Article

Relationship Between Occupants’ Adaptive Behaviors, Air-Conditioning Usage, and Thermal Acceptability Among Residences in the Hot–Humid Climate of Indonesia

by
Sri Rahma Apriliyanthi
1,2,
Tomonori Sakoi
3,*,
Tetsu Kubota
4,
Takashi Nakaya
5,
Mochammad Donny Koerniawan
6,
Muhammad Nur Fajri Alfata
7,
Akhlish Diinal Aziiz
6,8,
Fefen Suhedi
7,
Inat Shani Fathuna
7 and
Taiga Takiguchi
9
1
Graduate School of Medicine, Science and Technology, Shinshu University, 3-15-1 Tokida, Ueda 386-8567, Japan
2
Architecture Faculty, Universitas Andalas, Jl. Limau Manis, Padang 25175, Indonesia
3
Institute of Textile Science and Technology, Academic Assembly, Shinshu University, 3-15-1 Tokida, Ueda 386-8567, Japan
4
Graduate School of Advanced Science and Engineering, Hiroshima University, 1-5-1 Kagamiyama, Higashihiroshima 739-8529, Japan
5
Department of Architecture, Faculty of Engineering, Shinshu University, 4-17-1 Wakasato, Nagano 380-8553, Japan
6
School of Architecture, Planning, and Policy Development, Institut Teknologi Bandung, Jl. Ganesa No. 10, Kota Bandung 40132, Indonesia
7
Directorate of Engineering Affairs for Human Settlements and Housing, Ministry of Public Works, and Housing, Jl. Panyawungan, Cileunyi, Bandung 40622, Indonesia
8
Department of Architecture, Faculty of Civil Engineering and Planning, Universitas Trisakti, Jl. Kyai Tapa No. 1, Jakarta 11440, Indonesia
9
Graduate School of Science and Technology, Shinshu University, 3-15-1 Tokida, Ueda 386-8567, Japan
*
Author to whom correspondence should be addressed.
Buildings 2025, 15(1), 73; https://doi.org/10.3390/buildings15010073
Submission received: 25 November 2024 / Revised: 24 December 2024 / Accepted: 27 December 2024 / Published: 29 December 2024
(This article belongs to the Section Building Energy, Physics, Environment, and Systems)

Abstract

:
A strategy for effectively utilizing occupants’ adaptive behaviors (OABs) to achieve thermal acceptability while maintaining low energy consumption is necessary. This study aims to clarify the relationship between OABs and thermal acceptability over various climate zones, as well as the change in OABs due to air conditioner (AC) ownership in Indonesian residences. An online questionnaire consisting of perceived OABs’ time intensity, thermal acceptability, and personal attributes from 3000 respondents across Indonesia was analyzed using logistic regression. The results suggested that NV occupants engage in more fan usage and window opening to enhance ventilative cooling, while AC occupants are more likely to adjust clothing and use portable fans to create cooler environments. Moreover, the effects of OABs on NV residences varied depending on the local climate conditions. In hot local climates, averages of 90% fan usage intensity and 92% window opening intensity, complemented with active clothing adjustment, were unable to effectively provide thermal acceptability. These findings imply that there is a range of indoor environmental conditions in which conventional OABs work well. This study highlights the need to promote behavioral adaptations, especially in AC mixed-mode buildings, and to consider behavioral adaptations in NV buildings based on local climates.

1. Introduction

Indonesia, a progressively developing tropical country, faces distinct challenges and opportunities in studying how people adapt to their thermal environment. With the fourth-largest population in the world, Indonesia’s future lifestyle will significantly impact global sustainable development. Given Indonesia’s relatively stable temperatures throughout the year, most Indonesians often perceive the thermal environment as comfortable [1]. However, as the country continues to develop physically, economically, and socio-culturally, and as temperatures rise due to climate change, individuals increasingly rely on air conditioners (ACs) and cooling devices to adjust their thermal environment [2]. This growing reliance on ACs presents a trade-off between higher energy consumption and carbon emissions on the one hand and a decrease in individual heat exposure on the other [3]. This trade-off is not favorable for the environment. Therefore, developing alternative methods to adjust the thermal environment, such as behavioral adaptation strategies, is highly demanded [3,4,5].
Throughout history, studies have developed models that represent how people perceive their thermal conditions, such as the predicted mean vote by Fanger [6,7] and the adaptive thermal comfort models developed by de Dear, Brager, and colleagues [8,9,10] and Humphreys and Nicol [11,12]. With the development of adaptive thermal comfort models, various studies have focused on modeling the impacts [13,14] and changes [15,16] of occupants’ adaptive behaviors (OABs), as well as on enriching knowledge of related factors such as adaptive thermal comfort [17], sociodemographic factors [18], skin wettedness [19], and scalability [20]. Naturally, exposure to an uncomfortable thermal environment results in OABs, which are essential for achieving personal comfort. OABs depend on an occupant’s individual preferences, providing a personal control method for the thermal environment. Given that the human thermal physiological state is shaped by interactions between humans, clothing, the indoor thermal environment, and the outdoor thermal environment, the effect of OABs—such as operating ACs, opening or closing windows, and wearing or removing clothes—on thermal comfort changes depending on the outdoor climate and indoor environment [21]. Consequently, there has been growing interest in studying clothing insulation and clothing comfort [22,23,24,25,26,27]. Furthermore, careful consideration of these OABs can help reduce reliance on mechanical ventilation and AC systems in the future [28,29].
Mylonas et al. [30] suggested that advanced modeling on diverse factors, including climate, demographics, and technology, is necessary for developing an effective model for OABs. OABs vary depending on the climate [31]. Studies have identified that AC usage, as a relatively new OAB, and conventional OABs, such as opening windows, adjusting clothing, and using fans, are common methods for adjusting the thermal environment in hot climates [32,33,34]. Wu et al. [35] suggested that in Changsha, China, occupants adjust their thermal environment by changing their clothes, opening windows, and using fans, as clothing and air velocity adjustments are closely associated with the indoor operative temperature (Top). Many studies in India have revealed that Indians adjust their thermal environment by opening windows and using ceiling fans [36,37,38,39,40,41]. In Japan, the government has been promoting the so-called COOL BIZ campaign since 2005 to reduce energy consumption and CO2 emissions [42]. The campaign introduced a new norm for lighter business clothing in summer, raised AC temperatures in the workplace to 28 °C, and encouraged the use of small portable fans as needed [43,44,45]. These OABs have effectively reduced energy consumption in Japan’s workplaces during summer.
In addition to common OABs in hot climates, individuals in different countries or regions often have unique OABs shaped by their specific local climate and sociocultural conditions. For example, Rijal, Yoshida, and Umemiya [46] reported unique OABs in Nepal, such as “taking a nap” and “sleeping in the front yard”. Similarly, a study by Faheem, Bhandari, and Tadepalli [37] in Tiruchirappalli, India, indicated that sweating, combined with higher air velocity, can extend the thermal acceptability limit even in hot climates. Raja et al. [31] noted that while blinds or curtains in the United Kingdom can prevent the temperature from rising due to direct solar radiation, their impact is less significant than that of using windows and fans. A study by Feriadi and Wong [47] found that Indonesians prefer to take frequent baths and go to cooler places rather than stay in their rooms. The preferred OABs and their effects depend largely on the local climate.
In Southeast Asia, OABs and indoor environment control methods are bound to change drastically due to increasing temperatures from urban heat islands [48]. Miyamoto et al. [49] also suggested that the recent increase in income is contributing to the adoption of AC systems in buildings. Previous studies have mentioned that with the use of ACs, individuals tend to have higher expectations for their thermal environment compared to those in naturally ventilated (NV) buildings, resulting in a narrower, comfortable thermal range [50,51,52,53]. The latest research on thermal comfort in Indonesia has revealed an increasing trend in mixed-mode and AC buildings [54,55,56,57]. Additionally, modern clothing styles influenced by foreign cultures, such as suits, blouses, and long-sleeved shirts for formal work meetings, have become more common, along with an increase in the number of females wearing hijabs [58,59]. This shift in clothing behavior indicates an increase in clothing insulation compared to the past.
As mentioned above, it is apparent that there are complex interrelations among OABs, the local climate, AC usage, and thermal acceptability. These nexuses are further influenced by the social and cultural changes brought about by economic growth, particularly in developing countries. However, these nexuses have yet to be revealed, especially in tropical developing countries such as Indonesia. This study investigated the interrelations among OABs, thermal acceptability, the local climate, and AC usage in Indonesia through a large-scale online survey (n = 3000). It is necessary to highlight that our study focused on residential data to minimize the influence of external factors that might restrict respondents’ free will to conduct OABs. Typically, workers cannot freely adjust the thermal conditions in workplaces. For instance, factory workers might not control the AC based on their comfort since it must comply with company rules to ensure product quality. Meanwhile, occupants in residences generally have more freedom to adjust their thermal environment than in workplaces. We explored occupants’ personal attributes related to AC adoption in Indonesian residences and examined how AC ownership alters the relationship between conventional OABs and thermal acceptability in residences using logistic regression. As for the details of the analysis, we began by investigating how thermal unacceptability changes depending on OABs within a certain climate zone. Next, we tried to find explanation factors for AC ownership, such as income level, local climate, and building types. Then, we considered the difference in OABs between AC and NV residences. Finally, we explored how OABs relate to the local climate and thermal acceptability in certain types of climate. The findings in this study reveal insights into the limitations and differences of OABs in different local climates in achieving thermal acceptability.

2. Methodology

The indoor environment is formed through a strong interaction between AC operation, local climate, and building insulation. Especially in NV residences, local climates greatly influence the indoor environment. The positivist epistemology led us to a hypothesis that there should be a relationship among thermal acceptability, OABs, AC ownership, and local climate. This relationship must have been changing dramatically in Southeast Asia, which consists of many progressively developing countries. Thus, we adopted a deductive approach to clarify the relationship. For this study, we chose a mono-method quantitative cross-sectional survey, a self-reported online questionnaire with the approval of the ethics committee of Hiroshima University (ASE-2021-74). This survey collected responses from 3000 working-age Indonesians by quota sampling to satisfy a 50:50 percentage ratio between AC and NV, as well as male and female. In this study, we focused on AC ownership and climate zones as major online survey data to represent the indoor environment. While the online survey, as a cross-sectional study, cannot provide the correspondence between the real physical thermal environment and thermal comfort for the physical environment, the survey provided insight into the perceived satisfaction with the daily thermal environment. Based on this survey, we investigated how the relationship between perceived thermal acceptability and OABs differs by AC ownership and local climate, how AC ownership varies with personal attributes, and how OABs differ between AC and NV residences through logistic regression analyses.

2.1. Online Survey Summary

The cross-sectional online survey took place between December 2021 and January 2022. After the present authors developed the questionnaire, which covered both residences and workplaces, an international survey company distributed the questionnaire to their registered contacts within Indonesia. Each respondent was allowed to submit only one response.
Participants from 31 provinces in Indonesia responded to the questionnaire. It included questions on their personal attributes, building attributes, general thermal perception in their residence, the most frequently worn residential clothing ensemble, and usual OABs in their residence. Supplementary (Table S1) provides details of these variables. The personal attributes covered age, weight, height, sex, workplace, income level, residence province, and perceived consciousness in terms of reducing energy consumption, referred to as energy consciousness. Regarding energy consciousness, the respondents were asked to select a nominal percentage from a 0–100% range, in 10% increments, representing the perceived times in which they paid attention to saving energy in their daily lives. Meanwhile, most of the other variables, such as fan ownership, were included to investigate the effects of economic and civilization factors.
The participants were active, of working age, and worked in an indoor workplace, including factories and offices. The fields of industries of the respondents were varied for both office and factory; however, the current analysis will be focusing the discussion on their residential perception data. The sample included 1541 males and 1459 females. The average age of the respondents was 32 ± 7.2 years. Income levels were categorized into six monthly income ranges: IDR < 1.5 million (USD < 91.5), IDR 1.5–2.5 million (USD 91.5–152.5), IDR 2.5–3.5 million (USD 152.5–213.5), IDR 3.5–5.0 million (USD 213.5–305), IDR 5.0–10.0 million (USD 305–610), and IDR > 10.0 million (USD > 610) (note: IDR 1 = USD 0.000061; conversion as of 2 July 2024, 04:06 UTC on https://www.forbes.com (accessed on 2 July 2024)).
The data were predominantly from respondents on Java Island, representing 71.0% of the total population. Sumatera, Sulawesi, and Kalimantan Islands accounted for 13.6%, 7.4%, and 6.0% of the data, respectively. Bali, Nusa Tenggara, Papua, and other islands in East Indonesia made up 2.0% of the data. These provinces were converted into climate zones as defined by Putra et al. [60], who divided Indonesia into eight local climate zones: equatorial (EQ), sub-equatorial (SEQ), highland tropical (HT), very highland tropical, monsoonal (M), sub-monsoonal (SM), savanna (SV), and sub-savanna (SSV). Each province was assigned one major climate zone, with a 75% accuracy rate for the cities listed by Putra et al. [60]. The respondents’ areas were classified as HT (19.0%), SV (14.1%), SSV (0.8%), SEQ (2.7%), EQ (23.1%), SM (12.8%), and M (27.5%). No samples were collected from the very highland tropical climate zone. Supplementary (Table S2) details the climate zone distribution and climate attributes based on Putra et al.’s study [60].
Regarding their residences, the majority of the respondents lived in detached houses (56.2%) or cluster houses (38.3%). The remaining respondents resided in shophouses (1.4%), rusunawa (rental apartments; 1.8%), dormitories (1.7%), and rusunami (owned apartments; 0.7%). The building categories were selected based on the commonly found types of residences in Indonesia. Detached and cluster houses are typical types of landed housing with different boundary configurations. Cluster houses typically share their side walls with the neighbors as shared boundaries, while detached houses are free-standing with no shared boundaries with their neighbors. Meanwhile, shophouses, rusunawa, rusunami, and dormitories are typically mid-rise to high-rise residential buildings. Shophouses are mixed-use residential buildings that are usually mid-rise buildings, with the lower floor being used as business quarters and the upper floor as private lodgings. Rusunawa and rusunami are typical apartments with different ownerships, where rusunawa are rental apartments and rusunami are privately owned apartments. Dormitories are typical rental rooms, usually used by single people as private lodgings. The respondents were also asked to indicate whether they owned cooling devices such as ACs and fans. Based on AC ownership, the samples were classified into two groups throughout the study: those without ACs, referred to as “NV respondents”, and those living in residences with AC systems, referred to as “AC respondents”.
The respondents provided their thermal acceptability as general perceptions of the daily thermal environmental conditions in their residences, which was assessed using the scale presented in Figure 1. While their general thermal preferences for the daily thermal environment in their residences were simultaneously recorded as part of the perceived thermal environment, we do not include these data in the current discussion since their relevance to the main findings of this paper is minimal. The results and related analyses on thermal preferences are shown in Table S1.
As shown in Figure 1, the questionnaire used six levels of thermal acceptability. Nevertheless, due to the small number of respondents who selected “unacceptable”, the analyses in this paper were conducted using a simplified three-level scale: (a) acceptable—combining responses from “acceptable” and “slightly acceptable”; (b) weak opinion—combining “neither, but if I have to choose, I would say acceptable” and “neither, but if I have to choose, I would say unacceptable”; (c) unacceptable—combining “slightly unacceptable” and “unacceptable”.
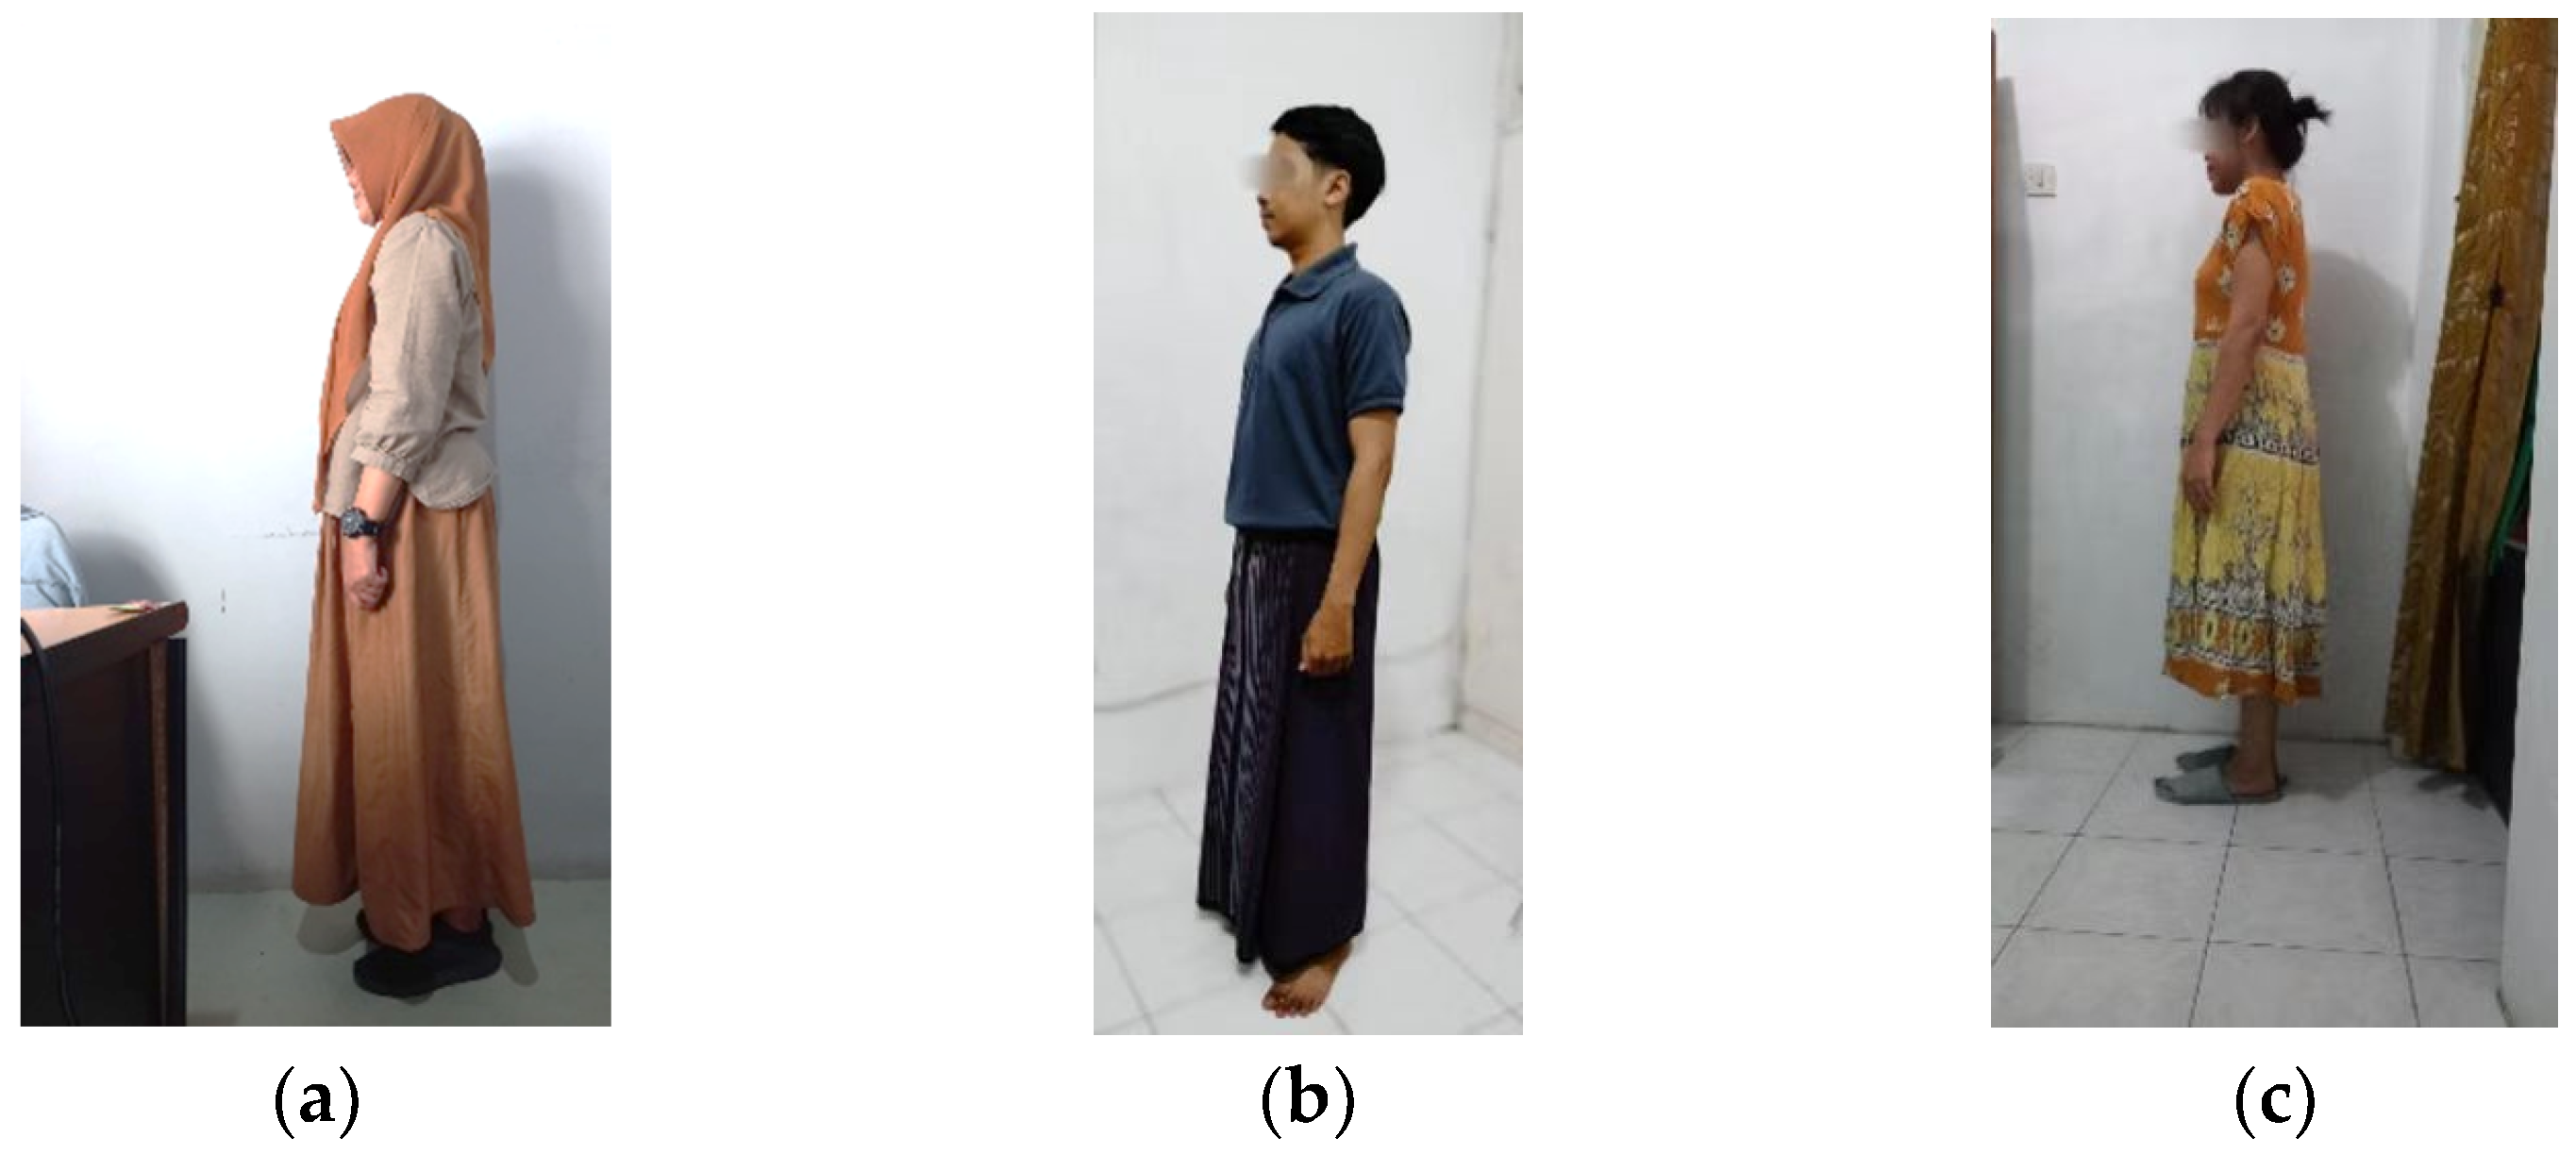
In the clothing section, the respondents selected various garments to create a clothing ensemble that represented what they most frequently wore in their residences and workplaces. The intrinsic clothing insulation (clo-value) of each ensemble was estimated according to ISO 9920 [61]. For unregistered or traditional Indonesian clothing, clo-values were estimated by selecting similar garments listed in ISO 9920 [61] or referenced from countries with similar clothing. In these cases, the similarities were determined based on covered areas and materials. For traditional home dresses (daster) and religious clothing, such as sarongs and hijabs, clo-values were determined using values for similar garments in ISO 9920 [61] and McCullough et al.’s study [62] or values listed in other research from the Arabian Gulf [63]. Figure 2 illustrates some common Indonesian clothing.
In the building sections, the respondents reported their perceptions of OABs when staying in their residences or workplaces. The perceived OABs were assessed based on clo-values, AC set-point temperatures, and the intensity with which the respondents used ACs and fans, opened windows, and used portable fans, as well as how they adjusted their clothing. Each level of intensity for AC or fan usage, opening a window, or using a portable fan was reported as the perceived percentage duration for which the respondents used or opened them over the past year. The respondents chose a perceived percentage from 0% to 100% at 10% increments for each behavior. Clothing adjustment intensity was reported using a 4-point Likert scale: 1 for “never”, 2 for “rarely”, 3 for “sometimes”, and 4 for “often”. The clo-value for the most frequently worn clothing in their residences was estimated using several databases, as previously mentioned. The AC set-point temperatures in AC residences were collected from a multiple-choice input of 16 to 30 °C in 1 °C intervals, along with options for “no set-point temperature, and “others: …”, where the respondents could specify a nominal value. Those respondents with more than one AC unit in their residences were asked separately for each room in which an AC system was installed; however, in this study, only the average set-point temperatures for the main bedroom and living area of the residence, where activities are usually conducted, were assigned as the representative AC set-point temperatures for a respondent. Therefore, the analysis did not consider ACs in other rooms. Although intensity data were reported for both residences and workplaces, this study focused solely on OABs in residences.

2.2. Statistical Analysis Methods

Analyses were conducted using IBM SPSS Statistics version 25. This study employed logistic regression, including binomial logistic regression (BLR) and multinomial logistic regression (MLR) for binomial and multinomial outcome variables, respectively. We first investigated how the outcome variables changed in response to the input-independent variables. Details of the variables used in the BLRs and MLRs are provided in Supplementary (Table S1). Categorical or nominal data were converted to binary 0 and 1 dummies for each item prior to the BLRs and MLRs. We referred to a set of categorical variables as an item. In the BLRs and MLRs, the adjusted odds ratios (AORs) of the investigated variables were calculated to evaluate the net influence of the investigated input variable. The adjusted variables used in these calculations were the respondents’ personal attributes: age, weight, height, and sex.

2.2.1. Binomial Logistic Regression (BLR)

The effect of each OAB on reducing the thermal unacceptability for NV respondents was investigated using BLR. Prior to BLR, the 3-level acceptability scale was converted into a binary dummy variable, with “unacceptable” coded as 1 and all other values as 0. This binary dummy variable for “unacceptable” served as the outcome variable in the BLR, while the OAB, along with its adjusted variables, was used as the input variable. BLR was repeatedly conducted—with AORs calculated for each OAB—separately for each local climate zone.
A similar analysis was conducted to identify the personal attributes that explain AC ownership using BLR, with AC ownership as the outcome variable. The following categorical attributes were used as input variables: workplace, work type, income level, energy consciousness, climate zone, residential building type, and fan ownership. The analysis included two BLRs as follows.
The first BLR determined the AOR for a specific input dummy variable in comparison to the other input dummy variable(s) within the same categorical item. This first BLR in AC ownership analysis is referred to as “BLR-S”, indicating BLR for a single value. In calculating the AOR for a single input dummy variable within a categorical item, 1 represented the value of interest, while 0 represented the other values for each dummy. Meanwhile, the second BLR, referred to as “BLR-P”, developed a prediction model for the probability of AC ownership. BLR-P reduced the selected input variables using the backward stepwise method based on the changes in −2 log-likelihood, removing non-significant independent variables with a threshold p-value of 0.05 (p < 0.05 was considered significant). BLR-P evaluated the interaction effect among categorical items. Then, the AORs from BLR-P were considered an impact index for each investigated variable while excluding the influences of other categorical items’ variables.
BLR was also conducted to investigate how OABs differ between the AC and NV respondents. In this analysis, AC ownership—a binary variable—was used as the outcome variable. The intensities of OABs, including fan and portable fan usage, window opening, clothing adjustment, and clo-value, were used as input variables along with the adjusted variables. BLR was performed for each OAB. The NV respondents were set as the reference outcome variable; thus, all of their AORs were 1. The AOR for the AC respondents indicates how the probability of being an AC respondent changes with each investigated OAB compared to the probability of being an NV respondent. An AOR of >1 for the AC respondents implies that an increase in the investigated OAB increases the likelihood of a respondent being an AC respondent. Therefore, an AOR of >1 suggests that the AC respondents engage in the investigated OABs more frequently than the NV respondents.

2.2.2. Multinomial Logistic Regression (MLR)

MLR was conducted to explore how OABs differ based on local climate groups and residents’ thermal acceptability. Here, we defined three local climate groups, considering the sample size sufficient for analysis and CDDs indicated by Putra et al. [60]. One was a neutral climate group composed of HT with zero CDDs for 25 °C; another was a moderate local climate group composed of EQ and M with CDDs higher than 0 and less than 1000. The other was a hot local climate group composed of SSV and SM with CDDs higher than 1000. Each local climate group and thermal acceptability, expressed in three levels, were used as the outcome variables, making MLR the appropriate choice. The OABs—AC, AC set-point temperature, fan and portable fan usage, window opening, clo-value, and clothing adjustment—were used as the input variables, along with the adjusted variables. The analysis was repeatedly performed for each OAB. MLR was conducted separately for the AC and NV respondents. In the analysis for the local climate group, the neutral local climate group was used as the reference outcome variable; meanwhile, “weak opinion” was used in the analysis for thermal acceptability. The MLR provided AORs compared to the neutral local climate group and the “weak opinion” category. An AOR of >1 for the investigated OAB for moderate and hot climates implies that the respondents who lived in moderate and hot climates engaged in the said OAB more frequently than those who lived in a neutral climate. Similarly, an AOR of >1 for the investigated OAB for “acceptable” or “unacceptable” means that the respondents that indicated “acceptable” or “unacceptable” engaged in the investigated OAB more frequently than those that chose “weak opinion”.

3. Results

3.1. Occupants’ Adaptive Behaviors and Thermal Unacceptability in NV Residences for Each Climate Zone

Table 1 presents the number of NV respondents, the number and percentage of NV respondents who found their daily thermal environment “unacceptable”, and the AOR for each OAB for the unacceptable dummy outcome variable across climate zones. The AORs for the SV and SEQ were not evaluated due to the small sample size. In the HT, the AORs for thermal unacceptability, excluding the clo-value, were not significantly different from 1. A common trend was observed in two local climate groups: SSV and SM, as well as EQ and M.
According to Putra et al. [60], SSV and SM have the hottest local climates among the seven climate zones considered in this study, with 1374.1 and 1042.7 cooling degree days (CDDs) required to achieve 25 °C/year, respectively. The trend in Table 1 reveals that the occupants in SSV and SM with lower clo-values, higher fan usage, and higher window opening intensity felt that the environment was more likely unacceptable. Meanwhile, for moderately warm local climates—i.e., EQ and M—with <1000 CDDs, those respondents with higher clo-values, lower fan usage, and lower window opening intensities were more likely to feel that the environment was unacceptable. The respondents with an unacceptable thermal environment in a neutral local climate—i.e., HT, which has 0 CDDs—tend to have significantly high clo-values. This is expected because long-sleeved clothing and reduced airflow prevent heat dissipation from the body. In general, this suggests that in moderate local climates, people feel an unacceptable thermal environment due to a lack of OABs and too much clothing insulation; meanwhile, people in hot local climates could feel an unacceptable thermal environment despite actively conducting OABs.

3.2. Personal Attributes Explaining AC Ownership

The stepwise method excluded the less significant input variable, energy consciousness, from BLR-P. The resulting prediction model included income level, workplace, climate zone, residential building type, and fan ownership. Table 2 presents the change in −2 log-likelihood and the significance of the change for the remaining five variables. BLR-P achieved a classification accuracy of 74.6%.
The BLR-S and BLR-P results shown in Table 3 indicate that AC ownership varied significantly with income levels. Given that AC ownership was approximately 49.8% with 1494 AC owners and 50.2% with 1506 non-owners, the AOR of close to 1 from BLR-S indicates that AC ownership was roughly 50% within the specified income level. In BLR-S, the AOR for income levels of 3.5–5.0 million IDR/month (213.5–305 USD/month) was near 1, suggesting a near 50:50 ratio of AC ownership within this income range. In BLR-P, in which an income range ≤ 1.5 million IDR/month was set as the reference input, the AOR for income ranges more than or equal to 2.5–3.5 million IDR/month was significantly greater than 1. This suggests that the income threshold at which AC ownership increases might be <3.5 million IDR/month when considering the interactive influences of the other four factors: workplace, climate zone, residential building type, and fan ownership.
Regarding workplaces, the AOR for office settings was inversely related to that of the factory setting in BLR-S. This implies that respondents working in offices are more likely to have ACs in their homes compared to those working in factories.
Regarding climate zones, the respondents in M and SEQ were more likely to own ACs than those in other climate zones. The higher AC ownership in SEQ compared to M suggested by BLR-S might not be attributable to climate zones alone because the significance of this effect diminishes when considering other factors in BLR-P. According to Putra et al. [60], HT has lower temperatures and, consequently, a lower cooling load compared to other climate zones. Therefore, the demand for ACs in HT is logically the lowest among the climate zones considered in this survey. The AORs for HT in BLR-S were not significantly different from 1 (p-values of 0.322). However, after accounting for the other factors in BLR-P, HT exhibited a lower probability of AC ownership than M. Meanwhile, as indicated in the AORs of BLR-S and BLR-P, the SM and SSV respondents were less likely to own ACs than those in M. However, SM and SSV had higher cooling loads than the other climate zones [60]. These inconsistent AORs for climate attributes can be explained by the input variables of the climate zone, including several other regional factors, such as the urban development level, which cannot be evaluated adequately by workplace, type of residence building, and fan ownership in BLR-P. Such other regional factors would lower the AC ownership AORs of SM and SSV. Similarly, M had a higher AC ownership probability than the other climate zones, excluding SEQ. M includes the main cities and provinces on Java Island, where the highest urban development is centered, such as Jakarta. Therefore, the AC ownership situation did not correspond to climate attributes; rather, it is affected strongly by urban development and income levels. Rural areas preserve the traditional perspective of breathable buildings, thus forcing them to adapt to their thermal environment without using ACs.
The type of residential building changes with location, such as those in the city center and rural areas. Therefore, the corresponding AOR reflects the factors related to the building structure and modernized or traditional lifestyles. The AORs from all three BLRs indicate that the respondents who live in rusunami (owned apartments—located in high-density urban areas) were likely to have ACs. While the rusunami owners earned a relatively high income, BLR-P determined AORs by excluding the income level effect. The high AOR of rusunami suggests that a high urban lifestyle encourages AC ownership. Further results showed that those respondents without fans in their homes were less likely to own an AC than those who owned fans. However, its influence on the prediction model from BLR-P was minimal, as indicated by the change in −2 log-likelihood in Table 2.
To summarize, this section highlighted that income level is vital in explaining AC ownership in residences. This result supports the hypothesis that as income increases and the economy improves, more people will own ACs in Indonesia in the future [49,54,55]. It also aligns with Miyamoto et al.’s [49] study, which mentioned that energy consumption tends to increase as the household income increases. The results of the present study also suggest that the current AC ownership situation does not fully align with hot local climate demands, such as those in SSV and SM. The inconsistency between higher levels of unacceptability and lower AC ownership in SSV and SM suggests that factors other than climate, such as economy, lifestyle, and urbanization, still greatly influence AC ownership. Lifestyle changes and urbanization, driven by the increasing number of buildings in Indonesia [64,65], along with the growing demand for ACs due to the hot local climate, are expected to boost AC adoption, particularly as income levels rise.

3.3. Occupants’ Adaptive Behavior Differences Between AC and NV Residences

Table 4 summarizes the OABs for NV and AC residences. It also provides an overall summary of the OABs in residential buildings. Window opening was the most practiced OAB, whereas portable fan use was the least practiced, at 63–67% and 21–24% on average, respectively. The clo-values in AC residences were slightly higher than in NV residences. The results also suggest that the respondents in AC residences also open their windows. This implies that most AC residences in this study should be regarded as mixed-mode buildings.
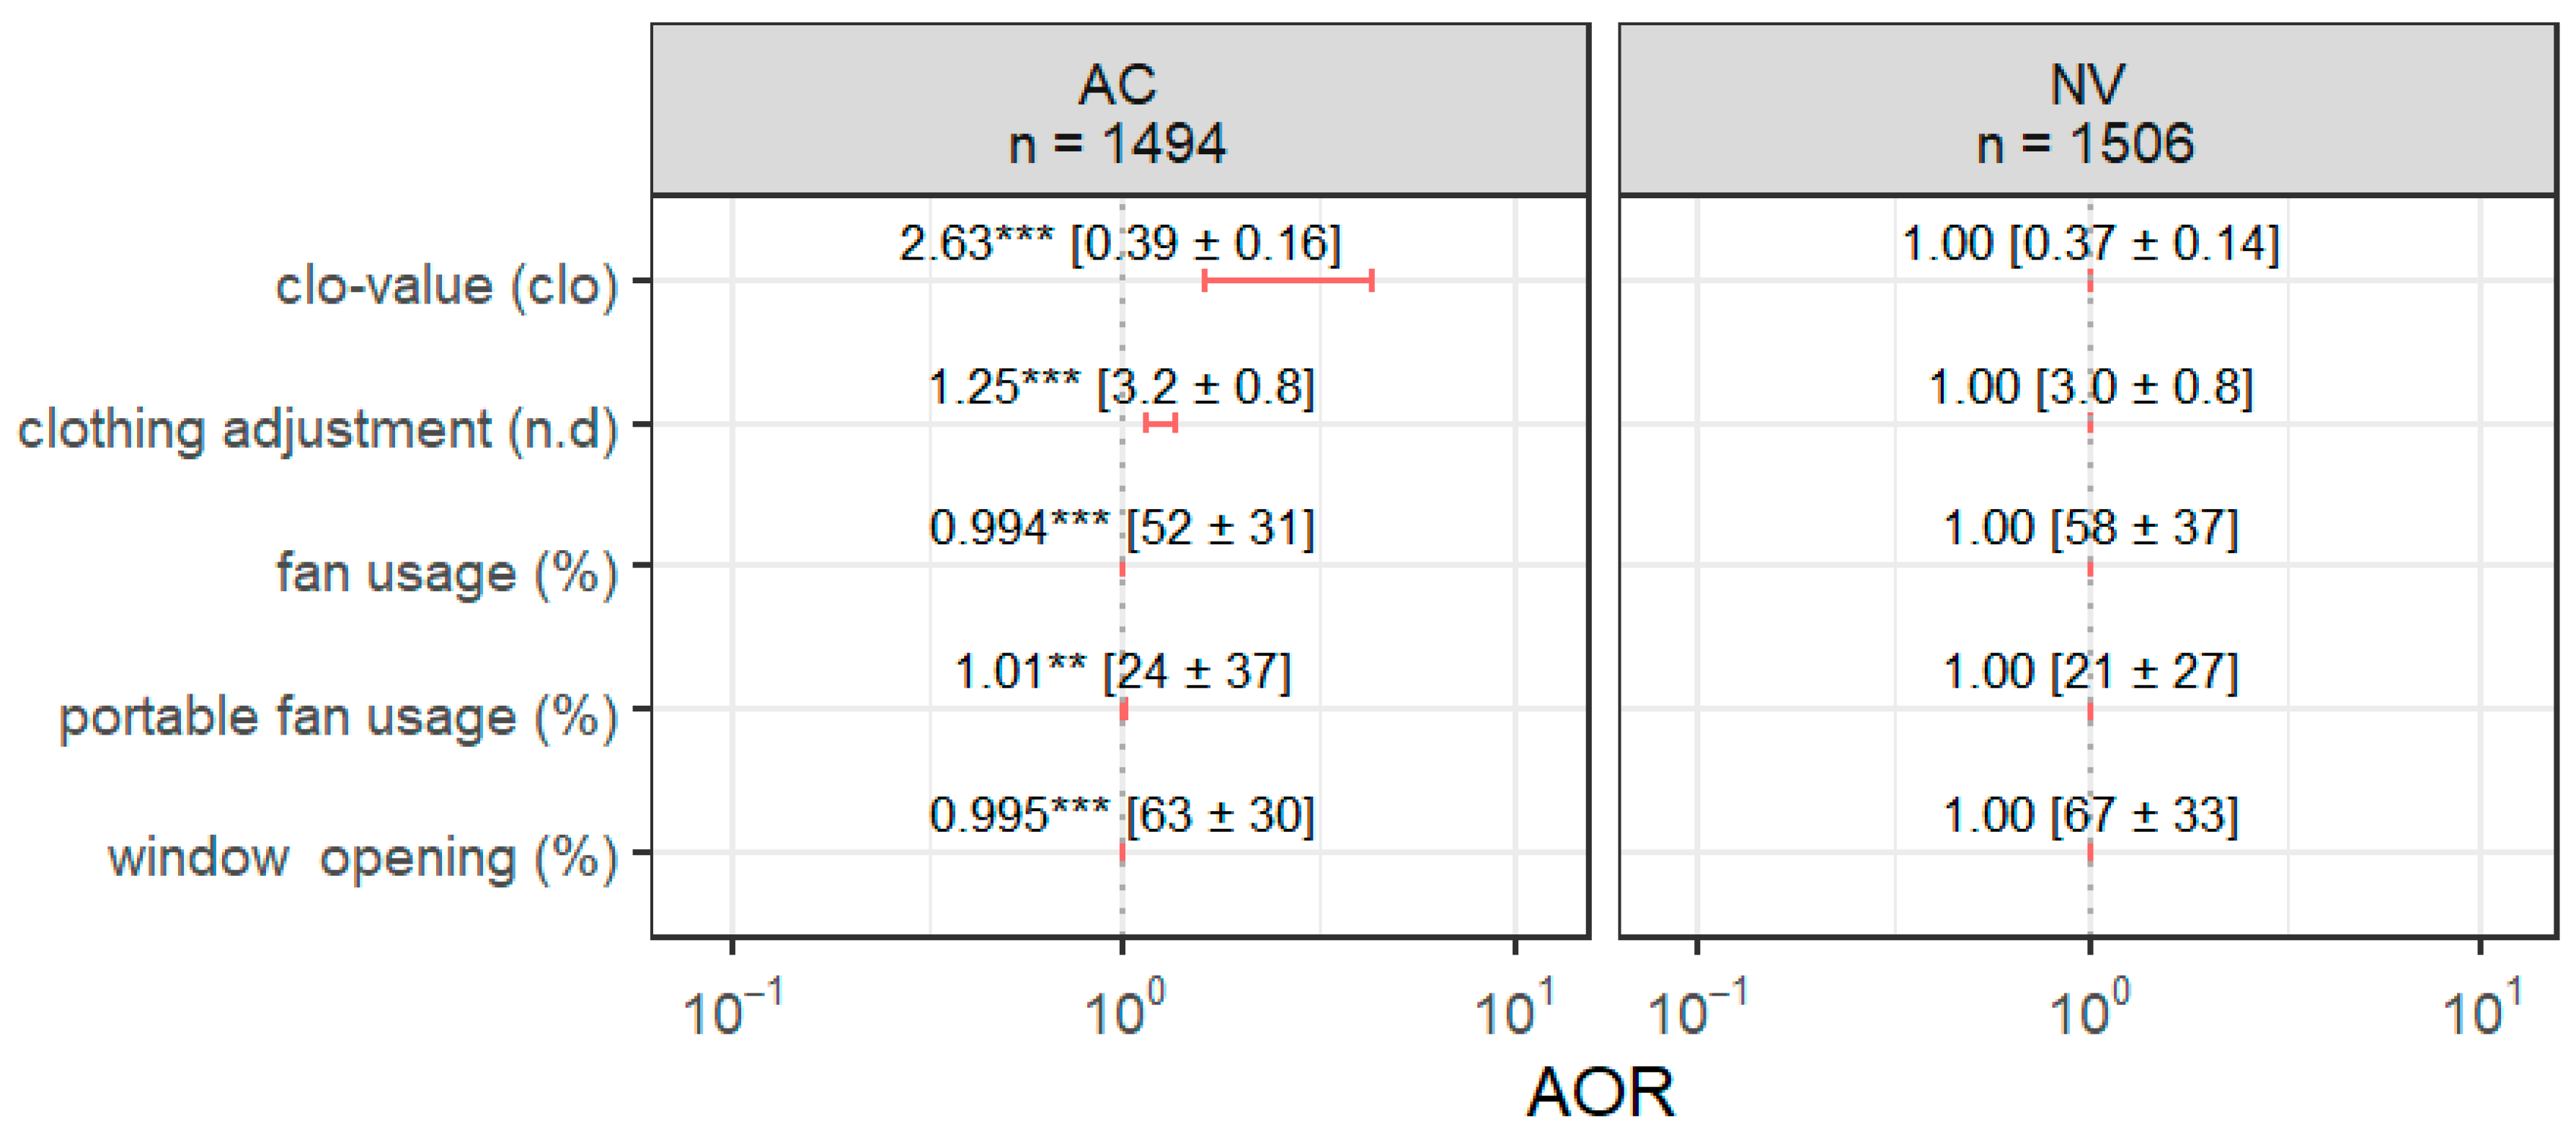
Figure 3 presents the AORs of the OABs for the AC and NV respondents. The red lines in the figures correspond to a confidence interval of 95% for the AORs. All AORs for the NV respondents were 1, as they serve as the reference outcome variable. As explained in Section 2.2.1, AORs significantly different from 1 indicate that the input OABs vary between the AC and NV respondents.
Significant AOR differences were observed between the clo-values of the AC and NV respondents, but the average difference was only 0.02 clo. This clo-value result, coupled with significantly higher AORs for clothing adjustment intensity among the AC respondents, suggests that the most worn clothing is light and cannot be further adjusted due to cultural norms. This trend may be unique for hot–humid climates or for summers only in other climates. However, the AC respondents occasionally added clothing to adapt to cooler environments. They were less likely to use fans for thermal adjustment since the average was only 52%, instead relying more on clothing adjustments by wearing more clothes, with an average Likert scale score of 3.2. Meanwhile, using portable fans had an average of 24%. The occupants in AC residences manage body heat loss by adding clothing, which increases thermal resistance between their bodies and the indoor environment [21,25]. In contrast, the occupants in NV residences facilitate body heat loss by reducing heat transfer resistance through the use of fans, with an average intensity of 58%. The use of ACs and the increase in clothing can be contradictory regarding body heat loss. Recent studies have reported issues with overcooling [28,29], and our online survey revealed that overcooled indoor environments, which can be partially mitigated by conventional OABs, might currently be prevalent in Indonesia.

3.4. Occupants’ Adaptive Behavior Differences Based on Local Climate Groups

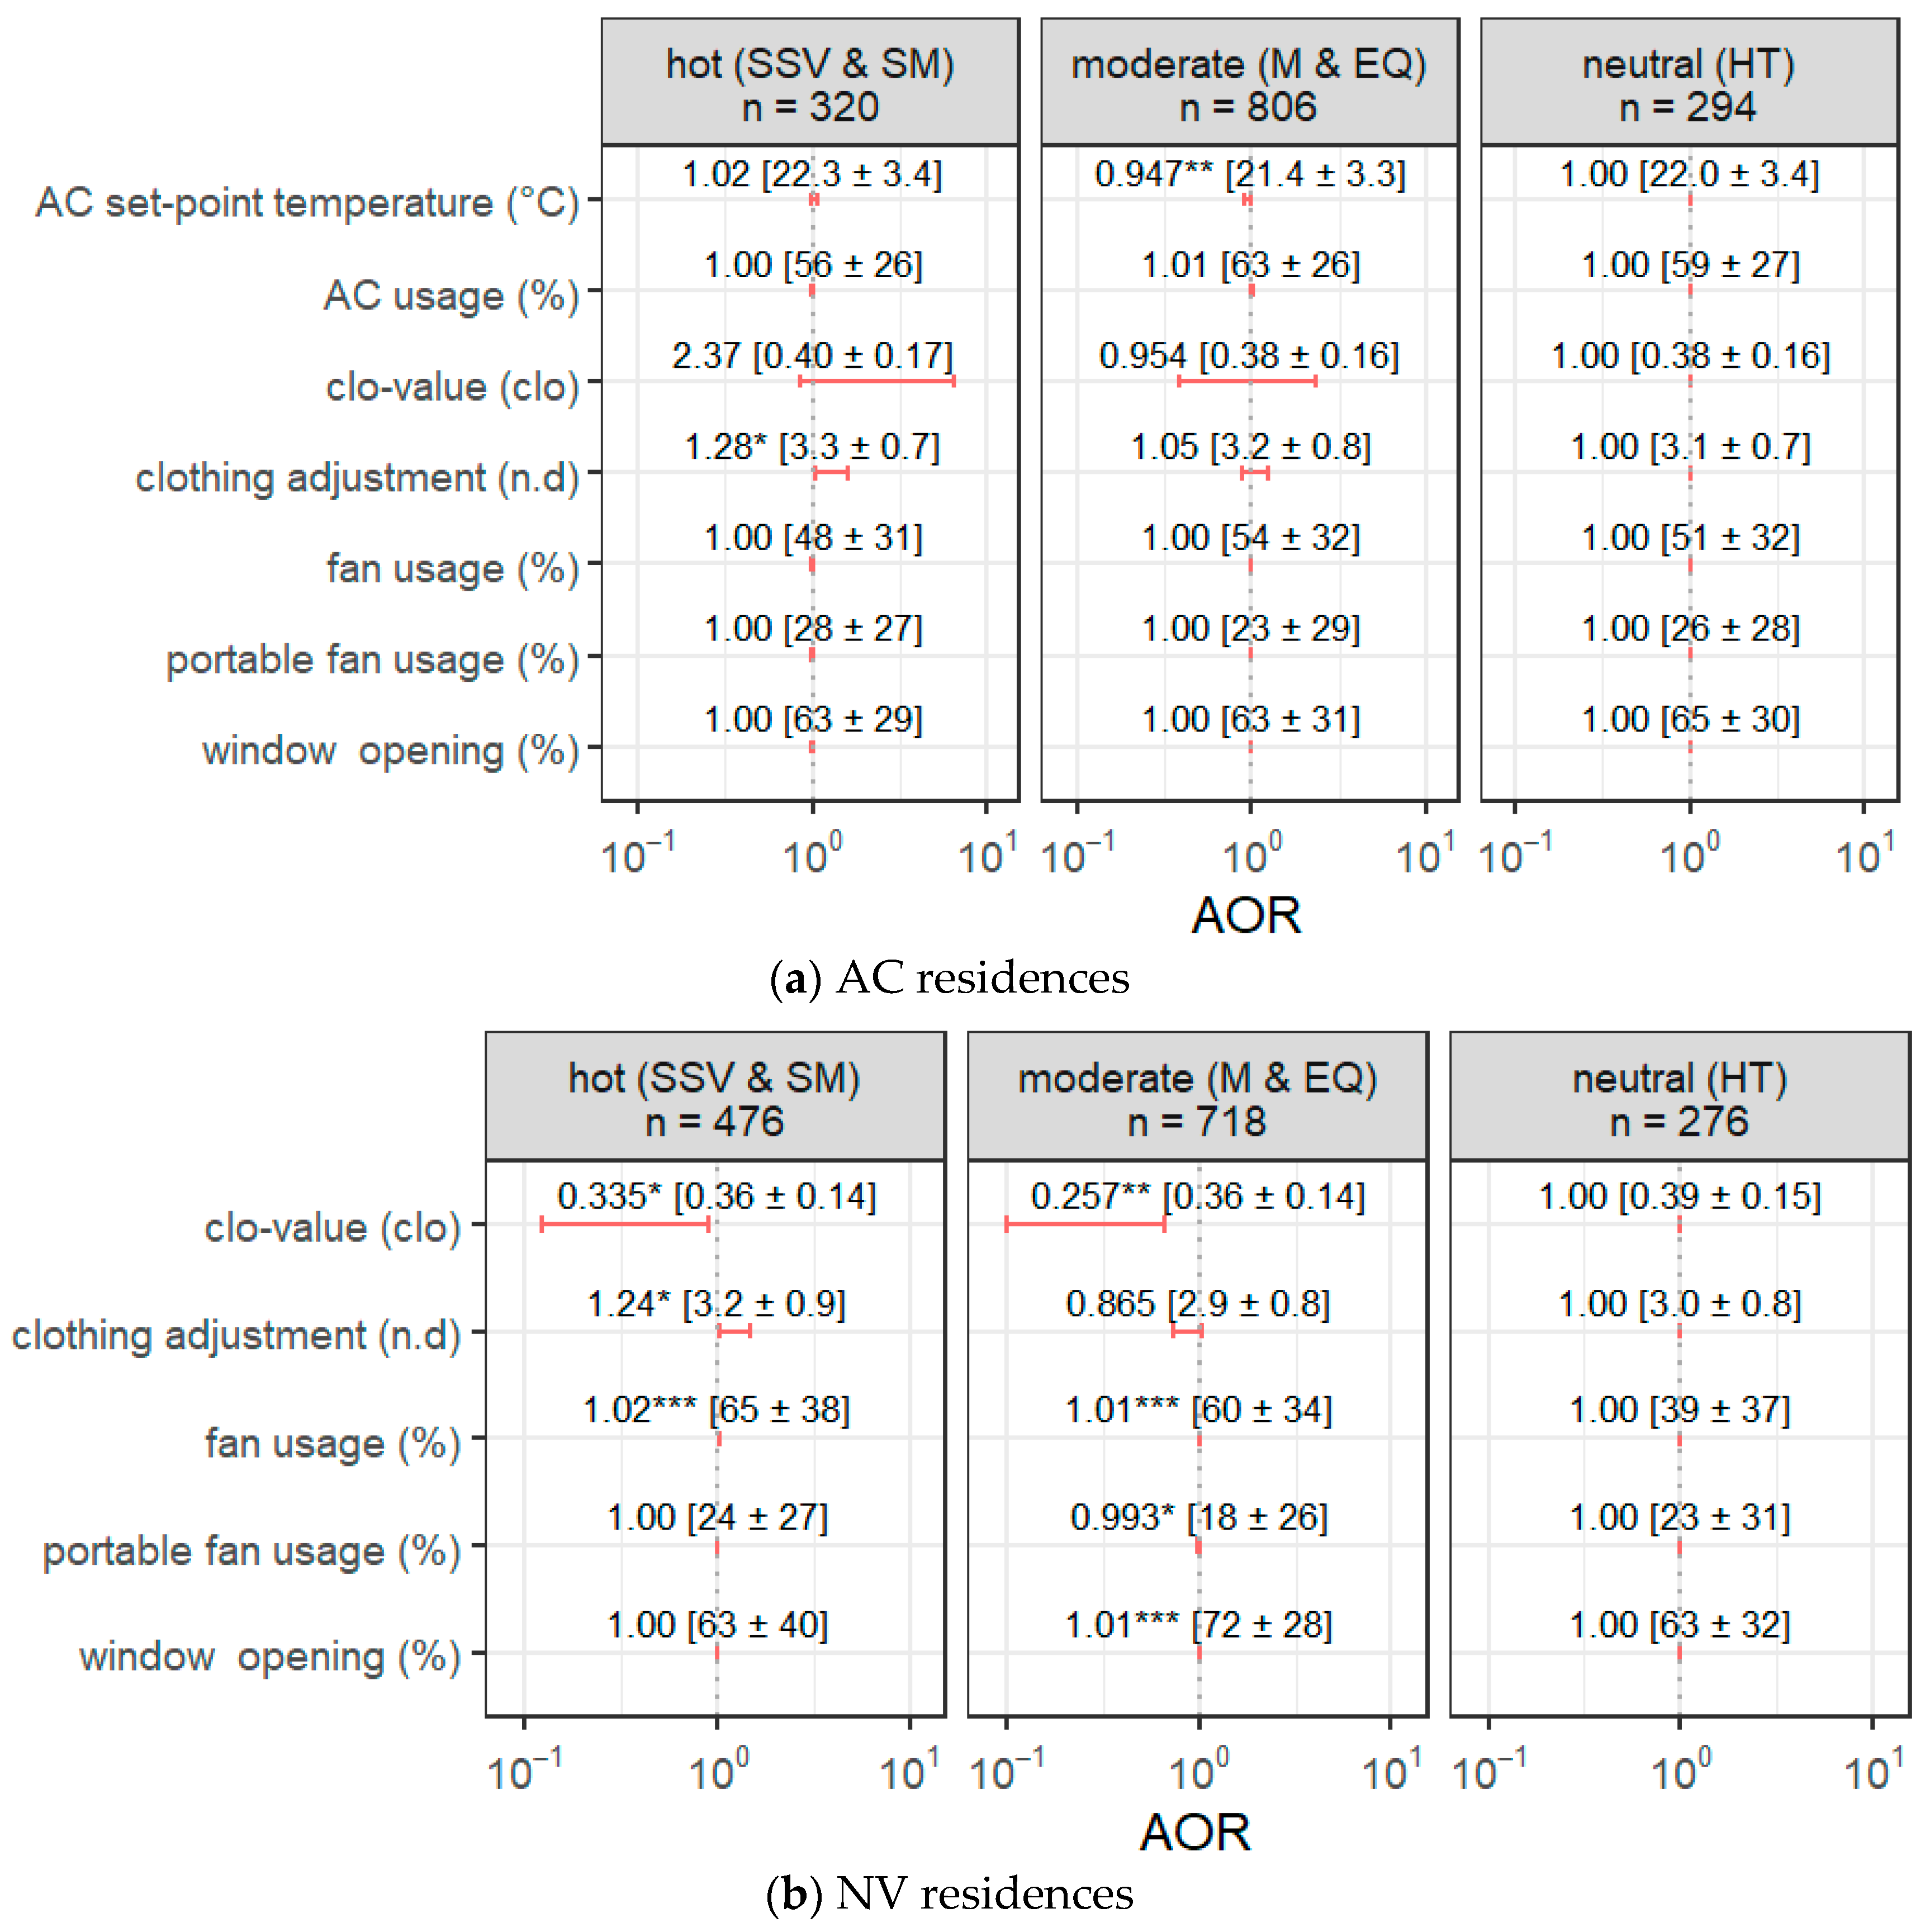
Figure 4 presents the AORs for the OABs of each local climate group, along with the averages and standard deviations of the OABs. For these AORs, the neutral local climate group (HT) was set as the reference. It also provides an overall summary of the OABs in each local climate group. In AC residences, there were not so many differences between the local climate groups, as indicated in Figure 4a. One of the significant differences can be seen in clothing adjustment between the hot local climate group, with an average Likert scale score of 3.3, and the neutral local climate group, with an average of 3.1. Meanwhile, in the moderate local climate group, the respondents tended to set their ACs to lower temperatures, averaging 21.4 °C, compared to the respondents in the neutral local climate group, averaging 22.0 °C. The results in Figure 4b highlight apparent OAB differences in NV residences among local climate groups.
Considering thermal interactions among the human body, clothing, and the indoor environment [21], the NV respondents in the neutral local climate group were characterized as retaining large thermal and evaporative resistance between the human body and the surrounding environment by wearing clothes with a slightly higher clo-value of 0.39, regularly opening their windows with an average of 63%, and using fans less with an average of 39% compared to the other local climate groups. In general, thermal unacceptability in the neutral local climate group was very low (see Table 1). The moderate and hot local climate groups were characterized by reduced thermal and evaporative resistances between the human body and the surrounding environment. In these groups, the respondents had a low clo-value of 0.36 and 21–26% higher fan usage compared to the neutral groups, as shown in Figure 4b. However, between the moderate and hot local climate groups, the thermal acceptability corresponding to increased OABs was the opposite: acceptable for the moderate local climate group and unacceptable for the hot local climate group, as shown in the next analysis.

3.5. Relationship Between Occupants’ Adaptive Behaviors and Thermal Acceptability

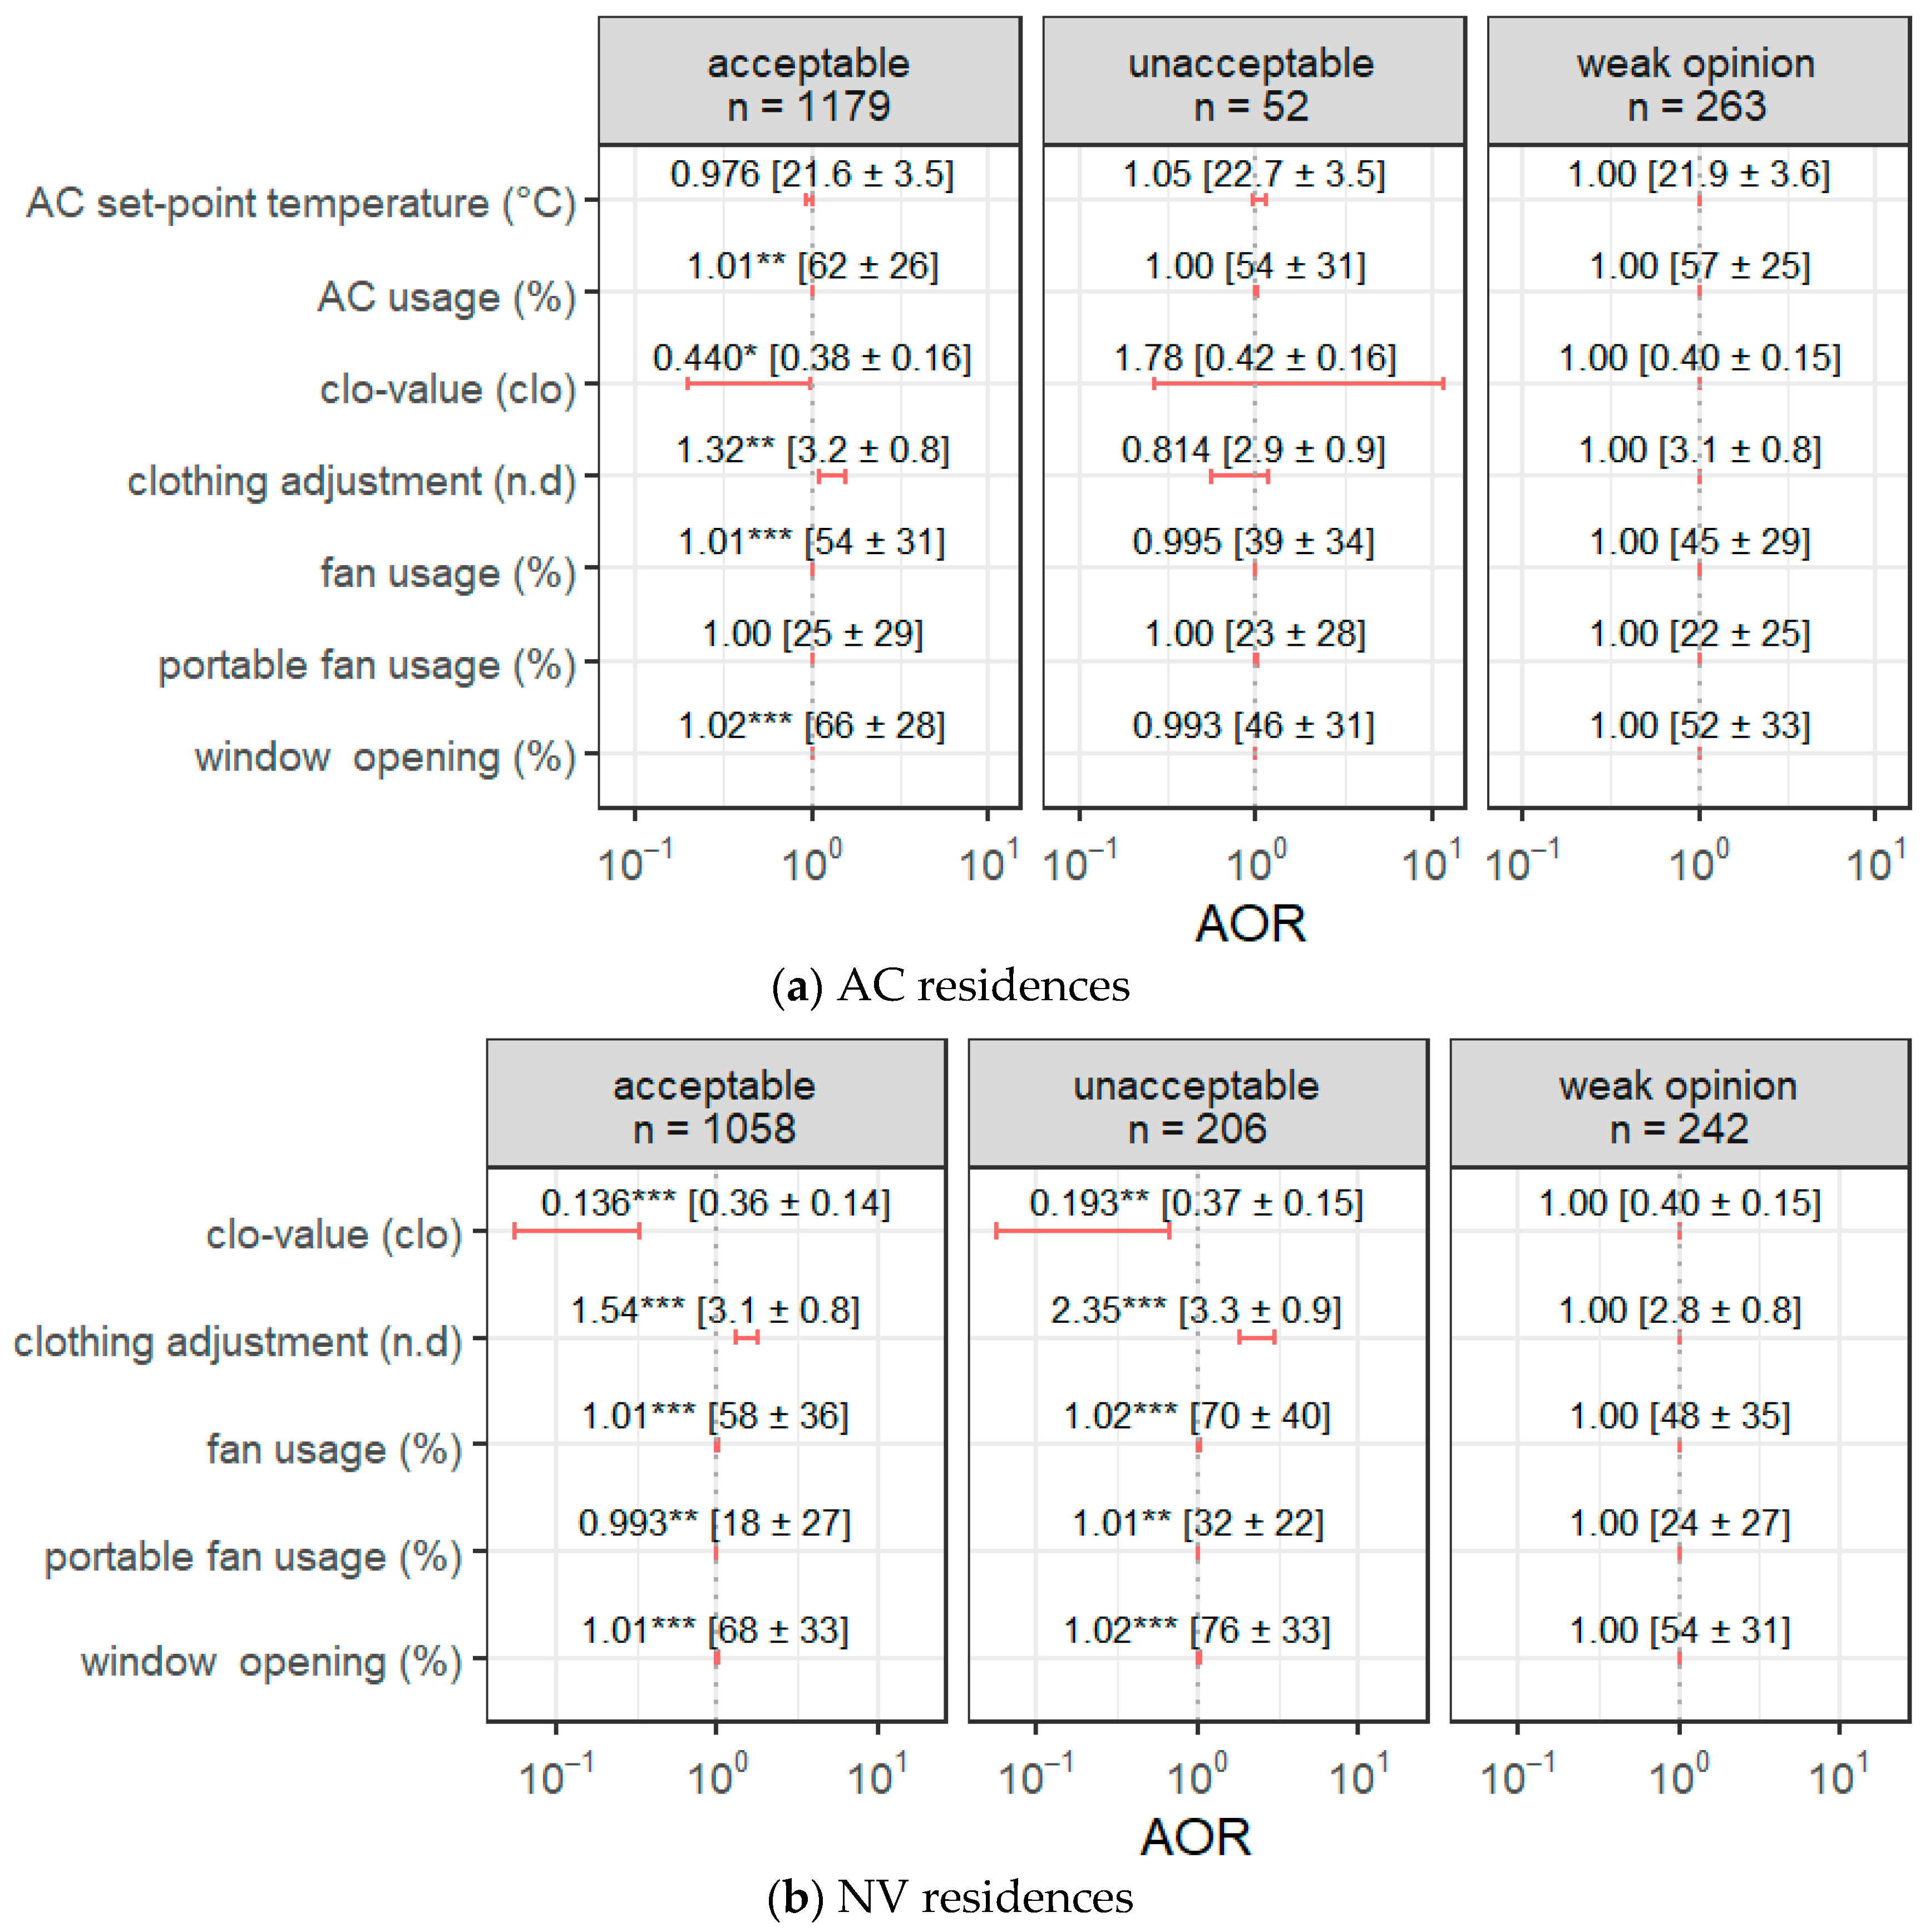
Among the AC respondents, 79% selected “acceptable”, 3% chose “unacceptable”, and 18% had “weak opinions”. In contrast, 70% of the NV respondents selected “acceptable”, 14% chose “unacceptable”, and 16% had “weak opinions”. Figure 5a,b present the AORs of the OABs with thermal acceptability as the outcome variable, along with the averages and standard deviations of the OABs for the AC and NV respondents, respectively. The AORs were calculated using “weak opinion” as the reference outcome.
As indicated in Section 3.3, the AC respondents used fans and opened windows less frequently than the NV respondents to adjust their thermal environment. Figure 5a shows that most of the AORs for the AC respondents who chose “unacceptable” did not significantly differ from those of the respondents with “weak opinions”. These non-significant differences in AORs might be partially due to the small number of such respondents. Meanwhile, significant AOR differences were observed between the AC respondents who indicated “acceptable” and “weak opinions”, except for portable fan usage intensity. The AC respondents who found the thermal environment “acceptable” used 5% more ACs, adjusted their clothing more frequently with a 0.1 difference of average, wore clothing with a 0.02 lower clo-value, used 9% more fans, and opened their windows 6% more compared to those with a “weak opinion”. As reported in Section 3.3, although the AC respondents opened their windows less frequently than the NV respondents, those who found the thermal environment “acceptable” still opened their windows more often than those with a “weak opinion”. This suggests that as most AC residences operate in mixed mode, the intermittent use of opening windows contributes to achieving an acceptable thermal environment in AC residences.
Figure 5b reveals that all AORs for OABs significantly differed between the NV respondents who indicated “acceptable” or “unacceptable” and those with a “weak opinion”. All AORs, except for portable fan usage, changed in the same direction from 1 for those respondents who indicated “acceptable” or “unacceptable”. For example, the NV respondents who found the daily thermal environment “acceptable” or “unacceptable” wore clothing with average clo-values of 0.36 and 0.37, respectively, which are slightly lower clo-values than those with a “weak opinion”, which averaged 0.40 clo. This suggests that feelings of either acceptability or unacceptability could be prompted by similar OAB patterns. This means that OABs can contribute to mitigating thermal unacceptability in general but do not always remove thermal unacceptability while not always providing thermal acceptability for all of the NV residences.
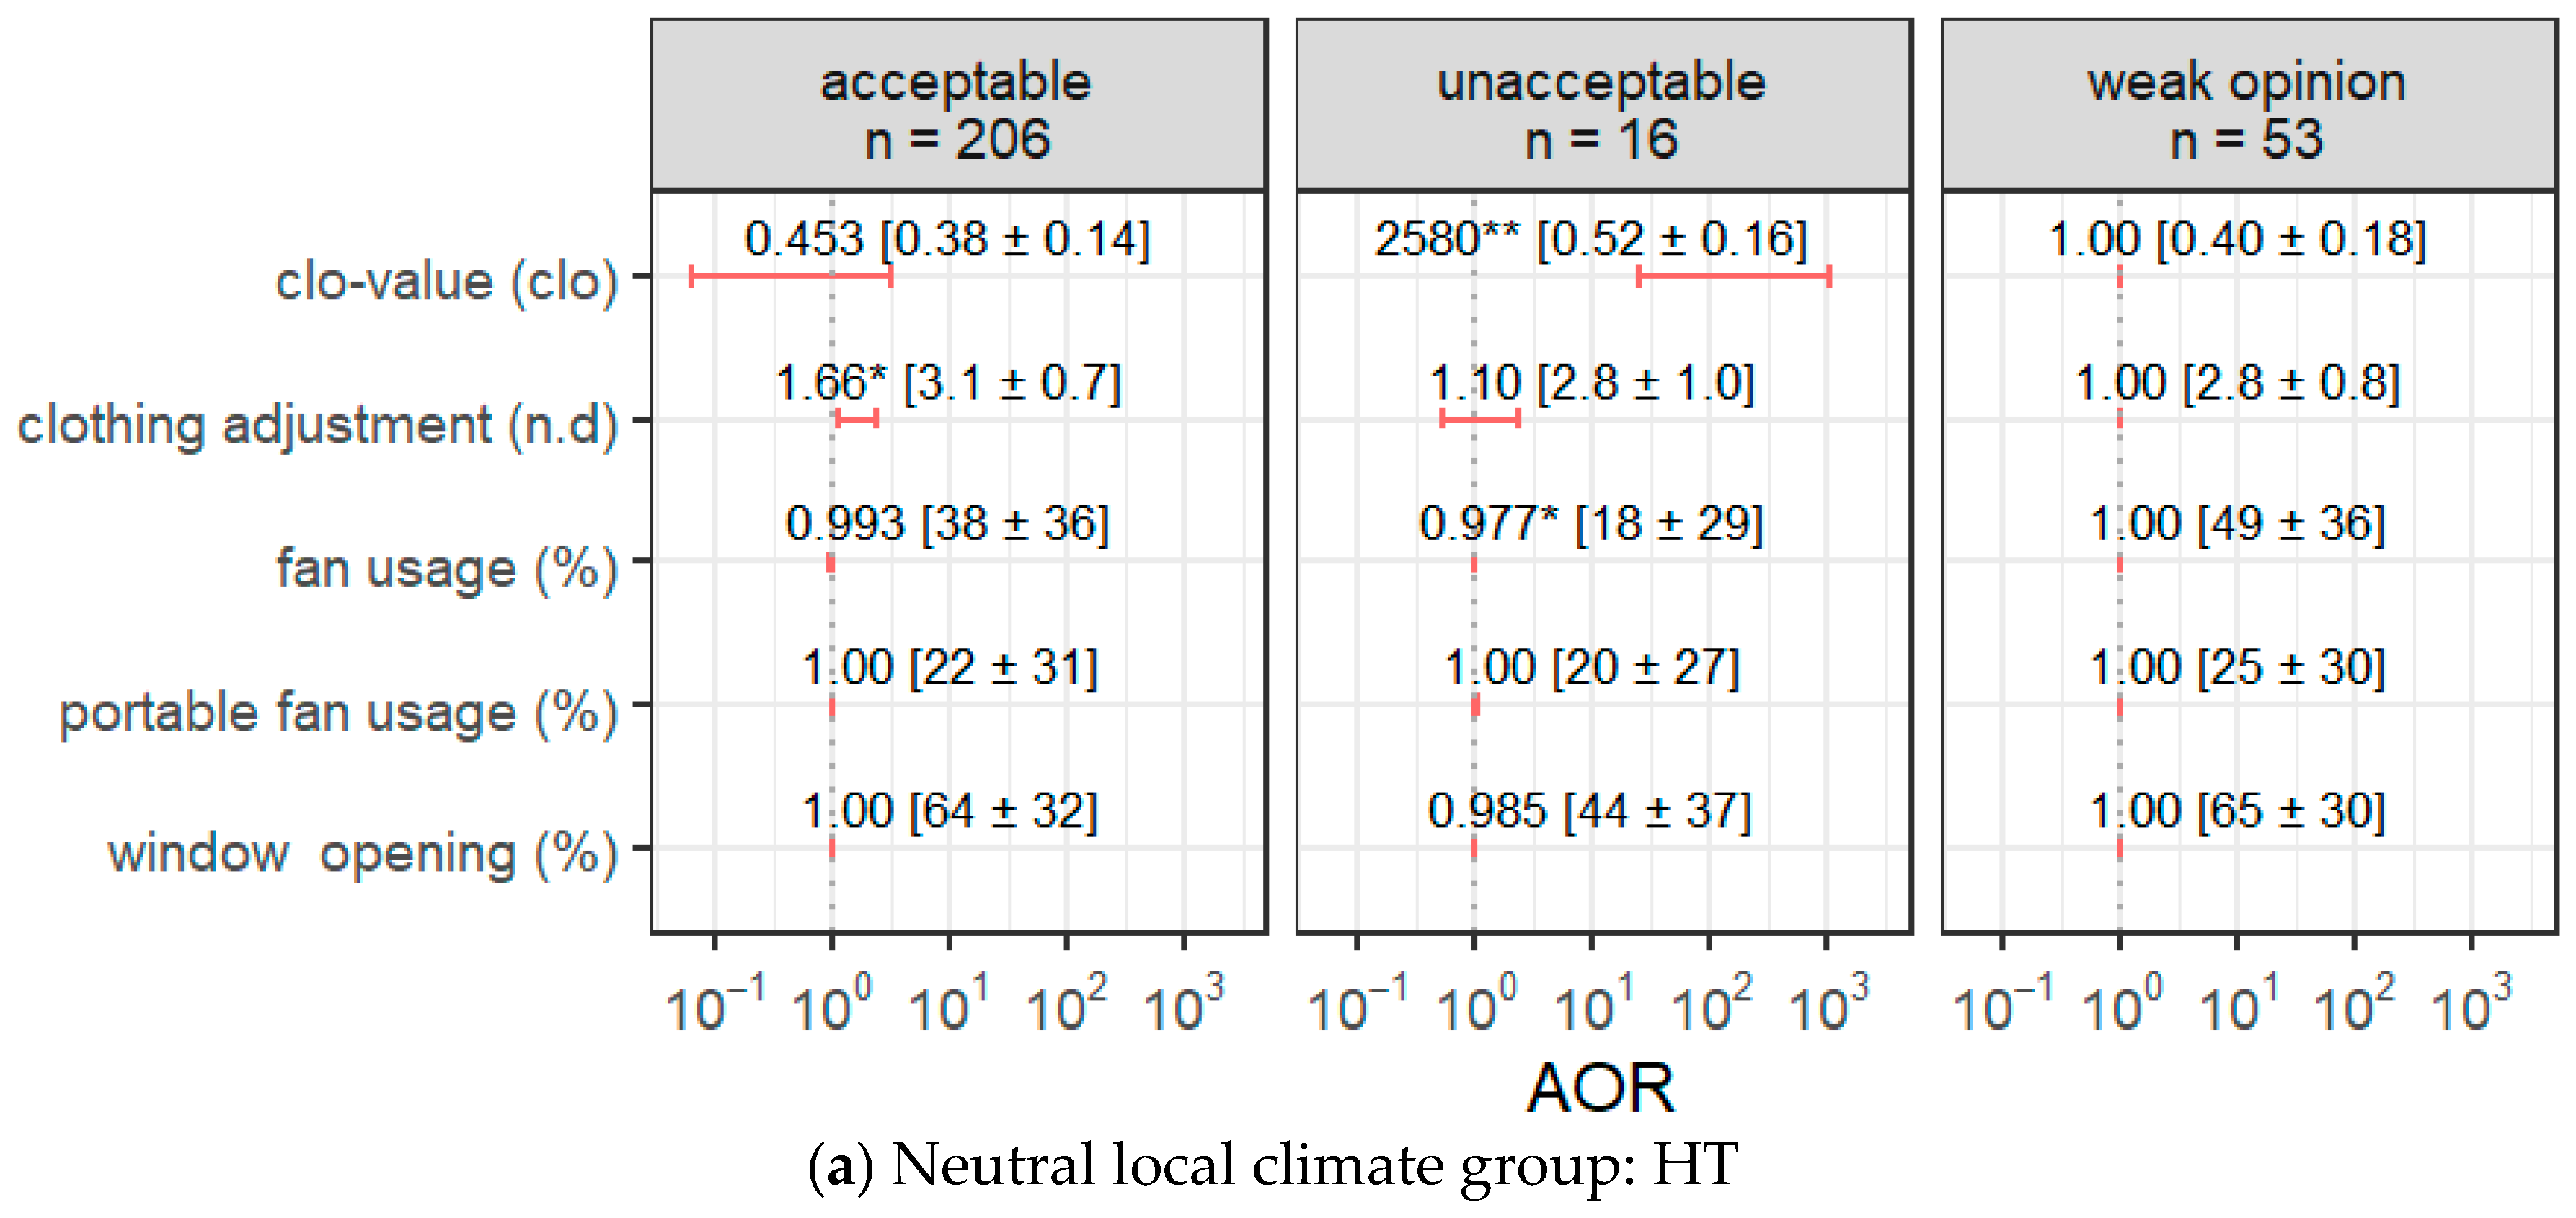
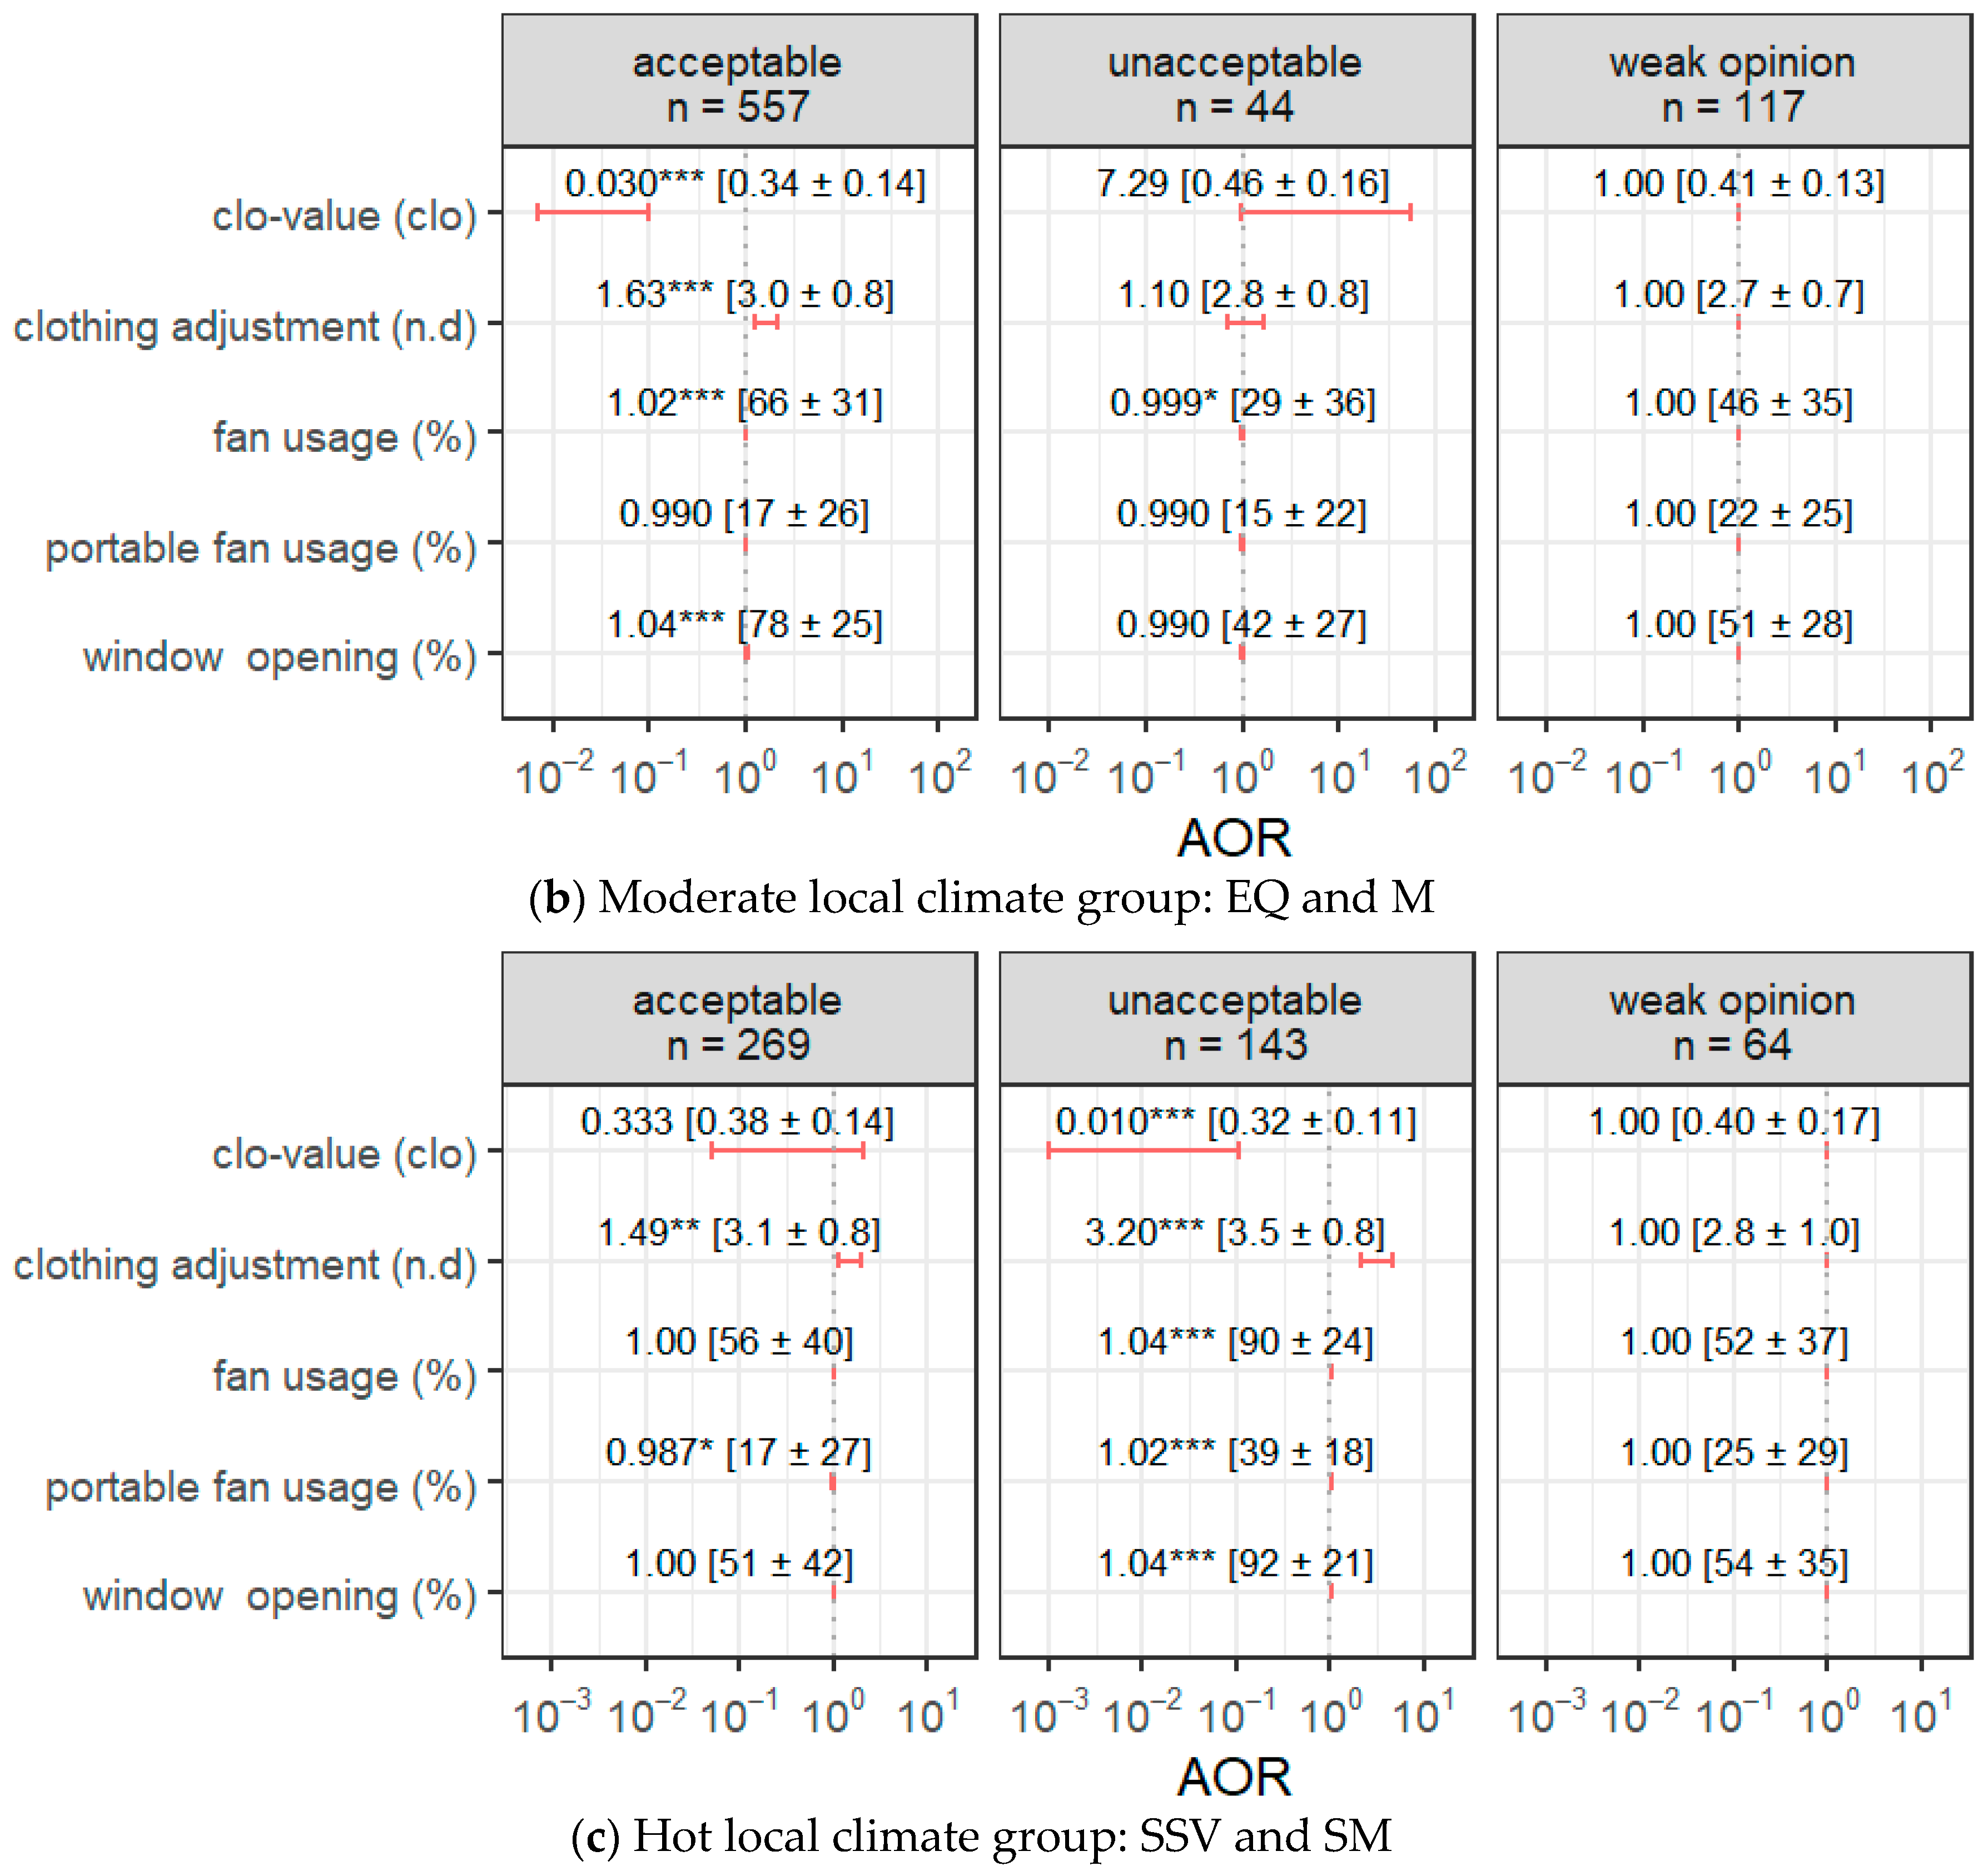
Further investigation into the NV residences based on local climate groups is shown in Figure 6. The results for the neutral local climate in Figure 6a suggest that the respondents who indicated “unacceptable” had high clo-values, averaging 0.52 clo, and lesser fan usage than those with a “weak opinion”, with an average of 18% and 49%, respectively. Meanwhile, those respondents who indicated “acceptable” and “weak opinion” had relatively similar OABs. In Figure 6b, for the moderate local climate group, those respondents who indicated “acceptable” tended to take OABs more intensively. Meanwhile, those respondents who indicated “unacceptable” and “weak opinion” tended to have similar OAB intensities. On the contrary, in Figure 6c, for the hot local climate, those respondents who indicated “unacceptable” tended to carry out OABs more intensively, with a 90% average fan usage, 39% average portable fan usage, 92% average window opening, and a 3.2 average Likert scale score for clothing adjustment. This strengthens the idea that OABs can contribute to mitigating thermal unacceptability but cannot always remove thermal unacceptability for all NV residences. OABs have limitations in their ability to help respondents achieve thermal acceptability. A similar analysis was conducted for AC residences; however, no apparent differences were observed between the OABs based on thermal acceptability for each local climate group.
For portable fan usage for the NV respondents in general (Figure 5b) and in the hot local climate group (Figure 6c), the AOR for the respondents who chose “acceptable” was less than 1, while it was greater than 1 for “unacceptable”. This indicates that the NV respondents who found the thermal environment “acceptable” used portable fans less frequently than those with a “weak opinion”, with averages of 17% and 25%, respectively. On the contrary, those who found it “unacceptable” used portable fans significantly more, with an average of 39%. This is higher than the average portable fan usage for all of the respondents overall, which was only 25%. These results imply that portable fans are primarily used to mitigate thermal unacceptability.

4. Discussion

Developing an adaptation strategy that properly utilizes OABs to maintain thermal acceptability while keeping energy consumption low is necessary. Similar suggestions for utilizing behavioral adjustment to reduce energy consumption were also discussed by Miyamoto et al. [49]. Generally, more respondents in AC mixed-mode residences found the thermal environment acceptable compared to those in NV residences. Several research reports have indicated that the thermal comfort conditions in mixed-mode buildings during NV operation mode are wider than those for AC buildings, agreeing with the adaptive thermal comfort model for NV buildings [50,51,52,53]. The current results support that conventional OABs have great potential to encourage occupants to achieve thermal acceptability in AC mixed-mode residences in Indonesia.

4.1. Indoor Environmental Conditions and OABs

Contrasting trends were observed in the relationship between OABs and thermal acceptability between the AC and NV respondents. For the NV residences, both probabilities of feeling “unacceptable” and “acceptable” increased despite the increasing intensities of conventional OABs. However, for the AC residences, the respondents with more conventional OAB intensity were more likely to indicate “acceptable” than have a “weak opinion”, while the OABs of those who felt “unacceptable” were in a similar range to those of a “weak opinion”. Thus, the current results suggest that OABs should be encouraged to maintain appropriate thermal conditions in AC mixed-mode buildings. This result aligns with previous studies, which noted elevated thermal expectations by OABs among AC and mixed-mode building occupants [50,51,52,53].
The contrasting trends between AC and NV can be explained by the thermal interaction among the human body, clothing, and indoor and outdoor environments [21]. To achieve acceptable thermal conditions, skin temperature and sweat secretion need to be maintained at an acceptable level. Given that the human body always generates metabolic heat, to maintain acceptable skin temperature and sweat secretion, the generated metabolic heat must finally be emitted to the outdoor environment through the building envelope or HVAC system operations. In this context, OABs are interpreted as personal behaviors to achieve thermal acceptability. For NV residences without AC installation, local climates are characterized by the heat and mass transfer potentials at one terminal, while conventional OABs can only adjust the thermal resistance between the skin at the opposite terminal and the local climate. The adjustable range of the thermal resistance in daily life is not infinite. Therefore, the local climate plays an important role in the effectiveness of OABs in achieving thermal acceptability. For AC residences, the indoor environment controlled by AC operation is regarded as the environment terminal of heat and mass transfers. The relatively stable indoor operative temperature and humidity provided by AC operation in AC mixed-mode residences is a key factor that enables conventional OABs to work effectively in achieving thermal acceptability. Meanwhile, for NV residences, the indoor operative temperature and humidity cannot be actively adjusted. If they are within the range where conventional OABs work well, then these OABs can remove thermal unacceptability. However, if they are out of the range, the thermal unacceptability cannot be removed even if it is mitigated by OABs.
Based on these findings, we should consider complementing the use of ACs with OABs instead of only relying on AC’s ability to adjust the overall indoor environmental conditions. Colelli et al. [3] raised the concern of trade-offs between energy consumption and carbon emissions on human feelings of thermal comfort. With the increased awareness of this trade-off, we should properly strategize our behavior so as not to use unnecessary amounts of energy just to achieve a comfortable thermal environment. One successful example of this strategy is the Japanese COOL Biz policy, which encourages office workers to set the AC set-point to slightly higher but compensate for it with a proper strategy of adaptive behavior, e.g., wearing thin clothing, using fans and portable fans, etc. However, this discussion is part of our next study. Therefore, we decided not to include this discussion in the current study. Our main aim in this study was to confirm the limitations and potential of OABs, as well as the effect of AC ownership and local climate conditions on OAB effectiveness.

4.2. Local Climate and OABs

The local climate groups distinguished the trend and potential of OABs for NV residences. In the hot–humid regions of Indonesia, occupants tended to use fans heavily and wear thin clothing in hot and moderate local climates, while only occupants in moderate local climates tended to open their windows more and were unlikely to use portable fans. Occupants in neutral climates hardly used fans and wore relatively high-insulation clothing. However, the OABs in AC mixed-mode residences were similar despite the local climate groups. The reason behind this has been discussed as being related to the indoor environmental conditions. Understanding climate factors can be useful for the further development of an effective strategy to utilize OABs, yet there is limited knowledge on this matter, as discussed by Mylonas et al. [30]. Through this study, we managed to utilize a large-scale online survey across several climate zones and identify the differences in OABs among climate groups and their characteristics.

4.3. Limitations and Research Potentials

Finally, we acknowledge several limitations of this study. We utilized an online survey to gather respondents’ perceptions of their daily thermal environment and the use of OABs. Consequently, the findings are based on the respondents’ perceptions of their usual daily thermal environment rather than on physical environment data or actual thermal fluctuations. Another limitation is related to the sample size. Certain samples, such as AC owners with unacceptable sensations (n = 52), were fewer than the required sample for estimation of population percentage of 5% within 5% error (n = 73). Moreover, while the tasks in factories vary widely, our sampling method was not planned to represent the population of all types of factories. Although the output from this study did not evaluate the percentages of these samples, these might cause a bias in the result. This study evaluated whether input factors influenced the outcome variables using logistic regression. The total sample size reached 3000. However, it may not be sufficient to detect several dependencies, such as dependencies related to SV and SEQ. Additionally, the online format may have limited participation to respondents who are acclimatized to the digital information society, meaning the respondents likely represent individuals with at least a minimum level of technological knowledge to access the Internet. Furthermore, this study used binary data related to thermal unacceptability, but in some cases, the sample size for thermally unacceptable conditions was small, making it difficult to assess how OABs improved thermal comfort when the respondents still found the conditions unacceptable. Another limitation is that climate zones were assigned based on the respondents’ province data, with a conversion accuracy of 75%. This study focused on climate zones as representative factors affecting indoor environments in NV residences.
Future research addressing these limitations is needed to better understand the relationship between OABs and thermal acceptability. Further investigation into underrepresented respondents from specific local climates, such as SV and SEQ, is also necessary. Miyamoto et al. [49] and Mori et al. [34] observed cooling habits—in our case, OABs—by defining the schedules for AC usage, window usage, and fan usage. Miyamoto et al. [49] also revealed that energy consumption increased with household income and that energy consumption by the cooling method was affected by AC usage. However, their studies did not account for differences in local climate zones. Additionally, their studies mainly focused on public housing or apartment buildings, while we considered residential buildings in general. In this study, we were unable to clarify the interaction between OABs, building type, and thermal acceptability. Future investigations into the effect of building types on OABs could provide valuable insights. Our analysis revealed the effectiveness of each OAB in achieving thermal acceptability, which can inform the development of models for occupants’ behavior, as suggested by Mylonas et al. [30]. Proper consideration of OABs can offer valuable insights to designers and policymakers, helping to reduce reliance on mechanical ventilation and AC systems in future buildings.

5. Conclusions

In this study, we conducted a large-scale online survey to understand the perceptions of daily thermal environments and the use of OABs. With a sample size of 3000 respondents covering all 31 Indonesian provinces, the survey provided insights into how the relationship between thermal acceptability and OABs differs by AC ownership, how OABs differ between AC and NV residences, and how AC ownership varies with personal attributes, including climate. The main findings of this study are summarized as follows:
  • The OABs practiced by the Indonesian occupants, such as using fans and portable fans, opening windows, and adjusting clothing insulation, are effective in reducing thermal unacceptability under a certain range of indoor thermal conditions.
  • Among most respondents in AC mixed-mode residences, OABs significantly assisted in achieving thermal acceptability. This was primarily because the indoor thermal conditions in these residences were generally maintained within a moderate range, allowing the OABs to have a relatively large effect.
  • The effects of the OABs in NV residences varied depending on the local climate conditions. In hot climates such as SSV and SM, the OABs were not able to effectively provide thermal acceptability.
  • In contrast, the OABs were more effective in achieving thermal acceptability in NV residences located in moderate local climates such as EQ and M.
  • It can be concluded that ACs are becoming increasingly prevalent in Indonesia, regardless of the local climate’s cooling demands. However, conventional OABs can still address thermal unacceptability in AC residences.
  • AC ownership and usage alter the role of conventional OABs—from enhancing body heat loss in NV residences to reducing body heat loss in AC mixed-mode residences. In AC residences, the respondents were more likely to adjust their clothing and use portable fans, while in NV residences, they preferred to modify their thermal environment by using fans and opening windows.
  • We successfully detected differences in OABs in NV residences by climate. While the OABs in AC residences did not differ based on local climate, those in NV residences did.
Based on these findings, OABs should be encouraged in AC mixed-mode buildings to maintain appropriate thermal conditions. The potential of OAB strategies for NV buildings should be considered separately for each climate zone. This implies that policymakers and building designers should carefully consider OABs as complementary factors to passive building design. In the future, it is essential to explore and document the impact of OABs on thermal comfort and develop effective strategies for their utilization. It is necessary to note that this study utilized self-reported online questionnaires, meaning that the results might be limited to the respondents’ individual perceptions and may not fully represent the daily thermal fluctuations. To improve accuracy, future research should consider recruiting several respondents from similar cities or towns with defined climate zones for actual measurements. This approach can provide more precise insights into the relationships among OABs, thermal acceptability, and local climate zones. By encouraging people to adopt appropriate OAB strategies, we can create a more responsive and inclusive society while reducing energy consumption.

Supplementary Materials

The following supporting information can be downloaded at https://www.mdpi.com/article/10.3390/buildings15010073/s1, Figure S1: Thermal preference scales for perceived their thermal environment used in the questionnaire; Figure S2: AORs from the MLR model of thermal preferences and their significance (a) in AC residences and (b) in NV residences; Table S1: Data used in the analysis; Table S2: Climate zone distribution and the attributes; Sub-topic S3: Occupants’ Adaptive Behavior Differences Based on Thermal Preferences; Sub-topic S4: Questionnaire summary.

Author Contributions

S.R.A. data curation, conceptualization, formal analysis, investigation, visualization, and writing—original draft; T.S. conceptualization, methodology, supervision, writing—review and editing, and project admission; T.K. conceptualization, project admission, supervision, funding acquisition, and writing—review and editing; T.N. conceptualization, methodology, and supervision; M.D.K. project admission and supervision; M.N.F.A. project admission, supervision, and funding acquisition; A.D.A. methodology and data collection and preparation; F.S. methodology and data collection and preparation; I.S.F. data collection and preparation; T.T. data collection and preparation. All authors have read and agreed to the published version of the manuscript.

Funding

This research was funded by Japan Science and Technology Agency (JST)-Japan International Cooperation Agency (JICA) SATREPS (JST, JPMJSA1904) and Japan Society for the Promotion of Science (JSPS) Kaken-hi (20H02313).

Data Availability Statement

The participants of this study did not give written consent for their data to be shared publicly, so due to the sensitive nature of the research, supporting data are not available.

Acknowledgments

We would like to thank Kyohei Kondo of the School of Environment and Society, Institute of Science Tokyo; Hiroshi Mori of YKK AP; Isniaty Hidayah and Andry Suryabrata of the Directorate of Engineering Affairs for Human Settlements and Housing, Ministry of Public Works and Housing, Bandung, Indonesia, for their valuable support with this survey.

Conflicts of Interest

We declare that this study was conducted in the absence of any commercial or financial relationships that could be construed as potential conflicts of interest.

Abbreviations

ACAir conditioner
AORAdjusted odds ratio
BLRBinomial logistic regression
BLR-PBLR for the prediction model using input variables from plural categorical items
BLR-SBLR for a single value within a categorical item
CDDsCooling degree days
EQEquatorial climate zone
HTHighland tropical climate zone
MMonsoonal climate zone
MLRMultinomial logistic regression
NVNaturally ventilated
OABOccupants’ adaptive behavior
SEQSub-equatorial climate zone
SMSub-monsoonal climate zone
SSVSub-savanna climate zone
SVSavanna climate zone
TopIndoor operative temperature (°C)

References

  1. Karyono, T.H. Report on Thermal Comfort and Building Energy Studies in Jakarta, Indonesia. Build. Environ. 2000, 35, 77–90. [Google Scholar] [CrossRef]
  2. Karyono, T.H. Thermal Comfort in Indonesia. In Sustainable Houses and Living in the Hot-Humid Climates of Asia; Springer: Singapore, 2018; pp. 115–121. ISBN 9789811084652. [Google Scholar]
  3. Colelli, F.P.; Wing, I.S.; Cian, E.D. Air-Conditioning Adoption and Electricity Demand Highlight Climate Change Mitigation–Adaptation Tradeoffs. Sci. Rep. 2023, 13, 4413. [Google Scholar] [CrossRef]
  4. Schweiker, M.; Carlucci, S.; Andersen, R.K.; Dong, B.; O’brien, W. Occupancy and Occupants’ Actions. In Exploring Occupant Behavior in Buildings Methods and Challenges; Wagner, A., O’brien, W., Dong, B., Eds.; Springer: Cham, Switzerland, 2018; Chapter 2; pp. 6–38. [Google Scholar]
  5. Kim, J.; Tartarini, F.; Parkinson, T.; Cooper, P.; de Dear, R. Thermal Comfort in a Mixed-Mode Building: Are Occupants More Adaptive? Energy Build. 2019, 203, 109436. [Google Scholar] [CrossRef]
  6. Fanger, P.O. Assessment of Man’s Thermal Comfort in Practice. Br. J. Ind. Med. 1973, 30, 313–324. [Google Scholar] [CrossRef]
  7. Fanger, P.O. Thermal Comfort: Analysis and Applications in Environmental Engineering; Danish Technical Press: Copenhagen, Denmark, 1970. [Google Scholar]
  8. De Dear, R.J.; Fountain, M.E. Field experiments on occupant comfort and office thermal environments in a hot-humid climate. ASHRAE Trans. 1994, 100, 457–475. [Google Scholar]
  9. Brager, G.S.; de Dear, R.J. Thermal Adaptation in the Built Environment: A Literature Review. Energy Build. 1998, 17, 83–96. [Google Scholar] [CrossRef]
  10. De Dear, R.J.; Brager, G.S. Developing an Adaptive Model of Thermal Comfort and Preference. ASHRAE Trans. 1998, 104, 145–153. [Google Scholar]
  11. Humphreys, M.; Nicol, F. Understanding the Adaptive Approach to Thermal Comfort. ASHRAE Trans. 1998, 104, 991–1004. [Google Scholar]
  12. Nicol, J.F.; Humphreys, M.A. Adaptive Thermal Comfort and Sustainable Thermal Standards for Buildings. Energy Build. 2002, 34, 563–572. [Google Scholar] [CrossRef]
  13. Ma, N.; Chen, L.; Hu, J.; Perdikaris, P.; Braham, W.W. Adaptive Behavior and Different Thermal Experiences of Real People: A Bayesian Neural Network Approach to Thermal Preference Prediction and Classification. Build. Environ. 2021, 198, 107875. [Google Scholar] [CrossRef]
  14. Rijal, H.B.; Tuohy, P.; Humphreys, M.A.; Nicol, J.F.; Samuel, A. Considering the Impact of Situation-Specific Motivations and Constraints in the Design of Naturally Ventilated and Hybrid Buildings. Archit. Sci. Rev. 2012, 55, 35–48. [Google Scholar] [CrossRef]
  15. Langevin, J.; Wen, J.; Gurian, P.L. Simulating the Human-Building Interaction: Development and Validation of an Agent-Based Model of Office Occupant Behaviors. Build. Environ. 2015, 88, 27–45. [Google Scholar] [CrossRef]
  16. Nakaya, T.; Matsubara, N.; Kurazumi, Y. Use of Occupant Behaviour to Control the Indoor Climate in Japanese Residences. In Proceedings of the Air Conditioning and the Low Carbon Cooling Challenge, Windsor, UK, 27–29 July 2008. [Google Scholar]
  17. Haldi, F.; Robinson, D. On the Behaviour and Adaptation of Office Occupants. Build. Environ. 2008, 43, 2163–2177. [Google Scholar] [CrossRef]
  18. Uddin, M.N.; Lee, M.; Ni, M. The Impact of Socio-Demographic Factors on Occupants’ Thermal Comfort and Sensation: An Integrated Approach Using Statistical Analysis and Agent-Based Modeling. Build. Environ. 2023, 246, 110974. [Google Scholar] [CrossRef]
  19. Vargas, N.T.; Chapman, C.L.; Johnson, B.D.; Gathercole, R.; Schlader, Z.J. Skin Wettedness Is an Important Contributor to Thermal Behavior during Exercise and Recovery. Am. J. Physiol. Regul. Integr. Comp. Physiol. 2018, 315, 925–933. [Google Scholar] [CrossRef]
  20. Mamulova, E.; Loomans, M.; Loonen, R.; Schweiker, M.; Kort, H. Let’s Talk Scalability: The Current Status of Multi-Domain Thermal Comfort Models as Support Tools for the Design of Office Buildings. Build. Environ. 2023, 242, 110502. [Google Scholar] [CrossRef]
  21. Sakoi, T.; Kurazumi, Y.; Apriliyanthi, S.R.; Sawada, S.i.; Gao, C. Human Body Heat Balance Equation to Consider Core Body Temperature in Assessment of Heatstroke Risk. Build. Environ. 2024, 247, 111020. [Google Scholar] [CrossRef]
  22. El-Azzeh, S.; Wright, A.; Khattak, S.; Salem, M.; Al-Ajmi, F. An Investigation into Gender and Clothing’s Effect on Indoor Thermal Comfort in Hot-Desert Climate: A Case Study in Kuwait. ASHRAE Trans. 2023, 129, 800–809. [Google Scholar]
  23. Peng, Y.; Cui, Y. Advanced Textiles for Personal Thermal Management and Energy. Joule 2020, 4, 724–742. [Google Scholar] [CrossRef]
  24. De Carli, M.; Olesen, B.W.; Zarrella, A.; Zecchin, R. People’s Clothing Behaviour According to External Weather and Indoor Environment. Build. Environ. 2007, 42, 3965–3973. [Google Scholar] [CrossRef]
  25. Das, A.; Alagirusamy, R.; Kumar, P. Study of Heat Transfer through Multilayer Clothing Assemblies: A Theoretical Prediction. AUTEX Res. J. 2011, 11, 54–60. [Google Scholar] [CrossRef]
  26. Indraganti, M.; Lee, J.; Zhang, H.; Arens, E.A. Thermal Adaptation and Insulation Opportunities Provided by Different Drapes of Indian Saris. Archit. Sci. Rev. 2015, 58, 87–92. [Google Scholar] [CrossRef]
  27. Gao, S.; Ooka, R.; Oh, W. Experimental Assessment of Convective and Radiative Heat Transfer Coefficients for Various Clothing Ensembles. Int. J. Biometeorol. 2021, 65, 1811–1822. [Google Scholar] [CrossRef]
  28. Alnuaimi, A.; Natarajan, S.; Kershaw, T. The Comfort and Energy Impact of Overcooled Buildings in Warm Climates. Energy Build. 2022, 260, 111938. [Google Scholar] [CrossRef]
  29. Parkinson, T.; Schiavon, S.; de Dear, R.; Brager, G. Overcooling of Offices Reveals Gender Inequity in Thermal Comfort. Sci. Rep. 2021, 11, 23684. [Google Scholar] [CrossRef]
  30. Mylonas, A.; Tsangrassoulis, A.; Pascual, J. Modelling Occupant Behaviour in Residential Buildings: A Systematic Literature Review. Build. Environ. 2024, 265, 111959. [Google Scholar] [CrossRef]
  31. Raja, I.A.; Nicol, J.F.; Mccartney, K.J.; Humphreys, M.A. Thermal Comfort: Use of Controls in Naturally Ventilated Buildings. Energy Build. 2001, 33, 235–244. [Google Scholar] [CrossRef]
  32. Zhou, J.; Zhang, X.; Xie, J.; Liu, J. Occupant’s Preferred Indoor Air Speed in Hot-Humid Climate and Its Influence on Thermal Comfort. Build. Environ. 2023, 229, 109933. [Google Scholar] [CrossRef]
  33. Zhou, J.; Zhang, X.; Xie, J.; Liu, J. Effects of Elevated Air Speed on Thermal Comfort in Hot-Humid Climate and the Extended Summer Comfort Zone. Energy Build. 2023, 287, 112953. [Google Scholar] [CrossRef]
  34. Mori, H.; Kubota, T.; Antaryama, I.G.N.; Ekasiwi, S.N.N. Analysis of Window-Opening Patterns and Air Conditioning Usage of Urban Residences in Tropical Southeast Asia. Sustainability 2020, 12, 10650. [Google Scholar] [CrossRef]
  35. Wu, Z.; Li, N.; Wargocki, P.; Peng, J.; Li, J.; Cui, H. Adaptive Thermal Comfort in Naturally Ventilated Dormitory Buildings in Changsha, China. Energy Build. 2019, 186, 56–70. [Google Scholar] [CrossRef]
  36. Indraganti, M.; Ooka, R.; Rijal, H.B.; Brager, G.S. Adaptive Model of Thermal Comfort for Offices in Hot and Humid Climates of India. Build. Environ. 2014, 74, 39–53. [Google Scholar] [CrossRef]
  37. Faheem, M.; Bhandari, N.; Tadepalli, S. Adaptive Thermal Comfort in Naturally Ventilated Hostels of Warm and Humid Climatic Region, Tiruchirappalli, India. Energy Built Environ. 2023, 4, 530–542. [Google Scholar] [CrossRef]
  38. Malik, J.; Bardhan, R.; Hong, T.; Piette, M.A. Contextualising Adaptive Comfort Behaviour within Low-Income Housing of Mumbai, India. Build. Environ. 2020, 177, 106877. [Google Scholar] [CrossRef]
  39. Kumar, S.; Singh, M.K.; Kukreja, R.; Chaurasiya, S.K.; Gupta, V.K. Comparative Study of Thermal Comfort and Adaptive Actions for Modern and Traditional Multi-Storey Naturally Ventilated Hostel Buildings during Monsoon Season in India. J. Build. Eng. 2019, 23, 90–106. [Google Scholar] [CrossRef]
  40. Kumar, S.; Mathur, J.; Mathur, S.; Singh, M.K.; Loftness, V. An Adaptive Approach to Define Thermal Comfort Zones on Psychrometric Chart for Naturally Ventilated Buildings in Composite Climate of India. Build. Environ. 2016, 109, 135–153. [Google Scholar] [CrossRef]
  41. Kumar, S.; Singh, M.K. Field Investigation on Occupant’s Thermal Comfort and Preferences in Naturally Ventilated Multi-Storey Hostel Buildings over Two Seasons in India. Build. Environ. 2019, 163, 106309. [Google Scholar] [CrossRef]
  42. Haneda, M.; Nishihara, N.; Nakamura, S.; Uchida, S.; Tanabe, S.I. A Field Measurement of Thermal Environment in COOL BIZ Office and the Evaluation on Productivity by a Questionnaire Survey. J. Environ. Eng. 2009, 74, 389–396. [Google Scholar] [CrossRef]
  43. Mustapa, M.S.; Zaki, S.A.; Rijal, H.B.; Hagishima, A.; Ali, M.S.M. Thermal Comfort and Occupant Adaptive Behaviour in Japanese University Buildings with Free Running and Cooling Mode Offices during Summer. Build. Environ. 2016, 105, 332–342. [Google Scholar] [CrossRef]
  44. Tanabe, S.; Haneda, M.; Nishihara, N. Workplace Productivity and Individual Thermal Satisfaction. Build. Environ. 2015, 91, 42–50. [Google Scholar] [CrossRef]
  45. Khadka, S.; Rijal, H.B.; Amano, K.; Saito, T.; Imagawa, H.; Uno, T.; Genjo, K.; Takata, H.; Tsuzuki, K.; Nakaya, T.; et al. Development of Adaptive Behaviour Models for Thermal Comfort: Longitudinal Investigation in Japanese Office Buildings and Literature Review. J. Build. Eng. 2024, 89, 109220. [Google Scholar] [CrossRef]
  46. Rijal, H.B.; Yoshida, H.; Umemiya, N. Seasonal and Regional Differences in Neutral Temperatures in Nepalese Traditional Vernacular Houses. Build. Environ. 2010, 45, 2743–2753. [Google Scholar] [CrossRef]
  47. Feriadi, H.; Wong, N.H. Thermal Comfort for Naturally Ventilated Houses in Indonesia. Energy Build. 2004, 36, 614–626. [Google Scholar] [CrossRef]
  48. Kubota, T.; Lee, H.S.; Trihamdani, A.R.; Phuong, T.T.T.; Tanaka, T.; Matsuo, K. Impacts of Land Use Changes from the Hanoi Master Plan 2030 on Urban Heat Islands: Part 1. Cooling Effects of Proposed Green Strategies. Sustain. Cities Soc. 2017, 32, 295–317. [Google Scholar] [CrossRef]
  49. Miyamoto, K.; Pratiwi, S.N.; Nishiiri, S.; Takaguchi, H.; Kubota, T. Relationship between Cooling Methods and Energy Consumption for the Development of Low-Carbon Collective Housing in Indonesia. Sustainability 2024, 16, 1635. [Google Scholar] [CrossRef]
  50. Bienvenido-Huertas, D.; Sánchez-García, D.; Rubio-Bellido, C.; Pulido-Arcas, J.A. Influence of the Improvement in Thermal Expectation Levels with Adaptive Setpoint Temperatures on Energy Consumption. Appl. Sci. 2020, 10, 5282. [Google Scholar] [CrossRef]
  51. Yan, H.; Sun, Z.; Shi, F.; Yuan, G.; Dong, M.; Wang, M. Thermal Response and Thermal Comfort Evaluation of the Split Air Conditioned Residential Buildings. Build. Environ. 2022, 221, 109326. [Google Scholar] [CrossRef]
  52. Kim, J.; de Dear, R. Is Mixed-Mode Ventilation a Comfortable Low-Energy Solution? A Literature Review. Build. Environ. 2021, 205, 108215. [Google Scholar] [CrossRef]
  53. Schweiker, M.; Rissetto, R.; Wagner, A. Thermal Expectation: Influencing Factors and Its Effect on Thermal Perception. Energy Build. 2020, 210, 109729. [Google Scholar] [CrossRef]
  54. Karyono, T.H. Predicting Comfort Temperature in Indonesia, an Initial Step to Reduce Cooling Energy Consumption. Buildings 2015, 5, 802–813. [Google Scholar] [CrossRef]
  55. Uno, T.; Hokoi, S.; Nastiti, E.S.; Tomoko, U. Survey on Thermal Environment in Residences in Surabaya, Indonesia: Use of Air Conditioner. J. Asian Archit. Build. Eng. 2003, 2, 15–21. [Google Scholar] [CrossRef]
  56. Koerniawan, M.D.; Aziiz, A.D.; Kawakami, R.; Hasebe, H.; Angela Upitya, P.; Rhamadana, V.; Suhendri; Ardiani, N.A.; Fitriyana, D. Workers Thermal Comfort in Tropical Humid Climate Indonesia (Book in Indonesian); Warsidi, E., Ed.; ITB Press: Bandung, Indonesia, 2020; ISBN 978-623-7568-97-1. [Google Scholar]
  57. Novianto, D.; Koerniawan, M.D.; Munawir, M.; Sekartaji, D. Impact of Lifestyle Changes on Home Energy Consumption during Pandemic COVID-19 in Indonesia. Sustain. Cities Soc. 2022, 83, 103930. [Google Scholar] [CrossRef]
  58. Arifah, L.; Sobari, N.; Usman, H. Hijab Phenomenon in Indonesia: Does Religiosity Matter? In Competition and Cooperation in Economics and Business; Routledge: London, UK, 2017; pp. 179–186. ISBN 9781138626669. [Google Scholar]
  59. Rahayu, L.M. Hijab: Pop Culture and Moeslem Identity in Indonesia (Indonesian: “Jilbab: Budaya Pop Dan Identitas Muslim Di Indonesia”). J. Kebud. Islam 2016, 14, 139–155. [Google Scholar]
  60. Putra, I.D.G.A.; Nimiya, H.; Sopaheluwakan, A.; Kubota, T.; Lee, H.S.; Pradana, R.P.; Alfata, M.N.F.; Perdana, R.B.; Permana, D.S.; Riama, N.F. Development of Climate Zones for Passive Cooling Techniques in the Hot and Humid Climate of Indonesia. Build. Environ. 2022, 226, 109698. [Google Scholar] [CrossRef]
  61. ISO 9920; Ergonomics of the Thermal Environment—Estimation of Thermal Insulation and Water Vapour Resistance of a Clothing Ensemble. International Organization for Standardization: London, UK, 2007.
  62. McCullough, E.A.; Jones, B.W.; Huck, J. A Comprehensive Data Base for Estimating Clothing Insulation. ASHRAE Trans. 1985, 91, 29–47. [Google Scholar]
  63. Al-ajmi, F.F.; Loveday, D.L.; Bedwell, K.H.; Havenith, G. Thermal Insulation and Clothing Area Factors of Typical Arabian Gulf Clothing Ensembles for Males and Females: Measurements Using Thermal Manikins. Appl. Ergon. 2008, 39, 407–414. [Google Scholar] [CrossRef]
  64. Rimba, A.B.; Atmaja, T.; Mohan, G.; Chapagain, S.K.; Arumansawang, A.; Payus, C.; Fukushi, K. Identifying Land Use and Land Cover (LULC) Change from 2000 to 2025 Driven by Tourism Growth: A Study Case in Bali. In Proceedings of the International Archives of the Photogrammetry, Remote Sensing and Spatial Information Sciences—ISPRS Archives; International Society for Photogrammetry and Remote Sensing, Bethesda, MD, USA; 2020; Volume 43, pp. 1621–1627. [Google Scholar]
  65. Ramadan, G.F.; Hidayati, I.N. Prediction and Simulation of Land Use and Land Cover Changes Using Open Source QGIS. A Case Study of Purwokerto, Central Java, Indonesia. Indones. J. Geogr. 2022, 54, 344–351. [Google Scholar] [CrossRef]
Figure 1. Scale used in the questionnaire to express respondents’ thermal acceptance. Note: English translations were not indicated in the questionnaire.
Buildings 15 00073 g001
Figure 2. Examples of Indonesian clothing: (a) female workplace clothes with a hijab; (b) male wearing a sarong in his residence or the mosque; (c) female wearing a home dress (daster).
Buildings 15 00073 g002
Figure 3. BLR results for the relationship between OABs and AC ownership. Note: values in [ ] represent the averages and standard deviations. *** p ≤ 0.001; ** 0.001 < p < 0.01.
Buildings 15 00073 g003
Figure 4. MLR AORs for climate group and their significance (a) in AC residences and (b) NV residences. Note: values in [ ] are the averages and standard deviations. *** p ≤ 0.001; ** 0.001 < p < 0.01; * 0.01 ≤ p ≤ 0.05.
Buildings 15 00073 g004
Figure 5. MLR AORs for thermal acceptability and their significance (a) in AC residences and (b) in NV residences. Note: values in [ ] are the averages and standard deviations. *** p ≤ 0.001; ** 0.001 < p < 0.01; * 0.01 ≤ p ≤ 0.05.
Buildings 15 00073 g005
Figure 6. MLR AORs for local climate groups and their significance (a) in a neutral local climate, (b) in a moderate local climate, and (c) in a hot local climate. Note: values in [ ] are the averages and standard deviations. *** p ≤ 0.001; ** 0.001 < p < 0.01; * 0.01 ≤ p ≤ 0.05.
Buildings 15 00073 g006aBuildings 15 00073 g006b
Table 1. NV respondent samples and AORs for thermal unacceptability of OABs based on climate zone.
Local Climate GroupNeutralModerateHot
Climate ZoneHTEQMSEQSVSSVSM
NV samples (n)2753523651915259221
Samples with an unacceptable thermal environment (n)161826217079
Percentage of unacceptable thermal environment responses (%)5.85.17.19.16.727.036.4
CDDs (°C/year)0884.8838.8845.4972.11374.11042.7
AOR of OABClo-value (clo)4770 ***135 **39.9 **--0.011 **0.0708 *
Fan usage intensity (%)0.9820.985 *0.967 ***--1.06 ***1.03 ***
Window opening intensity (%)0.9850.974 **0.968 ***--1.06 ***1.03 ***
Portable fan usage intensity (%)1.001.010.990--1.04 ***1.02 ***
Clothing adjustment intensity (categorical) ** ***
Never0.9410.4165.27--0.000.498
Rarely1.930.7736.56 **--0.001.05
Sometimes0.2960.5381.25--0.0423 ***0.586
Often (reference)1.001.001.00--1.001.00
Note: *** p ≤ 0.001; ** 0.001 < p < 0.01; * 0.01 ≤ p ≤ 0.05.
Table 2. Changes in the −2 log-likelihood of the final step in the BLR-P analysis on AC ownership.
VariableVariable TypeChange in −2 Log-LikelihoodSig. of the Change
Income levelCategorical382.660.000
WorkplaceBinary206.7540.000
Climate zoneCategorical71.0560.000
Type of residence buildingCategorical25.6890.000
Fan ownershipBinary21.1930.000
Cox and Snell R2 = 0.302; Nagelkerke R2 = 0.403; classification percentage = 74.6%.
Table 3. AOR results for AC ownership BLR-S.
VariableSample NumberAOR
(95% Confident Interval)
BLR-SBLR-P
Income
(1) ≥10 mil. IDR/month23511.8 *** (7.34–19.1)38.1 *** (17.4–83.7)
(2) 5–10 mil. IDR/month6195.18 *** (4.17–6.43)14.17 *** (7.43–27.0)
(3) 3.5–5 mil. IDR/month10690.816 ** (0.701–0.951)5.22 *** (2.79–9.76)
(4) 2.5–3.5 mil. IDR/month5910.440 *** (0.363–0.534)2.70 ** (1.43–5.10)
(5) 1.5–2.5 mil. IDR/month4140.210 *** (0.162–0.272)1.10 (0.567–2.12)
(6) ≤1.5 mil. IDR/month720.285 *** (0.159–0.514)1.00 (1.00–1.00)
Workplace
(1) Factory15000.198 *** (0.169–0.232)0.253 *** (0.209–0.307)
(2) Office15005.05 *** (4.31–5.92)1.00 (1.00–1.00)
Climate zone
(1) Highland tropical climate5691.10 (0.912–1.33)0.624 ** (0.478–0.815)
(2) Sub-savanna climate4220.627 *** (0.506–0.778)0.330 *** (0.244–0.446)
(3) Savanna climate250.759 (0.334–1.72)0.519 (0.208–1.29)
(4) Sub-equatorial climate863.50 *** (2.06–5.93)1.08 (0.596–1.94)
(5) Equatorial climate6920.915 (0.769–1.09)0.798 (0.621–1.03)
(6) Sub-monsoonal climate3740.739 ** (0.59–0.92)0.460 *** (0.340–0.624)
(7) Monsoonal climate8321.37 *** (1.17–1.62)1.00 (1.00–1.00)
Building type
(1) Rusunami2119.4 ** (2.59–146)12.1 * (1.47–99.9)
(2) Rusunawa530.807 (0.462–1.41)0.606 (0.316–1.16)
(3) Dormitory510.422 ** (0.227–0.783)0.276 ** (0.133–0.570)
(4) Shophouse421.51 (0.793–2.88)1.06 (0.484–2.31)
(5) Cluster house11481.29 ** (1.11–1.50)1.06 (0.877–1.29)
(6) Detached house16850.782 ** (0.675–0.907)1.00 (1.00–1.00)
Fan ownership
(1) Do not own fan3800.638 *** (0.510–0.799)0.529 *** (0.401–0.697)
(2) Own fan26201.57 *** (1.25–1.96)1.00 (1.00–1.00)
Note: *** p ≤ 0.001; ** 0.001 < p < 0.01; * 0.01 ≤ p ≤ 0.05.
Table 4. Overview of Indonesian OABs in residential buildings.
OABNV ResidencesAC ResidencesOverall
AC set-point temperature (°C)-21.7 ± 3.5-
AC usage (%)-60 ± 29-
Fan usage (%)58 ± 3752 ± 3155 ± 34
Window opening (%)67 ± 3363 ± 3065 ± 32
Portable fan usage (%)21 ± 2724 ± 2823 ± 28
Clothing adjustment (n.d.)3.0 ± 0.83.2 ± 0.83.1 ± 0.8
Clo-value (clo)0.37 ± 0.140.39 ± 0.160.38 ± 15
Number of samples150614943000
Disclaimer/Publisher’s Note: The statements, opinions and data contained in all publications are solely those of the individual author(s) and contributor(s) and not of MDPI and/or the editor(s). MDPI and/or the editor(s) disclaim responsibility for any injury to people or property resulting from any ideas, methods, instructions or products referred to in the content.