
The Impact of Accident Experience on Unsafe Behaviors of Construction Workers Within Social Cognitive Theory


Abstract
1. Introduction
2. Theoretical Mechanisms and Hypotheses
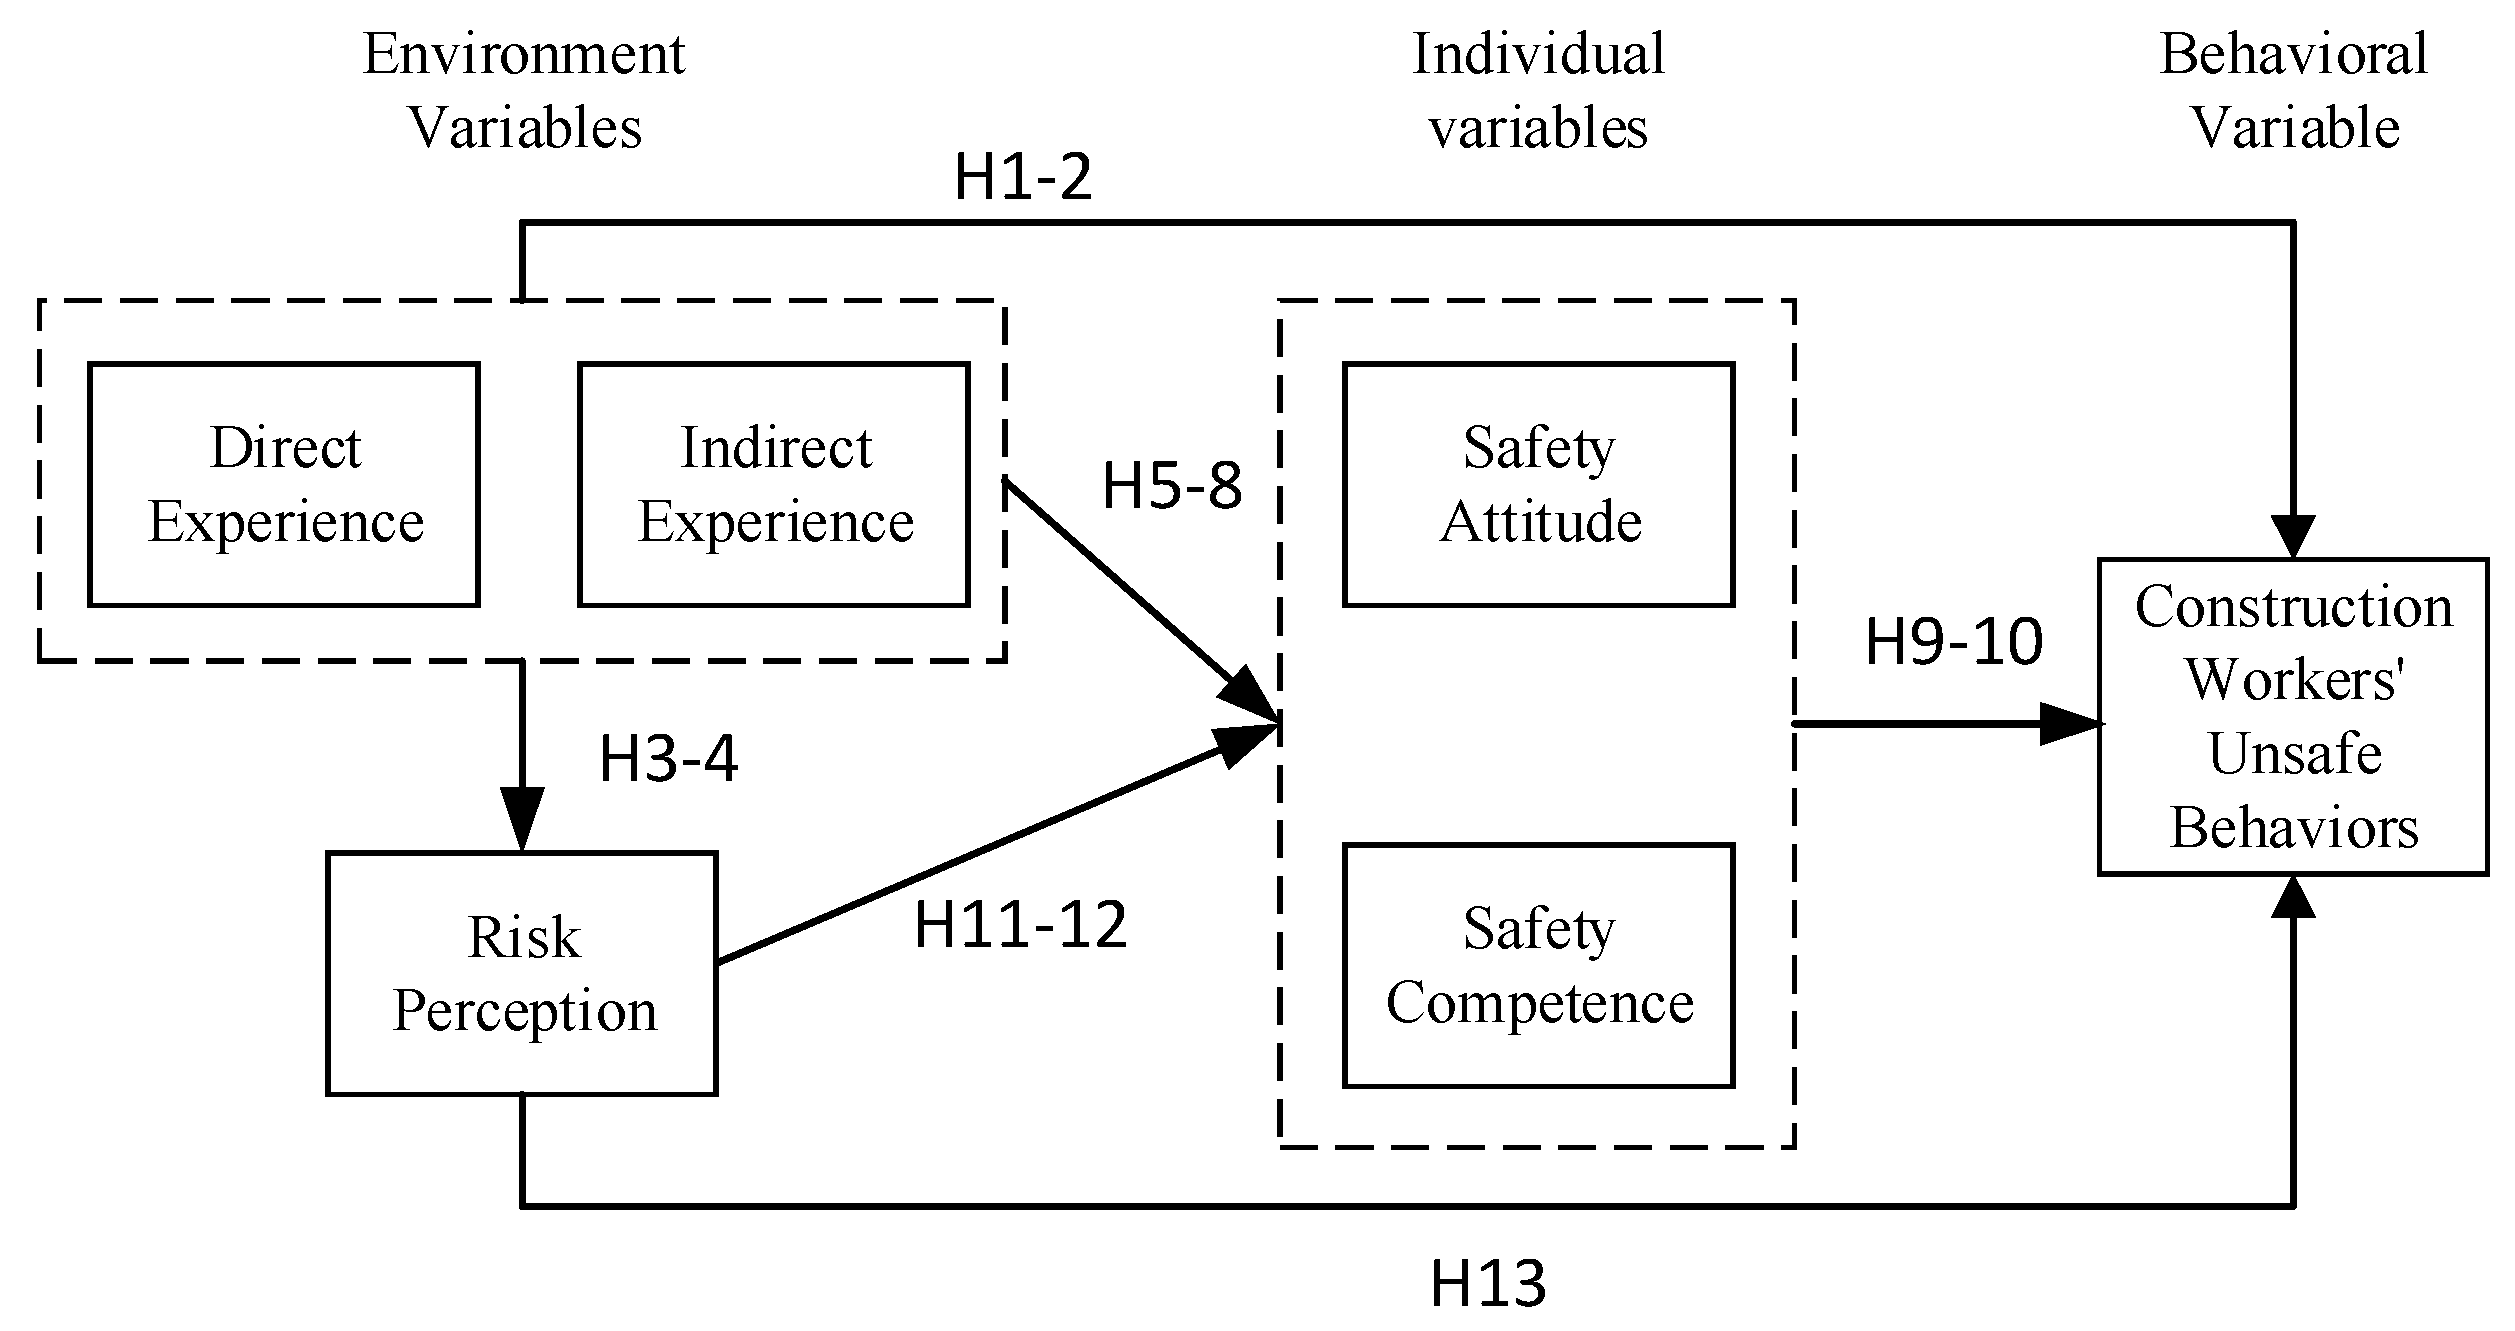
2.1. Social Cognitive Model
2.2. Environmental Factors
2.3. Personal Factors
2.4. Mediating Factor
3. Research Methodology
3.1. Measurement
3.2. Participants
3.3. Statistical Analysis
4. Results
4.1. Socio-Demographic Characteristics
4.2. Scale Reliability and Validity Test
4.3. Structural Equation Model Test
4.4. Mediation Analysis
5. Discussion
5.1. Theoretical Implications
5.2. Practical Implications
- (1)
- Strengthen safety awareness through immersive experience.
- (2)
- Develop an accident case database to strengthen warning education.
- (3)
- Develop a comprehensive reward and punishment system to promote safety compliance.
5.3. Limitations and Future Research Opportunities
6. Conclusions
Author Contributions
Funding
Institutional Review Board Statement
Informed Consent Statement
Data Availability Statement
Conflicts of Interest
Abbreviations
References
- Comu, S.; Kazar, G.; Marwa, Z. Evaluating the attitudes of different trainee groups towards eye tracking enhanced safety training methods. Adv. Eng. Inform. 2021, 49, 101353. [Google Scholar] [CrossRef]
- Guo, X.; Liu, Y.; Tan, Y.; Xia, Z.; Fu, H. Hazard identification performance comparison between virtual reality and traditional construction safety training modes for different learning style individuals. Saf. Sci. 2024, 180, 106644. [Google Scholar] [CrossRef]
- Workplace Accident Notification of Building and Municipal Engineering, Ministry of Housing and Urban-Rural Development. Available online: https://www.mohurd.gov.cn/gongkai/zc/wjk/art/2022/art_17339_768565.html (accessed on 21 May 2021).
- Yang, S.; Wang, T.; Li, H.; Liu, L.; Yao, W.; Ren, G. The Cross-Cutting Effects of Age Expectation and Safety Value on Construction Worker Safety Behavior: A Multidimensional Analysis. Buildings 2024, 14, 2290. [Google Scholar] [CrossRef]
- Health and Safety Executive. Workplace Fatal Injuries in Great Britain. Available online: https://www.ukata.org.uk/documents/294/Workplace_fatal_injuries_in_Great_Britain_2020.pdf (accessed on 1 July 2020).
- Mei, Y.; Huang, J.; Liu, J.; Jia, L. A Study of Factors Influencing Construction Workers’ Intention to Share Safety Knowledge. Buildings 2024, 14, 440. [Google Scholar] [CrossRef]
- Bao, Z.; Lu, W. Developing efficient circularity for construction and demolition waste management in fast emerging economies: Lessons learned from Shenzhen, China. Sci. Total Environ. 2020, 724, 138264. [Google Scholar] [CrossRef] [PubMed]
- Fu, H.; Tan, Y.; Xia, Z.; Feng, K.; Guo, X. Effects of construction workers’ safety knowledge on hazard-identification performance via eye-movement modeling examples training. Saf. Sci. 2024, 180, 106653. [Google Scholar] [CrossRef]
- Salminen, S.; Tallberg, T. Human errors in fatal and serious occupational accidents in Finland. Ergonomics 1996, 39, 980–988. [Google Scholar] [CrossRef] [PubMed]
- Zheng, X.; Wang, Y.; Chen, Y.; Zeng, Q.; Jin, L. Influence of safety experience and environmental conditions on site hazard identification performance. Buildings 2023, 13, 251. [Google Scholar] [CrossRef]
- Oah, S.; Na, R.; Moon, K. The Influence of Safety Climate, Safety Leadership, Workload, and Accident Experiences on Risk Perception: A Study of Korean Manufacturing Workers. Saf. Health Work 2018, 9, 427–433. [Google Scholar] [CrossRef]
- Terum, J.A.; Svartdal, F. Lessons learned from accident and near-accident experiences in traffic. Saf. Sci. 2019, 120, 672–678. [Google Scholar] [CrossRef]
- Lheureux, F.; Auzoult, L. When the social discourse on violation behaviours is challenged by the perception of everyday life experiences: Effects of non-accident experiences on offending attitudes and habits. Accid. Anal. Prev. 2016, 94, 89–96. [Google Scholar] [CrossRef]
- Gonçalves, S.M.P.; da Silva, S.A.; Lima, M.L.; Meliá, J.L. The impact of work accidents experience on causal attributions and worker behaviour. Saf. Sci. 2008, 46, 992–1001. [Google Scholar] [CrossRef]
- Gegenfurtner, A.; Lehtinen, E.; Säljö, R. Expertise differences in the comprehension of visualizations: A meta-analysis of eye-tracking research in professional domains. Educ. Psychol. Rev. 2011, 23, 523–552. [Google Scholar] [CrossRef]
- Zhang, L.; He, J. Critical factors affecting tacit-knowledge sharing within the integrated project team. J. Manag. Eng. 2016, 32, 04015045. [Google Scholar] [CrossRef]
- Bandura, A. Social cognitive theory: An Agentic Perspective. Annu. Rev. Psychol. 2001, 52, 1–26. [Google Scholar] [PubMed]
- Bandura, A. Human agency in social cognitive theory. Am. Psychol. 1989, 44, 1175. [Google Scholar] [CrossRef] [PubMed]
- Bandura, A. Self-Efficacy: The Exercise Of Control; W H Freeman/Times Books/Henry Holt & Co.: New York, NY, USA, 1997. [Google Scholar]
- Wang, Y.; Shen, C.; Zuo, J.; Rameezdeen, R. Same tune, different songs? Understanding public acceptance of mega construction projects: A comparative case study. Habitat Int. 2021, 118, 102461. [Google Scholar] [CrossRef]
- Cree, T.; Kelloway, E.K. Responses to occupational hazards: Exit and participation. J. Occup. Health Psychol. 1997, 2, 304. [Google Scholar] [CrossRef] [PubMed]
- Kouabenan, D.R. Occupation, driving experience, and risk and accident perception. J. Risk Res. 2002, 5, 49–68. [Google Scholar] [CrossRef]
- Fu, H.; Xia, Z.; Tan, Y.; Guo, X. Influence of cues on the safety hazard recognition of construction workers during safety training: Evidence from an eye-tracking experiment. J. Civ. Eng. Educ. 2024, 150, 04023009. [Google Scholar] [CrossRef]
- Xia, N.; Wang, X.; Griffin, M.A.; Wu, C.; Liu, B. Do we see how they perceive risk? An integrated analysis of risk perception and its effect on workplace safety behavior. Accid. Anal. Prev. 2017, 106, 234–242. [Google Scholar] [CrossRef] [PubMed]
- Becker, J.S.; Paton, D.; Johnston, D.M.; Ronan, K.R.; McClure, J. The role of prior experience in informing and motivating earthquake preparedness. Int. J. Disaster Risk Reduct. 2017, 22, 179–193. [Google Scholar] [CrossRef]
- Tong, R.P.; Zhao, H.; Zhang, N.; Li, H.W.; Wang, X.L.; Yang, H.Q. Modified accident causation model for highway construction accidents (ACM-HC). Eng. Constr. Archit. Manag. 2021, 28, 2592–2609. [Google Scholar] [CrossRef]
- Terpstra, T. Emotions, Trust, and Perceived Risk: Affective and Cognitive Routes to Flood Preparedness Behavior. Risk Anal. 2011, 31, 1658–1675. [Google Scholar] [CrossRef]
- Peng, Y.B.; Zhang, S.; Wu, P. Factors influencing workplace accident costs of building projects. Saf. Sci. 2015, 72, 97–104. [Google Scholar]
- Fang, D.; Zhao, C.; Zhang, M. A Cognitive Model of Construction Workers’ Unsafe Behaviors. J. Constr. Eng. Manag. 2016, 142, 04016039. [Google Scholar] [CrossRef]
- Loosemore, M.; Malouf, N. Safety training and positive safety attitude formation in the Australian construction industry. Saf. Sci. 2019, 113, 233–243. [Google Scholar] [CrossRef]
- Li, Y.L.; Wu, X.; Luo, X.W.; Gao, J.Q.; Yin, W.W. Impact of Safety Attitude on the Safety Behavior of Coal Miners in China. Sustainability 2019, 11, 21. [Google Scholar] [CrossRef]
- Basahel, A.M. Safety leadership, safety attitudes, safety knowledge and motivation toward safety-related behaviors in electrical substation construction projects. Int. J. Environ. Res. Public Health 2021, 18, 4196. [Google Scholar] [CrossRef]
- Deng, Y.L.; Guo, H.L.; Meng, M.M.; Zhang, Y.; Pei, S.S. Exploring the Effects of Safety Climate on Worker’s Safety Behavior in Subway Operation. Sustainability 2020, 12, 23. [Google Scholar] [CrossRef]
- Biggs, H.C.; Biggs, S.E. Interlocked projects in safety competency and safety effectiveness indicators in the construction sector. Saf. Sci. 2013, 52, 37–42. [Google Scholar] [CrossRef]
- Rahman, F.A.; Arifin, K.; Abas, A.; Mahfudz, M.; Cyio, M.B.; Khairil, M.; Ali, M.N.; Lampe, I.; Samad, M.A. Sustainable Safety Management: A Safety Competencies Systematic Literature Review. Sustainability 2022, 14, 17. [Google Scholar] [CrossRef]
- Li, S.Q.; Wu, X.Y.; Wang, X.Z.; Hu, S.H. Relationship between Social Capital, Safety Competency, and Safety Behaviors of Construction Workers. J. Constr. Eng. Manag. 2020, 146, 04020059. [Google Scholar] [CrossRef]
- Aggarwal, A.; Dhurkari, R.K. Association between stress and information security policy non-compliance behavior: A meta-analysis. Comput. Secur. 2023, 124, 11. [Google Scholar] [CrossRef]
- Lyu, S.; Hon, C.K.H.; Chan, A.P.C.; Wong, F.K.W.; Javed, A.A. Relationships among Safety Climate, Safety Behavior, and Safety Outcomes for Ethnic Minority Construction Workers. Int. J. Environ. Res. Public Health 2018, 15, 16. [Google Scholar] [CrossRef]
- Xiang, Q.T.; Ye, G.; Liu, Y.; Goh, Y.M.; Wang, D.; He, T.T. Cognitive mechanism of construction workers’ unsafe behavior: A systematic review. Saf. Sci. 2023, 159, 106037. [Google Scholar] [CrossRef]
- Slovic, P. Perception of risk. Science 1987, 236, 280. [Google Scholar] [CrossRef]
- Donald, I.; Canter, D. Psychological factors and the accident plateau. Health Saf. Inf. Bull. 1993, 215, 5–12. [Google Scholar]
- Siu, O.-L.; Phillips, D.R.; Leung, T.-W. Age differences in safety attitudes and safety performance in Hong Kong construction workers. J. Saf. Res. 2003, 34, 199–205. [Google Scholar] [CrossRef]
- Vinodkumar, M.N.; Bhasi, M. Safety management practices and safety behaviour: Assessing the mediating role of safety knowledge and motivation. Accid. Anal. Prev. 2010, 42, 2082–2093. [Google Scholar] [CrossRef]
- Gyekye, S.A.; Salminen, S. Are “good soldiers” safety conscious? an examination of the relationship between organizational citizenship behaviors and perception of workplace safety. Soc. Behav. Personal. Int. J. 2005, 33, 805–820. [Google Scholar] [CrossRef]
- Ali, F.; Rasoolimanesh, S.M.; Sarstedt, M.; Ringle, C.M.; Ryu, K. An assessment of the use of partial least squares structural equation modeling (PLS-SEM) in hospitality research. Int. J. Contemp. Hosp. Manag. 2018, 30, 514–538. [Google Scholar] [CrossRef]
- Fogarty, G.J.; Shaw, A. Safety climate and the theory of planned behavior: Towards the prediction of unsafe behavior. Accid. Anal. Prev. 2010, 42, 1455–1459. [Google Scholar] [CrossRef]
- Yule, S.; Flin, R.; Murdy, A. The role of management and safety climate in preventing risk-taking at work. Int. J. Risk Assess. Manag. 2007, 7, 137–151. [Google Scholar] [CrossRef]
- Kline, R. Principles and Practice of Structural Equation Modeling, 4th ed.; Guilford Press: New York, NY, USA, 2016. [Google Scholar]
- Hu, L.T.; Bentler, P.M. Fit indices in covariance structure modeling: Sensitivity to underparameterized model misspecification. Psychol. Methods 1998, 3, 424–453. [Google Scholar] [CrossRef]
- Ab Hamid, M.R.; Sami, W.; Mohmad Sidek, M.H. Discriminant Validity Assessment: Use of Fornell & Larcker criterion versus HTMT Criterion. J. Phys. Conf. Ser. 2017, 890, 012163. [Google Scholar]
- Bagozzi, R.P. Evaluating Structural Equation Models with Unobservable Variables and Measurement Error: A Comment. J. Mark. Res. 1981, 18, 375–381. [Google Scholar] [CrossRef]
- Cronbach, L. Coefficient alpha and the internal structure of tests. Psychometrika 1951, 16, 297–334. [Google Scholar] [CrossRef]
- Hayes, A.F. Introduction to Mediation, Moderation, and Conditional Process Analysis: A Regression-Based Approach.; Guilford Press: New York, NY, USA, 2013. [Google Scholar]
- Siegrist, M.; Arvai, J. Risk Perception: Reflections on 40 Years of Research. Risk Anal. 2020, 40, 2191–2206. [Google Scholar] [CrossRef] [PubMed]
- McDonald, R.P.; Ho, M.-H.R. Principles and practice in reporting structural equation analyses. Psychol. Methods 2002, 7, 64–82. [Google Scholar] [CrossRef]
- Fu, H.; Xia, Z.; Tan, Y.; Peng, Y.; Fan, C.; Guo, X. Fear Arousal Drives the Renewal of Active Avoidance of Hazards in Construction Sites: Evidence from an Animal Behavior Experiment in Mice. J. Constr. Eng. Manag. 2024, 150, 04024146. [Google Scholar] [CrossRef]
- He, C.Q.; Hu, Z.; Shen, Y.Z.; Wu, C.L. Effects of Demographic Characteristics on Safety Climate and Construction Worker Safety Behavior. Sustainability 2023, 15, 20. [Google Scholar] [CrossRef]
- Lindberg, A.K.; Hansson, S.O.; Rollenhagen, C. Learning from accidents—What more do we need to know? Saf. Sci. 2010, 48, 714–721. [Google Scholar] [CrossRef]
- Rispler, C.; Luria, G. Employee experience and perceptions of an organizational road-safety intervention—A mixed-methods study. Saf. Sci. 2021, 134, 105089. [Google Scholar] [CrossRef]
- Han, J.H.; Roh, Y.S. Teamwork, psychological safety, and patient safety competency among emergency nurses. Int. Emerg. Nurs. 2020, 51, 5. [Google Scholar] [CrossRef]
- Duan, P.S.; Zhou, J.L. Cascading vulnerability analysis of unsafe behaviors of construction workers from the perspective of network modeling. Eng. Constr. Archit. Manag. 2023, 30, 1037–1060. [Google Scholar] [CrossRef]
- Vignoli, M.; Nielsen, K.; Guglielmi, D.; Mariani, M.G.; Patras, L.; Peirò, J.M. Design of a safety training package for migrant workers in the construction industry. Saf. Sci. 2021, 136, 105124. [Google Scholar] [CrossRef]
- Xu, J.; Cheung, C.; Manu, P.; Ejohwomu, O. Safety leading indicators in construction: A systematic review. Saf. Sci. 2021, 139, 105250. [Google Scholar] [CrossRef]
- Yang, J.J.; Ye, G.; Xiang, Q.T.; Kim, M.; Liu, Q.J.; Yue, H.Z. Insights into the mechanism of construction workers’ unsafe behaviors from an individual perspective. Saf. Sci. 2021, 133, 105004. [Google Scholar] [CrossRef]
- Zhang, Z.T.; Guo, H.L.; Gao, P.Z.; Wang, Y.; Fang, Y.H. Impact of owners? safety management behavior on construction workers? unsafe behavior. Saf. Sci. 2023, 158, 105944. [Google Scholar] [CrossRef]
- Li, H.; Lu, M.J.; Hsu, S.C.; Gray, M.; Huang, T. Proactive behavior-based safety management for construction safety improvement. Saf. Sci. 2015, 75, 107–117. [Google Scholar] [CrossRef]

| Constructs | Items | Contents | Reference |
|---|---|---|---|
| Accident experience (AE) | AE1 | The number of minor bumps I’ve experienced in the last six months. | [12,14] |
| AE2 | The number of times I have been hospitalized in my past careers. | ||
| AE3 | In the past six months, I have witnessed the number of safety accidents with people around me. | ||
| AE4 | I know how many times the news has reported security incidents in the past six months. | ||
| AE5 | After learning about all safety incidents, I reflect on the reasons why safety accidents occur. | ||
| Safety attitude (SA) | SA1 | I know the importance of safety in the construction industry. | [30,41,42] |
| SA2 | When I detect a safety hazard, I stop working first. | ||
| SA3 | Safety issues that I always pay attention to in my production operations. | ||
| SA4 | I work with special care when I’m not sure if it’s safe. | ||
| Safety competence (SC) | SC1 | I am familiar with and understand how to use security equipment and standard construction practices. | [36,43] |
| SC2 | I know how to get the job done in a safe way. | ||
| SC3 | I know what to do and to whom to report a potential hazard if I find a potential hazard in my workplace. | ||
| SC4 | I am aware of the risks inherent in my work and understand the necessary safety measures that should be taken. | ||
| SC5 | I am aware of my rights and responsibilities in occupational safety. | ||
| Risk perception (RP) | RP1 | I often worry about cuts, stabbs, bumps, etc. while working. | [44,45,46] |
| RP2 | I often worry about safety accidents such as electric shock, falls, object blows, mechanical injuries, etc. | ||
| RP3 | I often worry that heat, dust, or toxic gases at work will cause harm to my body. | ||
| RP4 | I think my job is a very dangerous job. | ||
| RP5 | I can identify the sources of hazards and hidden hazards in my workplace. | ||
| Construction workers’ unsafe behaviors (CWUBs) | CWUBs1 | Do not wear necessary safety equipment. | [43,47] |
| CWUBs2 | Failure to strictly comply with safe operating procedures and regulations. | ||
| CWUBs3 | Safety practices are ignored due to rush work. | ||
| CWUBs4 | Will not take the initiative to report to the leadership the potential safety hazards on the construction site. | ||
| CWUBs5 | Do not want to participate in safety education training and safety work meetings. |
| Items | Details | Frequency | Percent |
|---|---|---|---|
| Gender | Male | 280 | 83.8% |
| Female | 54 | 16.2% | |
| Age | 18–25 | 13 | 3.9% |
| 26–33 | 51 | 15.3% | |
| 34–44 | 86 | 25.7% | |
| 45–55 | 137 | 41% | |
| ≥56 | 47 | 14.1% | |
| Education | Primary school and below | 45 | 13.5% |
| Junior middle school | 161 | 48.2% | |
| Senior middle school | 93 | 27.8% | |
| College, bachelor degree and above | 35 | 10.5% | |
| Number of households | 1 | 2 | 0.6% |
| 2 | 11 | 3.3% | |
| 3 | 66 | 19.8% | |
| 4 | 110 | 32.9% | |
| 5 | 76 | 22.8% | |
| ≥6 | 69 | 20.7% | |
| Work experience | ≤5 years | 44 | 13.2% |
| 5–10 years | 75 | 22.5% | |
| 11–15 years | 88 | 26.3% | |
| 16–20 years | 54 | 16.2% | |
| ≥20 years | 73 | 21.9% | |
| Accident experience (AE) | 0 | 28 | 8.4% |
| 1–3 times | 105 | 31.4% | |
| 4–6 times | 98 | 29.3% | |
| 7–12 times | 73 | 21.9% | |
| ≥13 times | 30 | 9.0% |
| Model Fit Indices | Recommended Values | Values | References |
|---|---|---|---|
| χ2/df | <5 | 1.646 | [54] |
| RMSEA | <0.08 | 0.044 | |
| CFI | >0.9 | 0.973 | |
| TLI | >0.9 | 0.969 |
| Construct | Item | Mean | SD | Factor Loading | AVE | CR | Cronbach’s Alpha |
|---|---|---|---|---|---|---|---|
| SC | SC1 | 3.40 | 1.336 | 0.797 | 0.6673 | 0.9230 | 0.897 |
| SC2 | 3.38 | 1.265 | 0.845 | ||||
| SC3 | 3.44 | 1.185 | 0.836 | ||||
| SC4 | 3.47 | 1.17 | 0.733 | ||||
| SC5 | 3.52 | 1.278 | 0.781 | ||||
| SA | SA1 | 3.31 | 1.064 | 0.749 | 0.6345 | 0.8959 | 0.872 |
| SA2 | 3.16 | 1.144 | 0.900 | ||||
| SA3 | 3.23 | 1.094 | 0.840 | ||||
| SA4 | 3.24 | 0.919 | 0.697 | ||||
| AE | AE1 | 3.28 | 1.068 | 0.937 | 0.7265 | 0.9131 | 0.925 |
| AE2 | 3.16 | 1.176 | 0.895 | ||||
| AE5 | 3.25 | 1.259 | 0.861 | ||||
| AE3 | 3.51 | 0.884 | 0.816 | 0.7471 | 0.8543 | 0.753 | |
| AE4 | 3.12 | 1.162 | 0.785 | ||||
| RP | RP1 | 3.12 | 1.107 | 0.761 | 0.6982 | 0.9017 | 0.898 |
| RP2 | 3.16 | 1.132 | 0.895 | ||||
| RP3 | 3.13 | 1.075 | 0.922 | ||||
| RP4 | 3.36 | 1.095 | 0.750 | ||||
| RP5 | 3.30 | 0.973 | 0.673 | ||||
| CWUBs | CWUBs1 | 2.99 | 1.14 | 0.848 | 0.6746 | 0.9111 | 0.938 |
| CWUBs2 | 2.96 | 1.196 | 0.896 | ||||
| CWUBs3 | 3.01 | 1.225 | 0.905 | ||||
| CWUBs4 | 2.86 | 1.16 | 0.761 | ||||
| CWUBs5 | 2.96 | 1.219 | 0.923 |
| DP | IP | SA | SC | RP | CWUBs | |
|---|---|---|---|---|---|---|
| DP | 0.7265 | |||||
| IP | 0.27 | 0.7471 | ||||
| SA | 0.498 | 0.326 | 0.6345 | |||
| SC | 0.272 | 0.284 | 0.312 | 0.6673 | ||
| RP | 0.501 | 0.392 | 0.437 | 0.286 | 0.6982 | |
| CWUBs | −0.378 | −0.439 | −0.538 | −0.352 | −0.355 | 0.6746 |
| Model Fit Indices | Recommended Values | Values | References |
|---|---|---|---|
| χ2/df | <5 | 1.546 | [48,55] |
| RMSEA | <0.08 | 0.040 | |
| CFI | >0.9 | 0.978 | |
| TLI | >0.9 | 0.975 |
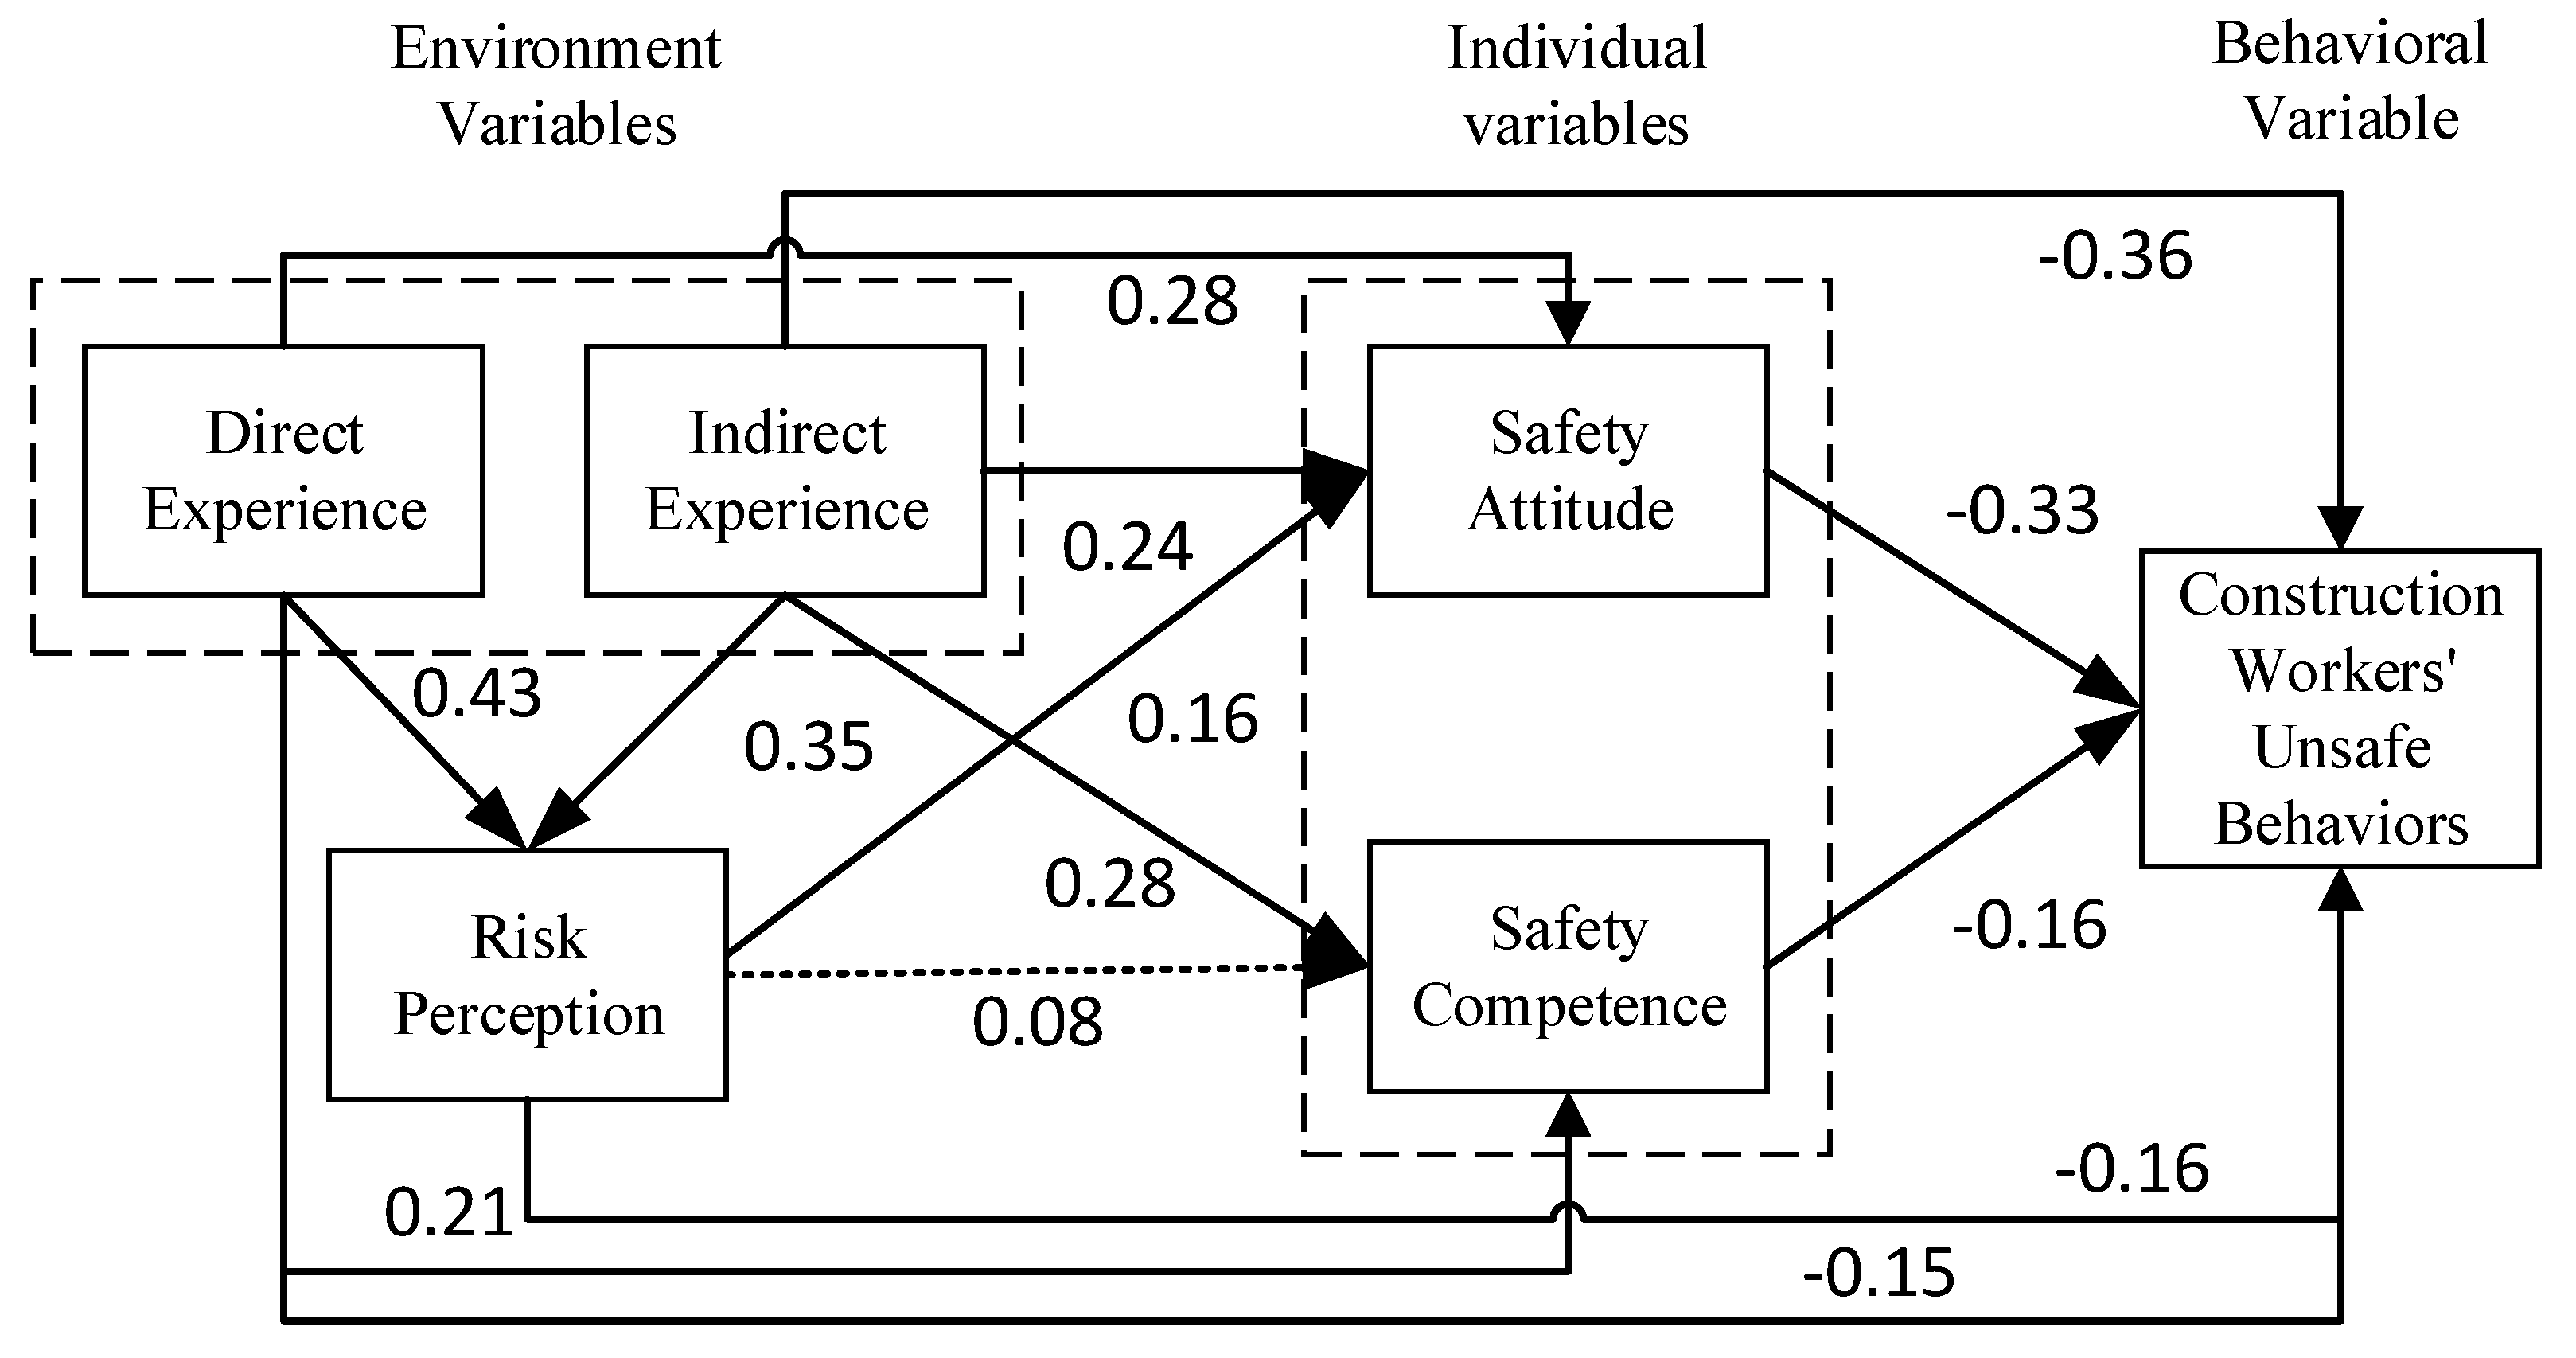
| Hypothesis | Standardized Path Coefficient | p-Value | Result |
|---|---|---|---|
| H1: DE has a negative effect on CWUBs. | −0.154 | * | Supported |
| H2: IE has a negative effect on CWUBs. | −0.364 | *** | Supported |
| H3: DE has a positive effect on RP. | 0.431 | *** | Supported |
| H4: IE has a positive effect on RP. | 0.349 | *** | Supported |
| H5: DE has a positive effect on SA. | 0.283 | *** | Supported |
| H6: DE has a positive effect on SC. | 0.207 | ** | Supported |
| H7: IE has a positive effect on SA. | 0.239 | ** | Supported |
| H8: IE has a positive effect on SC. | 0.279 | ** | Supported |
| H9: SA has a negative effect on CWUBs. | −0.335 | *** | Supported |
| H10: SC has a negative effect on CWUBs. | −0.157 | ** | Supported |
| H11: RP has a positive effect on SA. | 0.162 | ** | Supported |
| H12: RP has a positive effect on SC | 0.075 | 0.276 | Not supported |
| H13: RP has a negative effect on CWUBs. | −0.159 | * | Supported |
| Coeff | Effectiveness Degree | |
|---|---|---|
| Total effects | −0.462 | 100% |
| Direct effects | −0.298 | 64.5% |
| Total indirect effects | −0.164 | 35.5% |
| Path1. DE → SA → CWUBs | −0.041 | 8.9% |
| Path2. DE → SC → CWUBs | −0.018 | 3.9% |
| Path3. DE → RP → CWUBs | −0.039 | 8.4% |
| Path4. DE → RP → SA → CWUBs | −0.066 | 14.3% |
| Coeff | Effectiveness Degree | |
|---|---|---|
| Total effects | −0.903 | 100% |
| Direct effects | −0.620 | 66.7% |
| Total indirect effects | −0.283 | 33.3% |
| Path1. IE → SA → CWUBs | −0.070 | 8.3% |
| Path2. IE → SC → CWUBs | −0.037 | 4.4% |
| Path3. IE → RP → CWUBs | −0.070 | 8.2% |
| Path4. IE → RP → SA → CWUBs | −0.106 | 12.4% |
Disclaimer/Publisher’s Note: The statements, opinions and data contained in all publications are solely those of the individual author(s) and contributor(s) and not of MDPI and/or the editor(s). MDPI and/or the editor(s) disclaim responsibility for any injury to people or property resulting from any ideas, methods, instructions or products referred to in the content. |
© 2024 by the authors. Licensee MDPI, Basel, Switzerland. This article is an open access article distributed under the terms and conditions of the Creative Commons Attribution (CC BY) license (https://creativecommons.org/licenses/by/4.0/).
Share and Cite
Yang, S.; Liu, L.; Wang, T.; Guo, Y.; Qian, Y.; Chen, H. The Impact of Accident Experience on Unsafe Behaviors of Construction Workers Within Social Cognitive Theory. Buildings 2025, 15, 59. https://doi.org/10.3390/buildings15010059
Yang S, Liu L, Wang T, Guo Y, Qian Y, Chen H. The Impact of Accident Experience on Unsafe Behaviors of Construction Workers Within Social Cognitive Theory. Buildings. 2025; 15(1):59. https://doi.org/10.3390/buildings15010059
Chicago/Turabian StyleYang, Su, Lingyu Liu, Ting Wang, Yongqi Guo, Yingmiao Qian, and Huihua Chen. 2025. "The Impact of Accident Experience on Unsafe Behaviors of Construction Workers Within Social Cognitive Theory" Buildings 15, no. 1: 59. https://doi.org/10.3390/buildings15010059
APA StyleYang, S., Liu, L., Wang, T., Guo, Y., Qian, Y., & Chen, H. (2025). The Impact of Accident Experience on Unsafe Behaviors of Construction Workers Within Social Cognitive Theory. Buildings, 15(1), 59. https://doi.org/10.3390/buildings15010059