Article

Examining the Impacts of House Prices on Self-Rated Health of Older Adults: The Mediating Role of Subjective Well-Being

by
Min Wang
1,†,
Zixuan Tan
2,†,
Ruying Chen
2 and
Xuefang Zhuang
2,*
1
Architectural and Planning Design Institute of Guangdong University of Technology Co., Ltd., Guangzhou 510062, China
2
School of Architecture and Urban Planning, Guangdong University of Technology, Guangzhou 510062, China
*
Author to whom correspondence should be addressed.
These authors contributed equally to this work.
Buildings 2025, 15(1), 53; https://doi.org/10.3390/buildings15010053
Submission received: 9 October 2024 / Revised: 18 December 2024 / Accepted: 25 December 2024 / Published: 27 December 2024
(This article belongs to the Special Issue Research on Health, Wellbeing and Urban Design)

Abstract

:
As the global aging trend increases, older adults are placing greater emphasis on their health. Evidence indicates that there is a complex association between house prices and older adults’ health, with their subjective well-being potentially acting as a mediator in this connection. A mediation model, utilizing data from China’s 2018 Labor Dynamics Survey, was employed to examine the impact pathway of house prices, subjective well-being, and self-rated health, while investigating the differences between young-old and old-old groups. The major findings are as follows: (1) House prices negatively affected self-rated health among the older adults. (2) The subjective well-being of older adults mediated the pathway through which house prices affected their self-rated health. (3) For old-old adults, higher house prices were more strongly linked to an increased likelihood of reporting good, very good, or excellent health. Subjective well-being was more significantly associated with reporting better health among the young-old group. Compared with the young-old population, the impact of house prices on self-rated health was stronger among the old-old, and the degree increased with increasing age. Consequently, to improve older adults’ well-being and self-rated health, effective healthy-aging policies should not only consider the influence of the real estate market, but also balance the allocation of elderly service facilities, promote affordable housing, and implement a combination of medical and nursing care from the perspective of urban planning.

1. Introduction

The trend in global aging is intensifying. In 2022, the population aged 65 years and above reached 780 million, accounting for approximately 9.8% of the total global population. Projections indicate that the aging population will increase to 14% by 2038 and 20% by 2070, transforming the world into a deeply aged and, eventually, a super-aged society. The acceleration of population aging is more salient in countries or regions with large population bases, particularly China. Consequently, health issues in the older adults have progressively become a critical concern. The old-old population faces increased physical and mental health risks due to declining physical function and shrinking material and social spaces [1,2,3]. At the same time, with the development of medical technology and the improvement in living quality, an increasing number of older adults are focusing more on their health. In this context, housing, one of the most fundamental material requirements for the survival of residents, has major implications for residents’ health and well-being, and particularly for older adults [4].
Previous studies have largely concentrated on the physical–spatial attributes of housing in the use process (e.g., housing quality, space, and community environment) to examine the complex interplay between housing and health [5,6,7,8,9,10]. However, the wealth and affordability of housing, as marked by major financial assets [11], may impact the health of the occupants, particularly older adults [12]. House prices affect both the acquisition and usage of housing, making them important factors in housing wealth and affordability. Despite this, the connection between house prices and older adults’ health and well-being has been the subject of relatively limited research. Moreover, while numerous studies have focused on Australia, the USA, South Korea, and other developed countries, few have addressed the complex paths between house prices, self-rated health, and subjective well-being in emerging economies, such as China. This study uses China as a case study to investigate whether house prices are associated with older adults’ self-rated health, considering a potential mediating role of subjective well-being, employing data from the China Labor Dynamics Survey (CLDS) 2018 along with a mediation model. This study aims to fill the gaps in the literature regarding the association of house prices with older adults’ self-rated health and their subjective well-being in emerging economies. Exploring the relationship between house prices and older adults’ self-rated health can provide novel scientific insights and support the construction of aging-friendly cities and the development of healthy aging. The results of this study are intended to contribute to policies that promote aging-friendly cities.

2. Literature Review

2.1. Self-Rated Health of Older Adults

Health is generally evaluated from two perspectives: objective (e.g., morbidity, mortality, and functional health) and subjective (e.g., self-rated health (SRH) and health satisfaction) [13]. Objective health data are primarily obtained through objective observations and assessments, such as healthcare facility data and physical examinations. In contrast, SRH is mainly derived from individuals’ subjective perceptions of their own health status [14,15] and is widely recognized as a highly reliable and valid indicator to predict population health status [16,17]. SRH encompasses various dimensions related to health and well-being, including physical and mental health, as well as previous health experiences and future health expectations [18,19]. Previous studies demonstrated that the health issues of older adults tend to increase with age [20]. The health status of older adults was found to be relatively fragile, and they were often more susceptible to health issues, physical function decline, and physical mobility disorders [21]. Concurrently, 39.85% of older urban adults in China also had psychological health issues such as negative perceptions of aging, anxiety, and depression [22]. Older adults’ health issues have become a research priority. Epidemiological data suggested that self-rated health can be used to assess and predict older adults’ psychological, physical, and functional health status [23]. Research indicates that SRH is more strongly correlated with actual health outcomes than objective health measures [24,25]. Population-based longitudinal studies have indicated that compared to psychological health indicators, SRH is a reliable indicator for predicting mortality and overall health status among older adults [24,26]. Moreover, given the diverse criteria and metrics, this study evaluated the self-rated health of elderly respondents using subjective health assessment data. In particular, “How would you rate your overall health?” is a primary question used to measure self-rated health in health research [27].
Numerous studies indicated that the factors influencing self-rated health among older adults include housing, environment, income, education, and social relationships [28,29]. Additionally, housing, as an asset, significantly impacted older adults’ physical and mental health. To date, much of the research on housing and SRH in older adults has focused on the fields of the social and built environment. On the one hand, a healthy social–ecological model reflecting health is shaped by the social contexts in which the individual lived [30,31]. For example, Smith et al. [32] found that self-rated health was influenced by socioeconomic status, because with similar income levels, older adults living in low-income communities reported poorer self-rated health than those in gentrified communities, and this also extended to differences in their sense of well-being. On the other hand, housing availability also impacts health, including interior space and experience in externally built environments. Among these, issues relating to interior spaces, such as housing type, interior environments, and housing security, significantly affected health in the environmental conditions of homes [33,34]. Löfqvist et al. [35] demonstrated that insufficient lighting, unsafe furniture, and floors may lead to health concerns. Klein et al. [36] argued that poor housing quality negatively impacts health. The external built environment comprises infrastructure support [37], accessibility, land use [38], and green spaces [39]. Research has shown that green and blue spaces around housing built environments can reduce stress and encourage physical activity, thereby promoting health [40]. Huang et al. [41] reported that elderly homeowners living adjacent to freshwater blue spaces had better health conditions than older tenants. Stronegger et al. [42] suggested that a high-quality living environment was linked with better self-rated health and increased leisure time sports activity. However, the impact of house prices, as one of the characteristics of housing, on older adults’ self-rated health and subjective well-being, still requires further research.

2.2. Relation Between House Prices and Self-Rated Health of Older Adults

Research has demonstrated that house prices, as a major portion of older adults’ housing wealth, impacted their physical and mental health, which in turn affected their self-rated health [43]. Most previous research on the relationship of house prices to self-rated health has concentrated on two aspects, housing availability and housing wealth, highlighting the impact of housing affordability and wealth attributes on the health of residents.
On the one hand, house prices, as a major aspect of housing affordability, are a critical factor in determining the accessibility of housing, that is, housing affordability will affect homeownership and thus self-rated health. Rohe et al. [44] have found that homeownership can create more opportunities to promote health further. Housing affordability can accommodate the demands of older adults for a stable home, which is beneficial for their health and social integration [45]. House prices are associated with a critical effect on housing acquisition, particularly for renters and prospective home buyers. Rising house prices might result in financial burdens and life anxiety, and may have a greater impact on older adults owing to their vulnerable labor and economic income attributes [46,47]. Conversely, increases in house prices can endow owners with greater capital accumulation and lower life stress, resulting in a diminished risk of acquiring a range of non-chronic diseases [48,49]. For instance, Kadir et al. [47] discovered that rising house prices in Australia positively affect the health of homeowners, but harmed renters. The “wealth effect” and the “cost effect” can respectively explain the differences in health impacts that housing prices have on different groups. The “wealth effect” suggests that rising prices of houses, as an asset of elderly homeowners, increase their total household assets, which led to an increase in budget expenditure for health management, thereby improving their health status and promoting self-rated health [49]. However, the “cost effect” reflects the cost of housing as a future basic housing purchase cost for renters or prospective homebuyers. The rise in house prices increases housing and rental costs, and also leads to older adults investing more savings in housing cost accumulation and reducing expenditures on health management, thus increasing the economic pressure and the risk of physical and mental health problems for older adults [50].
On the other hand, as a precautionary saving asset for older adults, the change in house prices has an impact on older adults’ self-rated health [51]. The life cycle theory showed that people will have different characteristics of housing consumption at different life stages. For older adults, housing is a savings asset to support their retirement life [52]; thus, they would choose to obtain housing when they were young. In old age, housing is usually rented, sold, or distributed to the younger generation as a current asset [53]. In other words, for older adults, the appreciation of house prices can enable older adults to have more accumulation of housing wealth, while the rising “wealth effect” will have a positive impact on older adults’ self-rated health [54]. For example, in the study of the influence mechanism between housing and self-rated health, Ariadna Jou et al. [55] found that when housing wealth rises by one standard deviation, the likelihood of SRH improvement increases by 1 percentage point, and the mortality rate also decreases. Baker et al. [56] found that increasing house prices may enhance health levels among persons with higher housing wealth, whereas those with one or fewer owner-occupied houses may experience a decline in health. Meanwhile, research suggests that housing wealth represents a critical asset to support older adults in retirement [57], and increases in house prices may improve the health condition of older people who are homeowners [51].
Additionally, from the perspective of regional development, higher house prices reflect better regional economic activity and public service facilities such as schools and hospitals, which can improve residents’ quality of life and promote convenience, promoting their self-rated health [49]. In addition, studies have shown differences in how housing characteristics, such as house prices, influence the self-rated health of different age groups, with the impact being more pronounced among middle-aged and older people [58]. Young people cannot buy housing due to insufficient wealth savings, so their health is not significantly affected by house prices, while middle-aged and older people have the demand for “housing for pension” and for preparing housing for the next generation, and the impact of house prices is thus more significant for them [59]. However, the existing studies have not examined the influencing factors of self-rated health of older adults at different ages. Therefore, this paper divides older adults into two subgroups (young-old and old-old) to explore the differences in how house prices affect the self-rated health of these two groups.

2.3. Mediating Role of Subjective Well-Being (SWB)

However, scholars have debated the mechanisms underlying the relationship between house prices and self-rated health. As suggested by Solar et al. [60], the complexity of the causal pathways from housing to health is evident. In other words, the relationship between the two factors may not entail direct causality; instead, there are some latent variables regarding the link between housing and health that regulate or mediate the relationship. Among these, as an indicator of an affective and cognitive evaluation of life as a whole [61], subjective well-being is one of the most important indicators of resident welfare. Research indicated that subjective well-being was relatively independent of residents’ self-rated health [62,63].
Most studies have examined the two-way link between well-being and health. Relevant research indicated that subjective well-being can measure and predict older adults’ self-rated health and mental health [64]. For example, Diener et al. [65] and Chiang et al. [66] investigated well-being as an effective predictor of self-rated health. Those with persistently high well-being had a greater self-rated health level than those with persistently low well-being [67]. Similarly, lower baseline levels of well-being reflect poorer health conditions in terms of chronic conditions and physical symptoms [68]. Meanwhile, some studies have taken samples from ordinary people and patients with chronic diseases, observing that health conditions are significantly correlated with self-rated health [69]. However, some studies indicated that good health contributes positively to older adults’ well-being. For example, Lee et al. [63] found that the estimated coefficient of the effect of self-rated health on older adults’ subjective well-being was 1.502, with a significance of less than 0.01, indicating that their self-rated health made a significant contribution to their subjective well-being. When respondents’ self-rated health was worse than that of others, their subjective well-being was significantly reduced. That is, the comparison of self-assessed health was significantly correlated with an individual’s subjective well-being [62].
Furthermore, house prices, as marked by social capital, affect the subjective well-being of individuals associated with houses. Social status seeking theory reflects that rising house prices can expand the income gap among older adults, and meet their demand for pursuing a higher social status. To a certain extent, this can promote the subjective well-being of the elderly. However, under the motivation of social status seeking, some older adults need to make up for the wealth gap caused by the appreciation of house prices by accumulating more wealth and reducing daily expenses, which leads to older adults paying less attention to their health status and causes psychological pressure, which harms their health [70]. Theurer et al. [71] found that social capital, predicting life satisfaction and well-being in the Canadian elderly population, was positively related to well-being. Specifically, an increase in house values might positively improve residents’ subjective well-being because of wealth attributes [72] and because homeownership symbolizes a higher social status [73].
Research has demonstrated that, as an embodiment of social status and the value of social norms, home ownership influences subjective well-being [74,75], and house price appreciation and housing inequality affect the happiness of older adults [76]. According to the housing filtering theory, in the housing market, after high-income people build new houses, the price of existing old houses drops, so that low-income people can own houses. This can alleviate the pressure of low-income elderly people on the housing burden to some extent. However, with the passive filtering of low-income groups, the neighborhood relationship of older adults who have not moved is broken, and their social support also changes. The change in social class and neighborhood quality will lead to the decline in their subjective well-being. This can also have an impact on the health of homebuyers [77]. For example, Theurer et al. [78] found that older adults were more dependent on social network relationships to meet their emotional needs, while the weakening of social network relationships led to a decline in older adults’ self-worth, which in turn led to lower well-being [79]. However, the passive filtering phenomenon in housing filtering caused by the decline in house prices led to a decrease in the social support of older adults, and thus affected their happiness.
Therefore, this study addresses the following two questions: (1) In what ways do house prices affect older adults’ self-rated health in China? (2) Does subjective well-being mediate the relationship between house prices and self-rated health? We propose a framework for housing prices, self-rated health, and subjective well-being, as shown in Figure 1. The basic logic is that house prices affect older adults’ self-rated health, and might also influence subjective well-being, in turn influencing their self-rated health. This paper aims to test the following hypotheses:
H1. 
House prices have significant negative effects on the self-rated health of older adults.
H2. 
The relation between house prices and older adults’ self-rated health is mediated by subjective well-being.
H3. 
Compared to young-old, the mediation effect of subjective well-being between house prices and self-rated health is more significant for old-old.

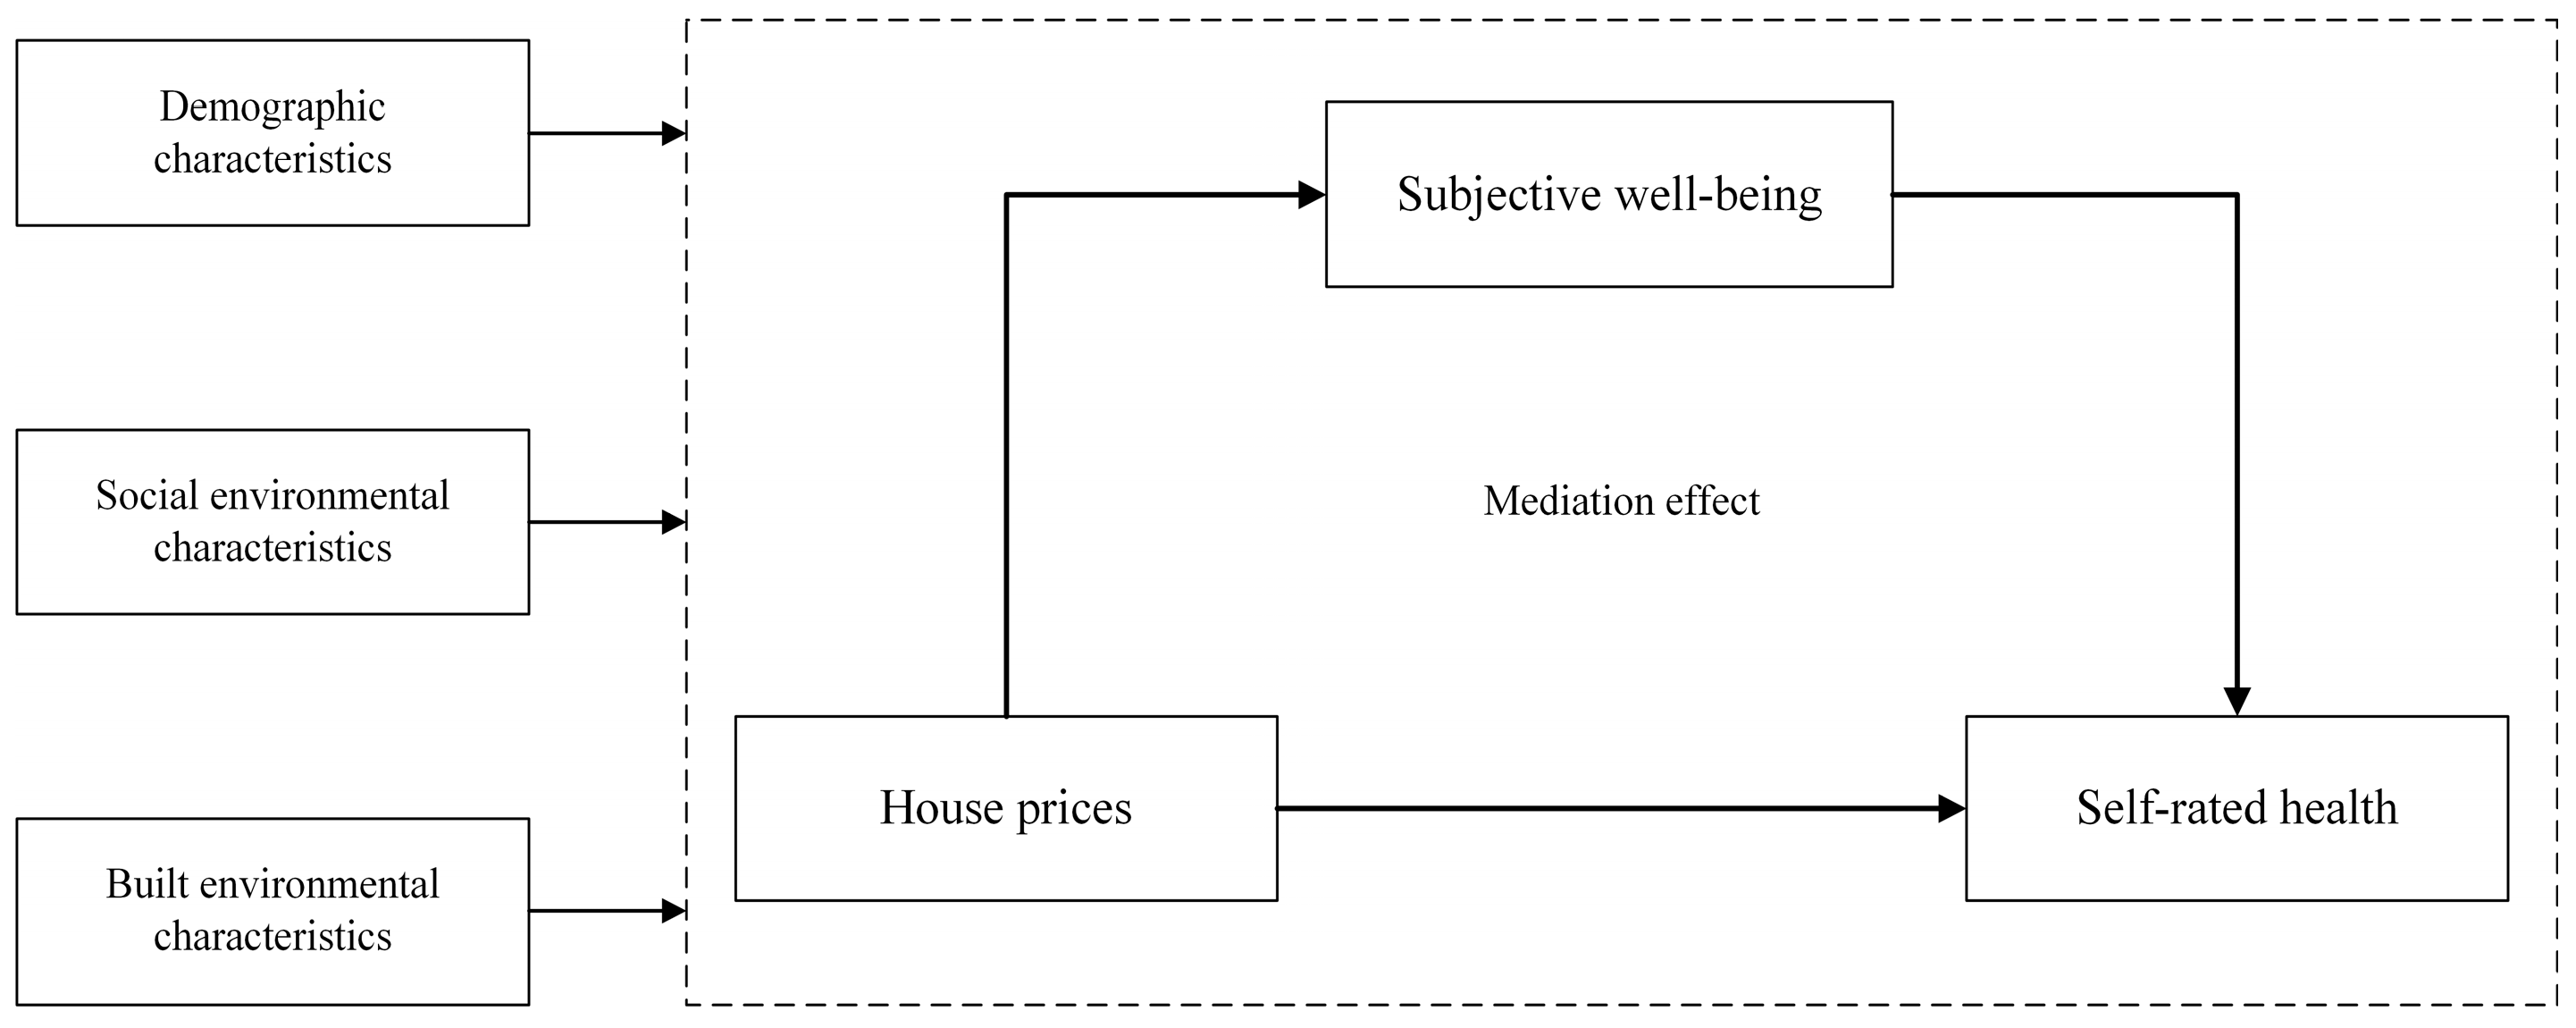
3. Materials and Methods

3.1. Study Area and Data Sources

This study used data from the CLDS 2018, an investigation carried out by the Social Science Survey Center of Sun Yat-sen University. It is an interdisciplinary large-scale follow-up survey focusing on the current situation and transition of China’s labor force, covering education, work, health, basic organizations, and many other research topics. It uses a multistage, multilevel sample whose size is in direct proportion to the size of the labor force. The data used in this research are from the 2018 CLDS, which provides comprehensive coverage of the labor force and older adult populations in 29 provinces in China, as depicted in Figure 2, providing a solid foundation for studying the impact of house prices on self-rated health and the mediating role of subjective well-being.
Table 1 indicates the social demographic characteristics of the survey respondents. Those aged 60–74 years comprised the majority of respondents, at 73.21%, while the group aged over 74 years represented the lowest proportion of respondents (3.58%). The male to female ratio was 40.7:59.3 and non-single people accounted for 95.9% of respondents. In terms of political status, non-Party members accounted for 93.2% of respondents. Most people received an income of less than 18,000 yuan (65.8%), with 6.3% of respondents reporting an income exceeding 60,000 yuan. Regarding homeownership, the homeowner accounted for the majority of respondents (97.8%). Moreover, this study used basic geographic data to explore the association between the urban environment, subjective well-being, self-rated health, and house prices. Specifically, data on the urbanization rate, tertiary hospitals, and population density were all taken from the China Statistical Yearbook 2018 [80]. Furthermore, the information about POIs was derived from OpenStreetMap (openstreetmap.org (accessed on 1 October 2018)) [81].

3.2. Variable Selection and Measurement

3.2.1. Dependent Variable: Self-Rated Health

Following previous studies [82], SRH was assessed within physical health using the reverse-scored question: “How do you assess your overall health status compared to that of your peers?” Responses were categorized as 1 = very healthy, 2 = healthy, 3 = fair, 4 = unhealthy, 5 = very unhealthy. These self-assessments played an important role in understanding how house prices and subjective well-being interact to affect self-rated health.

3.2.2. Independent Variable: House Prices

House prices in this study were calculated using the average house prices of the city. The data were collected from China Real Estate Information (http://www.crei.com.cn/ (accessed on 22 January 2018)), which was developed by State Information Center and possesses over 14,000,000 pieces of data. The macroeconomic database contains the earliest annual and monthly macroeconomic and real estate-related data of the whole country, various regions, and 297 prefecture-level cities since 1952. Recent studies [72,76] found that high house prices have a significant negative impact on residents’ subjective well-being.

3.2.3. Mediator: Subjective Well-Being

The mediator is residents’ SWB. SWB is based on personal reaction to the question, are you happy in your life overall? Answer options are: Extremely unhappy, Unhappy, Neutral, Happy, Extremely happy. A 5-point Likert scale was used, where higher scores indicated a greater level of SWB. For instance, 1 point demonstrates Extremely unhappy and 5 points demonstrates Extremely happy.

3.2.4. Covariates

Variables that previous studies have shown to be important predictors of health outcomes, such as demographic characteristics, social environment characteristics, and built environment characteristics, were selected. These variables contributed to isolating the effects of house prices on self-rated health and subjective well-being. The regression results were adjusted for the following covariates: (1) Demographic characteristics. Eight indicators were selected from the CLDS 2018 questionnaire to form a social demographic characteristics scale, including one subscale of age, gender, marital status, political status, hukou status, income, freedom of life choice, homeownership, and mental health status. To measure the mental health status, we used the CES-D20 Self-Rating Depression Scale (Cronbach’s alpha = 0.85) (Table 2). After yielding a total range of 20 to 80, higher scores indicated that the respondents experienced depressive symptoms more frequently in the past week. (2) Social environment characteristics. Following previous studies on the social environment, we developed a five-item scale to measure neighborhood mutual support, community safety, community satisfaction, and social trust (Cronbach’s alpha = 0.85), as shown in Table 2. (3) Built environment characteristics. Indicators included density of population, number of tertiary hospitals, points of interest per 10,000 people (POIs), and urbanization rate, as depicted in Table 3. For the sake of the consistency of data, the urbanization rate in 2018 was chosen. The population census data and urban land-use area were used for the density of population.

3.2.5. Model Specification

The self-rated health of older adults is influenced by sociodemographic characteristics and house prices, built environment, and social environment dimensions in this study. A multilevel regression model was employed in this study to examine mechanisms linking house prices and the self-rated health of older adults. A null model of self-rated health, using the dependent variable, was employed to calculate the intraclass correlation (ICC) [83]. The ICC model was specified as follows:
I C C = σ b 2 σ w 2 + σ b 2
where σ b 2 denotes the cities’ variance, and σ w 2 denotes the individual variance within cities. By calculating the ICC values of the entire sample, ICC = 0.146 indicates that the necessity of using multilevel models rather than single-level models to measure the self-rated health mechanism of influence [84]. Based on the approach used by Goldstein, the mechanism is measured using a multilevel regression model [85]. The expression is as follows:
Y i j = α 1 + η X j + β 1 Z i j + γ 1 W i j + δ 1 K i j + μ i j + ε 1 i j   ,
where Y i j represents the self-rated health status for individual i within city j; X j denotes the built environment’s level variables; Z i j denotes the variables for the social environment; W i j denotes the sociodemographic characteristic variables; K i j indicates the variables for the house prices; α 1 indicates the intercept; η , β 1 , γ 1 , δ 1 represents the coefficients of the variables, respectively; and μ 1 j   a n d   ε 1 i j represent the residual of the sociodemographic characteristics and the social environment.
We test the existence of the pathways using Baron and Kenny’s mediation analysis [86]. First, we regress house prices on older adults’ self-rated health (Model 1). Second, we regress the mediator (subjective well-being) on house prices and covariates (Model 2). Third, we regress house prices on older adults’ self-rated health, covariates, and mediators. Fourth, we calculate the direct and indirect effects in the mediation model to test whether mediation effects are statistically significant. We use bootstrapping (500 samples) to obtain bias-corrected 95% CIs for the pathway.

4. Results

4.1. Relationship Between House Prices and Self-Rated Health

The ICC for the null model was 0.146, all between-residual variances were 0.96, and between-factor variances were 0.17, which means about 14.6% of the variation in self-rated health among older adults was attributed to the variation in cluster level or city-level factors. This indicated that the multilevel logistic regression was more suitable than the standard factor model. Table 4 presents the relation among these variables. Model 1 estimated the association between house prices and self-rated health, while adjusting for built environment, social environment, and demographic covariates. House prices strongly and significantly predicted older adults’ self-rated health (coef. = −0.214, p < 0.05): higher house prices were negatively related with lower older adults’ self-rated health. Specifically, a one-point increase in house prices produced a 0.214-point decrease in self-rated health. This suggests that price increases lead to people becoming healthier, as self-rated health is scored in reverse. With respect to the social environment characteristics, social trust negatively predicted older adults’ self-rated health when the scores of social trust were in the reverse direction toward self-rated health (coef. = −0.081, p < 0.01). This means that, in a neighborhood with higher social trust, older adults living there are healthier. Surprisingly, homeownership by renters or homeowners did not significantly correlate with self-rated health of older adults. One explanation for this may be that health-promoting effects are contingent upon house values rather than homeownership [87].

4.2. Mediating Effect of Subjective Well-Being

A mediation analysis to examine the mediation effect of subjective well-being on the relation between house prices and self-rated health was performed. Model 2 estimated the association between house prices and mediators (subjective well-being), whereas Model 3 estimated the association between house prices and self-rated health while considering the mediator. In our study, we observed that the direction of the direct and indirect effects contradicted each other, which implied there was an inconsistent mediation effect. The ratio of the indirect to the direct effect was 0.066. The effect between house prices and self-rated health in Model 1 was −0.214, while the direct effect in Model 3 was −0.227, indicating that the coefficient increased. This means the presence of a suppression effect could be identified when the correlation between house prices and subjective well-being became stronger when a mediator was introduced into the analysis. This occurs because the mediator accounts for variance that was initially attributed to the independent variable, resulting in the suppression of the direct effect [88].
In mediation analysis, a bias-corrected bootstrapping method was additionally applied to determine whether the 95% confidence interval included zero. The result was significant if not, or non-significant if otherwise. The results revealed that the subjective well-being served as a mediator (Table 4). The analysis showed that after controlling for gender, marital status, political status, and hukou, the negative effect of house prices on self-rated health was significantly mediated by subjective well-being (coef. = −0.029, bootstrap CI: −0.045~−0.014). In the meantime, the direct effect of house prices on self-rated health remained significant (coef. = −0.180, bootstrap CI: −0.241~−0.118). This result confirmed the mediating effect. A possible reason for this may be that renters who want to purchase real estate will be required to take on more debt (a larger mortgage) as a result of rising house prices [89]. Furthermore, this may be related to the context of the special family cultural background in China: when adult children plan to get married, parents have a strong motivation to help their children buy or build new houses, which means that older adults need to keep working. Simultaneously, the social environment characteristics among the covariates had significant effects on the subjective well-being of the older adults. Social trust can promote engagement with social networks, which can improve mental health. Several studies have shown that people who interact with trustworthy neighbors or are willing to do neighbors a favor may present a positive psychological state, leading to a sense of belonging and self-worth [90].

4.3. Difference Between Young-Old and Old-Old

This study also examined whether self-rated health differed across young-old and old-old groups. A t-test illustrated that these mean differences were significant between the young-old and old-old groups (t = 0.033, p < 0.05), which indicated the differences in self-rated health among young-old and old-old adults. This result might be partly because of mobility disabilities in older adults as age increases. The social advantages and opportunities associated with living in owner-occupied housing, for example, neighborhood stability, increased social interaction, and community involvement, enhance old-old adults’ degree of satisfaction in life.
Table 5 compares the analytical results of the two subsample models following the same approaches employed for the total sample. The result revealed findings regarding the relationship between house prices and self-rated health for young-old (55–69 years old) and old-old (older than 70 years old). For the young-old in the model without the mediator variable (subjective well-being), house prices strongly and significantly influenced self-rated health (coef. = −0.186, p < 0.1), while the effect of house prices clearly increased for the old-old (coef. = −0.933, p < 0.01). When both the independent variable (house prices) and the mediator variable (subjective well-being) were included in the same model with self-rated health serving as the dependent variable, the effect of house prices increased for both the young-old (coef. = −0.200, p < 0.1) and old-old (coef. = −1.004, p < 0.01). Regarding the coefficient of house prices, its value dropped from −0.186 to −0.200 for the young-old and from −0.933 to −1.004 for the old-old. This result suggested that, for the young-old and old-old, the mediation effect of subjective well-being seems plausible. The bootstrap mediation test results also proved the difference in the effect of mediation of subjective well-being. The p-value of the bootstrap test was 0.000 for the young-old and 0.001 for the old-old. The result found in the young-old and old-old was in accordance with the findings for the total sample: house prices directly affected self-rated health, and also indirectly impacted an individual’s health via the mediation effect of subjective well-being.
Significant differences were found in the effects of social trust, community safety, freedom of life choice, homeownership, and mental well-being. Freedom of life choice was a negative predictor for all groups, while community safety was a positive predictor for the young-old but not for the old-old. This was because, as age increased, the older adults were more restricted to the community due to the deterioration of mobility. For instance, people who live in neighborhoods with less community safety were prone to stress, and social chaos and unsafe neighborhoods will affect residents’ mental health. Furthermore, the coefficients of social trust and political status were significant negative predictors among all the samples (Table 5). This was because the scores of social trust were in the reverse direction toward self-rated health. In interpersonal relationships, the tendency and ability to trust in other people are considered a positive attitude, especially in the group of older adults, where trust is positively related to health [91]. Asset effect theory indicates that individuals with more assets, which means homeownership, are prone to demonstrate better subjective well-being [92]. Our results showed that homeownership was a negative predictor for all groups, while the effect of ownership clearly increased for the old-old (coef. = −1.437, p < 0.05). This result might be partly because of mobility disabilities in older adults as age increases. Living in a community with mutual assistance and stable relationships among neighbors can improve the comfort and happiness of the elderly.

4.4. Sensitivity Analysis

In Table 6, an analysis was conducted to test the sensitivity of our results to different measurements. Mean income was utilized as a novel measure of prices. As in the study of Shen et al. [93], who used the average annual household income as an indicator, we conducted sensitivity analysis. Models 1–3 further substantiated the mediating effect of subjective well-being on the direct and indirect linkages between mean income and self-rated health. These findings imply that our principal conclusions remain strong, even after considering other measurements.

5. Discussion and Conclusions

5.1. Discussion

In the context of China’s aging population, many health problems of older adults associated with aging are becoming more serious. Against the background of active aging, the rapid increase in house prices is also drawing widespread attention. The housing market has been proven to contribute to several outcomes and actions, such as neighborhood characteristics and house purchase behavior, which may have an negative impact on older adults [94,95]. Our study considered the relationship between house prices and the self-rated health of older adults, and especially on how subjective well-being mediated this relation based on the above background. Using a mediation modeling approach, we derived the key finding: house prices had a positive impact on older adults’ self-rated health, with their subjective well-being acting as a mediator in this effect. Previous studies conducted in Western countries that explored house prices and health have shown that house prices create direct economic pressure and psychological anxiety for those enjoying preferential policies and who go through marriage and divorce registration formalities, increase working hours, reduce the time invested in health, and have negative effects on the health level of buyers [96]. Recent findings regarding Chinese cities have revealed a negative association between rising house prices and mental health [97]. This study takes it a step further by breaking through previous conclusions that house prices only affect the health of 20–45-year-olds [98] and proves that rising house prices have a positive impact on the health level of persons aged over 55 years. This may be because older adults who are more senior are inclined to have a higher probability of homeownership [99]. Scholars consistently find that homeowners have better health outcomes when compared with renters [100]. The increase in house prices leads to the accumulation of their wealth, so that older adults are prone to increase expenditures on health management. Furthermore, asset effect theory posits that individuals with greater assets have a tendency to depict better subjective well-being [101].
Previous studies on subjective well-being have demonstrated that, in both developed and developing countries, older adults’ self-rated health is strongly linked with their subjective well-being. Older adults who report greater subjective well-being tend to enjoy longer lifespans and superior health outcomes compared to those with a low level of subjective well-being [49,102,103]. This study further verified the role of subjective well-being in the relationship between house price levels and self-rated health. The main reason for this is that housing market reform intensified the differentiation of high-priced commercial housing. House prices imply differentiation regarding spatially enjoying and accessing resources that are valuable for well-being. Social characteristics such as hospitals, population density, and urbanization level significantly influenced the subjective well-being of older adults. Therefore, differences in public facilities due to house prices affect the well-being of older adults [104]. Furthermore, some social environment characteristics may also influence older adults’ mental health and subjective well-being. Regarding community satisfaction, most scholars believe that the higher the satisfaction of life, the healthier will be older adults [102].
At the same time, the perception of a lack of safety is also considered a crucial contributor to stress. Robinette and Charles found that people who perceived their neighborhoods as less safe experienced more health issues 10 years later than those who perceived higher levels of community safety [105]. There may also be differences among older adults. Taking this into consideration, we analyzed possible age differences between older adults by separating them into two subgroups: young-old (55–69 ages) and old-old (older than 70 years old). The study found that when age is the dividing line, the old-old are more affected by house price levels than the young-old. Meanwhile, the mediation effect of subjective well-being is particularly manifest for the old-old. Such differences may be attributed to various goals and values held at various life stages. This may be because the older people are, the more the degrees of their functional impairment and low mobility are aggravated. The young-old tend to take part in various leisure activities and neighborhood interactions, so that their subjective well-being is less susceptible to house prices. Regarding the old-old, due to the inconvenience of one’s own mobility and the contraction of their social space, they have fewer ways to achieve happiness in comparison, so that they are prone to being influenced by house prices [106]. This can help bridge the gap in older adults’ self-rated health of different age groups.
Despite its contributions to understanding the relationship between house prices and older adults’ self-rated health, this study has several limitations that should be considered. First, our study was cross-sectional. Determining how long-term house price changes affect the self-rated health of older adults requires further longitudinal investigation. Second, the increase in housing prices does not necessarily imply an improvement in community aging facilities, which may be due to location advantages. Understanding whether changes to neighborhood environments (e.g., aging facilities, accessibility to green space) impact living arrangements, such as the time spent outdoors, could be crucial. Owing to the unavailability of the living arrangement, we failed to explore this relationship in which the effects of neighborhood environments might be crucial for the health and well-being of older adults. Future research should take the micro-scale built environments into account to fill these gaps.

5.2. Conclusions

This paper studied the correlation between house prices and older adults’ self-rated health in China, focusing especially on how subjective well-being mediates this relationship. The results of the statistical analyses indicated that, in accordance with what was known about the influence of house prices on health in developed and developing countries, house prices affected people’s physical and mental health. Furthermore, some pivotal discoveries were identified: (1) Higher house prices were negatively associated with lower self-rated health of older adults. (2) The subjective well-being of older adults mediates the effect of house prices on their self-rated health. (3) Compared with the young-old population, house prices have a stronger positive impact on the self-rated health of the old-old, and the degree increases with increasing age. Elevated house prices correlated negatively with both mental health and overall life satisfaction. Our empirical analysis is helpful for policy formulation of urbanization and ensuring healthy aging in China. Policymakers are advised to formulate relevant policies by enacting housing purchase restriction policies or loan limitations to control the rapid rise in house prices, maintain these rising rates within a reasonable range, and enable residents to afford housing within budget constraints. Furthermore, the Chinese Government should continue to promote the optimal allocation of resources for older adults. It is recommended that, first, the government should strengthen the construction of professional teams in elderly care institutions and form a team of high-quality professional and technical personnel with a reasonable structure of age, education, and qualifications. Secondly, for the old-old group, subjective well-being played a greater role in health. Therefore, we advocate measures to combine medical care with nursing care in areas where old-old adults are concentrated to maximize the role of spiritual needs in health. In areas in which older adults constitute a majority of the population, the government should concentrate on the establishment of different types of elderly care institutions to fulfill the medical health demands of older persons. In conclusion, this study shows that rising prices negatively affect self-rated health, with subjective well-being acting as a mediator in this relationship. These findings indicate that urban planning and housing policies should aim to control house price increases, consider the different impacts across age groups, and increase the chances of social interaction of older adults to promote health and well-being.

Author Contributions

Conceptualization, M.W. and Z.T.; methodology, M.W. and Z.T.; software, R.C.; validation, Z.T.; formal analysis, R.C.; investigation, M.W. and Z.T.; resources, X.Z.; data curation, R.C.; writing-original draft preparation, M.W., Z.T., R.C. and X.Z.; supervision, X.Z. All authors have read and agreed to the published version of the manuscript.

Funding

This work was supported by the Guangdong Province Natural Science Fund (Grant No. 2022A1515011728).

Institutional Review Board Statement

Ethical review and approval were waived for this study due to the absence of sensitive data and to the processing of data with the assurance of the confidentiality and anonymization of the personal information of all the subjects involved in the study.

Data Availability Statement

Data are contained within the article.

Acknowledgments

The authors sincerely thank the couples who participated in the study.

Conflicts of Interest

Author Min Wang was employed by the company Architectural and Planning Design Institute of Guangdong University of Technology Co., Ltd. The remaining authors declare that the research was conducted in the absence of any commercial or financial relationships that could be construed as a potential conflict of interest.

References

  1. Bowling, A.; Stafford, M. How Do Objective and Subjective Assessments of Neighbourhood Influence Social and Physical Functioning in Older Age? Findings from a British Survey of Ageing. Soc. Sci. Med. 2007, 64, 2533–2549. [Google Scholar] [CrossRef] [PubMed]
  2. Stafford, M.; Mcmunn, A.; De Vogli, R. Neighbourhood Social Environment and Depressive Symptoms in Mid-Life and Beyond. Ageing Soc. 2011, 31, 893–910. [Google Scholar] [CrossRef]
  3. Beard, J.R.; Blaney, S.; Cerda, M.; Frye, V.; Lovasi, G.S.; Ompad, D.; Rundle, A.; Vlahov, D. Neighborhood Characteristics and Disability in Older Adults. J. Gerontol. Ser. B-Psychol. Sci. Soc. Sci. 2009, 64, 252–257. [Google Scholar] [CrossRef] [PubMed]
  4. WHO Housing and Health Guidelines; World Health Organization: Geneva, Switzerland, 2018.
  5. Schoenbaum, M.; Waidmann, T. Race, Socioeconomic Status, and Health: Accounting for Race Differences in Health. J. Gerontol. Ser. B Psychol. Sci. Soc. Sci. 1997, 52, 61–73. [Google Scholar] [CrossRef] [PubMed]
  6. Ellaway, A.; Macintyre, S. Does Housing Tenure Predict Health in the UK Because It Exposes People to Different Levels of Housing Related Hazards in the Home or Its Surroundings? Health Place 1998, 4, 141–150. [Google Scholar] [CrossRef] [PubMed]
  7. Macintyre, S.; Ellaway, A.; Hiscock, R.; Kearns, A.; Der, G.; Mckay, L. What Features of the Home and the Area Might Help to Explain Observed Relationships between Housing Tenure and Health? Evidence from the West of Scotland. Health Place 2003, 9, 207–218. [Google Scholar] [CrossRef]
  8. Pollack, C.; von dem Knesebeck, O.; Siegrist, J. Housing and Health in Germany. J. Epidemiol. Community Health 2004, 58, 216–222. [Google Scholar] [CrossRef] [PubMed]
  9. Robert, S.; House, J.S. SES Differentials in Health by Age and Alternative Indicators of SES. J. Aging Health 1996, 8, 359–388. [Google Scholar] [CrossRef] [PubMed]
  10. Pollack, C.E.; Chideya, S.; Cubbin, C.; Williams, B.; Dekker, M.; Braveman, P. Should Health Studies Measure Wealth? A Systematic Review. Am. J. Prev. Med. 2007, 33, 250–264. [Google Scholar] [CrossRef] [PubMed]
  11. Marshall, A.; Jivraj, S.; Nazroo, J.; Tampubolon, G.; Vanhoutte, B. Does the Level of Wealth Inequality within an Area Influence the Prevalence of Depression amongst Older People? Health Place 2014, 27, 194–204. [Google Scholar] [CrossRef]
  12. Disney, R.; Gathergood, J.; Henley, A. House price shocks, negative equity, and household consumption in the united kingdom. J. Eur. Econ. Assoc. 2010, 8, 1179–1207. [Google Scholar] [CrossRef]
  13. Kocjan, G.Z.; Avsec, A.; Kavcic, T. Feeling Too Low to Be Active: Physical Inactivity Mediates the Relationship between Mental and Physical Health. Soc. Sci. Med. 2024, 341, 392–401. [Google Scholar]
  14. Bond, J.; Dickinson, H.O.; Matthews, F.; Jagger, C.; Brayne, C.; Cfas, M. Self-Rated Health Status as a Predictor of Death, Functional and Cognitive Impairment: A Longitudinal Cohort Study. Eur. J. Ageing 2006, 3, 193–206. [Google Scholar] [CrossRef] [PubMed]
  15. Benyamini, Y.; Idler, E.L. Community Studies Reporting Association between Self-Rated Health and Mortality: Additional Studies, 1995 to 1998. Res. Aging 1999, 21, 392–401. [Google Scholar] [CrossRef]
  16. Liao, Y.; Bang, D.; Cosgrove, S.; Dulin, R.; Harris, Z.; Taylor, A.; White, S.; Yatabe, G.; Liburd, L.; Giles, W.; et al. Surveillance of Health Status in Minority Communities—Racial and Ethnic Approaches to Community Health across the U.S. (REACH U.S.) Risk Factor Survey, United States, 2009. Morb. Mortal. Wkly. Rep. Surveill. Summ. 2011, 60, 1–44. [Google Scholar]
  17. Bombak, A.E. Self-Rated Health and Public Health: A Critical Perspective. Front. Public Health 2013, 1, 15. [Google Scholar] [CrossRef]
  18. Murray, C.J.; Lopez, A.D. Alternative Projections of Mortality and Disability by Cause 1990-2020: Global Burden of Disease Study. Lancet 1997, 349, 1498–1504. [Google Scholar] [CrossRef] [PubMed]
  19. Manor, O.; Matthews, S.; Power, C. Dichotomous or Categorical Response? Analysing Self-Rated Health and Lifetime Social Class. Int. J. Epidemiol. 2000, 29, 149–157. [Google Scholar] [CrossRef] [PubMed]
  20. de Bruin, A.; Picavet, H.S.; Nossikov, A. Health Interview Surveys: Towards International Harmonization of Methods and Instruments; WHO Regional Publications, European Series, No. 58; Office of Publications, WHO Regional Office for Europe: Copenhagen, Denmark, 1996; Volume 58, pp. 1–161. [Google Scholar]
  21. Hummert, M.L. Multiple Stereotypes of Elderly and Young Adults: A Comparison of Structure and Evaluations. Psychol. Aging 1990, 5, 182–193. [Google Scholar] [CrossRef]
  22. Warmoth, K.; Tarrant, M.; Abraham, C.; Lang, I.A. Older Adults’ Perceptions of Ageing and Their Health and Functioning: A Systematic Review of Observational Studies. Psychol. Health Med. 2016, 21, 531–550. [Google Scholar] [CrossRef] [PubMed]
  23. Tomioka, K.; Kurumatani, N.; Hosoi, H. Self-Rated Health Predicts Decline in Instrumental Activities of Daily Living among High-Functioning Community-Dwelling Older People. Age Ageing 2017, 46, 265–270. [Google Scholar] [CrossRef] [PubMed]
  24. Idler, E.L.; Benyamini, Y. Self-Rated Health and Mortality: A Review of Twenty-Seven Community Studies. J. Health Soc. Behav. 1997, 38, 21–37. [Google Scholar] [CrossRef]
  25. Jylh, M. What Is Self-Rated Health and Why Does It Predict Mortality? Towards a Unified Conceptual Model. Soc. Sci. Med. 2009, 69, 307–316. [Google Scholar] [CrossRef] [PubMed]
  26. DeSalvo, K.; Bloser, N.; Reynolds, K.; He, J.; Muntner, P. Mortality Prediction with a Single General Self-Rated Health Question. J. Gen. Intern. Med. 2006, 21, 267–275. [Google Scholar] [CrossRef]
  27. Jang, Y.; Huang, Y.-C.; Yoon, H.; Lin, S. Correlates of Self-Rated Health and Self-Rated Mental Health in Older Chinese Americans. Soc. Work. Public Health 2016, 31, 309–315. [Google Scholar] [CrossRef]
  28. Hirve, S.; Juvekar, S.; Lele, P.; Agarwal, D. Social Gradients in Self-Reported Health and Well-Being among Adults Aged 50 and over in Pune District, India. Glob. Health Action 2010, 3, 88–95. [Google Scholar] [CrossRef] [PubMed]
  29. Gomez-Olive, F.X.; Thorogood, M.; Clark, B.D.; Kahn, K.; Tollman, S.M. Assessing Health and Well-Being among Older People in Rural South Africa. Glob. Health Action 2010, 3, 23–35. [Google Scholar] [CrossRef]
  30. Kim, E.S.; Kawachi, I. Perceived Neighborhood Social Cohesion and Preventive Healthcare Use. Am. J. Prev. Med. 2017, 53, E35–E40. [Google Scholar] [CrossRef]
  31. Richard, L.; Gauvin, L.; Raine, K. Ecological Models Revisited: Their Uses and Evolution in Health Promotion Over Two Decades. Annu. Rev. Public Health 2011, 32, 307–326. [Google Scholar] [CrossRef] [PubMed]
  32. Smith, R.J.; Lehning, A.J.; Kim, K. Aging in Place in Gentrifying Neighborhoods: Implications for Physical and Mental Health. Gerontologist 2018, 58, 26–35. [Google Scholar] [CrossRef]
  33. Gibson, M.; Petticrew, M.; Bambra, C.; Sowden, A.J.; Wright, K.E.; Whitehead, M. Housing and Health Inequalities: A Synthesis of Systematic Reviews of Interventions Aimed at Different Pathways Linking Housing and Health. Health Place 2011, 17, 175–184. [Google Scholar] [CrossRef] [PubMed]
  34. Thomson, H.; Thomas, S.; Sellstrom, E.; Petticrew, M. The Health Impacts of Housing Improvement: A Systematic Review of Intervention Studies from 1887 to 2007. Am. J. Public Health 2009, 99 (Suppl. S3), S681. [Google Scholar] [CrossRef] [PubMed]
  35. Lofqvist, C.; Tomsone, S.; Iwarsson, S.; Horstmann, V.; Haak, M. Changes in Home and Health over Nine Years among Very Old People in Latvia—Results from the ENABLE-AGE Project. J. Cross-Cult. Gerontol. 2017, 32, 17–29. [Google Scholar] [CrossRef] [PubMed]
  36. Klein, E.G.; Keller, B.; Hood, N.; Holtzen, H. Affordable Housing and Health: A Health Impact Assessment on Physical Inspection Frequency. J. Public Health Manag. Pract. 2015, 21, 368–374. [Google Scholar] [CrossRef]
  37. Ellaway, A.; Macintyre, S.; Bonnefoy, X. Graffiti, Greenery, and Obesity in Adults: Secondary Analysis of European Cross Sectional Survey. BMJ-Br. Med. J. 2005, 331, 611–612. [Google Scholar] [CrossRef]
  38. Gong, Y.; Palmer, S.; Gallacher, J.; Marsden, T.; Fone, D. A Systematic Review of the Relationship between Objective Measurements of the Urban Environment and Psychological Distress. Environ. Int. 2016, 96, 48–57. [Google Scholar] [CrossRef]
  39. van den Berg, M.; Wendel-Vos, W.; van Poppel, M.; Kemper, H.; van Mechelen, W.; Maas, J. Health Benefits of Green Spaces in the Living Environment: A Systematic Review of Epidemiological Studies. Urban For. Urban Green. 2015, 14, 806–816. [Google Scholar] [CrossRef]
  40. Liu, Y.; Wang, R.; Grekousis, G.; Liu, Y.; Li, Z. Neighbourhood Greenness and Mental Wellbeing in Guangzhou, China: What Are the Pathways? Landsc. Urban Plan. 2019, 190, 103602. [Google Scholar] [CrossRef]
  41. Huang, B.; Feng, Z.; Pan, Z.; Liu, Y. Amount of and Proximity to Blue Spaces and General Health among Older Chinese Adults in Private and Public Housing: A National Population Study. Health Place 2022, 74, 102774. [Google Scholar] [CrossRef]
  42. Stronegger, W.J.; Titze, S.; Oja, P. Perceived Characteristics of the Neighborhood and Its Association with Physical Activity Behavior and Self-Rated Health. Health Place 2010, 16, 736–743. [Google Scholar] [CrossRef] [PubMed]
  43. Park, A.; Shen, Y. Understanding Wealth and Housing Inequality among China’s Older Population. China Econ. J. 2015, 8, 288–307. [Google Scholar] [CrossRef]
  44. Rohe, W.M.; Van Zandt, S.; Mccarthy, G. Home Ownership and Access to Opportunity. Hous. Stud. 2002, 17, 51–61. [Google Scholar] [CrossRef]
  45. Shaw, M. Housing and Public Health. Annu. Rev. Public Health 2004, 25, 397–418. [Google Scholar] [CrossRef] [PubMed]
  46. Liu, Y.; Njai, R.S.; Greenlund, K.J.; Chapman, D.P.; Croft, J.B. Relationships between Housing and Food Insecurity, Frequent Mental Distress, and Insufficient Sleep among Adults in 12 US States, 20309. Prev. Chronic Dis. 2014, 11, E37. [Google Scholar] [CrossRef]
  47. Atalay, K.; Edwards, R.; Liu, B.Y.J. Effects of House Prices on Health: New Evidence from Australia. Soc. Sci. Med. 2017, 192, 36–48. [Google Scholar] [CrossRef]
  48. Fichera, E.; Gathergood, J. Do Wealth Shocks Affect Health? New Evidence from the Housing Boom. Health Econ. 2016, 25, 57–69. [Google Scholar] [CrossRef]
  49. Ratcliffe, A. Wealth effects, local area attributes, and economic prospects: On the relationship between house prices and mental wellbeing. Rev. Income Wealth 2015, 61, 75–92. [Google Scholar] [CrossRef]
  50. Wang, H.-Q.; Liang, L.-Q. How Do Housing Prices Affect Residents’ Health? New Evidence from China. Front. Public Health 2022, 9, 816372. [Google Scholar] [CrossRef]
  51. Hamoudi, A.; Dowd, J.B. Physical Health Effects of the Housing Boom: Quasi-Experimental Evidence From the Health and Retirement Study. Am. J. Public Health 2013, 103, 1039–1045. [Google Scholar] [CrossRef] [PubMed]
  52. Toussaint, J. Housing Assets as a Potential Solution for Financial Hardship: Households’ Mental Accounts of Housing Wealth in Three European Countries. Hous. Theory Soc. 2011, 28, 320–341. [Google Scholar] [CrossRef]
  53. Deaton, A. Franco Modigliani and the Life-Cycle Theory of Consumption. BNL Q. Rev. 2005, 58, 91–107. [Google Scholar] [CrossRef]
  54. Grewal, A.; Hepburn, K.J.; Lear, S.A.; Adshade, M.; Card, K.G. The Impact of Housing Prices on Residents’ Health: A Systematic Review. BMC Public Health 2024, 24, 931. [Google Scholar] [CrossRef]
  55. Jou, A.; Mas, N.; Vergara-Alert, C. Housing Wealth, Health and Deaths of Despair. J. Real. Estate Financ. Econ. 2023, 66, 569–602. [Google Scholar] [CrossRef]
  56. Baker, E.; Pham, N.T.A.; Daniel, L.; Bentley, R. New Evidence on Mental Health and Housing Affordability in Cities: A Quantile Regression Approach. Cities 2020, 96, 102455. [Google Scholar] [CrossRef]
  57. Venti, S.F.; Wise, D.A. Aging and Housing Equity; NBER Working Papers; University of Pennsylvania Press: Philadelphia, PA, USA, 2000. [Google Scholar]
  58. Chen, N.; Shen, Y.; Liang, H.; Guo, R. Housing and Adult Health: Evidence from Chinese General Social Survey (CGSS). Int. J. Environ. Res. Public Health 2021, 18, 916. [Google Scholar] [CrossRef] [PubMed]
  59. Shuyun, C.; Jiankun, Y. Whether Housing Affects Urban Rsidents’ Health Level?—From an Empirical Analysis of Chinese General Social Survey(2015). J. Cent. China Norm. Univ. Humanit. Soc. Sci. 2018, 5, 55–64. [Google Scholar]
  60. Solar, O.; Irwin, A. A Conceptual Framework for Action on the Social Determinats of Health; Social Determinants of Health Discussion Paper 2 (Policy and Practice); World Health Organization: Geneva, Switzerland, 2010. [Google Scholar]
  61. Diener, E.; Suh, E.; Lucas, R.; Smith, H. Subjective Well-Being: Three Decades of Progress. Psychol. Bull. 1999, 125, 276–302. [Google Scholar] [CrossRef]
  62. Neumannhme, S.; Attema, A.E.; Brouwer, W.B.F.; Exel, J.N.J.A.V. Life Satisfaction: The Role of Domain: Pecific Reference Points. Health Econ. 2021, 30, 2766–2779. [Google Scholar] [CrossRef]
  63. Lee, C.-C.; Huang, R.-Y.; Wu, Y.-L.; Yeh, W.-C.; Chang, H.-C. The Impact of Living Arrangements and Social Capital on the Well-Being of the Elderly. Healthcare 2023, 11, 2050. [Google Scholar] [CrossRef] [PubMed]
  64. Soosova, M.S.; Timkova, V.; Dimunova, L.; Mauer, B. Spirituality as a Mediator Between Depressive Symptoms and Subjective Well-Being in Older Adults. Clin. Nurs. Res. 2021, 30, 707–717. [Google Scholar] [CrossRef] [PubMed]
  65. Diener, E.; Chan, M.Y. Happy People Live Longer: Subjective Well-Being Contributes to Health and Longevity. Appl. Psychol.-Health Well Being 2011, 3, 1–43. [Google Scholar] [CrossRef]
  66. Chiang, H.-H.; Lee, T.S.-H. Family Relations, Sense of Coherence, Happiness and Perceived Health in Retired Taiwanese: Analysis of a Conceptual Model. Geriatr. Gerontol. Int. 2018, 18, 154–160. [Google Scholar] [CrossRef] [PubMed]
  67. Ryff, C.D.; Radler, B.T.; Friedman, E.M. Persistent Psychological Well-Being Predicts Improved Self-Rated Health over 9–10 Years: Longitudinal Evidence from MIDUS. Health Psychol. Open 2015, 2, 2055102915601582. [Google Scholar] [CrossRef] [PubMed]
  68. Steptoe, A.; Deaton, A.; Stone, A.A. Subjective Wellbeing, Health, and Ageing. Lancet 2015, 385, 640–648. [Google Scholar] [CrossRef]
  69. Ngamaba, K.H.; Panagioti, M.; Armitage, C.J. How Strongly Related Are Health Status and Subjective Well-Being? Systematic Review and Meta-Analysis. Eur. J. Public Health 2017, 27, 879–885. [Google Scholar] [CrossRef]
  70. Yuan, W.; Gong, S.; Han, Y. How Does Rising Housing Price Affect the Health of Middle-Aged and Elderly People? The Complementary Mediators of Social Status Seeking and Competitive Saving Motive. PLoS ONE 2020, 15, e0243982. [Google Scholar] [CrossRef]
  71. Theurer, K.; Wister, A. Altruistic Behaviour and Social Capital as Predictors of Well-Being among Older Canadians. Ageing Soc. 2010, 30, 157–181. [Google Scholar] [CrossRef]
  72. Zhang, C.; Zhang, F. Effects of Housing Wealth on Subjective Well-Being in Urban China. J. Hous. Built Environ. 2019, 34, 965–985. [Google Scholar] [CrossRef]
  73. Guven, C.; Sorensen, B.E. Subjective Well-Being: Keeping up with the Perception of the Joneses. Soc. Indic. Res. 2012, 109, 439–469. [Google Scholar] [CrossRef]
  74. Foye, C.; Clapham, D.; Gabrieli, T. Home-Ownership as a Social Norm and Positional Good: Subjective Wellbeing Evidence from Panel Data. Urban Stud. 2018, 55, 1290–1312. [Google Scholar] [CrossRef]
  75. Zheng, X.; Yuan, Z.Q.; Zhang, X. Does Happiness Dwell in an Owner-Occupied House? Homeownership and Subjective Well-Being in Urban China. Cities 2020, 96, 102404.1–102404.11. [Google Scholar] [CrossRef]
  76. Cheng, Z.; King, S.P.; Smyth, R.; Wang, H. Housing Property Rights and Subjective Wellbeing in Urban China. Eur. J. Political Econ. 2016, 45, 160–174. [Google Scholar] [CrossRef]
  77. Boddy, M.; Gray, F. Filtering Theory, Housing Policy and the Legitimation of Inequality. Policy Politics 1979, 7, 39–54. [Google Scholar] [CrossRef]
  78. Theurer, K.; Ben Mortenson, W.; Stone, R.; Suto, M.; Timonen, V.; Rozanova, J. The Need for a Social Revolution in Residential Care. J. Aging Stud. 2015, 35, 201–210. [Google Scholar] [CrossRef] [PubMed]
  79. Dai, Y.; Zhang, C.-Y.; Zhang, B.-Q.; Li, Z.; Jiang, C.; Huang, H.-L. Social Support and the Self-Rated Health of Older People A Comparative Study in Tainan Taiwan and Fuzhou Fujian Province. Medicine 2016, 95, e3881. [Google Scholar] [CrossRef]
  80. National Bureau of Statistics of China. China Statistical Yearbook 2018; China Statistics Press: Beijing, China, 2018; ISBN 978-7-5037-8587-0. [Google Scholar]
  81. Cellmer, R.; Belej, M.; Trojanek, R. Housing Prices and Points of Interest in Three Polish Cities. J. Hous. Built Environ. 2024, 39, 1509–1540. [Google Scholar] [CrossRef]
  82. Van Doorn, C.; Kasl, S.V. Can Parental Longevity and Self-Rated Life Expectancy Predict Mortality among Older Persons? Results from an Australian Cohort. J. Gerontol. Ser. B Psychol. Sci. Soc. Sci. 1998, 53B, S28–S34. [Google Scholar] [CrossRef]
  83. Goldstein, N.E.S.; Romaine, C.L.R.; Zelle, H. Psychometric Properties of the Miranda Rights Comprehension Instruments with a Juvenile Justice Sample. Assessment 2011, 18, 428–441. [Google Scholar] [CrossRef]
  84. Austin, P.C.; Merlo, J. Intermediate and Advanced Topics in Multilevel Logistic Regression Analysis. Stat. Med. 2017, 36, 3257–3277. [Google Scholar] [CrossRef]
  85. Goldstein, H. Multilevel Statistical Models; John Wiley & Sons: Hoboken, NJ, USA, 2011. [Google Scholar]
  86. Baron, R.M.; Kenny, D.A. The Moderator-Mediator Variable Distinction in Social Psychological Research: Conceptual, Strategic, and Statistical Considerations. J. Personal. Soc. Psychol. 1999, 51, 1173. [Google Scholar] [CrossRef]
  87. Mehdipanah, R.; Schulz, A.; Israel, B.; Mentz, G.; Eisenberg, A.; Stokes, C.; Rowe, Z. Neighborhood Context, Homeownership and Home Value: An Ecological Analysis of Implications for Health. Int. J. Environ. Res. Public Health 2017, 14, 1098. [Google Scholar] [CrossRef] [PubMed]
  88. Preacher, K.J.; Hayes, A.F. SPSS and SAS Procedures for Estimating Indirect Effects in Simple Mediation Models. Behav. Res. Methods Instrum. Comput. 2004, 36, 717–731. [Google Scholar] [CrossRef]
  89. Atalay, K.; Edwards, R. House Prices, Housing Wealth and Financial Well-Being. J. Urban Econ. 2022, 129, 103438. [Google Scholar] [CrossRef]
  90. Fujiwara, T.; Kawachi, I. A Prospective Study of Individual-Level Social Capital and Major Depression in the United States. J. Epidemiol. Community Health 2008, 62, 627–633. [Google Scholar] [CrossRef] [PubMed]
  91. Barefoot, J.C.; Maynard, K.E.; Beckham, J.C.; Brummett, B.H.; Hooker, K.; Siegler, I.C. Trust, Health, and Longevity. J. Behav. Med. 1998, 21, 517–526. [Google Scholar] [CrossRef]
  92. Han, C.-K.; Hong, S.-I. Assets and Life Satisfaction Patterns Among Korean Older Adults: Latent Class Analysis. Soc. Indic. Res. 2010, 100, 225–240. [Google Scholar] [CrossRef]
  93. Ni, Y.-L.; Chang, J.-H.; Chen, L.H. Investigating the Relationship between District-Level Socioeconomic Status and Individual Obesity in Taiwanese Adolescents: A Large-Scale Cross-Sectional Analysis. Sci. Rep. 2019, 9, 2928. [Google Scholar] [CrossRef] [PubMed]
  94. Mohamad, M.H.; Nawawi, A.H.; Sipan, I. Review of Building, Locational, Neighbourhood Qualities Affecting House Prices in Malaysia. Procedia-Soc. Behav. Sci. 2016, 234, 452–460. [Google Scholar]
  95. Jia, S.; Wang, Y.; Fan, G.-Z. Home-Purchase Limits and Housing Prices: Evidence from China. J. Real Estate Financ. Econ. 2018, 56, 386–409. [Google Scholar] [CrossRef]
  96. Vonen, H.D.; Sund, E.R.; Ariansen, I.; Krokstad, S. Trends in Socioeconomic Inequalities in Self-Rated Health and Mental Distress during Four Decades in a Norwegian Population: A HUNT Study. Eur. J. Public Health 2024, 34, 435–440. [Google Scholar] [CrossRef] [PubMed]
  97. Wei, G.; Zhu, H.; Han, S.; Chen, J.; Shi, L. Impact of House Price Growth on Mental Health: Evidence from China. SSM—Popul. Health 2021, 13, 100696. [Google Scholar] [CrossRef] [PubMed]
  98. Yilmazer, T.; Babiarz, P.; Liu, F. The Impact of Diminished Housing Wealth on Health in the United States: Evidence from the Great Recession. Soc. Sci. Med. 2015, 130, 234–241. [Google Scholar] [CrossRef] [PubMed]
  99. Gu, D.; Yin, Y.; Zhou, J.; Sautter, J.; Qiu, L. Homeownership among Older Adults in Urban China: The Importance of Institutional Factors. J. Cross Cult. Gerontol. 2016, 31, 337–355. [Google Scholar] [CrossRef]
  100. Mawhorter, S.; Crimmins, E.M.; Ailshire, J.A. Housing and Cardiometabolic Risk among Older Renters and Homeowners. Hous. Stud. 2023, 38, 1342–1364. [Google Scholar] [CrossRef]
  101. Seo, B.K.; Kim, J.H. Intergenerational Coresidence and Life Satisfaction in Old Age: The Moderating Role of Homeownership. Appl. Res. Qual. Life 2022, 17, 3199–3216. [Google Scholar] [CrossRef]
  102. Huang, H.; Li, X.; Zhang, T.; Han, B. Life Satisfaction and Mental Health of Chinese Older Adults in Different Living Arrangements. In Proceedings of the 2011 International Conference on Human Health and Biomedical Engineering, Jilin, China, 19–22 August 2011. [Google Scholar]
  103. Zaninotto, P.; Steptoe, A. Association between Subjective Well-Being and Living Longer without Disability or Illness. JAMA Netw. Open 2019, 2, e196870. [Google Scholar] [CrossRef]
  104. Ren, H.; Yuan, N.; Hu, H. Housing Quality and Its Determinants in Rural China: A Structural Equation Model Analysis. J. Hous. Built Environ. 2019, 34, 313–329. [Google Scholar] [CrossRef]
  105. Lorenc, T.; Clayton, S.; Neary, D.; Whitehead, M.; Petticrew, M.; Thomson, H.; Cummins, S.; Sowden, A.; Renton, A. Crime, Fear of Crime, Environment, and Mental Health and Wellbeing: Mapping Review of Theories and Causal Pathways. Health Place 2012, 18, 757–765. [Google Scholar] [CrossRef] [PubMed]
  106. Yoon, C.; Cole, C.A.; Lee, M.P. Consumer Decision Making and Aging: Current Knowledge and Future Directions. J. Consum. Psychol. 2009, 19, 2–16. [Google Scholar] [CrossRef]
Figure 1. Conceptual framework of mediation effect.
Buildings 15 00053 g001
Figure 2. Research area. (Note: Based on the Department of Natural Resources Standard Map Service website GS (2024)0650.)
Buildings 15 00053 g002
Table 1. Sociodemographic characteristics of the sample.
Total (n = 3279)
Age (%)
55~5923.21
60~7473.21
75~893.52
≥900.06
Gender (%)
Male40.7
Female59.3
Marital status (%)
First marriage/second marriage/cohabitation95.9
Single/divorced/widowed4.1
Political status (%)
Party member6.8
Non-Party member93.2
Hukou (%)
Local Hukou94.8
Non-local Hukou5.2
Individual income in 2017 (yuan) (%)
<18,00065.8
18,000~35,99921.2
36,000~59,9996.7
≥60,0006.3
Homeownership (%)
Homeowner97.8
Renter2.2
Notes: “Local Hukou” represents household registration in this city.
Table 2. Description of index of mental health and community satisfaction.
VariableCronbach’s αStandardized Cronbach’s αDefinitions
Mental Health 0.8570.950Be annoyed by little things
I have no appetite and don’t want to eat.
Even in the favor of family and friends, I still can’t get rid of the depression in my heart
I don’t think it’s as good as most people
Inability to be absorbed in when doing things
Feel depressed
Feel laborious to do anything
Feel hopeless in the future
Feel like your life is a failure
Feel scared
Poor sleep
Feel upset
Talk less than usual
Feel lonely
Feel that people are not very amiable to themselves
Think life is meaningless
Once cried
Feel sad
Feel that people don’t like themselves
Feel like life can’t go on
Community Satisfaction0.8570.860There are safety risks when hanging out and hanging out
Going out alone at night is a safety risk
Risk of burglary if you don’t lock your doors and windows
There is a risk of being targeted if wealth is exposed
Children are at risk of being trafficked when they are alone
Table 3. Urban environment dimension index.
IndexDefinitions
Density of PopulationThe number of individuals per unit area
Urbanization rateThe proportion of the total population that resides in urban areas
POI densityThe ratio of the number of points of interest (POI) within a specific area to the area’s size.
Number of tertiary hospitalsNumber of urban tertiary hospitals (institutes)
Notes: Tertiary hospitals are represented by an additional grade of A (excellent) in the overall evaluation of the hospital’s complexes, the size of the workforce, facilities, skill levels, equipment, managerial function, etc., and can provide the highest level of health care in the region.
Table 4. Regression models for older adults’ self-rated health of the entire sample.
VariableModel 1
Self-Rated Health
Model 2
Subjective Well-Being
Model 3
Self-Rated Health
Coef. (SE)Coef. (SE)Coef. (SE)
House prices−0.214 **
(0.114)
−0.118
(0.076)
−0.227 **
(0.114)
Built environment characteristics
Number of tertiary hospitals0.005
(0.004)
0.009 **
(0.004)
0.006
(0.004)
Point of Interest−0.000
(0.000)
−0.000 ***
(0.000)
−0.000
(0.000)
Density of Population0.000
(0.000)
0.000
(0.000)
0.000
(0.000)
Urbanization Rate−0.002
(0.003)
0.002
(0.002)
−0.002
(0.003)
Social environment characteristics
Social trust−0.081 ***
(0.022)
0.059 **
(0.022)
−0.073 ***
(0.022)
Community mutual assistance0.006
(0.019)
0.056 **
(0.021)
0.013
(0.020)
Community safety0.019
(0.028)
−0.123 ***
(0.023)
0.003
(0.028)
Community satisfaction0.002
(0.006)
−0.007 *
(0.003)
0.002
(0.006)
Freedom of life choice−0.043 ***
(0.011)
0.087 ***
(0.008)
−0.032 **
(0.011)
Demographic characteristics
Mental Health 0.029 ***
(0.002)
−0.020 ***
(0.002)
0.027 ***
(0.002)
Gender−0.110 **
(0.038)
−0.079 **
(0.031)
−0.109 **
(0.039)
Marital status0.110
(0.086)
0.044
(0.100)
0.115
(0.086)
Political status−0.083
(0.062)
0.195 ***
(0.050)
−0.059
(0.062)
Family income (Yuan/Year) (%)
(60,000 income and above ref.)
Below 18,0000.117 **
(0.075)
−0.002
(0.063)
0.120 *
(0.076)
18,000~35,999−0.055
(0.077)
0.054
(0.067)
−0.049
(0.076)
36,000 and above−0.106
(0.076)
0.054
(0.067)
−0.101
(0.077)
Hukou0.134 *
(0.079)
−0.063
(0.064)
0.127 *
(0.070)
Age0.010
(0.003)
0.014 ***
(0.003)
0.011 **
(0.004)
Age1 (55–69)0.623
(0.977)
0.855 ***
(0.102)
0.740
(0.979)
Age2 (≥70)0.505
(0.979)
0.570 ***
(0.107)
0.585
(0.981)
Homeownership−0.041
(0.139)
−0.386 ***
(0.091)
−0.091
(0.138)
Mediator variable
Subjective well-being −0.127 ***
(0.024)
Constant1.300 **
(1.023)
1.975 ***
(0.340)
1.534
(1.019)
Observation327932793279
Proportion of total effect that is mediated0.070
Ratio of indirect to direct effect0.066
Note: * p < 0.10; ** p < 0.05; *** p < 0.01.
Table 5. Regression results for self-rated health of young-old and old-old.
VariableYoung-Old (55–69 Years of Age)Old-Old (70 Years of Age and Above)
Model 1
Self-Rated Health
Model 2
Subjective Well-Being
Model 3
Self-Rated Health
Model 1
Self-Rated Health
Model 2
Subjective Well-Being
Model 3
Self-Rated Health
Coef.
(SE)
Coef.
(SE)
Coef.
(SE)
Coef.
(SE)
Coef.
(SE)
Coef.
(SE)
House prices−0.186 *
(0.111)
−0.102
(0.078)
−0.200 *
(0.113)
−0.933 ***
(0.284)
−0.322
(0.310)
−1.004 ***
(0.249)
Built environment characteristics
Number of tertiary hospitals0.004
(0.004)
0.009 **
(0.004)
0.005
(0.004)
0.023 **
(0.010)
0.007
(0.011)
0.026 **
(0.010)
Point of Interest−0.000
(0.000)
−0.000 ***
(0.000)
−0.000
(0.000)
−0.000
(0.000)
−0.000 **
(0.000)
−0.000
(0.000)
Density of Population0.000
(0.000)
0.000
(0.000)
0.000
(0.000)
0.000
(0.000)
0.000
(0.000)
0.000
(0.000)
Urbanization Rate−0.002
(0.003)
0.002
(0.002)
0.002
(0.003)
0.012
(0.013)
0.006 **
(0.013)
0.010
(0.012)
Social environment characteristics
Social trust−0.071 ***
(0.021)
0.057 **
(0.022)
−0.065 **
(0.022)
−0.206
(0.137)
0.010
(0.098)
−0.186
(0.143)
Community mutual assistance−0.005
(0.019)
0.054 **
(0.021)
−0.012
(0.020)
0.017
(0.122)
0.101
(0.100)
0.039
(0.121)
Community safety0.020
(0.029)
−0.116 ***
(0.022)
0.006
(0.029)
0.109
(0.149)
−0.332 **
(0.116)
0.039
(0.161)
Community satisfaction 0.003
(0.006)
−0.006 *
(0.003)
−0.002
(0.006)
−0.022
(0.022)
−0.010
(0.019)
−0.024
(0.021)
Freedom of life choice−0.043 ***
(0.011)
0.089 ***
(0.008)
−0.032 **
(0.011)
−0.031 **
(0.043)
−0.029 ***
(0.009)
−0.028 **
(0.044)
Demographic characteristics
Mental Health0.030 ***
(0.002)
−0.019 ***
(0.002)
0.028 ***
(0.002)
0.006
(0.009)
−0.029 ***
(0.009)
−0.001
(0.010)
Gender−0.092 **
(0.040)
−0.076 **
(0.030)
0.101 **
(0.041)
0.064
(0.172)
−0.145
(0.145)
0.035
(0.159)
Marital Status0.110
(0.089)
−0.053
(0.097)
0.116
(0.089)
−0.076
(0.322)
0.095
(0.399)
−0.047
(0.289)
Political Status−0.092
(0.064)
0.200 ***
(0.050)
−0.069
(0. 065)
−0.220
(0.353)
0.192
(0.246)
−0.147
(0.392)
Family income (Yuan/Year) (%) (60,000 income and above ref.)
Below 18,0000.137 *
(0.075)
−0.004
(0.063)
0.139 *
(0.075)
−0.486
(0.327)
0.070
(0.434)
−0.526 **
(0.243)
18,000~35,9990.039
(0.076)
−0.064
(0.067)
0.033
(0.076)
−1.110 **
(0.415)
0.022
(0.487)
−1.186 ***
(0.353)
36,000 and above−0.100
(0.076)
0.051
(0.067)
−0.095
(0.077)
−0.325
(0.422)
0.056
(0.502)
−0.379
(0.370)
Hukou−0.054
(0.144)
−0.067
(0.066)
0.122 *
(0.072)
−0.091
(0.374)
0.127
(0.422)
−0.027
(0.350)
Homeownership−0.130 *
(0.071)
0.050 ***
(0.068)
−0.104 *
(0.143)
1.547 **
(0.631)
−0.777
(0.587)
−1.437 **
(0.617)
Mediator variable
Subjective well-being −0.126 ***
(0.026)
−0.247 **
(0.092)
constant1.872 ***
(0.310)
2.804 ***
(0.267)
2.214 ***
(0.322)
4.448 **
(1.620)
3.815 **
(1.367)
5.496 ***
(1.543)
Observation316231623162117117117
Proportion of total effect that is mediated 0.069 0.085
Ratio of indirect of direct effect 0.064 0.079
Note: * p < 0.10; ** p < 0.05; *** p < 0.01.
Table 6. Sensitivity analysis.
VariableModel 1
Self-Rated Health
Model 2
Subjective Well-Being
Model 3
Self-Rated Health
Coef. (SE)Coef. (SE)Coef. (SE)
Mean income−0.120 ***
(0.035)
0.039 *
(0.022)
−0.115 ***
(0.035)
Built environment characteristics
Number of tertiary hospitals0.003
(0.003)
0.006 **
(0.002)
0.004
(0.003)
Point of Interest−0.000
(0.000)
−0.000 ***
(0.000)
−0.000
(0.000)
Density of Population0.000
(0.000)
0.000
(0.000)
0.000
(0.00)
Urbanization Rate−0.003
(0.003)
0.000
(0.002)
−0.003
(0.003)
Social environment characteristics
Social trust−0.084 ***
(0.023)
0.061 **
(0.022)
−0.076 ***
(0.022)
Community mutual assistance0.003
(0.019)
0.053 **
(0.021)
0.009
(0.019)
Community safety0.021
(0.028)
−0.126 ***
(0.023)
0.005
(0.028)
Community satisfaction−0.003
(0.006)
−0.006 **
(0.003)
0.002
(0.006)
Freedom of life choice−0.042 ***
(0.011)
0.086 ***
(0.008)
−0.032 **
(0.011)
Demographic characteristics
Mental Health 0.029 ***
(0.002)
−0.020 ***
(0.002)
0.028 ***
(0.002)
Gender−0.101 **
(0.039)
−0.078 **
(0.030)
−0.112 **
(0.039)
Marital status0.103
(0.087)
0.050
(0.099)
0.108
(0.087)
Political status−0.077
(0.063)
0.190 ***
(0.050)
−0.052
(0.063)
Family income (Yuan/Year) (%) (60,000 income and above ref.)
Below 18,0000.093
(0.076)
−0.023
(0.062)
0.096 *
(0.076)
18,000~35,999−0.070
(0.076)
0.068
(0.067)
−0.063
(0.076)
36,000 and above−0.114
(0.075)
0.053
(0.068)
−0.109
(0.076)
Hukou0.121 *
(0.080)
−0.144
(0.067)
0.102 *
(0.079)
Age0.010 **
(0.004)
0.014 ***
(0.003)
0.011 **
(0.004)
Age1 (55–69)0.609
(1.006)
0.872 ***
(0.103)
0.727
(1.007)
Age2 (≥70)0.491
(1.008)
0.589 ***
(0.107)
0.573
(1.009)
Homeownership−0.042
(0.141)
−0.392 ***
(0.089)
−0.092
(0.140)
Mediator variable
Subjective well-being −0.125 ***
(0.024)
constant1.334 ***
(1.056)
1.936 ***
(0.342)
1.569
(1.054)
Observation327932793279
Proportion of total effect that is mediated0.040
Ratio of indirect to direct effect0.042
Note: * p < 0.10; ** p < 0.05; *** p < 0.01.
Disclaimer/Publisher’s Note: The statements, opinions and data contained in all publications are solely those of the individual author(s) and contributor(s) and not of MDPI and/or the editor(s). MDPI and/or the editor(s) disclaim responsibility for any injury to people or property resulting from any ideas, methods, instructions or products referred to in the content.

