Abstract
The intricacies of foundation pit engineering often result in alterations to the surrounding environment, posing potential threats to the safe operation of nearby buildings and pile foundations. This study employs finite element numerical simulation to scrutinize the influence of vacuum preloading pressure, preloading duration, excavation slope ratio, excavation duration, and retaining pile wall depth on the stress and deformation of existing plain concrete pile foundations. The findings reveal that the impacts of excavation are primarily absorbed by both proximal and distal piles in relation to the pit. Moreover, elevating vacuum preloading pressure and extending the preloading duration during dewatering can lead to increased internal forces and displacement of the piles. Changes in excavation slope ratio exhibit minimal effects, while prolonged excavation duration can shift internal forces from predominantly positive to negative, with negligible impact on horizontal displacement. Importantly, augmenting the depth of the retaining pile wall embedding effectively mitigates the effects of pit excavation.
1. Introduction
In recent years, composite foundations have gained widespread application in engineering, attributed to their efficacy in augmenting foundation-bearing capacity [1] and resistance to deformation [2,3]. Particularly in soft soil regions, the utilization of composite ground stands out as a prevalent strategy to enhance overall foundation performance. Plain concrete piles emerge as a pivotal method for foundation treatment, owing to their cost-effectiveness and versatility [4]. Nevertheless, practical engineering implementation of this method encounters challenges [5], including intricate geological conditions, excavation effects, economic feasibility, and construction complexities.
The excavation of foundation pits is a commonplace construction activity in urban development; at each stage, it often brings vibrations and displacements to surrounding buildings [6], frequently encompassing dewatering and soil mass excavation. This process induces alterations in groundwater levels and stress redistribution [7] within the soil. These changes wield a substantial impact on the composite ground, causing heightened soil deformation, influencing the interaction between piles and soil, reducing bearing capacity, and, ultimately, resulting in foundation deformation and damage. Vacuum preloading is a commonly employed method for dewatering foundation pits, offering advantages such as high dewatering efficiency and reduced soil settlement [8]. However, it inevitably causes disturbances to the surrounding environment. The impact of vacuum preloading on the surrounding environment primarily manifests in two aspects: the horizontal displacement of soil outside the reinforced area leading to damage in the surrounding soil, and the lowering of groundwater levels due to vacuum preloading construction, resulting in the uneven settlement of the surrounding soil. The existence of the vacuum preloading influence zone has gained extensive attention from scholars. Most studies have focused on the extent of the influence of vacuum preloading [9] and protective measures. The magnitude of the impact of vacuum preloading on the surrounding environment is not only related to soil properties and vacuum degree [10] but also to the sealing performance of the membrane [11], vacuum preloading duration, and other factors. The research findings of numerous scholars are not consistent. The excavation of foundation pits, as a major factor inducing disasters such as decreased bearing capacity and soil instability in foundation pit engineering, has attracted extensive discussions among scholars. To investigate the impact of excavation on the surrounding environment, Wang et al. [12] conducted physical model experiments using a top-tube well foundation pit, analyzing the stress and deformation characteristics of support structures during dewatering and excavation. They found that the main factor affecting the deformation of support structures is the transition from dewatering to excavation. Gao et al. [13], through analyzing monitoring data from the excavation of an underground diaphragm wall, discovered that the surface settlement around the circular underground diaphragm wall is primarily influenced by the excavation depth. Wang et al. [14] found in the analysis of excavation disturbance on a subway crossing with a cross-shaped deep foundation pit that the interaction between the cross-shaped intersection structure and the surrounding soil is affected by the repeated unloading disturbance during excavation, soil arching effects, and changes in boundary conditions. The horizontal displacement of the retaining structure and surface settlement differed significantly from the observations of single-pit excavation. Lei et al. [15], through their study on the deformation characteristics of railway embankments near a group of excavated foundation pits, found that increasing the number of pits, reducing the distance between adjacent pits, and reducing the distance between the pits and the railway embankment can result in excessive settlement and the horizontal deformation of the embankment. In the process of excavation affecting the adjacent existing road embankment, deformation is initially caused by the excavation of the pit itself [16], followed by the deformation of the adjacent surface, adjacent existing roads, and neighboring buildings. Dmochowsk et al. [17] also introduced some solutions for securing existing buildings during excavation work. Currently, the most commonly used temporary support system is the steel prop system with push–pull props, which features rapid assembly and disassembly, as well as high prefabrication. Studies have shown that, during the excavation process of foundation pit engineering, different deformation patterns and impact rules on adjacent existing roads are observed depending on the support method, excavation depth, and geological conditions [18,19].
In summary, vacuum preloading and excavation often lead to the reduced stability of surrounding structures. The excavation depth of the foundation pit is generally recognized as a pivotal factor influencing the stability of surrounding structures [20]. Scholars have conducted extensive research on various projects and conditions in this field [21,22], and the research results indicate that the excavation position of the foundation pit [23], excavation sequence [24], excavation rate [25], and support method [26] all play important roles in the stability of excavation. Although some progress has been made in studying the impact of the surrounding environment on existing composite ground [27,28] and proposing corresponding countermeasures, most studies focus on relatively conventional site conditions. In the case of deep soft soil areas utilizing suspended pile structures, further investigation is necessary to comprehend the adverse effects of excavation on composite ground with plain concrete piles in soft soil areas, as well as to explore preventive measures. However, existing theories lack comprehensive research on this issue. Therefore, a detailed study is required to examine the impact of excavation on the composite ground with plain concrete piles, aiming to develop theoretical approaches for controlling deformation in the composite ground and minimizing the effects of foundation pits, ensuring the normal functioning of road surfaces.
This study investigates the composite foundation of plain concrete piles in the excavation project of a coastal plain in Zhuhai City. It focuses on analyzing the deformation and mechanical characteristics of the composite foundation under the influence of vacuum preloading and excavation. To address the specific soft soil conditions in the coastal area, parameters fitting Zhuhai’s soft soil characteristics were calibrated through experiments including a resonant column and triaxial consolidation drainage shear. Subsequently, a numerical model with an excellent fit and reliability was established using the finite element analysis software PLAXIS 2D Ultimate 21.01.00.479. The analysis considered various factors, including vacuum preloading pressure, preloading duration, excavation slope ratio, excavation rate, and support setting depth. The study delves into the mechanical response and displacement variation mechanisms of the composite foundation’s piles under different conditions. Furthermore, it predicts and assesses the safety of the composite foundation under the influence of vacuum preloading and excavation. The findings offer valuable guidance for the design, construction, and management of excavation projects in soft soil areas, providing new theoretical insights and references for the study of composite foundation performance in such environments.
2. Project Overview
As a coastal city, Zhuhai has an extensive distribution of coastal sedimentary soft soil, which accounts for approximately 50% to 60% of the total land area of Zhuhai. Figure 1 shows the geographical location of the research portfolio project, located in Danfeng Road, Bailong River Tail Scenic Area, Aviation Industrial Park, Jinwan District, Zhuhai City, Guangdong Province, China.
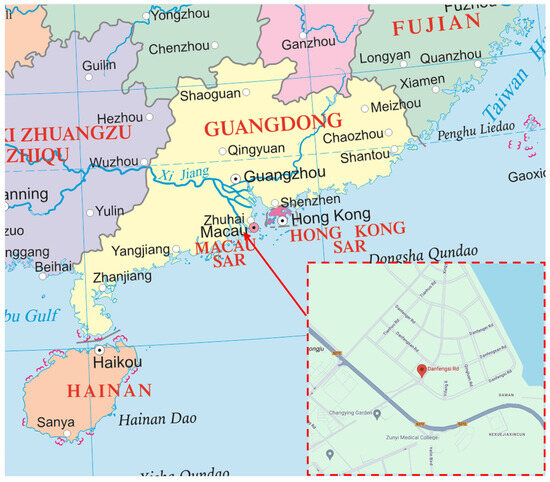
Figure 1.
Location of the considered project: Danfeng Road, Zhuhai, China.
According to the investigation data, the second phase of the Aviation Industrial Park is located in a typical soft soil zone. The average thickness of the fill soft soil on the surface exceeds 4 m, while the average thickness of silt and silty clay soft soil exceeds 25 m. The soil in this section has a low bearing capacity, high compressibility, and high moisture content, and, generally, does not meet the requirements for road construction. Ensuring an adequate subgrade bearing capacity for road construction and usage, and preventing excessive post-construction settlement or differential settlement, necessitates the treatment of such soft soil foundations.
Danfeng Road is close to the main drainage channel, and the composite foundation treatment range extends beyond the sidewalk line of Danfeng Road, adjacent to the drainage channel. According to the plan, the completion of the drainage channel takes precedence to guarantee the safety and stability of the main drainage infrastructure. Therefore, the entire section of Danfeng Road adopts composite plain concrete piles for the treatment of the soft foundation. However, owing to the considerable depth of soft soil, the piles are predominantly in a suspended state, giving rise to diverse challenges in the composite foundation of plain concrete piles in the present project. For example, serious cracking and soil erosion occurred on the road surface after the treatment of the composite foundation in the extremely soft and deep soil area during site development. There were even cases of fractures in the subgrade plain concrete piles, resulting in an excessive settlement of the road surface. Figure 2a shows an example of the fracture of the plain concrete piles due to environmental impacts in a certain project, and Figure 2b shows the cracking of the completed road surface caused by the excavation of a roadside foundation pit. Figure 2c shows the on-site image of dewatering during the excavation of the foundation pit on Danfeng Road. The excavation of the foundation pit has resulted in the partial fracture of the plain concrete pile group adjacent to the foundation pit. As a result, these piles have lost their initial bearing capacity, highlighting significant environmental disturbance and the insufficient strength of the pile.
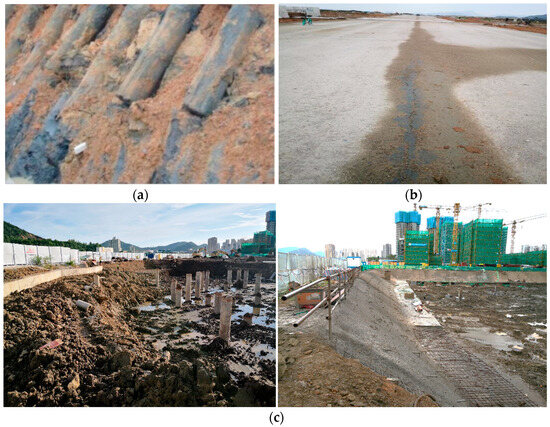
Figure 2.
Construction site images: (a) example of the fracture of plain concrete piles, (b) road surface cracking, (c) site photo of dewatering during the excavation of Danfeng Fourth Road foundation pit.
The characteristics of the pile–soil system in the composite foundation are closely related to the external loads applied during the foundation treatment [29]. Concrete piles are prone to brittle fracture. Activities such as vacuum preloading and foundation pit excavation can cause significant deformation of the road foundation, which may lead to the fracturing of the composite foundation piles, posing a serious threat to the safety and stability of the road [30]. In this research, a numerical calculation model is established based on the excavation of the foundation pit on Danfeng Road to evaluate the impact of foundation pit excavation on the composite foundation of plain concrete piles.
3. Numerical Analysis Model
3.1. Basic Information of Numerical Model
To investigate the impact of foundation pit excavation on the performance of the composite foundation of plain concrete piles, a study utilizing the finite element software PLAXIS2D was conducted on a representative cross-section in the research area. The soil layer data from the DFS5 borehole in the Danfeng Road section, as illustrated in Figure 3a, were employed to simulate the soil layers, based on the plan layout of survey points and borehole logs acquired from the engineering geological survey data. From the available borehole data, the soil layer distribution in the site mainly consists of artificial fill layers, Quaternary marine-land transitional sediment layers, residual layers, Yanshanian Phase III, weathered granite layers, and Devonian sandstone-weathered layers. Soft soils such as silt and silty clay are widely distributed and have a significant depth within the site, exhibiting poor engineering properties. A typical engineering geological profile is shown in Figure 3b.
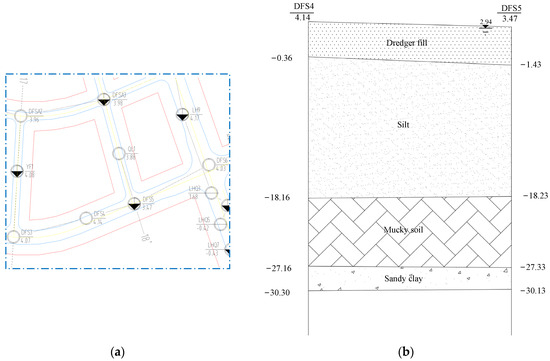
Figure 3.
(a) Plan layout of survey points, (b) typical geotechnical profile.
3.2. Model Size and Boundary Conditions
The specific model and grid division are shown in Figure 4. Due to the favorable stiffness exhibited by the sandy clay layer and the limited impact of granite layers in the lower stratum on the model’s deformation, the modeling process designated the sandy clay layer as the base layer. The upper soil layer was, consequently, employed as the representative modeling soil layer. There are four layers of the soil layer in this area, from top to bottom, including plain fill (3.47~−1.43 m), silt (−1.43~−18.23 m), mucky soil (−18.23~−27.33 m), and sandy clay (−27.33~−30.13 m). The total length of the model in the x direction is 140 m, and 33.6 m in the y direction. The bottom of sandy clay is taken as the bottom boundary of the model in the vertical direction. As shown in Figure 4, the 21 plain concrete piles are numbered sequentially from Pile 1, which is closest to the excavation pit, to Pile 21, which is furthest away from the excavation pit. The model is divided into 9614 triangular element grids, with 79,602 nodes in total, and the grids of the composite foundation are densified. The scope is indicated by the red box in Figure 4.

Figure 4.
Finite element model and mesh generation.
3.3. Simulation Procedures
The engineering project adopts a triangular pattern for the placement of plain concrete piles, with a spacing of 1.6 m between piles. The cross-sectional view of the standard treatment of the composite foundation using plain concrete piles is shown in Figure 5.

Figure 5.
Top view of the standard cross-section of the foundation.
The plain concrete pile group is simulated as embedded beam–column pile elements within PLAXIS. The embedded beam–column structure elements simplify the simulation of piles in the out-of-plane direction in the two-dimensional strain model, where piles and soil elements are connected through special interface elements in the out-of-plane direction. In three-dimensional space, the pile group is distributed in a plum blossom pattern, comprising 21 piles uniformly spaced in the plane, with a total width of 30 m. Each pile has a diameter of 0.4 m and a length of 25 m. The tops of the piles align with the top of the natural fill layer, while their bottoms are positioned in the middle of the silty clay layer. The piles are kept in a suspended state, without penetrating the soft soil layer, accurately reflecting the real conditions. To facilitate the selection of sections in the PLAXIS 2D model, the original plum blossom arrangement of piles is transformed into a rectangular layout using the modulus simplification method. Specifically, the equilateral triangular pile group, arranged with a spacing of S = 1.6 m in an interleaved pattern, is transformed into a square pile group, with equal displacement rates based on the principle of uniform displacement (Figure 6). The transformation equation is expressed as follows:
where m represents the area displacement ratio, d represents the diameter of the plain concrete piles, S represents the actual spacing between the piles, and l represents the spacing when the piles are arranged in a square pattern. By solving the equation, the spacing after transforming to a square pattern is determined to be l = 1.5 m.
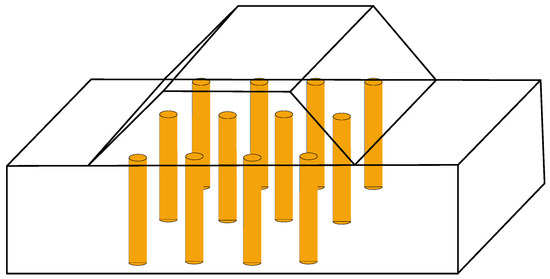
Figure 6.
Arrangement diagram of the pile group in a square pattern.
3.4. Boundary Conditions of Numerical Model
The accuracy and validity of the simulation results are intricately tied to the careful selection of the boundary conditions. Considering the soil conditions and the surrounding environment of the project, the numerical model establishes displacement and seepage boundaries as follows (Figure 7):
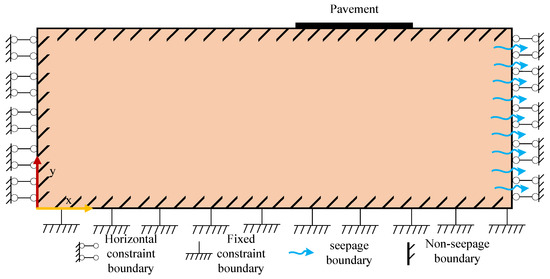
Figure 7.
Numerical simulation model boundary conditions.
- (1)
- Displacement boundary: The bottom boundary is fixed and constrained in all directions. The left and right boundaries are horizontally constrained. The top boundary is set as a free boundary, allowing for movement.
- (2)
- Seepage boundary conditions: The right boundary of the model area allows seepage, while the other three boundaries are designated as impermeable. These specified boundary conditions ensure a realistic representation of the model, accounting for its interaction with the environment, and considering both soil behavior and hydraulic conditions.
3.5. Numerical Model Material Parameters
The embedded pile element in PLAXIS 2D is used to simulate the plain concrete pile, and the parameter settings [31] for the embedded beam unit are presented in Table 1.

Table 1.
Pile parameters used in the simulations.
The model consists of four soil layers, where the fill soil layer is modeled using the Mohr–Coulomb (M-C) model, and the silt and silty clay soft soil layers are modeled using the small strain stiffness (HSS) model. In this model, the flow potential of the yield surface is intricately tied to the adopted constitutive models. The HSS model optionally uses a Matsuoka–Nakai yield surface and criterion instead of the original HS model’s Mohr–Coulomb criterion. In the HSS model, the non-associated Mohr–Coulomb potential is replaced by a Drucker–Prager potential. While the cap-type yield function remains unchanged, its potential is adjusted to the new deviatoric flow of the cone-type yield surface. The HSS model considers the small strain stiffness of the soil and accurately reflects the deformation and mechanical behavior of the soil in the construction zone under small strain conditions (10−4 to 10−6). The sand-clay retaining walls, including the sheet pile wall and cement retaining wall, are modeled using the hardening soil (HS) model. To obtain the required parameters for the HSS model, previous laboratory tests such as resonant column tests, triaxial consolidated drained shear tests, and triaxial consolidated undrained shear tests were conducted to obtain a set of HSS model parameters that are suitable for the soft soil in Zhuhai. The parameters for other structures, such as the cohesive soil isolation wall and cemented soil supporting wall, were determined based on empirical values. A summary of the material parameters is provided in Table 2.

Table 2.
Soil and structural parameters used in numerical simulation.
The simulation procedures are primarily divided into two stages: vacuum preloading and excavation of the foundation pit. In the vacuum preloading phase, a variable study was conducted on two factors: preloading pressure and preloading duration, as indicated in Table 3. In the excavation phase, a variable study was conducted on three factors: slope ratio of the excavation, excavation cycle, and depth of the pre-retaining pile wall, as indicated in Table 4. The proposed construction conditions for the standard simulation scenario are based on the data provided by the project, using the following parameters: preloading pressure of 80 kPa, preloading duration of 120 days, slope ratio of 3:6 for excavation, excavation cycle of 30 days, and pre-retaining pile wall depth of 12 m. These parameters were considered as the standard construction conditions for the simulation.

Table 3.
Simulated scenarios for vacuum preloading.

Table 4.
Excavation scenarios for the construction pit.
In the forthcoming analysis, the feasibility of the simulation results are validated, and an initial analysis is provided based on the standard simulation scenario.
In the standard working condition (T30-S3/6-D8.0), the entire simulation process is outlined in six steps:
- (a)
- Balance the ground stress: the calculation type is K0 consolidation, and the calculation type of pore water pressure uses the groundwater level to generate the initial stress field.
- (b)
- For the active concrete pile, the calculation type is the plastic calculation, and the calculation type of pore pressure uses the water table; the purpose of this step is to generate a plain concrete pile composite foundation.
- (c)
- Vacuum preloading: activate the vertical drainage line and set its pressure to −80 kPa. The calculation type uses a fluid–structure coupling calculation, and the time interval is 120 days; this step aims to simulate the vacuum preloading process in the actual project.
- (d)
- For the first excavation of the foundation pit, the calculation type used fluid–structure coupling, and the time interval was 10 days. The scope of the excavation is the filling from the surface to the initial groundwater level of −1 m. During excavation, a separation wall is generated, and shotcrete with mesh is activated for the excavated slope.
- (e)
- For the second excavation of the foundation pit, the calculation type is fluid–structure coupling, and the time interval is 10 days. The excavation range is the thickness (−1 m~−3 m) of the remaining fill layer within the scope of the foundation pit. Activate the mesh shotcrete of the excavated slope.
- (f)
- For the third excavation of the foundation pit, the calculation type is fluid–structure coupling, and the time interval is 10 days. The excavation range is from the top of the sludge layer to the bottom of the designed excavation foundation pit (−3 m~−4 m). Activate the mesh shotcrete of the excavated slope.
3.6. Simulation Results of Standard Working Conditions
3.6.1. Comparison with Field Monitoring Data
To validate the reliability of the numerical simulation, the continuous monitoring of horizontal and vertical displacements was conducted on specific points located outside the foundation pit during the actual excavation process. This monitoring aimed to capture the time history curves of the horizontal and vertical displacements for these points. The layout of the monitoring points is illustrated in Figure 8.
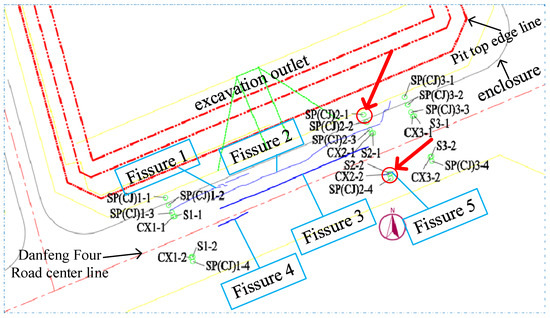
Figure 8.
Layout of monitoring points.
The reliability of the model is intended to be verified by comparing the deformation values at actual monitoring points with the corresponding simulated values in the numerical simulation model. In Figure 9a, a time history curve comparison is presented for the horizontal displacement of Pile 1 in the numerical simulation results against the horizontal displacement of monitoring point SP2-1, located near the subgrade edge at the side of the foundation pit in Figure 8, during the excavation of the foundation pit. Similarly, Figure 9b illustrates the temporal evolution of vertical displacements for Pile 1 and monitoring point CJ2-1 in response to the foundation pit excavation. The figure clearly demonstrates the excellent agreement between the monitored and simulated values of the horizontal displacement, with negligible deviations. Although the vertical displacement monitoring values exceed the simulation values, their overall trends remain consistent. This discrepancy between the simulated results and monitoring data may arise from the model’s exclusive focus on specific soil layers composed of sandy clay and above, potentially resulting in an incomplete representation of overall vertical deformation. Furthermore, practical engineering scenarios introduce variables like uneven soil distribution and varying effects from the group pile behavior, influencing the precision of vertical displacement predictions and yielding a comparatively diminished accuracy. Nevertheless, it is noteworthy that, despite these challenges, the trends of vertical displacements in both cases remain overall consistent, suggesting that the model retains commendable fitting capabilities.
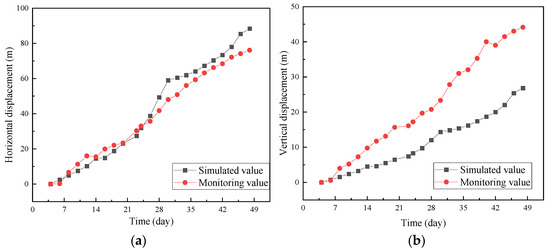
Figure 9.
Monitoring data and simulation results comparison: (a) Pile 1 horizontal displacement simulation results compared with monitoring point SP2-1; (b) Pile 1 vertical displacement simulation results compared with monitoring point CJ2-1.
3.6.2. Pile Bending Moment
According to the engineering data, the plain concrete piles are constructed using grade 42.5 ordinary Portland cement. The diameter of the piles is 40 cm, arranged in an equilateral triangle pattern with a spacing of 1.6 m. The cement strength of the pile body is C15, as shown in Figure 5. The flexural capacity of the plain concrete piles can be calculated using the expression M = σIz/y, where σ is the standard value of axial tensile strength, Iz is the moment of inertia of the section, and y is the distance from the neutral axis to the calculated section distance. Therefore, using Equation (2), the ultimate flexural strength of the plain concrete is calculated as:
The bending moment results under standard working conditions are shown in Figure 10, which shows that the pile bending moment is mainly distributed on the piles on both sides of the pile group. In the following, Pile 1 is selected as the main research and analysis object to explore the impact of foundation pit excavation and vacuum preloading on the pile under various working conditions.
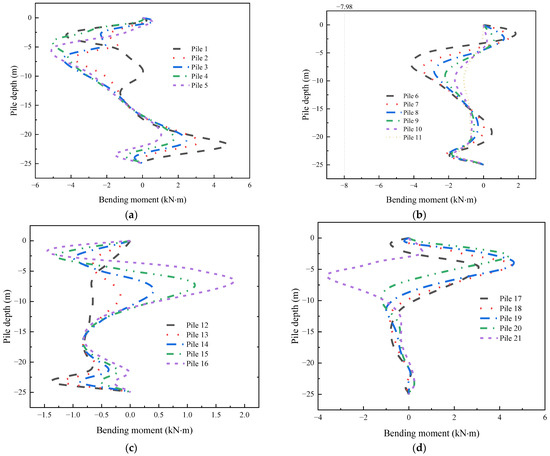
Figure 10.
Bending moment of Piles 1 to 21 under standard conditions: (a) Pile 1~5, (b) Pile 6~11, (c) Pile 12~16, (d) Pile 17~21.
The study additionally conducted a comparison of the simulation results between PLAXIS 3D and 2D, revealing minor differences in internal forces and deformations, as shown in Figure 11. To mitigate the potential computational expense associated with 3D models, the 2D models were adopted for subsequent analyses.

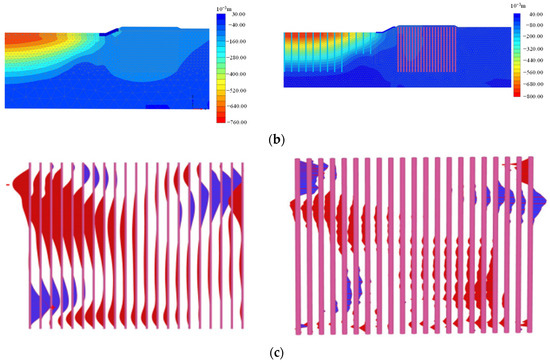
Figure 11.
Comparison of simulation results between 3D and 2D models in terms of (a) horizontal displacement, (b) vertical displacement, and (c) pile bending moment.
4. Results and Discussion
4.1. Vacuum Preloading
In the project where vacuum preloading is applied to a plain concrete composite foundation, serious crack failure has occurred. To understand the crack development pattern under vacuum preloading, the displacement of piles is compared and analyzed under different vacuum pressures and durations.
4.1.1. Effect of Vacuum Pressure
In practical applications, vacuum pressure often decreases with depth and, typically, remains below 80 kPa. A vacuum pressure of around 80 kPa is commonly utilized in vacuum preloading construction, yielding significant drainage effects. However, this considered project in Zhuhai, China, has already adopted 80 kPa as the construction pressure. In order to investigate whether increasing the pressure will exacerbate foundation deformation, we set 80 kPa as the intermediate condition and established four sets of conditions at 60, 70, 80, and 90 kPa to analyze the effects of vacuum preloading. According to the information provided by the project, the vacuum pre-pressure is considered acceptable as long as it remains below 100 kPa.
Displacement and Force Changes under Different Vacuum Pressures
The displacement changes of the No. 1 pile under different vacuum pressures are shown in Figure 12. Figure 12a shows that, in the vacuum preloading stage, the No. 1 pile body tilts to the side of the foundation pit so that the displacement at the top of the pile body has a more obvious development. In the process of the vacuum pressure increasing from 60 kPa to 90 kPa, the displacement of the No. 1 pile increases sharply, and the horizontal displacement of the pile top increases from about 0.015 m to0.023 m. This shows that the vacuum pressure plays an important role in the influence of vacuum preloading on the horizontal displacement of the pile. From the vertical displacement of Figure 12b, the vertical displacement of the pile is almost the same, and the vertical displacement of the pile changes little.
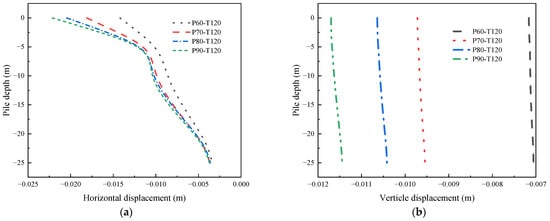
Figure 12.
The displacement of the No. 1 pile under different vacuum pressures: (a) Horizontal displacement, (b) Vertical displacement.
Figure 13 shows the maximum displacement of the No. 1 pile under different vacuum pressures. When the vacuum pressure increases from 60 kPa to 90 kPa, the minimum horizontal displacement (absolute value) of the No. 1 pile increases by 25.6%, 13.3%, and 25.6%, respectively. The maximum vertical displacement does not change more than 50 %. Figure 13 shows the change in the maximum value of the vacuum pressure from 60 kPa to 90 kPa. The maximum value of the horizontal displacement of the No. 1 pile is almost unchanged, while the minimum value (absolute value) increases, almost linearly related to the vacuum pressure. The vertical displacement of the pile fluctuates; however, the change is small.
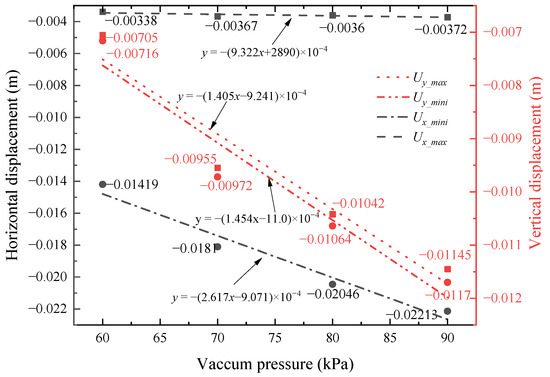
Figure 13.
The maximum displacement of No. 1 pile under different vacuum pressures.
Figure 14 illustrates the distribution of pore pressure under different vacuum pressures. As the vacuum pressure increases, the pore pressure distribution within the foundation pit consistently extends downward, and the consolidation effect becomes more prominent. Following PVD treatment in this model, there is a distinct decrease in the water level and pore pressure at the excavation site. Conversely, the soil moisture content remains at a relatively high level in the embankment adjacent to the excavation site, with groundwater seeping toward the excavation site from the plain concrete pile group.
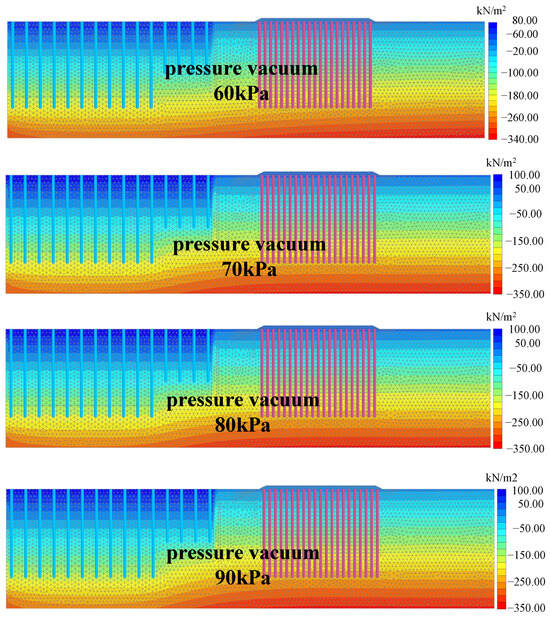
Figure 14.
Pore pressure distribution under different vacuum pressures.
Figure 15 illustrates the variations in the maximum internal forces of pile No. 1 at different vacuum pressures. As the vacuum pressure increases, the maximum shear force of pile No. 1 consistently increases. The curve depicting the maximum bending moment of the pile demonstrates a notable surge as the vacuum pressure reaches 70 kPa. However, subsequent increases in the vacuum pressure do not result in significant changes to the maximum bending moment. This suggests that, as long as the desired vacuum level is met, a design pressure difference of 70 kPa is adequate to fulfill the requirements.
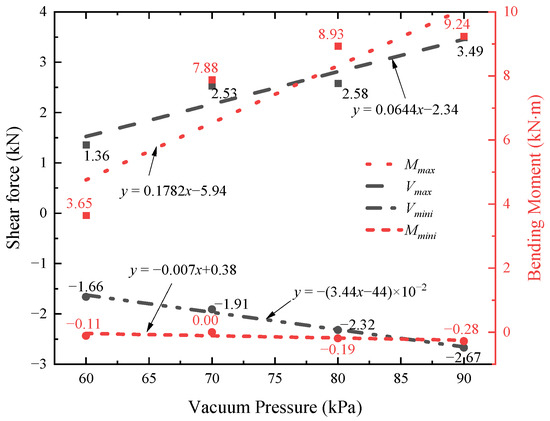
Figure 15.
The extreme values of the internal forces of pile No. 1 under different vacuum pressures.
4.1.2. Effect of Vacuum Time
Regarding the vacuum preloading duration variable, the following analysis examines the simulation results of dewatering in excavations with a vacuum preloading pressure of 80 kPa and vacuum durations of 60 days, 90 days, 120 days, and 150 days.
Displacement and Force Changes under Different Vacuum Durations
The displacement changes of the No. 1 pile under different vacuum durations are shown in Figure 16. From the results in Figure 16a, the No. 1 pile body tilts to the side of the foundation pit, resulting in a more pronounced displacement at the top of the pile body. As the vacuum duration is increased from 60 days to 150 days, the displacement of the No. 1 pile has increased significantly, and the horizontal displacement of the pile top has increased from about 0.03 m to 0.045 m, representing a 50% increase. This shows that the vacuum duration also has a great influence on the horizontal displacement of the pile in vacuum preloading. Figure 16b shows that the vertical displacement also increases obviously with the increase in vacuum time, as the vertical displacement rises from 0.011 m to 0.023 m, reflecting an increase of over 100%.
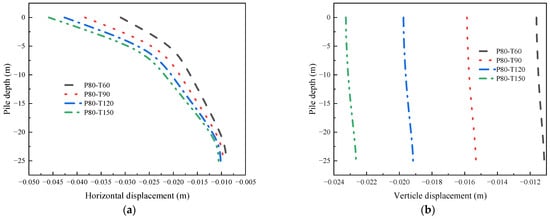
Figure 16.
The displacement of the No. 1 pile under different vacuum durations: (a) horizontal displacement; (b) vertical displacement.
In Figure 17, the maximum displacement of pile No. 1 is presented under varying vacuum durations. The foremost influence is observed in the minimum horizontal displacement, which consistently increases by 22.58%, 38.71%, and 48.39% with the progressive extension of vacuum duration. Conversely, due to the limited vertical deformation of the pile, the maximum and minimum values of the vertical displacement remain largely identical. However, a substantial increase is evident with prolonged vacuum duration, where the maximum vertical displacement rises by 36.36%, 72.73%, and 109.09%, respectively. Figure 17 portrays the maximum displacement of pile No. 1 under different vacuum durations. The maximum horizontal displacement remains nearly unchanged, while the minimum horizontal displacement (absolute value) displays a linear increase correlated with vacuum pressure. The vertical displacement of the pile exhibits an almost proportional relationship with the duration of the vacuum application.
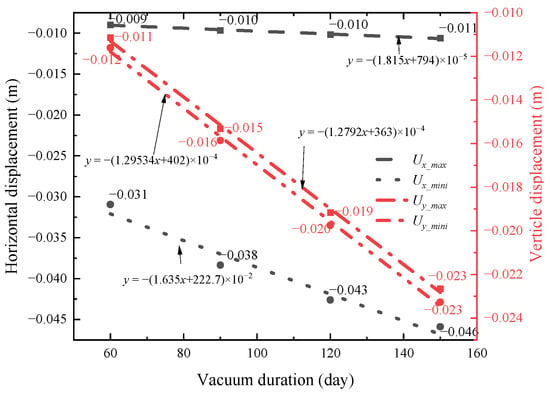
Figure 17.
Maximum displacement of No. 1 pile under different vacuum times.
Figure 18 illustrates the variations of the maximum internal forces of pile No. 1 under different vacuum durations. As the vacuum duration increases, both the maximum shear force and the maximum bending moment of pile No. 1 exhibit a gradual upward trend, while the minimum values (absolute values) continue to fluctuate.
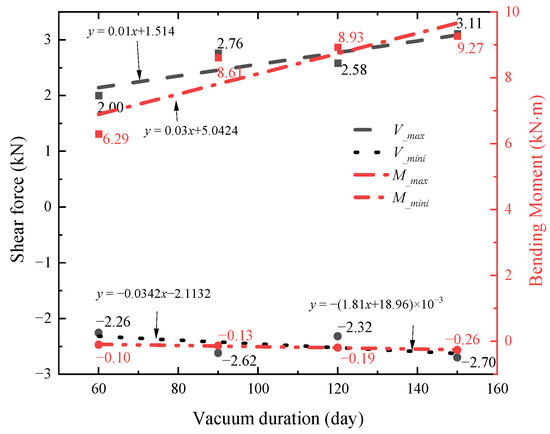
Figure 18.
The extreme values of internal forces of pile No. 1 under different vacuum durations.
4.2. Excavation of Foundation Pit
The excavation stage of a foundation pit is frequently the primary factor contributing to decreased stability in surrounding structures. Consequently, this study endeavors to explore the impacts of various factors, including the excavation slope ratio, excavation cycle, and the depth of the retaining pile wall embedding, on the composite ground of unreinforced concrete from multiple perspectives during the excavation stage.
4.2.1. Influence Analysis of Different Slope Ratio
Slope excavation is a commonly employed technique to mitigate the impact of foundation pit excavation on surrounding structures. Altering the slope ratio of the excavation can effectively modify its effects on nearby buildings. The choice of an appropriate slope ratio is crucial for ensuring the protection and reinforcement of engineering facilities. This section provides a comprehensive analysis of the influence of the slope ratio on the foundation pit, examining the operational conditions associated with different slope ratios.
For the excavation slope ratio, three groups of working conditions were set with an excavation duration of 30 days, a retaining pile wall embedding depth of 8 m, and slope ratios of 3:5, 3:6, and 3:7. The following analysis compares and analyzes the pile forces and deformations of the composite ground under these three working conditions.
Internal Force Variation under Different Slope Ratios
Figure 19 illustrates the shear force and bending moment of pile No. 1 under various slope ratios. The figure indicates that the change in slope ratio has minimal impact on the internal forces of pile No. 1. Across the three slope ratios, the shear force of pile No. 1 remains nearly constant, while the bending moment tends to decrease, particularly in the upper part of the pile, with a reduction in slope ratio.
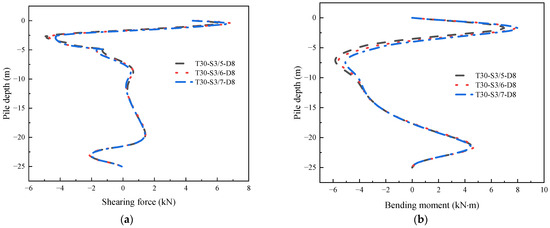
Figure 19.
The internal force of the No. 1 pile under different slope ratios: (a) shear force; (b) bending moment.
Table 5 presents the maximum and minimum shear forces of pile No. 1 for various slope ratios. The data reveals that, as the slope ratio decreases, the maximum shear force of pile No. 1 exhibits an increase of 12.06% and 17.55%, corresponding to values of 5.64 kN and 6.63 kN, respectively. Conversely, the minimum shear force (absolute value) shows a continuous decrease from 4.69 kN to 4.40 kN, reflecting a reduction of 3.84% and 6.18%, respectively.

Table 5.
The maximum internal force of No. 1 pile under different slope ratios.
According to Table 5, the maximum and minimum bending moments of pile No. 1 vary with different slope ratios. As the slope ratio increases, the maximum bending moment of pile No. 1 experiences an increase of 9.81% and 15.63%, compared to the 3:5 slope ratio. Notably, at a slope ratio of 3:7, the bending moment of pile No. 1 reaches 7.99 kN·m, surpassing the maximum bending moment tolerance for plain concrete. Consequently, under this slope ratio, there is a risk of fracture for pile No. 1. Conversely, the minimum bending moment (absolute value) demonstrates a decreasing trend, with reductions of 6.16% and 13.18%, respectively.
Displacement Changes under Different Slope Ratios
Similarly, Figure 20 depicts the horizontal and vertical displacements of pile No. 1 under various slope ratios, and the results align with the internal force curve. Different slope ratios exert a minimal impact on both horizontal and vertical displacements, mirroring real-world scenarios. Decreasing the slope ratio results in reduced soil disturbance, active earth pressure, and horizontal displacement of the pile. The vertical displacement experiences only a 5% increase when transitioning from a 3:5 to a 3:7 slope ratio.
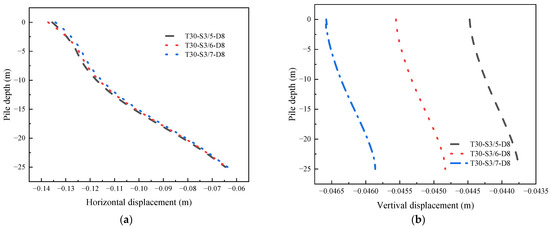
Figure 20.
The displacement of the No. 1 pile under different slope ratios: (a) horizontal displacement; (b) vertical displacement.
4.2.2. Influence Analysis of Different Front Retaining Pile Wall Embedded Depths
Regarding the depth of retaining pile wall embedding, four groups of working conditions were simulated with an excavation duration of 30 days, a slope ratio of 3:6, and retaining pile wall embedding depths of 6 m, 8 m, 10 m, and 12 m. Based on the simulation results of these four working conditions, the following analysis compares and analyzes the variations in internal forces and displacements of the piles at different depths of retaining pile wall embedding.
Internal Force Analysis of Different Front Retaining Pile Wall Embedded Depths
The shear force of the No. 1 pile under different depths of the front retaining pile wall is shown in Figure 21a. As the depth of the front retaining pile wall increases, the shear curve in the upper section of the pile remains relatively consistent, while the maximum shear force value in the lower section progressively shifts downward. This phenomenon can be attributed to the constant actual excavation depth of the foundation pit, which results in minimal changes to the maximum shear force generated by the pile body. The deepening of the front retaining pile wall depth enhances the stability of the soil surrounding the pile along the depth direction, leading to a slight displacement of the extreme points in the internal force distribution of the pile body. As shown in Figure 21b, similarly, the bending moment of the pile also exhibits a similar pattern to the shear force at different depths of the front retaining pile wall. The bending moment in the upper section remains relatively unchanged, while only the bending moment in the lower section experiences an offset. However, when considering the overall distribution, the shear force extreme points predominantly occur at depths from 0 to 5 m, while the bending moment extreme points are observed at depths from 2 to 4 m and 6 to 9 m.
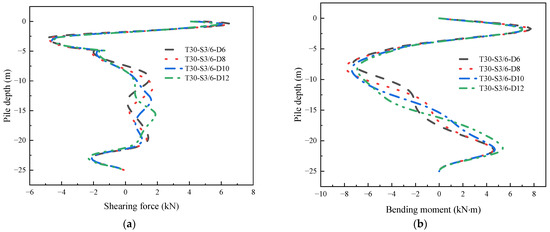
Figure 21.
The internal force of the No. 1 pile under different depths of the front retaining pile wall: (a) shear force; (b) bending moment.
Figure 22 illustrates the maximum internal forces of pile No. 1 under different depths of the front retaining pile wall. The diagram indicates that, with an increase in the depth of the front retaining pile wall, the shear force (absolute value) of pile No. 1 continuously decreases, while the bending moment increases to a certain extent, except for its minimum value (absolute value), and then decreases continuously. This observation signifies that the depth of the retaining pile wall effectively isolates the influence of the foundation pit excavation on the internal forces of plain concrete piles. In practical engineering, referring to the simulation results to increase the relevant reinforcement of the front retaining pile wall to reduce the influence of foundation pit excavation on plain concrete piles is necessary.
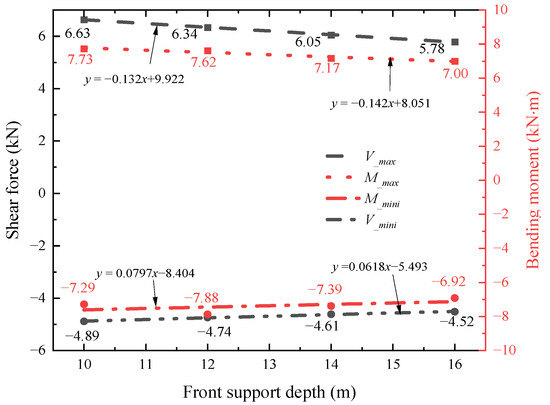
Figure 22.
Maximum internal force of the No. 1 pile under different depths of the front retaining pile wall.
Displacement of Front Retaining Pile Wall at Different Depths
The horizontal displacement of the No. 1 pile under different depths of the front retaining pile wall is shown in Figure 23a. From the results in the diagram, the horizontal displacement curve of the No. 1 pile under different depths of the front retaining pile wall changes weakly, which is consistent with the internal force law analyzed before, that is, the actual excavation depth of the foundation pit does not change, and the increase in the depth of the front retaining pile wall only further improves the stability of the soil around the lower part of the pile on the original basis. The vertical displacement of the No. 1 pile is shown in Figure 23b. The front retaining pile wall depth increases from 10 m to 16 m, and the vertical displacement increases by about 10%.
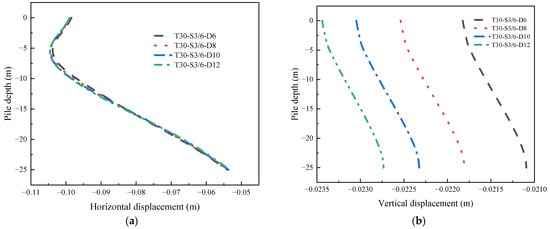
Figure 23.
The displacement of the No. 1 pile under different depths of the front retaining pile wall: (a) horizontal displacement; (b) vertical displacement.
4.2.3. Influence Analysis of Different Excavation Periods
The excavation period is a crucial factor that demands careful consideration in foundation pit excavation. Altering the excavation period not only impacts the overall project schedule but also influences the stability of surrounding structures. A rapid excavation may lead to excessive disturbance to engineering facilities, while a slow pace can impede the entire schedule. Therefore, selecting a reasonable excavation period is essential. The forthcoming analysis delves into excavation periods of 10, 20, 30, 60, and 90 days, examining changes in internal forces and pile displacements to offer practical insights for engineering applications.
Internal Force Variation under Different Excavation Periods
Figure 24 displays the variations in the internal forces of plain concrete piles under different excavation periods. As the excavation period increases, the maximum shear force and bending moment exhibit a slight upward trend initially, followed by a subsequent decrease. On the other hand, the minimum value (absolute value) of the internal forces shows a consistent increase.
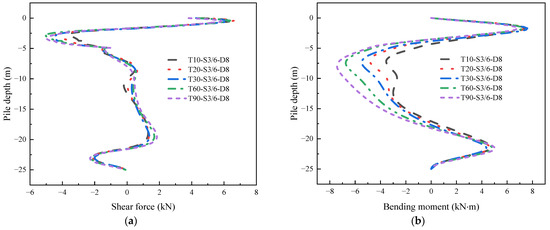
Figure 24.
The internal force of the No. 1 pile under different excavation periods: (a) shear force; (b) bending moment.
Figure 25 illustrates the maximum shear force of pile No. 1 under different excavation rates. As the excavation time extends, the maximum shear force initially exhibits a slight upward trend and, subsequently, decreases continuously. Specifically, from 10 days to 20 days, it increases by 3.1%. From 20 days to 30 days, there is almost no change. However, from 30 days to 90 days, the maximum shear force decreases by 6.38% and 13.68%, respectively. Conversely, the minimum shear force (absolute value) increases over time, with increments of 18%, 28.41%, 36.51%, and 43.96%, respectively.
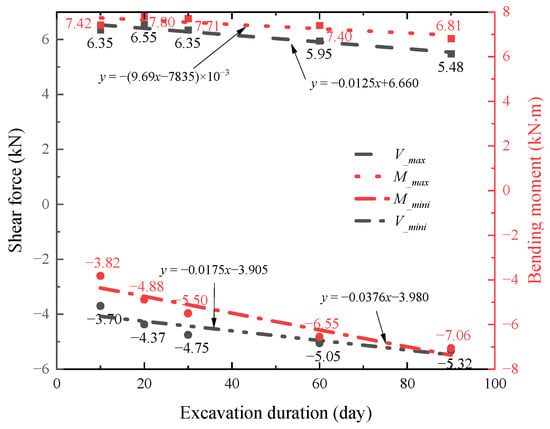
Figure 25.
Maximum internal force of the No. 1 pile under different excavation periods.
In Figure 25, the maximum bending moment of pile No. 1 initially increases from 10 days to 20 days of excavation time but then decreases as the excavation time continues to extend. Compared to the initial stage, it experienced an increase of 5.14% and 3.87%, respectively, followed by a subsequent decrease of 0.34% and 8.28%. On the other hand, the minimum value (absolute value) of the bending moment shows a consistent increase with the increase in excavation time, with increments of 27.75%, 44.13%, 71.60%, and 84.93%, respectively. The changes in the maximum value of the bending moment are depicted in Figure 25.
Displacement Changes under Different Excavation Periods
In Figure 26a, the horizontal displacement under different excavation periods reveals that, as the excavation period deepens, the pile’s horizontal displacement curve gradually shifts towards the excavation side of the foundation pit, particularly at a depth from 5 to 8 m. The variation in the excavation rate has a minimal impact on the horizontal displacement of the pile. This can be attributed to the fact that the depth of the foundation pit remains unchanged, and an extended excavation period leads to soil consolidation effects, which, consequently, affect the horizontal displacement. This observation is further supported by the changing pattern of vertical displacement, as depicted in Figure 26b. The vertical displacement of pile No. 1 exhibits significant changes with increasing excavation periods. This phenomenon primarily arises from the consolidation of the soil, which deepens the vertical settlement and subsequently drives the vertical displacement of the pile to further increase.
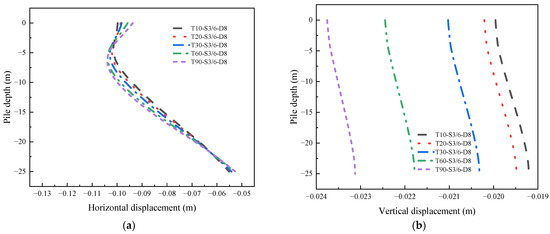
Figure 26.
The displacement of the No. 1 pile under different excavation periods: (a) horizontal displacement; (b) vertical displacement.
The maximum and minimum displacement of the No. 1 pile under different excavation periods in Figure 27 shows that the horizontal displacement changes slightly and the vertical displacement increases only to a certain extent under different excavation rates. When the excavation period increases from 10 days to 90 days, the maximum (absolute value) of vertical displacement increases by 1.46%, 5.78%, 13.38%, and 20.35%, respectively, compared with the initial stage, while the minimum (absolute value) increases by 1.25%, 5.36%, 12.47%, and 19.04%, respectively, compared with the initial stage. The maximum value of the vertical displacement is similar to the change range of the minimum value, which corresponds to the fact that the pile does not deform in the vertical direction.
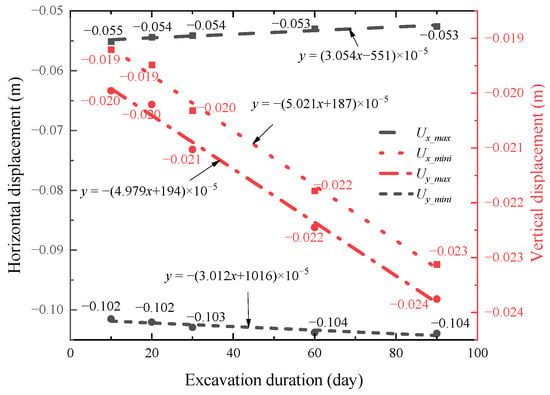
Figure 27.
Maximum and minimum displacement changes of the No. 1 pile under different excavation periods.
4.3. Recommendations for Enhancing Composite Foundation Stability
The aforementioned study demonstrates that the vacuum pressure and duration during the vacuum preloading phase have a substantial impact on the composite foundation of plain concrete piles. Consideration of actual conditions and engineering experience is crucial when determining the vacuum pressure difference and duration. During the excavation phase, numerical simulation results indicate that the slope ratio has a negligible effect on the composite foundation at the excavation depth, requiring only a brief treatment. The internal force of the plain concrete pile body undergoes significant changes during different excavation periods (i.e., excavation rate), primarily due to the dissipation of pore water pressure in the soil and soil consolidation. Setting the depth of the retaining pile wall can effectively mitigate the impact of the excavation. A comprehensive consideration of the actual conditions and cost implications is recommended when determining the depth of the retaining pile wall before any increase.
5. Conclusions
This study presents a modeling analysis of the potential effects of vacuum preloading and excavation stages on plain concrete pile composite foundations in practical engineering projects. Different scenarios were set up to investigate these effects, and the results were compared with actual monitoring data to validate the reliability of the model. Based on the results from the 2D model, the data obtained from simulating the vacuum preloading and excavation stages on plain concrete piles were organized and analyzed. The variations in internal forces and displacements of pile No. 1 under different scenarios were quantitatively analyzed. The main conclusions are as follows:
- (1)
- The simulation results reveal that plain concrete piles experience significant internal forces on their sides, while the forces are relatively smaller in the middle. Additionally, the impact on the piles intensifies as they approach the side of the foundation pit.
- (2)
- During the vacuum preloading stage, both the vacuum pressure and vacuum duration have a substantial impact. Specifically, the effect on the plain concrete pile composite foundation is positively correlated with both the vacuum pressure and vacuum duration. However, the influence of vacuum pressure is more pronounced compared to the vacuum duration. In other words, higher vacuum pressures tend to have a more significant effect on the composite foundation.
- (3)
- Based on the analysis of the simulated working conditions, the internal forces and displacements of the piles exhibit minimal changes under different slope ratios. However, when considering various depths of the front retaining pile wall, the shear forces and bending moments of the piles decrease as the depth of the front retaining pile wall increases. The front retaining pile wall plays a significant role in isolating the impact of foundation pit excavation on plain concrete piles. Furthermore, different excavation periods have a noticeable effect on the internal forces of plain concrete piles, while the horizontal displacement remains relatively unaffected. However, the vertical displacement tends to increase as the excavation period extends.
This paper addresses the issue of potential reduction in the bearing capacity of composite foundation piles due to excavation in foundation pit engineering. It analyzes the developmental law of internal force and the displacement of composite foundation piles under various working conditions such as excavation and slope ratio, providing valuable insights for engineering construction. However, further elucidation of the extent of reinforcement failure of the pile body under different levels of displacement and internal force, as well as issues such as pile instability and fracture, is essential during the excavation process. Furthermore, there is a need for more in-depth research on the impact of single pile failure on the overall stability of the pile group and the variation in the overall bearing capacity of the composite foundation before and after instability.
Author Contributions
Methodology, X.L.; Software, S.C.; Formal analysis, F.Y.; Resources, J.L.; Writing—original draft, D.L. and F.Y.; Writing—review & editing, Z.H.; Supervision, Z.H. and J.L.; Project administration, D.L. and S.C.; Funding acquisition, D.L. All authors have read and agreed to the published version of the manuscript.
Funding
The research described was funded by the Guangdong Provincial Natural Science Foundation of China (Grant No. 2023A1515012140), Guangdong Provincial Department of Housing and Urban-Rural Development Science and Technology Innovation Plan Project (Grant No. 2022-K4-231814; 2022-K4-065552).
Data Availability Statement
The original contributions presented in the study are included in the article, further inquiries can be directed to the corresponding authors.
Conflicts of Interest
The authors declare no conflict of interest.
References
- Lv, Y.; Liu, H.; Ding, X.; Kong, G. Field Tests on Bearing Characteristics of X-Section Pile Composite Foundation. J. Perform. Constr. Facil. 2012, 26, 180–189. [Google Scholar] [CrossRef]
- Haldar, S.; Babu, G.L.S. Failure Mechanisms of Pile Foundations in Liquefiable Soil: Parametric Study. Int. J. Geomech. 2010, 10, 74–84. [Google Scholar] [CrossRef]
- Yao, J.; Wu, C.; Liu, X.; Feng, K. Effect of Different Interlayers of Cement Concrete Pavements on Vibration and Anti-Erosion of Bases. J. Test. Eval. 2015, 43, 434–442. [Google Scholar] [CrossRef]
- Zhong-zhi, Y.E. Study on Application of Plain Concrete Pile Composite Foundation in the Treatment of Soft Soil Foundation. Constr. Technol. 2022, 117–119. [Google Scholar]
- Wu, J.; Ye, S.; Wang, Z.; Yang, D. Application and Automatic Monitoring and Analysis of Hybrid Support Structure in Ultra-DEEP Foundation Pit Engineering in the Lanzhou Area under Complex Environmental Conditions. Water 2023, 15, 1335. [Google Scholar] [CrossRef]
- Rybak, J.; Ivannikov, A.; Kulikova, E.; Żyrek, T. Deep Excavation in Urban Areas-Defects of Surrounding Buildings at Various Stages of Construction. MATEC Web Conf. 2018, 146, 02012. [Google Scholar] [CrossRef][Green Version]
- Zheng, J.J.; Abusharar, S.W.; Wang, X.Z. Three-Dimensional Nonlinear Finite Element Modeling of Composite Foundation Formed by CFG-Lime Piles. Comput. Geotech. 2008, 35, 637–643. [Google Scholar] [CrossRef]
- Chu, J.; Yan, S.W.; Yang, H. Soil Improvement by the Vacuum Preloading Method for an Oil Storage Station. Geotechnique 2000, 50, 625–632. [Google Scholar] [CrossRef]
- Zhu, W.; Yan, J.; Yu, G. Vacuum Preloading Method for Land Reclamation Using Hydraulic Filled Slurry from the Sea: A Case Study in Coastal China. Ocean Eng. 2018, 152, 286–299. [Google Scholar] [CrossRef]
- Saowapakpiboon, J.; Bergado, D.T.; Youwai, S.; Chai, J.C.; Wanthong, P.; Voottipruex, P. Measured and Predicted Performance of Prefabricated Vertical Drains (PVDs) with and without Vacuum Preloading. Geotext. Geomembr. 2010, 28, 1–11. [Google Scholar] [CrossRef]
- Wang, P.; Yu, F.; Zhou, Y.; Wang, J. Effect of a Sealed Connector on the Improvement of Dredged Slurry under Vacuum Preloading. Proc. Inst. Civ. Eng. Eng. 2020, 173, 254–261. [Google Scholar] [CrossRef]
- Wang, R.S.; Guo, C.C.; Lin, P.Y.; Wang, F.M. Excavation Response Analysis of Prefabricated Recyclable Support Structure for Water-Rich Silt Foundation Pit. Yantu Lixue/Rock Soil Mech. 2023, 44, 843–853. [Google Scholar]
- Gao, X.; Tian, W.; Li, J.; Qi, H.; Li, S.; Zhang, Z. Research on the Stress and Deformation Characteristics of Circular Foundation Pit during Excavation in Sand Soil. Adv. Mater. Sci. Eng. 2023, 2023, 3008695. [Google Scholar] [CrossRef]
- Wang, S.; Yang, B.; Dong, F.; Maxim, M.; Zhang, Z. Determination of the Influence of the Disturbance Caused by Traversing Cross-Type Deep Foundation Pit Excavations. Sustainability 2023, 15, 1130. [Google Scholar] [CrossRef]
- Lei, H.; Zhan, B.; Feng, S.; Amin, M. Influence of Foundation Pit Groups’ Excavation on the Deformation Characteristics of Adjacent Railway Subgrade and Protection Measures. Geotech. Geol. Eng. 2023, 41, 3877–3895. [Google Scholar] [CrossRef]
- Wang, D.L.; Wang, L. Stability Calculation of Unsymmetrical Loaded Foundation Pit Adjacent to Highway. Electron. J. Geotech. Eng. 2015, 20, 3575–3588. [Google Scholar]
- Dmochowski, G.; Szolomicki, J. Technical and Structural Problems Related to the Interaction between a Deep Excavation and Adjacent Existing Buildings. Appl. Sci. 2021, 11, 481. [Google Scholar] [CrossRef]
- Miao, L.; Wang, F.; Lv, W. A Simplified Calculation Method for Stress Concentration Ratio of Composite Foundation with Rigid Piles. KSCE J. Civ. Eng. 2018, 22, 3263–3270. [Google Scholar] [CrossRef]
- Zhang, D.; Li, J.; Meng, Z.; Han, G.; Wang, Z.; Guo, K.; Liu, M.; Huang, F.; Zhu, W.; Zhang, Y. Computer Safety Analysis and Research of Electrified Subway Deep Foundation Pit Excavation. J. Phys. Conf. Ser. 2021, 2033, 012132. [Google Scholar] [CrossRef]
- Gao, X.; Tian, W.P.; Zhang, Z. Analysis of Deformation Characteristics of Foundation-Pit Excavation and Circular Wall. Sustainability 2020, 12, 3164. [Google Scholar] [CrossRef]
- Zhang, X.; Ou, X.; Yang, J.; Fu, J. Deformation Response of an Existing Tunnel to Upper Excavation of Foundation Pit and Associated Dewatering. Int. J. Geomech. 2017, 17, 04016112. [Google Scholar] [CrossRef]
- Tan, Y.; Wang, D. Characteristics of a Large-Scale Deep Foundation Pit Excavated by the Central-Island Technique in Shanghai Soft Clay. I: Bottom-Up Construction of the Central Cylindrical Shaft. J. Geotech. Geoenviron. Eng. 2013, 139, 1875–1893. [Google Scholar] [CrossRef]
- Mitew-Czajewska, M. A Study of Displacements of Structures in the Vicinity of Deep Excavation. Arch. Civ. Mech. Eng. 2019, 19, 547–556. [Google Scholar] [CrossRef]
- Eunsu, S.; Shahin, H.M.; Nakai, T.; Hinokio, M.; Yamamoto, M. Ground Behavior Due to Tunnel Excavation with Existing Foundation. Soils Found. 2006, 46, 189–207. [Google Scholar]
- Tang, X.T.H. Plaxis Finite Element Modeling and Analysis of Soil Nailing Support for Deep Foundation Pit. Front. Soc. Sci. Technol. 2019, 1, 135–139. [Google Scholar]
- Zumrawi, M.M.E.; El-Amin, A. Importance of Deep Excavation Support and Its Influence on Adjacent Buildings. In Proceedings of the 7th Annual Conference for Postgraduate Studies and Scientific Research Basic Sciences and Engineering Studies—University of Khartoum, Khartoum, Sudan, 20–23 February 2016; Volume 1. [Google Scholar]
- Li, G.; Su, T.; Zhou, C.; Li, L.; Xiong, L. Experimental Study on Bearing Capacity of Composite Foundation with Plain Concrete Piles Reinforced by Border Piles. Yantu Gongcheng Xuebao/Chin. J. Geotech. Eng. 2023, 45, 2624–2633. [Google Scholar]
- Li, P. On the Application of Screw Pile Composite Foundation for High-Speed Railway in Huanghuai Alluvial Plain Area. Subgrade Eng. 2024, 1–7. [Google Scholar]
- Wang, L.; Zhao, Q.; Mao, J.; Wu, J.; Guo, F. Bearing Capacity and Simplified Calculation Approach for Large-Diameter Plain-Concrete Piles. Arab. J. Geosci. 2021, 14, 1480. [Google Scholar] [CrossRef]
- Yan, J.; Wang, Q.; Zhang, J. Environmental Influence of Vacuum Preloading Dredging Project. Procedia Environ. Sci. 2010, 2, 1613–1621. [Google Scholar] [CrossRef]
- Haisheng, L. Numerical Analysis of Large Diameter Plain Concrete Piles Composite Foundation Based on Plaxis. Railw. Constr. Technol. 2016, 9, 109–112. [Google Scholar]
Disclaimer/Publisher’s Note: The statements, opinions and data contained in all publications are solely those of the individual author(s) and contributor(s) and not of MDPI and/or the editor(s). MDPI and/or the editor(s) disclaim responsibility for any injury to people or property resulting from any ideas, methods, instructions or products referred to in the content. |
© 2024 by the authors. Licensee MDPI, Basel, Switzerland. This article is an open access article distributed under the terms and conditions of the Creative Commons Attribution (CC BY) license (https://creativecommons.org/licenses/by/4.0/).