


Numerical Investigation on Strengthening of Steel Beams for Corrosion Damage or Web Openings Using Carbon Fiber Reinforced Polymer Sheets


Abstract
1. Introduction
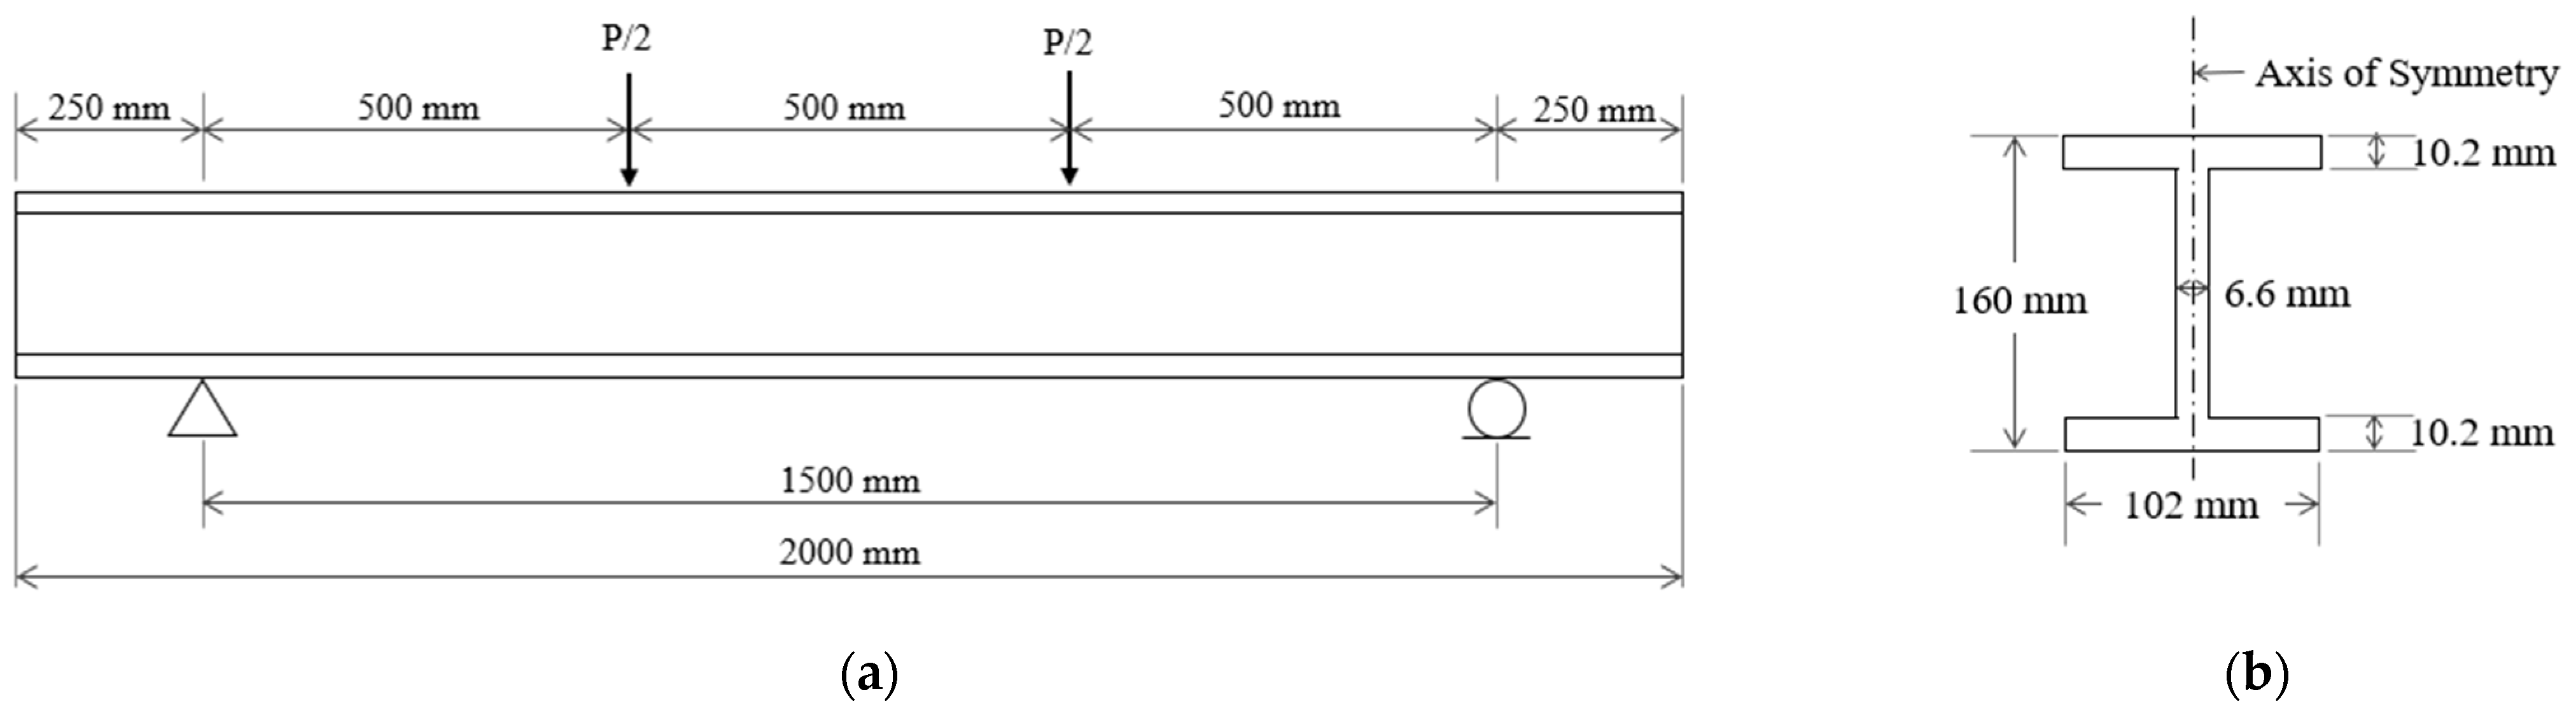
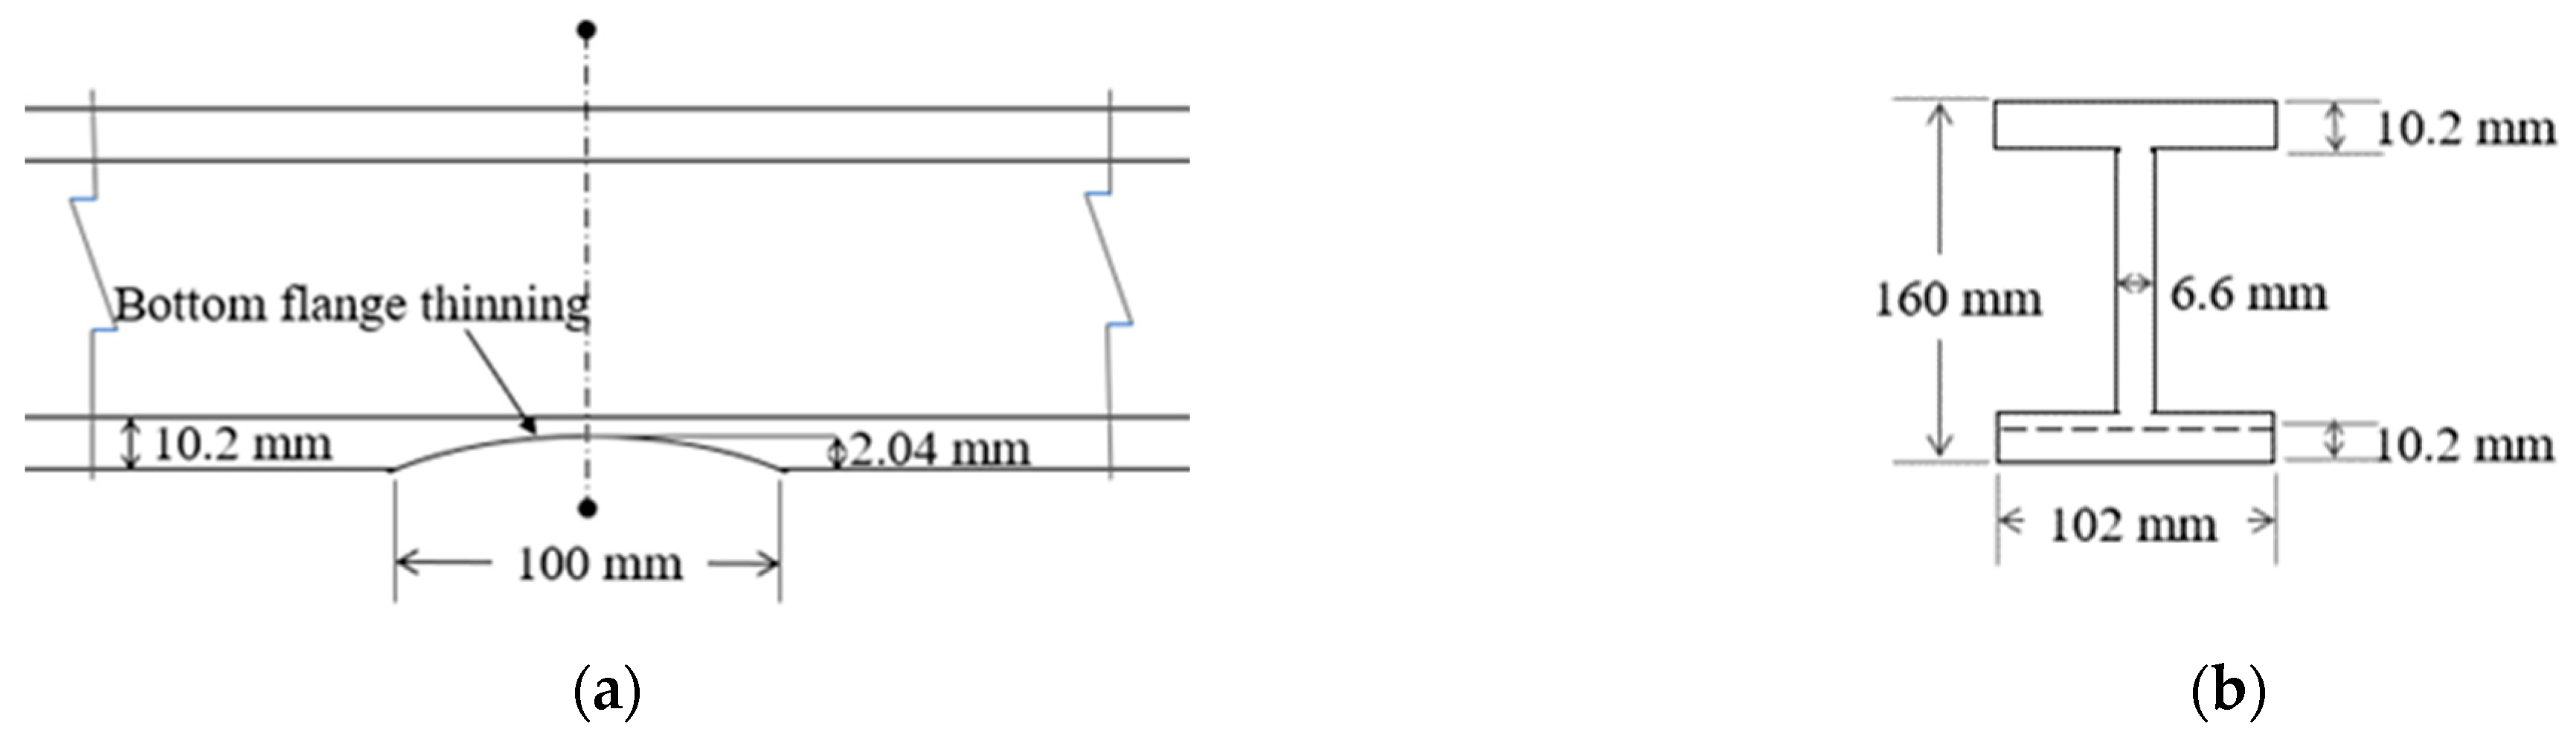
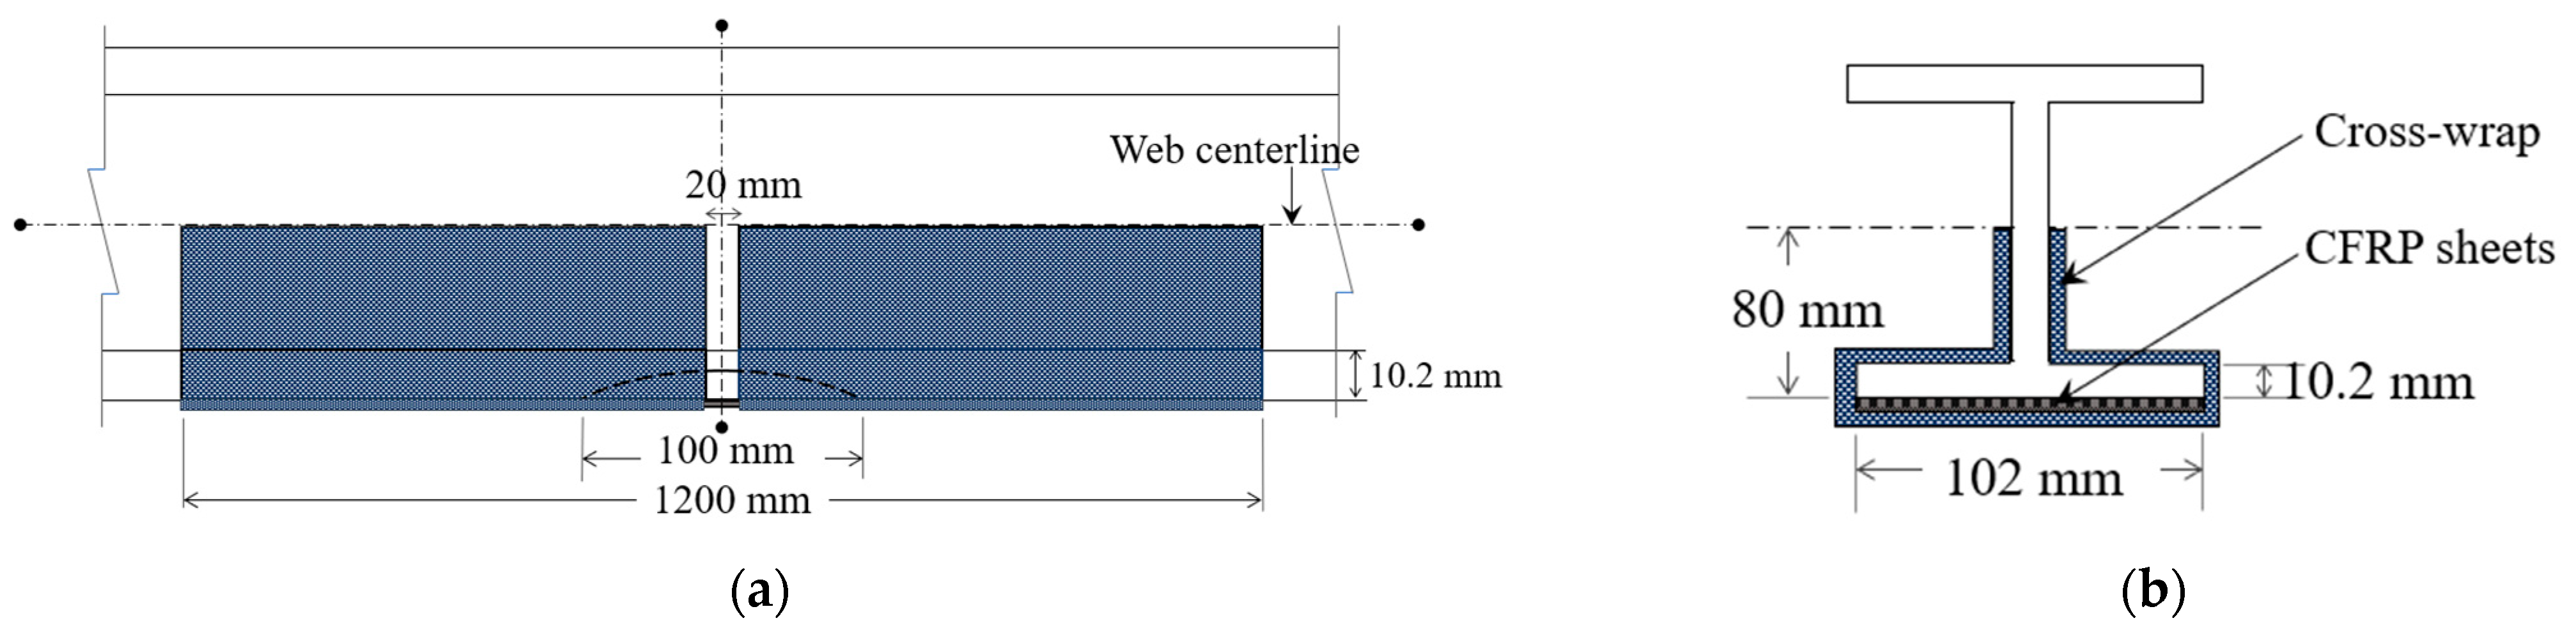
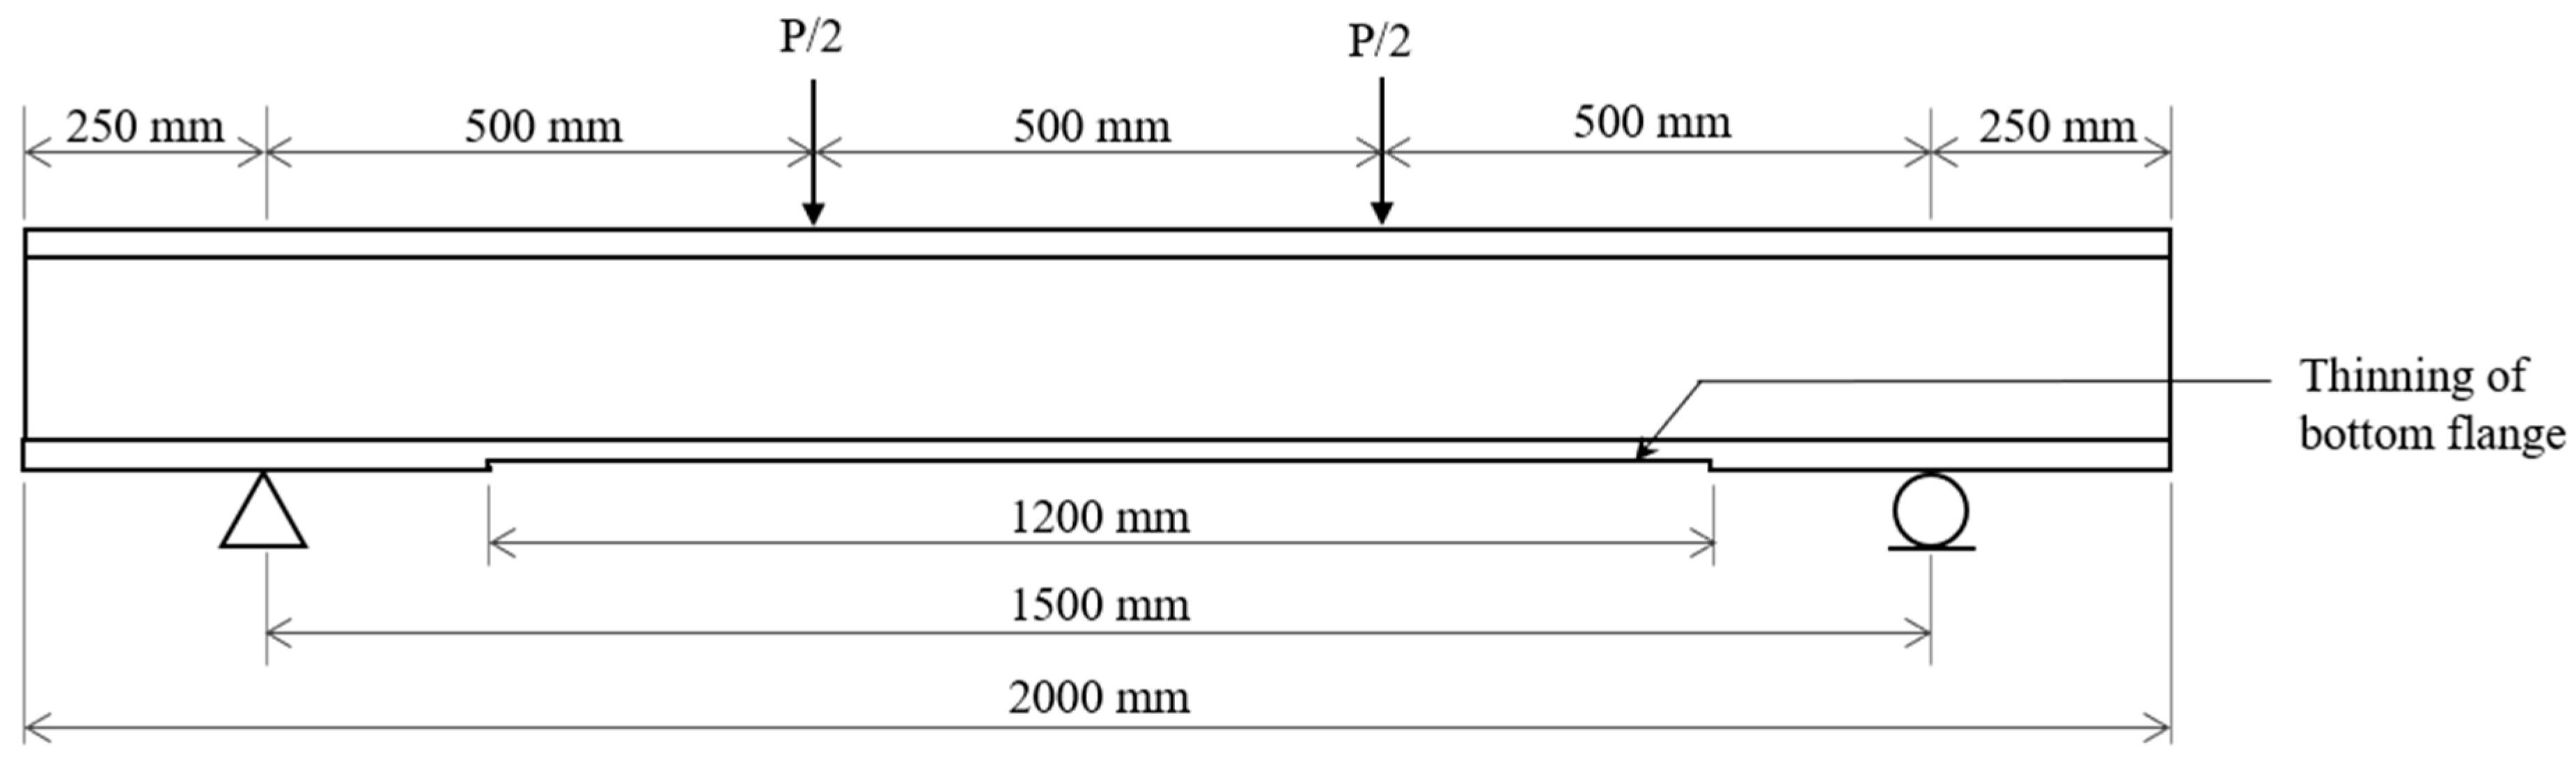
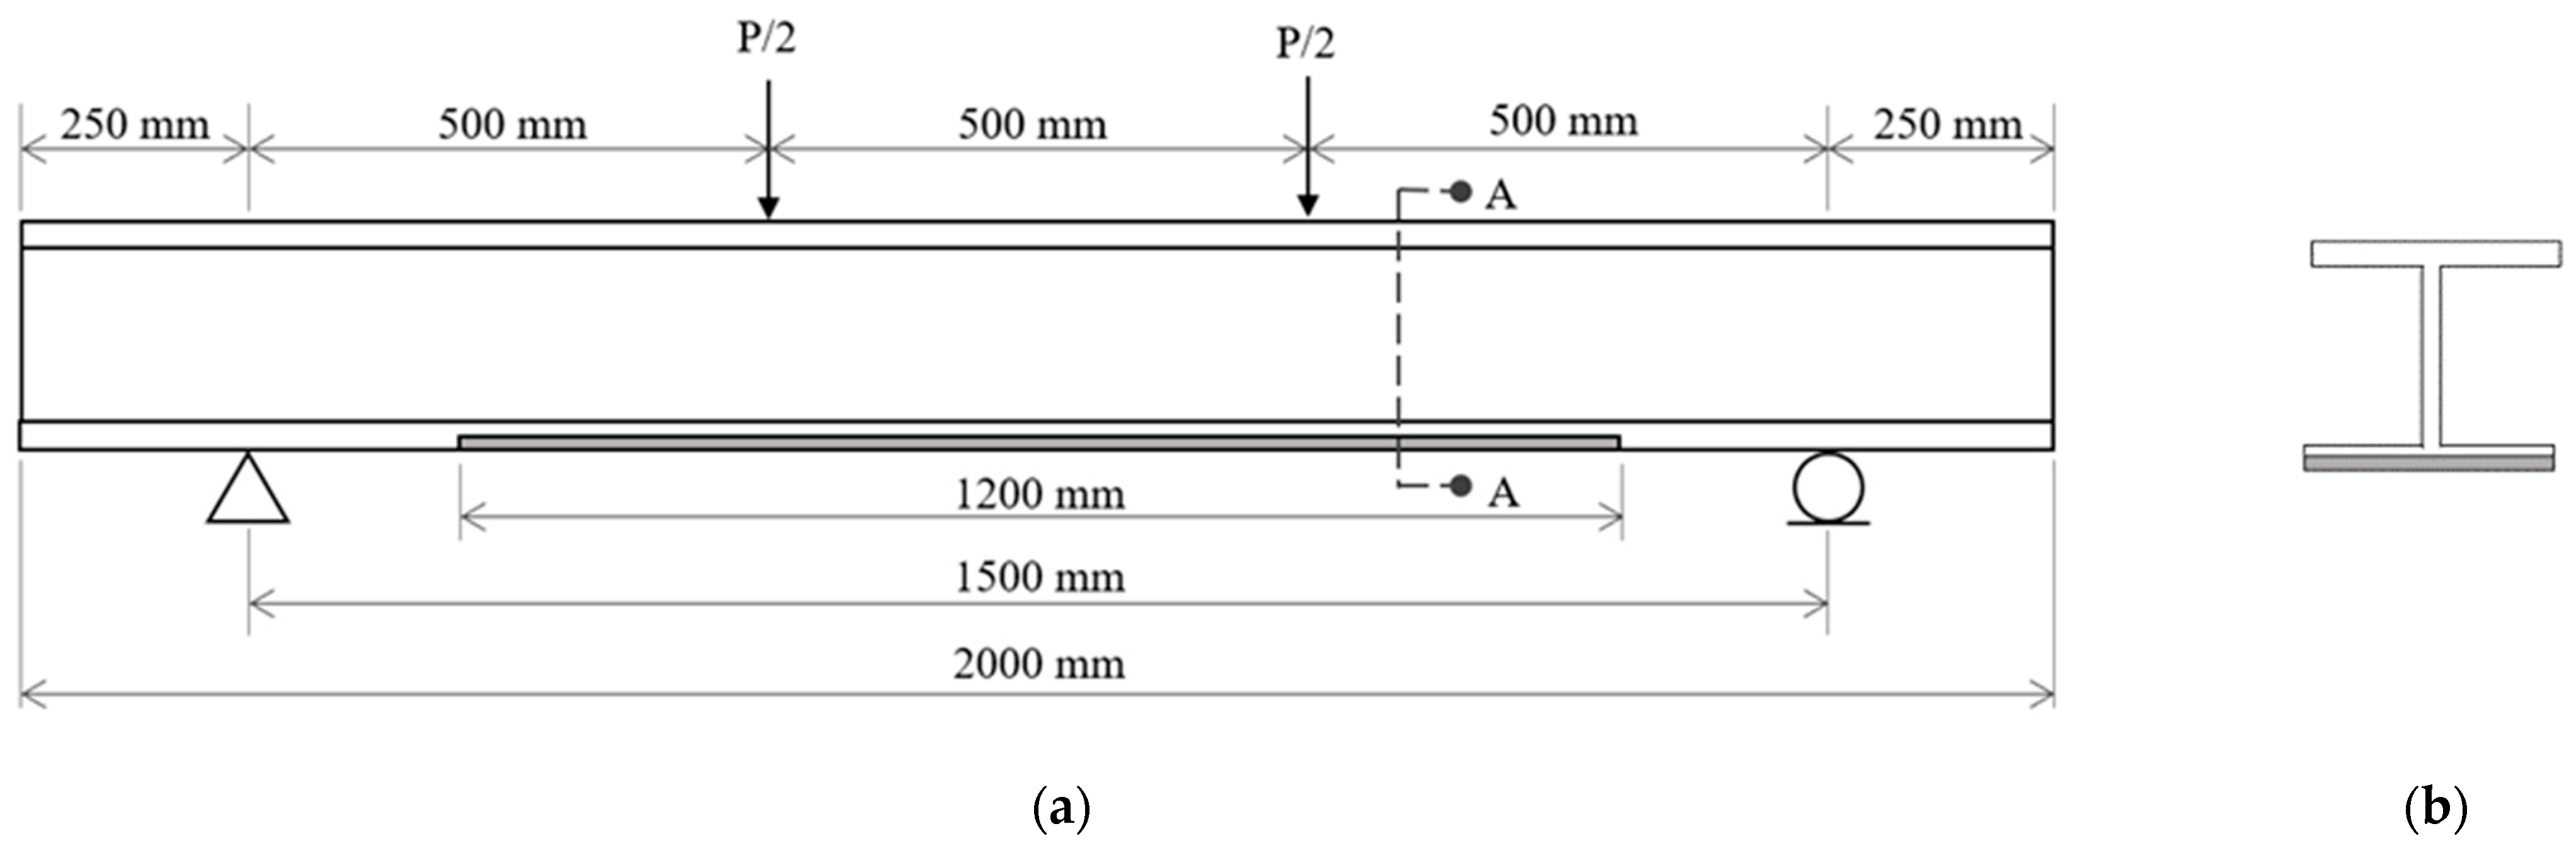
2. Description of the Experiment Used for the Validation of FE Models
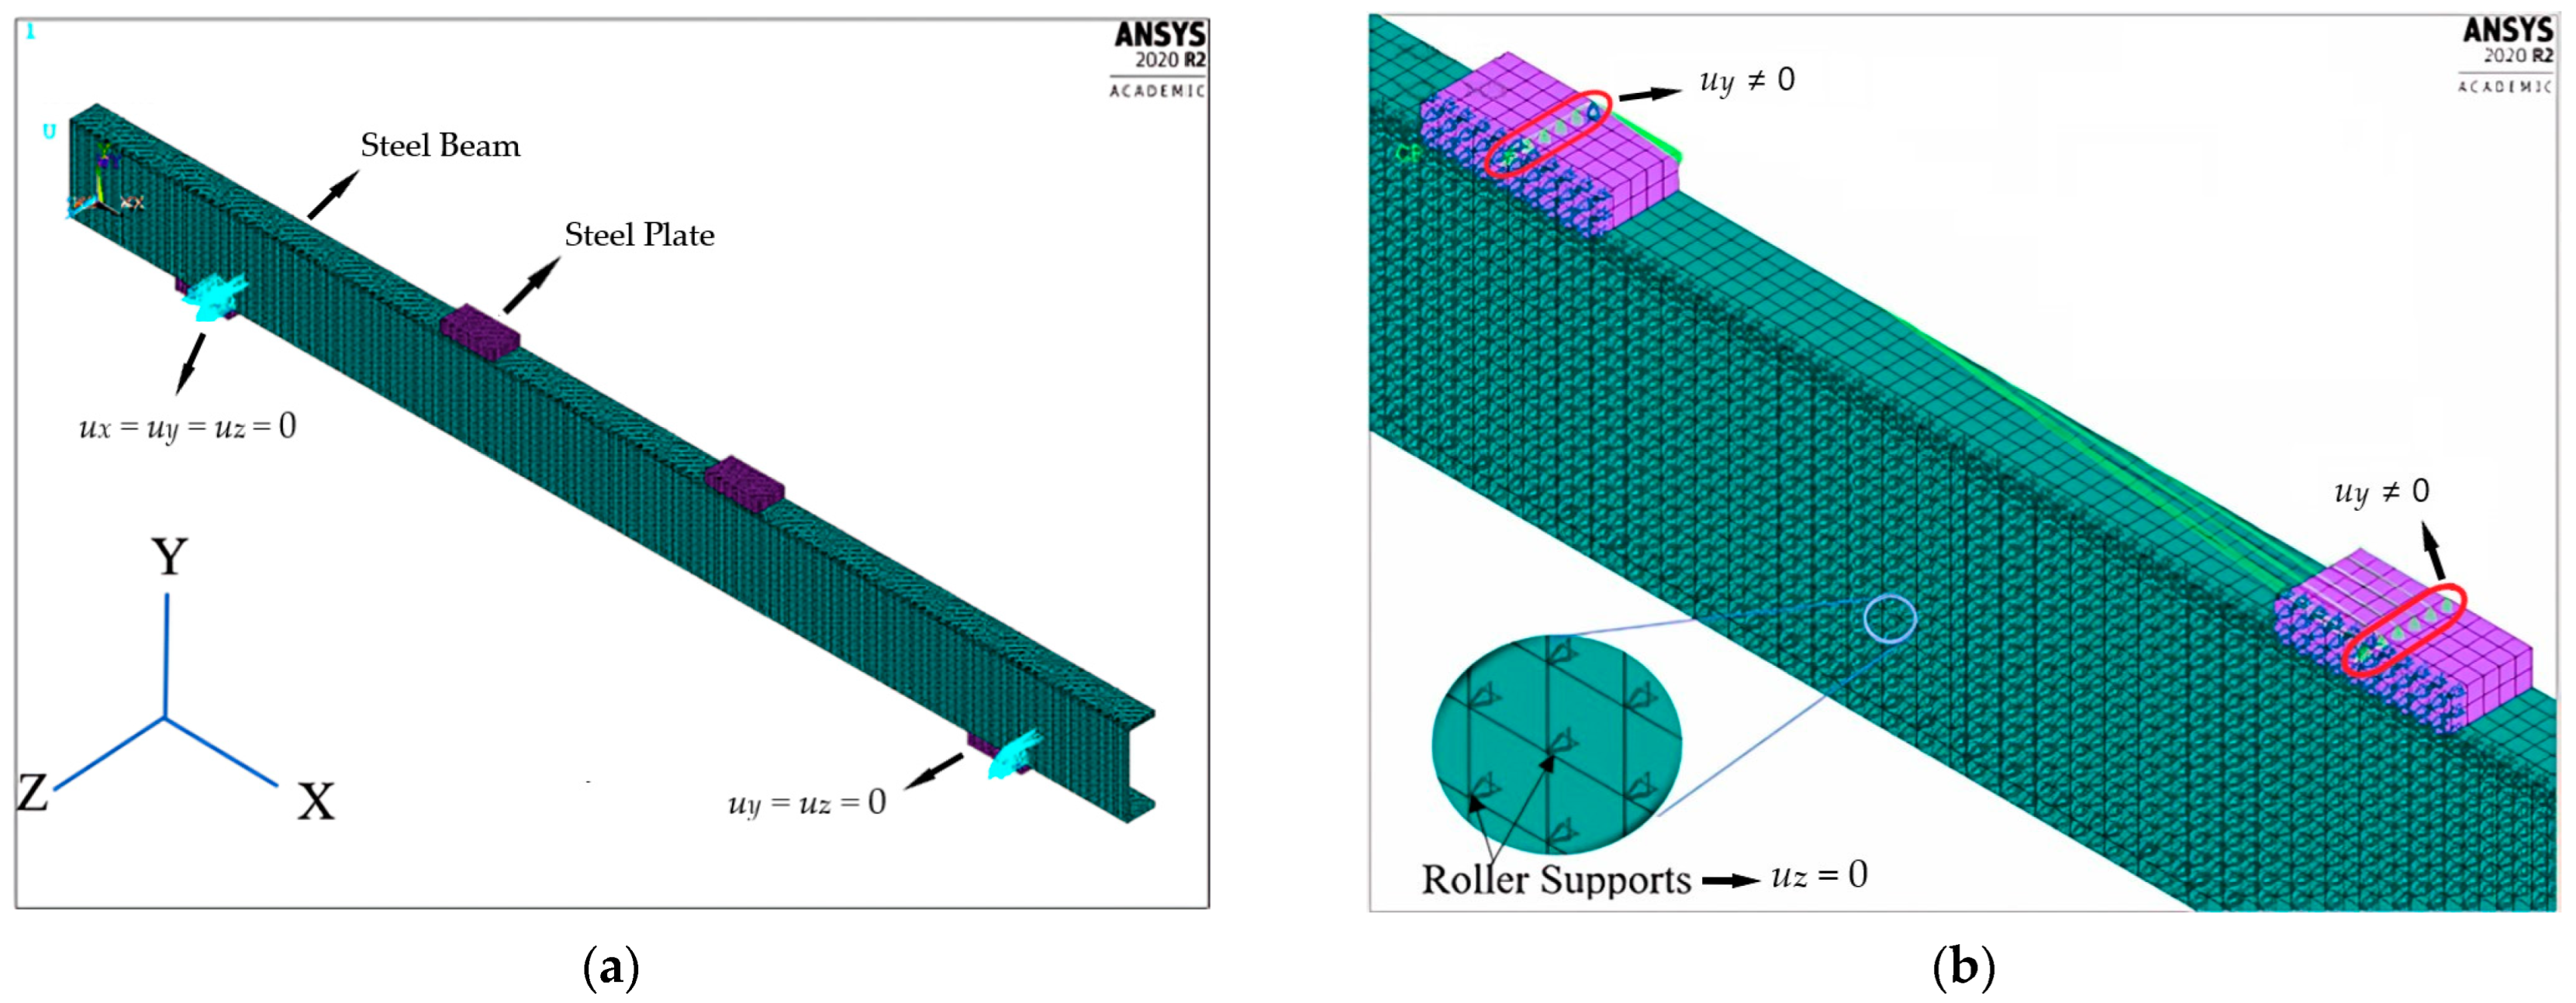
3. Finite Element Modeling Procedure
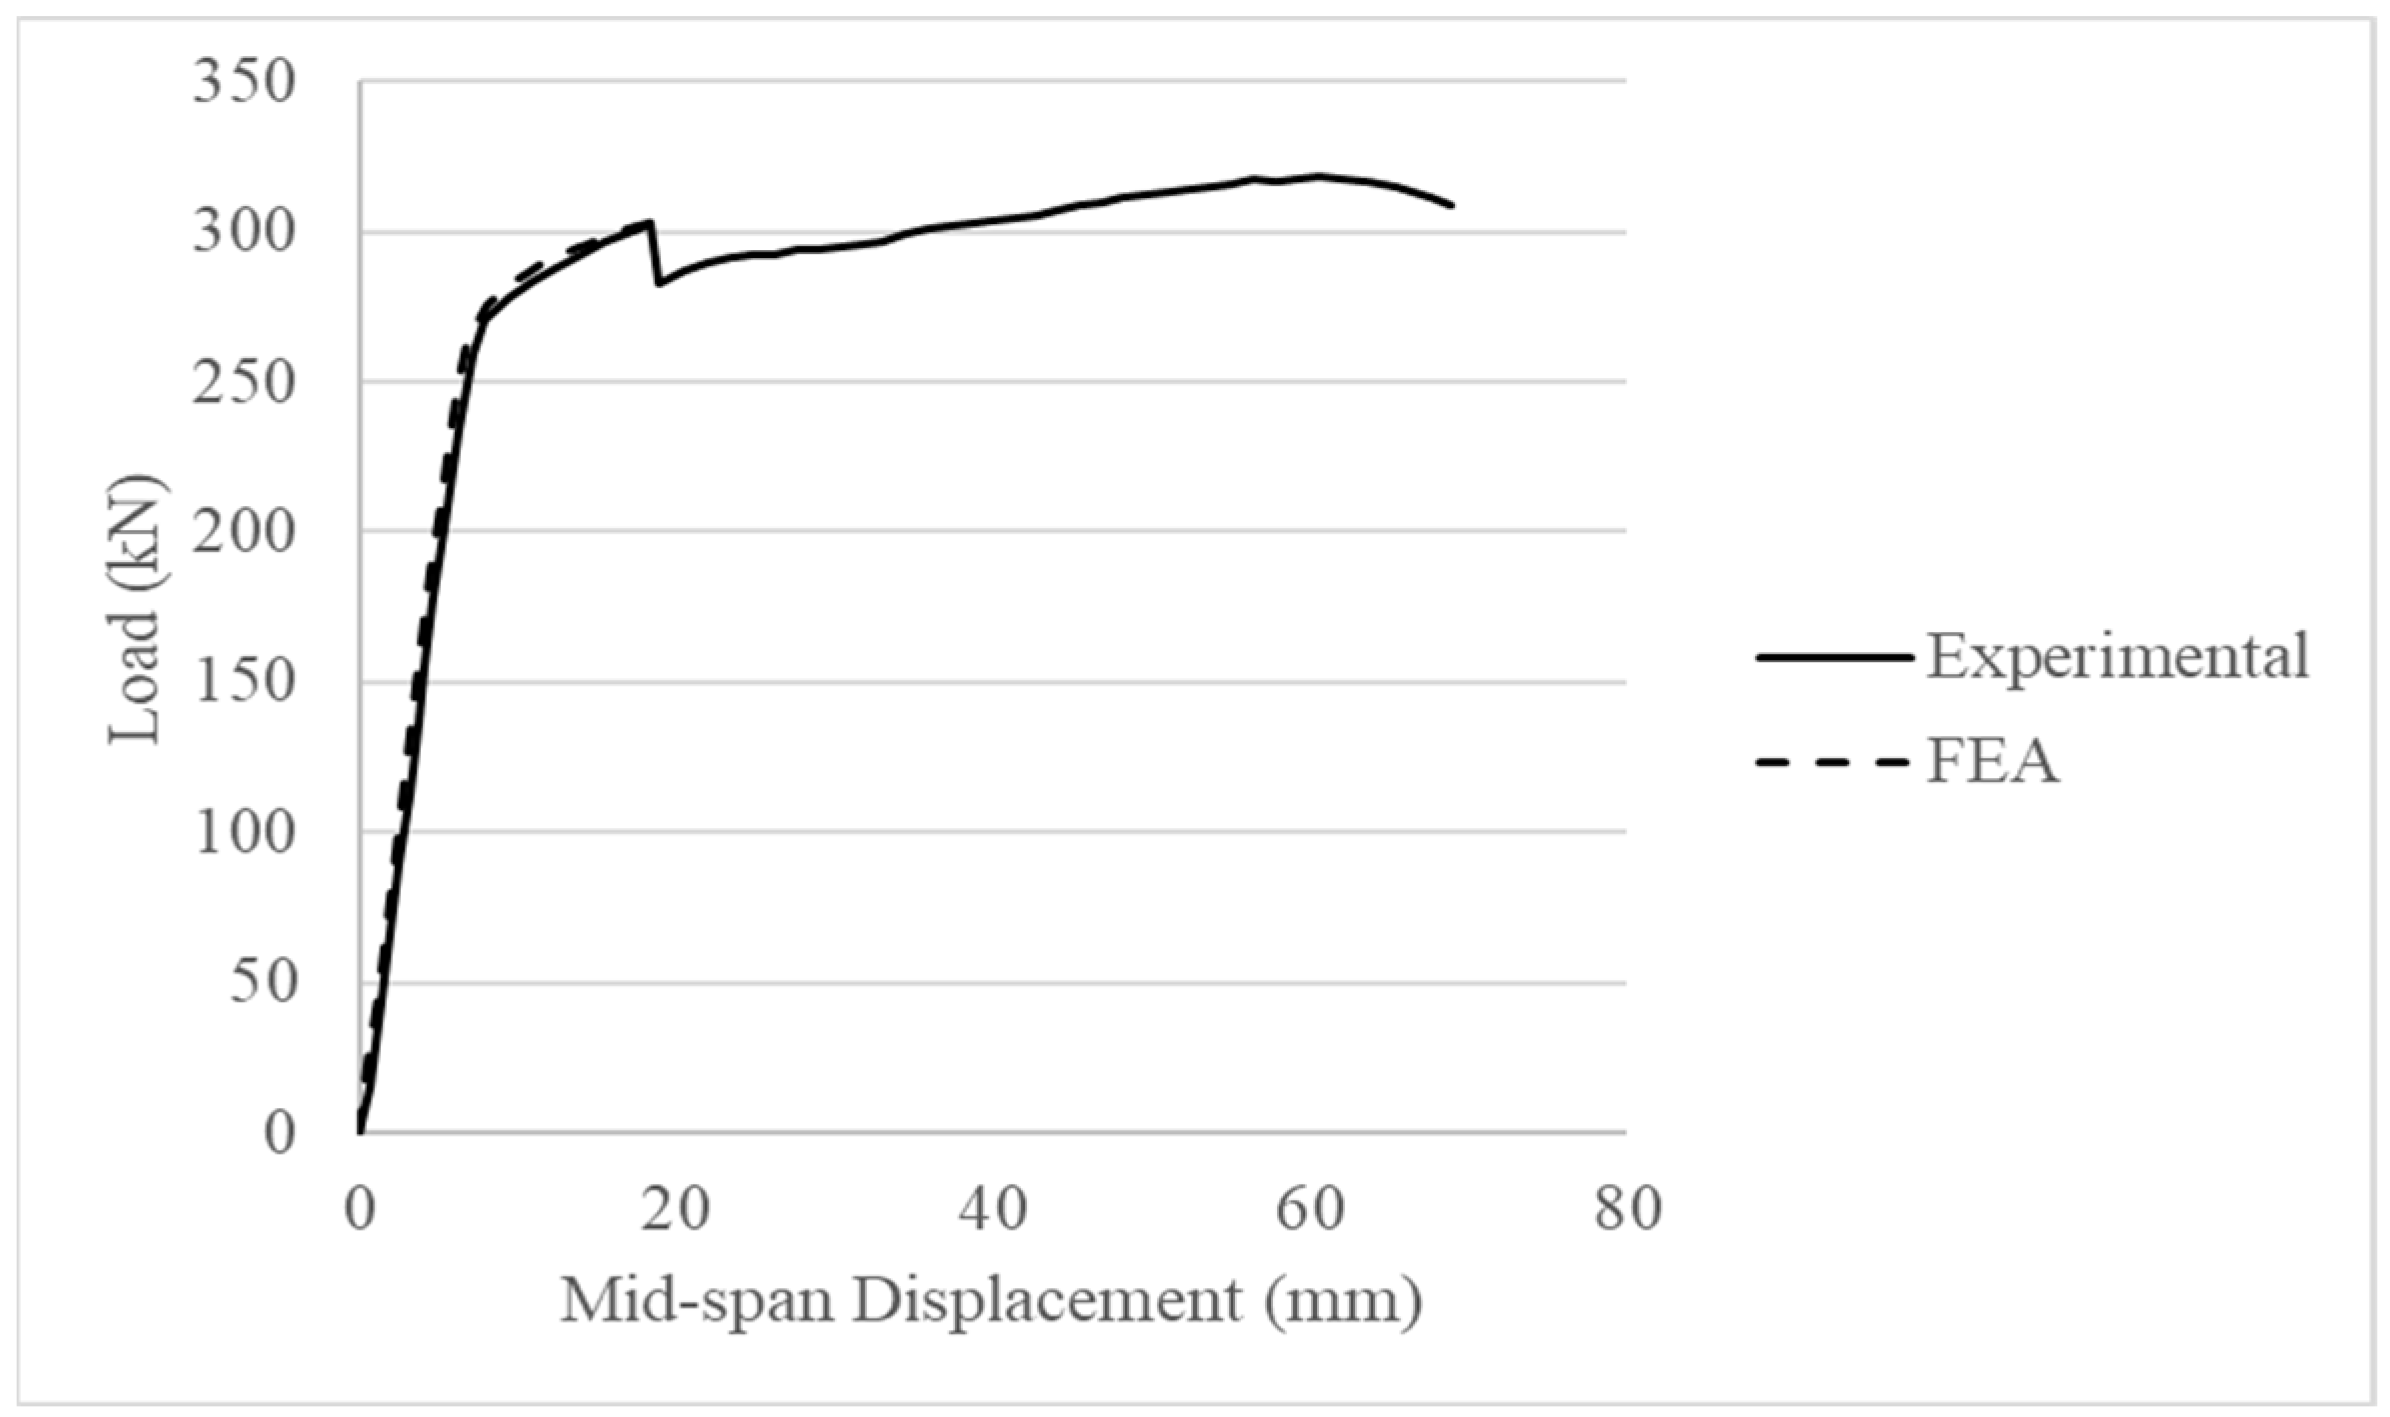
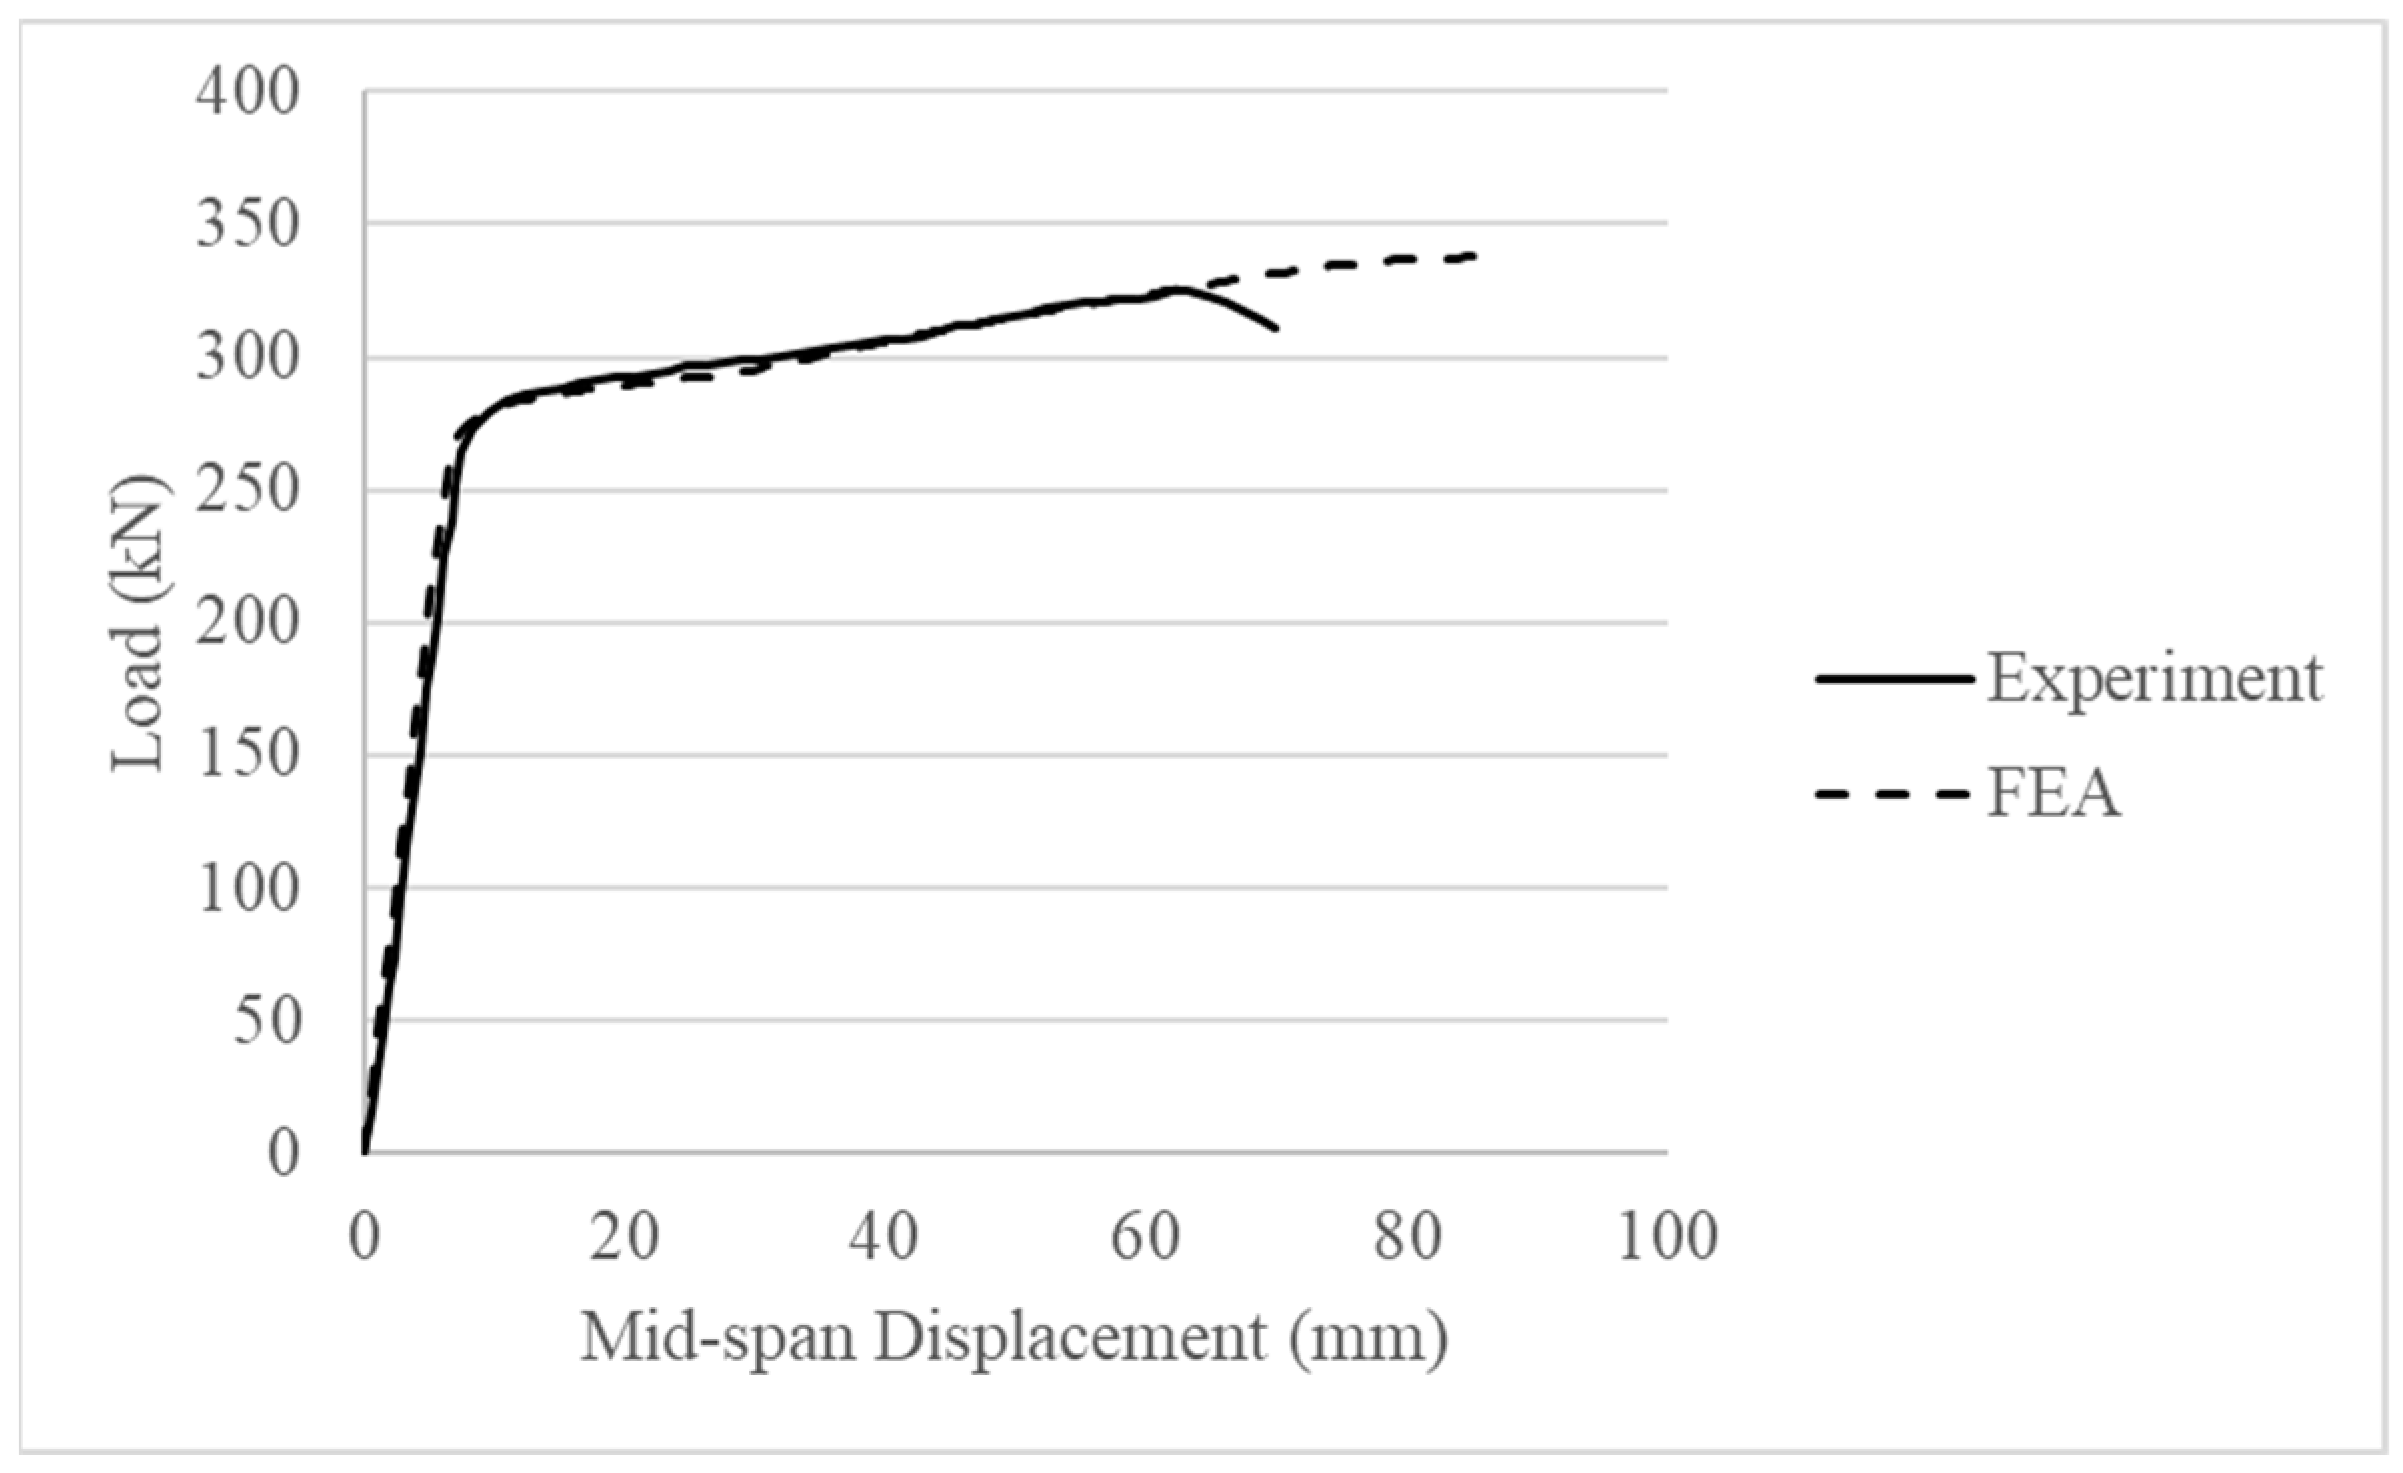
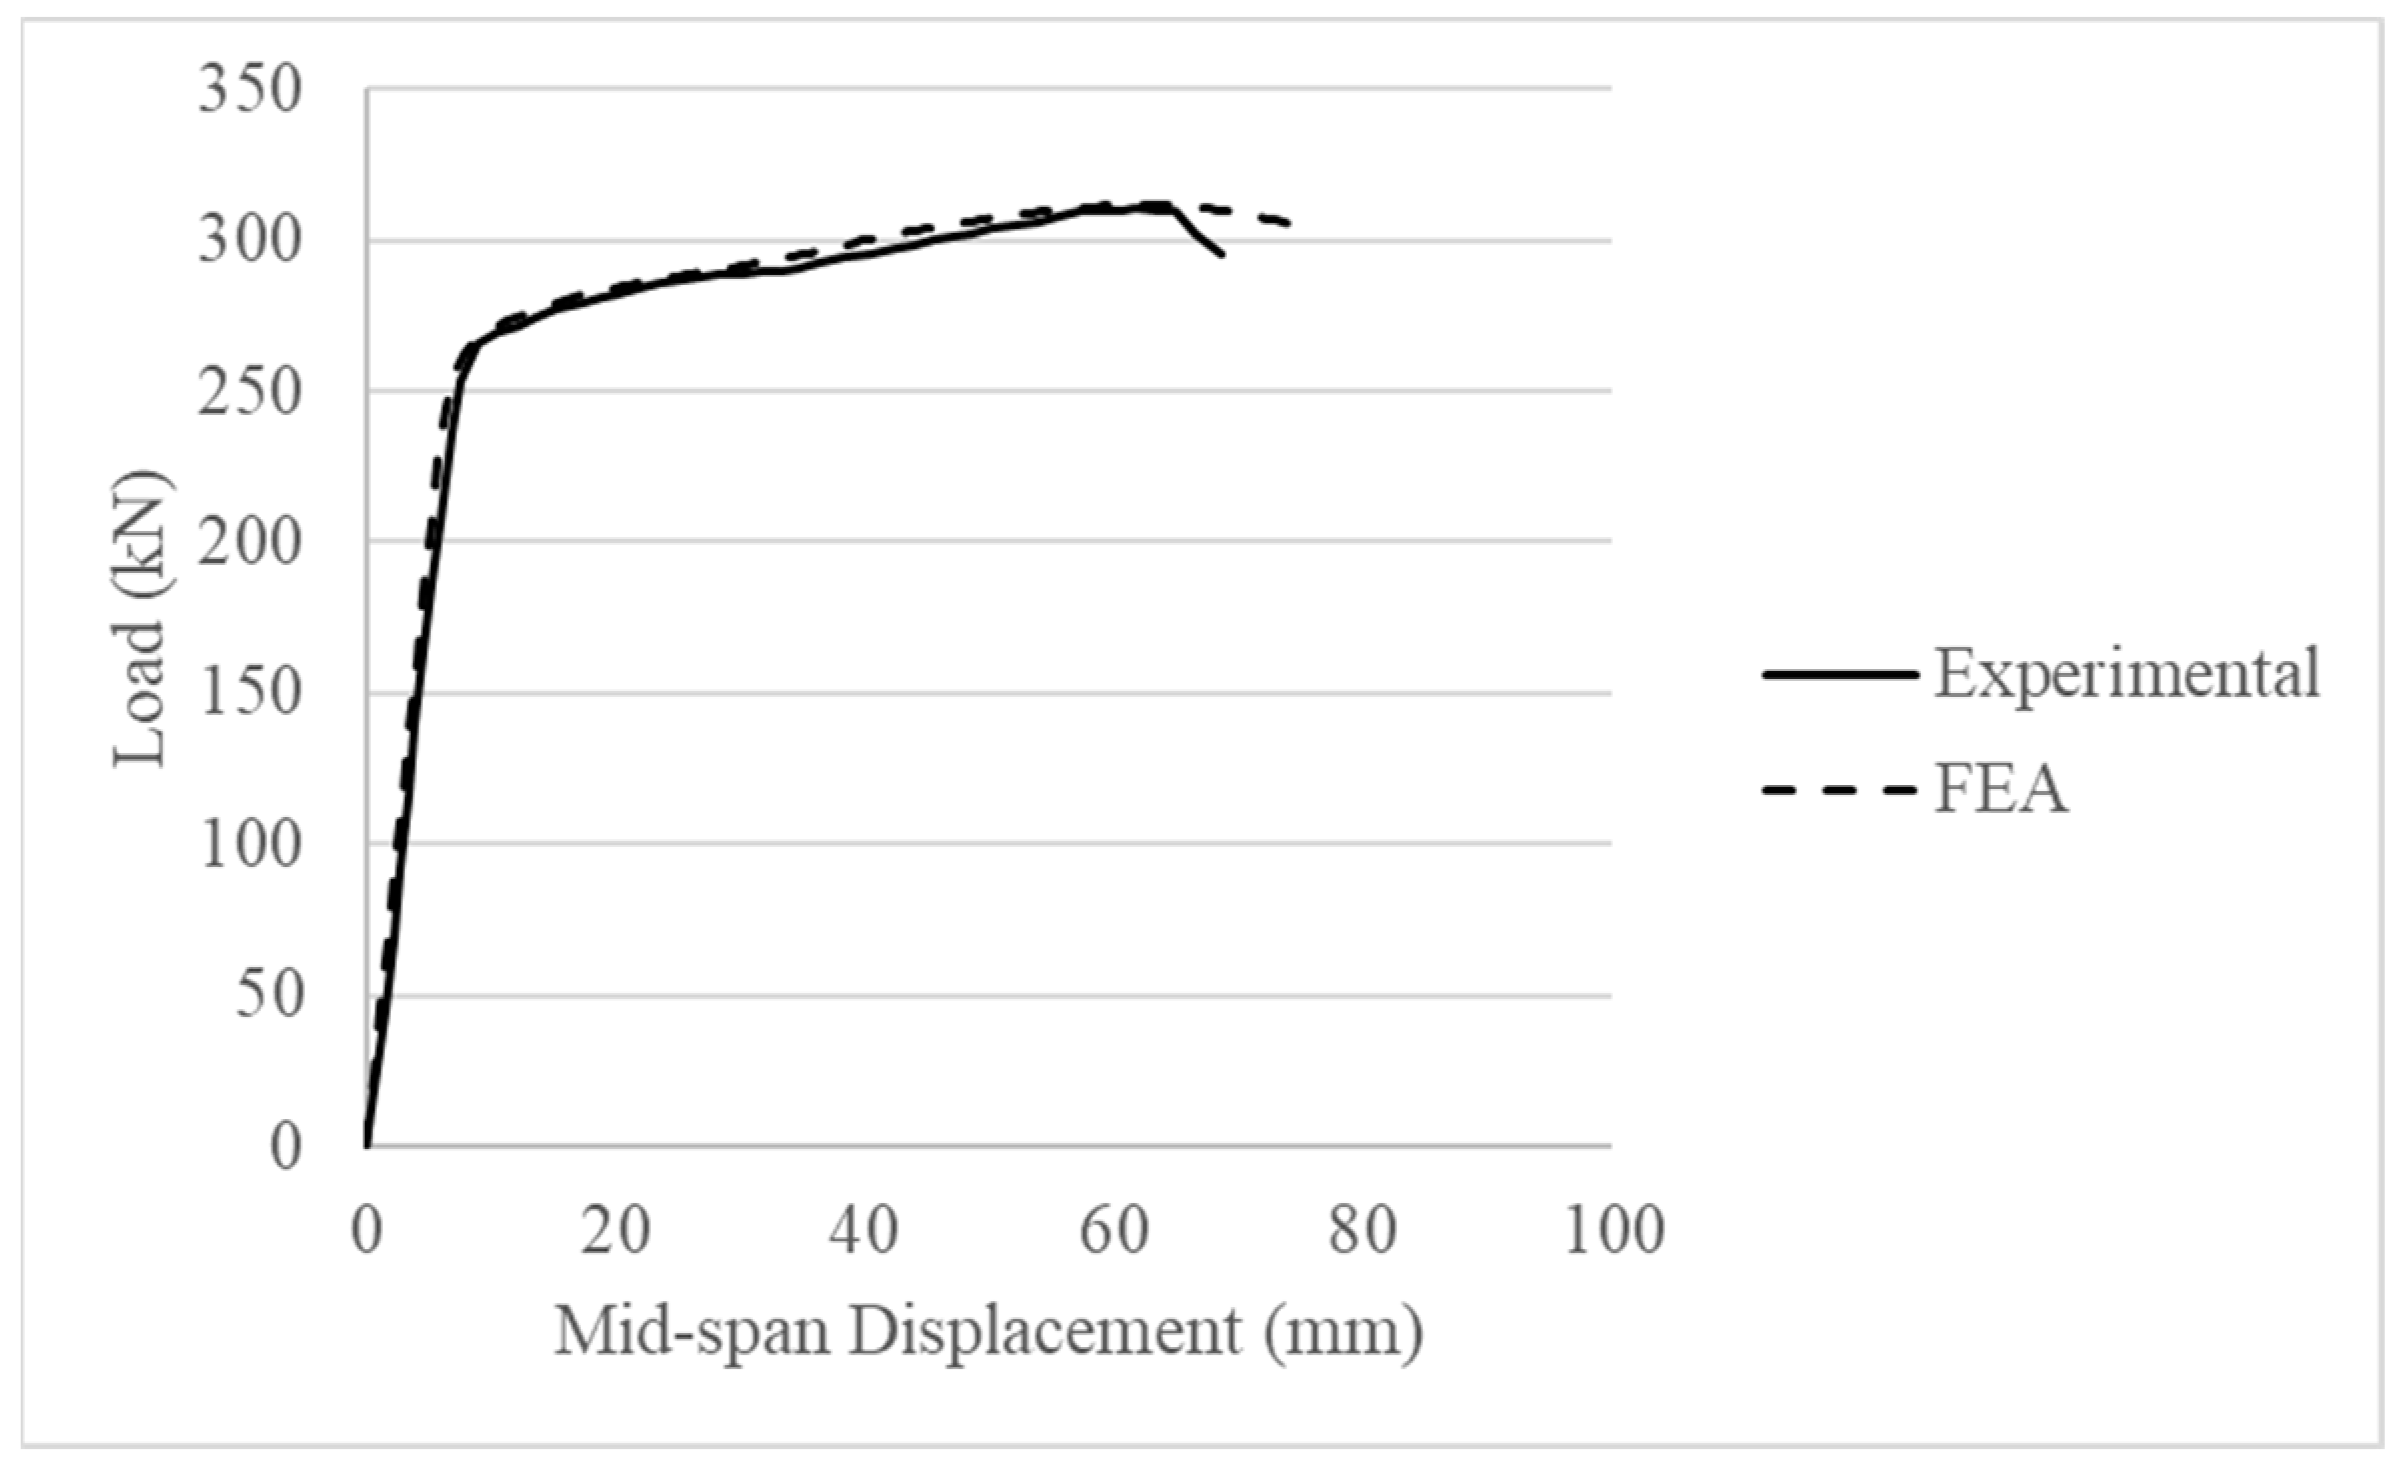
4. Validation of Developed FE Beam Models
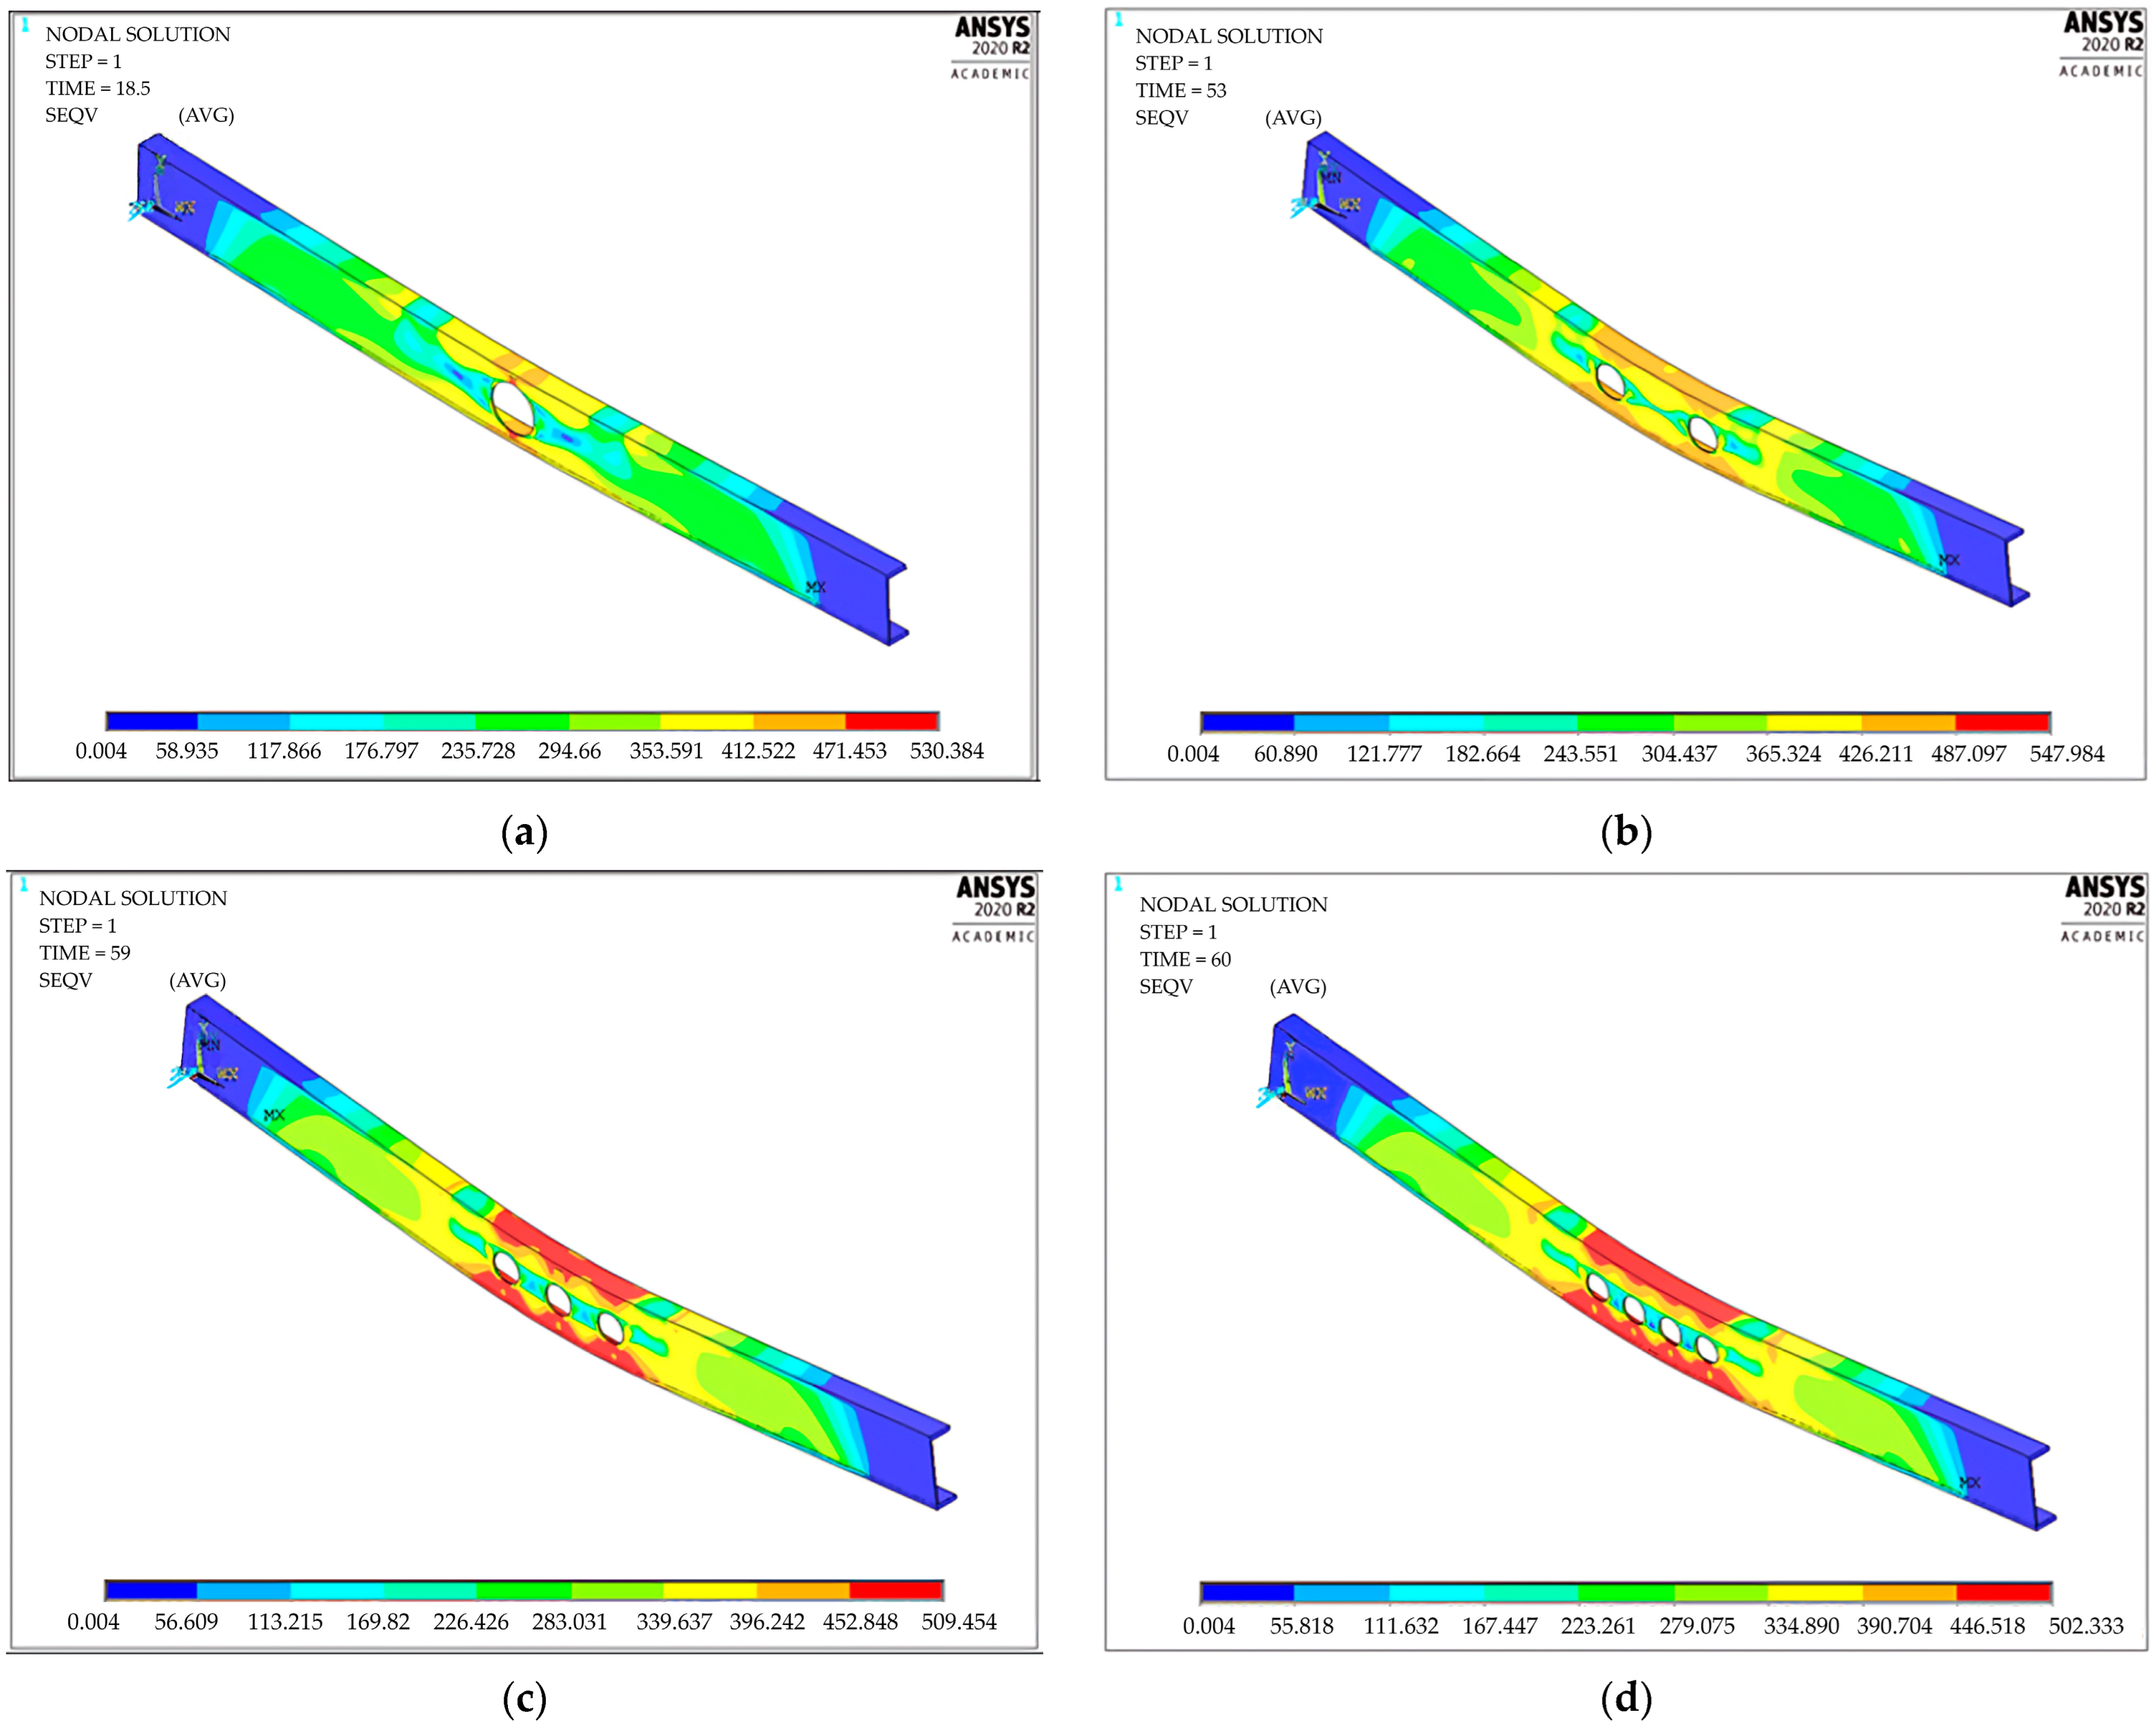
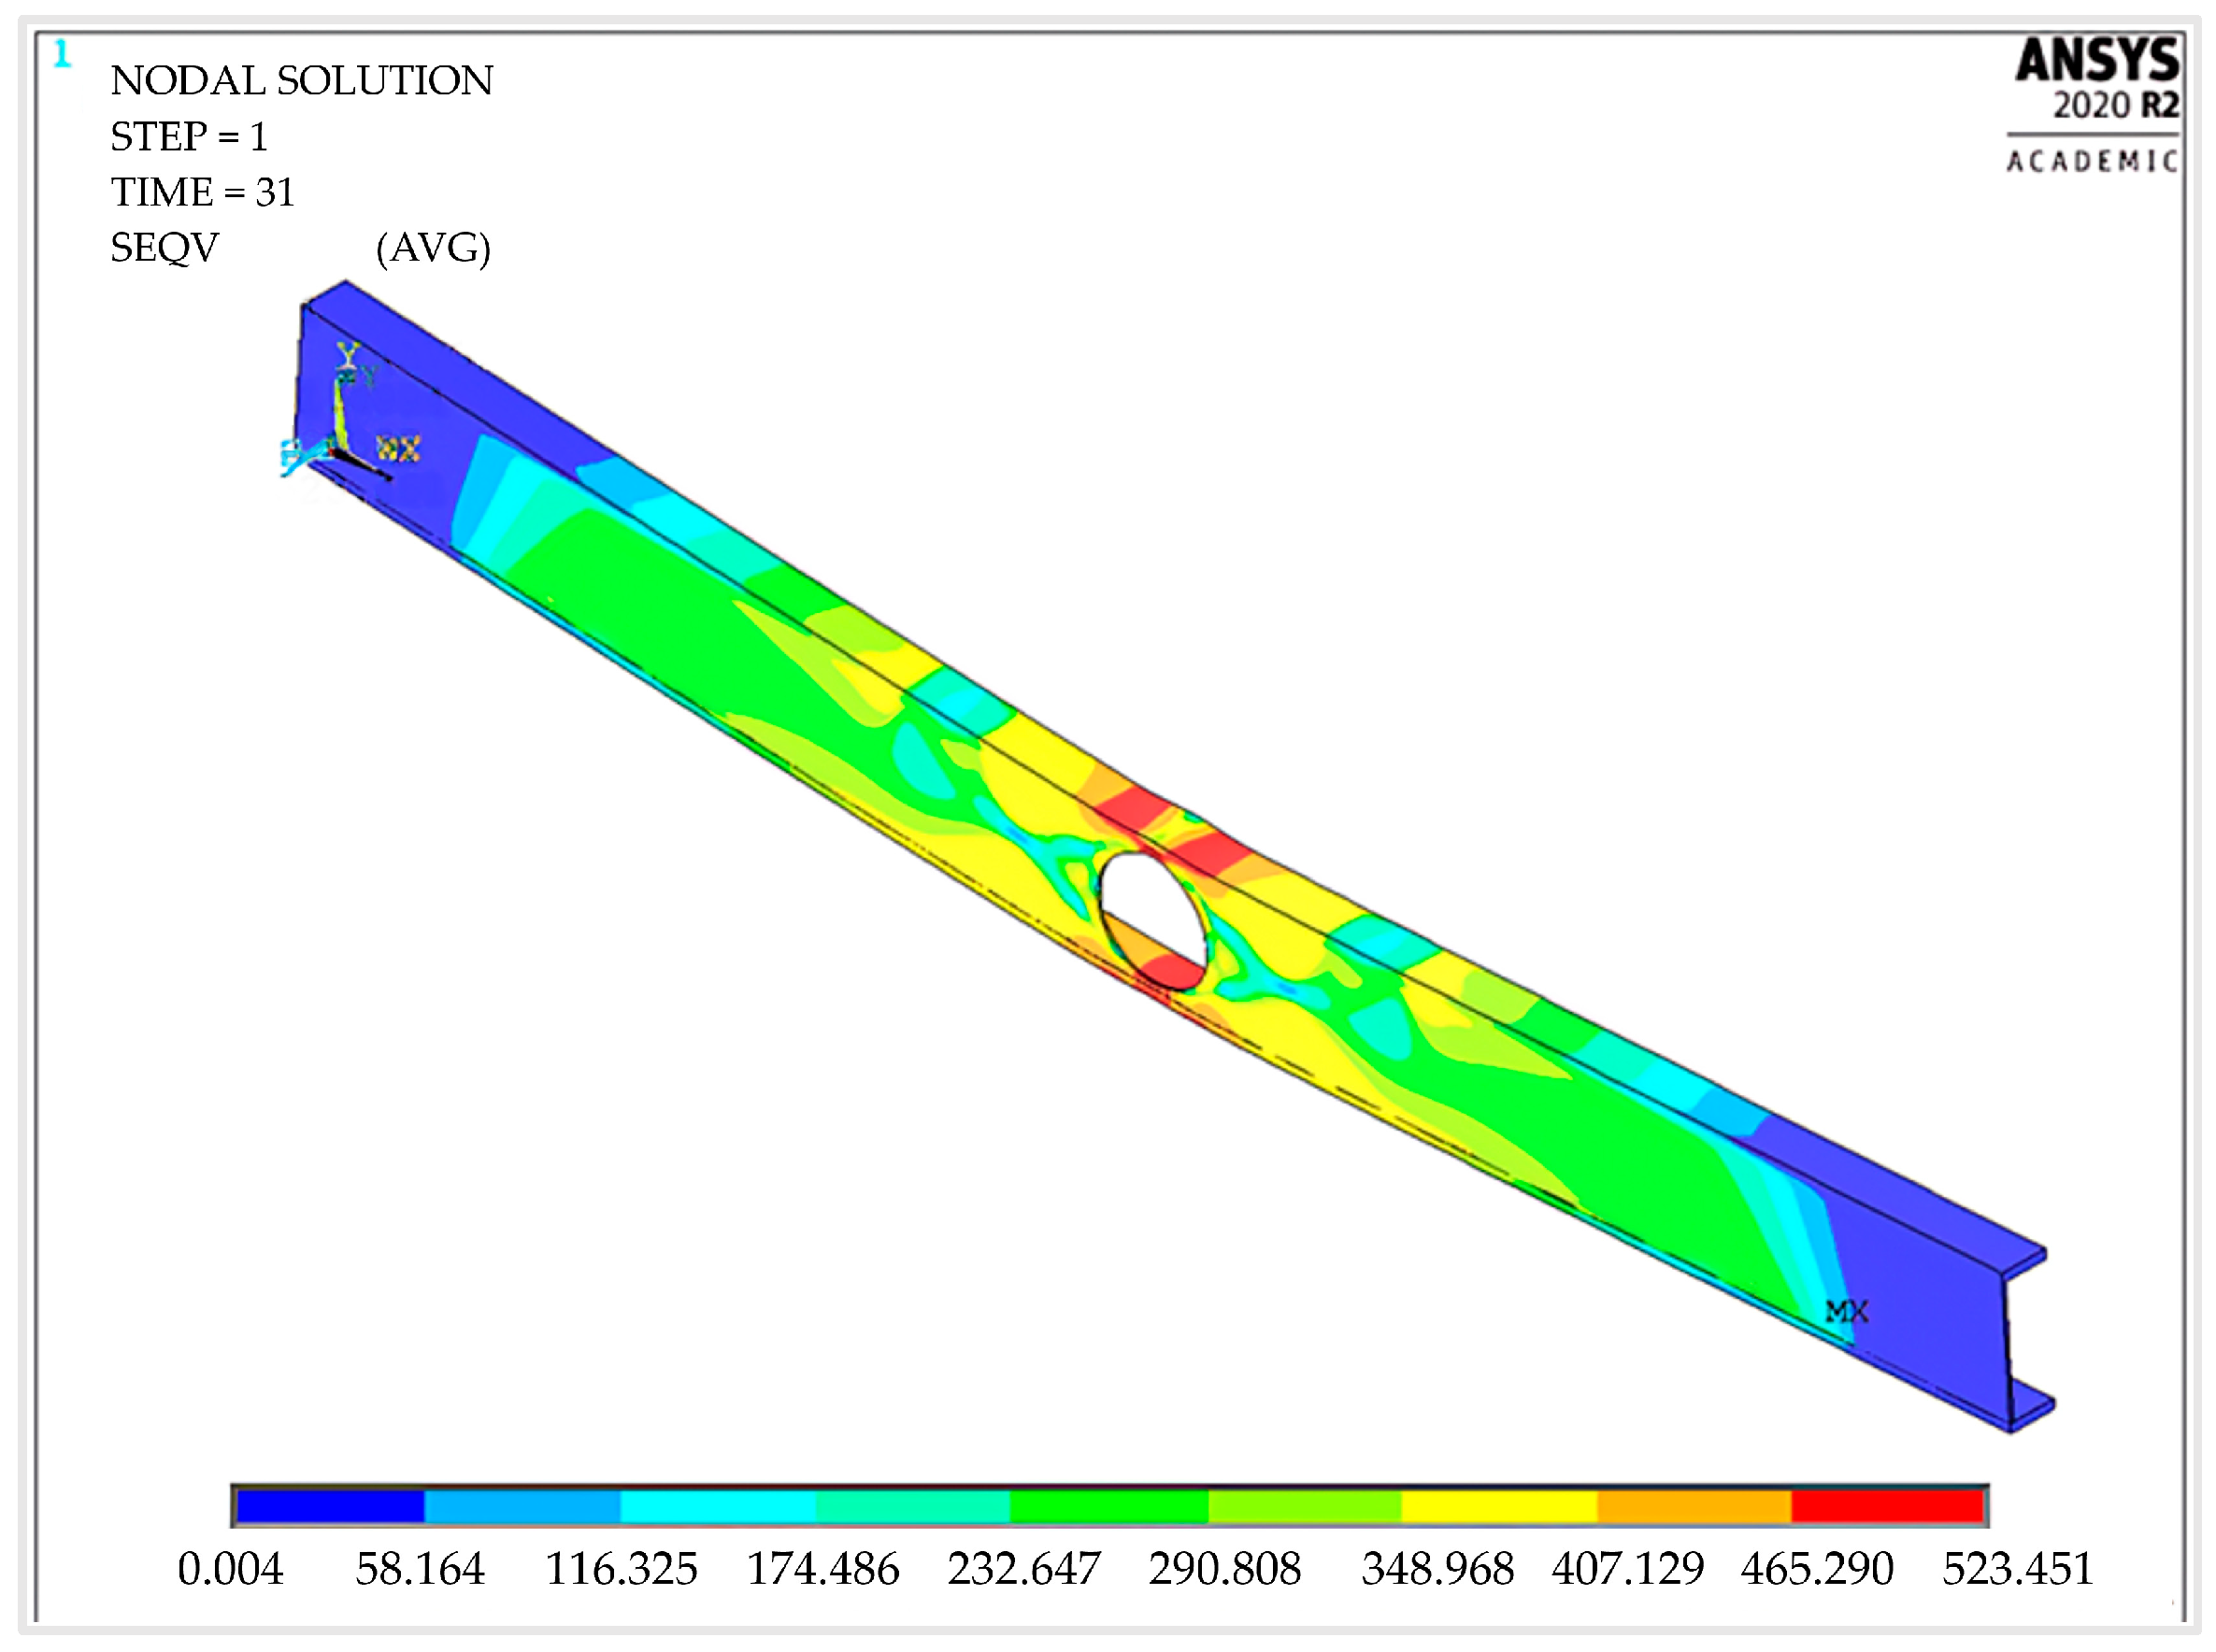
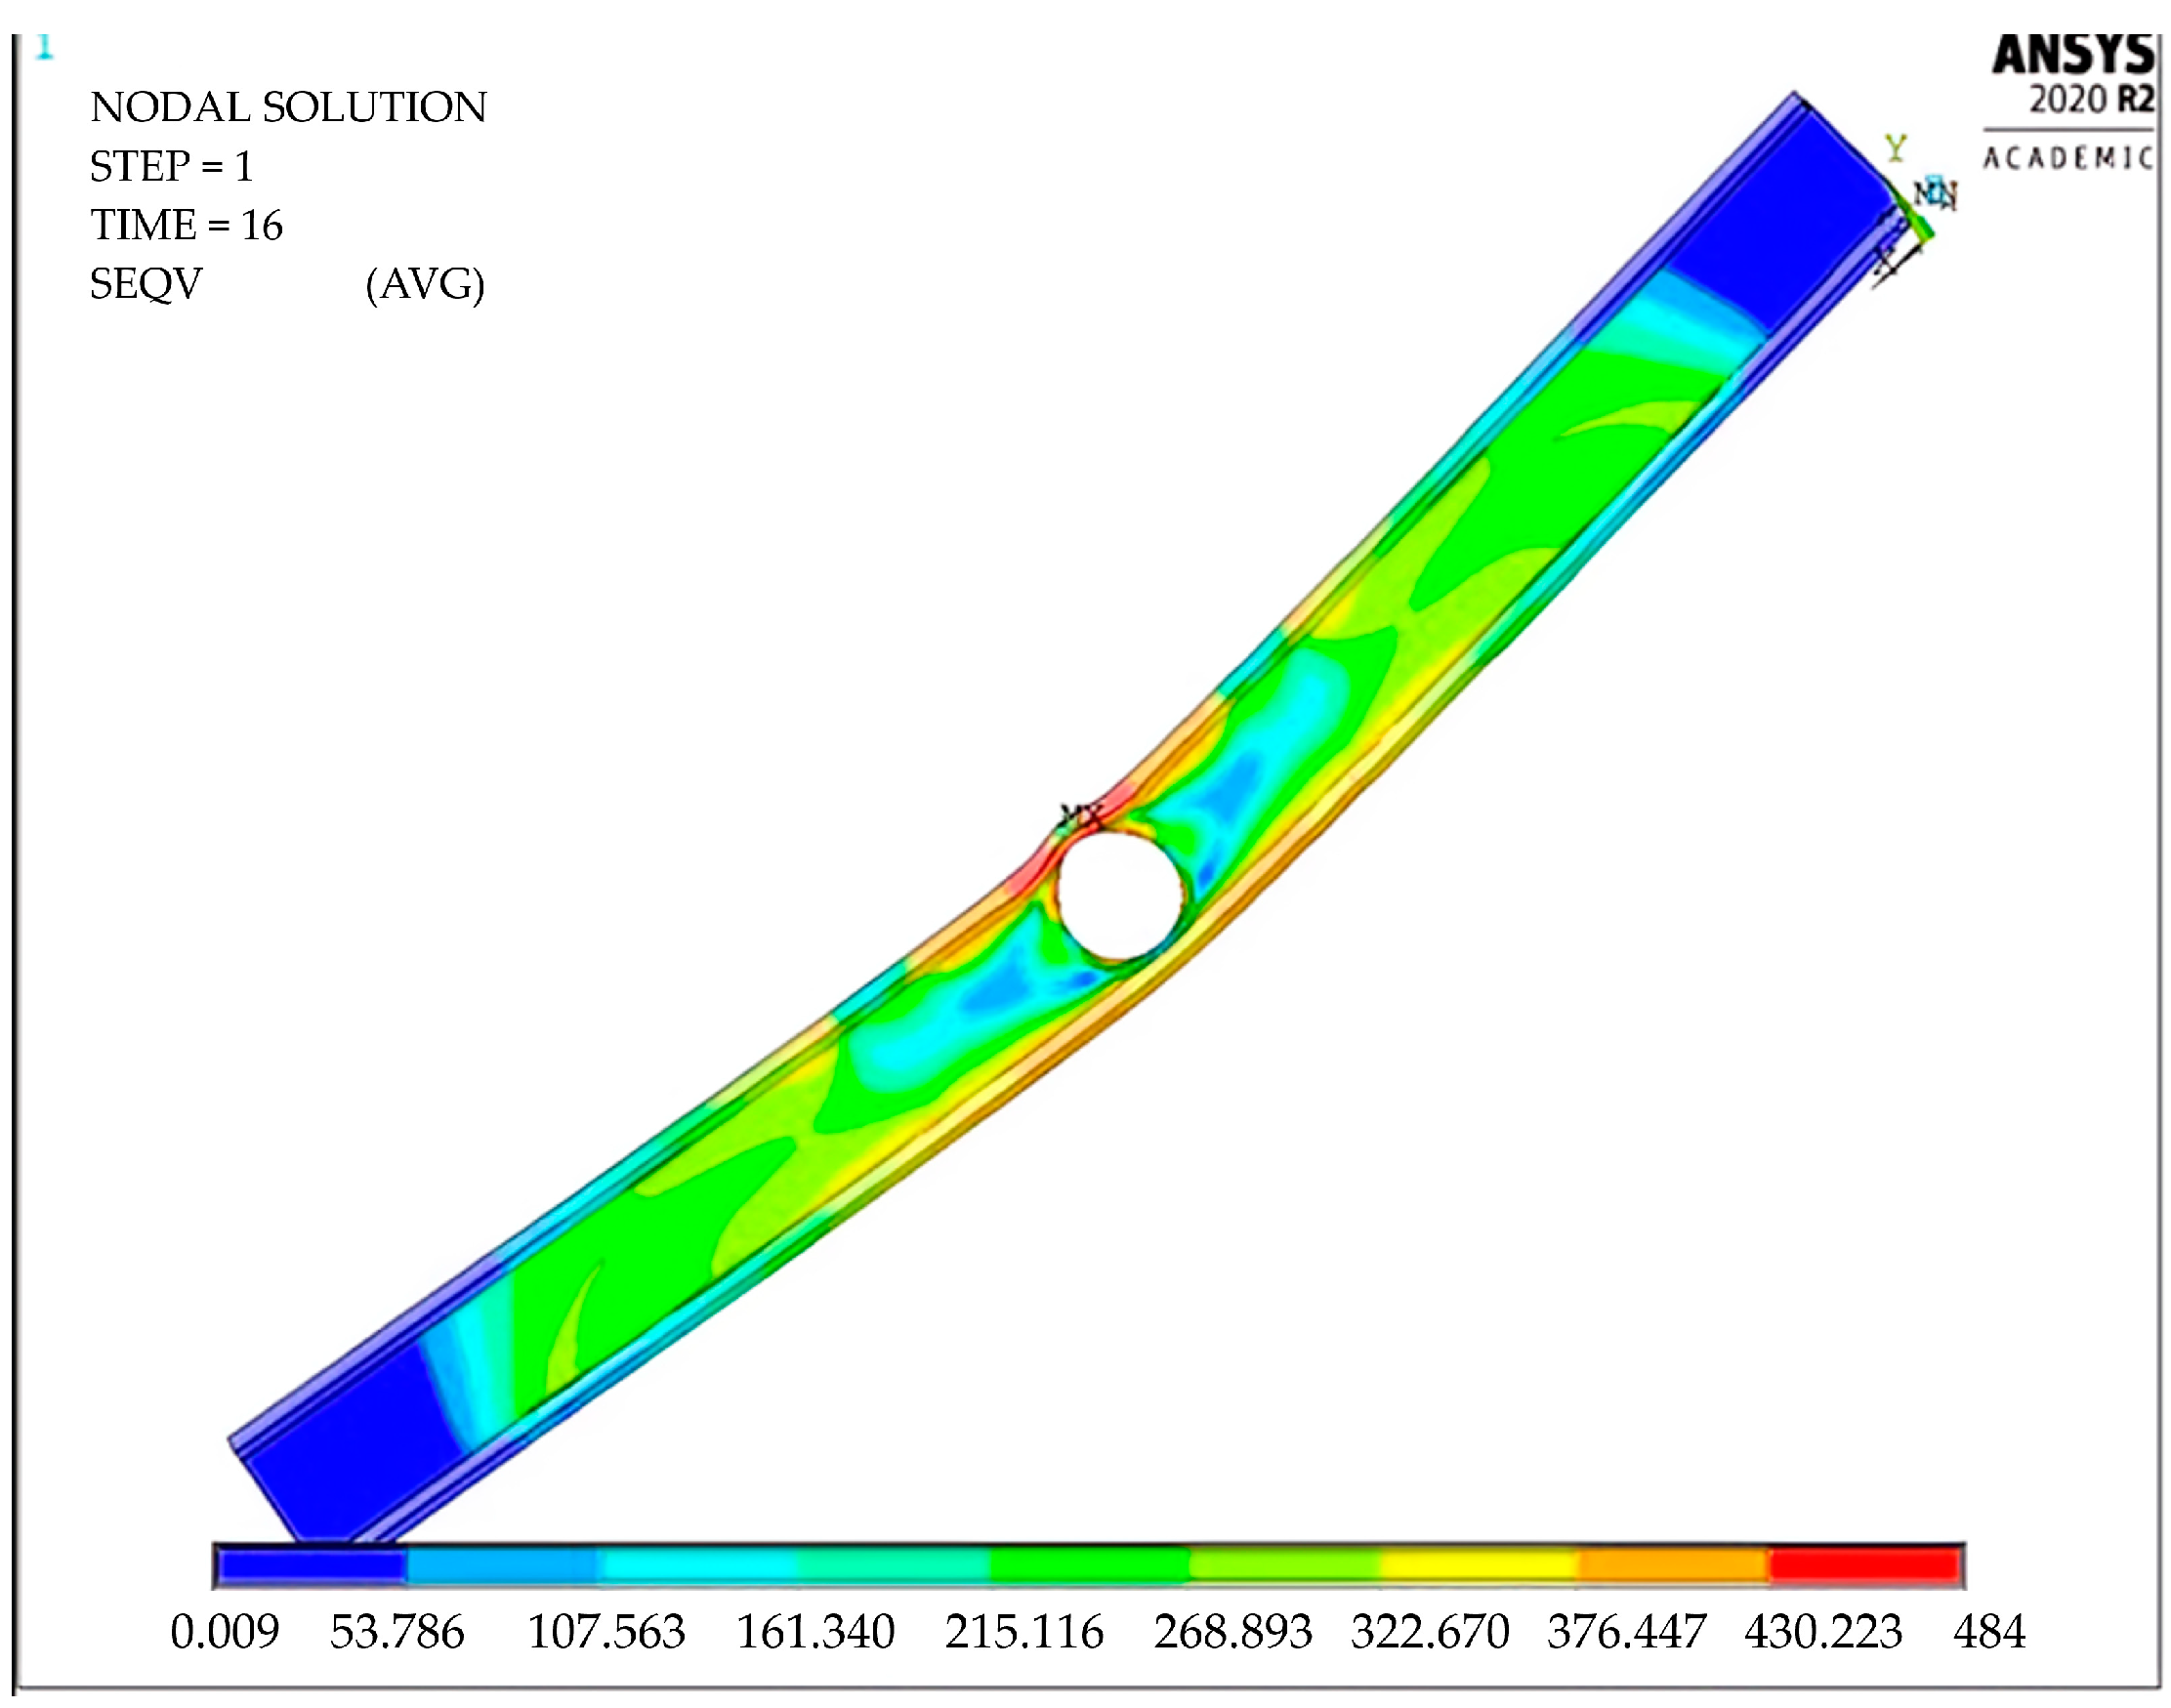
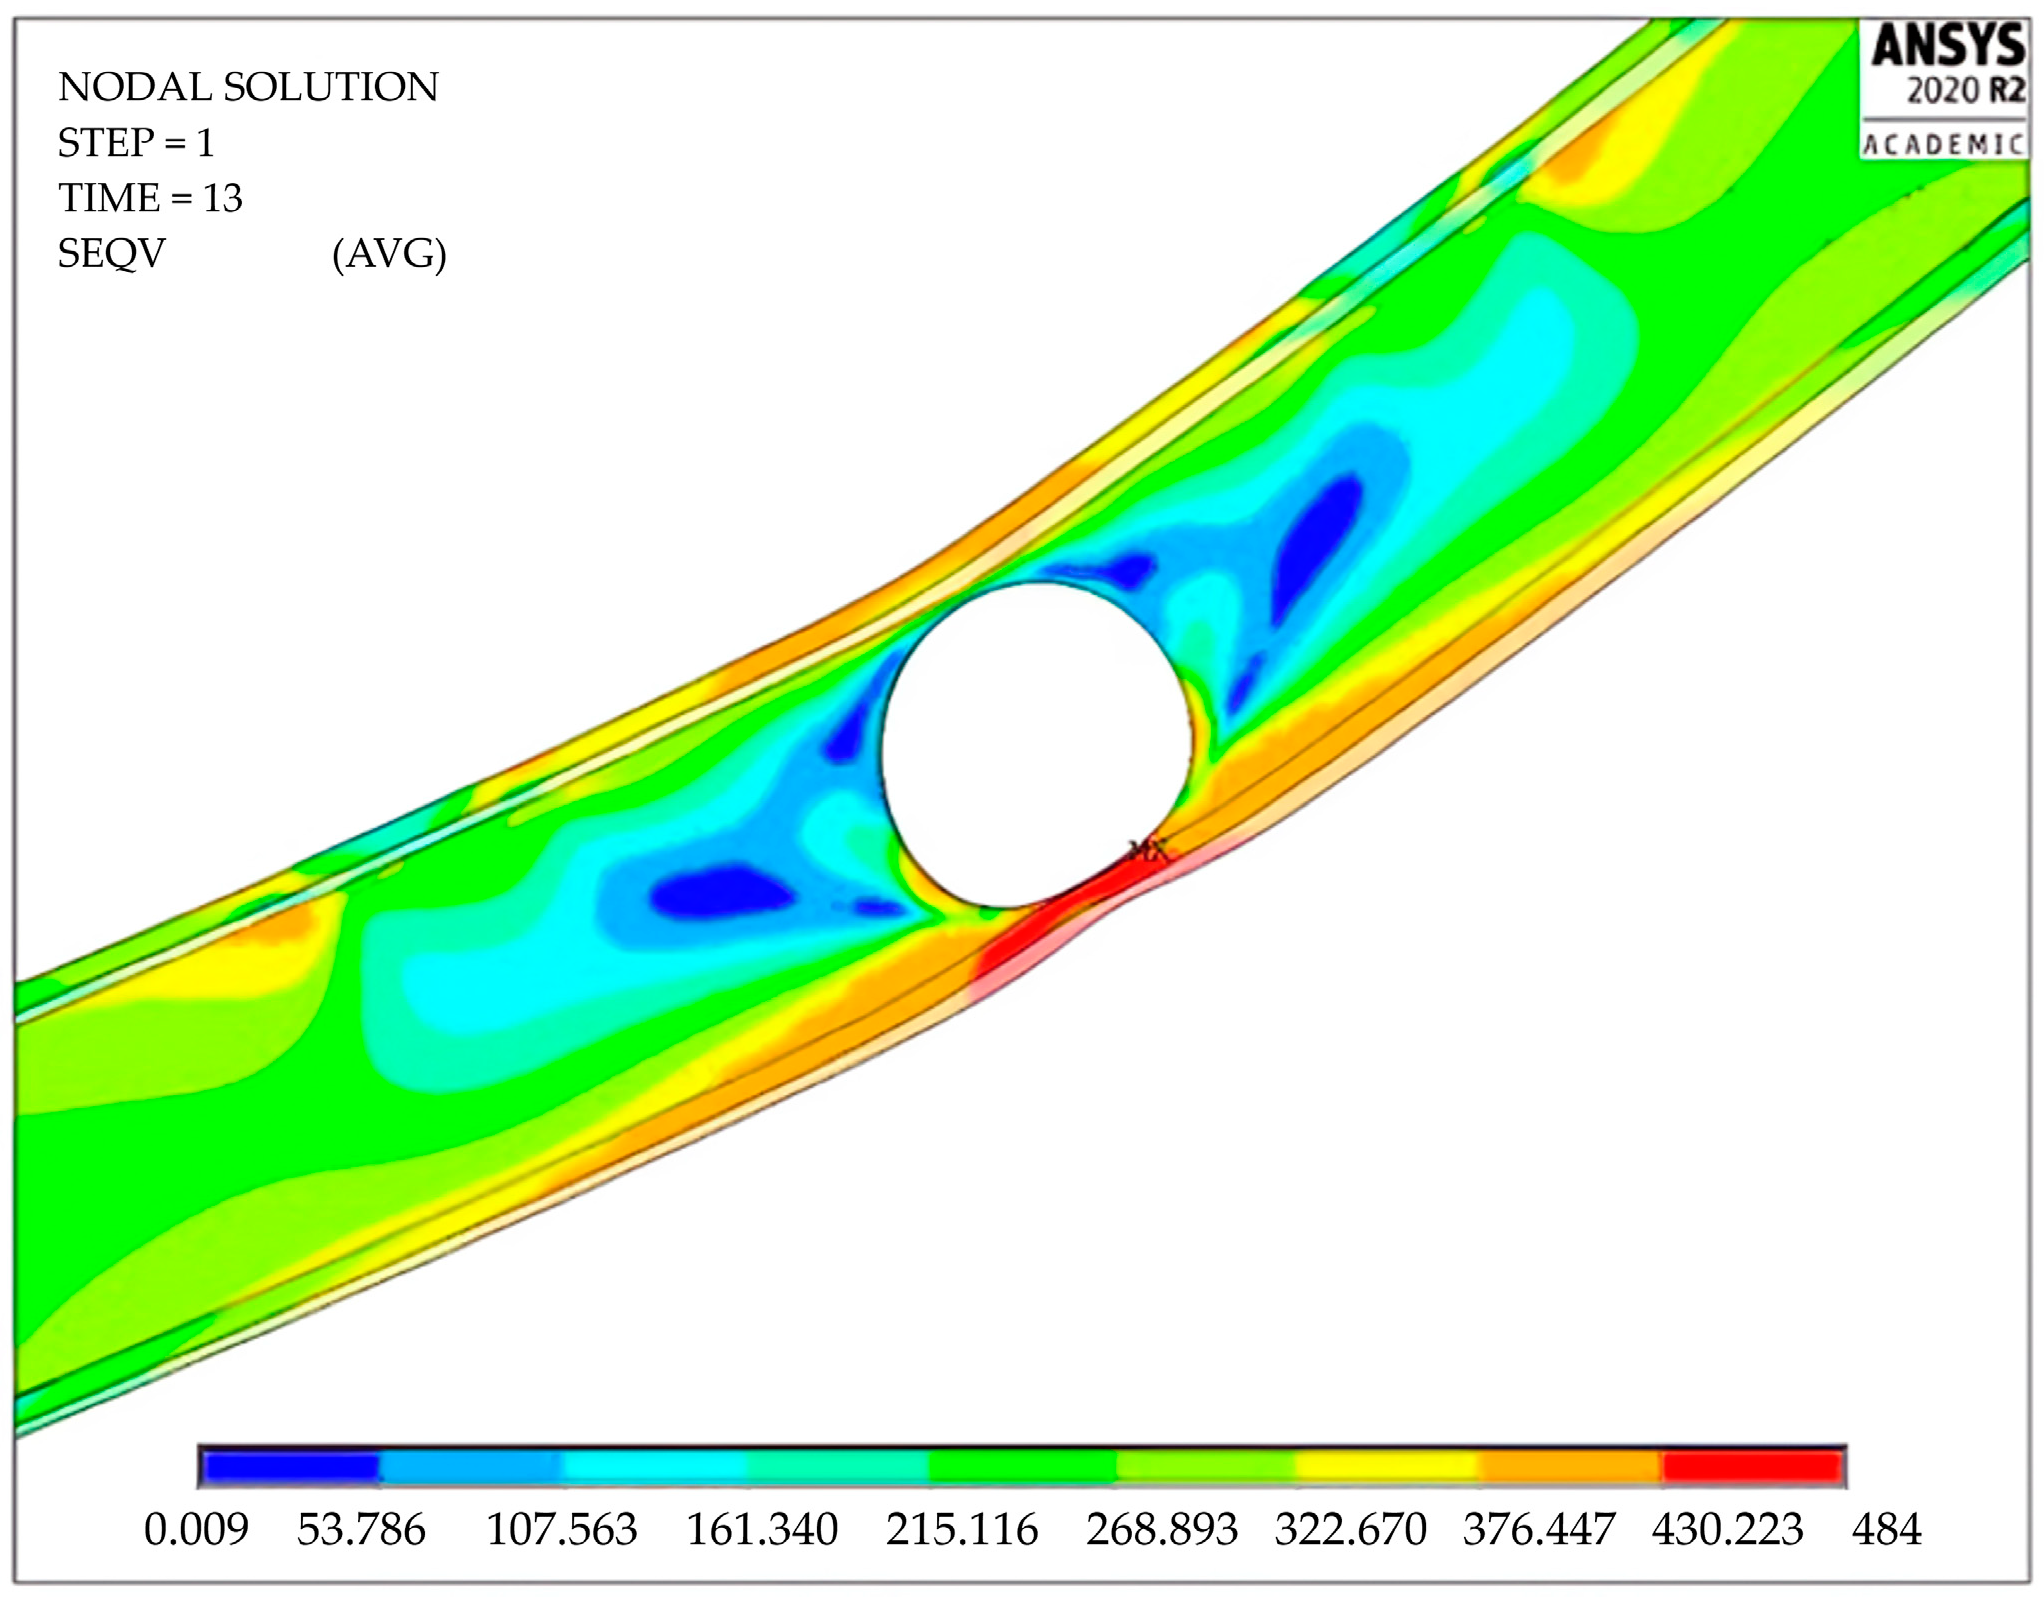
FE Beam Models Failure Behavior
5. Parametric Study Results
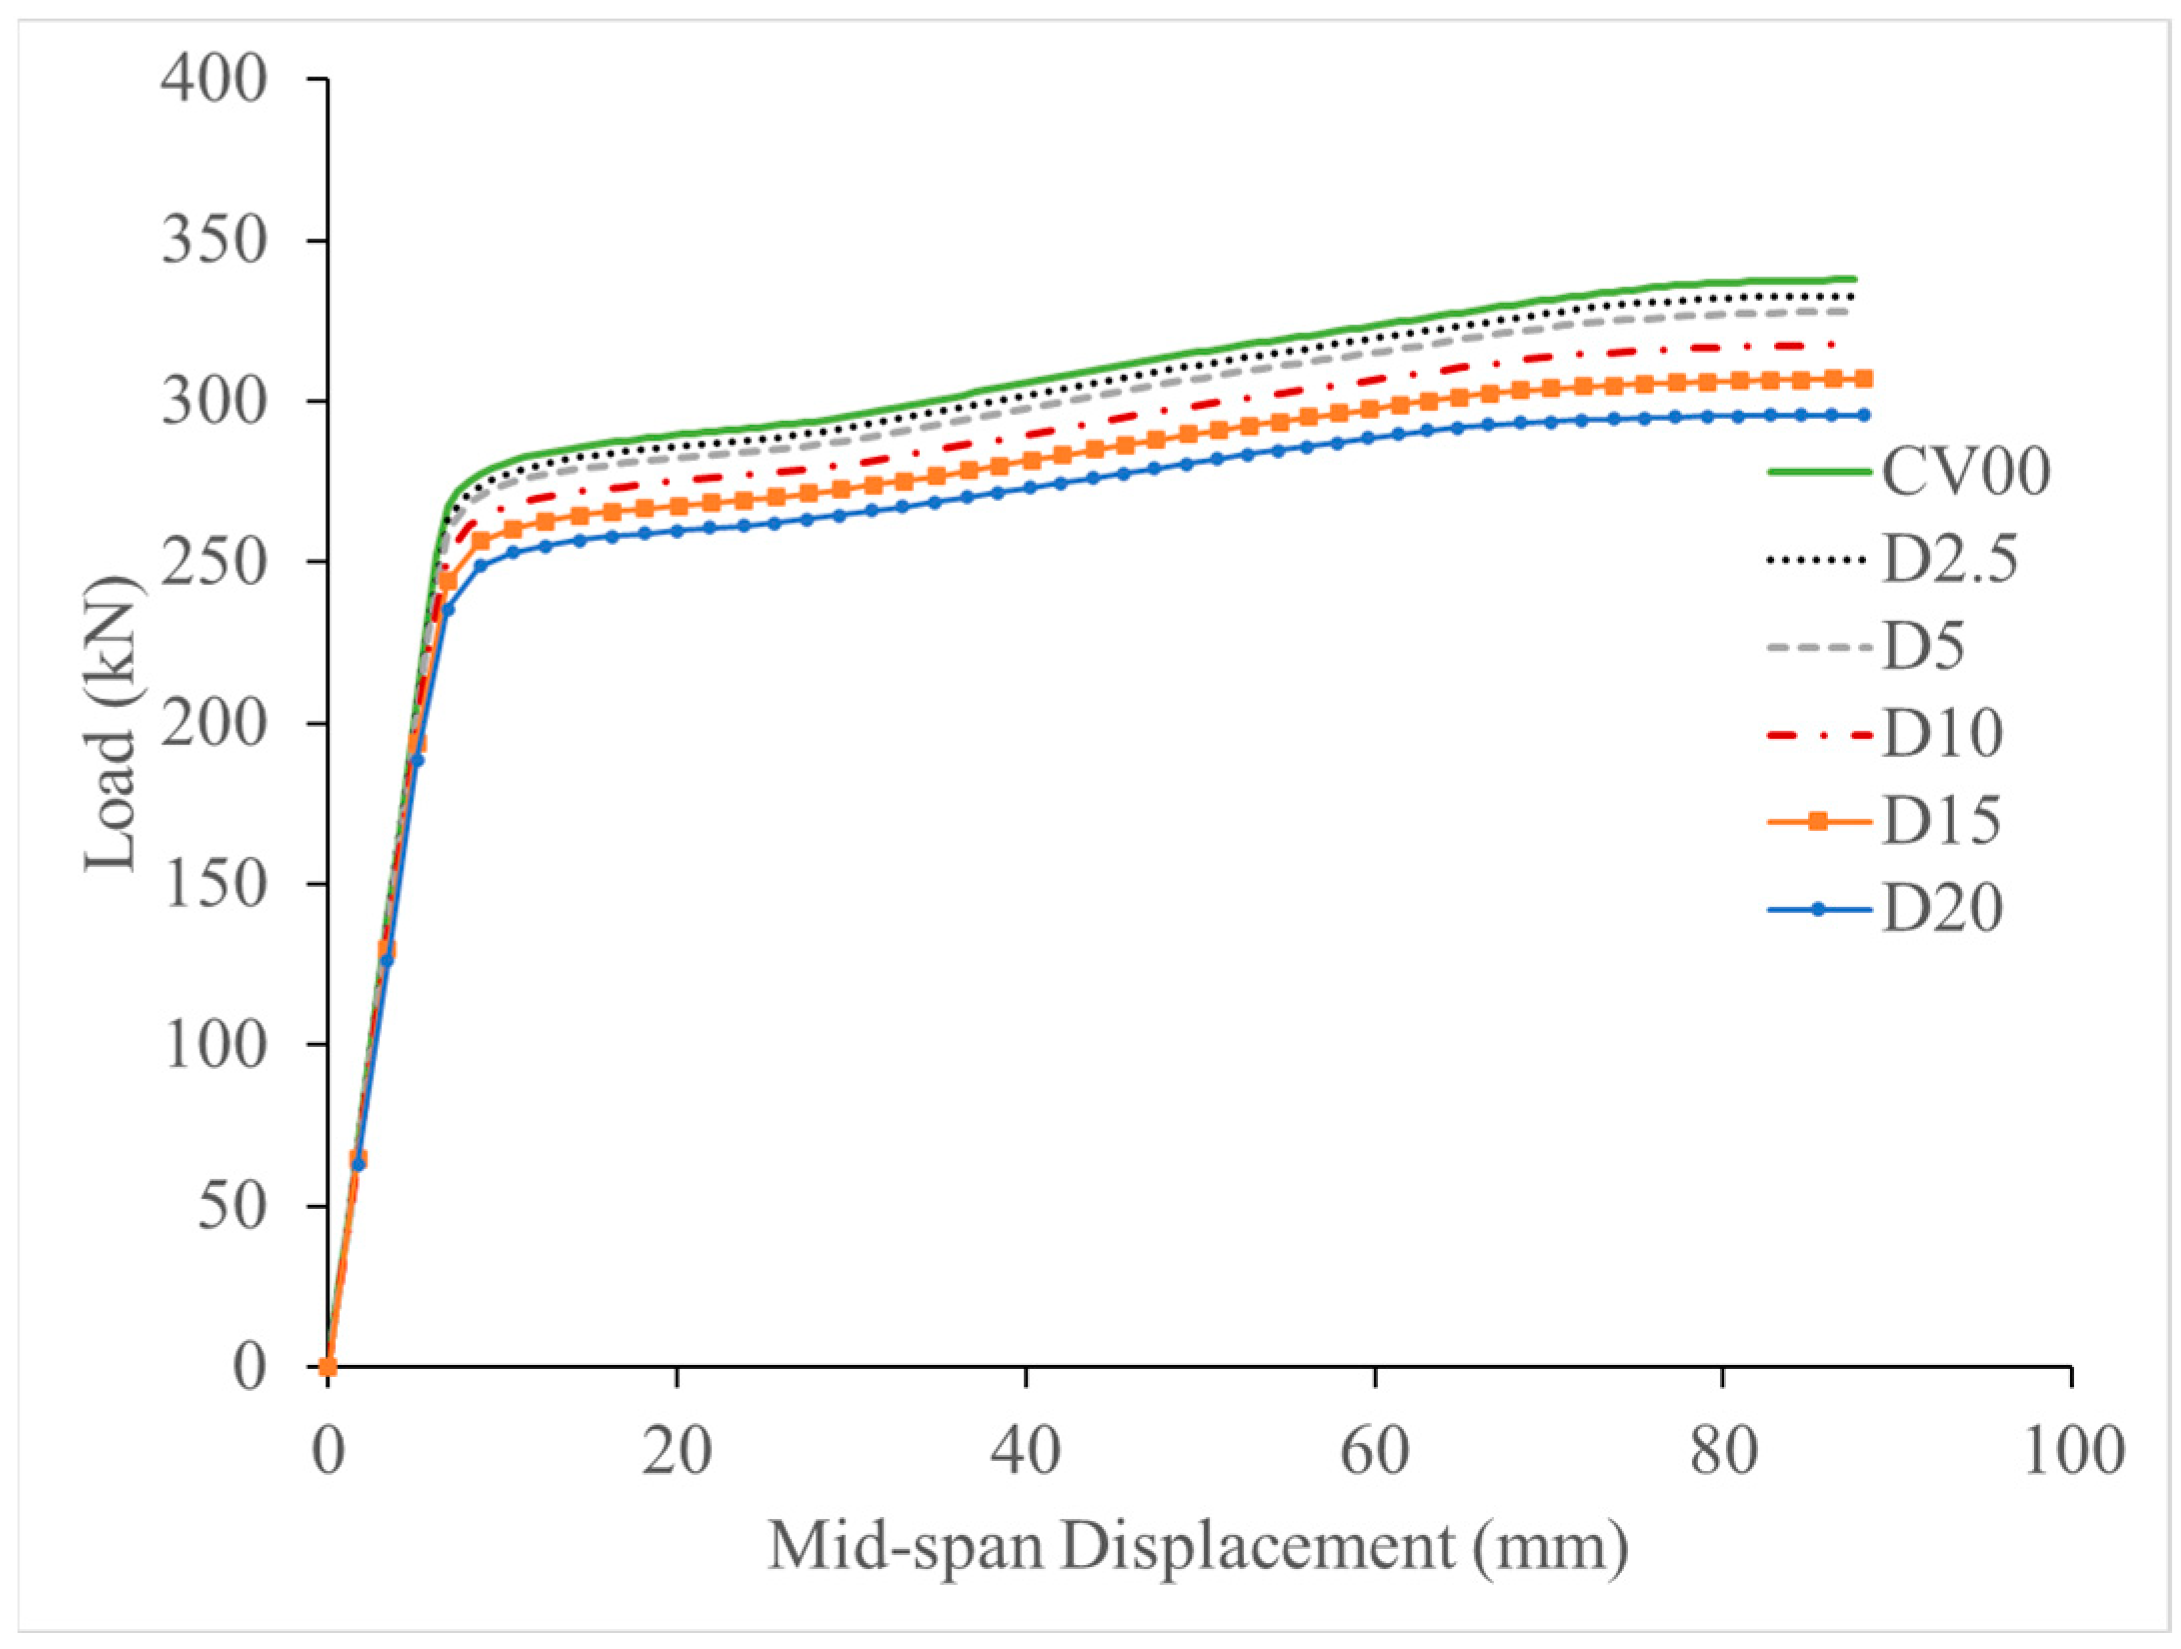
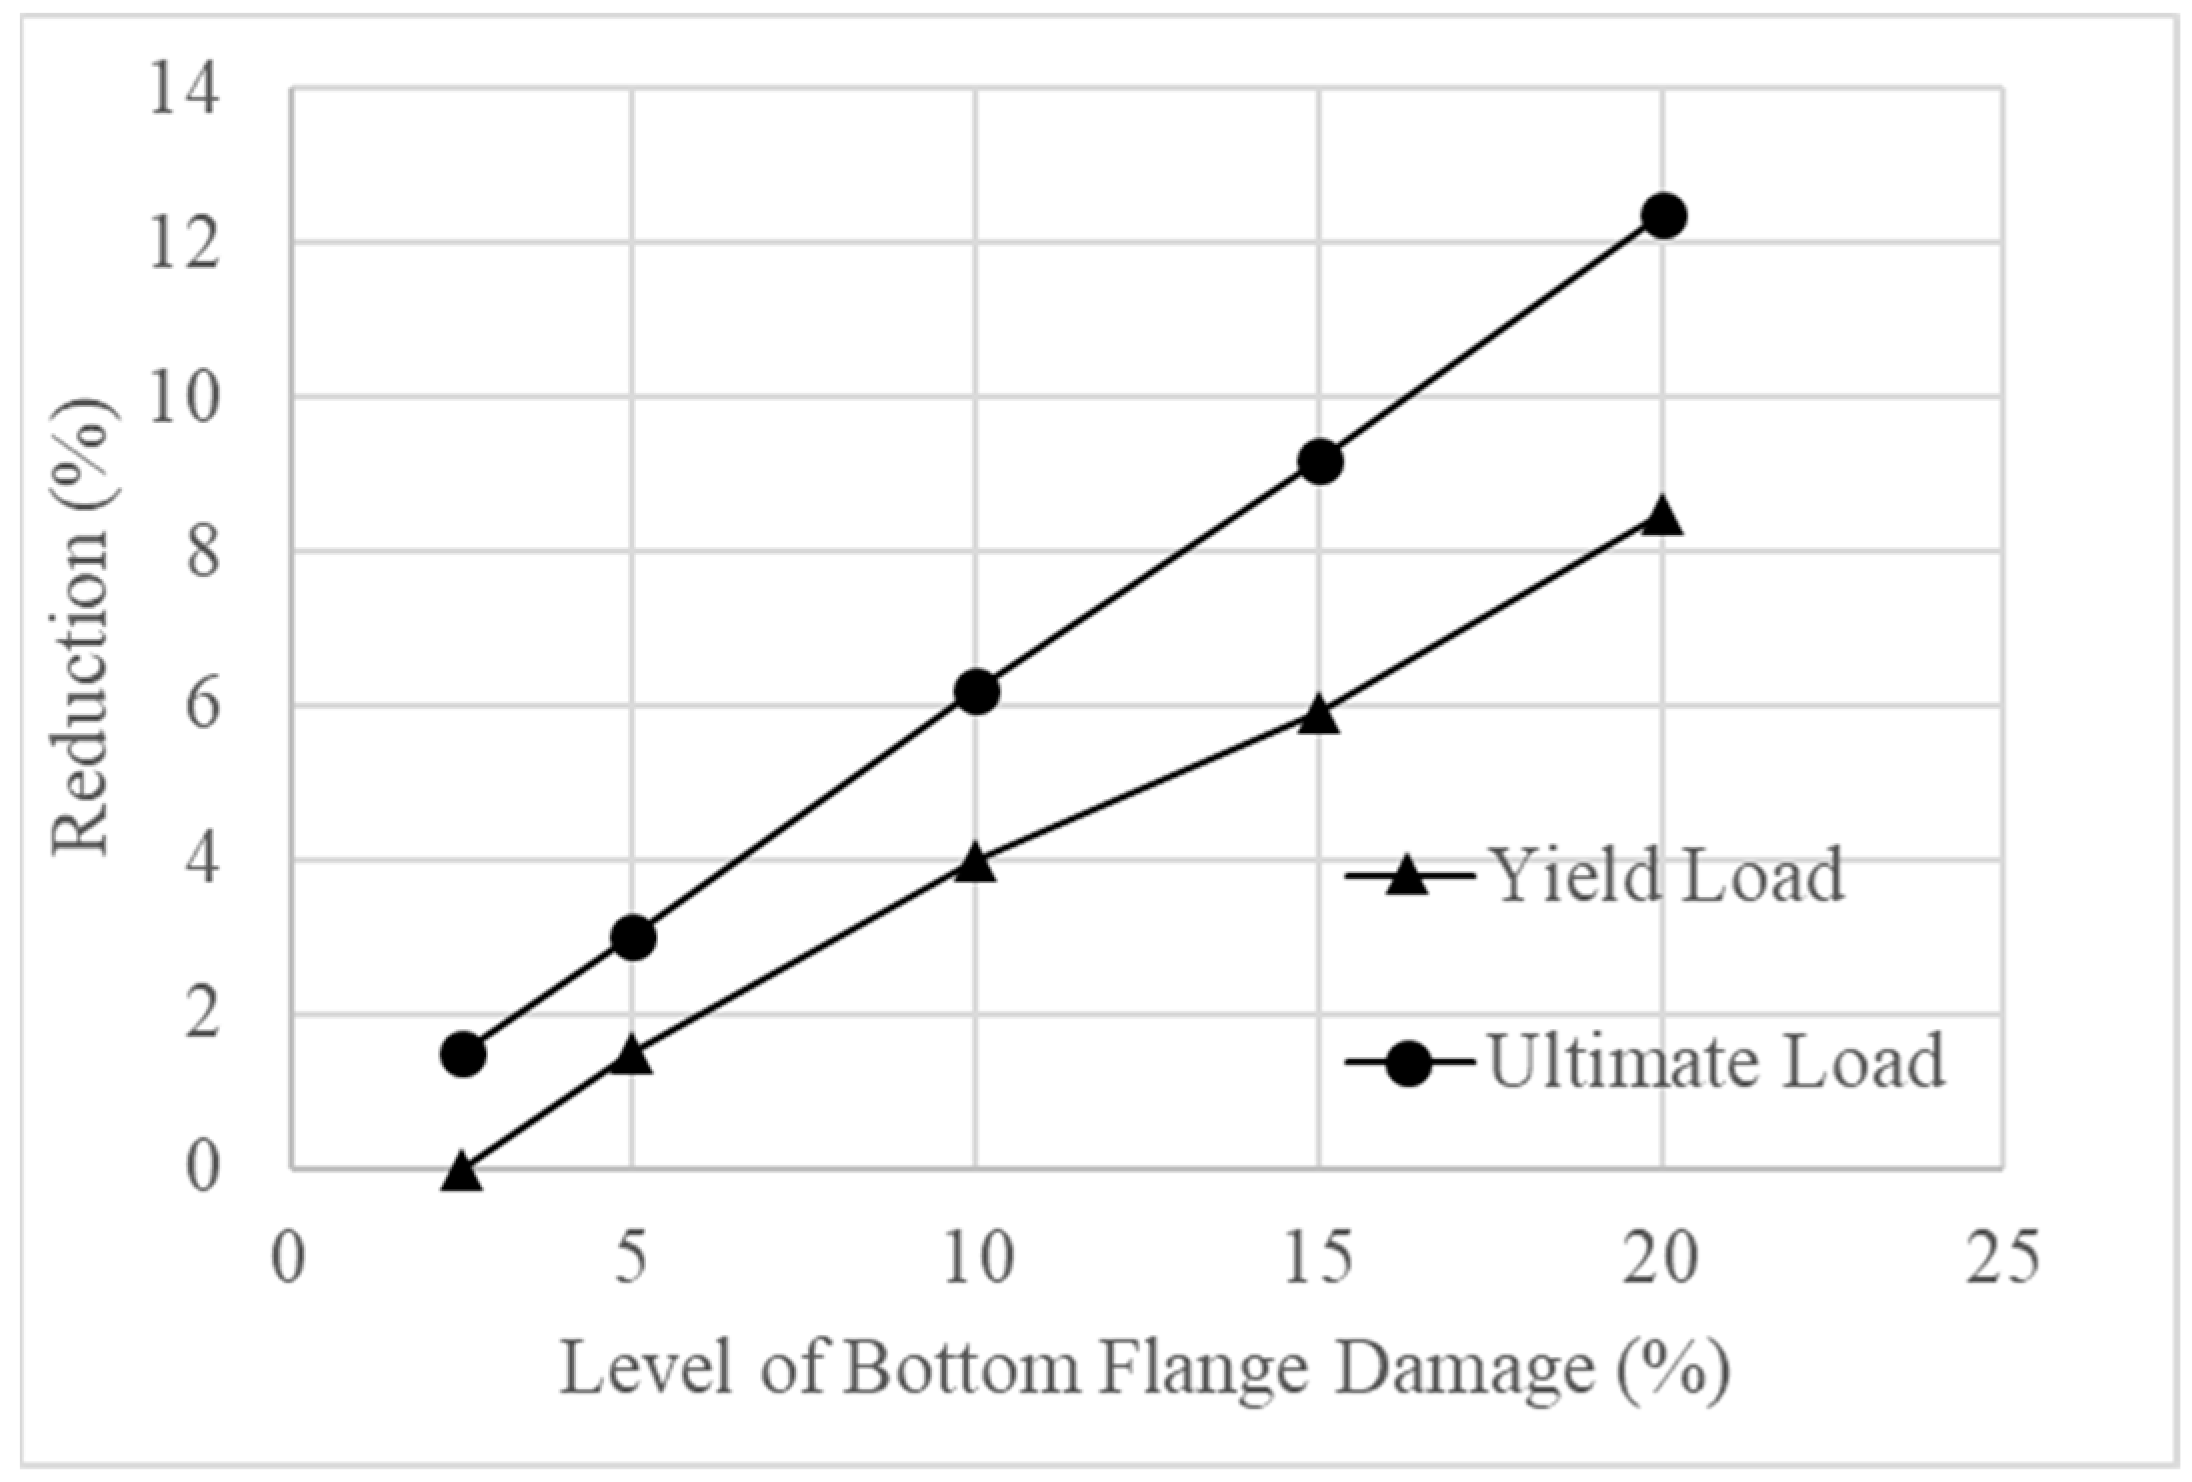
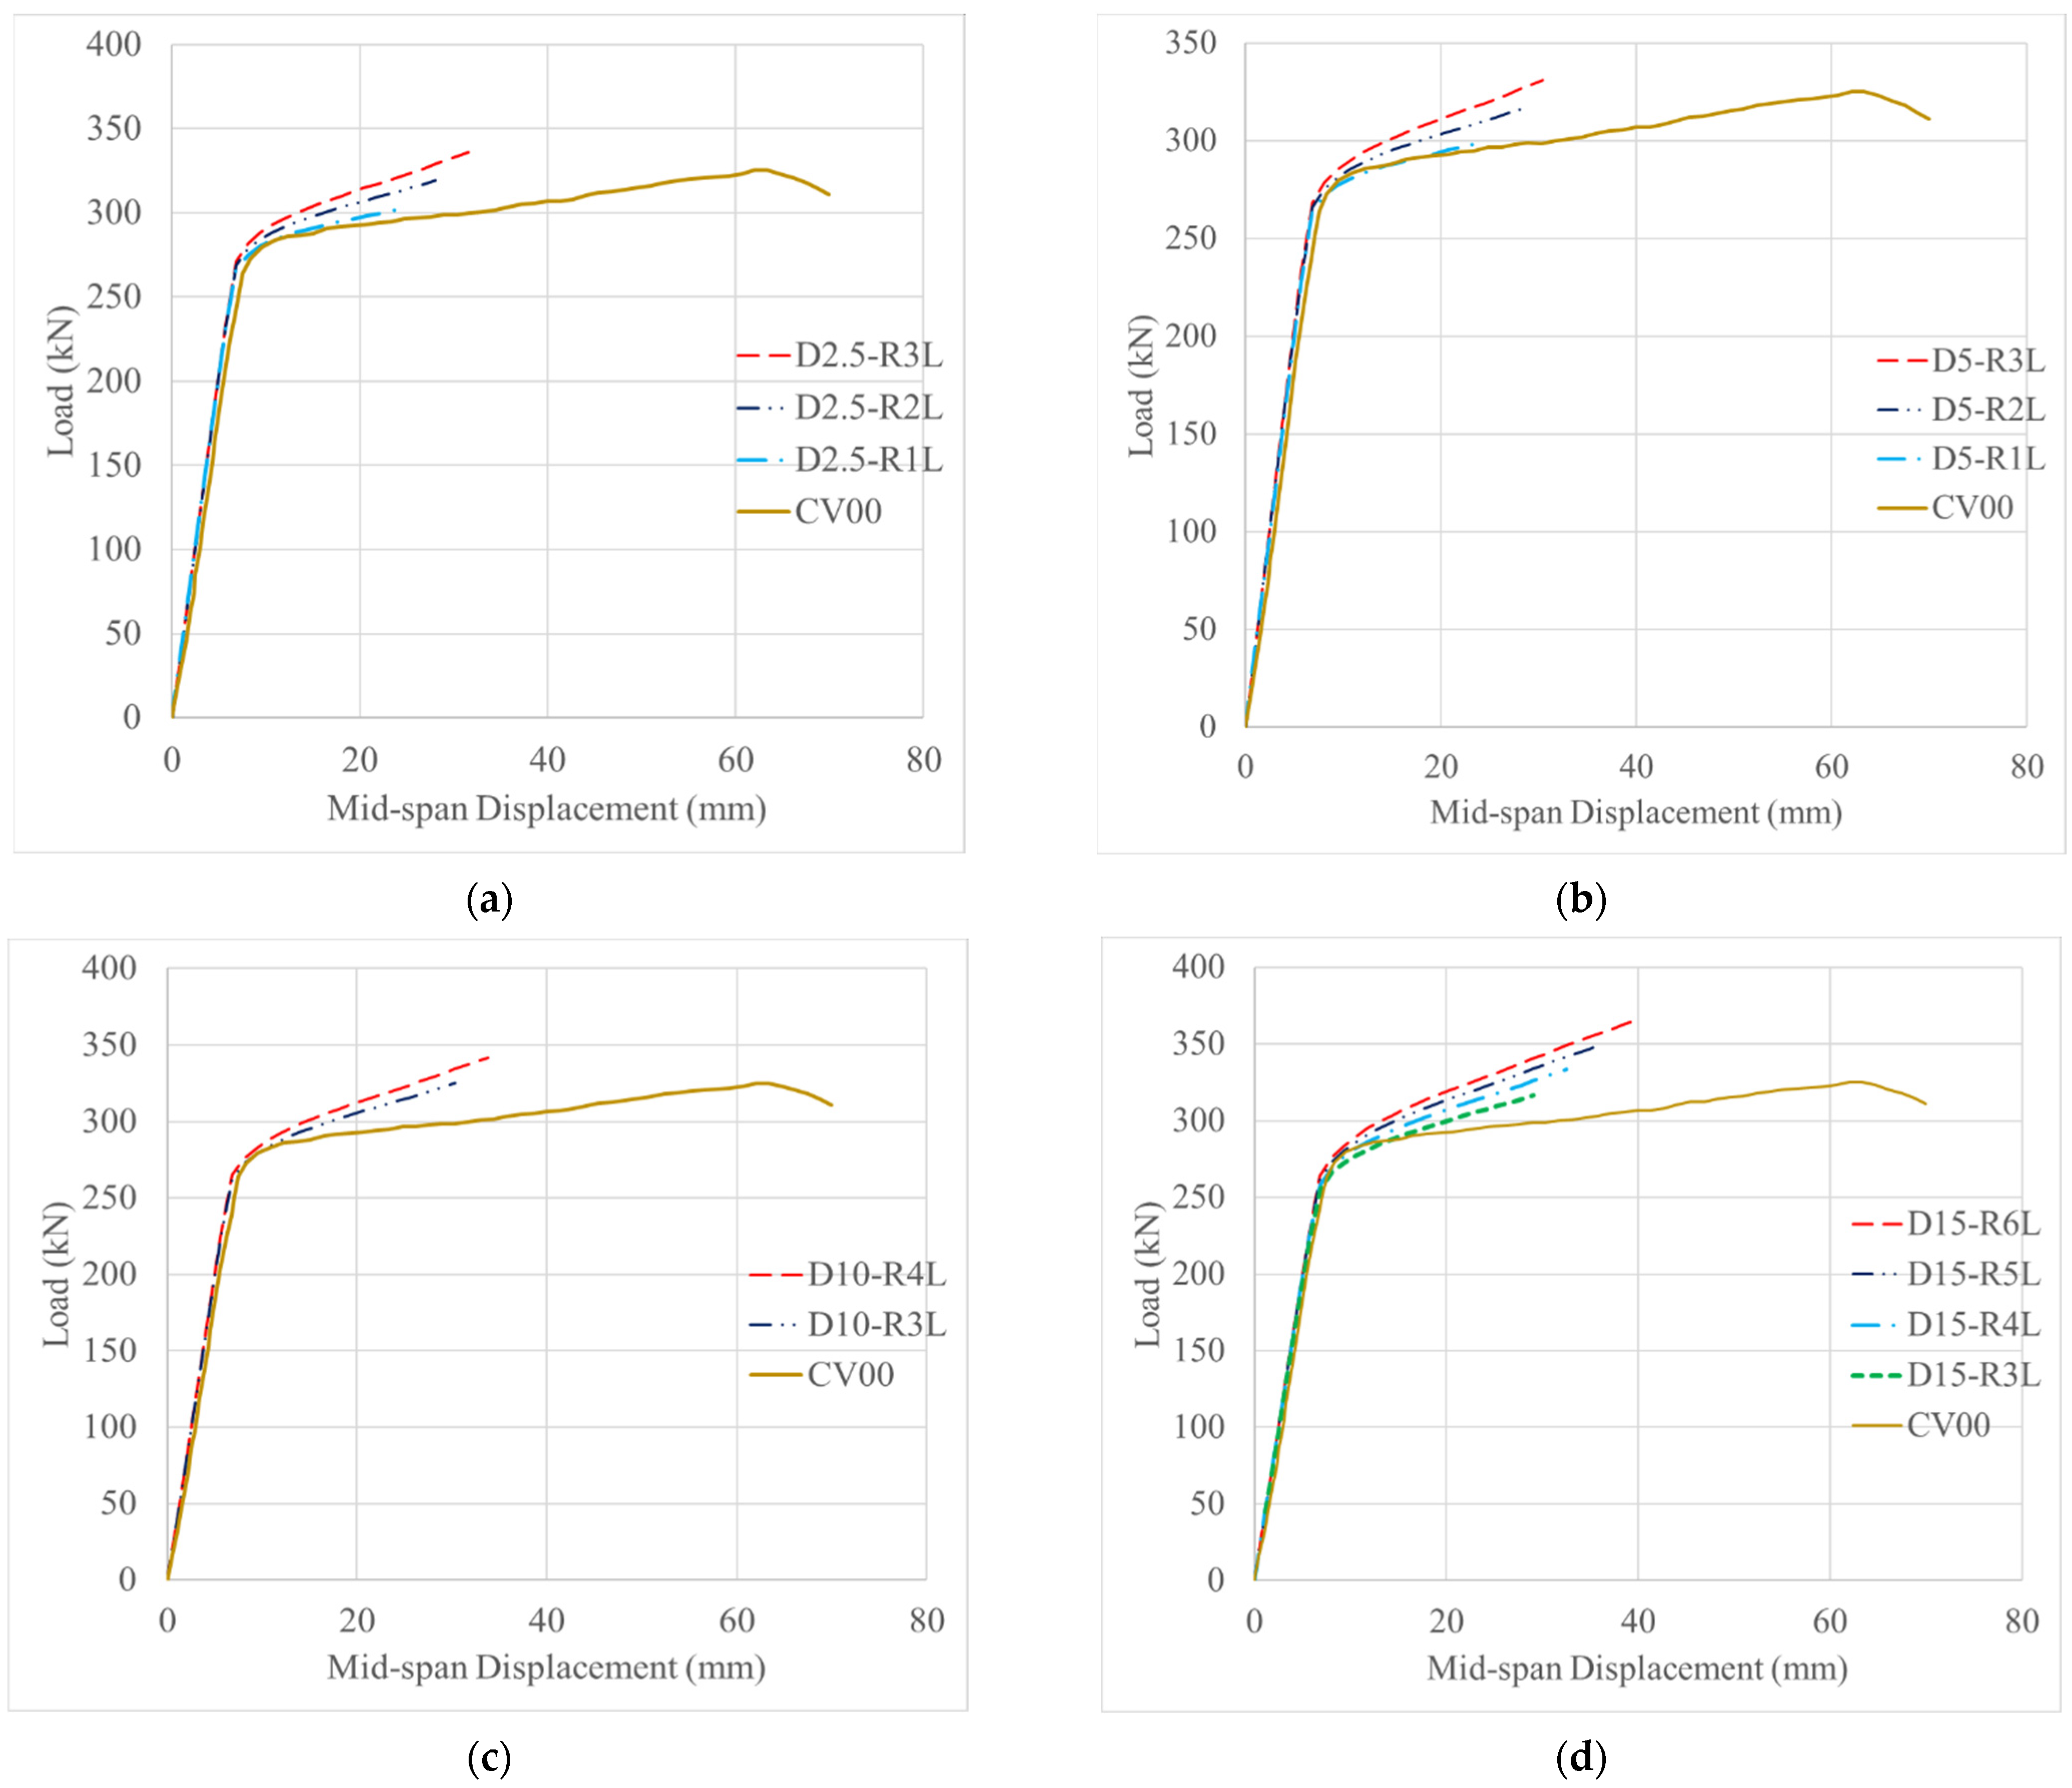
5.1. Effect of Corrosion and CFRP Strengthening
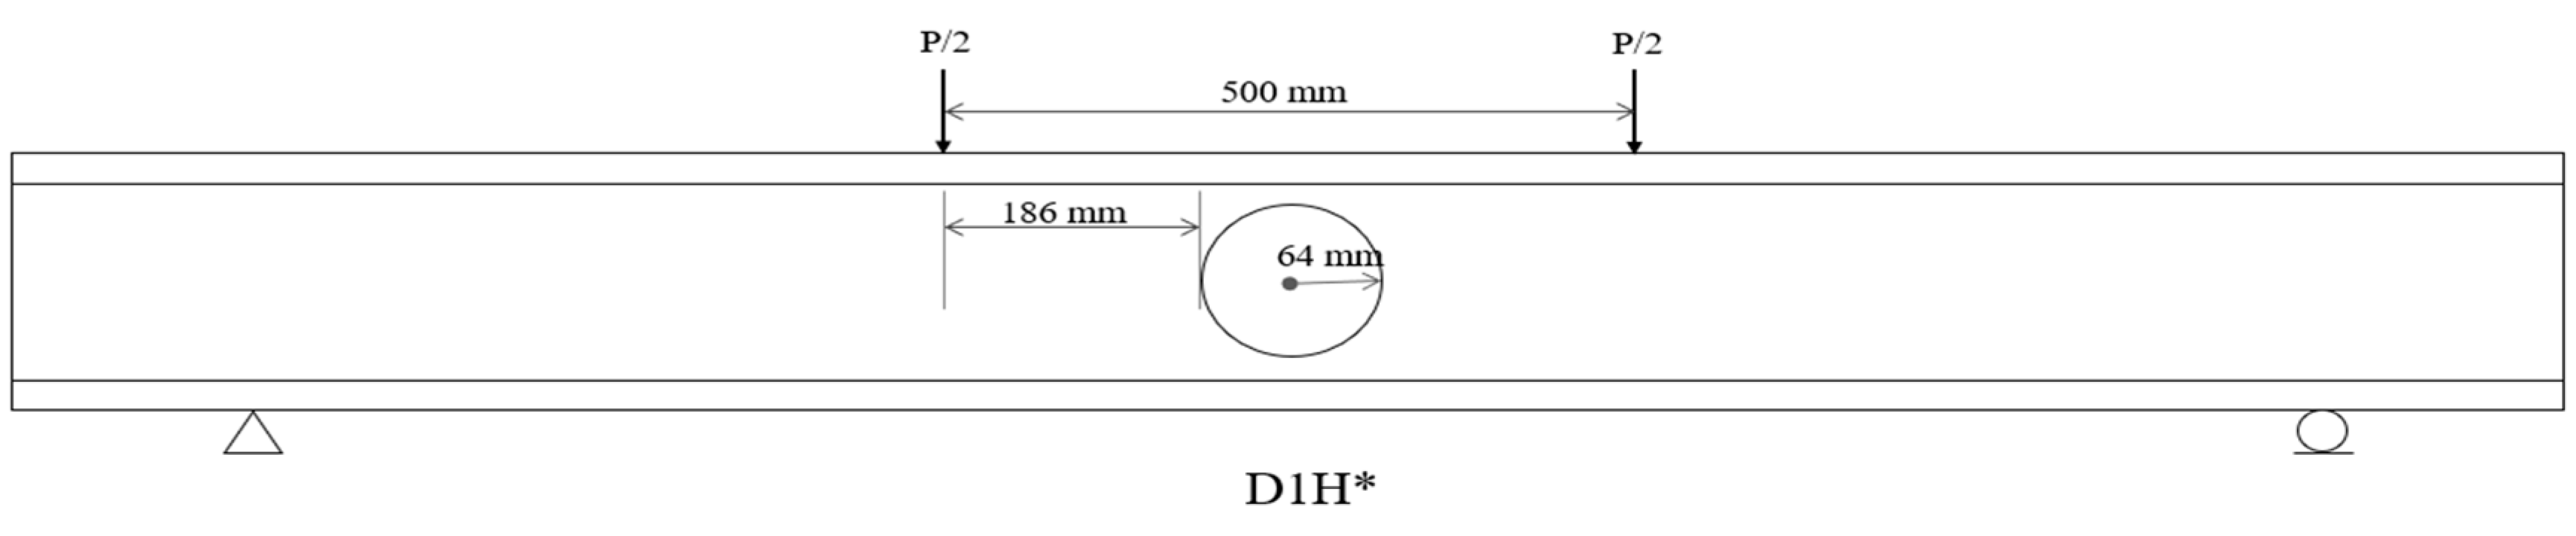
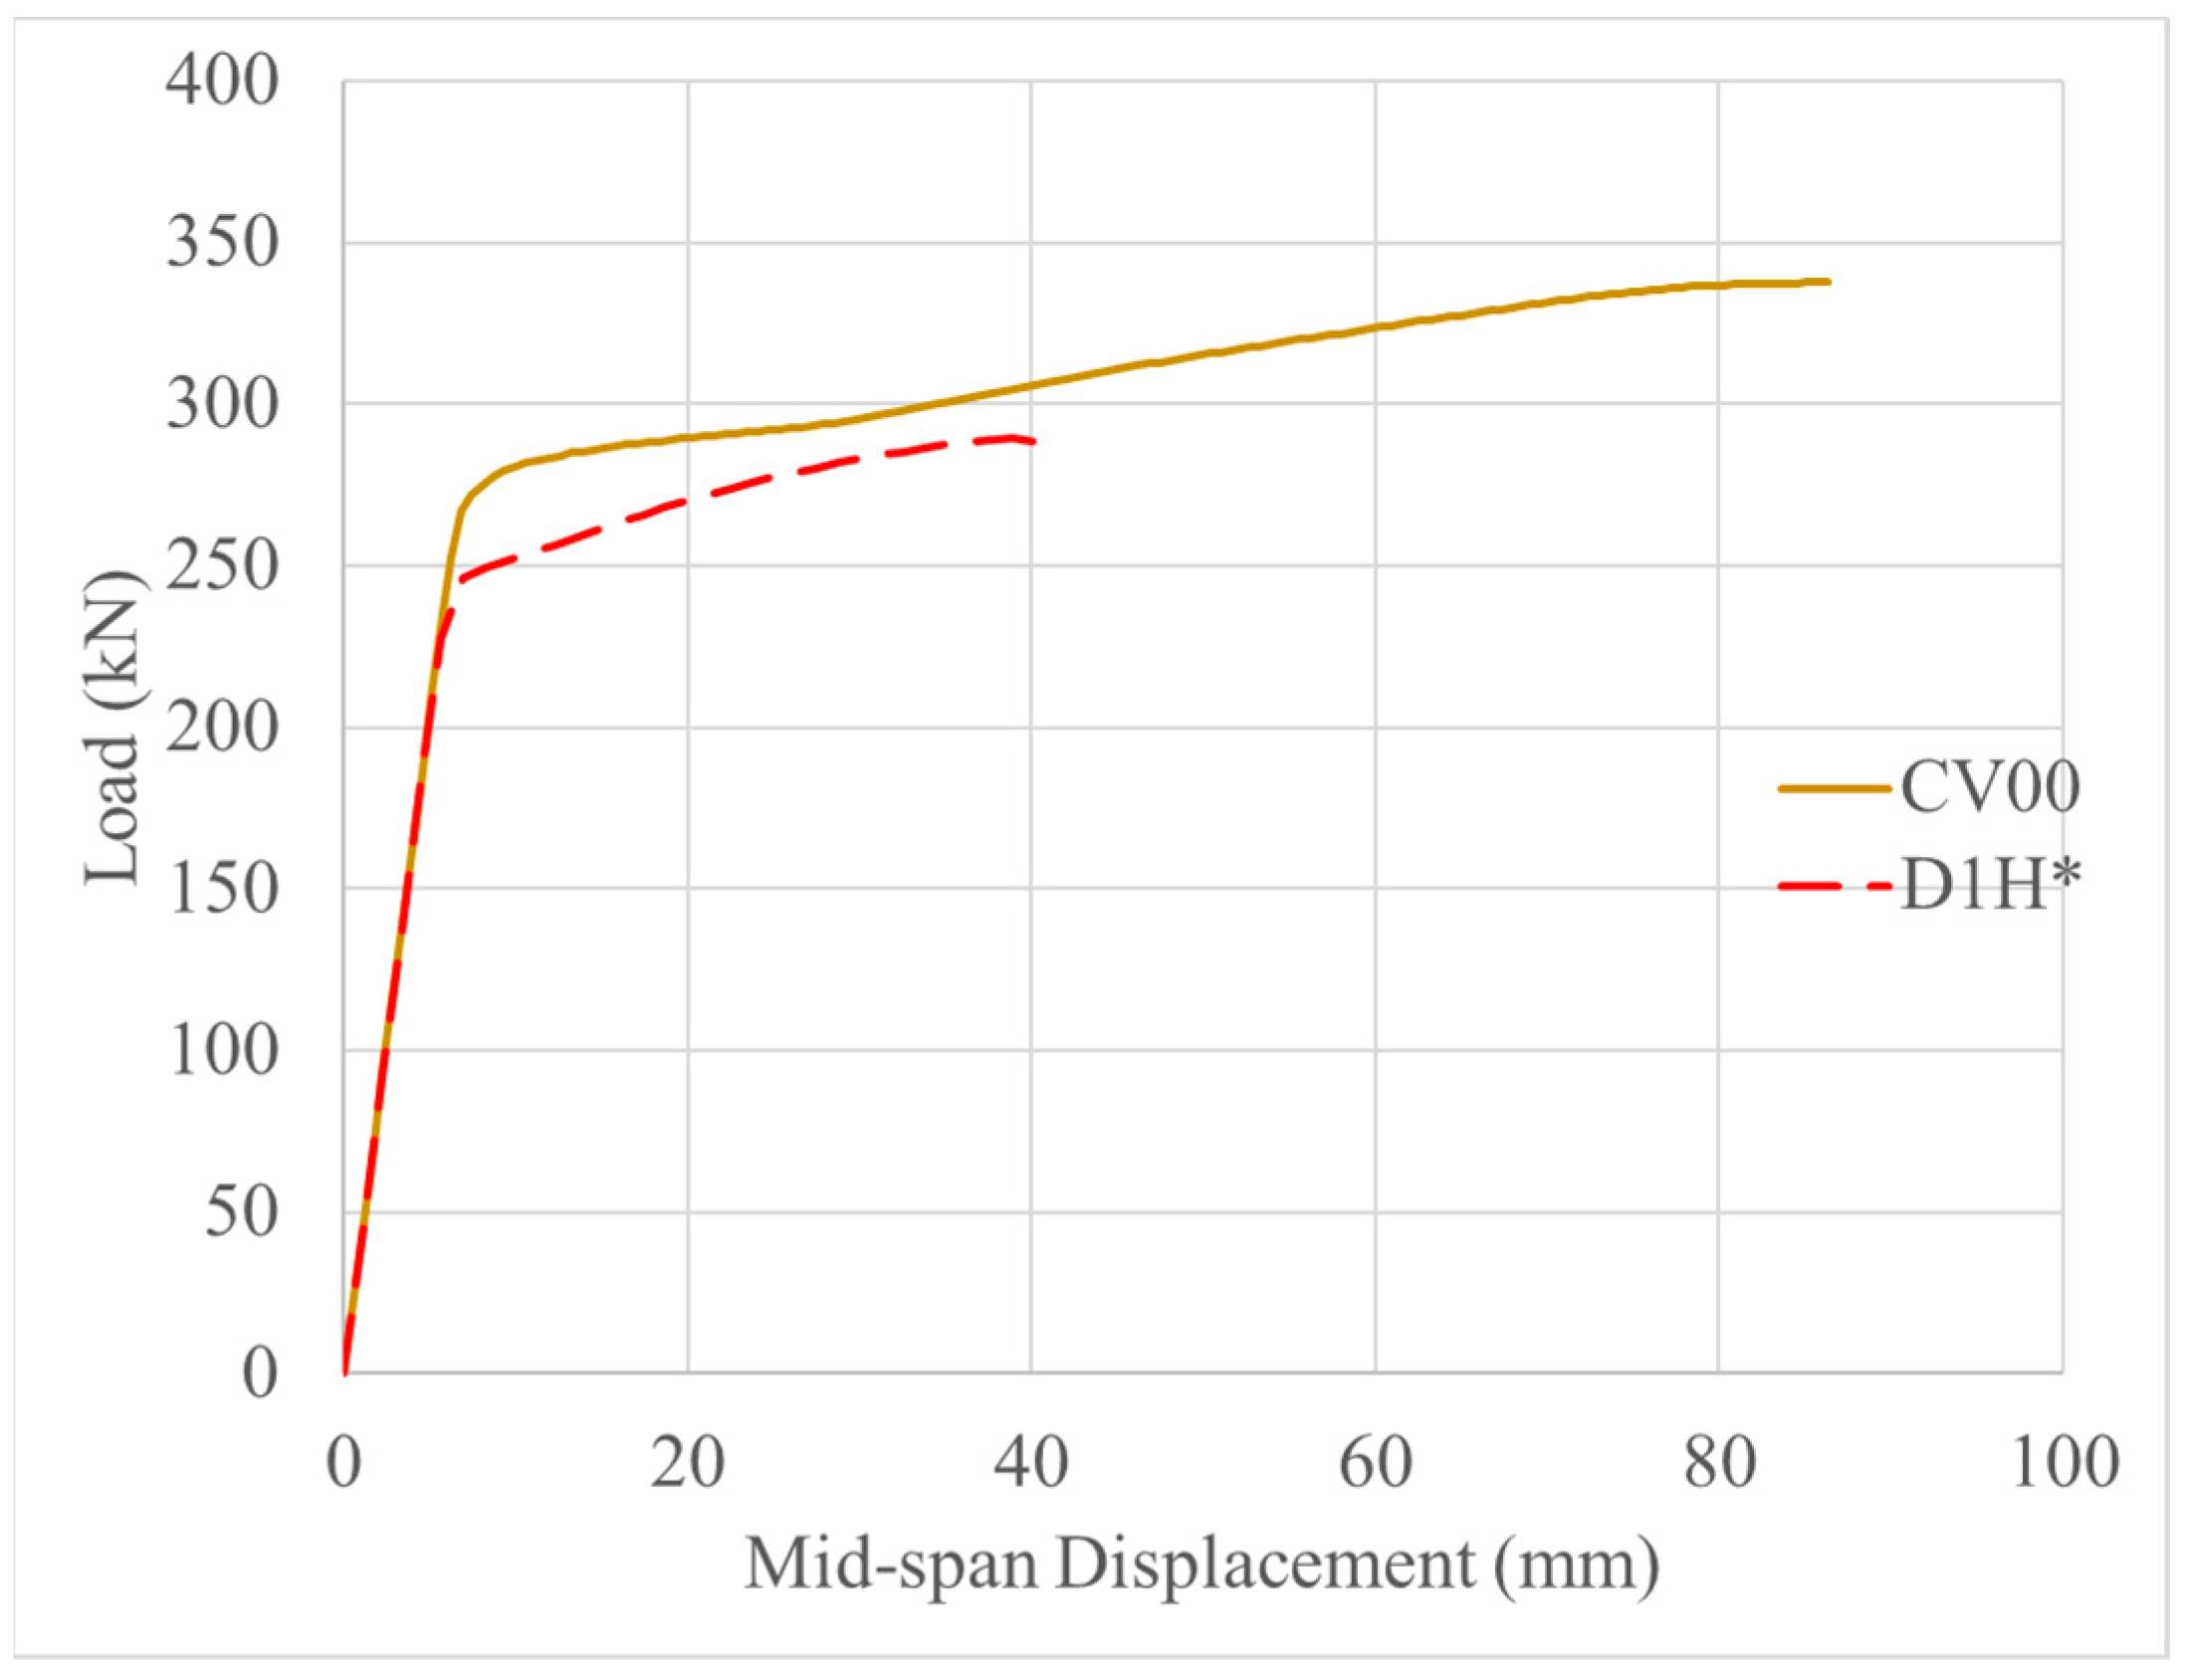
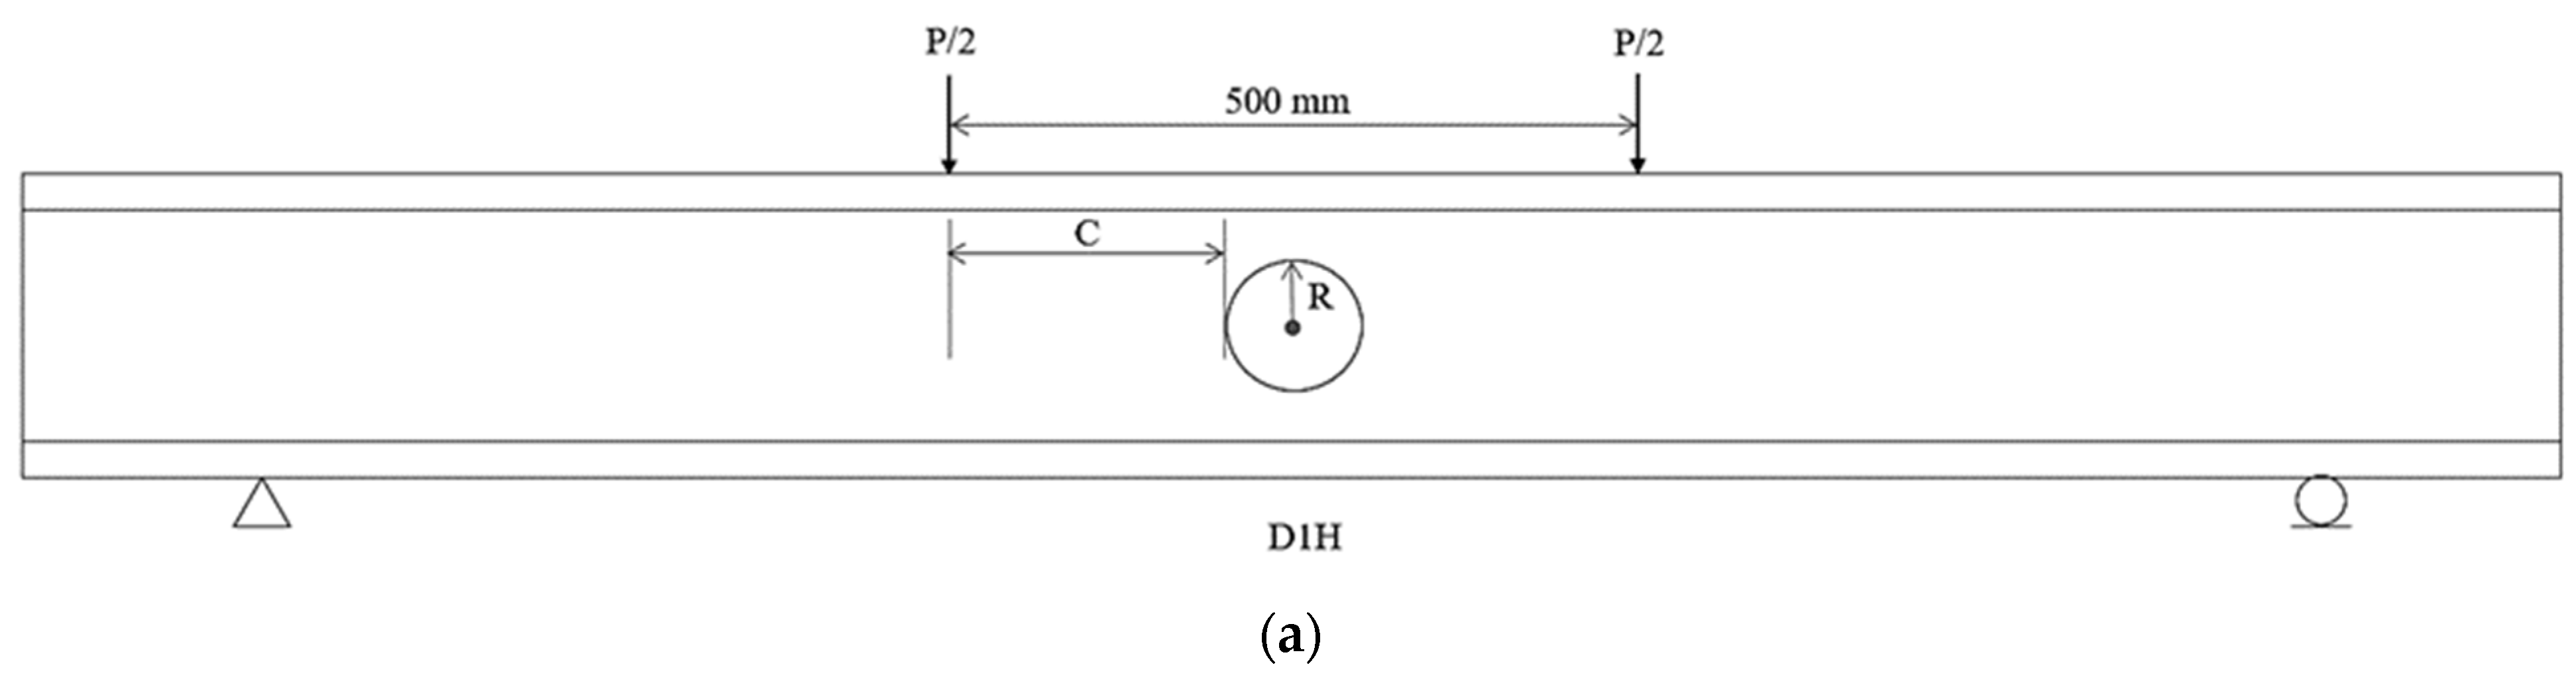
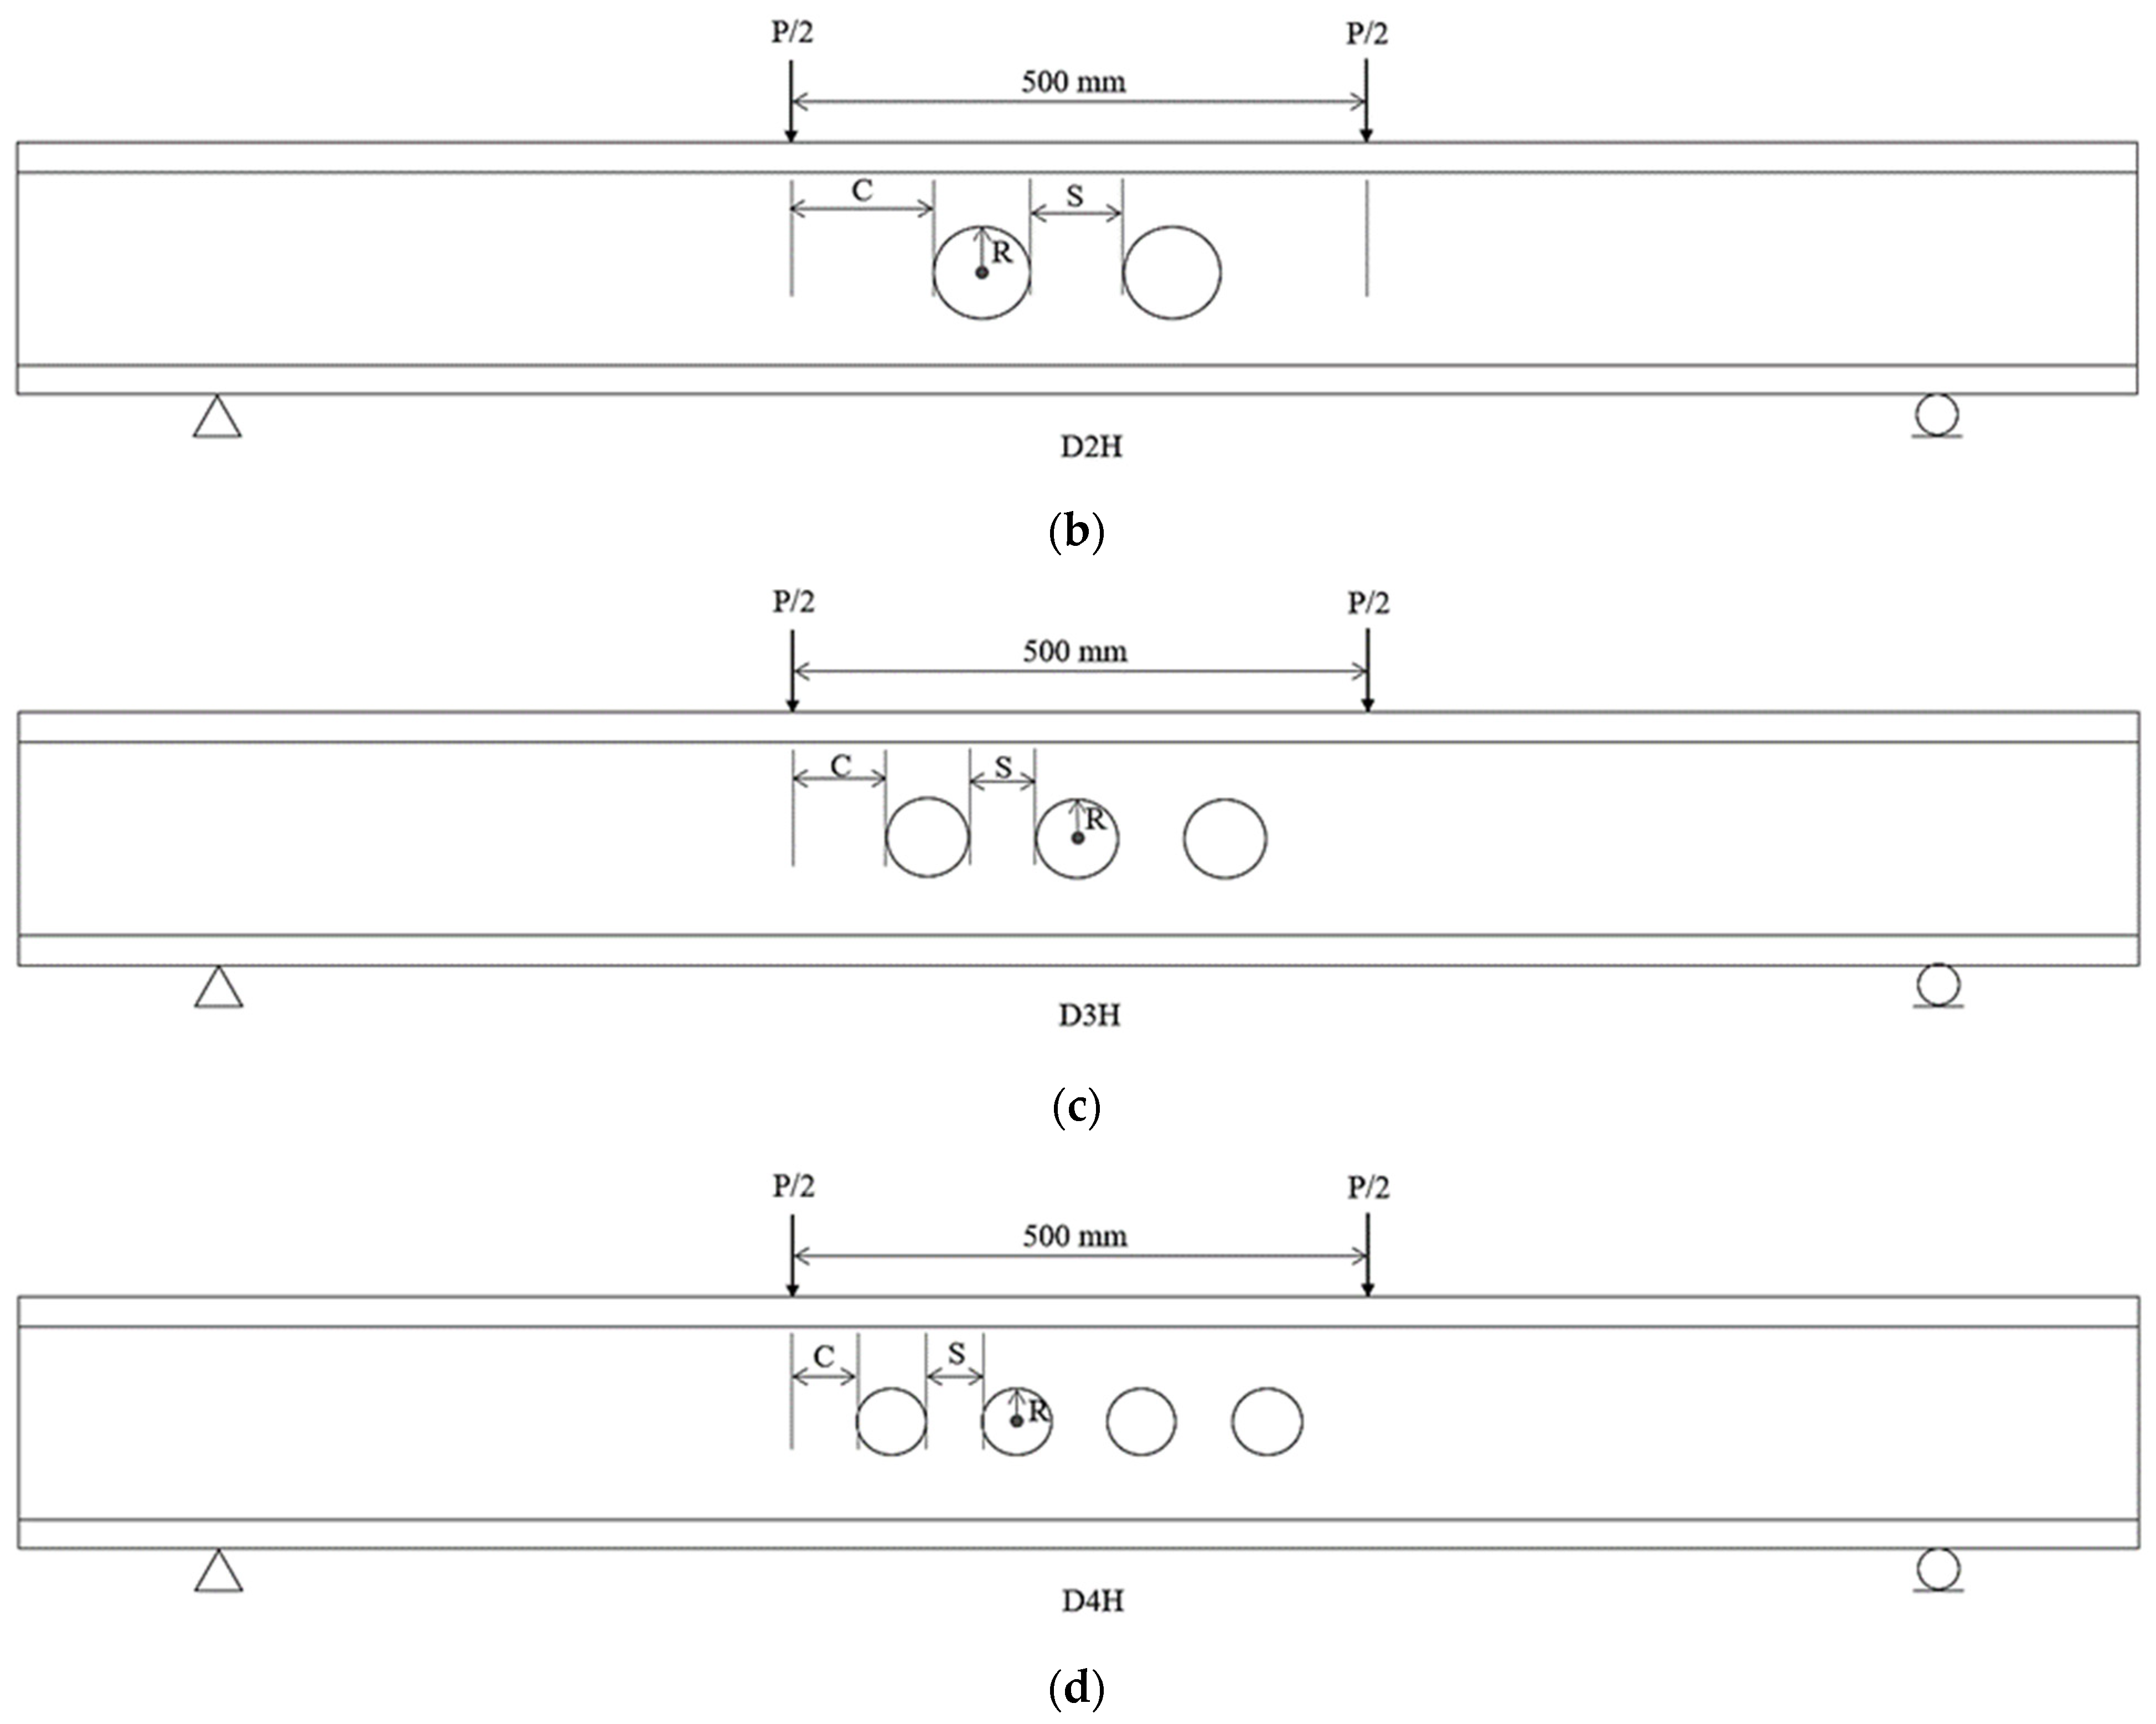
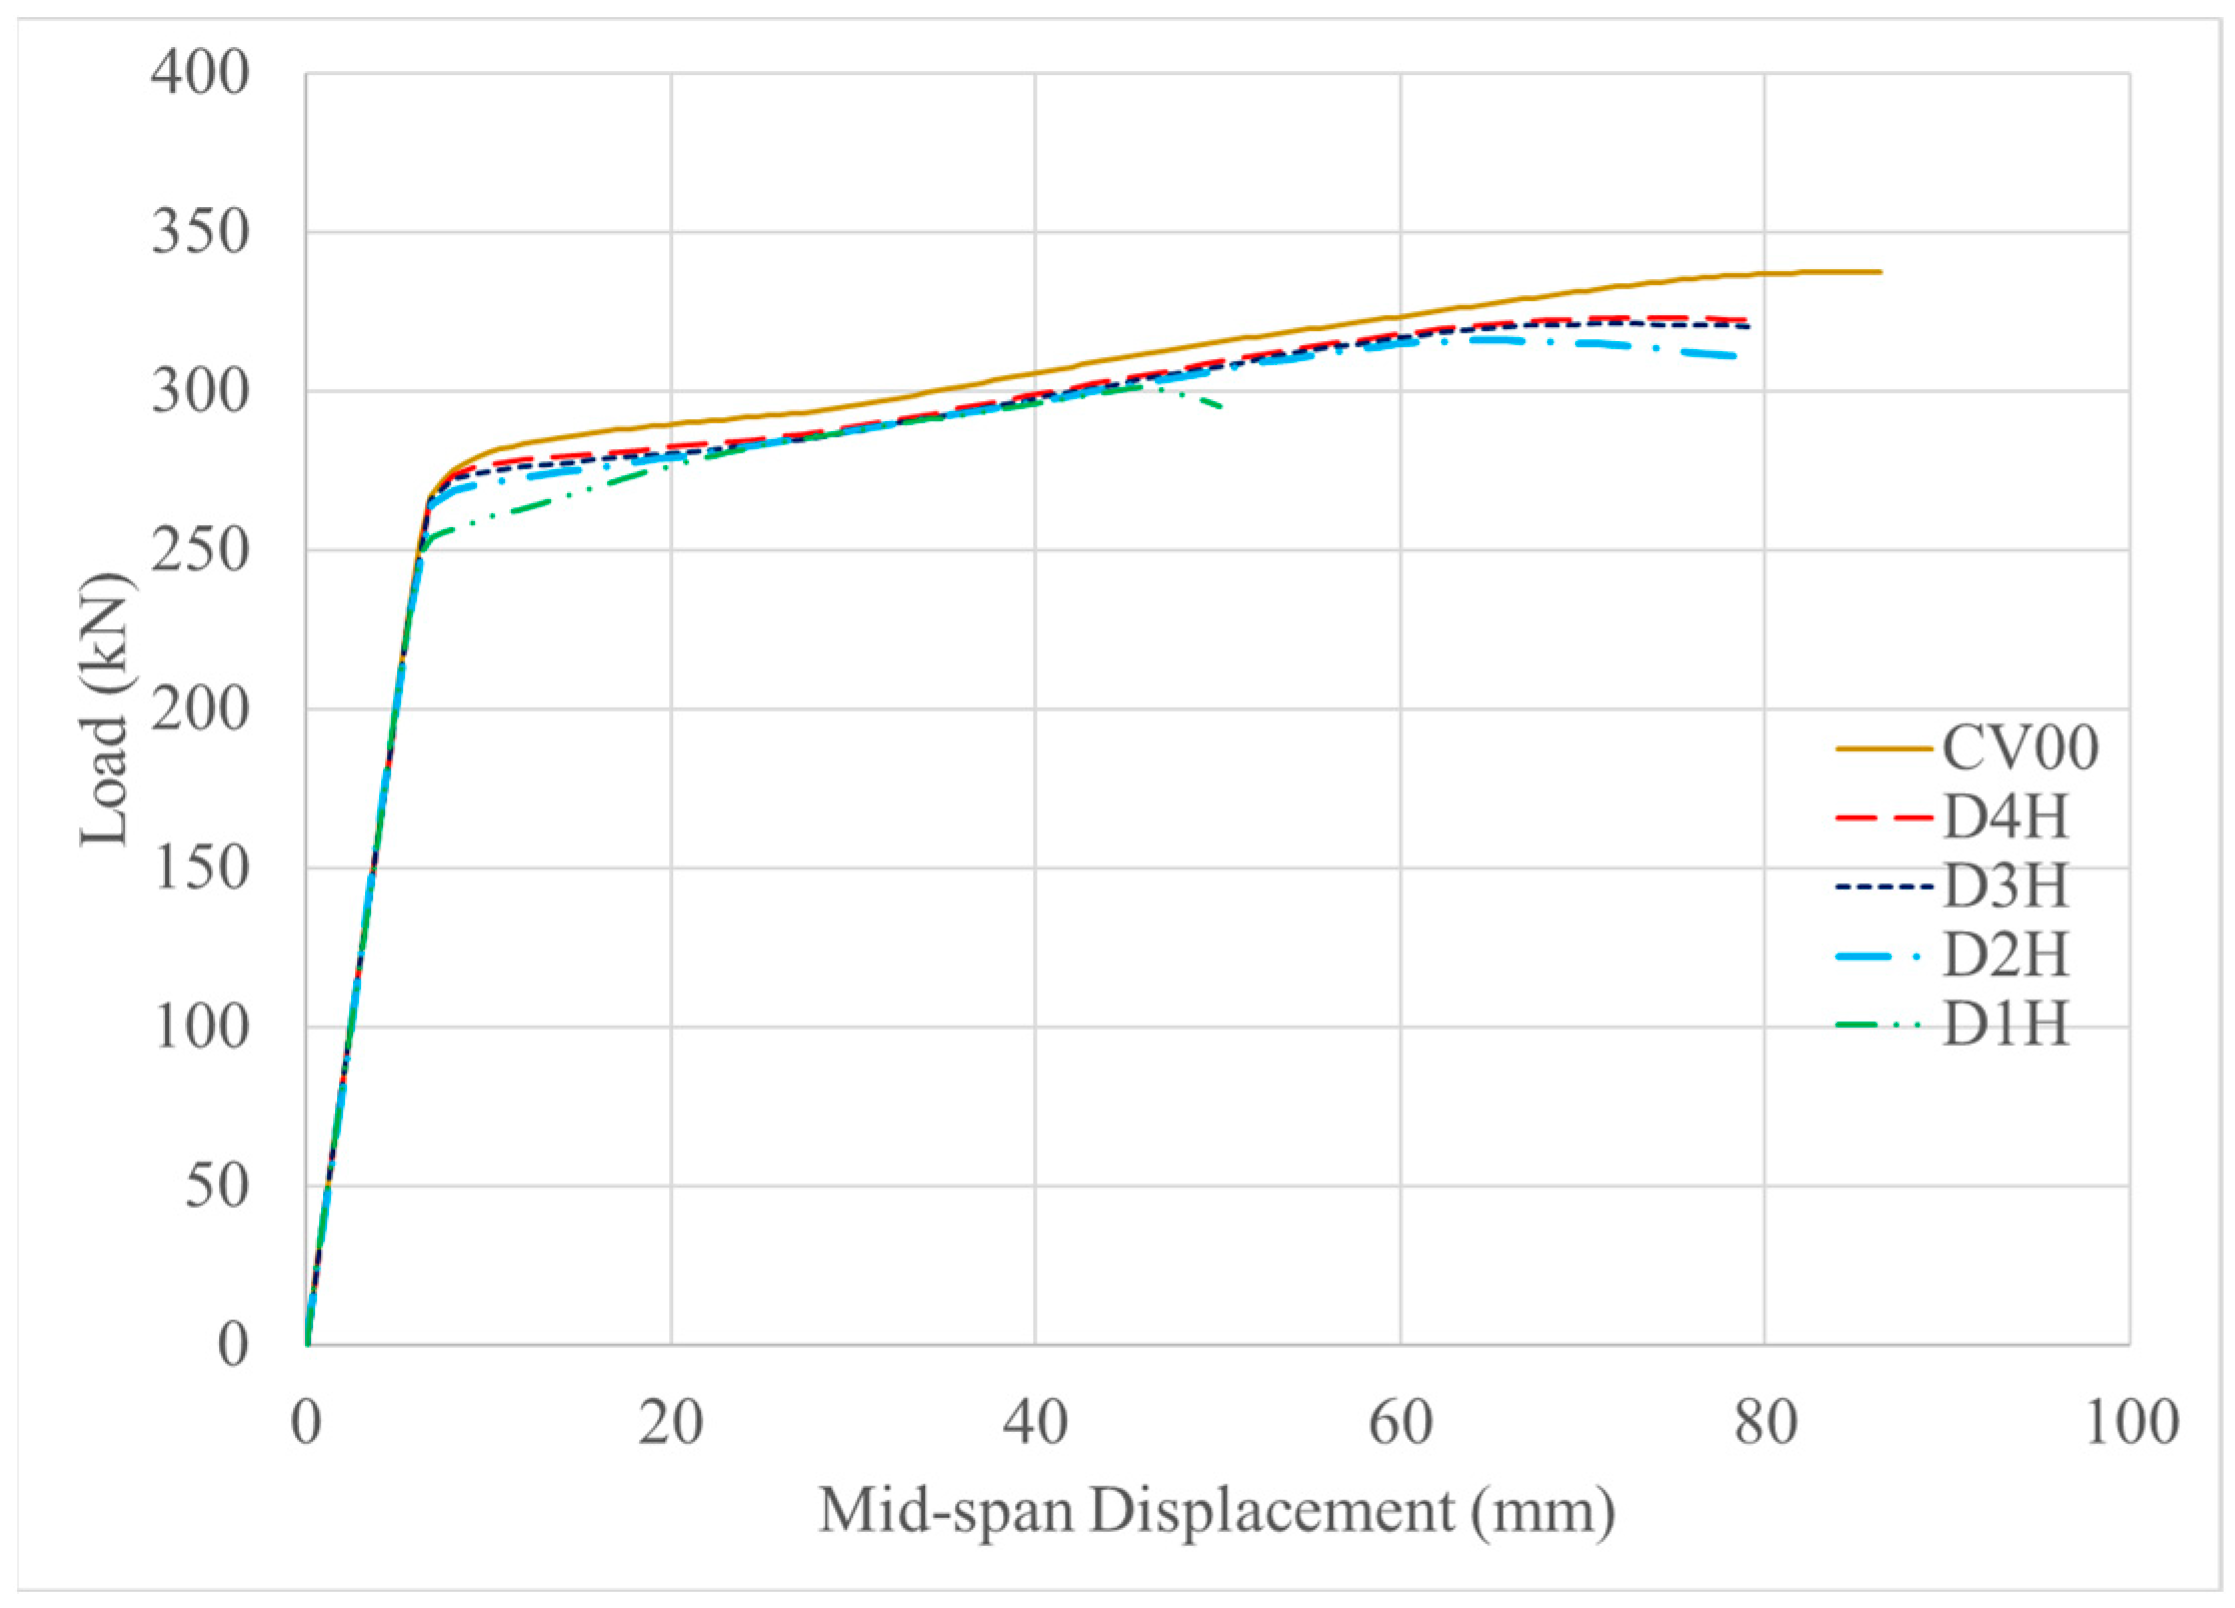
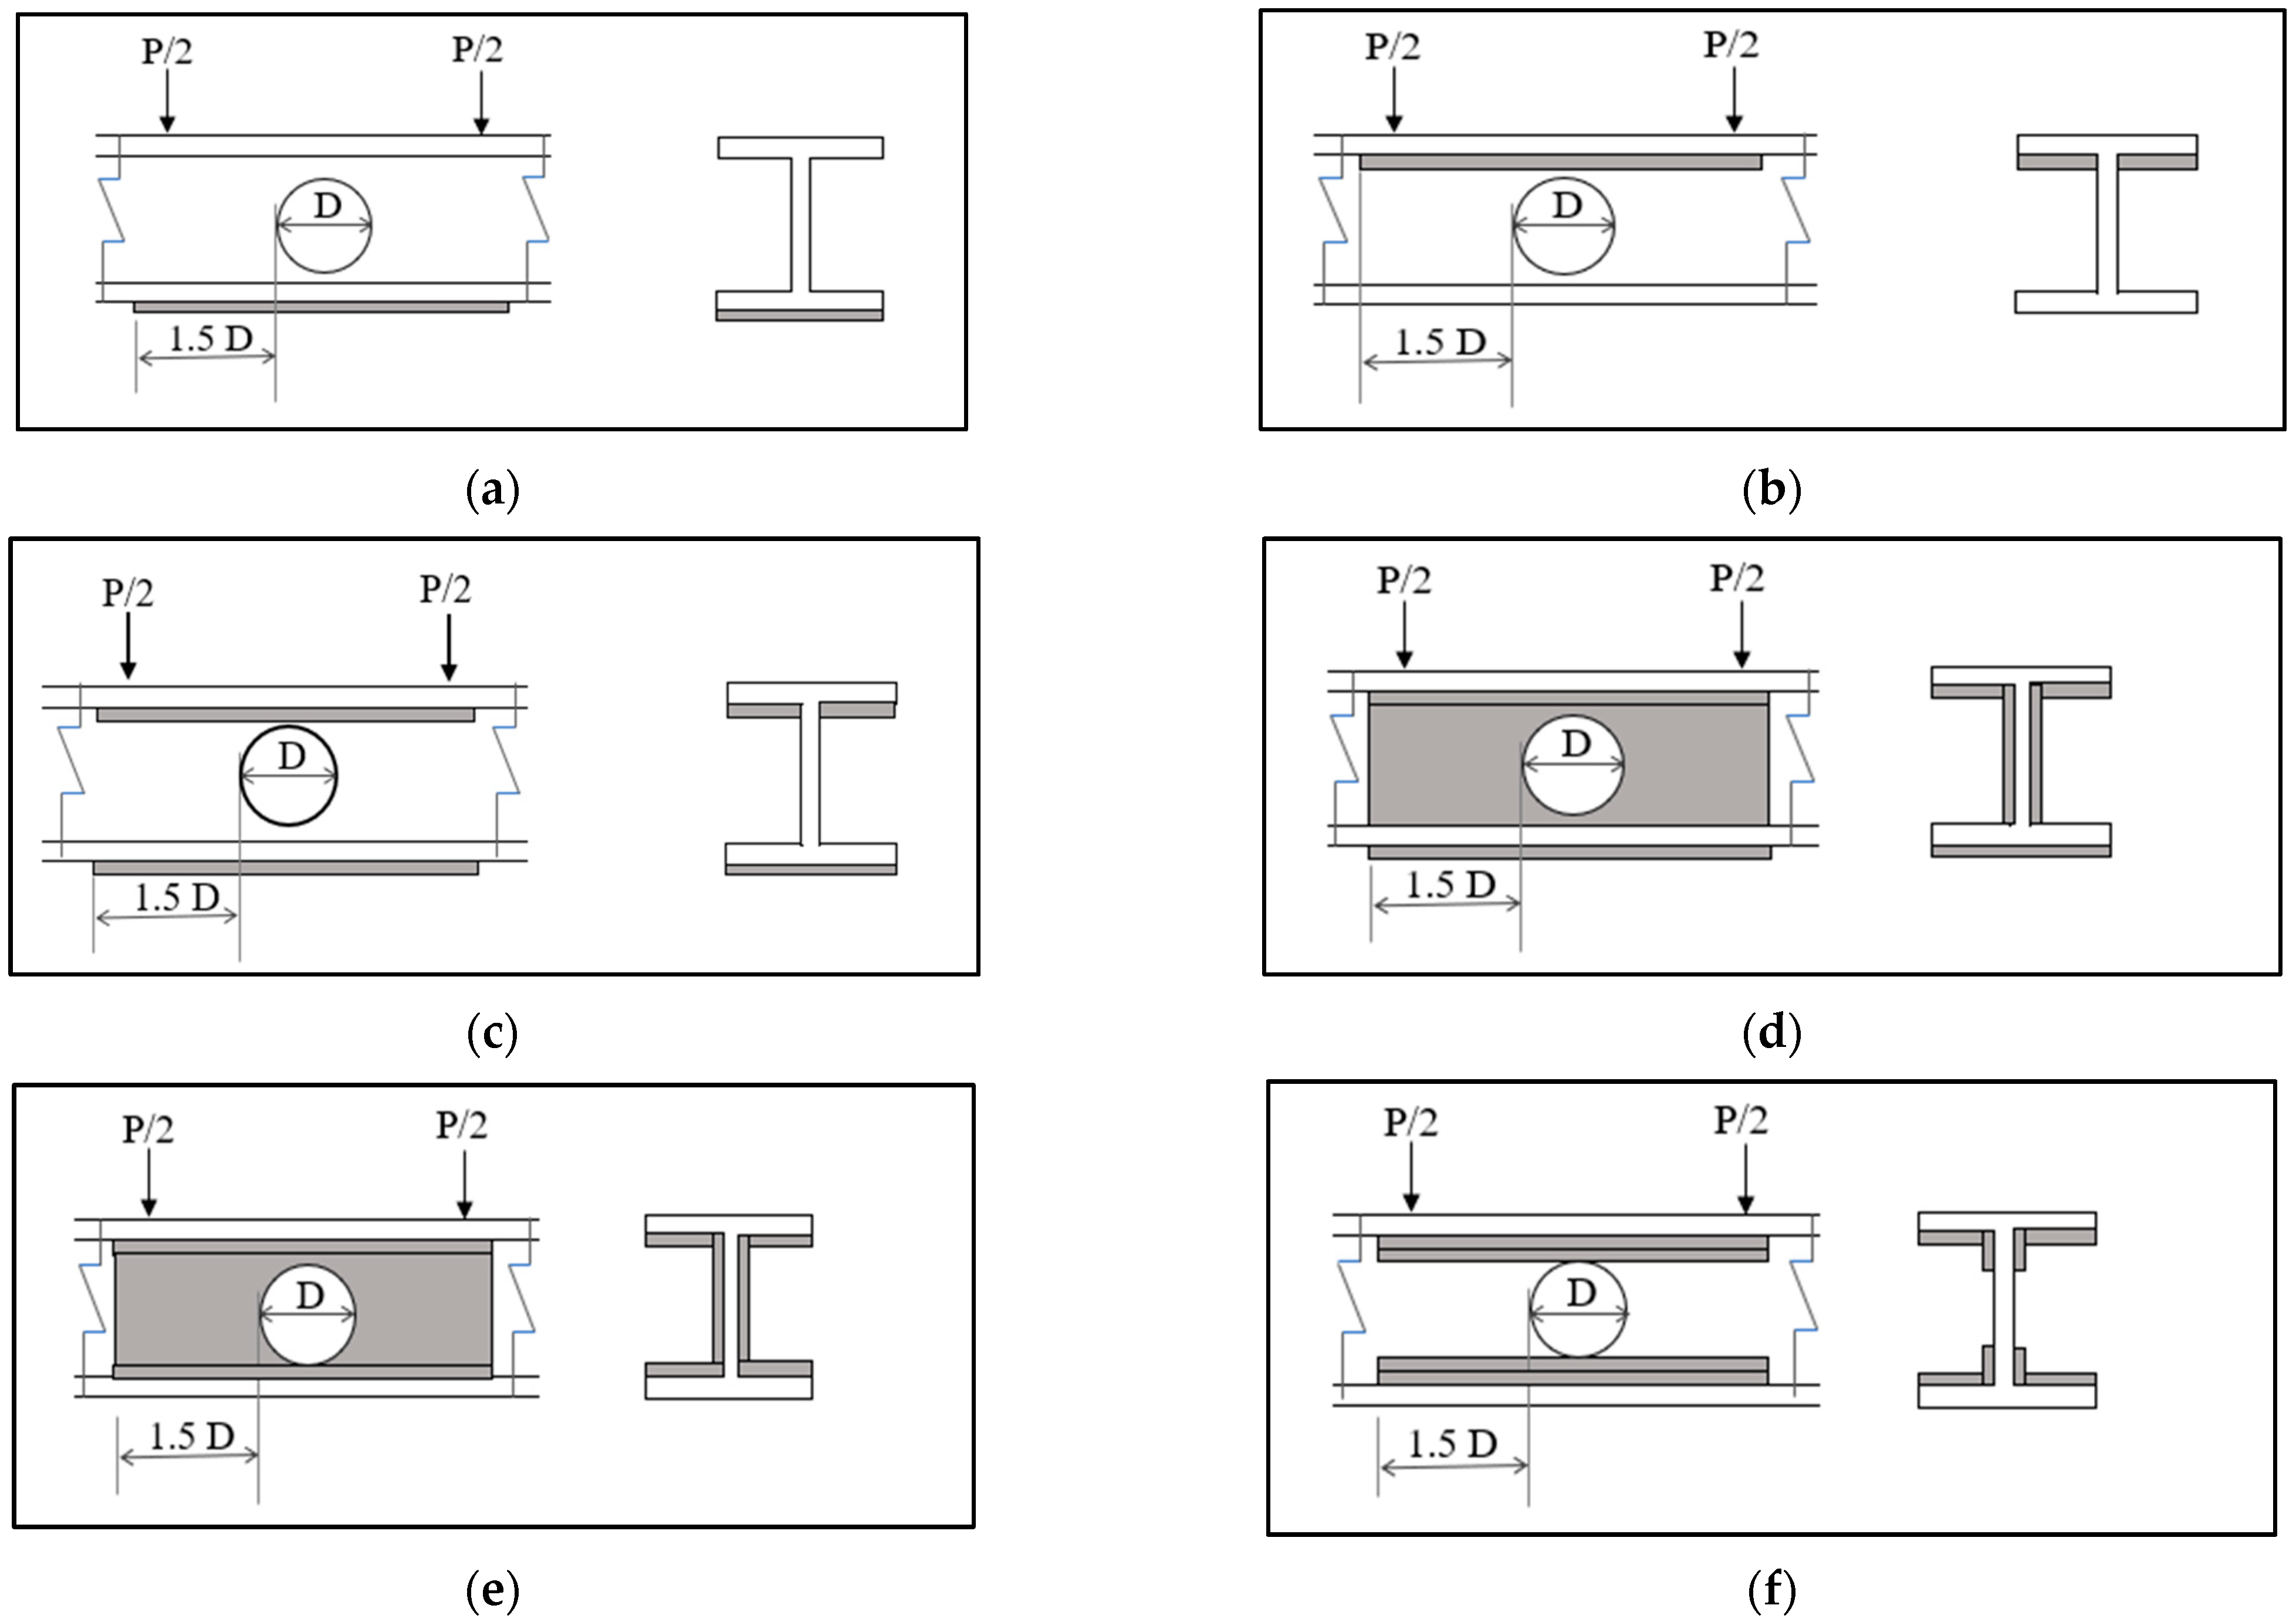
5.2. Effect of Web Openings
5.3. CFRP Strengthening of Steel Beams with Openings
6. Conclusions
- Due to the thinning of the bottom flange of the beam, both the yield and the ultimate load capacities of the beam were reduced. The reduction in the ultimate load followed a nearly perfect linear trend. For every 2.5% thickness loss of the bottom flange along 80% of the beam’s span, the ultimate load was observed to reduce by roughly 1.5%.
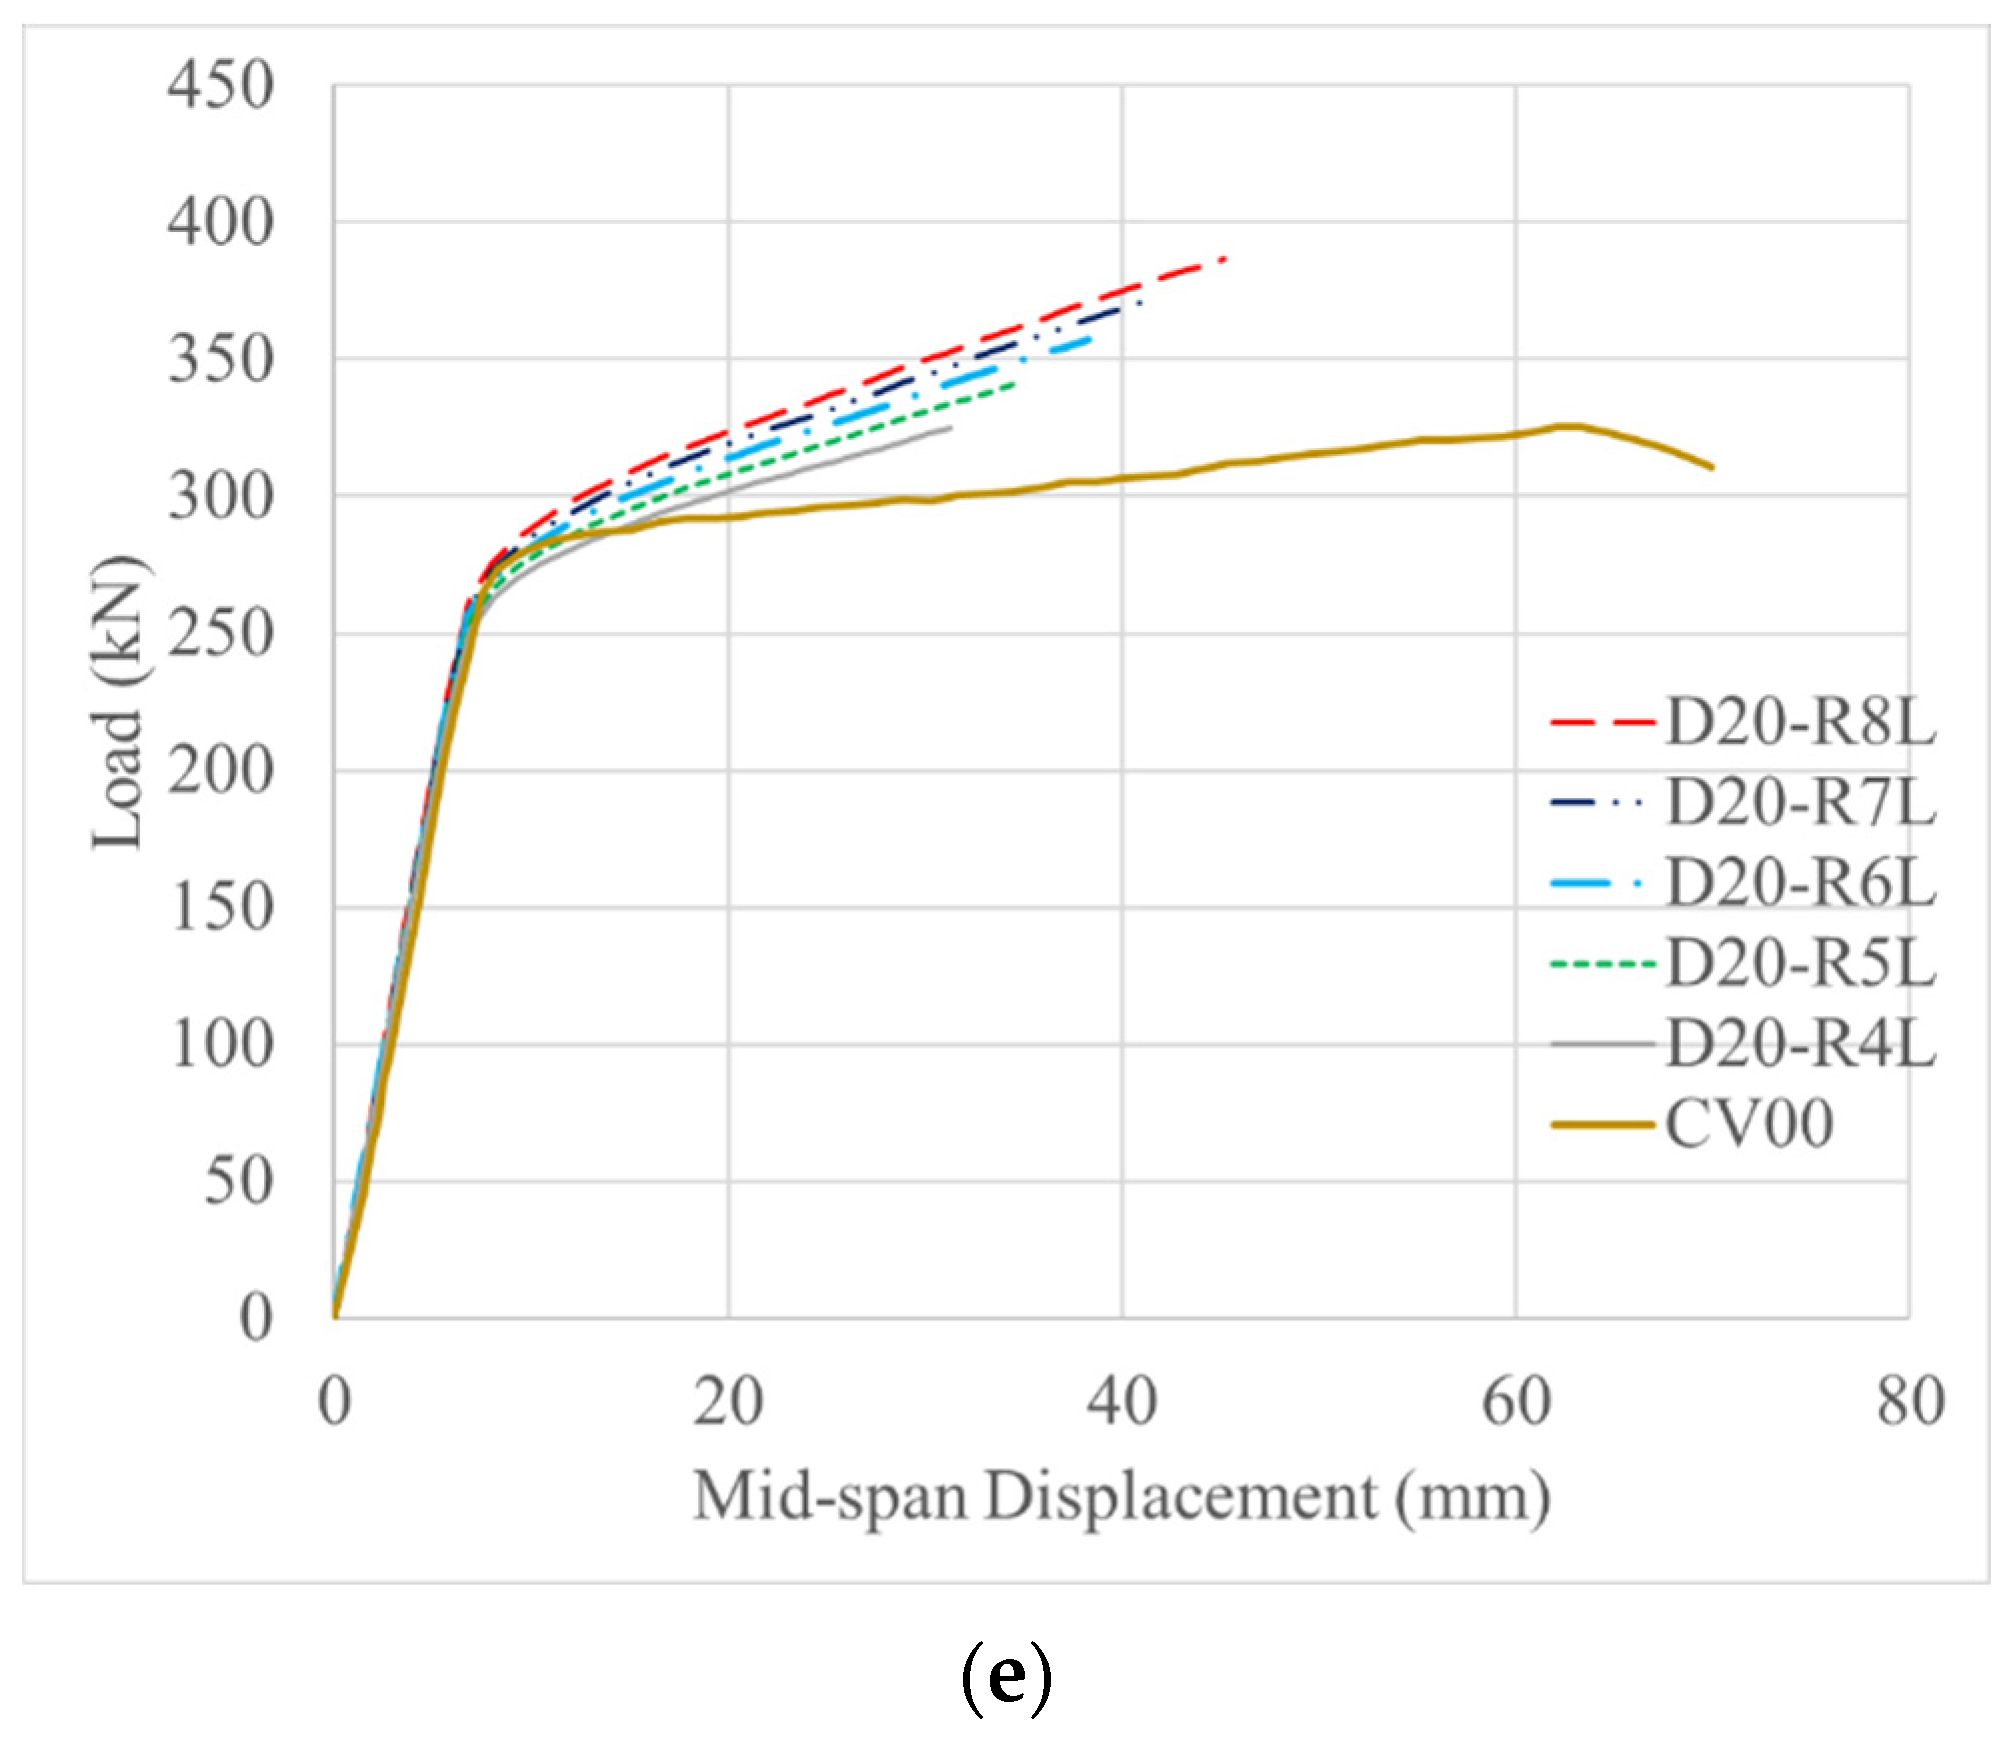
- An adequate number of layers of CFRP sheets could restore both the yield and the ultimate load capacities of the beam subjected to corrosion damage to the level of the undamaged beam, while also increasing the overall beam stiffness. CFRP sheets, as a result, could be used as an alternative to CFRP plates or other conventional flexural strengthening techniques.
- The overall stiffness of the beams was observed to increase with the application of CFRP sheets. However, when a lower number of layers was used, the sheets ruptured before the desired level of load was reached, due to the overstressing of the thin sheets. Therefore, it is desirable to use a higher number of sheet layers for strengthening beams subjected to corrosion damage to delay sheet rupture, which could cause a sudden load drop in the beam.
- If the total area of the openings (sum of area of all openings) was kept constant, it was observed that beams with a greater number of circular web openings of smaller sizes had higher load capacities than those with a smaller number of larger web openings. Additionally, it is advisable to provide web openings in the bending predominant region of the beam’s span.
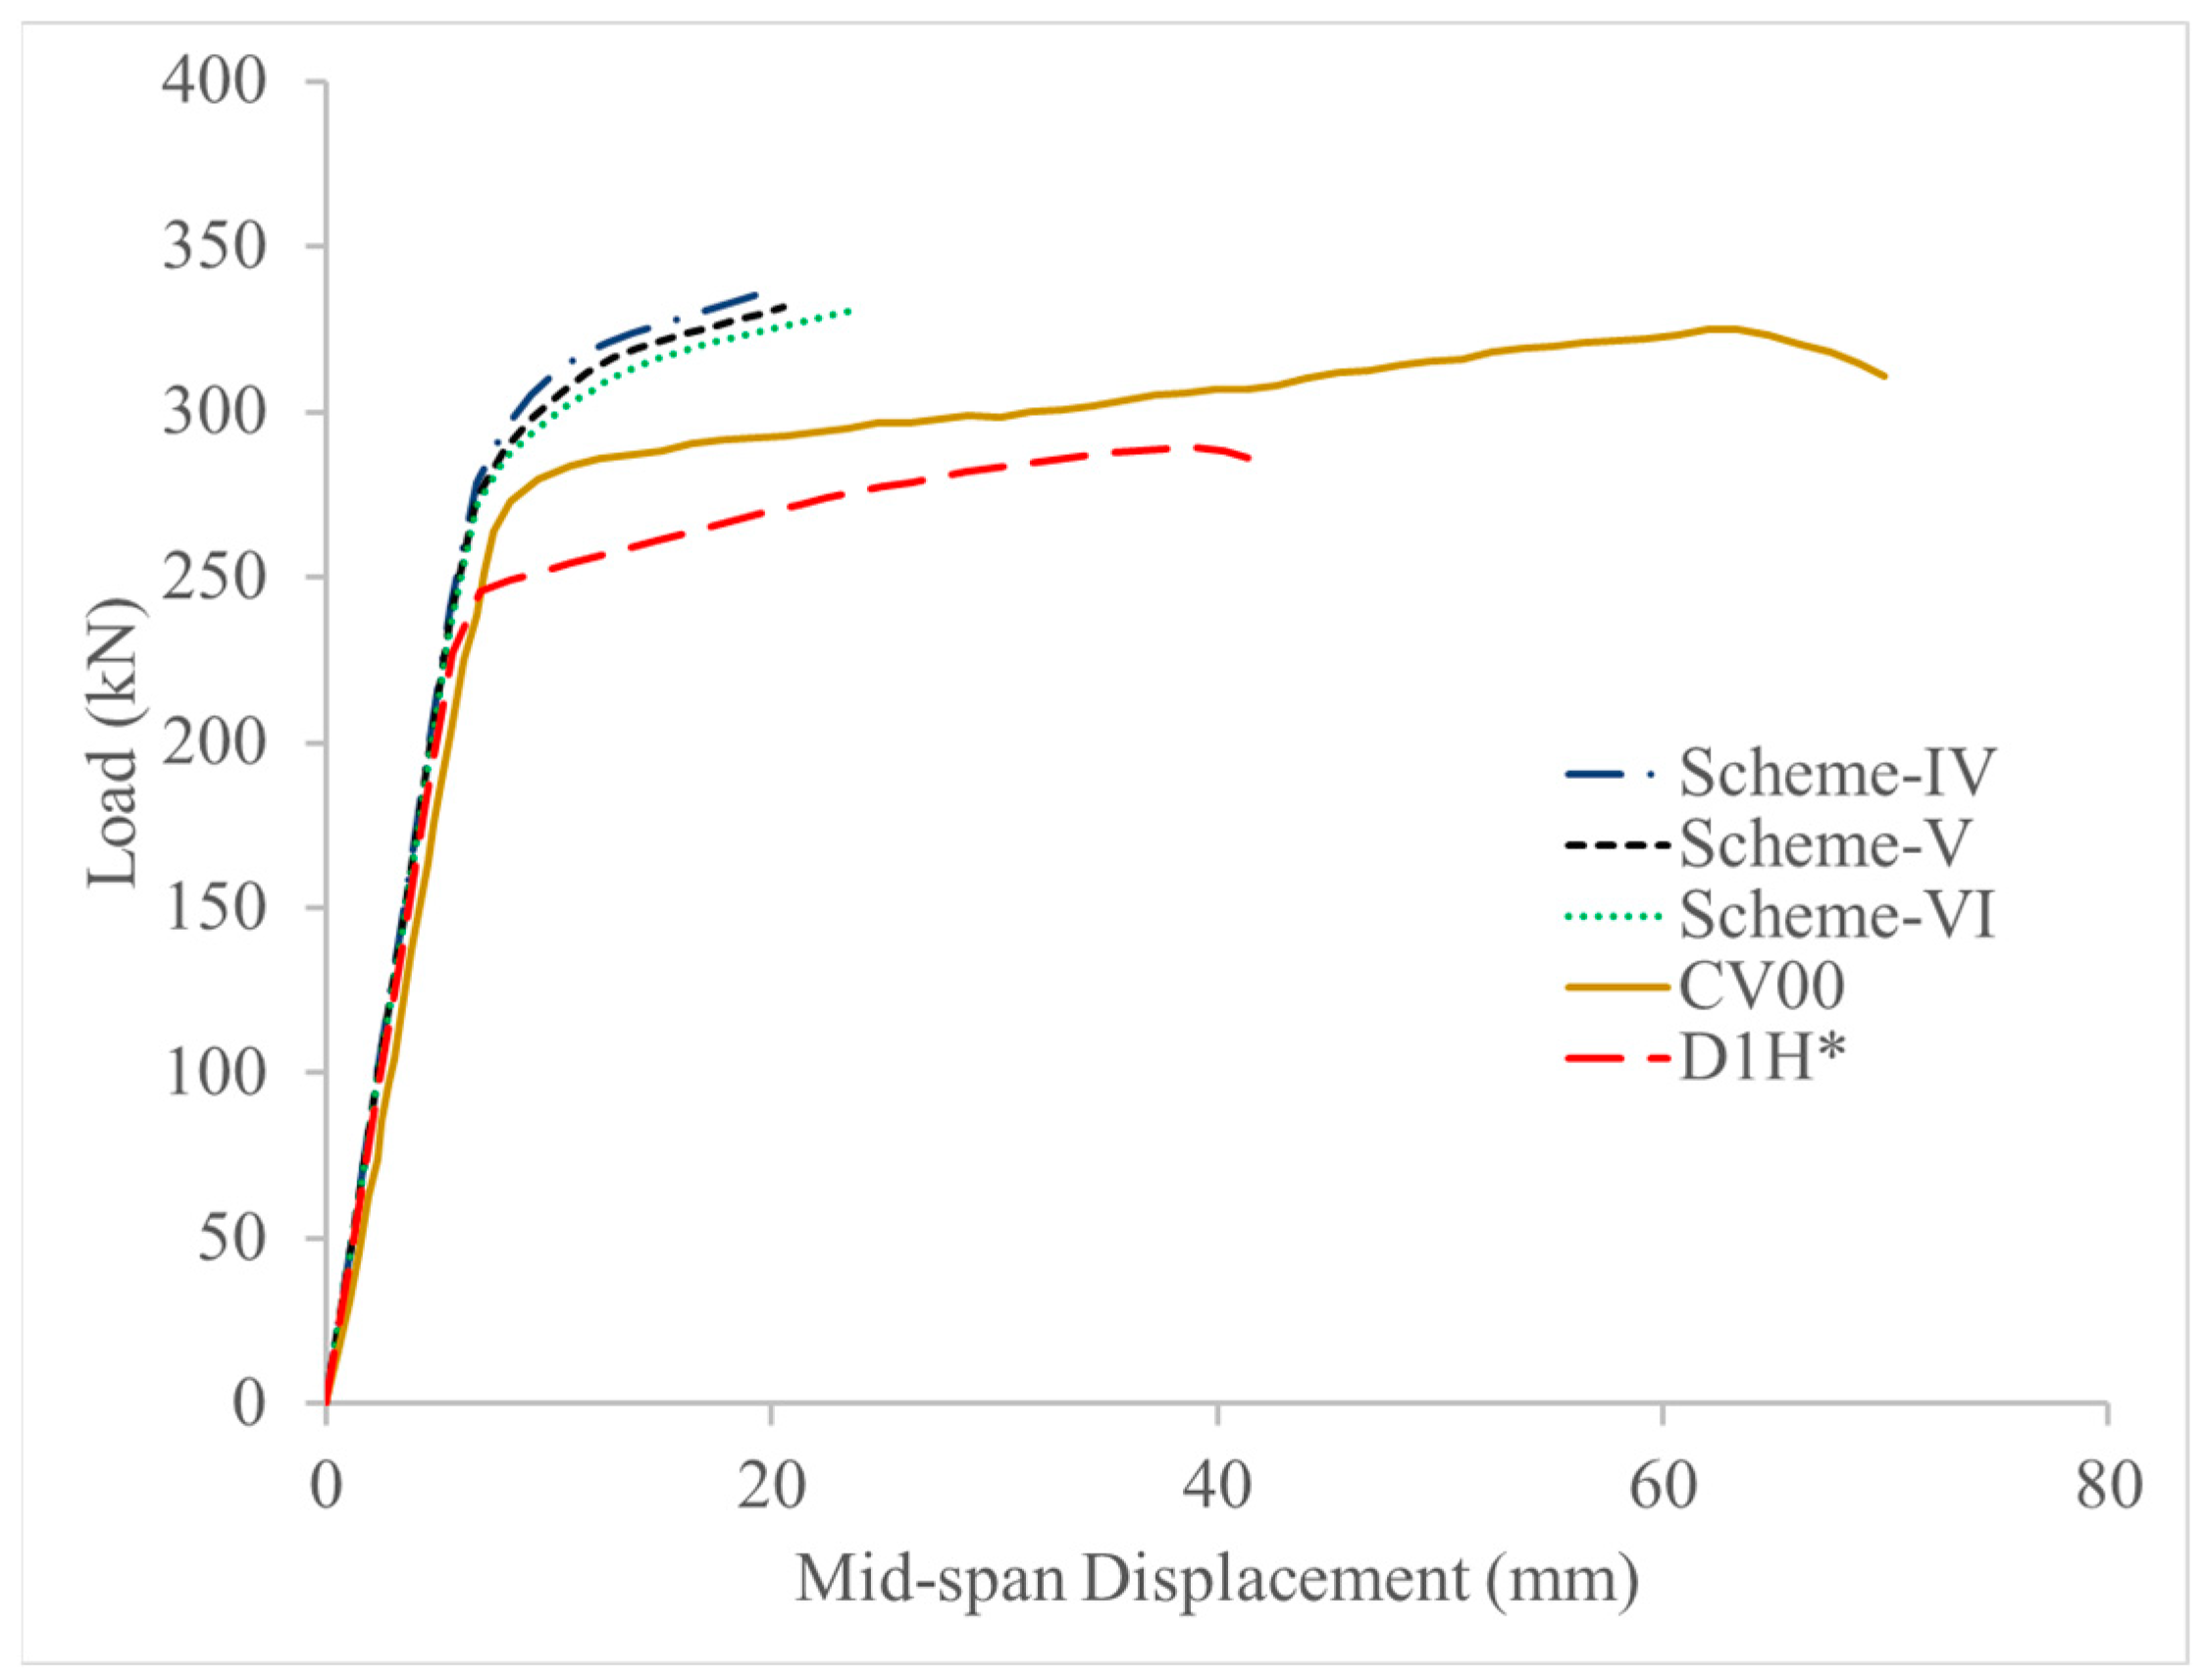
- Three of the proposed strengthening configurations, which involved the application of CFRP sheets only to the bottom, the top, or both the bottom and the top flanges (Schemes-I, II, and III, respectively), were found to be ineffective. However, the remaining three strengthening configurations of Schemes-IV, V, and VI, which involved the application of CFRP sheets to both the flanges and the web, with a minimum of six layers of CFRP sheets, could restore the strength of the steel beam with circular web openings to the level of the one without openings. An additional number of CFRP sheet layers in these schemes would result in improvements in both the load-carrying capacity and stiffness of the beams.
Author Contributions
Funding
Data Availability Statement
Conflicts of Interest
References
- Tavakkolizadeh, M.; Saadatmanesh, H. Fatigue strength of steel girders strengthened with carbon fiber reinforced polymer patch. J. Struct. Eng. 2003, 129, 186–196. [Google Scholar] [CrossRef]
- Ghafoori, E.; Motavalli, M. Normal, high and ultra-high modulus carbon fiber-reinforced polymer laminates for bonded and un-bonded strengthening of steel beams. Mater. Des. 2015, 67, 232–243. [Google Scholar] [CrossRef]
- Kim, Y.J.; Harries, K.A. Fatigue behavior of damaged steel beams repaired with CFRP strips. Eng. Struct. 2011, 33, 1491–1502. [Google Scholar] [CrossRef]
- Tafsirojjaman, T.; Fawzia, S.; Thambiratnam, D. Investigation on the behaviour of CFRP strengthened CHS members under monotonic loading through finite element modelling. Structures 2020, 28, 297–308. [Google Scholar] [CrossRef]
- Tafsirojjaman, T.; Dogar, A.U.R.; Liu, Y.; Manalo, A.; Thambiratnam, D.P. Performance and design of Steel Structures Reinforced with FRP Composites: A state-of-the-art review. Eng. Fail. Anal. 2022, 138, 106371. [Google Scholar] [CrossRef]
- Siwowski, T.W.; Siwowska, P. Experimental study on CFRP-strengthened steel beams. Compos. Part B Eng. 2018, 149, 12–21. [Google Scholar] [CrossRef]
- Peiris, A.; Harik, I. Steel beam strengthening with UHM CFRP Strip Panels. Eng. Struct. 2021, 226, 111395. [Google Scholar] [CrossRef]
- Bastani, A.; Das, S.; Kenno, S. Rehabilitation of thin walled steel beams using CFRP Fabric. Thin-Walled Struct. 2019, 143, 106215. [Google Scholar] [CrossRef]
- Batuwitage, C.; Fawzia, S.; Thambiratnam, D.; Al-Mahaidi, R. Durability of CFRP strengthened steel plate double-strap joints in accelerated corrosion environments. Compos. Struct. 2017, 160, 1287–1298. [Google Scholar] [CrossRef]
- Xu, S.; Li, H.; Wang, Y.; Wang, Y.; Wang, Y. Influence of corrosion on the bond behavior in CFRP-Steel Single Lap Joints. Constr. Build. Mater. 2020, 236, 117607. [Google Scholar] [CrossRef]
- Li, H.; Xu, S.; Wang, Y.; Song, C. Deterioration of the bond behavior between CFRP and corroded steel in wet-dry cycling environment. Compos. Struct. 2021, 272, 114202. [Google Scholar] [CrossRef]
- Morkhade, S.G.; Gupta, L.M. An experimental and parametric study on steel beams with web openings. Int. J. Adv. Struct. Eng. 2015, 7, 249–260. [Google Scholar] [CrossRef]
- Morkhade, S.G.; Gupta, L.M. Experimental investigation for failure analysis of steel beams with web openings. Steel Compos. Struct. 2017, 23, 647–656. [Google Scholar] [CrossRef]
- Morkhade, S.G.; Gupta, L.M. Ultimate load behaviour of steel beams with web openings. Aust. J. Struct. Eng. 2019, 20, 124–133. [Google Scholar] [CrossRef]
- Morkhade, S.G.; Gupta, L.M. Critical study of steel beams with web openings. Aust. J. Struct. Eng. 2023, 24, 24–35. [Google Scholar] [CrossRef]
- Abbas, J.L. Behaviour of steel I beams with web openings. Civ. Eng. J. 2023, 9, 596–617. [Google Scholar] [CrossRef]
- Manoharan, A.C.; Tripathi, R.K. Analysis of steel beams with circular opening. Int. J. Civ. Eng. Technol. 2017, 8, 411–422. [Google Scholar]
- Morkhade, S.G.; Kshirsagar, M.; Dange, R.; Patil, A. Analytical study of effect of web opening on flexural behaviour of hybrid beams. Asian J. Civ. Eng. 2019, 20, 537–547. [Google Scholar] [CrossRef]
- Morkhade, S.G.; Lokhande, R.S.; Gund, U.D.; Divate, A.B.; Deosarkar, S.S.; Chavan, M.U. Structural behaviour of castellated steel beams with reinforced web openings. Asian J. Civ. Eng. 2020, 21, 1067–1078. [Google Scholar] [CrossRef]
- Morkhade, S.G.; Jagtap, K.R.; Ghorpade, P.S.; Ahiwale, D.D.; Najm, H.M. Buckling performance evaluation of steel cellular beams strengthened with flange cover plate. Asian J. Civ. Eng. 2022, 23, 1277–1290. [Google Scholar] [CrossRef]
- Altaee, M.J.; Cunningham, L.S.; Gillie, M. Experimental investigation of CFRP-strengthened steel beams with web openings. J. Constr. Steel Res. 2017, 138, 750–760. [Google Scholar] [CrossRef]
- ANSYS®. Academic Research Mechanical Release 20.2; Help System; ANSYS, Inc.: Canonsburg, PA, USA, 2020; Available online: http://www.ansys.com/ (accessed on 28 August 2023).
- Lawson, R.M.; Hicks, S.J. Design of Composite Beams with Large Web Openings: In Accordance with Eurocodes and the UK National Annexes; Steel Construction Institute: Ascot, UK, 2011; ISBN 9781859421970. [Google Scholar]
- Altaee, M.; Cunningham, L.; Gillie, M. Novel technique for strengthening steel beams with web penetrations. In Proceedings of the MACE PGR Conference, Manchester, UK, 22 March 2016. [Google Scholar]


| Material | Mechanical Properties | Symbol | Unit | Value |
|---|---|---|---|---|
| Yield stress | fy | MPa | 379 | |
| Ultimate stress | fu | MPa | 484 | |
| Steel | Yield strain | ԑy | % | 0.2 |
| Ultimate strain | ԑu | % | 35 | |
| Elastic Modulus | E | GPa | 205 | |
| Poisson’s ratio | μ | - | 0.3 | |
| Sheet thickness | - | mm | 0.26 | |
| Tensile strength in longitudinal direction (0°) | - | MPa | 1780 | |
| Tensile modulus in longitudinal direction (0°) | - | GPa | 152 | |
| Tensile elongation in longitudinal direction (90°) | - | % | 1.75 | |
| CFRP | Tensile strength in transverse direction (90°) | - | MPa | 60 |
| Tensile modulus in transverse direction (90°) | - | GPa | 9 | |
| Tensile elongation in transverse direction (90°) | - | % | 0.5 | |
| In-plane shear strength | - | MPa | 100 | |
| In-plane shear modulus | - | GPa | 12 |
| Yield Load (kN) | Ultimate Load (kN) | CFRP Rupture Load (kN) | |||||||
|---|---|---|---|---|---|---|---|---|---|
| Beam ID | Experiment | FEA | Difference (%) | Experiment | FEA | Difference (%) | Experiment | FEA | Difference (%) |
| CV-00 | 273 | 272 | 0.4 | 325 | 338 | 4 | - | - | - |
| CD-20 | 255 | 256 | 0.4 | 312 | 312 | 0 | - | - | - |
| RB-20-2L | 270 | 271 | 0.4 | - | - | - | 303 | 304 | 0.3 |
| Beam ID | Yield Load (kN) | Reduction in Yield Load Capacity (%) | Ultimate Load (kN) | Reduction in Ultimate Load Capacity (%) |
|---|---|---|---|---|
| D2.5 | 272 | 0 | 333 | 1.5 |
| D5 | 268 | 1.5 | 328 | 3.0 |
| D10 | 261 | 4.0 | 317 | 6.2 |
| D15 | 256 | 5.9 | 307 | 9.2 |
| D20 | 249 | 8.5 | 296 | 12.4 |
| Yield Load (kN) | Failure Load (kN) | |||
|---|---|---|---|---|
| Beam ID | Target Value | FEA Results | Target Value | FEA Results |
| D2.5-R1L | 273 | 275 | 325 | 302 |
| D2.5-R2L | 279 | 319 | ||
| D2.5-R3L | 282 | 336 | ||
| D5-R1L | 273 | 272 | 325 | 299 |
| D5-R2L | 276 | 316 | ||
| D5-R3L | 279 | 331 | ||
| D10-R3L | 273 | 273 | 325 | 325 |
| D10-R4L | 276 | 342 | ||
| D15-R3L | 273 | 266 | 325 | 317 |
| D15-R4L | 270 | 333 | ||
| D15-R5L | 273 | 350 | ||
| D15-R6L | 276 | 365 | ||
| D20-R4L | 273 | 251 | 325 | 325 |
| D20-R5L | 267 | 342 | ||
| D20-R6L | 270 | 357 | ||
| D20-R7L | 273 | 373 | ||
| D20-R8L | 276 | 387 | ||
| Beam ID | ‘C’ (mm) | ‘S’ (mm) | ‘R’ (mm) | ‘N’ | ‘Ae’ (mm2) | ‘A’ (mm2) | Area Ratio | Opening Ratio |
|---|---|---|---|---|---|---|---|---|
| D1H | 193.5 | - | 56.5 | 1 | 10029 | 10029 | 1.000 | 0.71 |
| D2H | 80 | 180 | 40 | 2 | 5027 | 10053 | 1.002 | 0.50 |
| D3H | 80 | 71 | 33 | 3 | 3421 | 10264 | 1.023 | 0.41 |
| D4H | 80.5 | 37 | 28.5 | 4 | 2552 | 10207 | 1.018 | 0.36 |
| Beam ID | Reduction in Yield Load Capacity (%) | Reduction in Ultimate Load Capacity (%) |
|---|---|---|
| D1H | 6.6 | 10.9 |
| D2H | 1.1 | 6.5 |
| D3H | 0 | 5 |
| D4H | 0 | 4.4 |
Disclaimer/Publisher’s Note: The statements, opinions and data contained in all publications are solely those of the individual author(s) and contributor(s) and not of MDPI and/or the editor(s). MDPI and/or the editor(s) disclaim responsibility for any injury to people or property resulting from any ideas, methods, instructions or products referred to in the content. |
© 2024 by the authors. Licensee MDPI, Basel, Switzerland. This article is an open access article distributed under the terms and conditions of the Creative Commons Attribution (CC BY) license (https://creativecommons.org/licenses/by/4.0/).
Share and Cite
Silwal, P.K.; Parvin, A.; Alhusban, M. Numerical Investigation on Strengthening of Steel Beams for Corrosion Damage or Web Openings Using Carbon Fiber Reinforced Polymer Sheets. Buildings 2024, 14, 1069. https://doi.org/10.3390/buildings14041069
Silwal PK, Parvin A, Alhusban M. Numerical Investigation on Strengthening of Steel Beams for Corrosion Damage or Web Openings Using Carbon Fiber Reinforced Polymer Sheets. Buildings. 2024; 14(4):1069. https://doi.org/10.3390/buildings14041069
Chicago/Turabian StyleSilwal, Prabin Kumar, Azadeh Parvin, and Mohannad Alhusban. 2024. "Numerical Investigation on Strengthening of Steel Beams for Corrosion Damage or Web Openings Using Carbon Fiber Reinforced Polymer Sheets" Buildings 14, no. 4: 1069. https://doi.org/10.3390/buildings14041069
APA StyleSilwal, P. K., Parvin, A., & Alhusban, M. (2024). Numerical Investigation on Strengthening of Steel Beams for Corrosion Damage or Web Openings Using Carbon Fiber Reinforced Polymer Sheets. Buildings, 14(4), 1069. https://doi.org/10.3390/buildings14041069