Article

Evaluating Seismic Performance in Reinforced Concrete Buildings with Complex Shear Walls: A Focus on a Residential Case in Chile

Civil Engineering School, Pontificia Universidad Católica de Valparaíso, Valparaíso 2340000, Chile
*
Author to whom correspondence should be addressed.
Buildings 2024, 14(3), 761; https://doi.org/10.3390/buildings14030761
Submission received: 2 February 2024 / Revised: 4 March 2024 / Accepted: 8 March 2024 / Published: 12 March 2024
(This article belongs to the Special Issue Research on the Seismic Performance of Reinforced Concrete Structures)

Abstract

:
This study employs a non-linear static analysis, known as pushover analysis, to explore the flexural-compressive behavior of complex shear walls within a reinforced concrete (R.C.) structure, adhering to contemporary design standards in Chile. The primary objective is to assess the initiation of damage as the building approaches the limit states outlined in Achisina’s seminal “Performance Based Seismic Design” framework. To achieve this, a sophisticated fiber model, accounting for the confined behavior of concrete derived from the structural elements’ detailing, has been uniformly integrated across the building’s entire height. Furthermore, the analysis incorporates a rigid diaphragm to simulate the R.C. slab’s response accurately. The study implements the N2 method, adjusting for seismic demands in an acceleration-displacement format, which leverages the displacement spectrum defined by Supreme Decree 61, a legislative response to the 8.8 Mw Maule earthquake in 2010. The findings reveal that the analyzed structure meets the immediate occupancy performance level with drifts nearing 5‰ in the symmetrical Y direction. This outcome aligns with prior assessments of Chilean R.C. wall buildings. However, in the asymmetric X direction, the structure exhibits a higher degree of structural damage, aligning with a life safety performance level. This differentiation underscores the critical need for nuanced understanding and modeling of structural behavior under seismic loads, contributing to the ongoing refinement of seismic design practices and standards.

1. Introduction

The subduction zone formed by the interaction between the Nazca and South American tectonic plates defines Chile’s seismogenic profile, leading to significant tectonic activity. This interaction results in a relative motion of approximately −8.4 cm/year, positioning Chile as one of the regions with a notably higher frequency of interplate earthquakes compared to other global seismic areas [1]. Consequently, earthquakes with elevated seismicity have been recorded in 1985, 2010 and 2014 [2], and thirteen 8.0+ Mw earthquakes have occurred since 1900, averaging one every eight years [3]. To face Chile’s seismogenic reality, it is necessary to constantly test and monitor the national seismic-resistance regulations, with the goal of producing structures that perform adequately. The 27 February 2010, earthquake, with a magnitude of 8.8 Mw, provides a valuable case for analyzing R.C. shear-walls. These structures were designed following contemporary seismic-resistant regulations [4] and faced seismic demands leading to more extensive damage than the 1985 earthquake [5]. In several instances, this resulted in considerable economic losses [6].
Important changes were introduced into seismic-resistant design after the 2010 earthquake [7]. In this context, Supreme Decrees No. 60 [8] and 61 [9] were enacted to establish norms to improve the seismic behavior of R.C. shear-walls. Two main modifications were established (in Supreme Decree No. 60, specifically) [8]: (1) limitation of 0.35 fc’Ag of the axial load to avoid brittle behavior, and (2) Verification was conducted based on the deformation capacity, specifically for roof displacement design, as defined by the elastic displacement spectrum in Supreme Decree 61 [9]. This meant that Chilean structural engineering began to incorporate a displacement-based approach into the design, partially disassociating itself from the analogy between resistance and performance. Since then, a series of studies have been carried out to better understand the seismic behavior of R.C. shear-walls throughout their entire deformation capacity, until their final failure. This is where the renowned nonlinear models arise, which allow us to have more information on seismic performance with the aim of limiting the expected damage of a building subjected to different levels of seismic demand, and thus avoiding the possibility of an undesirable mechanism of collapse. Currently, building design is based on linear methods of structural analysis, which seek to represent, in a simplified manner, the buildings’ seismic behavior. For this type of analysis, a linear relationship between force and displacement is established, which means that at an infinite level of deformations, the element opposes an infinite force. This situation is not completely true, since at a high level of deformation the structure presents a significant degradation of its stiffness that causes the loss of the proportional relationship between force and displacement. For example, R.C. beams begin to crack at very low deformation levels, and this causes a loss of stiffness. Therefore, as the structure begins to suffer damage (a phenomenon that begins at low levels of deformation), the stiffness matrix should change and therefore the stress distribution in the structural analysis as well.
Regarding buildings with shear walls, there are particularities in the behavior of these structures in response to seismic actions that make it interesting to delve into their response. On one hand, for tall buildings, the presence of higher vibration modes is relevant, which can alter the dynamic response [10,11,12]. Another effect to consider when conducting the seismic analysis of these buildings relates to the eccentricity resulting from inadequate stiffness distribution, due to not paying attention to the location of the shear walls, potentially creating serious torsional issues [13,14,15]. Lastly, but no less important, is the deformability of the slabs, especially when there is no presence of beams coupling the shear walls [16,17,18].
This research embarked on a detailed examination of seismic performance through the lens of a typical 14-story residential structure equipped with reinforced concrete (RC) shear walls, located in Villa Alemana (Valparaíso Region, Chile). Employing advanced nonlinear models, including both distributed fibers and concentrated hinges, the study developed a refined model showcasing total inelastic behavior to assess compliance with performance Limit States as outlined in the “Performance-based Seismic Design” document by the Chilean Association of Seismology and Earthquake Engineering [19]. This approach marks a significant shift from traditional force-based methodologies to performance-based seismic design principles, offering a more nuanced understanding of RC shear walls’ behavior, especially in light of the regulatory shifts following the 2010 earthquake. By rigorously evaluating the modifications aimed at bolstering structural resilience, the study not only illuminates the effectiveness of these changes but also pioneers practical recommendations for seismic-resistant design. Emphasizing the strategic augmentation of shear wall density in asymmetric directions and leveraging structural stiffness, the findings provide a comprehensive framework for enhancing seismic resilience. Consequently, this research fills a critical gap in seismic engineering by delivering a holistic perspective on the determinants of RC shear walls’ seismic performance and proposing evidence-based strategies to fortify structures against seismic challenges prevalent in regions like Chile.

2. Background

If a structure has the capacity to respond elastically to seismic demand, there will be a linear relationship between force and displacement, resulting from the elastic stiffness of the structural system and leading to behavior characterized by low levels of deformation and displacement. However, given that the design assumes the resistance must be greater than the load, it is highly probable in practice, especially under Chile’s seismogenic conditions, that the seismic demand will exceed the design’s provisions. As a result, the structure is likely to experience considerably greater displacement and is expected to respond in the inelastic range, leading to structural damage. Thus, the force-based design methodology reveals a critical limitation in its inability to verify a structure’s capacity to withstand high-intensity earthquakes.
Currently, Chile has a force-based seismic design methodology (Modal-Spectral Analysis) that is consistent with the ASCE-7 standard used in the United States [20] and is specified in the Nch433 “Seismic Design of Buildings” [21] regulation, where the damage or inelastic behavior are controlled through response or behavior reduction factors commonly referred to as R factors. The values of these R factors are derived from empirical experience and engineering judgment. This methodology was initially formulated in relation to structural ductility [22], but it depends on other variables such as overstrength and structural redundancy. This method has been questioned because it does not provide precise information on the expected structural behavior of a building if it is subjected to a seismic demand where the structure’s stiffness begins to suffer significant degradation. Even though practices based on the Chilean seismic design code have shown that buildings present a practically operational level of performance [23,24,25], performance-based design procedures are not included in this code. In Chile, Supreme Decree No. 60 currently describes a simplified methodology to determine the deformation capacity of R.C. shear-walls [8], neglecting the influence of stiff diaphragm coupling on the inelastic behavior of the building’s critical section.
Modern seismic codes, which try to reflect great advances in knowledge and understanding in a very simple way, are not transparent about the expected level of behavior or response of the complete system [26,27,28,29,30]. For this reason, it is necessary to implement a structural design and analysis methodology that allows us to achieve a deeper understanding of the problem of seismic-resistant design, considering the inelastic behavior of R.C. sections. This insight will enable the determination of performance levels which must subsequently be validated within the building under various seismic demand scenarios. This implementation has been widely discussed over the past two decades which has ultimately led to the practical application of performance-based design.

2.1. Force-Based Design

The force-based seismic design philosophy employs linear elastic analysis for the design of a building’s structural elements, utilizing spectral modal analysis. This method applies lateral forces proportional to seismic coefficients and building weight across various floors, aligning with vibration modes [31]. These forces, determined by design spectra, undergo modal combination, such as the CQC method per Nch433 standard [21]. The analysis incorporates response reduction factors influenced by structural period and materiality, simulating the building’s potential inelastic behavior through energy dissipation. However, this approach simplifies by uniformly applying reduction factors across all vibration modes, which may not accurately reflect the structure’s actual response [32], especially as higher vibration modes become more significant in non-linear scenarios [33]. While the design method proposes a link between structural displacement capacity and seismic forces across deformation ranges, it indirectly checks interstory drift without ensuring structural efficiency [34,35,36,37,38]. It fails to directly predict potential collapse mechanisms, only implicitly addressing life safety levels and assuming uniform stiffness loss, which doesn’t hold for all structuring types.

2.2. Performance-Based Design

The capacity design philosophy, introduced by John P. Hollings in the 1960s in New Zealand, aims to prevent fragile collapse in the event of severe earthquakes by ensuring that yielding occurs only in ductile zones specifically designated by the structural designer [39]. This approach intends for the structure to accommodate seismic displacements with predictable and desired behavior, maximizing deformation and energy dissipation capacities while effectively reducing seismic demands on the structure [40]. Analogously, this concept likens the structural system to a chain that remains ductile overall if the weakest link is intentionally designed to be ductile, thereby maintaining integrity even when not all links share this property [41,42,43].
Building upon this foundation, performance-based seismic design focuses on minimizing structural damage across varying seismic demands. This methodology was further developed by the Structural Engineers Association of California (SEAOC) through the formation of the Vision 2000 committee [44], tasked with establishing guidelines for assessing structural seismic performance. This initiative was partly in response to the significant earthquakes that occurred from 1960 to 1970, leading SEAOC to propose in the Blue Book specific expectations for the seismic behavior of structures. These developments underscore a shift towards more resilient structural design strategies, emphasizing the importance of both targeted ductility in critical areas and comprehensive performance assessment to enhance earthquake readiness and reduce potential damage.
  • Structures must withstand frequent earthquakes without experiencing damage.
  • They must resist rare-occurrence earthquakes without causing structural damage, though they might suffer damage to secondary elements.
  • Withstand a very rare earthquake, experiencing both structural and non-structural damage, but not reaching a collapsed condition.
  • This design approach seeks to define different levels of performance for different levels of seismic demands derived from a probabilistic approach. In general, 4 performance levels are defined:
    • Fully operational: Zero structural and non-structural damage.
    • Operational: Cracks in structural elements. Minor damage.
    • Life safety: Moderate damage to some elements. Loss of resistance and stiffness of the resistant system of lateral loads. The system remains functional.
    • Collapse prevention: Severe damage to structural elements. It may be necessary to eventually demolish the building.
Unlike traditional methods, performance-based design allows us to evaluate the expected performance of a building governed mainly by displacements. Although there is great uncertainty in determining how the materials will perform when the seismic event occurs, nonlinear modeling allows for a better representation of the bending and compression behavior of R.C. sections for all ranges of deformations. For example, the structural designer can obtain information on the actual location of the critical region (section where the highest concentration of inelastic demand is expected) that has previously been chosen in the conventional design but has not been explicitly verified in structural analysis [45,46]. In addition, performance-based design allows us to verify that there is an adequate resistance of the structural elements and compliance with their expected elastic condition for an earthquake that demands of the building a condition of operational performance.
In recent years, Chilean regulations on the seismic-resistant design of R.C. shear-walls have undergone important changes, which has generated interest in a group of researchers and designers in the study and evaluation of the seismic performance of buildings. In this scenario, the Chilean Association of Anti-Seismic Engineering (Achisina) drafted the document “Performance-based Seismic Design”, for the evaluation of the performance of buildings within the Chilean seismic context. This document establishes guidelines in nonlinear modeling and its subsequent analysis based on acceptance criteria or performance levels and has been used to conduct the case study design of this research. Performance-based design is an initiative that, along with others, aims to enhance the response of structures to the effects of natural hazards. However, the definition of criteria for evaluating building performance is a topic where design codes exhibit varying criteria in determining limits [47]. Among the new initiatives, we can mention methodologies based on resilience, which the reader can find in works published by various authors [48,49,50,51,52,53].

2.3. Resilience-Based Design

Recently, in addition to performance-based design, resilience-based design has emerged, which has similar objectives to the former, but is not limited exclusively to the realm of structural behavior and its contents. This evolution is highlighted by Terzic et al. [48], who underscore the significance of evaluating buildings’ functional recovery post-earthquake.
Resilience-based design applied to seismically resistant buildings refers to a comprehensive approach in structural engineering that emphasizes the capacity of a building to withstand, adapt to, and recover from seismic events [48]. This design philosophy goes beyond ensuring mere survival during an earthquake, focusing on minimizing downtime and expediting functional recovery, as demonstrated by Hosseinzadeh and Galal [49] through their probabilistic seismic resilience quantification. It integrates probabilistic assessments of seismic hazards, structural vulnerabilities, and post-event functionalities to develop buildings that not only protect lives but also preserve their operational capacities after seismic incidents [50]. By considering a wide range of seismic demands and incorporating innovative optimization techniques, as explored by Joyner et al. [50], resilience-based design aims to achieve a balance between structural integrity, cost-efficiency, and rapid post-disaster recovery. This approach is distinguished by its emphasis on pre-event preparedness, including mitigation measures and retrofitting strategies, as well as post-event response and recovery actions, thereby aligning with broader goals of sustainability and disaster risk reduction in the built environment [51].
Collectively, these studies reinforce the paradigm of resilience-based design, underlining the need to incorporate probabilistic analyses and material deterioration considerations for a comprehensive evaluation of structural resilience [52,53]. The synergy among these contributions, from the framework for modeling post-earthquake functional recovery [48] to the state-dependent aftershock resilience analysis [53], provides a solid foundation for the development of design and retrofit strategies aimed not only at immediate structural survival post-earthquake but also at rapid functional recovery, thus aligning with sustainability goals and disaster risk reduction objectives. Other works addressing resilience-based design can be found in references [54,55,56,57,58,59].

3. Description of the Building Studied

Located in the city of Villa Alemana, it is a 14-story tower with a maximum height of 39.40 m, 2.55 m-high floors, and 2 underground levels. The structure is designed for residential use and is constructed from reinforced concrete. The structuring is typical of buildings conformed of shear-walls with a core of walls for vertical transit in the center of the structural plant, and with complex configurations. The set of shear-walls that contributes to the system of vertical and transversal loads has a thickness of 20 cm on practically the entire floor plan, except for some perimeter shear-walls that are thicker (30 cm) on the lower floors and reach 20 cm at the maximum height, with the objective of reducing the eccentricity of the floor plan.
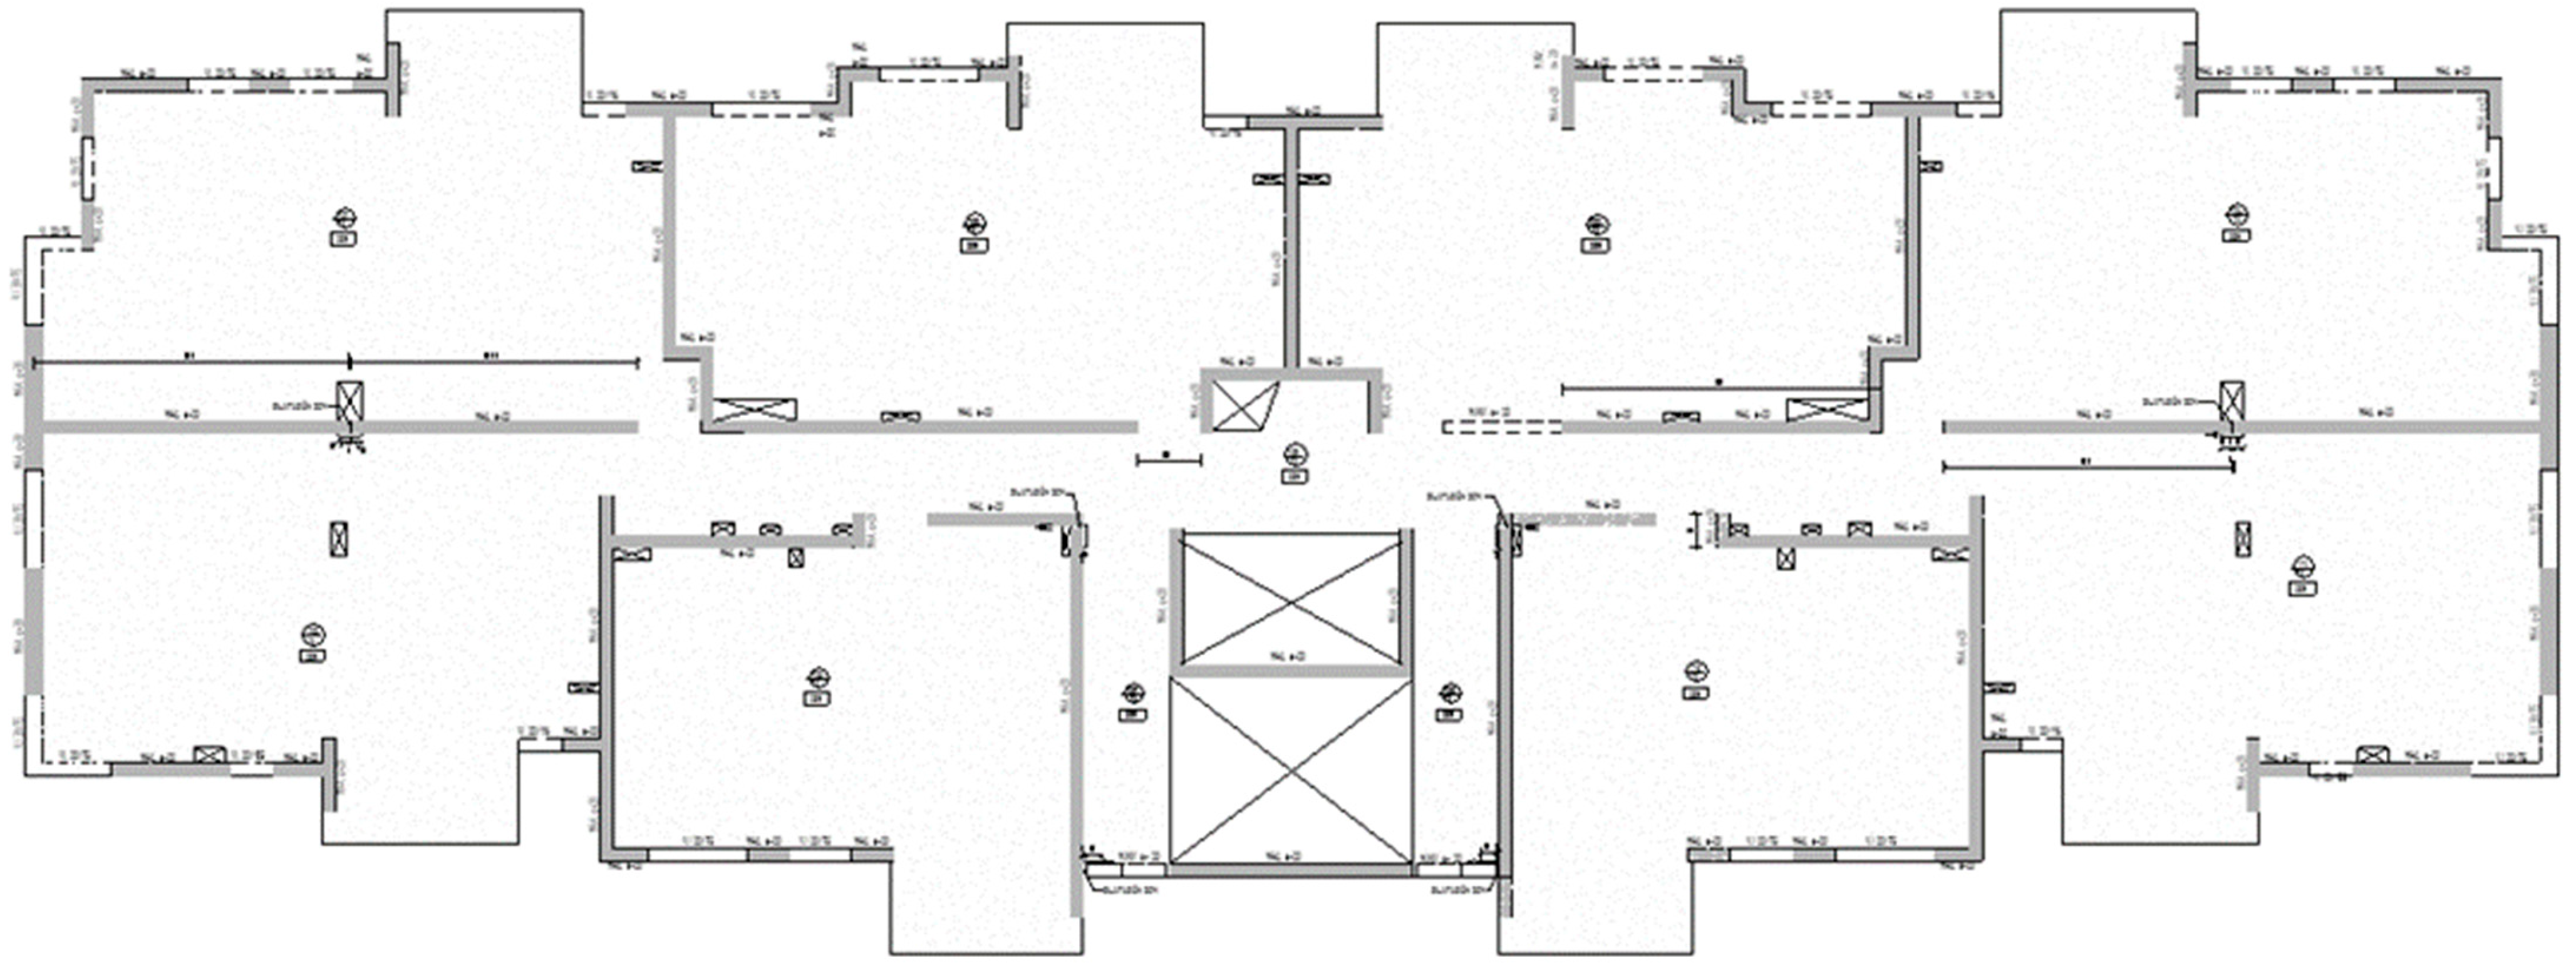
The structure presents a symmetric plane for the Y axis (strong axis), and an asymmetric plane for the X axis (weak axis). In addition, the building slabs are 15 cm thick on all floors. Figure 1 shows an isometric view of the Project, and Figure 2 shows a typical plan view. Relevant geometric characteristics of the building are summarized in Table 1.
Henceforth, the term “complex shear walls” will be used to define the building’s shear walls that do not have a typical geometry, such as rectangular or T- or C-shaped, as commonly found in other countries. As can be seen in Figure 2, the shear walls possess polygonal geometries with various lengths that will support seismic loads in both directions of analysis.
The building’s foundation is on soft type D soil (180 m/s ≤ Vs30 < 350 m/s) and Type 3 seismic zoning (close to the subduction zone) according to current Chilean regulations [9]. The preliminary seismic design of the building was carried out following the seismic-resistant provisions specified in the national regulations, considering the incorporation of Supreme Decree No. 61 [9] in the structural analysis and No. 60 [8] in the structural design. In addition, the building has a shape aspect of 2.6 (35.7 (m)/13.87 (m)), classified as “slender walls” [60,61,62,63] for which flexural deformations are considered the main contributor to lateral deformations. According to the design criteria, the building is structured with G-35 quality concrete from stories 1 to 2, G-30 from stories 3 to 4, and G-25 from stories 5 to 14. In addition, the reinforcing steel corresponds to type A630-420H with a yield stress of 420 MPa. Modal-spectral analysis has been implemented to determine base shear from the lateral distribution of forces.

4. Modeling and Analysis of the Case Study

4.1. Non-Linear Modeling

The nonlinear static analysis (pushover) has been executed in SeismoStruct [64], a user-friendly software for managing the structural analysis process, which allows nonlinear static and dynamic analysis to be performed using both fiber and lumped hinge models.
Structural elements are modeled considering the characteristics of the cross-sections, which are then used to generate both the plastic hinge model and the fiber model. The plastic hinge model consists of elastic elements with hinges at both ends representing the equivalent nonlinear behavior of the cross-section.
Fiber elements are essentially used to represent shear walls. In these elements, material nonlinearity is considered based on the complete distribution of inelasticity in the element, unlike the usual practice of employing models where plasticity is concentrated at specific points. This offers the advantage of not requiring empirical calibration of the actual or ideal behavior of the element under idealized load conditions, as is the case with concentrated plasticity models. In both programs, fiber-based modeling is used to represent the cross-sectional behavior of the element, where each fiber is associated with a uniaxial stress-strain relationship, and the state of the element is obtained from the integration of the nonlinear uniaxial stress-strain response of each individual fiber within the section (typically 100 to 150 fibers).
These elements with complete inelasticity distribution can be implemented using two different finite element formulations: the classical displacement-based (DB) elements and the more recent force-based (FB) formulation. In the first formulation, the procedure involves imposing a displacement field, such as the linear variation of curvature in the member. In contrast, in the second formulation, the equilibrium of the element is strictly satisfied without preventing the development of inelastic deformations in the member.
To verify the validity of the modeling, in the considered static pushover analysis, the development of the moment-curvature relationship of the element is reviewed, to be compared with that obtained by design calculation, where both effectively do not consider the cyclic degradation of materials. The design curve is performed with bilinear simplification, considering the initial stiffness accounting for cracked concrete cover.
On the other hand, shear resistance is calculated based on the expressions provided in ACI 318-08 [65], for wall and beam elements, from the transverse reinforcement of these elements defined within the model. These values will be used to determine the shear capacity-demand ratio, when establishing which elements are controlled by ductile or brittle failure.
Within the requirements of the procedures presented in the standards ASCE/SEI 41-17 [66] and Achisina, the modeling of slabs considering realistic stiffness properties is included, to adequately represent their function as diaphragms. For this, the first document allows establishing the diaphragm as rigid, flexible, or semi-rigid, depending on the comparison between maximum lateral displacement and the average interstory drift of the floor elements below the diaphragm. In contrast, the Achisina document leaves it to the discretion of the designer to define the stiffness properties of the diaphragm to realistically represent the force transfer action. Regarding this, the analysis program considers that slabs function as rigid diaphragms in the structural configuration of the model, as occurs in most reinforced concrete buildings. Additionally, it is important for the diaphragm to establish the parameters of the penalty functions for the constraints, where standard values were used and that also facilitate obtaining convergence of the analysis.
The constitutive modeling of the materials has been defined for each fiber by the stress-deformation relationship and a certain level of confinement that the section presents because of the detailing of the transversal steel. The coupling beams and the R.C. shear-walls are connected through rigid links, allowing the correct transmission of momentum between these two structural elements. A stiff diaphragm has been integrated into the structure. The main structural model of study considered R.C. shear-walls modeled with infrmFB elements (force-based fiber) and beams using infrmFBPH elements (force-based plastic hinge). On the other hand, beams shorter than 1 m were modeled using infrmDB elements (displacement-based fiber), to reduce numerical instability problems [67].
Regarding the constitutive model to carry out the nonlinear analysis, two models widely used for inelastic structure analysis were applied: the Mander model [68] and Menegotto-Pinto’s behavior-based steel modeling [69]. The maximum displacement used in the analyzes was established at 50 cm, in order to guarantee that the response reached a plastic behavior. The yielding deformation was determined by the bilinear approximation of the capacity curve and area compensation, according to the Park Method [70], through which the energies of the idealized curve and the real capacity curve are balanced. The nominal properties of the structure are taken into consideration since no significant differences are found when obtaining the capacity curve. In addition, 25% of the unreduced live load is taken into consideration, as the Achisina document indicates.
A deterministic approach will be used to define seismic demand, different from the probabilistic international approach. To do so, the following overview of Achisina’s document “Performance-based Seismic Design” [19] will be taken into consideration:
For these reasons, it is proposed that we adopt as design earthquakes, the considered earthquakes registered in 1985 in the central zone, in 2010 in the central and southern zone of the country, in 2014 in Iquique and in 2015 in Coquimbo. For these earthquakes, characterized by the elastic spectrum of displacements indicated in article 13 of Decree Law No. 61 (2011), it is possible to obtain an immediate occupancy response”.
Therefore, the definition of the design seismic demand will have to be formulated based on the elastic displacement spectrum corresponding to the Maule earthquake of 2010. This seismic demand must be presented in acceleration-displacement format in order to establish compatibility with the pushover analysis.

4.2. Non-Linear Static Analysis (Pushover Analysis)

The nonlinear static analysis (pushover) consists of a procedure for applying a pattern of lateral deformations or lateral seismic loads on the structure, depending on whether the structural analysis tests for deformations or forces.
The most common methodology used in structural engineering consists of the application of a pattern of lateral loads increasing in elevation, consistent with the first mode of vibration. Therefore, this analysis is valid for structures with fundamental periods lower than 1 s, whereas structures with more flexible periods require the influence of superior modes on the structural response to be incorporated into the analysis (pushover analysis with an adaptive scheme). These forces are applied gradually on the building, starting from elastic behavior, followed by the yielding of some structural components (at the point where the original lateral resistance and stiffness begin to drop off), and consequently the excess moment must be absorbed by the nearby components in the redistribution of stress. As the analysis develops, the capacity curve of the structure is presented, which establishes a relationship between the base shear and the deformation capacity of the roof. Conventionally, this type of nonlinear analysis has the purpose of taking the structure to a target roof deformation that allows the peak value of base shear to be reached or 150% of ΔD according to ASCE/SEI 41-17. This analysis incorporates the redistribution of stresses, the P-Δ effect, and the inelasticity of the materials’ behavior.
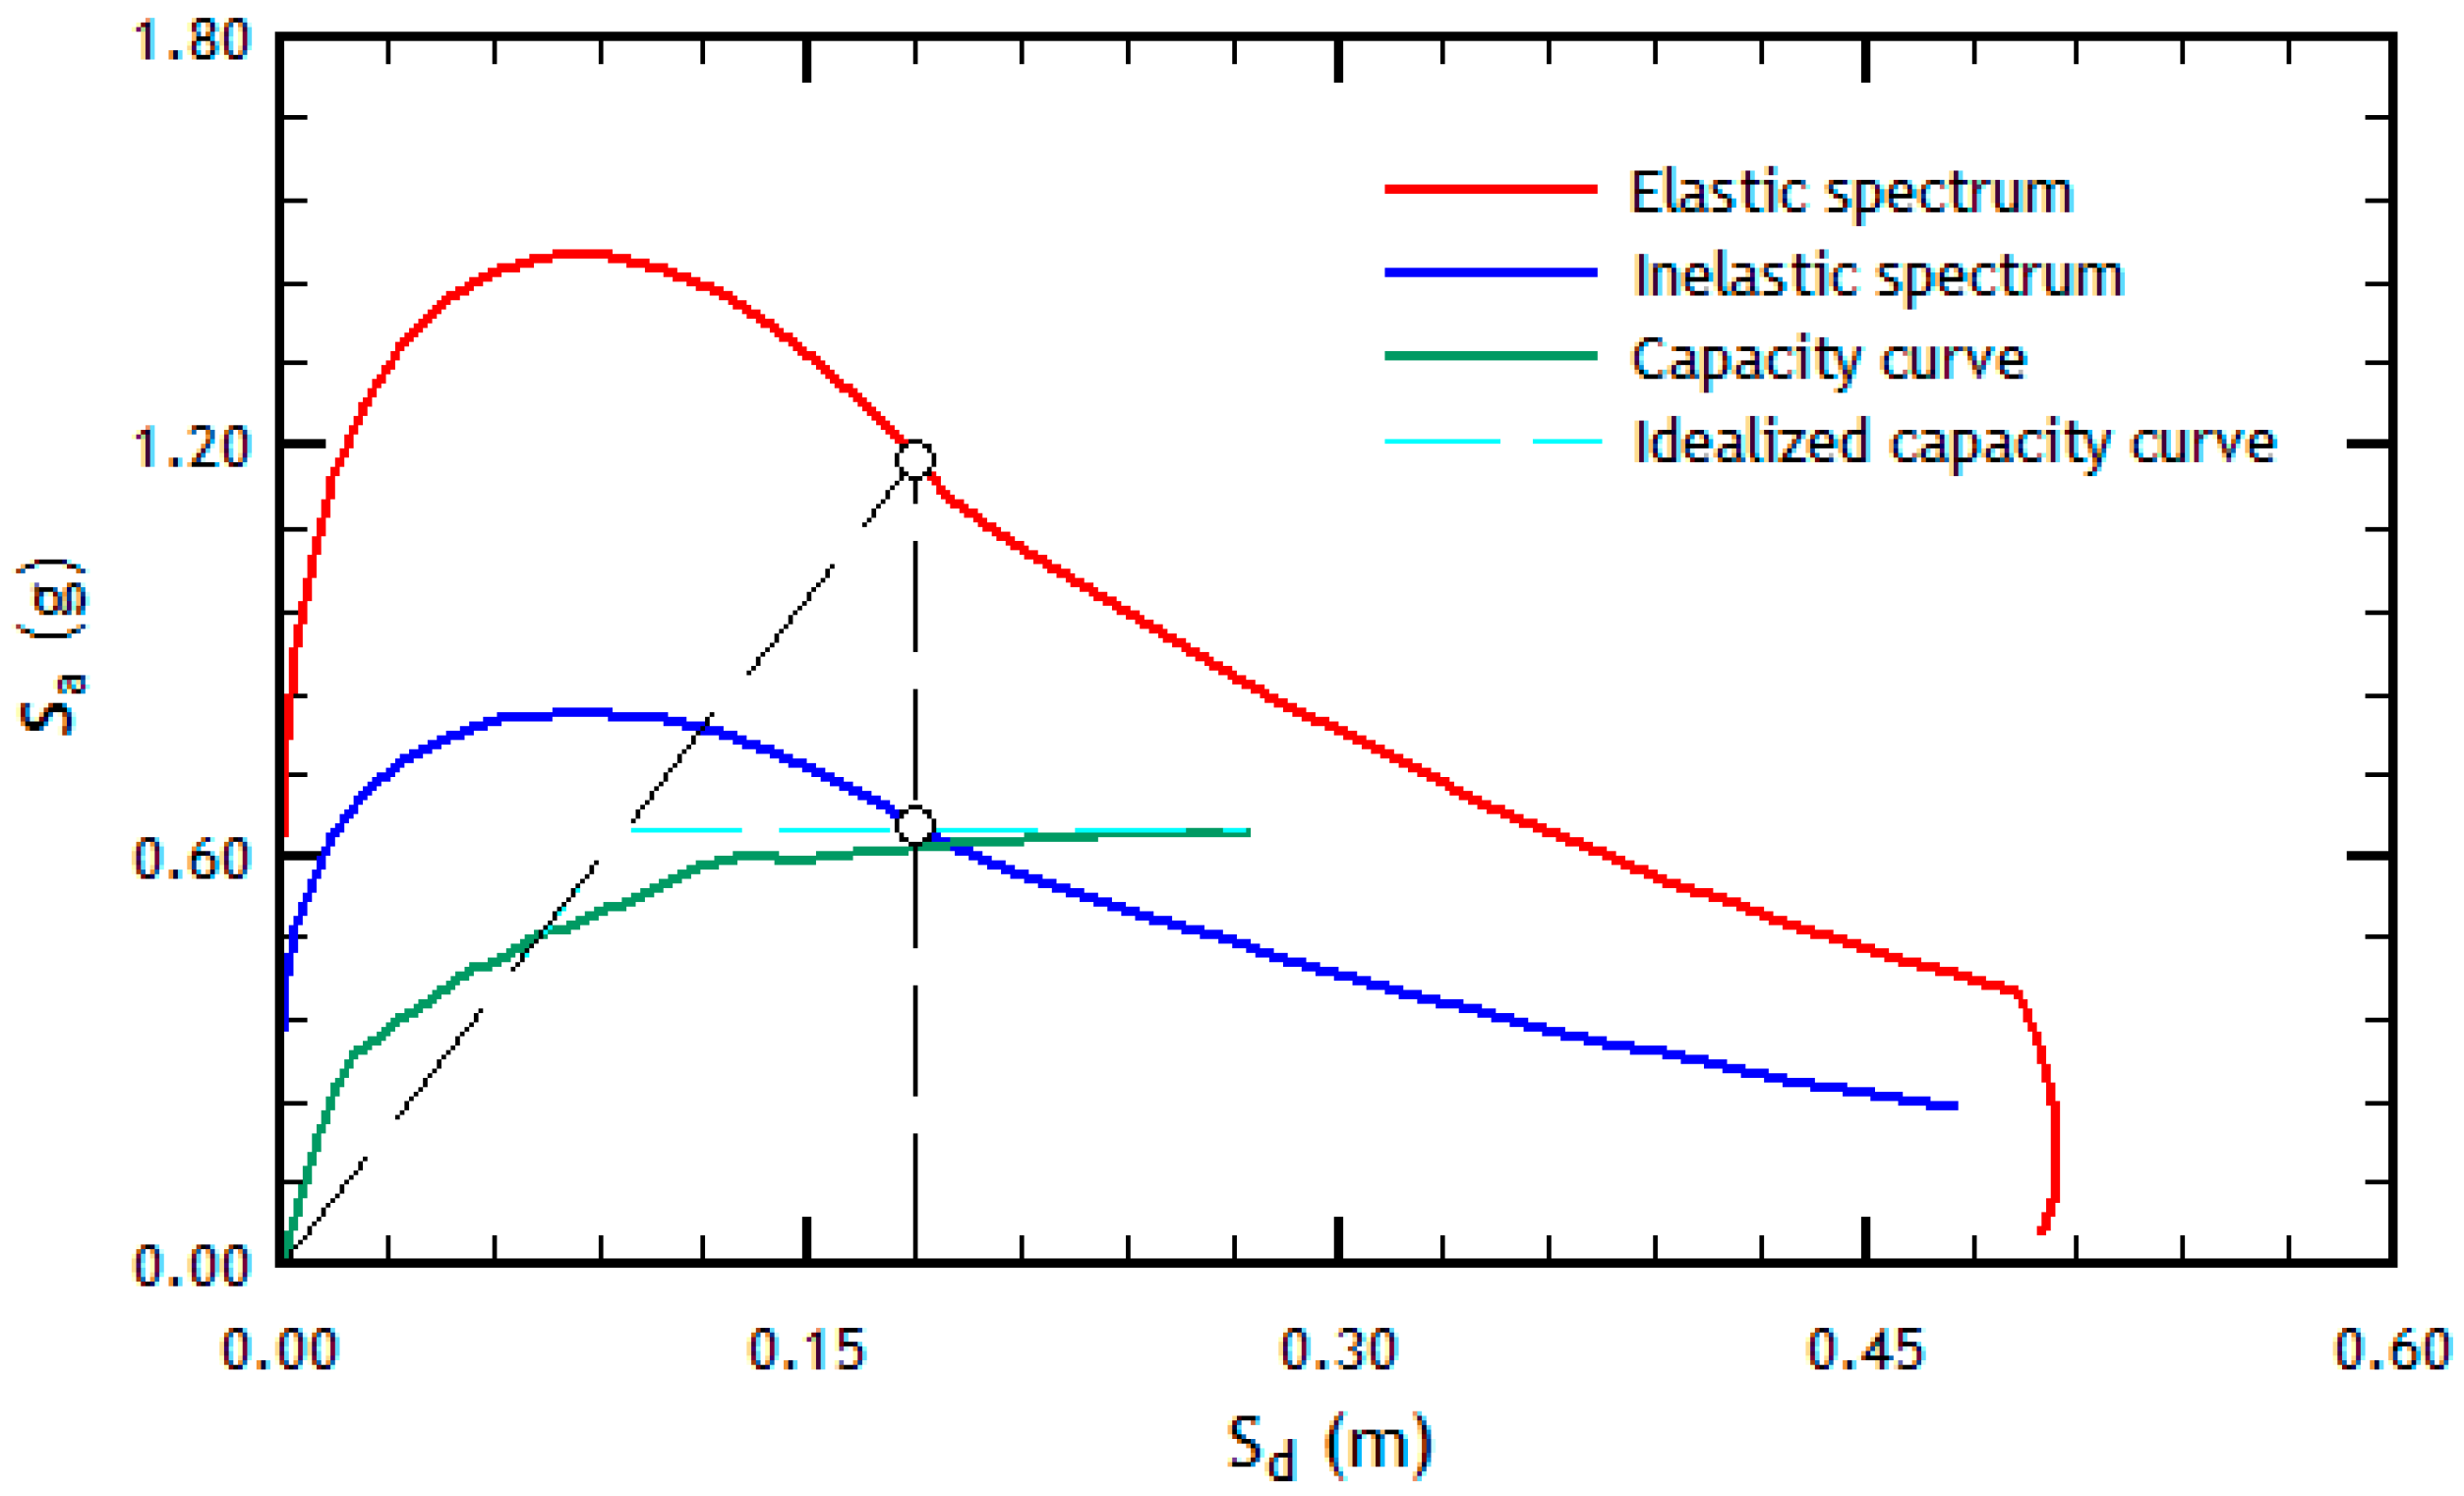
The modified Capacity Spectrum Method proposed by Fajfar [71,72] has been used to determine the Performance Point imposed on the case study through the lateral forces applied during the Static Nonlinear Analysis, see Figure 3.

5. Results

5.1. Comparison of Modeling Techniques for Nonlinear Sections

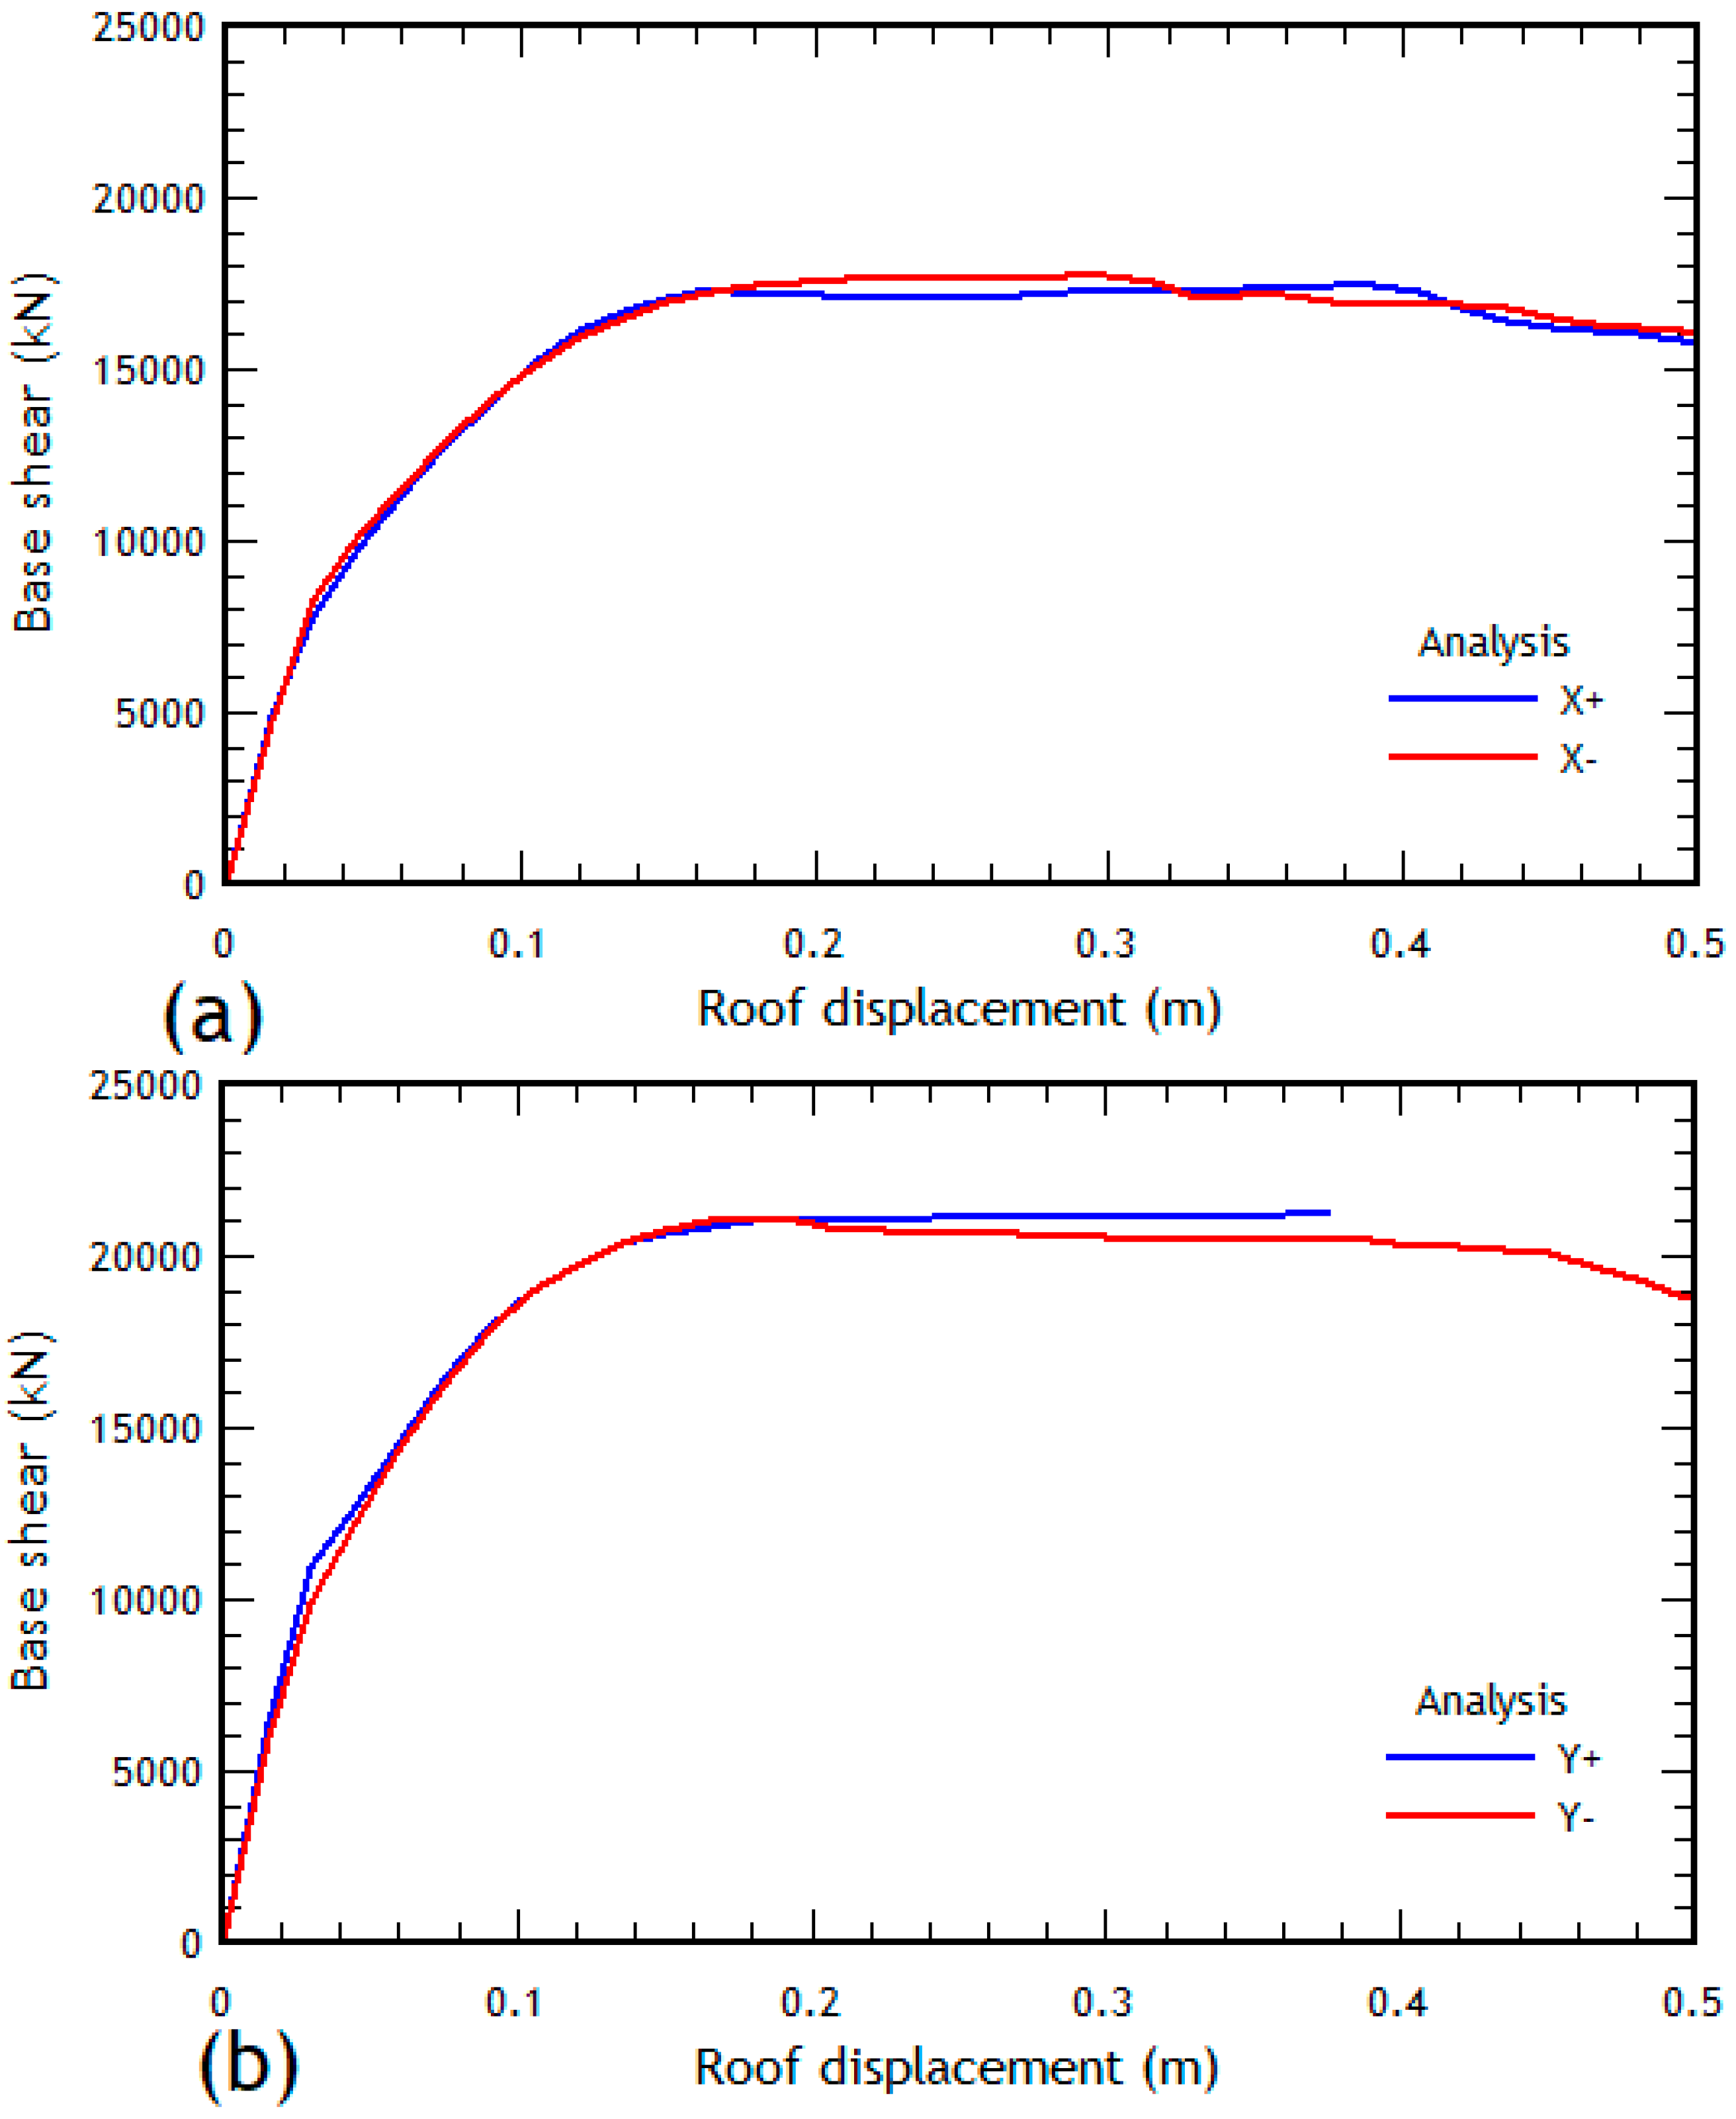
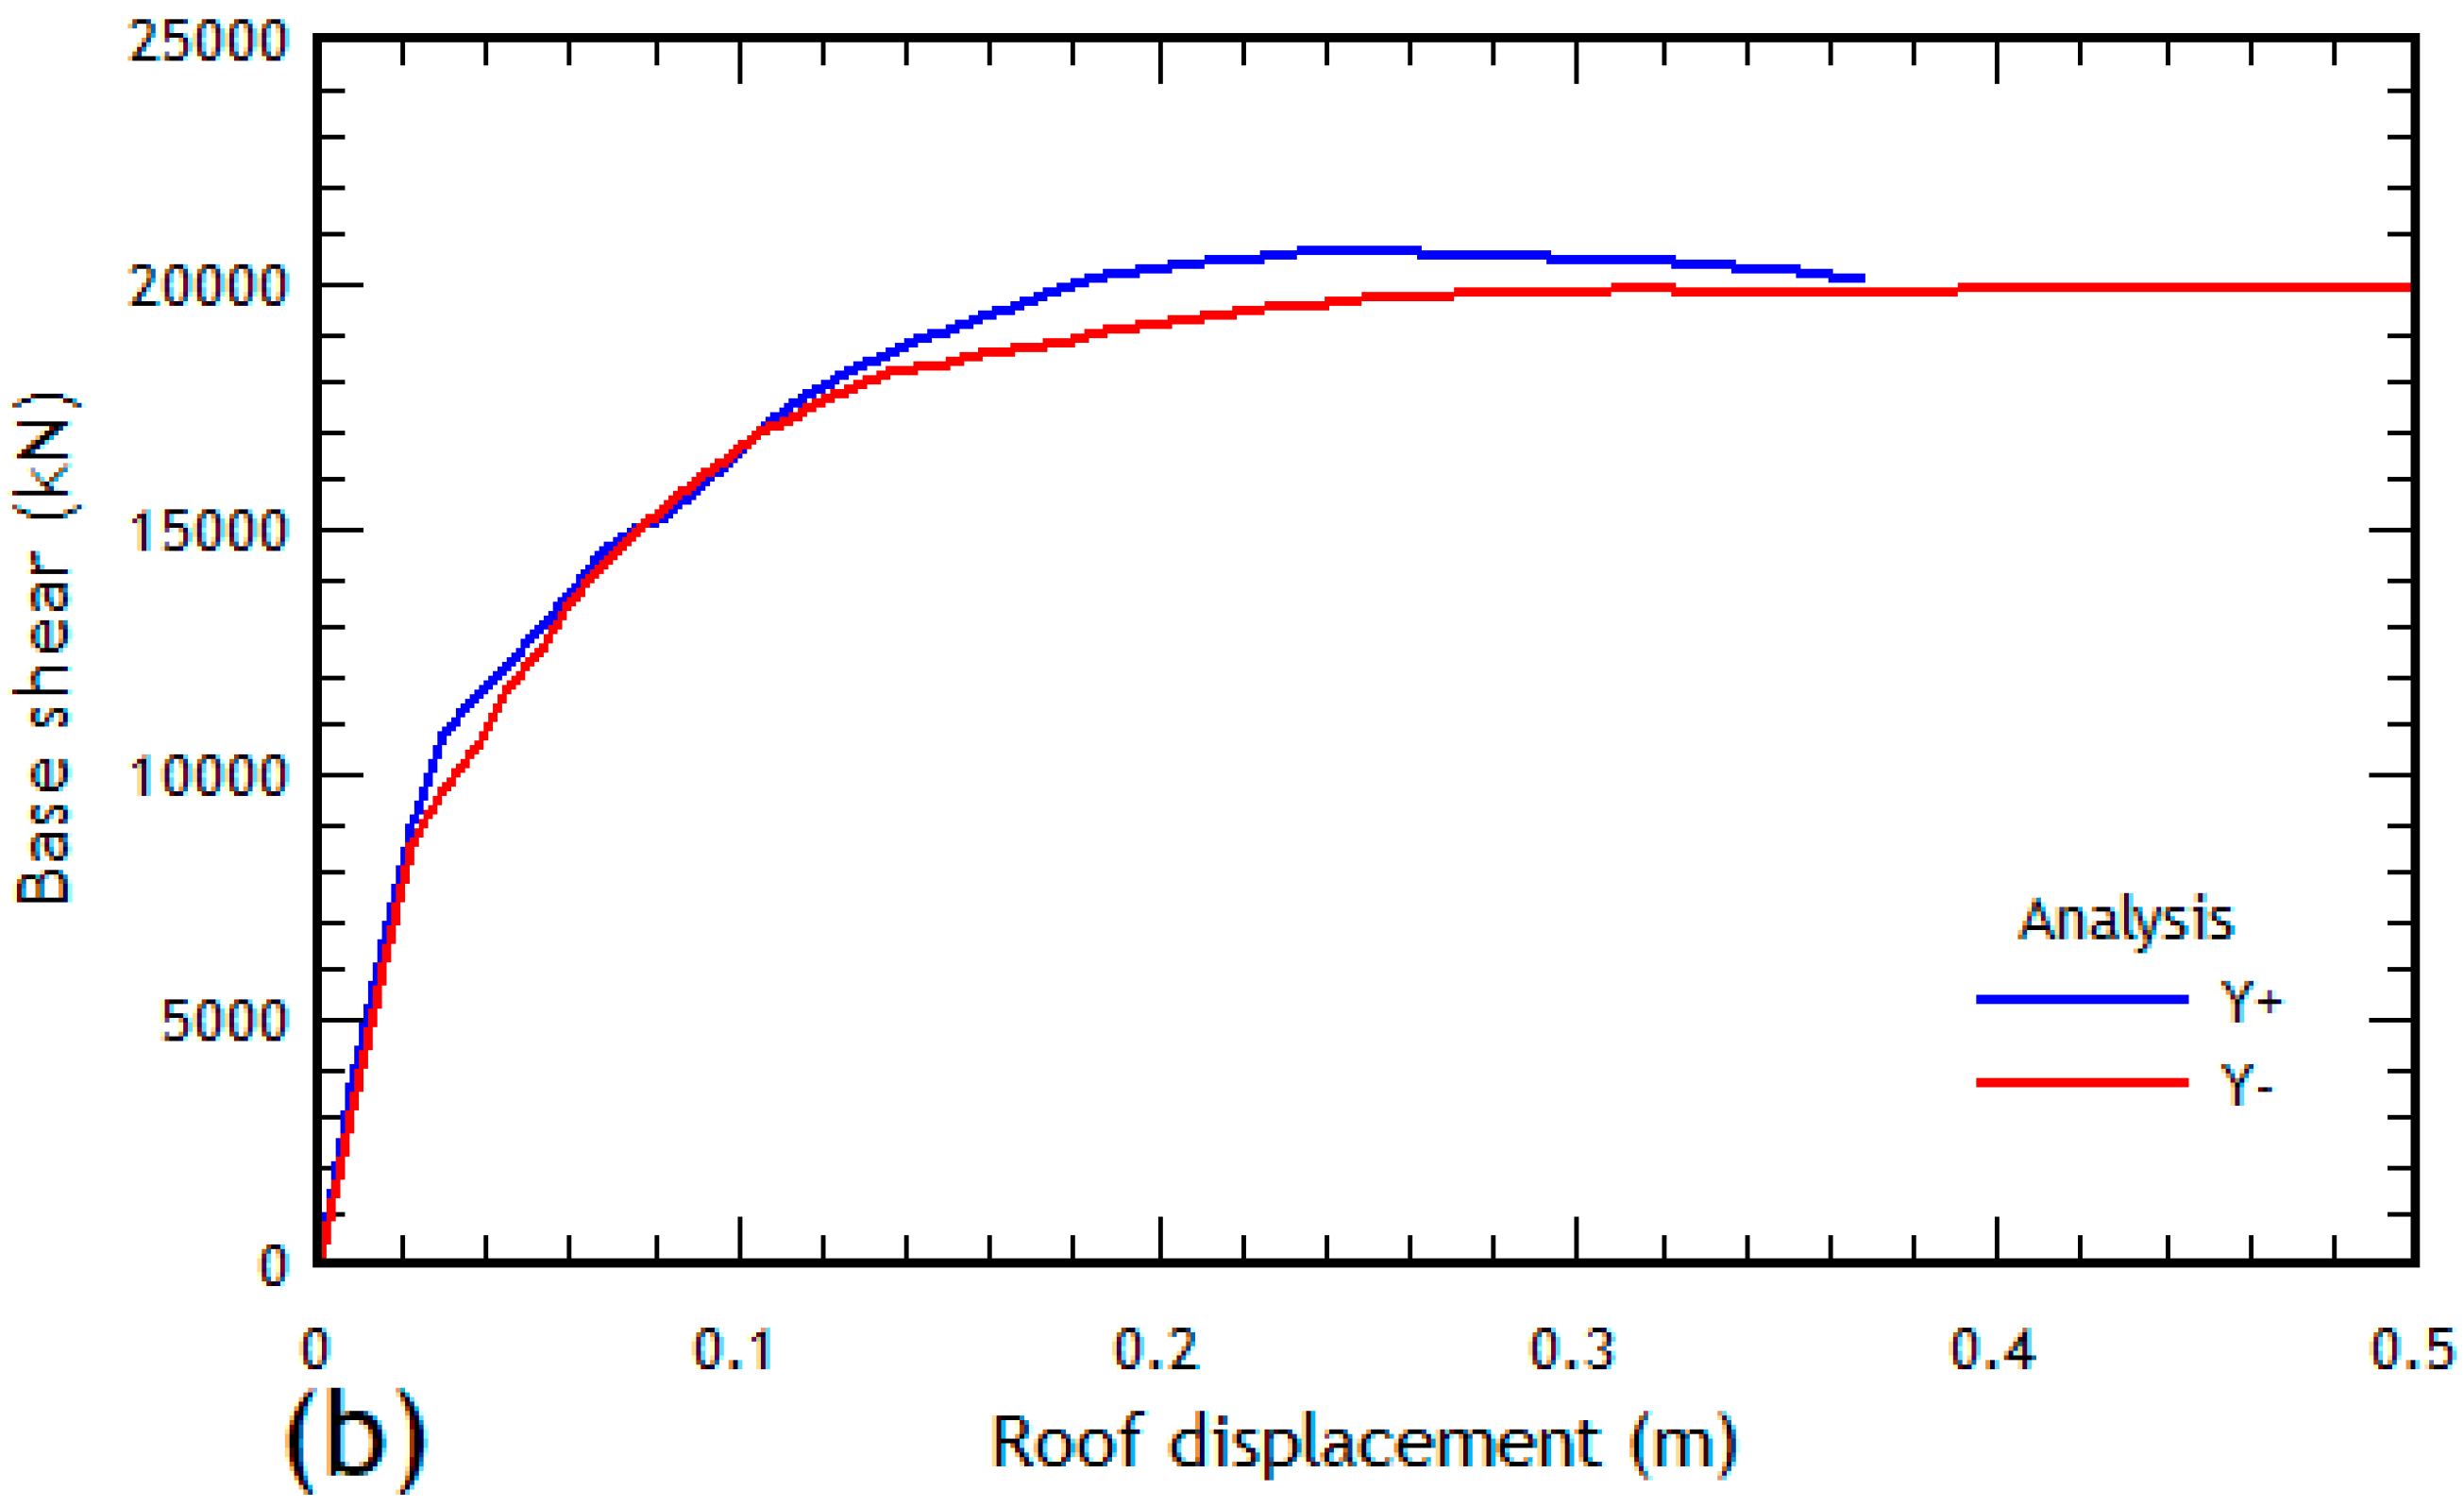
A study has been carried out based on two models to find out/establish a comparison in obtaining the capacity curve: (1) “M1 Model” with lumped hinge for the entire building, and (2) “M2 Model” with fiber on walls and lumped hinges in beams. The building was analyzed in all its directions (see Figure 4 and Figure 5). It is observed that the capacity curve obtained for the M1 Model overestimates the resistance capacity of the structure compared to the M2 Model curve. It is also observed that the M1 Model reaches its highest maximum value of shear stress at the same level of deformation where the M2 Model loses convergence. It becomes practically impossible to determine the capacity curve after reaching the maximum shear stress value for the M2 Model, in contrast with the M1 Model, for which strength degradation is observed upon reaching the maximum shear stress value.

5.2. Modal Analysis

The modal analysis reveals a period of 0.56 s in the Y direction, accounting for 64.89% of the translational mass, while in the X direction, a period of 0.65 s corresponds to 64.40% of the translational mass. A total of 50 modes were required to achieve 95% participation of the mass in both directions. These results of the linear analysis provide periods that under the action of the nonlinear dynamic analysis and the presence of flexible soils (for example soil type D) will predictably produce the elongation of this period.
The integration of the elongated period in nonlinear seismic analysis emerges as a fundamental factor across recent research, enhancing structural response and seismic reliability assessment. Studies demonstrate the significance of dynamic soil-structure interaction and its influence on seismic demand, with findings indicating that accurate consideration of these interactions, alongside innovative analysis techniques, leads to more reliable predictions of a structure’s seismic performance [73,74,75]. However, the analysis used in this study is of a nonlinear static type, assuming that seismic action is represented by incremental lateral forces independent of time. Consequently, the elongation of the period due to soil flexibility and stiffness degradation does not impact the outcomes of the analyses.

5.3. Capacity Curve Analysis

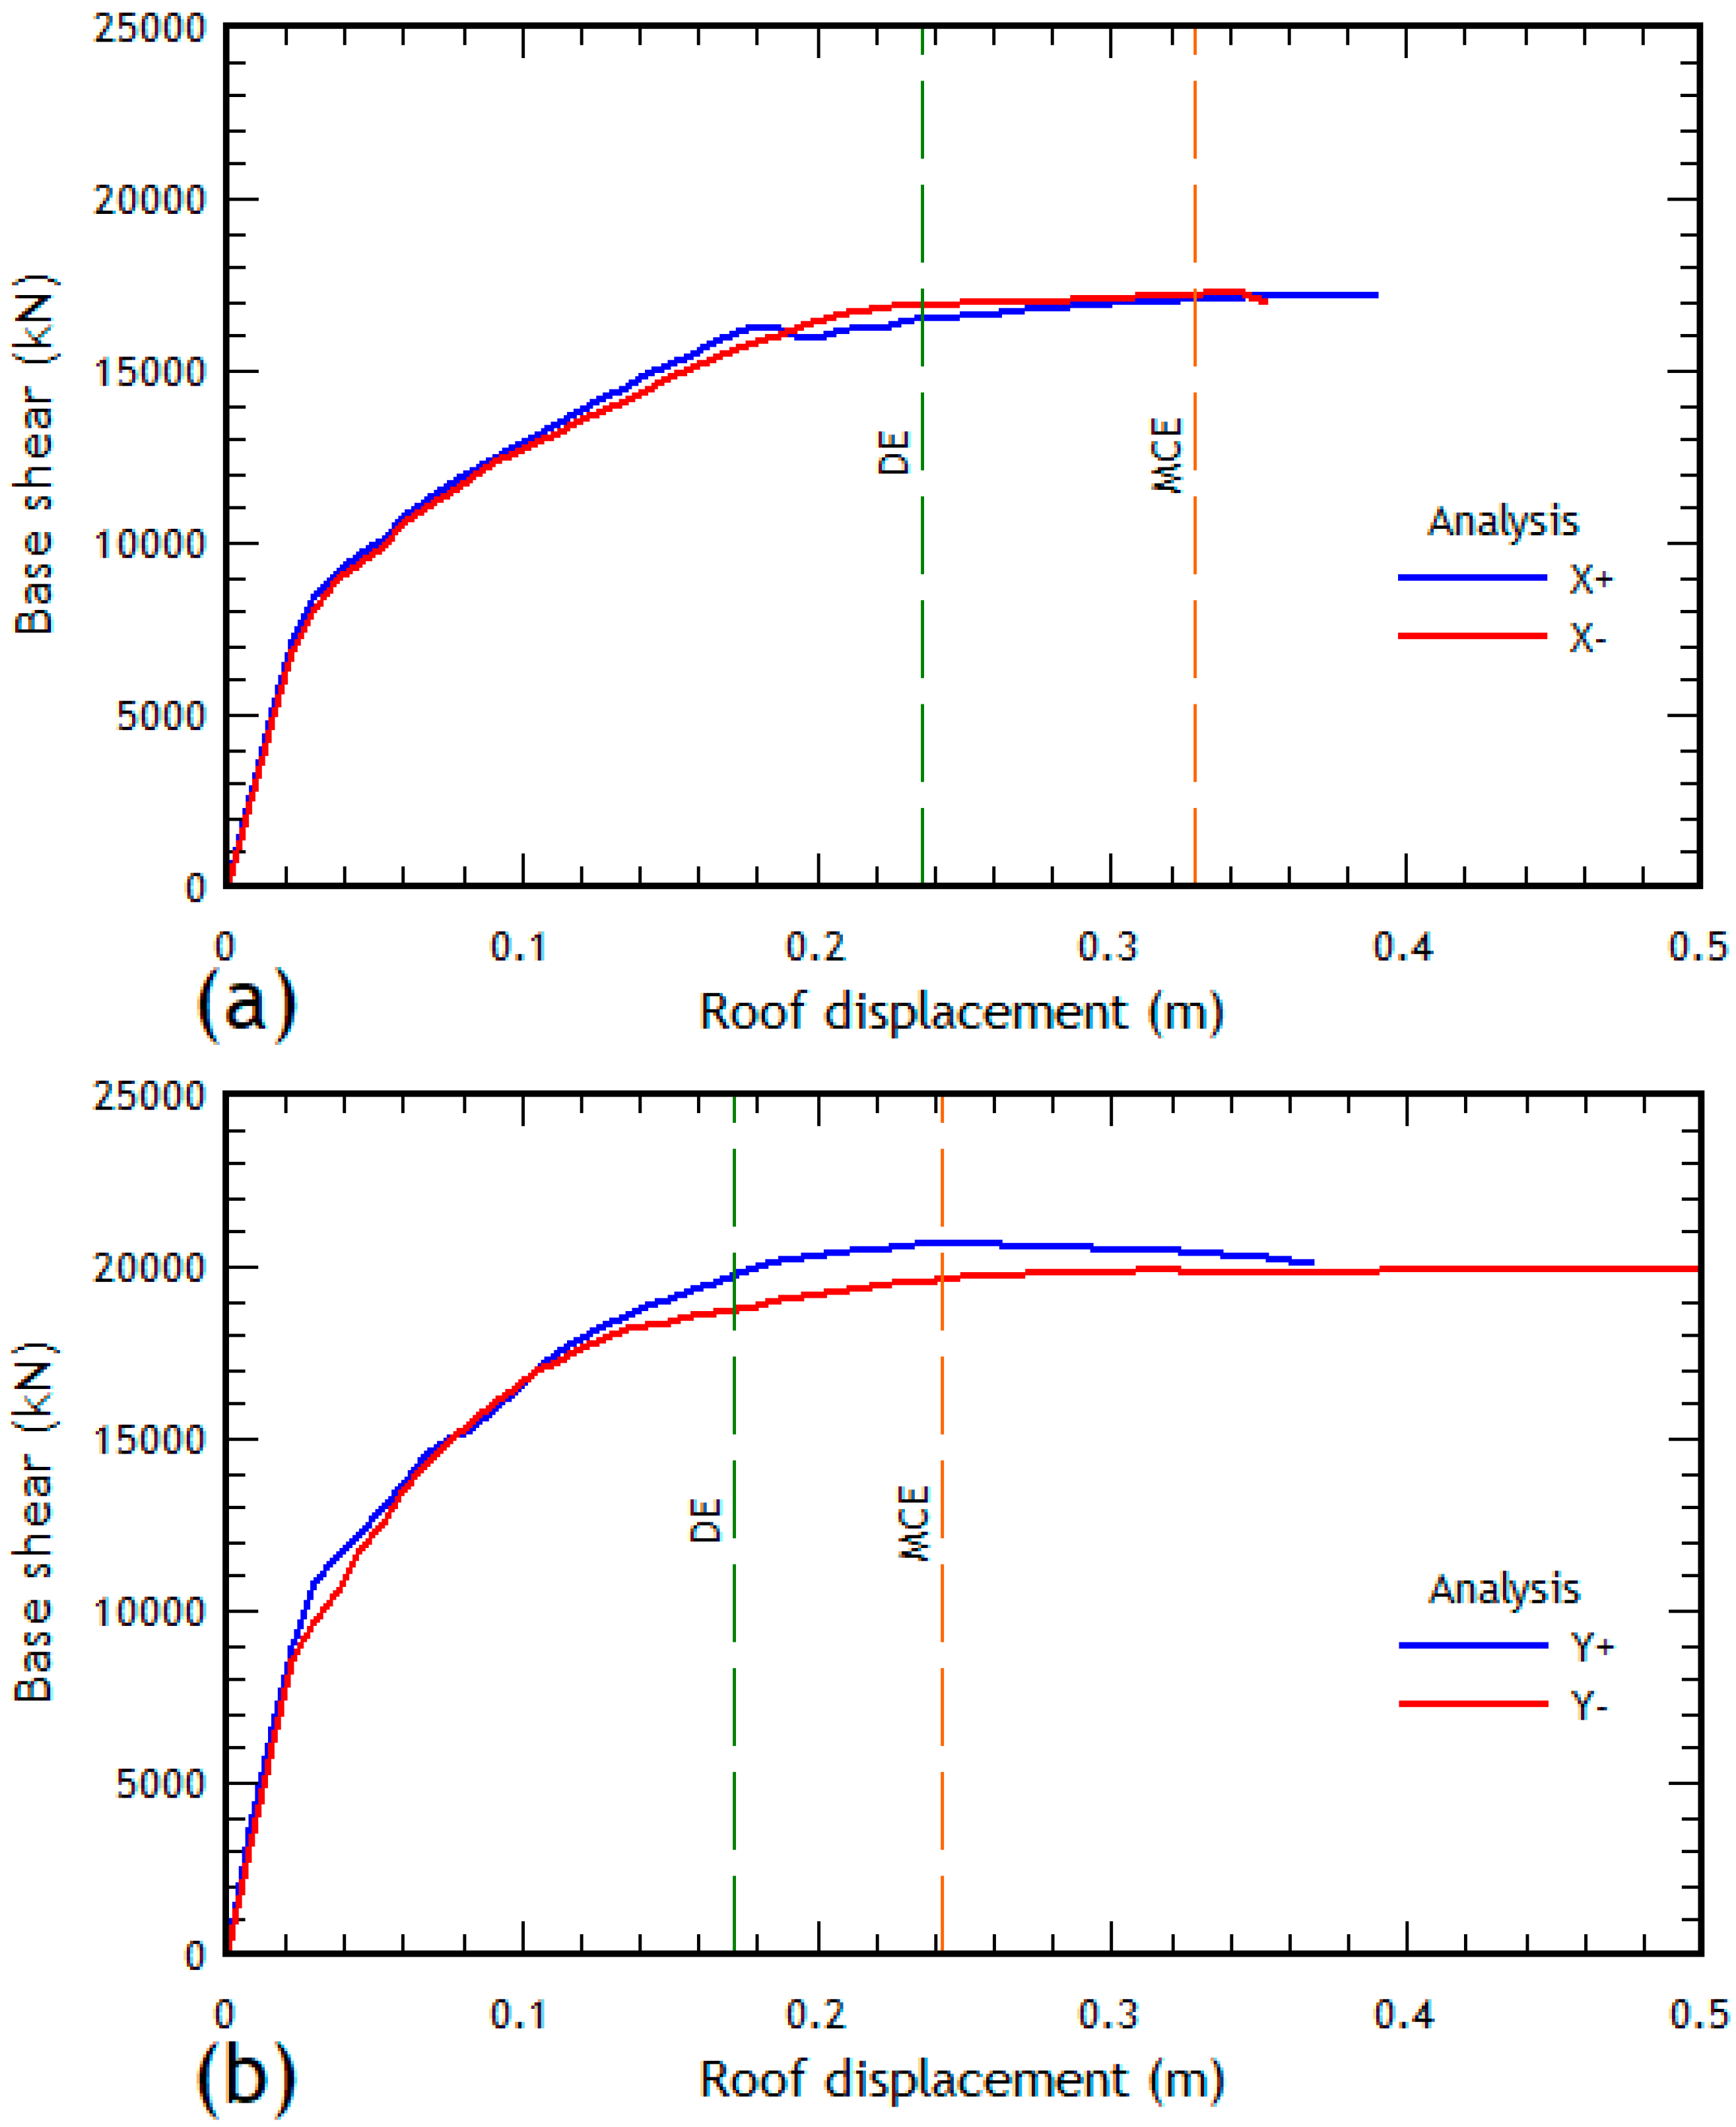
Firstly, to determine the performance point of the structure, the N2 Method was applied to the building in both directions. The deterministic approach uses the “capacity spectrum” to facilitate the evaluation of the benefits that the project’s structuring aims to achieve, determined from the modal participation factors in each direction (Γx = 1.33; Γy = 1.24). This spectrum will have to be presented in bilinear format based on Park’s energy compensation method [70], to later superimpose it with the seismic demand in acceleration-displacement format and determine the level of seismic demand expressed as design roof deformation. It is important to mention that, among the wide range of available procedures for determining the performance point, the Fajfar method has been applied due to its rationality and practicality. Determining the performance point of the building facilitates the acquisition of the design roof drift value necessary for verifying compliance with the immediate occupancy performance level. This procedure is conducted using the design earthquake derived from the elastic spectrum for type D soil. Meanwhile, to verify the additional deformation capacity, corresponding to the life safety limit state, the demand level is defined by the maximum considered earthquake, calculated as 1.4 times the design earthquake, as defined in the Achisina document [19]. Subsequently, the design demands are represented by vertical lines to determine the range of deformations of interest for analyzing the building’s performance (refer to Figure 6). The green lines represent the design demand, while the red lines represent the maximum considered earthquake demand for both directions of analysis.
Through the study of the demands, a 6.6‰ drift in X and 4.8‰ in Y are established for the DE (design earthquake) level, and 9.2‰ in X and 6.8‰ in Y are established for an MCE (maximum considered earthquake) level. For these drifts, it is necessary to study the performance achieved in the building based on the study of the interstory drifts (global analysis) and the strains at the component level (local analysis). For the MCE demand level, it is observed that, on the Y axis, the structure presents a certain ductility to enter the inelastic range, while on the X axis, the demand imposes a drift close to the maximum drift obtained in that direction of the order of 1%. Based on the structural analysis, setting a drift limit of 5‰ on the capacity curve for both directions indicates that the building’s performance is operational. At a reduced drift of 2‰, the building’s performance remains fully operational, with minimal yielding observed in the longest shear walls in each direction. This suggests that the structural behavior remains predominantly linear-elastic. Through previous characterizations of Chilean buildings and study of performance given the seismic reality, the performance witnessed in the nonlinear analysis is consistent with the investigation of “Seismic Performance of High-rise Concrete Buildings in Chile” [23] in which it is shown that buildings whose stiffness index (Ho/T) is normal, that is between 40 and 70 (m/s), with roof drifts of less than 5‰, had an immediate occupancy response to the 2010 Maule earthquake.

6. An Examination of Global and Local Performance Metrics

6.1. Determination of Performance at the Global Level of Components

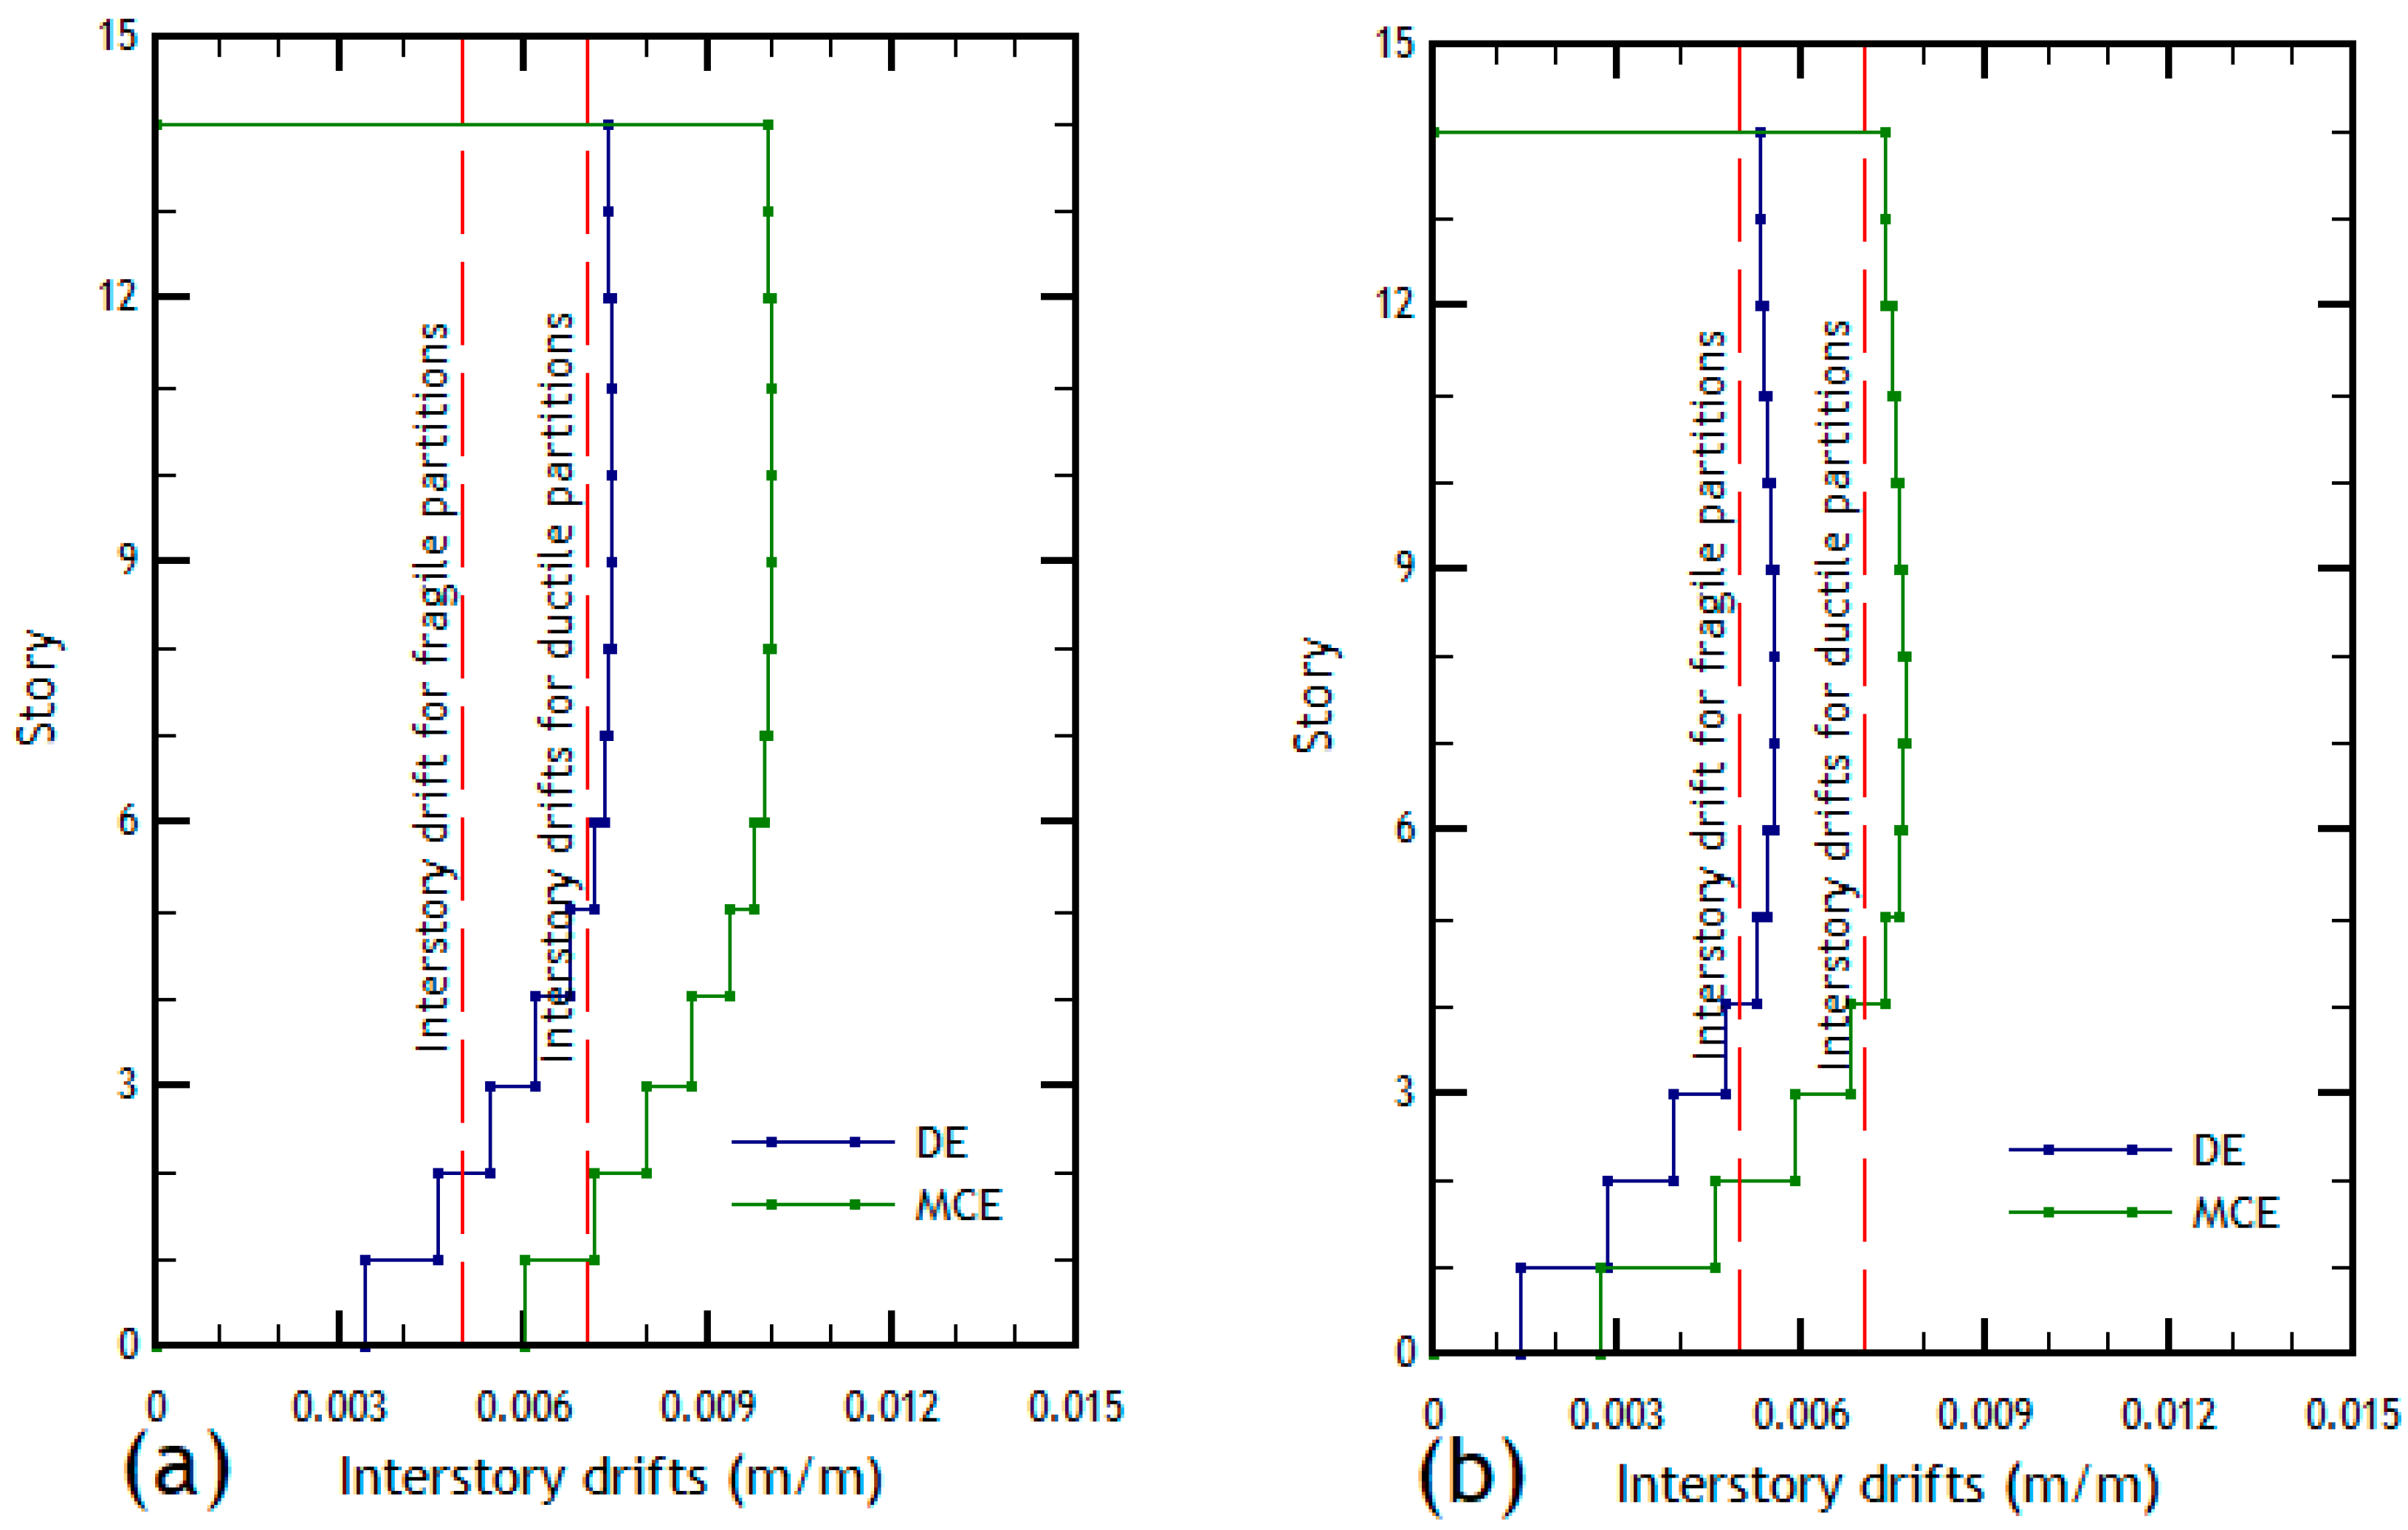
The evaluation of interstory drifts for demand levels (blue and green lines in Figure 7) in the determination of performance, allows for the behavior of the structure at a global level to be calculated. To do so, it was first necessary to model a control node at the centroid of all the floors of each structural level, which is attached to the nearest shear-wall by means of a rigid arm. This modeling technique allows for the monitoring, for each load factor of the analysis, the deformations of the nth floors of the building. The red vertical lines represent the interstory drifts of 5‰ and 7‰, the maximum levels established in the Achisina document for buildings with brittle and ductile non-structural elements, respectively.
It is observed that, for the DE demand level, the Y-axis, which is the most rigid direction of the building, exhibits drift values lower than 7‰ and slightly above 5‰., reaching the maximum roof drift values between the 6th and 8th floors; whereas for the MCE demand level, the interstory drifts slightly exceed 7‰. Meanwhile, the X-axis presents higher drift values, slightly exceeding (for the DE demand level) the limit drift values of 7‰ for the immediate occupancy state, concentrating the maximum drift values between the 9th and the 12th floors. The drifts determined in an inelastic behavior reach their maximum levels on the upper floors, whereas the elastic drifts do so at the middle of the building.

6.2. Deformation Analysis at Component Level

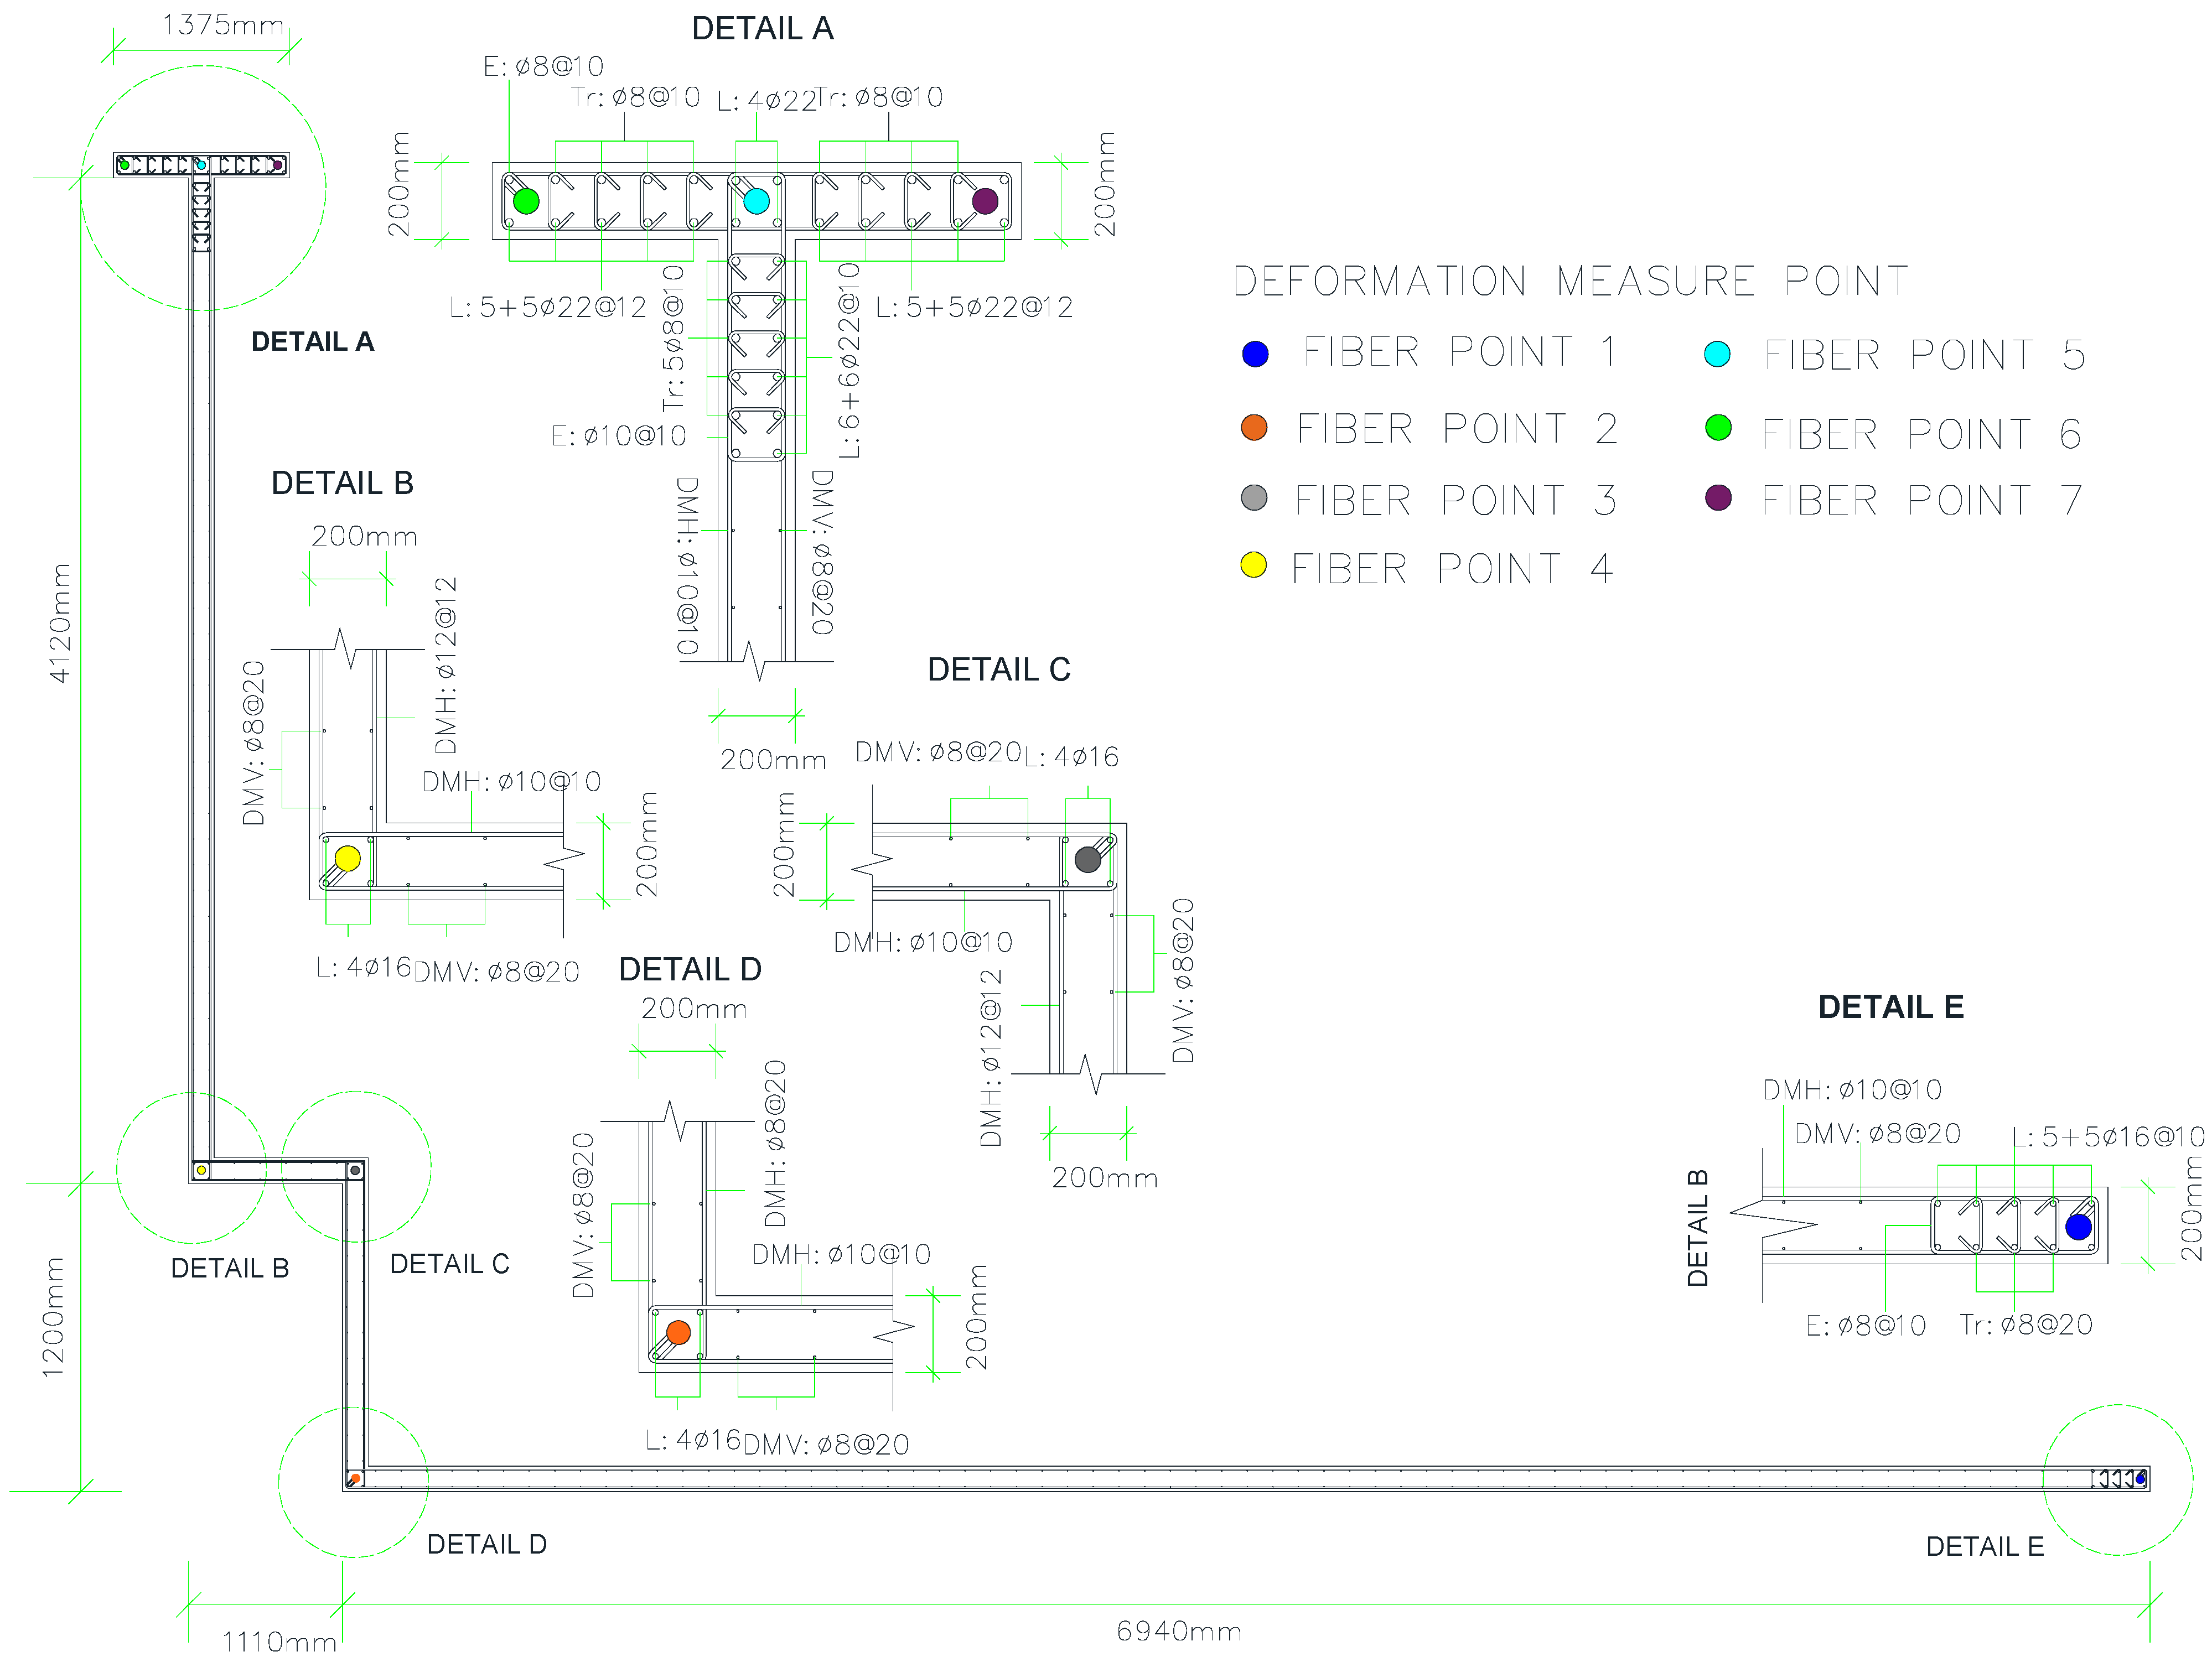
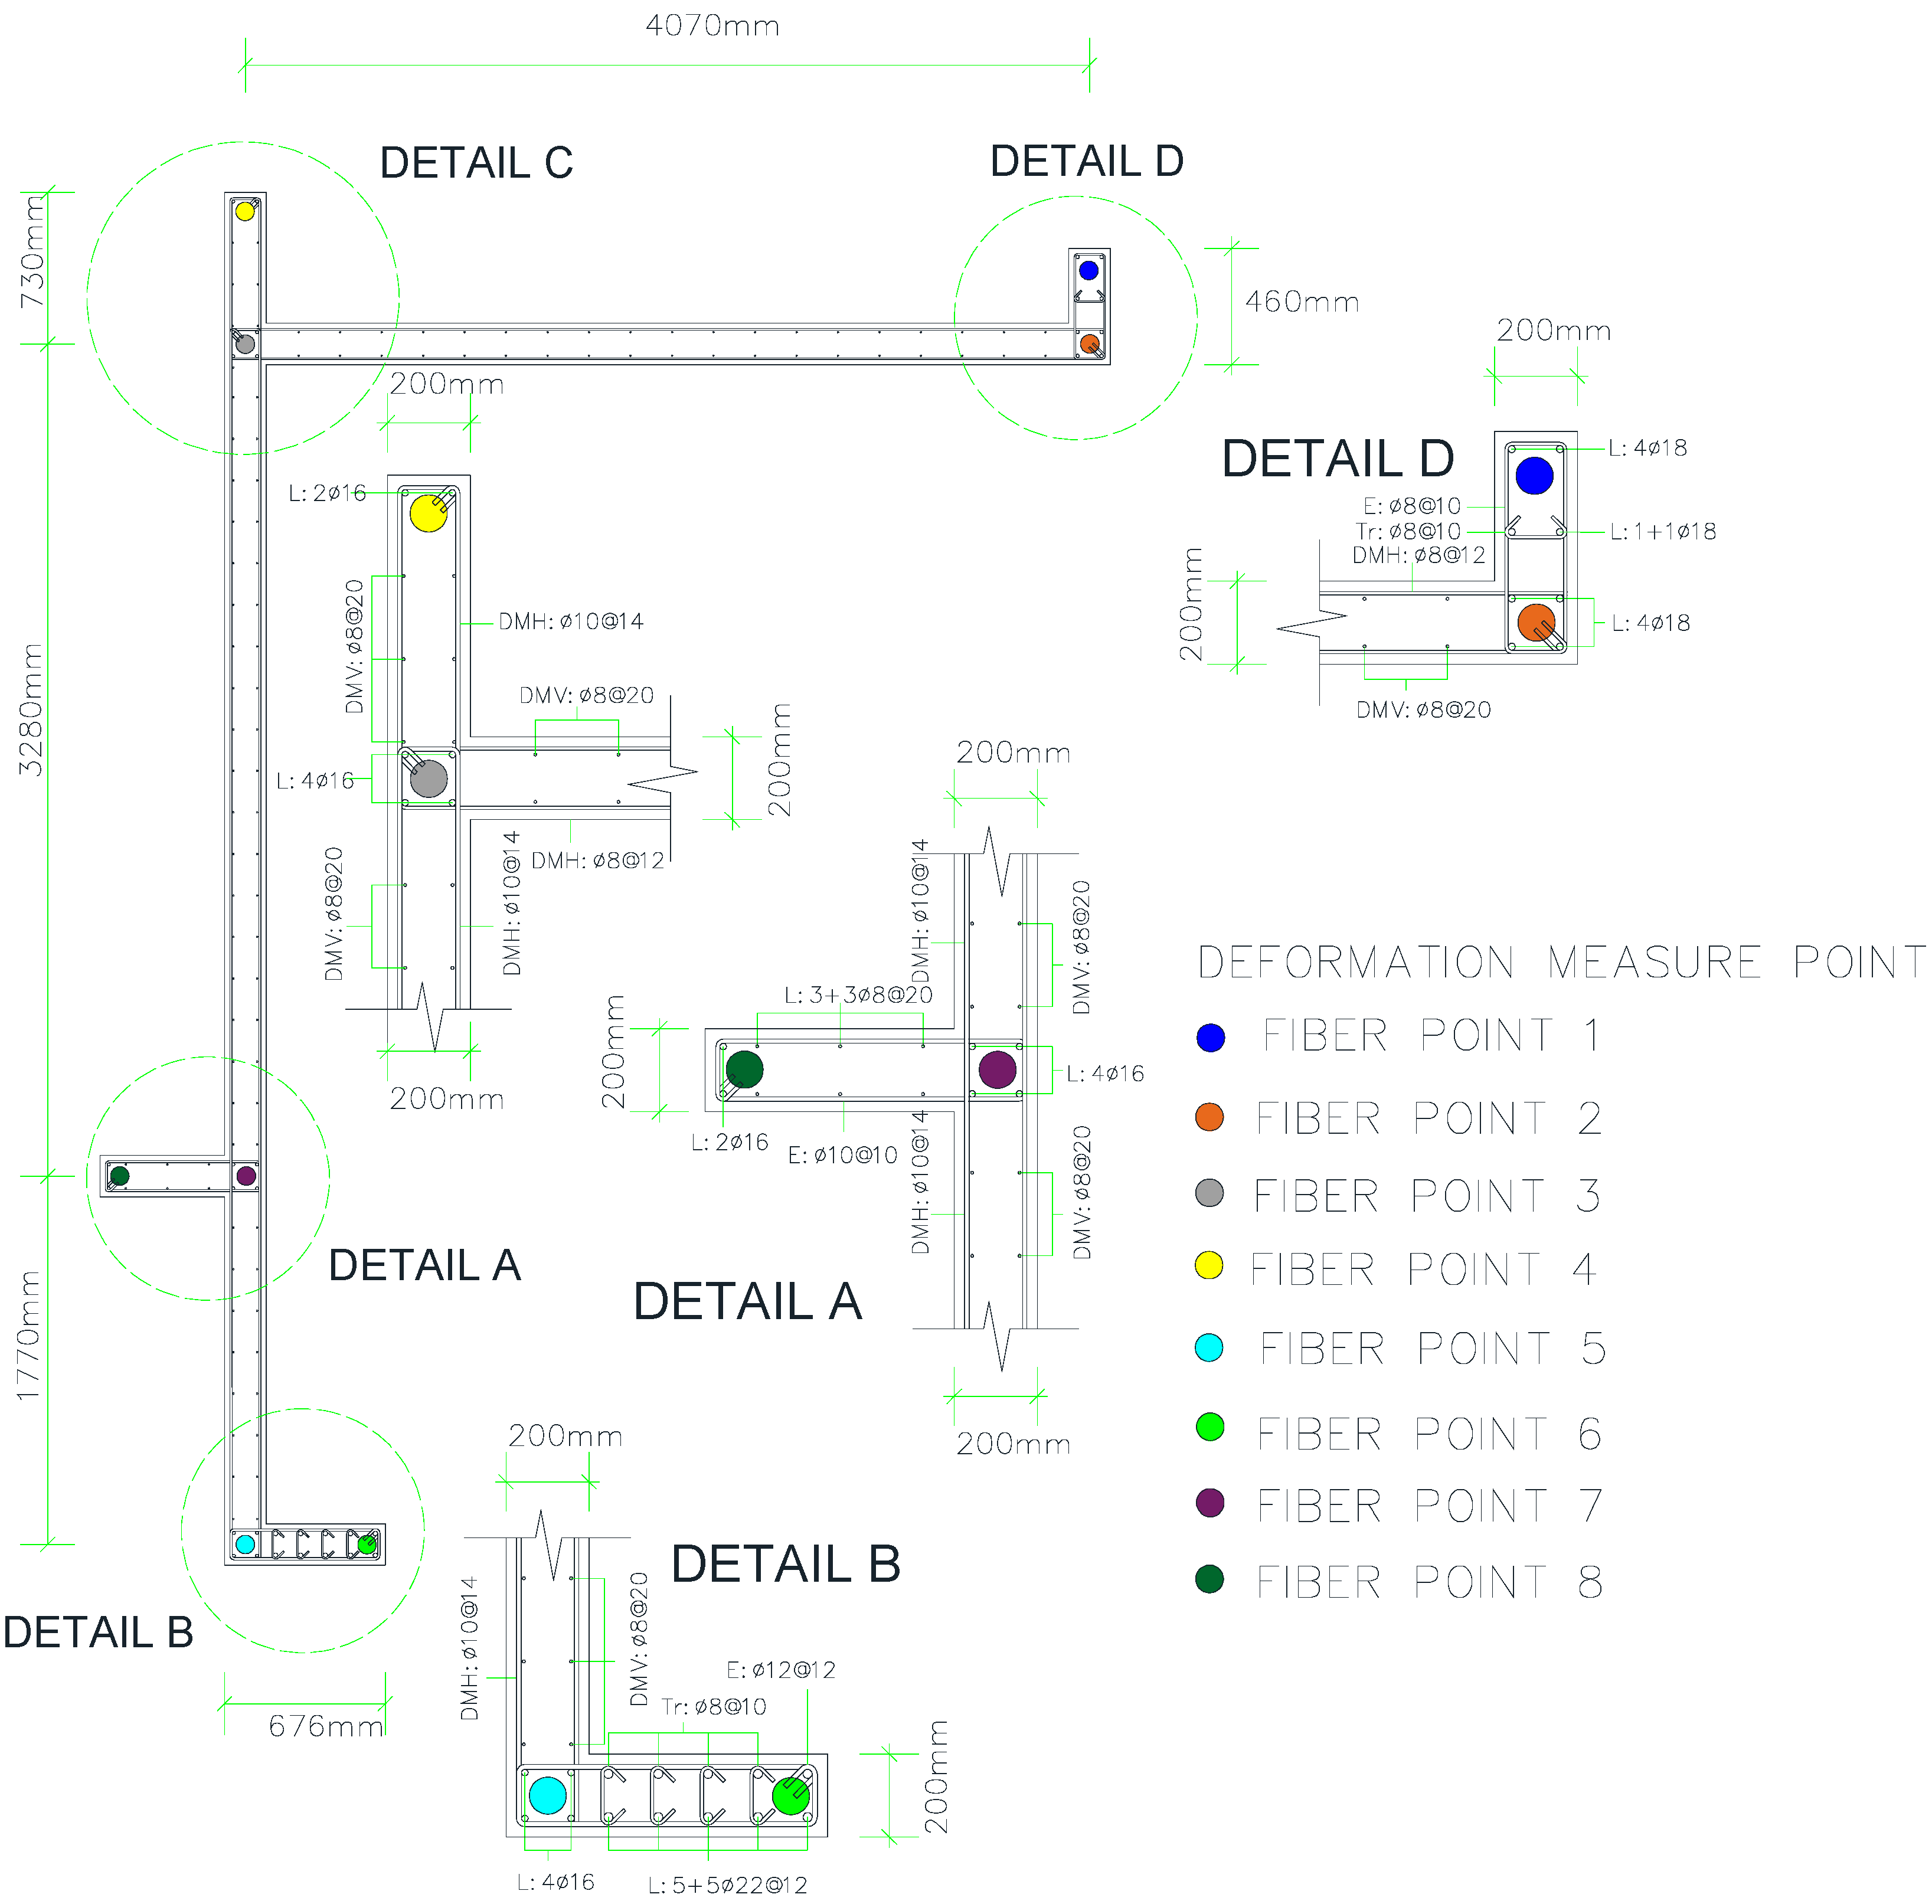
Performance at the component level is analyzed through strains. For this purpose, points of interest are established on complex walls, whose deformations are calculated for each increment of lateral loads. The progressive behavior of the damage develops from the fulfillment of the Limit States considering the redistribution of stress. This analysis is intended to establish a conservative estimate of the deformation and resistance capacity of the building when it is subjected to high-intensity seismic demands. A study has been developed to analyze the estimation of the elevation deformations for a first complex shear wall (see Figure 8) whose deformations for the DE and the MCE to determine the local performance are shown in Figure 9. Likewise, shows a second complex shear wall (Figure 10) whose deformations for the DE and MCE are shown in Figure 11.

6.2.1. Standard Shear-Wall Section with Unfavorable Complex Sectional Asymmetry in X Direction

This shear-wall system (see Figure 8) has been chosen for the study of strains in elevation (see Figure 9), because it includes the shear-wall that first initiates yielding in the X direction, corresponding to the longest shear-wall in that direction. It is verified that, in the Y direction, the shear-wall perfectly complies with the performance criteria (strain limits) established in the Achisina document for both levels of seismic demand. On the other hand, for the +X direction, given the design demand, the structure shows damage at the Fiber Point 1 on the first floor, where the concrete strain exceeds the value of 1.5%. Therefore, it would be necessary to study this section, which is the most unfavorable in structural design, since at high levels of deformation, its failure mode is controlled by compression. Enhancing the shear wall thickness to augment the level of confinement within the section would significantly improve performance. Nevertheless, this section was subjected to an analysis via the SAP2000 software, to find out the ultimate curvature expressed in the moment-curvature diagram, based on Mander’s confined concrete behavior, as dictated by conventional design practice. It is concluded that it correctly complies with the displacement-based design established in Supreme Decree No. 60 [9] for a roof drift demand of 8.2‰ in +X. This is not consistent with what was reported in the nonlinear structural analysis, since in the +X direction the shear-wall reaches the value of εc = 8‰ for a roof drift of 5.2‰ (that is, the nonlinear coupled behavior infers less deformation capacity). In the Y direction, it is observed that the steel shows adequate performance, since it does not generate an anticipated failure due to compression, allowing deformation capacity and ductility. Regarding ductility, the results obtained from the analysis in the X direction yield values of 3.75 and 2.96 in Y direction.

6.2.2. Section with Unfavorable Complex Sectional Asymmetry in Y Direction

The longest shear-wall system in the Y direction (see Figure 10) allows for a stress analysis (see Figure 11) that shows that in the X direction for the DE level, the most unfavorable region is located at point P3 (subjected to traction), precisely in the longest shear-wall of the system under study. For this complex shear-wall, the 3% tension limit of the steel is exceeded, therefore it would be necessary to confine this area with ties and stirrups with a maximum separation of 6 times ϕ of the longitudinal rebar to avoid buckling from lateral instability of the rebars in the reversal of the load [76]. Despite this observation, the shear-wall system does not exceed the limit values of unconfined concrete for the DE demand level at any of its ends and in any of its directions. Under an MCE demand level, the structure faces a higher demand in the X direction, and the deformation limits of 5% in the steel and of 1.5% in the confined concrete are exceeded. On the other hand, in the Y direction, these limits are not exceeded. It is observed that the strains for the P5 point reach their maximum on the third story, therefore it would be necessary to confine this shear-wall region up to the 3rd story, since after the 4th story they drastically decrease in elevation. For the MCE demand level, in the X direction, a compression failure is observed when the steel exceeds the limit of 5%, that is, when the steel reaches its maximum structural performance. In any case, it is essential to maintain control of the shear capacity of the walls [77].
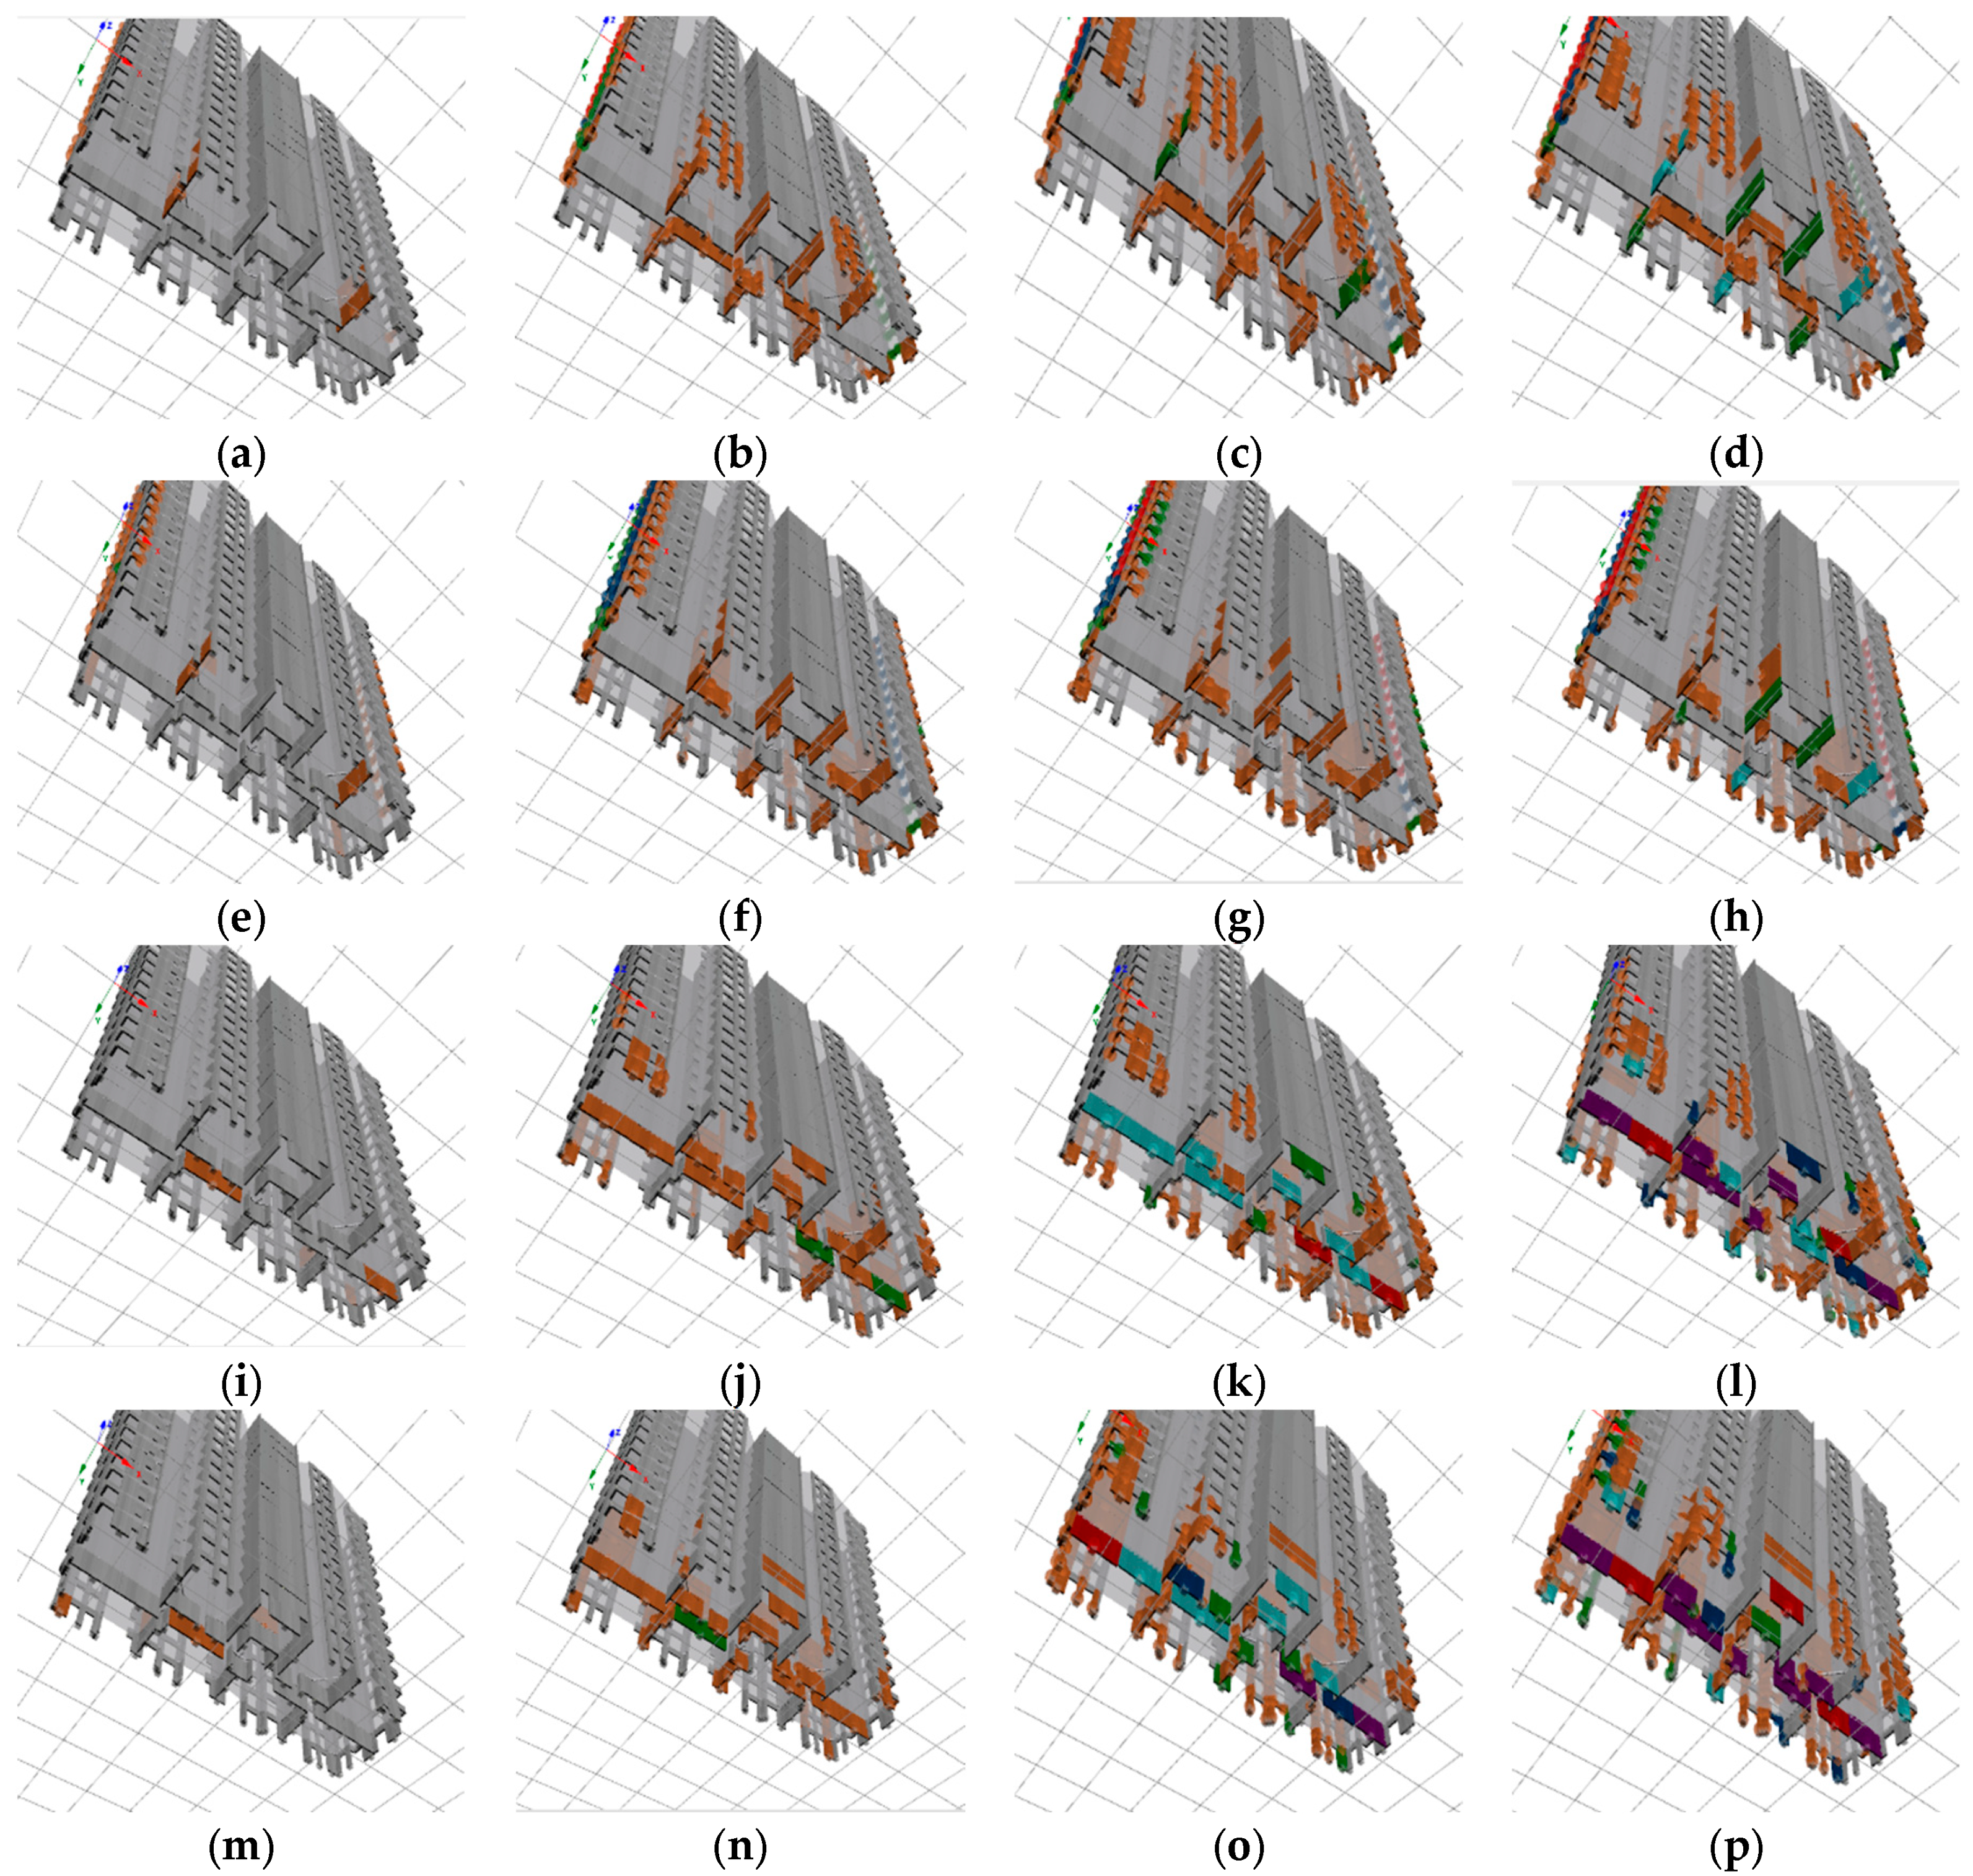
Figure 12 illustrates the progression of damage states in the complex shear walls of the studied building as pushover analysis is conducted in both X and Y directions, and in both positive and negative signs, across various displacement levels of the roof’s center of gravity. Note that for buildings with complex shear walls, in which there is no symmetry or structural regularity, it is very necessary that the analysis considers the two signs (+ and −) since these produce different states of damage to the complex shear walls. Figure 12 presents the evolution of the damage produced in each analysis, each line represents an analysis, with the global drifts increasing from left to right. Table 2 provides a summary of the different acceptance criteria graphed in Figure 12.

7. Conclusions

This investigation has assessed the seismic performance of reinforced concrete (RC) structures with shear walls using a nonlinear analysis approach under the performance-based approach. It has been determined that, in the most unfavorable direction (X-axis), the structure achieves a life safety performance level, exhibiting damages to certain structural components. This finding is consistent with the seismic demand criteria established in the current Chilean regulations. However, it is crucial to highlight the inherent uncertainties in nonlinear modeling and seismic record selection, suggesting a need for more detailed and comprehensive analysis to refine these estimates.
The study of the damage mechanism upon reaching Limit States reveals that rigorous confinement of shear wall ends is essential to improve their deformation capacity, especially in configurations with complex asymmetry. This underscores the importance of considering design recommendations beyond the current minimum requirements, pointing towards a design practice that fully integrates advances in understanding the inelastic behavior of structures under seismic demand.
In terms of practical recommendations, the need to increase the density of shear walls in asymmetric directions to reduce seismic demand and improve structural performance is emphasized. This strategy is proposed as an effective measure to limit structural damage and facilitate immediate occupancy levels after seismic events, as has been observed in Chilean buildings with RC shear walls. Similarly, it is recommended that design engineers pay special attention to the shear demands imposed on the building’s shear walls.
The comparison of nonlinear modeling methods has shown that, while the concentrated hinge model may overestimate the resistant capacity, detailed analysis of ultimate deformation offers a pathway to predict structural collapse. Nonetheless, both nonlinear static and dynamic analyses are recognized to have limitations, and there is an advocacy for the development of more efficient and accurate methodologies for seismic performance evaluation. In the event of conducting dynamic time-history analyses, it is recommended to consult literature related to the selection of records, with the aim of reducing the computational cost of the analyses [78,79].
Finally, the importance of advancing research and development of seismic regulations in Chile is underscored, considering both code improvements and the uncertainties associated with current analysis methods. This will not only allow a deeper understanding of seismic behavior of structures but also facilitate the design of safer and more resilient buildings against the seismic challenges of the region.

Author Contributions

Conceptualization, J.C. and J.C.V.; methodology, R.A. and J.C.V.; software, R.A.; validation, R.A., J.C. and J.C.V.; formal analysis, R.A.; investigation, R.A.; resources, R.A. and J.C.; data curation, J.C.V.; writing—original draft preparation, R.A.; writing—review and editing, R.A., J.C. and J.C.V.; visualization, J.C.V.; supervision, J.C. and J.C.V. All authors have read and agreed to the published version of the manuscript.

Funding

This research was funded by Agencia Nacional de Investigación y Desarrollo (ANID Chile), grant number FOVI 210063.

Data Availability Statement

The relevant data from this research are available in the authors’ repositories.

Acknowledgments

The authors thank the Pontificia Universidad Católica de Valparaíso for the support provided in the development of the research, as well as the support in the publication of the article. The authors also acknowledge the support of the PUCV School of Civil Engineering in whose facilities the research activities that gave rise to this article have been carried out.

Conflicts of Interest

The authors declare no conflict of interest.

References

  1. DeMets, C.; Gordon, R.G.; Argus, D.F.; Stein, S. Current plate motions. Geophys. J. Int. 1990, 101, 425–478. [Google Scholar] [CrossRef]
  2. Ruiz, S.; Saragoni, R. Attenuation formulas for the Chilean subduction considering the two mechanisms of seismogenesis and ground effects. In Proceedings of the Chilean Congress of Seismology and Earthquake Engineering, Concepción, Chile, 16–19 November 2005. [Google Scholar]
  3. Lagos, R.; Lafontaine, M.; Bonelli, P.; Boroschek, R.; Guendelman, T.; Massone, L.; Saragoni, R.; Rojas, F.; Yañez, F. The quest for resilience: The Chilean practice of seismic design for R.C. buildings. Earthq. Spectra 2021, 37, 26–45. [Google Scholar] [CrossRef]
  4. Tellen, K.; Maffei, J.; Willford, M.; Aviram, A.; Huang, Y.; Kelly, D.; Bonelli, P. Lessons for concrete wall design from the 2010 Maule Chile earthquake. In Proceedings of the International Symposium on Engineering Lessons Learned from the 2011 Great East Japan Earthquake, Tokyo, Japan, 1–4 March 2012. [Google Scholar]
  5. Massone, L.; Bonelli, P.; Lagos, R.; Lüders, C.; Mohle, J.; Wallace, J.W. Seismic design and construction practices for RC structural wall buildings. Earthq. Spectra 2012, 28, 245–256. [Google Scholar] [CrossRef]
  6. Suquillo, B.; Rojas, F.; Massone, L. Study of the seismic performance of a RC building with damage during the Mw 8,8 earthquake in 2010. In Proceedings of the 16th European Conference on Earthquake Engineering, Thessaloniki, Greece, 18–19 June 2018. [Google Scholar]
  7. Carvallo, J.; Alcaíno, P. Behavior of R.C. Buildings in Viña del Mar. Lessons of 27 February 2010 Earthquake. In Proceedings of the 15th World Conference on Earthquake Engineering 2012, Lisboa, Portugal, 24–28 September 2012. [Google Scholar]
  8. MINVU. D.S. 60; Regulation that Establishes Design and Calculation Requirements for R.C. and Repeals Supreme Decree N°188 of 2010. Ministry of Housing and Urbanism: Santiago, Chile, 2011. (In Spanish)
  9. MINVU. D.S. 61; Regulation that Establishes the Seismic Design of Buildings and Repeals Decree 117. Ministry of Housing and Urbanism: Santiago, Chile, 2011. (In Spanish)
  10. Miao, Z.; Ye, L.; Guan, H.; Lu, X. Evaluation of modal and traditional pushover analyses in frame-shear-wall structures. Adv. Struct. Eng. 2011, 14, 815–836. [Google Scholar] [CrossRef]
  11. Maniatakis, C.A.; Psycharis, I.N.; Spyrakos, C.C. Effect of higher modes on the seismic response and design of moment-resisting RC frame structures. Eng. Struct. 2013, 56, 417–430. [Google Scholar] [CrossRef]
  12. Fatemi, H.; Paultre, P.; Lamarche, C.-P. Experimental Evaluation of Inelastic Higher-Mode Effects on the Seismic Behavior of RC Structural Walls. J. Struct. Eng. 2020, 146, 04020016. [Google Scholar] [CrossRef]
  13. Repapis, C.; Zeris, C.; Vintzileou, E. Evaluation of the seismic performance of existing RC buildings: II. A case study for regular and irregular buildings. J. Earthq. Eng. 2006, 10, 429–452. [Google Scholar] [CrossRef]
  14. Anagnostopoulos, S.A.; Kyrkos, M.T.; Papalymperi, A.; Plevri, E. Should accidental eccentricity be eliminated from Eurocode 8? Earthq. Struct. 2015, 8, 463–484. [Google Scholar] [CrossRef]
  15. Caruso, C.; Bento, R.; Marino, E.M.; Castro, J.M. Relevance of torsional effects on the seismic assessment of an old RC frame-wall building in Lisbon. J. Build. Eng. 2018, 19, 459–471. [Google Scholar] [CrossRef]
  16. Ruggieri, S.; Vukobratović, V. Acceleration demands in single-storey RC buildings with flexible diaphragms. Eng. Struct. 2023, 275, 115276. [Google Scholar] [CrossRef]
  17. Lee, H.J.; Aschheim, M.A.; Kuchma, D. Interstory drift estimates for low-rise flexible diaphragm structures. Eng. Struct. 2007, 29, 1375–1397. [Google Scholar] [CrossRef]
  18. Ruggieri, S.; Porco, F.; Uva, G. A numerical procedure for modeling the floor deformability in seismic analysis of existing RC buildings. J. Build. Eng. 2018, 19, 273–284. [Google Scholar] [CrossRef]
  19. ACHISINA. Performance-Based Seismic Design, an Alternative Procedure for Seismic Design Analysis of Buildings; ACHISINA: Santiago, Chile, 2017. (In Spanish) [Google Scholar]
  20. American Society of Civil Engineers. Minimum Design Loads for Buildings and other Structures; American Society of Civil Engineers: Reston, VA, USA, 2010. [Google Scholar]
  21. MINVU. Chilean Standard Nch433, Seismic Design of Buildings; MINVU: Santiago, Chile, 1996.
  22. Vielma, J.C.; Barbat, A.H.; Oller, S. Seismic performance of buildings with waffled-slab floors. ICE Proc. Struct. Build. 2009, 162, 169–182. [Google Scholar] [CrossRef]
  23. Lagos, R.; Kupfer, M.; Lindenberg, J.; Bonelli, P.; Saragoni, P.; Guendelman, T.; Massone, L.; Boroschek, R.; Yañez, F. Seismic Performance of High-rise Concrete Buildings in Chile. Int. J. High-Rise Build. 2012, 1, 181–194. [Google Scholar]
  24. Vielma-Quintero, J.C.; Carvallo, J.Y.; Vielma, J.C. Comparative assessment of performance-based design methodologies applied to a R.C. shear-wall building. Buildings 2023, 13, 1492. [Google Scholar] [CrossRef]
  25. Bertero, V. Lessons learned from recent catastrophic earthquakes and associated research. In Proceedings of the First International Conference, Torroja, Madrid, Spain, 23 May–29 June 1989. [Google Scholar]
  26. Porcu, M.C.; Vielma, J.C.; Pais, G.; Osorio, D.; Vielma-Quintero, J.C. Some issues on the seismic assessment of shear-wall buildings through code-compliant dynamic analyses. Buildings 2022, 12, 694. [Google Scholar] [CrossRef]
  27. Cook, D.; Sen, A.; Liel, A.; Basnet, T.; Creagh, A.; Koodiani, H.K.; Berkowitz, R.; Ghannoum, W.; Hortacsu, A.; Kim, I.; et al. ASCE/SEI 41 assessment of R.C. buildings: Benchmarking nonlinear dynamic procedures with empirical damage observations. Earthq. Spectra 2023, 39, 1721–1754. [Google Scholar] [CrossRef]
  28. Kolozvari, K.; Terzic, V.; Miller, R.; Saldana, D. Assessment of dynamic behavior and seismic performance of a high-rise rc coupled wall building. Eng. Struct. 2018, 176, 606–620. [Google Scholar] [CrossRef]
  29. Georgoussis, G.K. Yield Displacements of Wall-Frame Concrete Structures and Seismic Design Based on Code Performance Objectives. J. Earthq. Eng. 2021, 25, 566–578. [Google Scholar] [CrossRef]
  30. Plaza, R.; Massone, L. Non-Linear, Two-Dimensional and Three-Dimensional Modeling of a R.C. Building; Report of Bachelor in Civil Engineer; University of Chile: Santiago, Chile, 2017. [Google Scholar]
  31. Montoya-Coronado, L.A.; Biondini, F.; Titi, A.; Bairán, J.M. Effect of high modes of vibration on the nonlinear seismic response of concrete buildings. In Proceedings of the 2nd Nicaraguan Congress of Earthquake Engineering, Managua, Nicaragua, 16–17 November 2017. [Google Scholar]
  32. Massone, L.; Bass, E. Dynamic shear amplification of R.C. coupled walls. Eng. Struct. 2020, 220, 110867. [Google Scholar] [CrossRef]
  33. Lopez, S.; Ayala, G.A. Método de diseño sísmico basado en desplazamientos para marcos de concreto reforzado. Ing. Sísmica 2013, 88, 91–111. [Google Scholar] [CrossRef]
  34. Sommer, A.; Bachmann, H. Seismic behavior of asymmetric RC wall buildings: Principles and new deformation-based design method. Earthq. Eng. Struct. Dyn. 2005, 34, 101–124. [Google Scholar] [CrossRef]
  35. Sattar, S.; Hulsey, A.; Hagen, G.; Naeim, F.; McCabe, S. Implementing the performance-based seismic design for new R.C. structures: Comparison among ASCE/SEI 41, TBI, and LATBSDC. Earthq. Spectra 2021, 37, 2150–2173. [Google Scholar] [CrossRef]
  36. Vielma, J.C.; Barbat, A.H.; Oller, Y.S. Seismic safety of low ductility structures used in Spain. Bull. Earthq. Eng. 2010, 8, 135–155. [Google Scholar] [CrossRef]
  37. Khelaifia, A.; Chebili, R.; Zine, Y.A. Impact of the position and quantity of shear walls in buildings on the seismic performance. Asian J. Civ. Eng. 2023, 25, 953–964. [Google Scholar] [CrossRef]
  38. Piqué, J. Design for Capacity: A New Zealand Seismic Resistant Design Strategy. Civ. Eng. J. 2004. (In Spanish) [Google Scholar]
  39. Aeleti, S.; Dai, H.; Sritharan, S. Ductile design of slender R.C. structural walls. In Proceedings of the Tenth U.S. National Conference on Earthquake Engineering Frontiers of Earthquake Engineering, Anchorage, AK, USA, 21–25 July 2014. [Google Scholar]
  40. Paulay, T.; Priestley, M.J.N. Seismic Design of R.C. and Masonry Buildings, 1st ed.; John Wiley and Sons, Inc.: Hoboken, NJ, USA, 1992; pp. 40–42. [Google Scholar]
  41. Abdullah, S.A.; Wallace, W. Reliability-Based Design Methodology for R.C. Structural Walls with Special Boundary Elements. ACI Struct. J. 2020, 117, 3. [Google Scholar] [CrossRef]
  42. Hagen, G.R. Performance-Based Analysis of a R.C. Shear Wall Building. Master’s Thesis, California Polytechnic State University, San Luis Obispo, CA, USA, 2012. [Google Scholar] [CrossRef]
  43. Klemencic, R.; Fry, J.A.; Hooper, J.D.; Morgen, B.G. Performance-based design of ductile concrete core wall buildings—Issues to consider before detailed analysis. Struct. Des. Tall Spec. Build. 2007, 16, 599–614. [Google Scholar] [CrossRef]
  44. SEAOC Vision Committee. Performance Based Seismic Engineering of Buildings; SEAOC Vision Committee: Sacramento, CA, USA, 2008. [Google Scholar]
  45. Lafontaine, M. Performance-based design of buildings. In Proceedings of the Nch433 Update Project Webinar, Santiago, Chile, 29 July 2020. [Google Scholar]
  46. Lee, S.; Gupta, A.; Proestos, G.T. Performance-Based Characterization and Quantification of Uncertainty in Damage Plasticity Model for Seismic Fragility Assessment of Concrete Structures. ASCE-ASME J. Risk Uncertain. Eng. Syst. Part A Civ. Eng. 2023, 9, 1. [Google Scholar] [CrossRef]
  47. Cirak Karakas, C.; Palanci, M.; Senel, S.M. Fragility based evaluation of different code based assessment approaches for the performance estimation of existing buildings. Bull. Earthq. Eng. 2022, 20, 1685–1716. [Google Scholar] [CrossRef]
  48. Terzic, V.; Villanueva, P.K.; Saldana, D.; Yoo, D.Y. Framework for modelling post-earthquake functional recovery of buildings. Eng. Struct. 2021, 246, 113074. [Google Scholar] [CrossRef]
  49. Hosseinzadeh, S.; Galal, K. Probabilistic seismic resilience quantification of a reinforced masonry shear wall system with boundary elements under bi-directional horizontal excitations. Eng. Struct. 2021, 247, 113023. [Google Scholar] [CrossRef]
  50. Joyner, M.D.; Gardner, C.; Puentes, B.; Sasani, M. Resilience-Based seismic design of buildings through multiobjective optimization. Eng. Struct. 2021, 246, 113024. [Google Scholar] [CrossRef]
  51. Samadian, D.; Ghafory-Ashtiany, M.; Naderpour, H.; Eghbali, M. Seismic resilience evaluation based on vulnerability curves for existing and retrofitted typical RC school buildings. Soil Dyn. Earthq. Eng. 2019, 127, 105844. [Google Scholar] [CrossRef]
  52. Forcellini, D. An expeditious framework for assessing the seismic resilience (SR) of structural configurations. Structures 2023, 56, 105015. [Google Scholar] [CrossRef]
  53. Zhou, Z.; Han, M.; Yu, X. State-dependent aftershock resilience analysis of reinforced concrete structures considering the effect of corrosion. J. Build. Eng. 2023, 80, 108107. [Google Scholar] [CrossRef]
  54. Afrin, T.; Yodo, N. Resilience-based recovery assessments of networked infrastructure systems under localized attacks. Infrastructures 2019, 4, 11. [Google Scholar] [CrossRef]
  55. Aghababaei, M.; Mahsuli, M. Component damage models for detailed seismic risk analysis using structural reliability methods. Struct. Saf. 2019, 76, 108–122. [Google Scholar] [CrossRef]
  56. Akiyama, M.; Frangopol, D.M.; Ishibashi, H. Toward life-cycle reliability-, risk-and resilience-based design and assessment of bridges and bridge networks under independent and interacting hazards: Emphasis on earthquake, tsunami, and corrosion. Struct. Infrastruct. Eng. 2020, 16, 26–50. [Google Scholar] [CrossRef]
  57. Bruneau, M.; Reinhorn, A. Exploring the concept of seismic resilience for acute care facilities. Earthq. Spectra 2007, 23, 41–62. [Google Scholar] [CrossRef]
  58. Cerè, G.; Rezgui, Y.; Zhao, W. Critical review of existing built environment resilience frameworks: Directions for future research. Int. J. Disaster Risk Reduct. 2017, 25, 173–189. [Google Scholar] [CrossRef]
  59. Hashemi, M.J.; Al-Attraqchi, A.Y.; Kalfat, R.; Al-Mahaidi, R. Linking seismic resilience into sustainability assessment of limited-ductility RC buildings. Eng. Struct. 2019, 188, 121–136. [Google Scholar] [CrossRef]
  60. Huan, C.L.; Li, Y.F.; Lin, C.T.; Hsu, T.H. Analytical and pushover analysis for predicting nonlinear force- displacement relationships of slender RC walls. J. Chin. Inst. Eng. 2011, 34, 415–428. [Google Scholar] [CrossRef]
  61. Wang, B.; Wu, M.-Z.; Shi, Q.-X.; Cai, W.-Z. Seismic performance of flanged RC walls under biaxial cyclic loading. J. Build. Eng. 2023, 64, 105632. [Google Scholar] [CrossRef]
  62. Ju, B.-S.; Kwag, S.; Lee, S. Performance-based drift prediction of R.C. shear wall using bagging ensemble method. Nucl. Eng. Technol. 2023, 55, 2747–2756. [Google Scholar] [CrossRef]
  63. Abate, M.; Evangelista, A.C.J.; Tam, V.W.Y. Comparative Response Spectrum Analysis on 15- and 50-Story R.C. Buildings Having Shear Walls with and without Openings as per EN1998-1 Seismic Code. Buildings 2023, 13, 1303. [Google Scholar] [CrossRef]
  64. Seismosoft. SeismoStruct 2020, a Computer Program for Static and Dynamic Nonlinear Analysis of Framed Structures (V2020); Seismosoft: Pavia, Italy, 2020. [Google Scholar]
  65. ACI. 318-08; Building Code Requirements for Structural Concrete and Commentary. American Concrete Institute: Farmington Hills, MI, USA, 2008.
  66. ASCE/SEI 41-17; Seismic Evaluation and Retrofit of Existing Buildings. American Society of Civil Engineers: Reston, VA, USA, 2017.
  67. Gomez, M.A.; Díaz-Segura, E.G.; Vielma, J.C. Nonlinear numerical assessment of the seismic response of hillside RC buildings. Earthq. Eng. Eng. Vib. 2021, 20, 423–440. [Google Scholar] [CrossRef]
  68. Mander, J.B.; Priestley, N.; Park, R. Theoretical stress-strain model for confined concrete. J. Struct. Eng. 1988, 114, 1804–1826. [Google Scholar] [CrossRef]
  69. Menegotto, M.; Pinto, P.E. Method of analysis for cyclically loaded RC plane frames including changes in geometry and non-elastic behavior of elements under combined normal force and bending. In Proceedings of the Symposium on the Resistance and Ultimate Deformability of Structures Acted on by Well-Defined Repeated Loads, International Association for Bridge and Structural Engineering, Zurich, Switzerland, 13–14 September 1973. [Google Scholar]
  70. Park, R. Ductility evaluation from laboratory and analytical testing. In Proceedings of the Ninth World Conference Earthquake Engineering, Tokyo-Kyoto, Japan, 2–9 August 1988. [Google Scholar]
  71. Fajfar, P.; Gaspersic, P. The N2 method for the seismic damage analysis of RC buildings. Earthq. Eng. Struct. Dyn. 1996, 25, 31–36. [Google Scholar] [CrossRef]
  72. Dautaj, A.; Sadiku, H.; Kabishi, N. Method N2—According to Farjfar. Int. J. Civ. Struct. Eng.–IJCSE 2015, 2, 363–369. [Google Scholar]
  73. Bárcena, A.; Esteva, L. Influence of dynamic soil–structure interaction on the nonlinear response and seismic reliability of multistorey systems. Earthq. Engng. Struct. Dyn. 2007, 36, 327–346. [Google Scholar] [CrossRef]
  74. Forcellini, D. Seismic fragility of tall buildings considering soil structure interaction (SSI) effects. Structures 2022, 45, 999–1011. [Google Scholar] [CrossRef]
  75. Vielma, J.C.; Porcu, M.C.; López, N. Intensity measure based on a smooth inelastic peak period for a more effective Incremental Dynamic Analysis. Appl. Sci. 2020, 10, 8632. [Google Scholar] [CrossRef]
  76. Thomsen, J.H.; Wallace, J.W. Displacement-Based Design of Slender R.C. Structural Walls-Experimental Verification. J. Struct. Eng. 2004, 130, 618–630. [Google Scholar] [CrossRef]
  77. Palanci, M.; Kalkan, A.; Senel, S.M. Investigation of shear effects on the capacity and demand estimation of RC buildings. Struct. Eng. Mech. 2016, 60, 1021–1038. [Google Scholar] [CrossRef]
  78. Kayhan, A.H.; Demir, A.; Palanci, M. Multi-functional solution model for spectrum compatible ground motion record selection using stochastic harmony search algorithm. Bull. Earthq. Eng. 2022, 20, 6407–6440. [Google Scholar] [CrossRef]
  79. Demir, A.; Kayhan, A.H.; Palanci, M. Response- and probability-based evaluation of spectrally matched ground motion selection strategies for bi-directional dynamic analysis of low- to mid-rise RC buildings. Structures 2023, 58, 105533. [Google Scholar] [CrossRef]
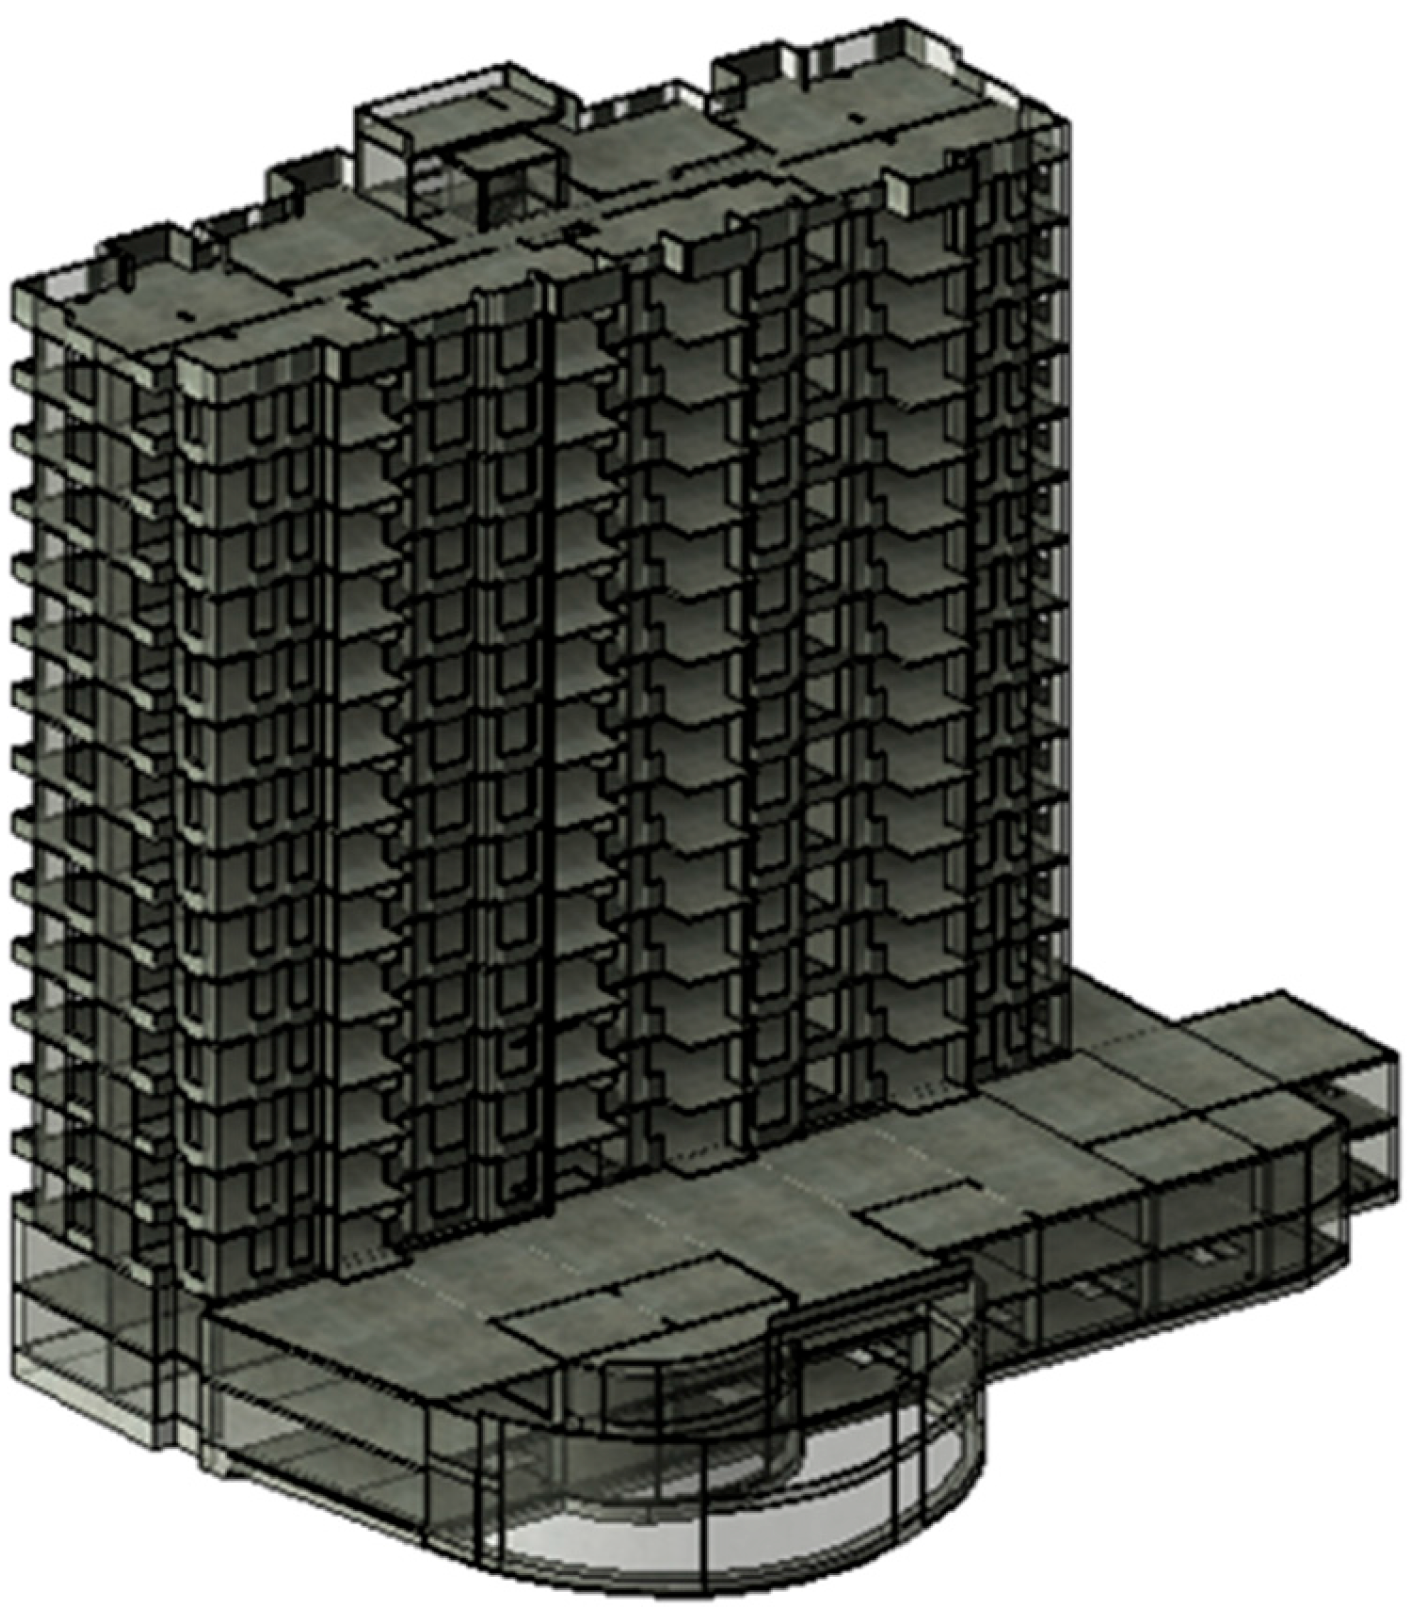
Figure 1. Isometric view of the studied building.
Buildings 14 00761 g001
Figure 2. Typical structural plan view of the building.
Buildings 14 00761 g002
Figure 3. Graphic determination of the performance point, N2 Method.
Buildings 14 00761 g003
Figure 4. Pushover analysis using M1 Model in (a) X direction, and in (b)Y direction.
Buildings 14 00761 g004
Figure 5. Pushover analysis using M2 Model in (a) X direction, and in (b) Y direction.
Buildings 14 00761 g005aBuildings 14 00761 g005b
Figure 6. Capacity curves with the demands imposed by DE (green dashed line) and MCE (orange dashed line) in (a) X direction and (b) Y direction.
Buildings 14 00761 g006
Figure 7. Interstory drifts for DE and MCE computed in (a) X direction and (b) Y direction.
Buildings 14 00761 g007
Figure 8. Shear-wall with unfavorable complex sectional asymmetry in X direction.
Buildings 14 00761 g008
Figure 9. Stress analysis of unfavorable complex asymmetric section in X direction. (a) Analysis for DE in Y+ direction, (b) Analysis for MCE in Y+ direction, (c) Analysis for DE in X+ direction, (d) Analysis for MCE in X+ direction. In this figure, the solid red line represents the strain limit of the reinforcing steel, the red long-dashed line represents the strain limit of confined concrete, while the red short-dashed line represents the strain limit of unconfined concrete.
Buildings 14 00761 g009
Figure 10. Shear-wall with unfavorable complex sectional asymmetry in Y direction.
Buildings 14 00761 g010
Figure 11. Stress analysis of a complex asymmetric section showed in Figure 10. (a) Analysis for DE in Y+ direction, (b) Analysis for MCE in Y+ direction, (c) Analysis for DE in X+ direction, (d) Analysis for MCE in X direction. In this figure, the solid red line represents the strain limit of the reinforcing steel, the red long-dashed line represents the strain limit of confined concrete, while the red short-dashed line represents the strain limit of unconfined concrete.
Buildings 14 00761 g011aBuildings 14 00761 g011b
Figure 12. Damage progression mechanism for different levels of global drift. (a) 0.002 in Y+, (b) 0.005 in Y+, (c) 0.006 in Y+, (d) 0.0068 in Y+, (e) 0.002 in Y−, (f) 0.005 in Y−, (g) 0.006 in Y−, (h) 0.0068 in Y−, (i) 0.002 in X+, (j) 0.005 in X+, (k) 0.0066 in X+, (l) 0.0092 in X+, (m) 0.002 in X−, (n) 0.005 in X−, (o) 0.0066 in X−, (p) 0.0092 in X−. Table 2 shows the meaning of each color in the limit state progression model.
Buildings 14 00761 g012
Table 1. Characteristics of the studied building.
CharacteristicsValue
Standard floor plan area509.83 m2
Area of walls on X-axis15.04 m2
Area of walls on Y-axis12.78 m2
Density of walls on X-axis2.9%
Density of walls on Y-axis2.5%
No. of floors14
Height from ground floor39.4 m
Table 2. Acceptance criteria for Achisina Limit States.
Acceptance CriteriaLimit StateColor
Concrete unit deformation/Unconfined concrete εc = 0.003Immediate occupancyBuildings 14 00761 i001
Concrete unit deformation/Confined concrete εc = 0.008Immediate occupancyBuildings 14 00761 i002
Concrete unit deformation/Confined concrete εc = 0.015Collapse preventionBuildings 14 00761 i003
Steel unit deformation/Initial yield of Steel εs = 0.002 Immediate occupancyBuildings 14 00761 i004
Steel unit deformation/Longitudinal bar buckling εs = 0.03Immediate occupancyBuildings 14 00761 i005
Steel unit deformation/Steel Longitudinal fracture εs = 0.05Collapse preventionBuildings 14 00761 i006
Disclaimer/Publisher’s Note: The statements, opinions and data contained in all publications are solely those of the individual author(s) and contributor(s) and not of MDPI and/or the editor(s). MDPI and/or the editor(s) disclaim responsibility for any injury to people or property resulting from any ideas, methods, instructions or products referred to in the content.