
Development of a Low-Density Waste-Based Geopolymer Construction Material


Department of Chemical Engineering Technology, Faculty of Engineering and the Built Environment, Doornfontein Campus, University of Johannesburg, Johannesburg 2028, South Africa
*
Author to whom correspondence should be addressed.
Buildings 2024, 14(3), 684; https://doi.org/10.3390/buildings14030684
Submission received: 26 January 2024
/
Revised: 16 February 2024
/
Accepted: 22 February 2024
/
Published: 5 March 2024
(This article belongs to the Section Building Energy, Physics, Environment, and Systems)
Abstract
:The construction industry, integral to national infrastructure development, faces environmental challenges attributed to Portland cement’s high energy consumption and carbon dioxide emissions during production. To address this challenge, this study integrated waste fly ash and polystyrene into geopolymers to enhance environmental sustainability and economic feasibility. The objectives included developing low-density geopolymers using polystyrene inclusion, optimizing component mixing ratios, assessing activator concentration effects, determining the optimal curing conditions, and characterizing the resulting geopolymers. Through experimental investigation, low-density geopolymers were developed with optimized component ratios and curing conditions. The experimental procedure began with the classification of fly ash to determine its suitability for various applications, revealing it to be type F. Geopolymers were fabricated using a mixture of fly ash, water, sodium hydroxide activator, and polystyrene. Varied concentrations of sodium hydroxide and polystyrene were employed. Two curing temperatures, 60 °C and 100 °C, were explored. The results showed that greater sodium hydroxide concentrations improved the structure and compressive strength of the geopolymers. The results also demonstrated a significant correlation between the curing conditions and the mechanical properties of the produced geopolymers. The goal of reducing the density of the geopolymers for lightweight thermal-resistant applications was achieved through polystyrene incorporation. However, polystyrene incorporation negatively impacted the compressive strength. The optimum production conditions for the sodium hydroxide-varied samples were 8 g sodium hydroxide/g sample cured at 100 °C, while the optimum production conditions for polystyrene-varied samples were 1 g polystyrene/g sample cured at 60 °C. The findings confirmed the viability of utilizing fly ash and polystyrene wastes to produce sustainable, low-density, thermal-resistant construction materials. Overall, increasing activator concentration enhances the strength and durability of geopolymers, while polystyrene contributes to the development of lightweight geopolymers, provided the appropriate amount is utilized. To ensure replicability, the formulation procedure and input quantities must be tailored according to the intended geopolymer application. These insights offer practical guidance for optimizing geopolymer manufacturing processes towards enhanced sustainability and performance.
1. Introduction
1.1. Background, Aims, and Contributions
The global construction industry plays a vital role in infrastructure development, technological advancement, and socio-economic growth. However, despite these contributions, the traditional reliance on Portland cement as a primary construction material has increasingly raised environmental concerns [1]. The carbon footprint and high energy demands of cement production have emerged as significant issues, prompting the industry to seek more sustainable alternatives [2]. Conventional cement manufacturing contributes significantly to problems such as air pollution, high energy consumption, and climate change. Eco-friendly solutions are needed to address the growing issue of excessive waste generation and the detrimental effects of its inappropriate disposal due to the serious environmental threat posed by the exponential increase in waste. This study seeks to address these issues by advocating for waste-based construction materials, effectively reducing landfilled waste, and reducing the overall carbon footprint. In response to the growing demands for eco-friendly solutions, geopolymer construction materials have come to the forefront. This study highlights the urgency of transitioning towards more sustainable construction materials and demonstrates the role of waste-based geopolymers in this vital shift. As promising green alternatives to traditional cement-based construction materials, waste-based geopolymers can reduce carbon emissions, energy consumption, and waste generation [3], all of which are pressing concerns in many industries.
Hence, the study objectives include developing a low-density geopolymer through the incorporation of polystyrene and fly ash waste, determining the ideal component mixing ratio of the geopolymer, assessing the effect of activator concentration on the geopolymers’ mechanical properties, determining the optimum curing conditions, and characterizing the geopolymer samples. The primary goal of this study is to develop low-density geopolymers with improved environmental and economic benefits through the incorporation of waste fly ash and polystyrene. By utilizing leftover fly ash and polystyrene, the study seeks to create eco-friendly geopolymers that can replace Portland cement while reducing waste and carbon emissions. The study aims to improve the mechanical characteristics of the produced geopolymers by optimizing the mix ratios and curing conditions, thus promoting sustainable practices in the construction industry.
Aligned with the aims and objectives, the study addresses four scientific questions related to the development and characterization of waste-based geopolymers:
- How can waste fly ash and polystyrene be effectively incorporated into geopolymers to enhance their environmental and economic benefits?
- What are the optimal mix ratios and activator concentrations that result in low-density geopolymers with desirable mechanical properties?
- How do variations in curing conditions, such as temperature, impact the structure and performance of waste-based geopolymers?
- What are the key characteristics and properties of the developed geopolymers?
Regarding its contribution to the engineering community, this study innovatively addresses environmental challenges in construction by repurposing waste fly ash and polystyrene. By optimizing mix ratios and curing conditions, guidance is provided for developing waste-based geopolymers, fostering sustainable construction applications. Overall, the study’s findings advance sustainable practices in construction and contribute to the broader field of environmental engineering.
Overall, this study introduces a novel approach to sustainable construction by utilizing waste fly ash and polystyrene to produce low-density geopolymers for potential thermal resistance applications, addressing environmental concerns and offering economic benefits through repurposed materials. It is argued that incorporating materials such as polystyrene can lead to the creation of lightweight, thermally efficient geopolymer materials.
1.2. Literature Review
A review of the relevant literature is shown below.
1.2.1. Global Perspectives
Global economic and social transformation is accelerated by several variables, including urbanization, industrialization, and economic globalization. Environmental pollution and population expansion fuel this transformation. These aspects cause global warming and climate change, posing serious risks to humanity [4]. Extreme weather, an increase in wildfires, habitat degradation, and communicable illnesses are some of the problems caused by these transformations [5].
Another global problem is the production and disposal of enormous amounts of waste [6]. If waste generation rises as predicted, every entity will continue to face disposal challenges. This problem necessitates creative ways to efficiently dispose of solid waste. Most landfills lack suitable waste management systems, increasing environmental concerns [6]. With the daily global output of municipal solid waste predicted to increase by 74% in 2025, its management is evolving into one of the most urgent environmental challenges [7]. The ideal way of dealing with municipal solid waste is to utilize it to produce “green” products [6].
When a product’s environmental and social performance from manufacturing to disposal is better than that of traditional items, it is regarded as “green” [8]. This concept emphasizes the various stages of a product’s life cycle in which its environmental friendliness is observed [8]. Inorganic polymers, known as geopolymers, have attracted attention as environmentally friendly substitutes for conventional cement-based materials [9]. Due to their potential to reduce the environmental effects of conventional Portland cement-based materials, geopolymers are looked upon as an emerging class of ecologically friendly construction materials. Fly ash, a byproduct of coal combustion, has undergone substantial research as a potential geopolymer precursor material [9].
1.2.2. Fly Ash
The by-product of burning pulverized coal in electricity-generating plants is called fly ash. The carbon and volatile substances are combusted when the pulverized coal is ignited in the combustion chamber [10]. Fly ash particles typically consist of tiny solid spheres. For its industrial use, primarily in the construction industry, fly ash is generally categorized into two chemical categories, Class C and Class F [11]. The fundamental difference between these classes of fly ash is the concentrations of four constituents: silica, (35–60%), calcium, CaO (1–35%), iron, (4–20%), and alumina, (10–30%) [10]. According to ASTM specifications, fly ash is categorized as Class F if the collective concentrations of alumina, silica, and iron exceed 70% and as Class C if the amounts are greater than 50% but less than 70% [11]. The fly ash color indicates its lime content. For instance, shades of black indicate a high organic content, while bright colors indicate a high calcium oxide level [12].
1.2.3. Polystyrene
Polystyrene is a synthetic polymer created from the monomers of the aromatic hydrocarbon styrene [13]. Polystyrene is an affordable resin per unit mass that is rigid and brittle, with its natural state being a solid or foam. It is one of the most extensively used plastics, produced at a rate of several million metric tons annually [14]. The prolific production rate of polystyrene commodities has led to their accumulation within waste management facilities [13]. Proposing the reutilization of polystyrene products emerges as a promising strategy to mitigate the adverse impacts of this excessive waste generation [6].
Polystyrene waste can be incorporated into geopolymers to produce lighter bricks and blocks with higher insulation properties. Styrofoam is one such material that can serve this purpose. The cavity left behind by dissipating particles during the curing process improves the thermal insulation properties of the geopolymer brick produced [15]. Therefore, polystyrene foam is used as a pore-inducing agent in the brick body to reduce thermal conductivity and density, resulting in a lighter building structure. An added advantage of lightweight bricks is reduced transportation costs. However, the low density is related to the reduced compressive strength of the geopolymer structures associated with the additional porosity of the ceramic mass [15].
1.2.4. Fly Ash/Polystyrene Geopolymers
Fly ash and polystyrene can be combined to create fly ash/polystyrene geopolymer composites, as shown in Figure 1. An alkaline solution, usually consisting of sodium hydroxide and sodium silicate, is used to activate this combination [16]. After curing, the geopolymerization step is catalyzed by the alkaline medium, resulting in a durable, environmentally friendly material. This geopolymer composite exhibits outstanding thermal insulation properties, making it suitable for a range of construction uses, such as lightweight concrete mixtures and insulating panels. To determine a material’s suitability for construction, it is typically subjected to physical, chemical, and mechanical tests [17]. By modifying the formulation and processing conditions, geopolymer characteristics can be adjusted to match certain application requirements. Numerous geopolymer studies have been conducted recently, and continuous research is expanding the applications for these materials and improving their features.
2. Material and Methods
2.1. Materials
A total of 20 kg of fly ash was sourced from the South African Lethabo power station. Polystyrene cups were sourced from the dustbins inside the University of Johannesburg’s Doornfontein campus. The cups were thoroughly cleaned and shredded using a pair of scissors. Deionized water was sourced from the Chemical Engineering Laboratory. Sodium hydroxide pellets were sourced from the Glassworld company, and the remaining material and equipment were available in the laboratory. Table 1 shows the geopolymer sample specifications. Figure 2 shows the materials used in the study, while Figure 3 shows a flow diagram outlining the study’s methodological approach. Figure 4 depicts the various stages comprising the experimental work.
2.2. Characterization
A characterization was performed to assess the suitability of the fly ash for use as a precursor in geopolymer production. Due to its composition playing a major role in the properties of geopolymers, different fly ash compositions are used to produce geopolymers for different purposes. The chemical characterization tests conducted on the fly ash included the elemental composition and loss on ignition, while the physical characterization tests included the liquid limit, plasticity index, and material finer than No. 100 sieving. The composition of Si, Al, Ca, Mg, and Fe is normally used as a basis to determine the minimum precursor suitability threshold. The particle size of fly ash also influences the properties of the resulting geopolymer. The fly ash was homogenized by stirring. Thereafter, a riffle splitter was used to form representative subsamples of 0.5 kg that were used in the following characterization tests.
2.2.1. Laser Diffraction
The particle size distribution of the fly ash was determined using a laser-diffraction particle size analyzer. The particle size analyzer shines a laser beam through a dispersed sample and measures the angles at which the light is scattered. The analysis of the angles against a known calibration curve enables the instrument to provide the particle size distribution of the sample. To determine the particle size distribution, the representative subsample was dried in an oven at 105 °C before sifting.
2.2.2. X-ray Fluorescence (XRF) and Loss on Ignition (LOI)
X-ray fluorescence (XRF) was used to determine the elemental composition of the fly ash using X-rays. XRF analysis helps assess the quality and acceptability of fly ash to produce cement and concrete, as well as its environmental impact and regulatory compliance [18]. Fly ash samples were stored in sealed containers to prevent contamination and moisture loss. The stored samples were then ground to a fine powder and dried at 100 °C to remove any remaining moisture prior to the XRF analysis. By heating the samples in a furnace at 1000 °C and comparing their masses before and after heating, the loss on ignition (LOI) of the samples was determined. Based on the components of interest and the anticipated concentration ranges, the appropriate measurement program for XRF analysis was selected. The standard analysis for 20 oxides was selected and used to determine the composition of the major oxides. The XRF results obtained were reported in terms of oxide mass fractions (%), as shown in Table 2.
2.2.3. Specific Gravity
A specific gravity test using the Le Chatelier apparatus was conducted on the fly ash to be used in the geopolymer formulation. The three fly ash subsamples to be tested were dried in the oven for a day to remove moisture content. Specific gravity increases with longer milling times due to finer particles being formed as milling progresses [19].
2.2.4. Atterberg Limits Test
The plastic, shrinkage, and liquid limits of the fly ash samples were tested using the Atterberg limit tests. For each test of the plastic and liquid limits, a 20-g subsample was passed through a 425-um sieve. When a sample contains a certain amount of liquid, which makes it behave as if it were practically a liquid, it is said to have reached its liquid limit. The plastic limit was reached when the sample started to behave like a plastic material due to its high moisture content. A semi-logarithmic plot was drawn between log N and water content (w) to determine the water limit, which is the water content corresponding to N [20]. The results are shown in Table 3.
2.3. Geopolymer Production
Various geopolymer samples were prepared to determine the optimal manufacturing process, blend design, and curing temperature. The amount of water and fly ash used was kept constant in all runs. The polystyrene mass and activator concentration were varied throughout to determine their effect on geopolymer properties. To ensure complete homogenization, the measured water, fly ash, and polystyrene were mixed for two minutes. After uniformly mixing the paste, it was poured into molds, where it gained its cubic shape. The dimensions of the metal molds were 50 mm by 50 mm by 50 mm. The samples were kept under ambient conditions in the mold before oven curing. After molding, the samples were removed from the mold and dried first in a laboratory setting (precuring) and then in an oven at 60 and 100 ± 5 °C for 24 h. The precuring time has been proven to be beneficial to strength development [16]. Based on the extensive review by Nurruddin et al. [21], who outlined ideal geopolymer curing conditions from a variety of academic publications, a temperature range of 60 °C to 100 °C was chosen for this investigation. This temperature range exhibits an efficient geopolymerization rate, resulting in more robust structures [21]. The oven temperature and curing period were varied to assess their effect on the final geopolymer properties.
2.4. Testing of Produced Geopolymers
2.4.1. X-ray Diffraction (XRD)
X-ray diffraction (XRD) was used to determine whether the formulated geopolymers contained crystalline or amorphous phases. To increase the accuracy of the analysis, geopolymer samples were prepared by finely powdering and combining them with an internal standard (SiO2/Al2O3). A known amount (10% by mass) of the internal standard was added. The samples were then placed in the XRD instrument after mounting it on a holder. Prior to the measurement, the instrument was properly aligned and calibrated. The obtained XRD analysis was assembled and saved as a file. The saved information was then used to plot the diffracted X-ray intensity against the scattering angle (2𝜃). The GSAS program was used to analyze the XRD data. By comparing the experimental data with database references, this technique determined the phase composition, crystallinity, and lattice characteristics of the geopolymer samples.
2.4.2. Scanning Electron Microscopy (SEM)
A beam of electrons is used in the scanning electron microscopy (SEM) technique to scan a sample’s surface and create a magnified image of its features [12]. To determine the elemental makeup of the sample, SEM can also be used with energy dispersive X-ray spectroscopy (EDS). The morphology, structure, and chemistry of the formulated geopolymers were evaluated using SEM-EDS. The samples were first dried for 24 h at 100 °C in an oven, then ground into a fine powder. After placing the sample on a metal stub using conductive adhesive tape, the sample was flattened and smoothed to fully cover the surface of the stub. A sputter coater was used to apply a miniscule layer of carbon to the fly ash sample to improve its conductivity and reduce its tendency to charge upon exposure to an electron beam. The sample was then placed into the SEM chamber, and air was removed using a vacuum pump. The required images were then selected and saved.
2.4.3. Unconfined Compressive Strength (UCS)
After the geopolymer samples were cooled for 24 h at room temperature, they were then placed in a testing apparatus, and a compressive load was exerted until they failed. The maximum load was recorded and used to calculate the unconfined compressive strength (UCS) by dividing the maximum load by the specimen’s cross-sectional area. The UCS value indicated the geopolymer’s resistance to axial compression in the absence of lateral confinement [3].
2.4.4. Density
A Mettler Toledo laboratory balance was used to measure the mass of each geopolymer sample. The volume was calculated by multiplying the dimensions of each cube measured using a Vernia caliper. The density was determined by dividing the mass of each sample by its volume [3].
3. Results and Discussion
3.1. Fly Ash Characterization
The characterization phase entails examining and ascertaining the physical, chemical, and mineralogical characteristics of fly ash. Various analytical techniques are employed, as outlined in the sections below.
3.1.1. XRF Analysis of Fly Ash
Table 2 shows the chemical composition of the fly ash, obtained from the XRF test.
According to the results, the fly ash had a high content of silicon dioxide (SiO2) and iron oxide (Fe2O3), which accounted for more than 50% of the total composition. Hence, the fly ash was classified as class F, distinguished by strong pozzolanic activity and low calcium concentration [22]. According to Mucsi et al. [23], the optimal performance of geopolymer structures is obtained at fly ash SiO2/Al2O3 ratios less than 3.3. The XRF results indicated a SiO2/Al2O3 ratio of 5.9513, which is not ideal for geopolymer production [24], as the dissolution and polycondensation processes during geopolymerization are influenced by the SiO2/Al2O3 ratio of the fly ash. The dissolution of fly ash occurs more slowly due to lower reactivity when the SiO2/Al2O3 ratio is higher [17]. The SiO2/Al2O3 ratio of the fly ash influences the Si/Al ratio of the resulting geopolymer, which is crucial in determining the mechanical properties of the geopolymers. Higher geopolymer Si/Al ratios signify lower polymerization and a more porous structure due to a lower density [25]. However, fly ash with a high SiO2/Al2O3 ratio can still be used in geopolymer synthesis, depending on the concentration and type of activator used and the curing conditions.
Particularly for high-strength and high-performance concrete, Class F fly ash is suitable as a partial replacement for cement in concrete mixes. The XRF results also revealed that the sample contained trace elements in small concentrations (less than 0.1%), which included rubidium (Rb2O), strontium (SrO), and zirconium (ZrO2). Fly ash properties, such as color, radioactivity, and reactivity, may be affected by these trace elements. Strontium is radioactive, which can elevate the ambient radiation levels of fly ash. The thermal resistance of fly ash can be improved by the refractory metal zirconium, which has a percentage composition of 0.0323 [25]. The results also revealed the presence of contaminants, including copper (CuO), sulfur (SO3), and chlorine (Cl), in low to moderate concentrations (less than 3%). These contaminants may adversely affect the performance and quality of the fly ash through discoloration, corrosion, and expansion. Concrete can expand and crack because of sulfur, due to the development of ettringite. Concrete can become stained by copper because of copper hydroxide production [26]. Using Table 2 and the proposed activator concentrations and curing conditions, the properties of the synthesized geopolymers could be predicted.
3.1.2. Atterberg Limits of Fly Ash
The Atterberg limit results of the fly ash are shown in Table 3.
A study by Heyns and Mostafa Hassan [11] claimed that South Africa only produces Class F fly ash, which requires a cementing agent to undergo reactions to develop strength [11]. Class F fly ash has a low calcium concentration, as shown in Table 2, and is primarily made of silica and alumina oxides. Fly ash’s Atterberg limits are determined by several important parameters. First, the distribution of particle sizes is important since smaller particles have a higher surface area than larger ones, which could lead to differing plastic and liquid limits [27]. Second, fly ash’s chemical makeup, including its mineralogy and the presence of chemicals, has a major influence on how malleable it is. Specific minerals present in fly ash have the potential to influence the production of colloidal particles, which could impact both liquid and plastic limits [28].
Furthermore, the Atterberg limits of fly ash can be significantly impacted by the curing conditions to which it is exposed. Changes in temperature and moisture content during storage or curing can cause variations in the water content at which the soil transitions between several phases [20]. Another aspect that affects the parameters of water absorption in fly ash is its carbon content. Fly ash’s carbonaceous particles can absorb or release water, changing the plastic and liquid limitations [27]. Moreover, like numerous soils, fly ash’s Atterberg limits could change over time because of elements like weathering, compaction, and consolidation. Lastly, the Atterberg limits of fly ash can be altered by adding additional substances or minerals [9]. For example, combining fly ash with cement or lime might change the material’s plasticity properties. Accurately evaluating the engineering characteristics and behavior of fly ash in a variety of applications, such as soil improvement and construction, requires an understanding of and consideration for these elements. As indicated in Table 3, the moisture level at which the fly ash transformed from a liquid to a plastic condition was 49%. The difference between the liquid and plastic weight limits (PI) indicated the range of water contents below which fly ash lost its plasticity, as shown in Equation (1):
Based on the values reported in Table 3 and according to the Unified Soil Classification System (USCS), the fly ash was classified as a highly plastic material, indicating that the fly ash had a high FeO content (as shown in Table 2), posing a high potential for shrinkage and expansion [29]. Additionally, a moderate liquid limit (LL) of 49% shows that the fly ash had low shear strength, high compressibility, and low permeability. Such fly ash is usually stabilized due to its Atterberg limits, which are not typically appropriate for building roads or supporting foundations [30].
3.2. Geopolymer Testing
Geopolymer testing involves evaluating the properties of the produced geopolymers. These tests include compressive strength, water absorption, Atterberg limits of fly ash, and durability to evaluate the geopolymers’ suitability for construction and other industrial applications. Characterization plays a crucial role in optimizing geopolymer formulations and understanding their performance under different environmental conditions.
3.2.1. Unconfined Compressive Strength (UCS) Test
One way to assess the mechanical behavior of geopolymers is the unconfined compressive strength (UCS) test. The UCS test entails placing a geopolymer sample under an increasing load until it breaks [9].
Varied Sodium Hydroxide Concentrations and Curing Temperature
Two sets of UCS data, one for geopolymers cured at 60 °C and the other for geopolymers cured at 100 °C, are shown in Figure 5, indicating that for both curing temperatures, the UCS values are directly proportional to the sodium hydroxide concentration. According to Temuujin et al. [17], high sodium hydroxide concentrations accelerate the dissolution of aluminosilicate precursors, thus releasing hydroxide ions (OH−), which in turn release additional silicon (Si) and aluminum (Al) ions for geopolymerization. The acceleration of the geopolymerization process enhances the formation of a dense and compact microstructure with less porosity, which explains the UCS increase from 0.441 MPa at 0.02 sodium hydroxide concentration to 11.049 MPa at 0.08 sodium hydroxide composition at 60 °C. For samples cured at 100 °C, the UCS increased from 0.290 MPa to 16.695 MPa at 0.02 and 0.08 g sodium hydroxide/g sample concentrations, respectively. The UCS values are higher for samples cured at 100 °C than for samples cured at 60 °C at all sodium hydroxide concentrations, demonstrating that increased curing temperature also improves the geopolymer strength. Overall, the highest UCS of 16.695 MPa was obtained at conditions of 0.08 g sodium hydroxide/g sample and 100 °C curing temperature, while the lowest UCS of 0.29 MPa was obtained at 0.02 g sodium hydroxide/g sample and 100 °C curing temperature.
Si and Al, the primary constituents of the geopolymeric gel, are more easily dissolved from the source materials at higher curing temperatures, explaining the high UCS values at the 100 °C curing temperature compared to 60 °C. Another byproduct of geopolymerization that might have contributed to the rising trend of geopolymer strength is calcium silicate hydrate (CSH) gel, which is formed at higher sodium hydroxide concentrations [25]. A closer look at Figure 5 shows that after a sodium hydroxide concentration of 0.08 g sodium hydroxide/g sample, the UCS decreased as the sodium hydroxide concentration increased to 0.1 g sodium hydroxide/g sample. This decrease concludes that the optimum sodium hydroxide concentration for both curing conditions was 0.08 g sodium hydroxide/g sample, yielding the highest UCS of 11.049 MPa and 16.695 MPa at 60 °C and 100 °C curing temperatures, respectively. Excess sodium hydroxide may disturb the geopolymerization process due to the excess hydroxyl ions, resulting in an ineffective reaction [31], causing the geopolymer products to have decreased strength, greater porosity, and less durability, as shown by the UCS decrease in Figure 5 at a sodium hydroxide concentration of 0.1 g sodium hydroxide/g sample.
Varied Polystyrene Concentrations and Curing Temperature
The UCS comparison of the polystyrene concentrations at curing temperatures of 60 °C and 100 °C is displayed in Figure 6. Figure 6 depicts a negative trend for both curing temperatures, demonstrating a relationship of inverse proportionality between the UCS of the geopolymers and polystyrene concentration. The highest UCS values of 4.180 MPa and 2.387 MPa were obtained at a low polystyrene concentration of 0.01 g polystyrene/g sample cured at 60 °C and 100 °C, respectively. Increased polystyrene concentrations negatively affected the UCS values, with minimum values of 0.237 MPa and 0.254 MPa at 60 °C and 100 °C, respectively. Additionally, Figure 6 demonstrates that the trend for the curing temperature at 100 °C is less steep than the trend for curing at 60 °C, implying that a higher curing temperature exacerbates the detrimental effects of polystyrene on the UCS of the geopolymers. The optimum conditions deduced from Figure 6 are a polystyrene concentration of 0.01 g polystyrene/g sample at 60 °C curing conditions.
As suggested by Veiseh and Yousefi [15], the load-bearing capability of the varied polystyrene samples was decreased by weak interfaces caused by polystyrene, a plastic substance with poor adherence to the geopolymer matrix. In addition, the geopolymer matrix is left with voids and cracks that compromise its strength and integrity because polystyrene melts and deforms at high temperatures. The results indicate that adding polystyrene to geopolymers is not an ideal strategy to create lightweight and durable materials for applications that require robust mechanical performance or exposure to high temperatures. However, adding polystyrene to geopolymers might still be advantageous in some ways, such as increasing thermal insulation, lowering density, and valorizing polystyrene waste [3].
3.2.2. XRD Analysis
Figure 7 reveals that all samples contained the minerals quartz (Q), mullite (M), zeolite (Z), and sodium aluminate (NA). However, there are a few peaks whose intensity and location vary between the five samples as a result of different sodium hydroxide concentrations. The black line (0.10 g sodium hydroxide/g sample) at the bottom of Figure 7 has higher intensities compared to the purple line (0.02 g sodium hydroxide/g sample) at the top. The bottom trends are more intense than the top trends at various angles, including 20°, 27°, 35°, and 45°. This finding implies that some phases were more concentrated in the bottom samples (black/red line graph) than the top samples (purple/green/blue line graph). For instance, zeolite, a frequent result of fly ash geopolymerization, peaks at 20 degrees. The peak at about 27 degrees represents sodium aluminate, which was similarly created by the interaction of fly ash and NaOH4. Mullite, a leftover phase generated from fly ash, gave the peak at approximately 35 degrees [32]. The peak at 45 degrees is explained by quartz, a further fly ash residual phase [32].
Figure 8 and Figure 9 show the XRD results for the geopolymer samples exhibiting the optimal UCS results (best mechanically performing). Consequently, Figure 8 shows the XRD plot of the geopolymer sample at the 0.08 g sodium hydroxide/g sample sodium hydroxide concentration, while Figure 9 shows the XRD plot for the geopolymer sample at the 0.01 g polystyrene/g sample polystyrene concentration. The crystalline phases in the geopolymer sample are depicted in Figure 8. The peaks are indicative of the several minerals that compose the sample. The peak intensity corresponds to the quantity or concentration of each mineral phase. The interplanar spacing, or lattice parameter, of each phase is represented by the position of the peaks [32]. Quartz (SiO2), a frequent component of fly ash, is responsible for the greatest peak at approximately 20 degrees. The inert quartz does not take part in the geopolymerization reaction. As a result, quartz has little impact on the geopolymer’s characteristics. Other fly ash phases, such as mullite (3Al2O3·2SiO2), hematite (Fe2O3), magnetite (Fe3O4), or calcium silicate hydrate (CSH), are responsible for the remaining peaks.
These phases could have various implications for the geopolymerization process and the geopolymers’ characteristics. Mullite, for instance, is a reactive aluminosilicate that can help geopolymer gel develop [32]. Iron oxides like hematite and magnetite can alter the geopolymer’s color and magnetic characteristics [32]. The cementitious CSH phase can increase the geopolymers’ tensile strength and durability [29]. By comparing the relative strengths of the peaks in Figure 8, it is possible to deduce how the sodium hydroxide concentration affects the geopolymer’s mineralogical composition. The degree of fly ash dissolution and polymerization can be increased by increasing the sodium hydroxide content, which would improve the geopolymers’ compressive strength and decrease their water absorption, as indicated by higher intensity peaks. Conversely, some peak intensities can be decreased by reducing the amount of unreacted fly ash or residual phases in the geopolymer [33].
Due to the amorphous nature of polystyrene, it did not exhibit any XRD peaks or have a substantial impact on the XRD results. All the varied polystyrene samples were prepared at a constant sodium hydroxide concentration (0.08 g sodium hydroxide/g sample). Hence, the peaks shown in Figure 9 are similar to those shown in Figure 8. The crystalline phases in the geopolymer sample are depicted in Figure 9.
3.2.3. Scanning Electron Microscope (SEM)
The geopolymer microstructure of the best mechanically performing sodium hydroxide-varied sample at the 0.08 g/g sample concentration is displayed in Figure 10. The micrograph reveals a network of pores and the presence of spherical fly ash particles. The pore development is caused by the combination of fly ash and sodium hydroxide. The geopolymer development is indicated by the appearance of pores in Figure 10. The sodium hydroxide concentration affects the pores’ size. It was observed that larger voids were present as the sodium hydroxide concentration was increased. However, according to Kutchko and Kim [34], larger pores indicate a weaker geopolymer structure as the geopolymers’ mechanical properties are diminished due to the larger pores, thus increasing their porosity and decreasing their density [34]. Reduced reactivity is indicated by the presence of unreacted fly ash particles. The sodium hydroxide solution did not completely dissolve and polymerize all the fly ash particles, as some were still left in the sample (shown by spherical particles in Figure 10).
The microstructure of the best mechanically performing varied polystyrene sample at the 0.01 g/g sample concentration is shown in Figure 11. The polystyrene is visible as white spots scattered around the matrix. Similar to Figure 10, Figure 11 reveals a network of pores and spherical fly ash particles. The geopolymer properties may also be influenced by the addition of polystyrene. In the geopolymer matrix, the polystyrene can serve as a filler or a pore former. Polystyrene can alter the geopolymer’s porosity, density, strength, and thermal conductivity depending on its size and distribution [3]. A higher dissolution of fly ash is indicated in Figure 10 due to the limited spherical fly ash particles. A denser microstructure may result from the reduced unreacted fly ash particles or residual phases in the geopolymer.
3.2.4. FTIR
The FTIR results for the varied sodium hydroxide samples are shown in Figure 12.
The chemical structure and functional groups of the geopolymer samples were described using the Fourier transform infrared spectroscopy (FTIR) method. The main FTIR bands showing the presence of geopolymers were: 1000–1200 (asymmetric stretching vibration of Si-O-Si and Si-O-Al bonds), 800–900 (symmetric stretching vibration of Si-O-Si and Si-O-Al bonds), 600–700 (bending vibration of Si-O-Si and Si-O-Al bonds), and 400–500 [35]. Although the trends in Figure 12 look similar, they are slightly different when carefully analyzed. The difference is due to the unique sodium hydroxide concentrations, which influence the availability of the different functional groups in each geopolymer structure. Lower sodium hydroxide concentrations did not produce many geopolymerization products, hence limiting the quantity of Si-O-Si and Si-O-Al bonds in each structure. Therefore, a lower transmittance is observed in the lower trends in Figure 12. The 0.08 g/g sample sodium hydroxide trend has clearer, sharper waves compared to the 0.02 g/g sample sodium hydroxide trend due to the greater presence of each type of bond at higher sodium hydroxide concentrations. However, as the concentration was raised above 0.08 to 0.1 g/g sample concentration, the % transmittance decreased, indicating that excess sodium hydroxide affects the production of Si-O-Si and other bonds.
3.2.5. Density Analysis
Generally, the density of geopolymers is highly related to the UCS [3]. Hence, the density analysis was performed only for the samples cured at 100 °C, as they showed greater strength than those cured at 60 °C.
Figure 13 shows the density of the varied sodium hydroxide samples. The graph has an increasing trend, indicating an increase in density as the concentration of sodium hydroxide increased. Increasing the sodium hydroxide content encourages a quicker and more complete geopolymerization reaction [36]. This may result in a more compact and dense structure in the geopolymer, which in turn may increase the material’s density, as shown in Figure 13. The lowest density of 1154.4 kg/ was recorded at a sodium hydroxide concentration of 0.02 g sodium hydroxide/g sample, while the highest density of 1405.6 kg/ was recorded at 0.08 g sodium hydroxide/g sample. The densities obtained in Figure 13 were compared to those of varied polystyrene samples in Figure 14 to achieve the objective of producing lightweight geopolymer structures in comparison to ordinary geopolymers.
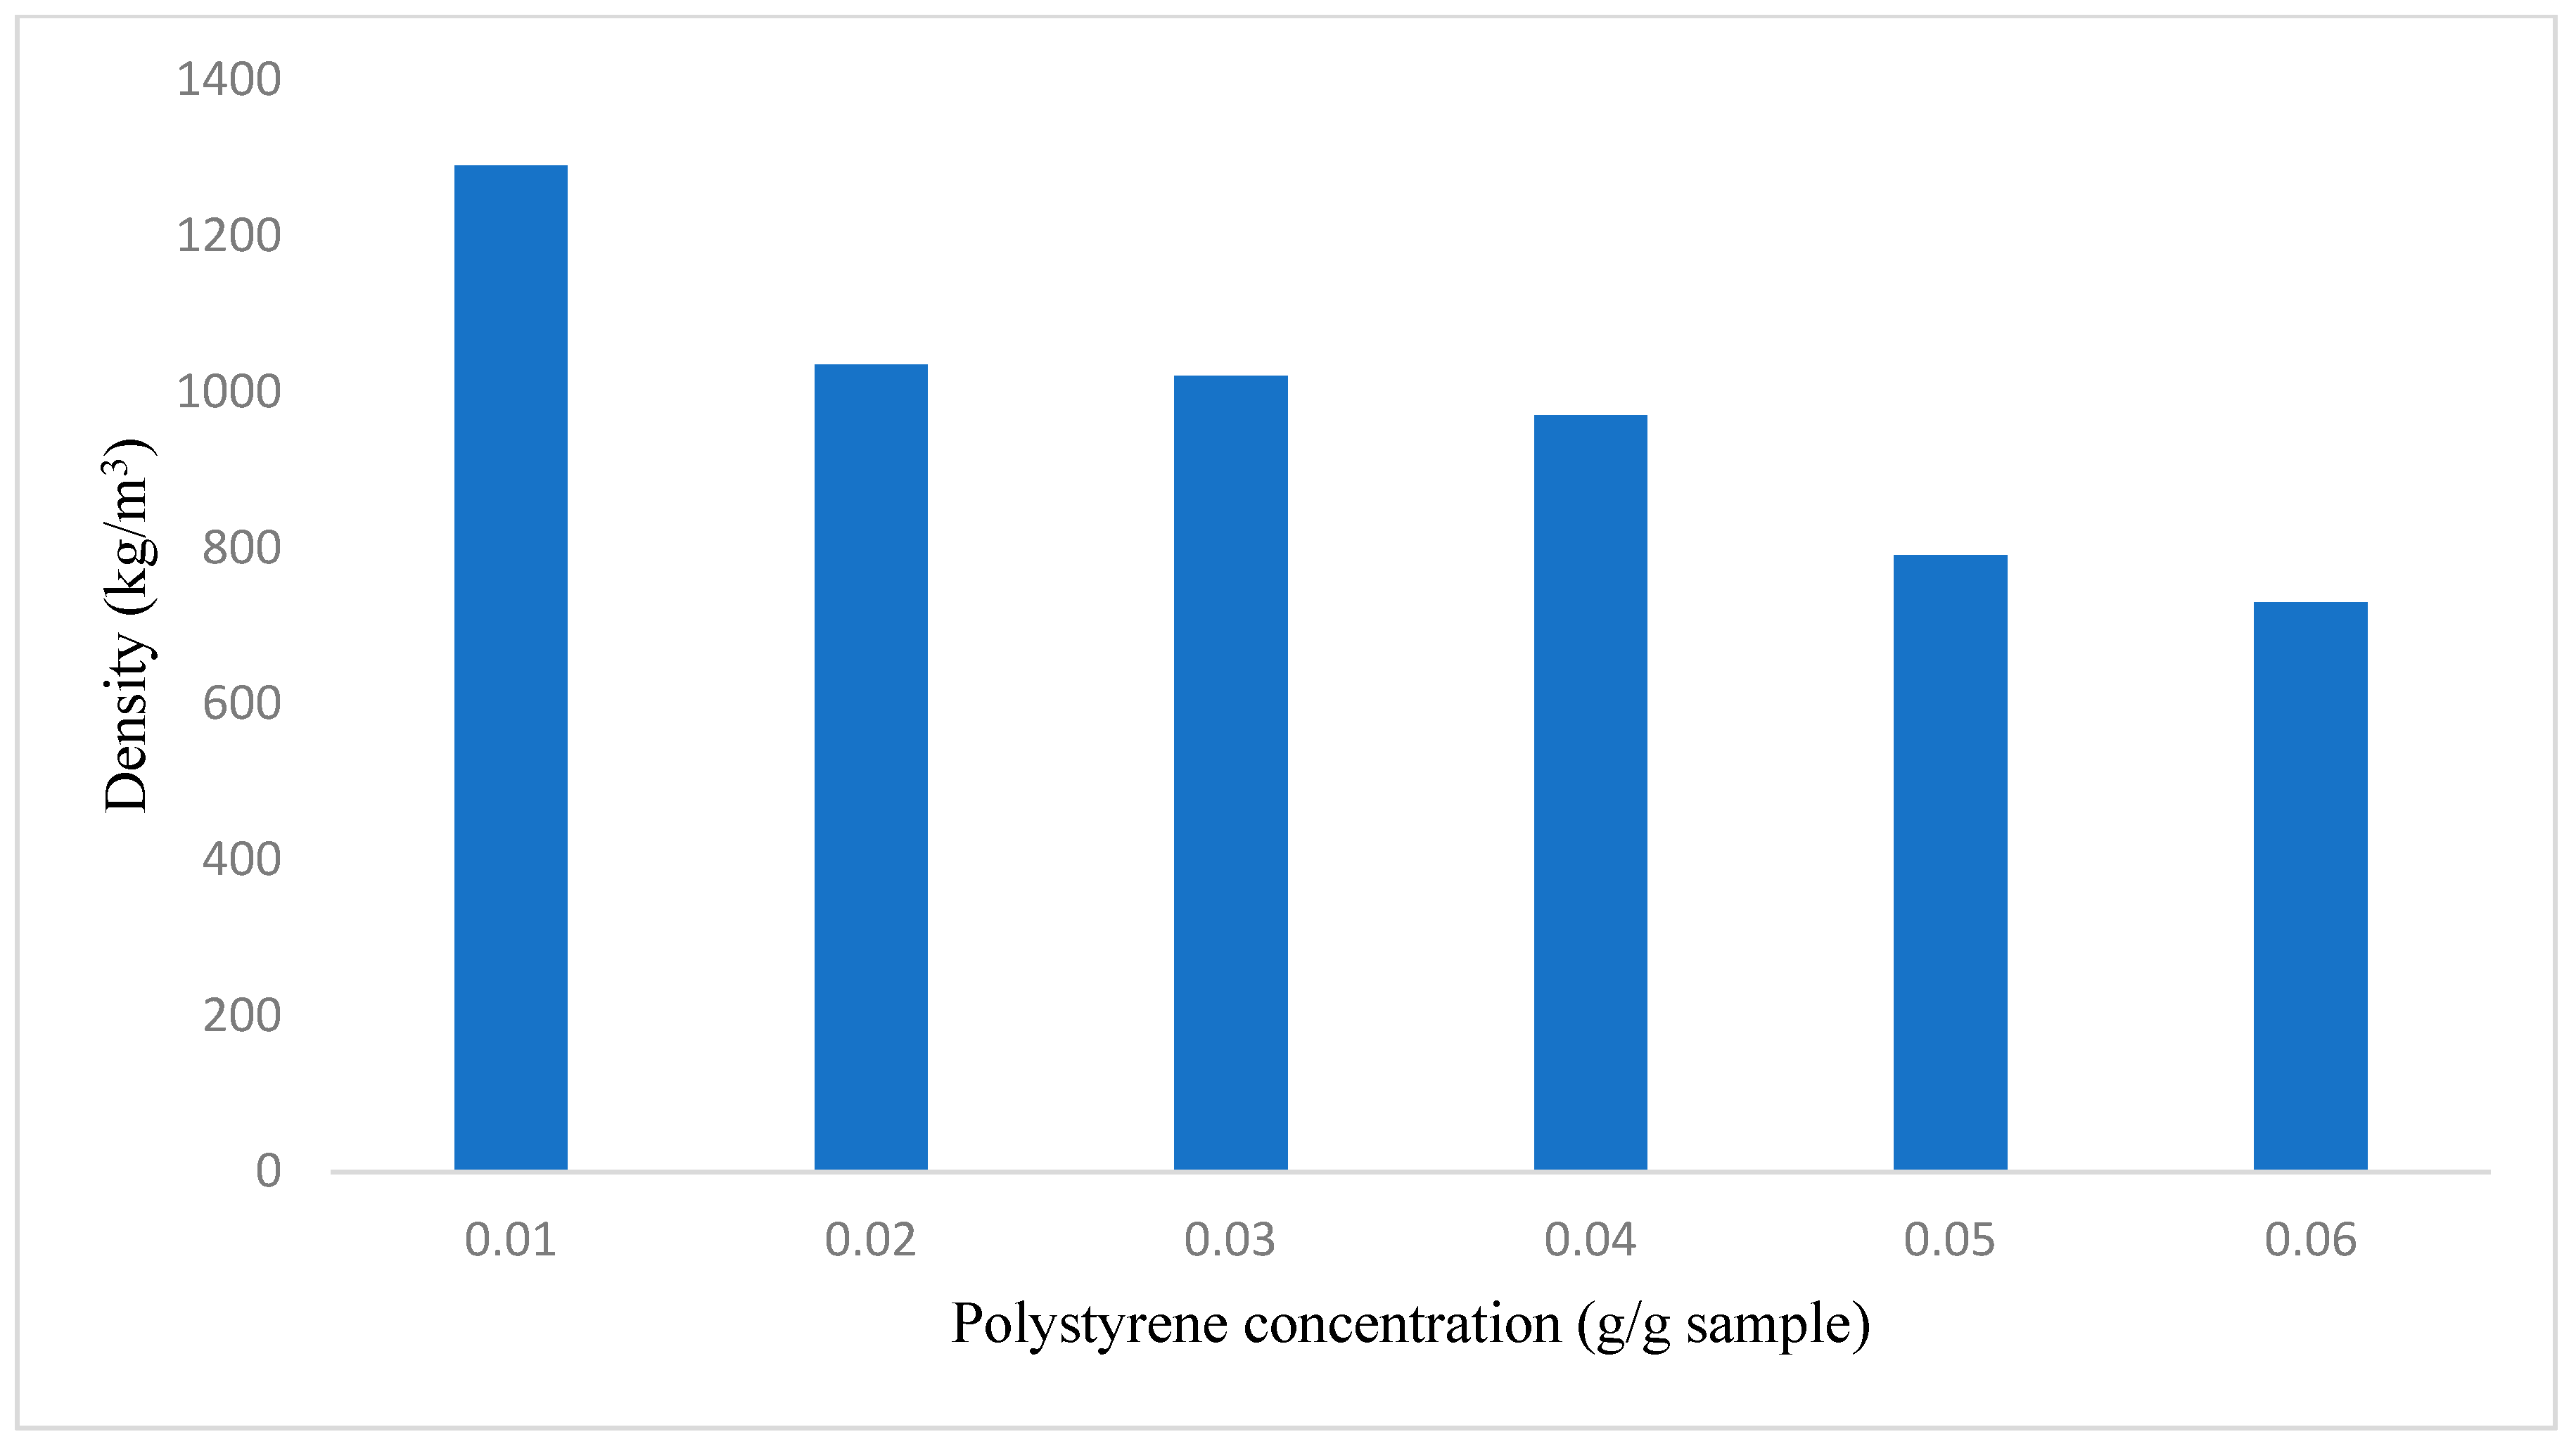
Figure 14 shows the density of polystyrene-dosed geopolymer samples. The trend is opposite compared to the varied sodium hydroxide samples. As the concentration of polystyrene increases, a gradual decrease in the geopolymers’ densities is seen. This finding can be attributed to the fact that polystyrene hindered the geopolymerization, which might have resulted in less completion. Such a lack of completion usually leads to a less dense geopolymer structure due to limited binding, creating a weak structure and potentially leading to a lower density of the material [15]. In the geopolymer matrix, the synthetic polymer polystyrene can serve as a filler or a pore former, weakening the bonds and keeping the structure intact [15]. The highest density of 1290.16 kg/, as predicted, was obtained at a low polystyrene concentration of 0.01 g polystyrene/g sample. A lower density of 730.32 kg/ was obtained at a high polystyrene concentration of 0.06 g polystyrene/g sample. The results show that the polystyrene samples were less dense compared to the varied sodium hydroxide samples, thus achieving the goal of creating lightweight geopolymer materials.
3.2.6. Water Absorption Test
The test for water absorption was carried out on all the geopolymer samples that had been cured at 60 °C for 24 h. The samples were weighed for dry mass ( after being cooled to room temperature and submerged in deionized water for 24 h. The geopolymer samples were then removed from the water, thoroughly shaken, and wiped off with a cloth to eliminate surface water. The samples were then weighed for wet mass () before computing the percentage of water absorption (W) using Equation (2):
W = (Mw − Md)/Md × 100%
The fly ash geopolymer water absorption test results (Table 4) show how the density and water absorption of the geopolymer samples were affected by increasing the sodium hydroxide concentration. These results are comparable to those reported by Thokchom et al. [37], who obtained values ranging from 6.42% to 11.79% in a similar study. Table 4 shows a water absorption reduction from 14% to 4.30% as the concentration of sodium hydroxide increased from 0.02 to 0.08, respectively, while the dry density () and wet density () increased from 144.30 kg/ to 169.62 kg/ and from 165.73 kg/ to 176.91 kg/, respectively. As seen in previous results, greater sodium hydroxide concentrations cause greater geopolymerization and reduced porosity in the samples, which in turn causes greater density and decreased water absorption. However, the water absorption slightly increased to 5.11% as the sodium hydroxide concentration rose to 0.10, while the dry density and wet density both marginally increased to 175.70 kg/ and 184.67 kg/, respectively. This finding could be attributed to the excess sodium silicate gel that forms, filling some pores while simultaneously creating new ones and increasing the amount of water absorption. Therefore, 0.08 was the ideal sodium hydroxide concentration for reducing water absorption and increasing fly ash geopolymers’ density.
In accordance with the study by Veiseh et al. [15], it can be observed in Table 5 that the water absorption of fly ash geopolymers increases with an increase in polystyrene concentration. This means that adding more polystyrene to the geopolymer mixture makes the material more porous and less dense, allowing more water to penetrate the pores. This might be because polystyrene, which is lightweight and hydrophobic, does not adhere well to the geopolymer matrix, leading to cavities and cracks in the structure [15]. In comparison to ordinary Portland cement, which typically has water absorption values of less than 5%, fly ash geopolymers containing polystyrene have water absorption values that vary from 10% to 15.87%. This shows that fly ash geopolymers containing polystyrene are more prone to water damage and deterioration than Portland cement and therefore require additional protection to optimize their performance in wet conditions.
4. Conclusions
The use of fly ash and polystyrene wastes in the production of a potentially sustainable low-density construction material was investigated in this study. To reduce the adverse environmental impacts of the cement industry and the energy production industry, fly ash from a South African powerplant was used to produce an alternative to Portland cement, a major carbon emission contributor. In an attempt to target low-density applications in the construction industry, the mass of the produced geopolymer was reduced using polystyrene as a foaming agent, thus validating the argument that the polystyrene waste could be used to decrease the density of the produced geopolymer.
The objective of the study was to assess the effect of varying sodium hydroxide and polystyrene concentrations on the chemical and mechanical properties of geopolymers. The experimental results showed positive outcomes, as supported by the literature. The strength of the geopolymers was directly proportional to the activator concentration. High UCS values of 16.695 MPa were obtained at an optimum concentration of 0.08 g sodium hydroxide/g sample cured at 100 °C. The addition of polystyrene reduced the density of the geopolymer while increasing its thermal resistance. The incorporation of polystyrene highly affected the UCS of the produced geopolymer samples, a major property of a construction material. The geopolymers formulated using low concentrations of polystyrene exhibited similar properties to those of non-polystyrene geopolymers. However, as the polystyrene concentration increased, properties such as the UCS were greatly compromised.
It can be concluded that the use of fly ash as a component of geopolymers is viable and can be enhanced by incorporating additives to improve their properties. The addition of polystyrene is also possible at low concentrations, as it does not significantly alter the major properties of a construction material. The production of lightweight geopolymer construction materials was achieved; however, further studies are required to improve the desired properties. For specific commercial applications requiring low-density materials, additional research is required to optimize the composition and processing parameters to balance the strength and density properties of geopolymer–polystyrene composites.
Author Contributions
R.R.: conceptualization, supervision, investigation, visualization, writing—reviewing and editing. B.N.: methodology, investigation, formal analysis, validation, writing—original and final draft. All authors have read and agreed to the published version of the manuscript.
Funding
This project was supported by the University Research Council (URC) Fund (Grant Number: 2023URC00653) at the University of Johannesburg.
Data Availability Statement
The raw data supporting the conclusions of this article will be made available by the authors on request.
Acknowledgments
The authors would like to thank the University of Johannesburg for the facilities in which the study was conducted and Naadhira Seedat for her review guidance.
Conflicts of Interest
The authors declare no conflicts of interest.
References
- Imbabi, M.S.; Carrigan, C.; McKenna, S. Trends and developments in green cement and concrete technology. Int. J. Sustain. Built Environ. 2012, 1, 194–216. [Google Scholar] [CrossRef]
- Komnitsas, K.A. Potential of geopolymer technology towards green buildings and sustainable cities. Procedia Eng. 2011, 21, 1023–1032. [Google Scholar] [CrossRef]
- Roopchund, R.; Andrew, J.; Sithole, B. Using cellulose nanocrystals to improve the mechanical properties of fly ash-based geopolymer construction materials. Eng. Sci. Technol. Int. J. 2022, 25, 100989. [Google Scholar] [CrossRef]
- Henderson, K.; Loreau, M. A model of Sustainable Development Goals: Challenges and opportunities in promoting human well-being and environmental sustainability. Ecol. Model. 2023, 475, 110164. [Google Scholar] [CrossRef]
- Crompton, T.; Kasser, T.; World Wildlife Fund UK (WWF-UK). Meeting Environmental Challenges: The Role of Human Identity; World Wildlife Fund UK (WWF-UK): Surrey, UK, 2009. [Google Scholar]
- Khan, S.; Anjum, R.; Raza, S.T.; Bazai, N.A.; Ihtisham, M. Technologies for municipal solid waste management: Current status, challenges, and future perspectives. Chemosphere 2022, 288, 132403. [Google Scholar] [CrossRef] [PubMed]
- Prajapati, P.; Varjani, S.; Singhania, R.R.; Patel, A.K.; Awasthi, M.K.; Sindhu, R.; Zhang, Z.; Binod, P.; Awasthi, S.K.; Chaturvedi, P. Critical review on technological advancements for effective waste management of municipal solid waste—Updates and way forward. Environ. Technol. Innov. 2021, 23, 101749. [Google Scholar] [CrossRef]
- Bradu, P.; Biswas, A.; Nair, C.; Sreevalsakumar, S.; Patil, M.; Kannampuzha, S.; Mukherjee, A.G.; Wanjari, U.R.; Renu, K.; Vellingiri, B.; et al. Recent advances in green technology and Industrial Revolution 4.0 for a sustainable future. Environ. Sci. Pollut. Res. 2022, 30, 124488–124519. [Google Scholar] [CrossRef] [PubMed]
- Meesala, C.R.; Verma, N.K.; Kumar, S. Critical review on fly-ash based geopolymer concrete. Struct. Concr. 2020, 21, 1013–1028. [Google Scholar] [CrossRef]
- Ahmaruzzaman, M. A review on the utilization of fly ash. Prog. Energy Combust. Sci. 2010, 36, 327–363. [Google Scholar] [CrossRef]
- Heyns, M.W.; Hassan, M.M. South Africa Class F Fly Ash for roads: Physical and chemical analysis. Interim Interdiscip. J. 2013, 12, 28–41. [Google Scholar]
- Fauzi, A.; Nuruddin, M.F.; Malkawi, A.B.; Abdullah, M.M.A.B. Study of Fly Ash Characterization as a Cementitious Material. Procedia Eng. 2016, 148, 487–493. [Google Scholar] [CrossRef]
- Gulizia, A.M.; Patel, K.; Philippa, B.; Motti, C.A.; van Herwerden, L.; Vamvounis, G. Understanding plasticiser leaching from polystyrene microplastics. Sci. Total Environ. 2023, 857, 159099. [Google Scholar] [CrossRef]
- Kim, J.-S.; Lee, W.-Y.; Lee, S.-B.; Kim, S.-B.; Choi, M.-J. Degradation of polystyrene waste over base promoted Fe catalysts. Catal. Today 2003, 87, 59–68. [Google Scholar] [CrossRef]
- Veiseh, S.; Yousefi, A.A. The Use of Polystyrene in Lightweight Brick Production polystyrene foam; lightweight bricks; thermal insulation; pore-forming. Iran. Polym. J. 2003, 12, 323–329. Available online: www.sid.ir (accessed on 23 June 2023).
- Feng, J.; Zhang, R.; Gong, L.; Li, Y.; Cao, W.; Cheng, X. Development of porous fly ash-based geopolymer with low thermal conductivity. Mater. Des. (1980–2015) 2015, 65, 529–533. [Google Scholar] [CrossRef]
- Temuujin, J.; van Riessen, A.; MacKenzie, K. Preparation and characterisation of fly ash based geopolymer mortars. Constr. Build. Mater. 2010, 24, 1906–1910. [Google Scholar] [CrossRef]
- Williams, R.P.; van Riessen, A. Determination of the reactive component of fly ashes for geopolymer production using XRF and XRD. Fuel 2010, 89, 3683–3692. [Google Scholar] [CrossRef]
- Arun, N.; Singh, P.; Gupta, S. Utilisation of ground bottom ash in concrete. Mater. Today Proc. 2020, 32, 663–669. [Google Scholar] [CrossRef]
- Andavan, S.; Pagadala, V.K. Experimental study on addition of lime and fly ash for the soil stabilization. Mater. Today Proc. 2020, 22, 1065–1069. [Google Scholar] [CrossRef]
- Nurruddin, E.A. Methods of curing geopolymer concrete: A review. Int. J. Adv. Appl. Sci. 2018, 5, 31–36. [Google Scholar] [CrossRef]
- Hemalatha, T.; Ramaswamy, A. A review on fly ash characteristics—Towards promoting high volume utilization in developing sustainable concrete. J. Clean. Prod. 2017, 147, 546–559. [Google Scholar] [CrossRef]
- Mucsi, G.; Kumar, S.; Csőke, B.; Kumar, R.; Molnár, Z.; Rácz, Á.; Mádai, F.; Debreczeni, Á. Control of geopolymer properties by grinding of land filled fly ash. Int. J. Miner. Process. 2015, 143, 50–58. [Google Scholar] [CrossRef]
- Waijarean, N.; Asavapisit, S.; Sombatsompop, K.; MacKenzie, K.J.D. The Effect of SiO2/Al2O3 Ratios on the Properties of Geopolymers Prepared from Water Treatment Residue (WTR) in the Presence of Heavy Metals. GMSARN Int. J. 2014, 8, 97–102. [Google Scholar]
- Duxson, P.; Provis, J.L.; Lukey, G.C.; Mallicoat, S.W.; Kriven, W.M.; van Deventer, J.S.J. Understanding the relationship between geopolymer composition, microstructure and mechanical properties. Colloids Surf. A Physicochem. Eng. Asp. 2005, 269, 47–58. [Google Scholar] [CrossRef]
- Prusty, J.K.; Pradhan, B. Effect of GGBS and chloride on compressive strength and corrosion performance of steel in fly ash-GGBS based geopolymer concrete. Mater. Today Proc. 2020, 32, 850–855. [Google Scholar] [CrossRef]
- Rashid, H.M.A.; Sardar, A.; Ismail, A. Geotechnical characterization of bentonite-fly ash mixtures for their application as landfill liner in Pakistan. Arab. J. Geosci. 2021, 14, 1307. [Google Scholar] [CrossRef]
- Deepak, M.; Rohini, S.; Harini, B.; Ananthi, G.B.G. Influence of fly-ash on the engineering characteristics of stabilised clay soil. Mater. Today Proc. 2021, 37 Pt 2, 2014–2018. [Google Scholar] [CrossRef]
- Alehyen, S.; Achouri, M.E.L.; Taibi, M. Characterization, microstructure and properties of fly ash-based geopolymer. J. Mater. Environ. Sci. 2017, 8, 1783–1796. [Google Scholar]
- Titova, I.; Vladimir, V. The history and development of the classification system for the construction industry. Constr. Unique Build. Struct. 2020, 87, 20–29. (In Russian) [Google Scholar]
- Rambabu, D.; Sharma, S.K.; Akbar, M.A. Properties Exhibited by Nanomaterial Based Geopolymers: A Review. J. Inorg. Organomet. Polym. Mater. 2023, 33, 1081–1118. [Google Scholar] [CrossRef]
- Guo, X.; Shi, H.; Dick, W.A. Compressive strength and microstructural characteristics of class C fly ash geopolymer. Cem. Concr. Compos. 2010, 32, 142–147. [Google Scholar] [CrossRef]
- Sajan, P.; Jiang, T.; Lau, C.; Tan, G.; Ng, K. Combined effect of curing temperature, curing period and alkaline concentration on the mechanical properties of fly ash-based geopolymer. Clean. Mater. 2021, 1, 100002. [Google Scholar] [CrossRef]
- Kutchko, B.G.; Kim, A.G. Fly ash characterization by SEM–EDS. Fuel 2006, 85, 2537–2544. [Google Scholar] [CrossRef]
- Rees, C.A.; Provis, J.L.; Lukey, G.C.; van Deventer, J.S.J. In Situ ATR-FTIR Study of the Early Stages Geopolymer Gel Formation. Langmuir 2007, 23, 9076–9082. [Google Scholar] [CrossRef]
- Abdullah, M.M.A.; Hussin, K.; Bnhussain, M.; Ismail, K.N.; Ahmad, M.I. Chemical reactions in the geopolymerisation process using fly ash–based geopolymer: A review. Aust. J. Basic Appl. Sci. 2011, 5, 1199–1203. Available online: https://www.researchgate.net/publication/287952700 (accessed on 15 June 2023).
- Thokchom, S.; Ghosh, S.; Ghosh, P. Effect of water absorption, porosity and sorptivity on durability of geopolymer mortars. ARPN J. Eng. Appl. Sci. 2009, 4, 28–32. Available online: https://www.researchgate.net/publication/237215851 (accessed on 18 June 2023).
Figure 1.
Geopolymer samples.

Figure 2.
Study materials: (a) fly ash, (b) sodium hydroxide pellets, (c) waste polystyrene, and (d) geopolymer molds.
Figure 2.
Study materials: (a) fly ash, (b) sodium hydroxide pellets, (c) waste polystyrene, and (d) geopolymer molds.

Figure 3.
Flow diagram of the study’s methodology.

Figure 4.
Study materials: (a) pulverizing machine, (b) polystyrene, (c) geopolymer paste, (d) mold, (e) paste mold, and (f) UCS testing machine.
Figure 4.
Study materials: (a) pulverizing machine, (b) polystyrene, (c) geopolymer paste, (d) mold, (e) paste mold, and (f) UCS testing machine.
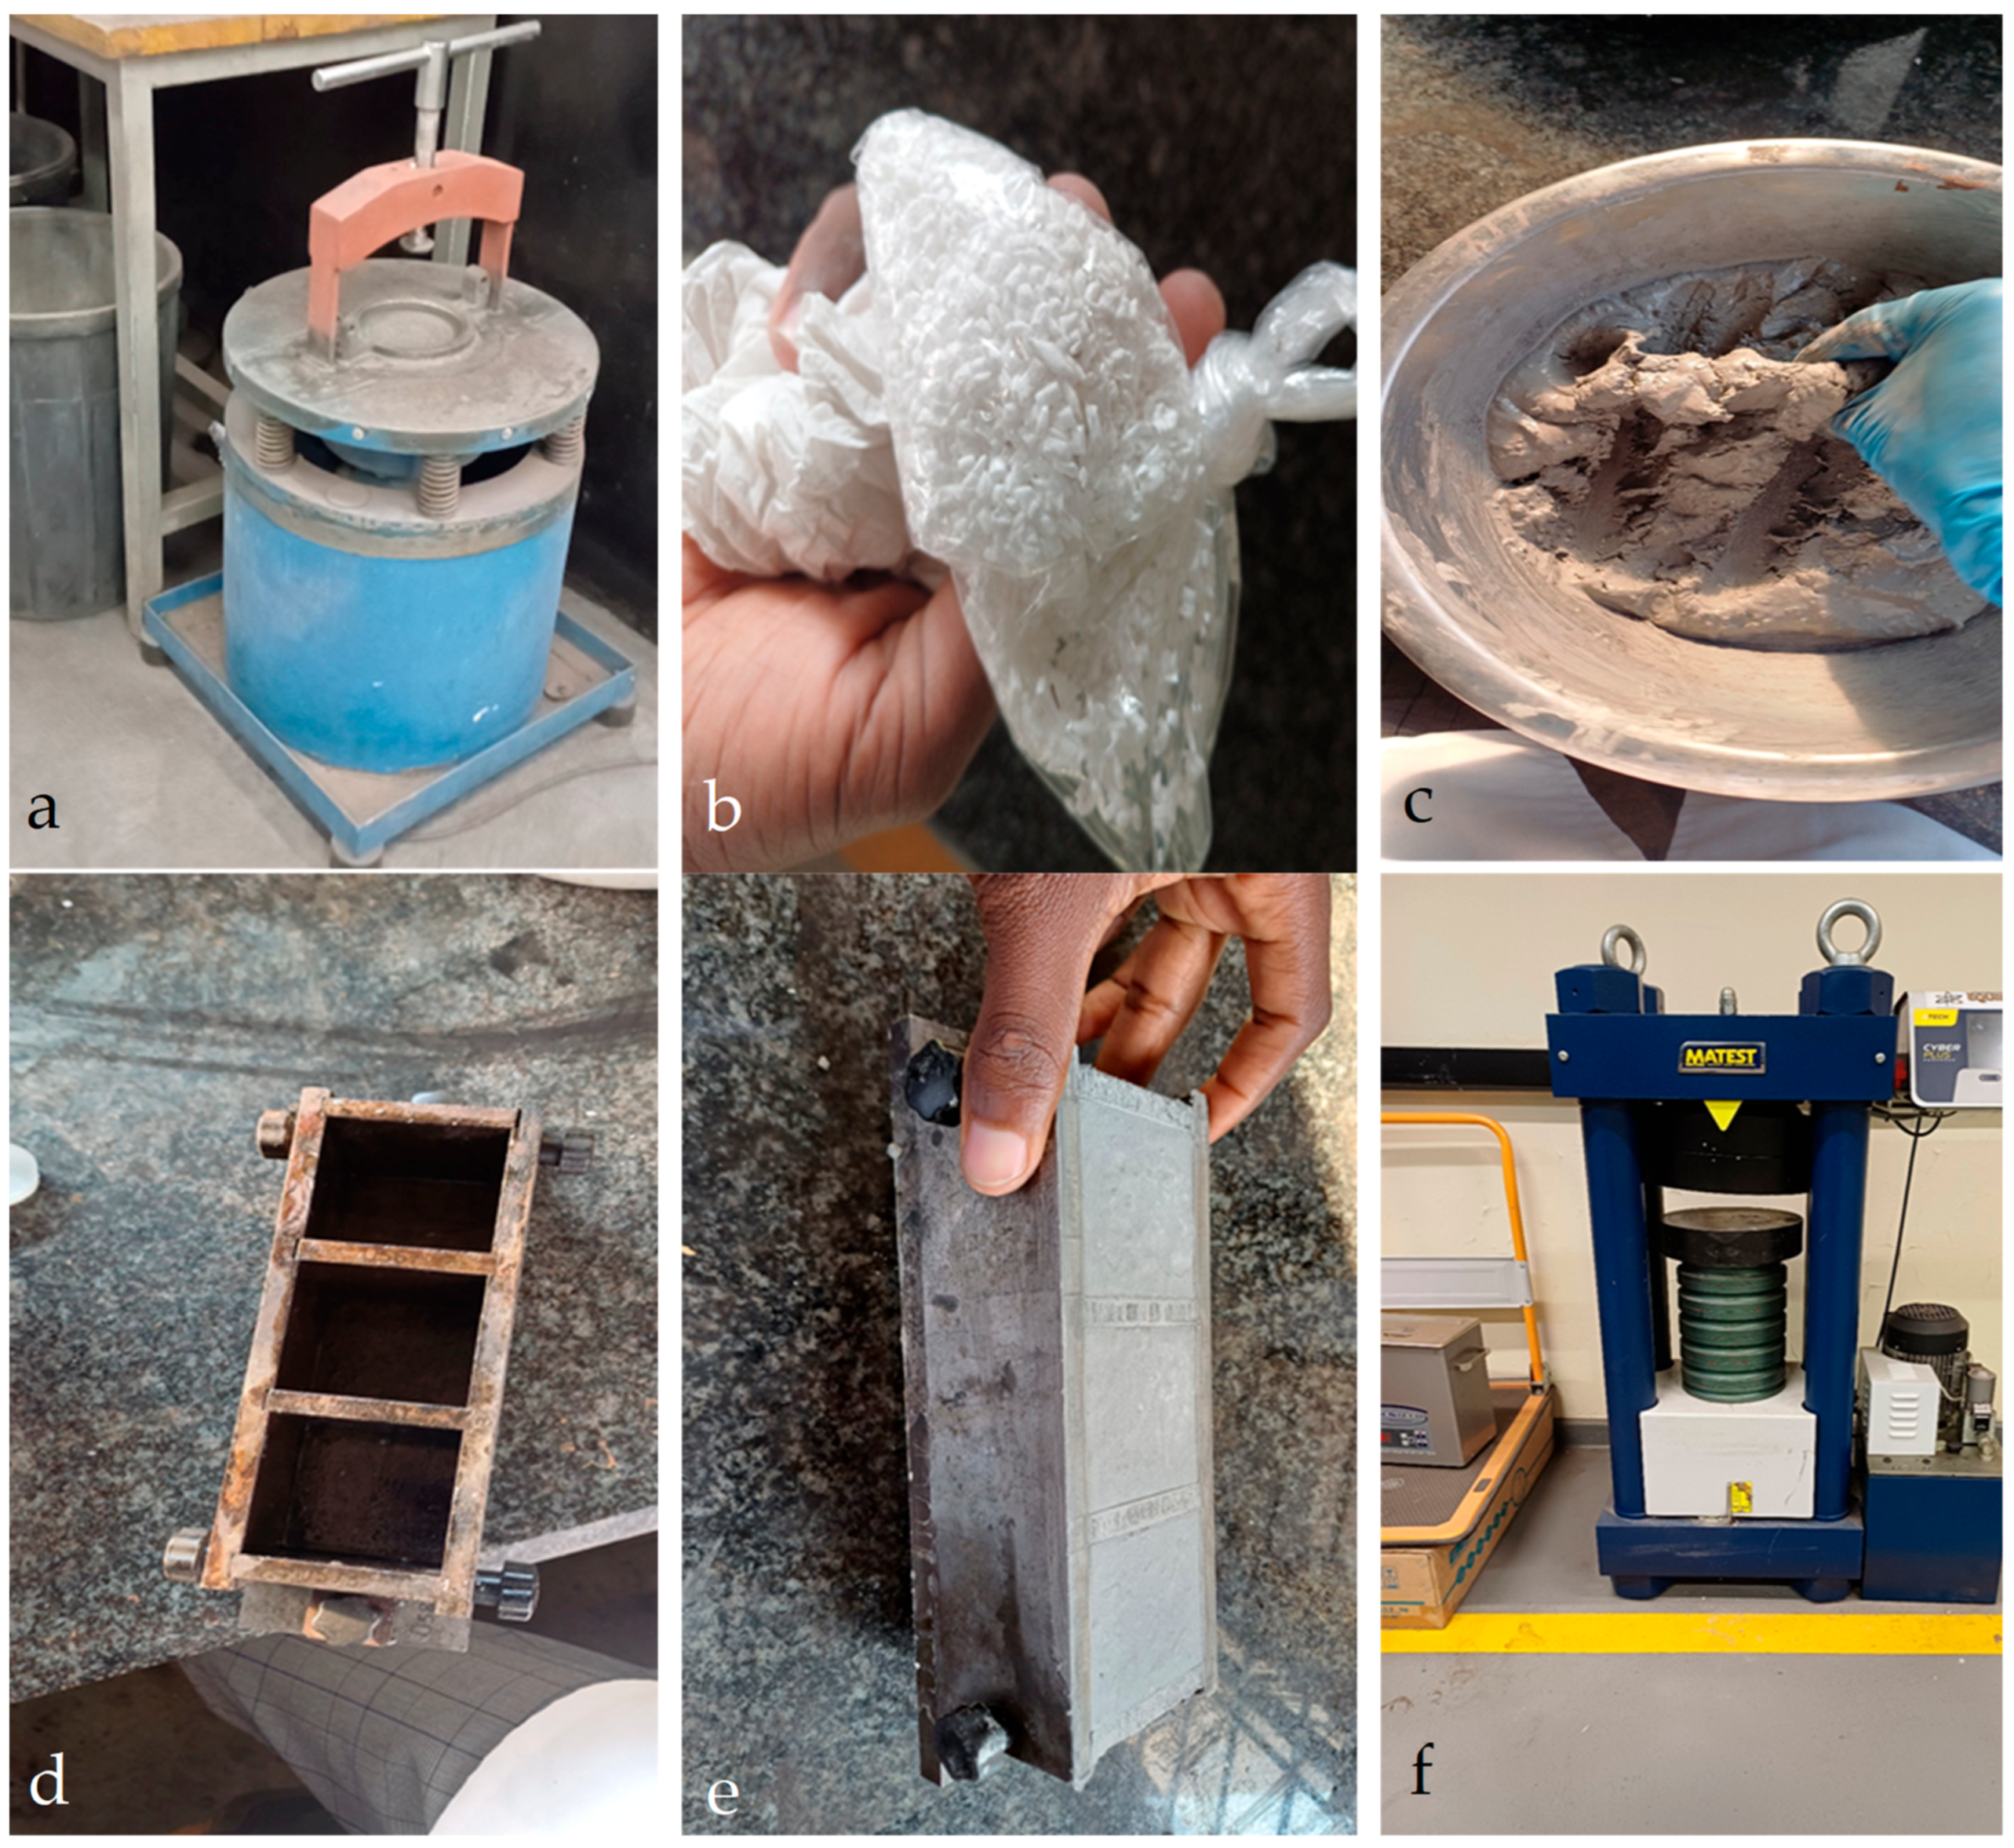
Figure 5.
UCS results for the varied sodium hydroxide samples.

Figure 6.
UCS results for the varied polystyrene concentration samples.

Figure 7.
XRD results for the varied sodium hydroxide samples cured at 100 °C.
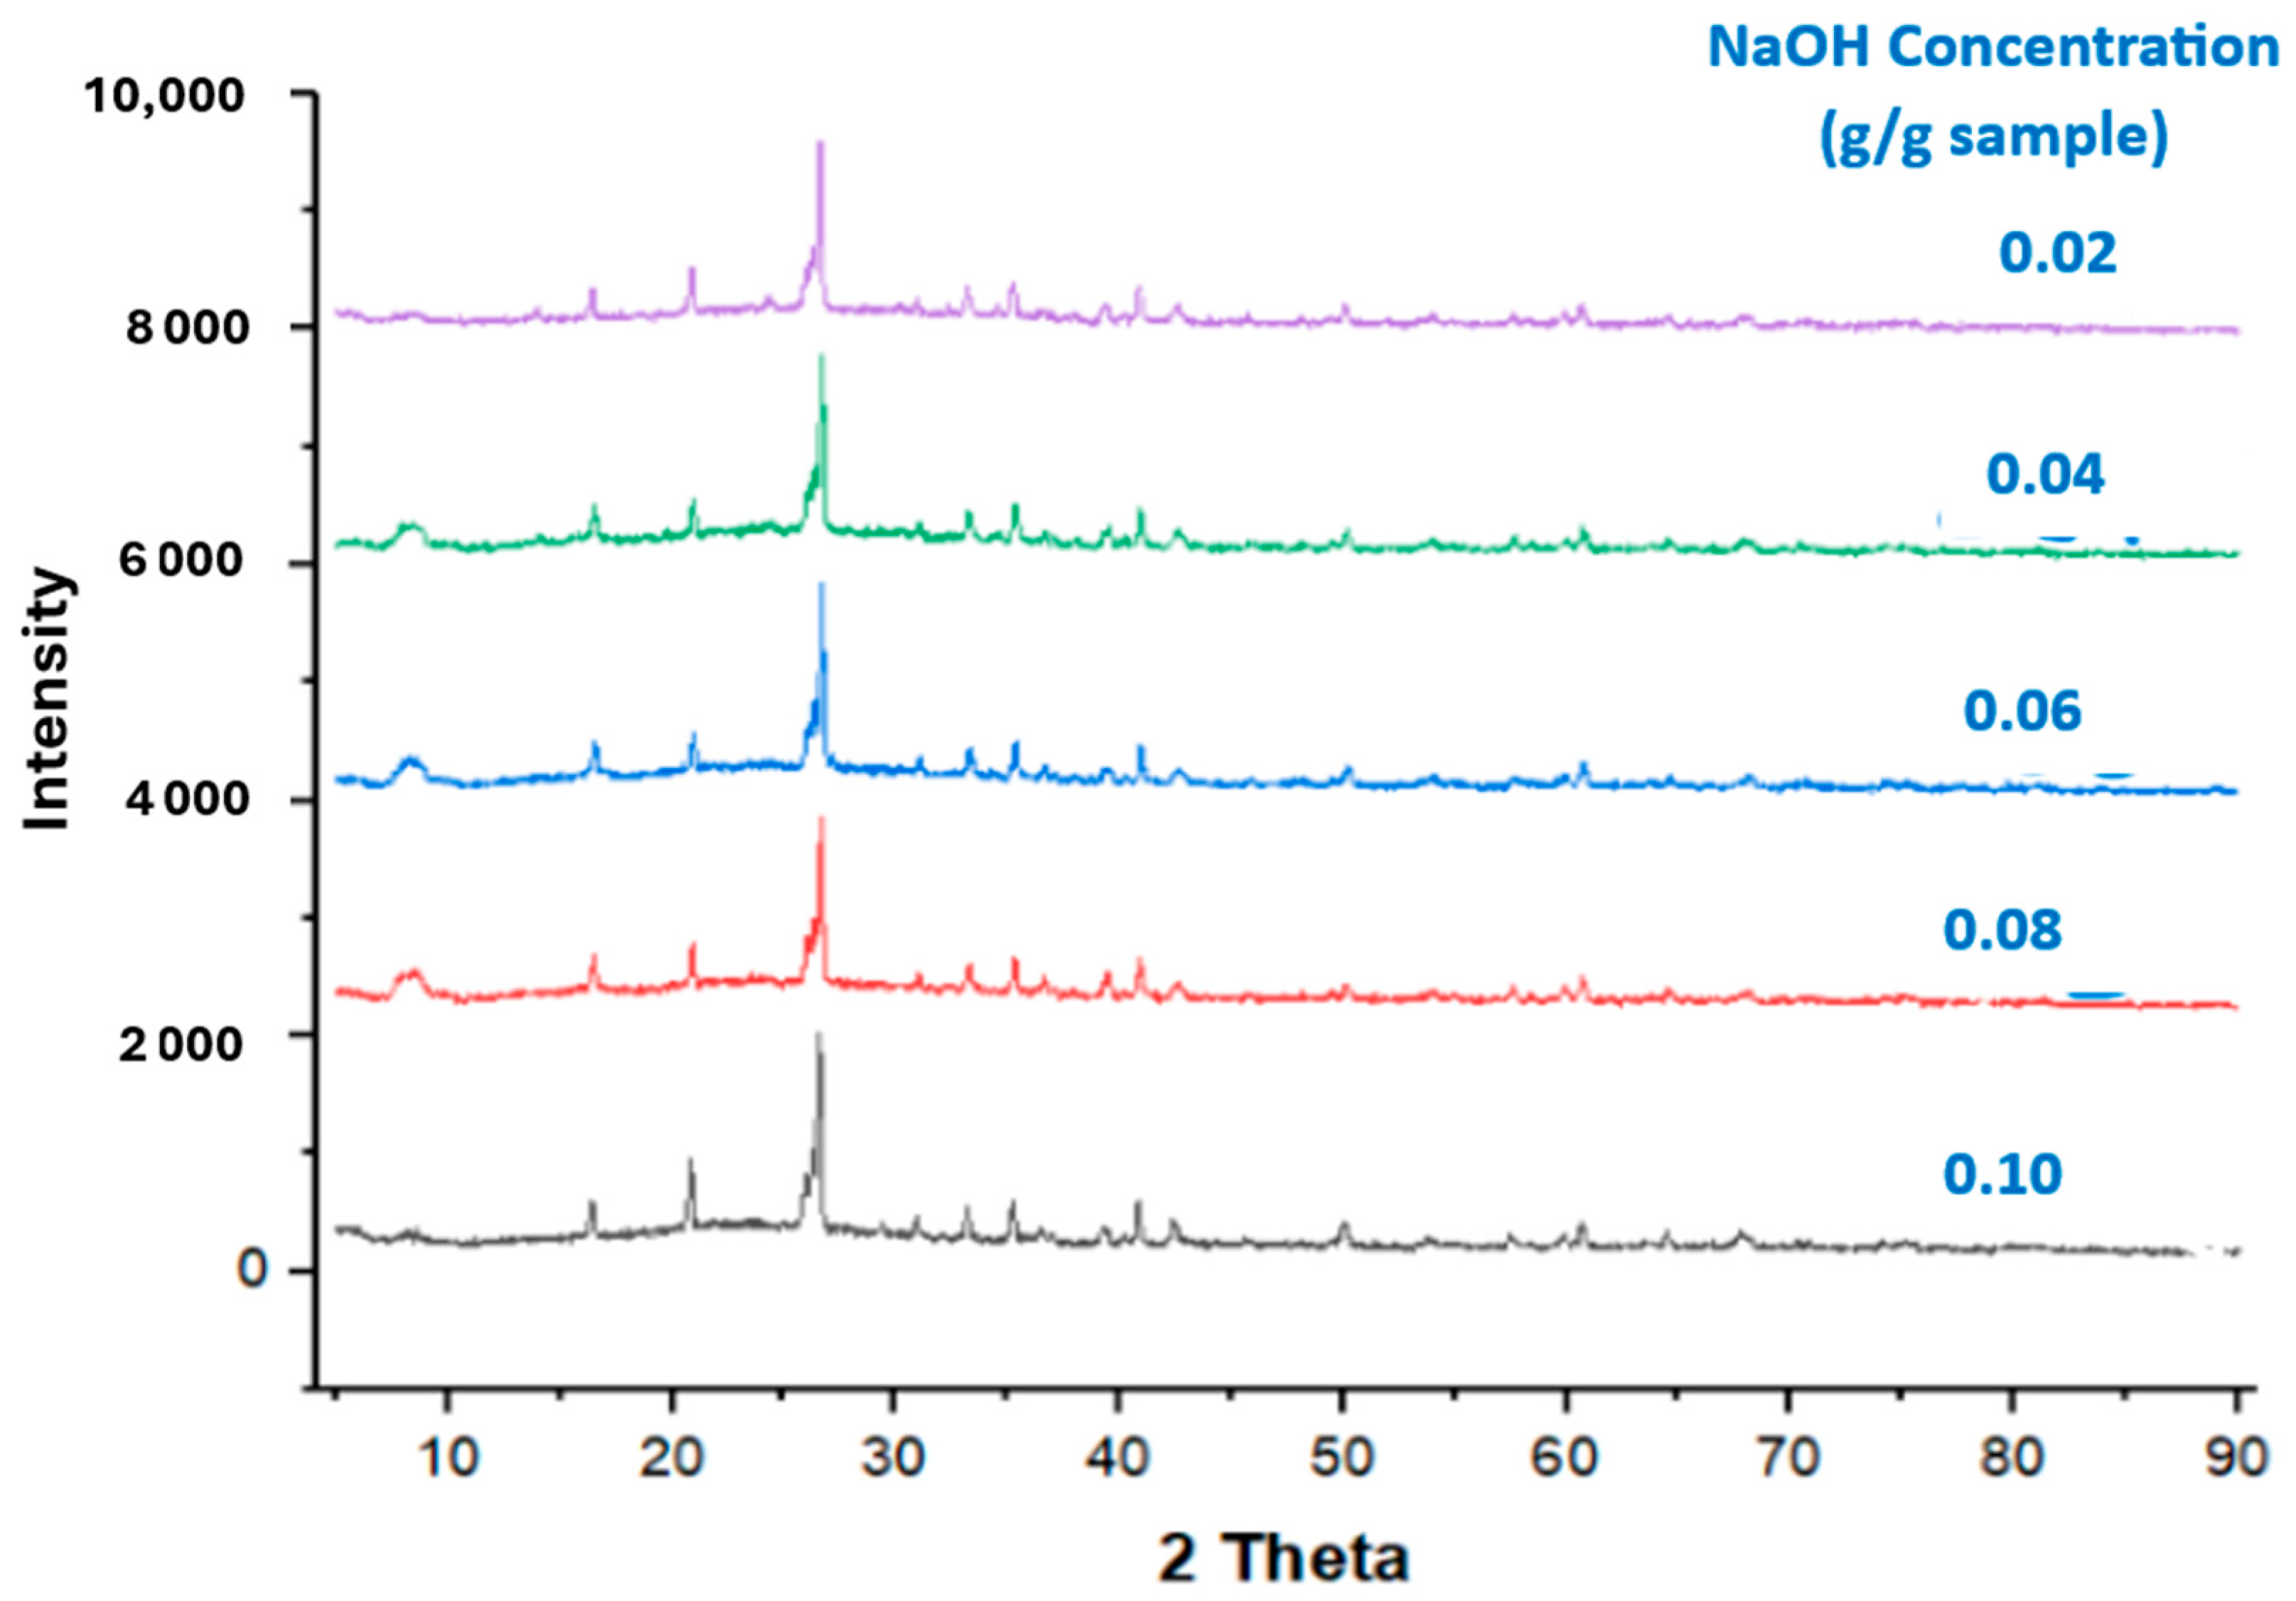
Figure 8.
XRD results for 0.08 g sodium hydroxide/g sample sodium hydroxide concentration geopolymer cured at 100 °C.
Figure 8.
XRD results for 0.08 g sodium hydroxide/g sample sodium hydroxide concentration geopolymer cured at 100 °C.

Figure 9.
XRD results for 0.01 g polystyrene/g sample polystyrene concentration geopolymer cured at 100 °C.
Figure 9.
XRD results for 0.01 g polystyrene/g sample polystyrene concentration geopolymer cured at 100 °C.
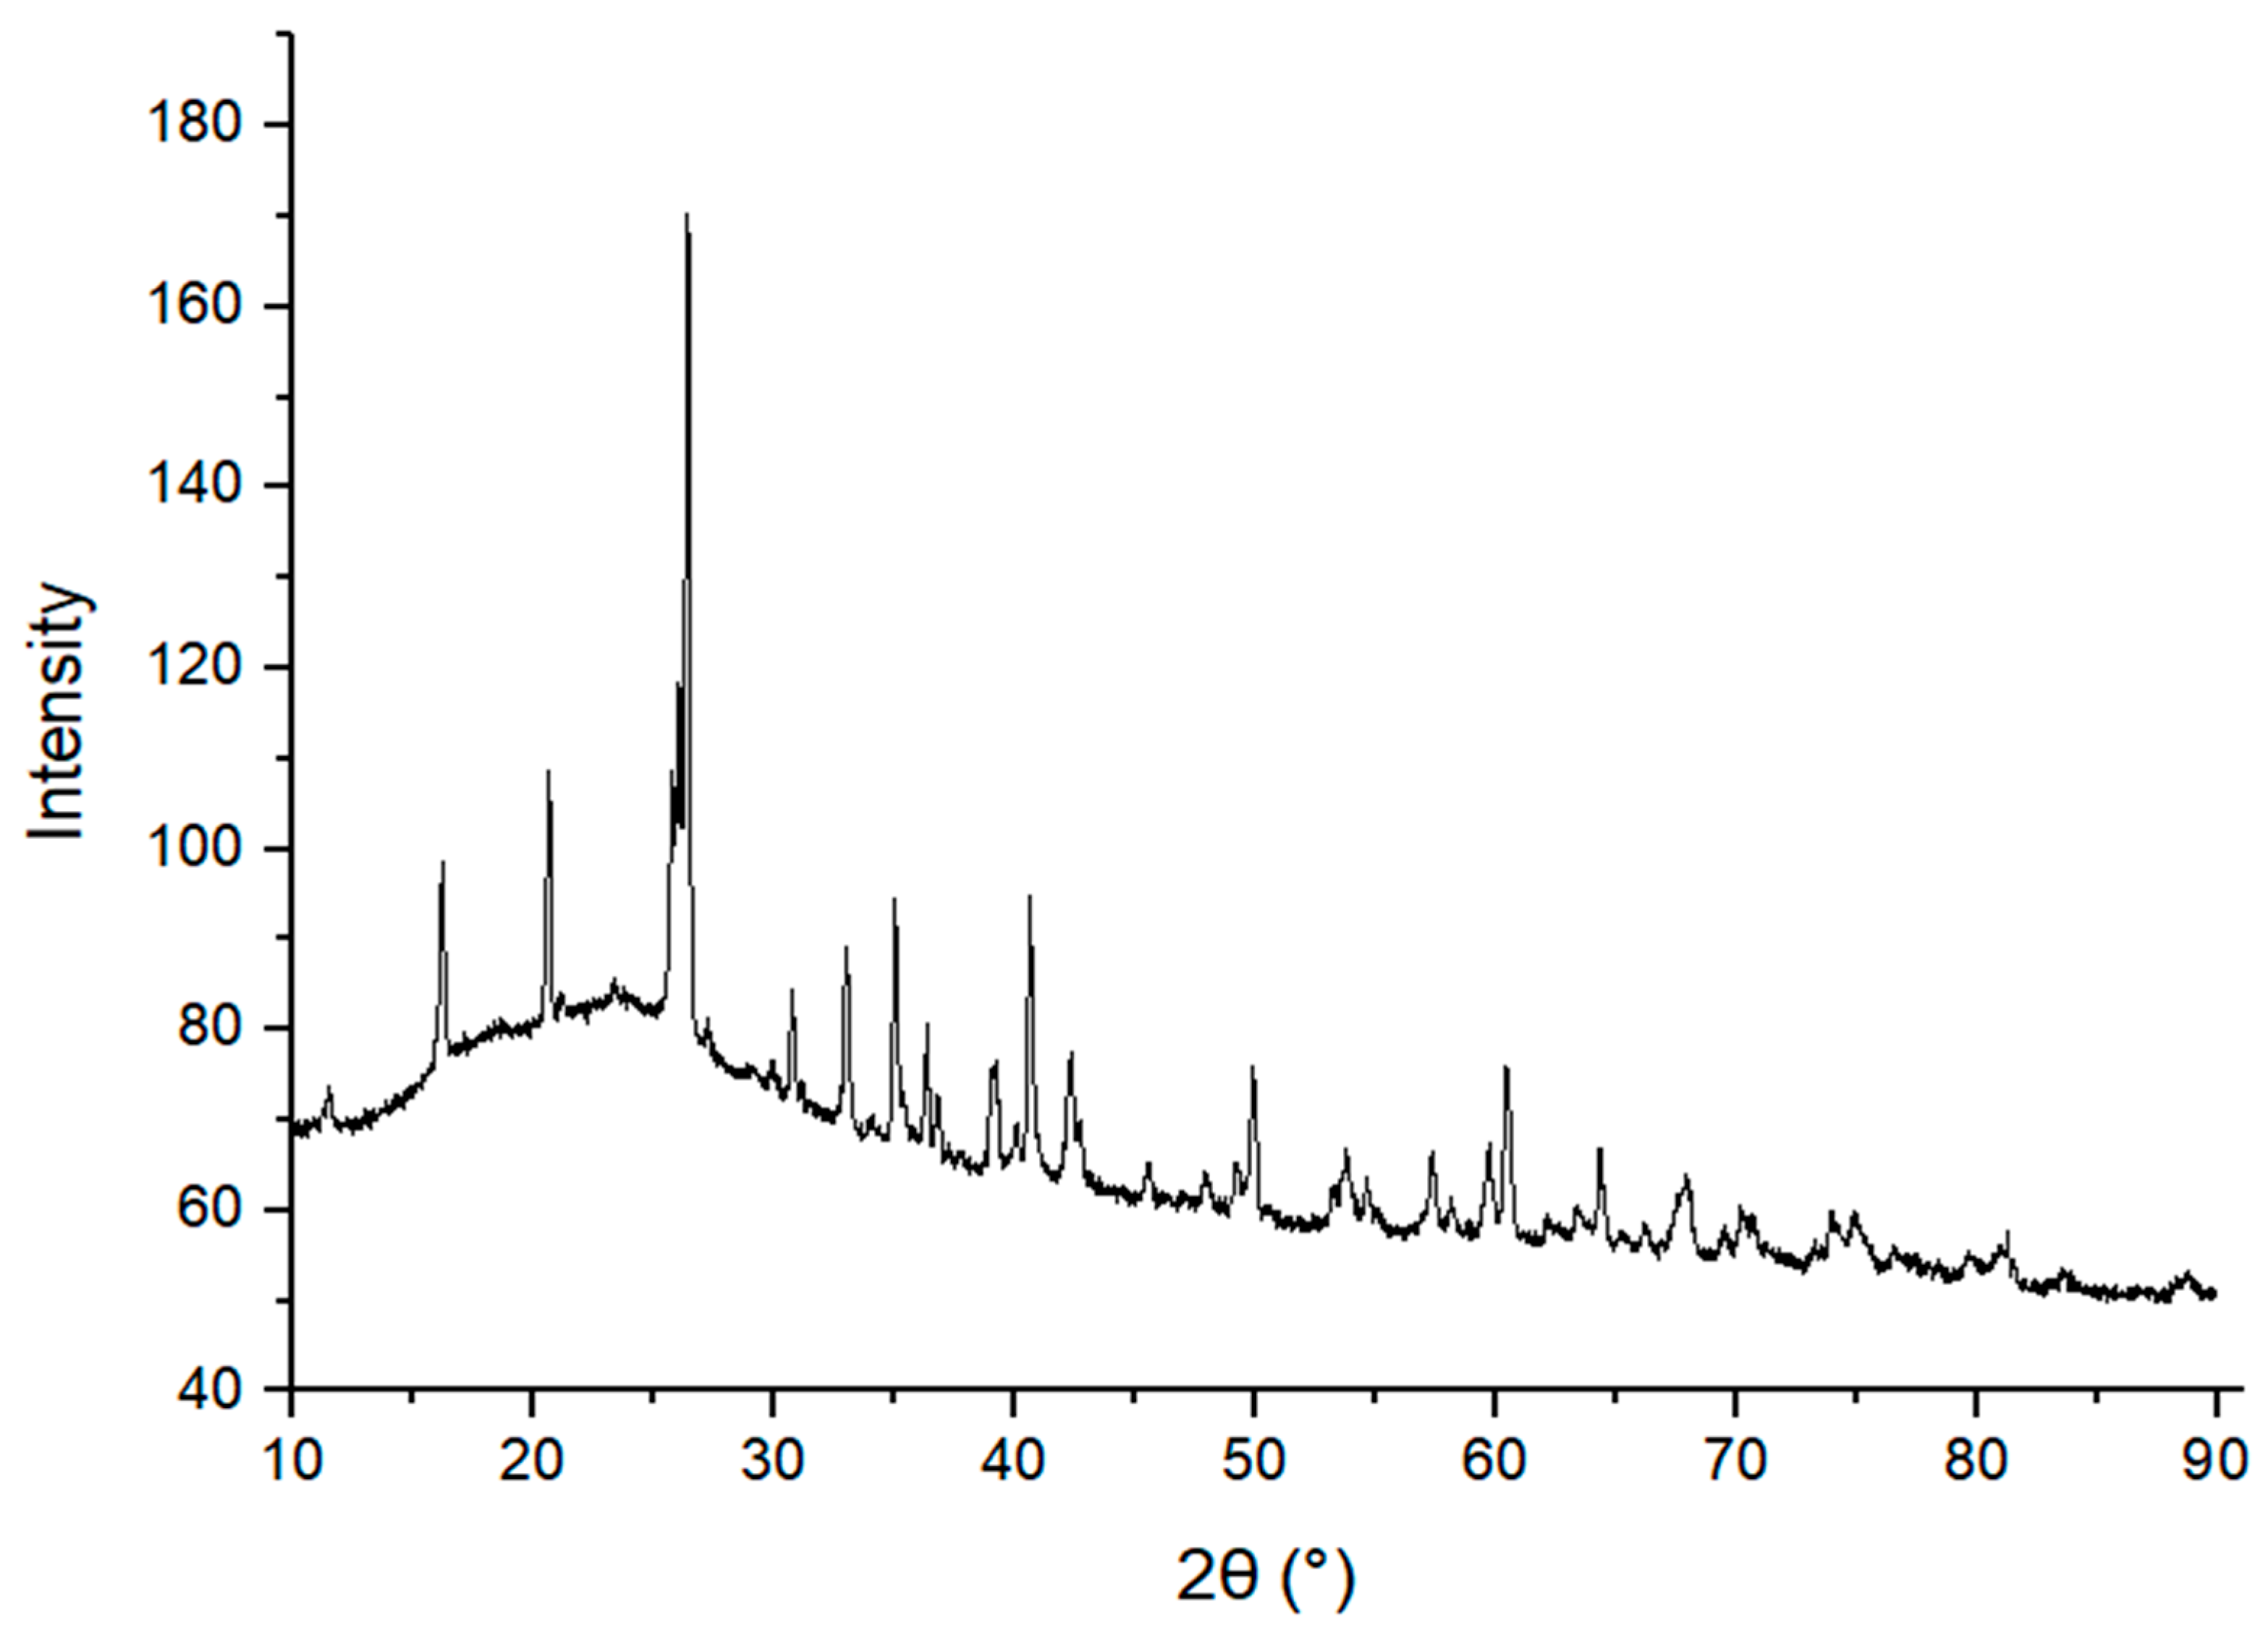
Figure 10.
SEM results for 0.08 g sodium hydroxide/g sample sodium hydroxide concentration geopolymer cured at 100 °C.
Figure 10.
SEM results for 0.08 g sodium hydroxide/g sample sodium hydroxide concentration geopolymer cured at 100 °C.
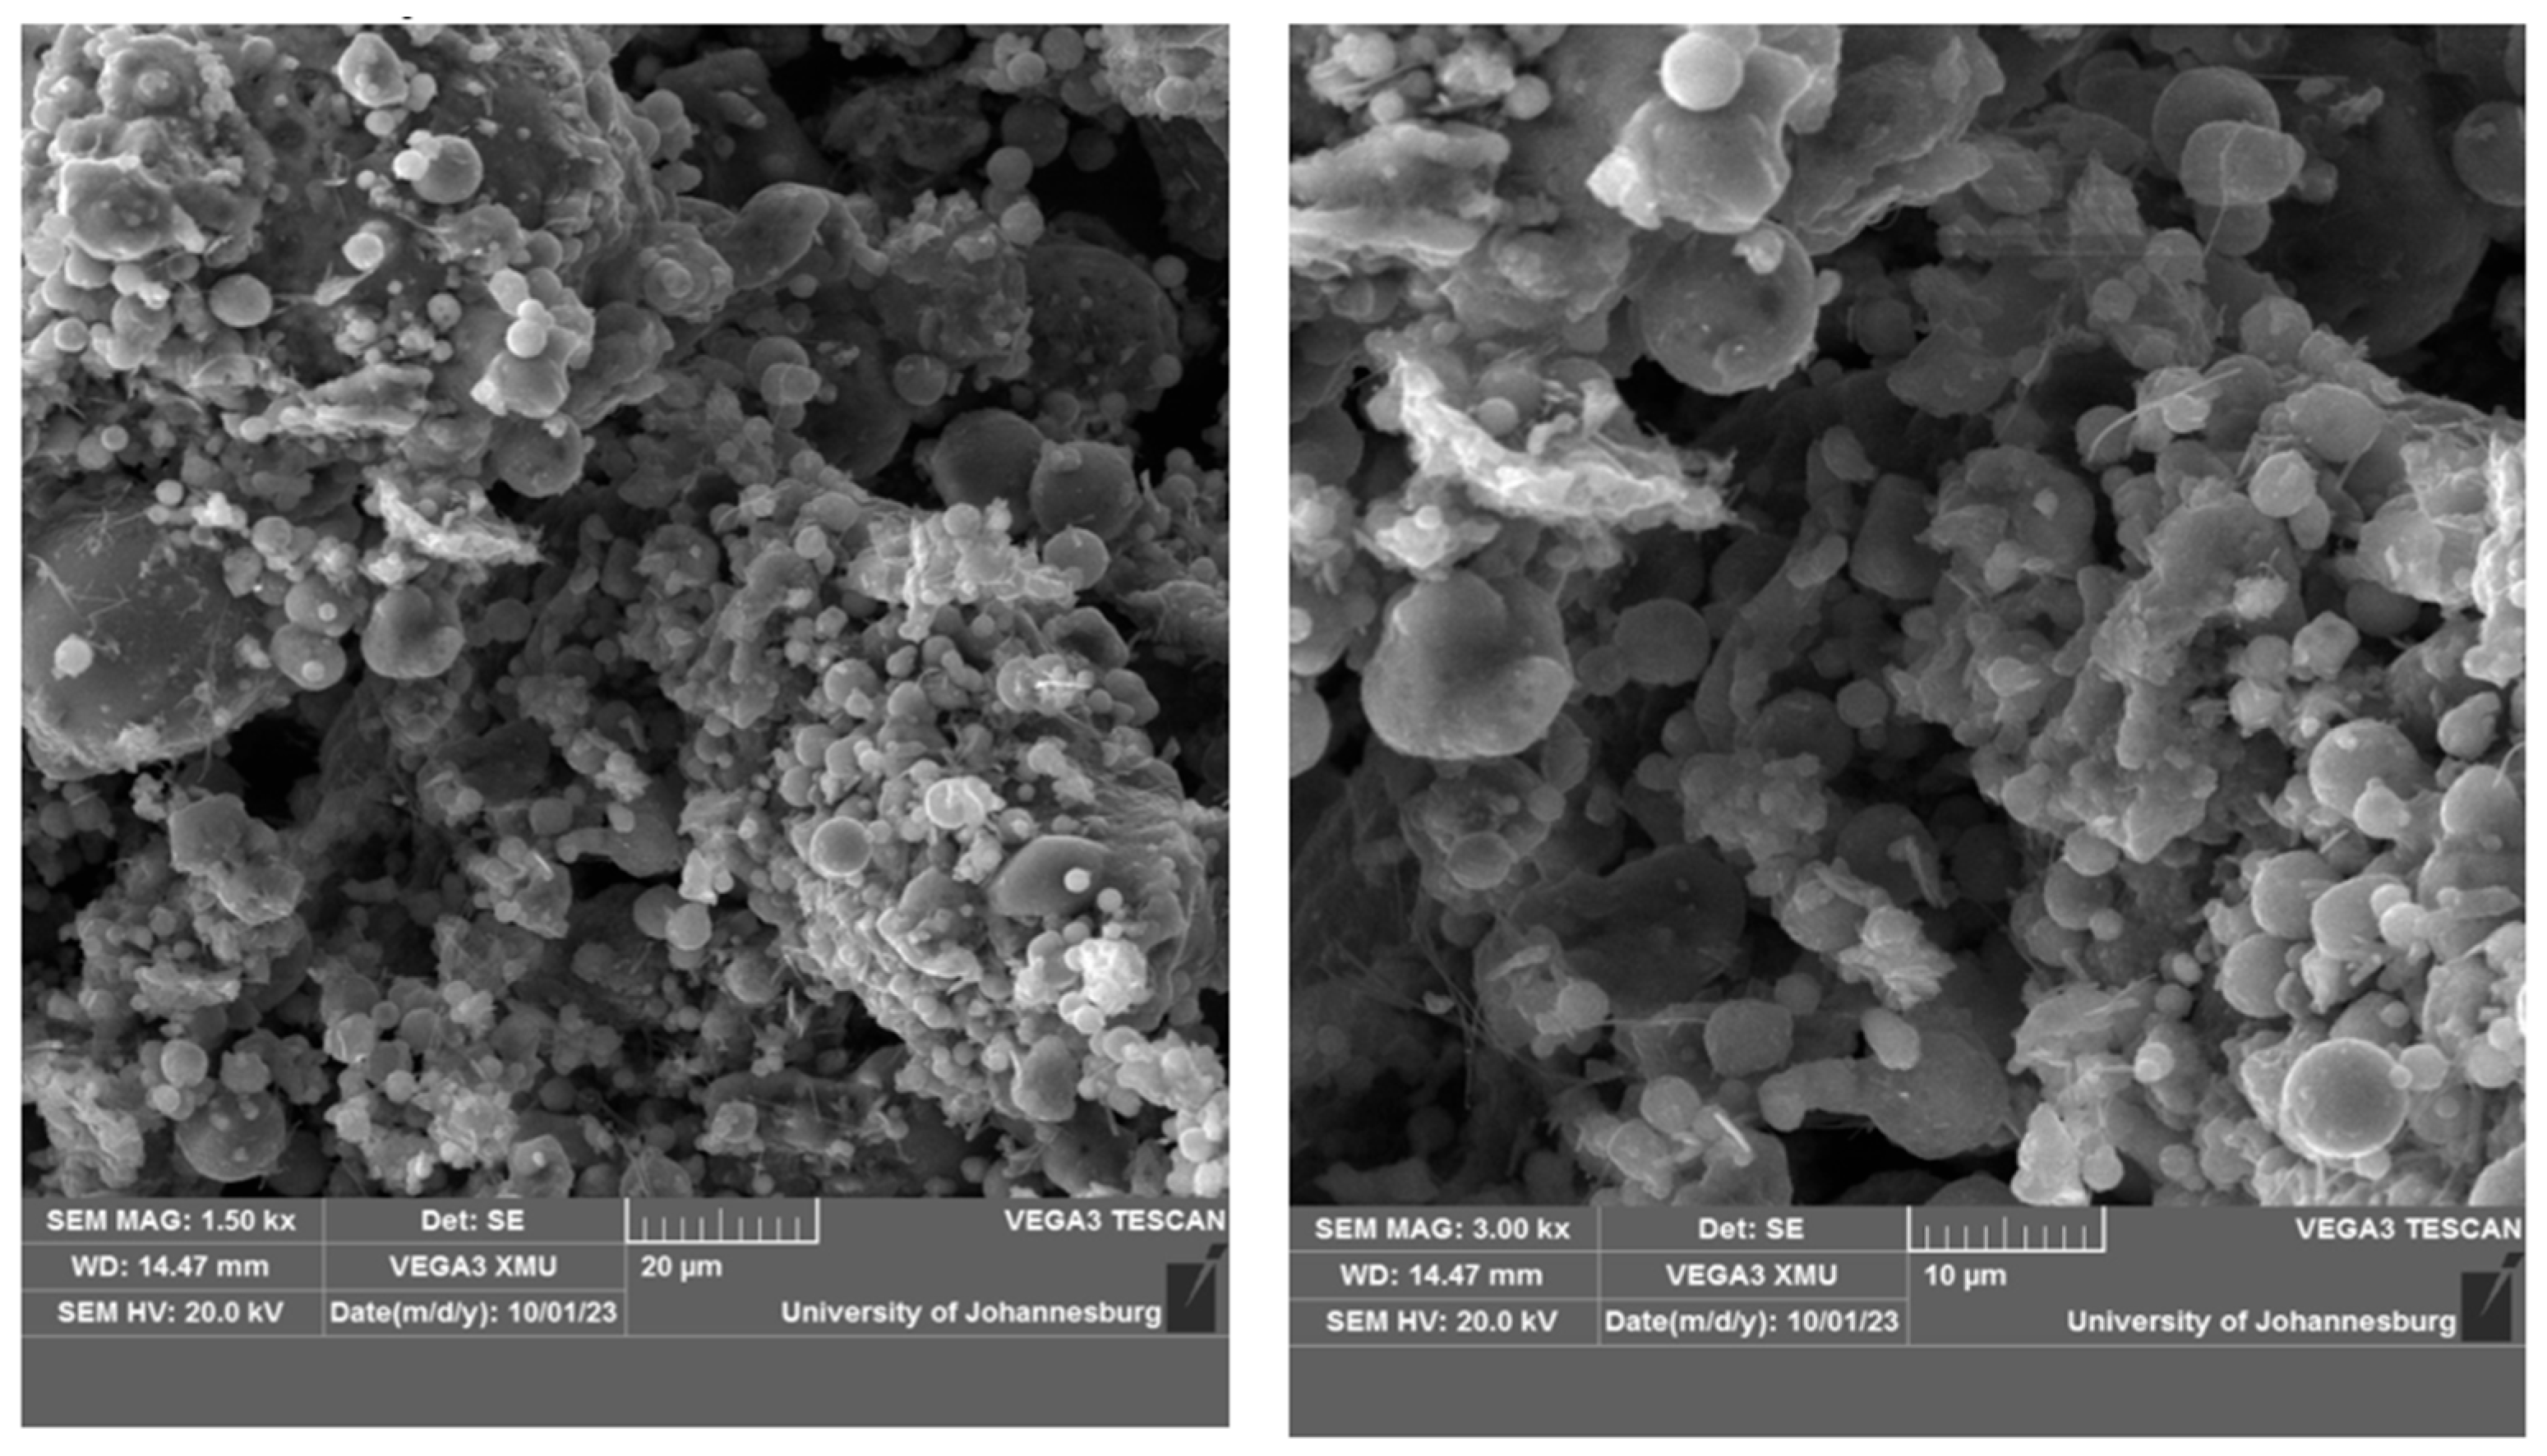
Figure 11.
SEM results for 0.01 g polystyrene/g sample polystyrene concentration geopolymer cured at 100 °C.
Figure 11.
SEM results for 0.01 g polystyrene/g sample polystyrene concentration geopolymer cured at 100 °C.
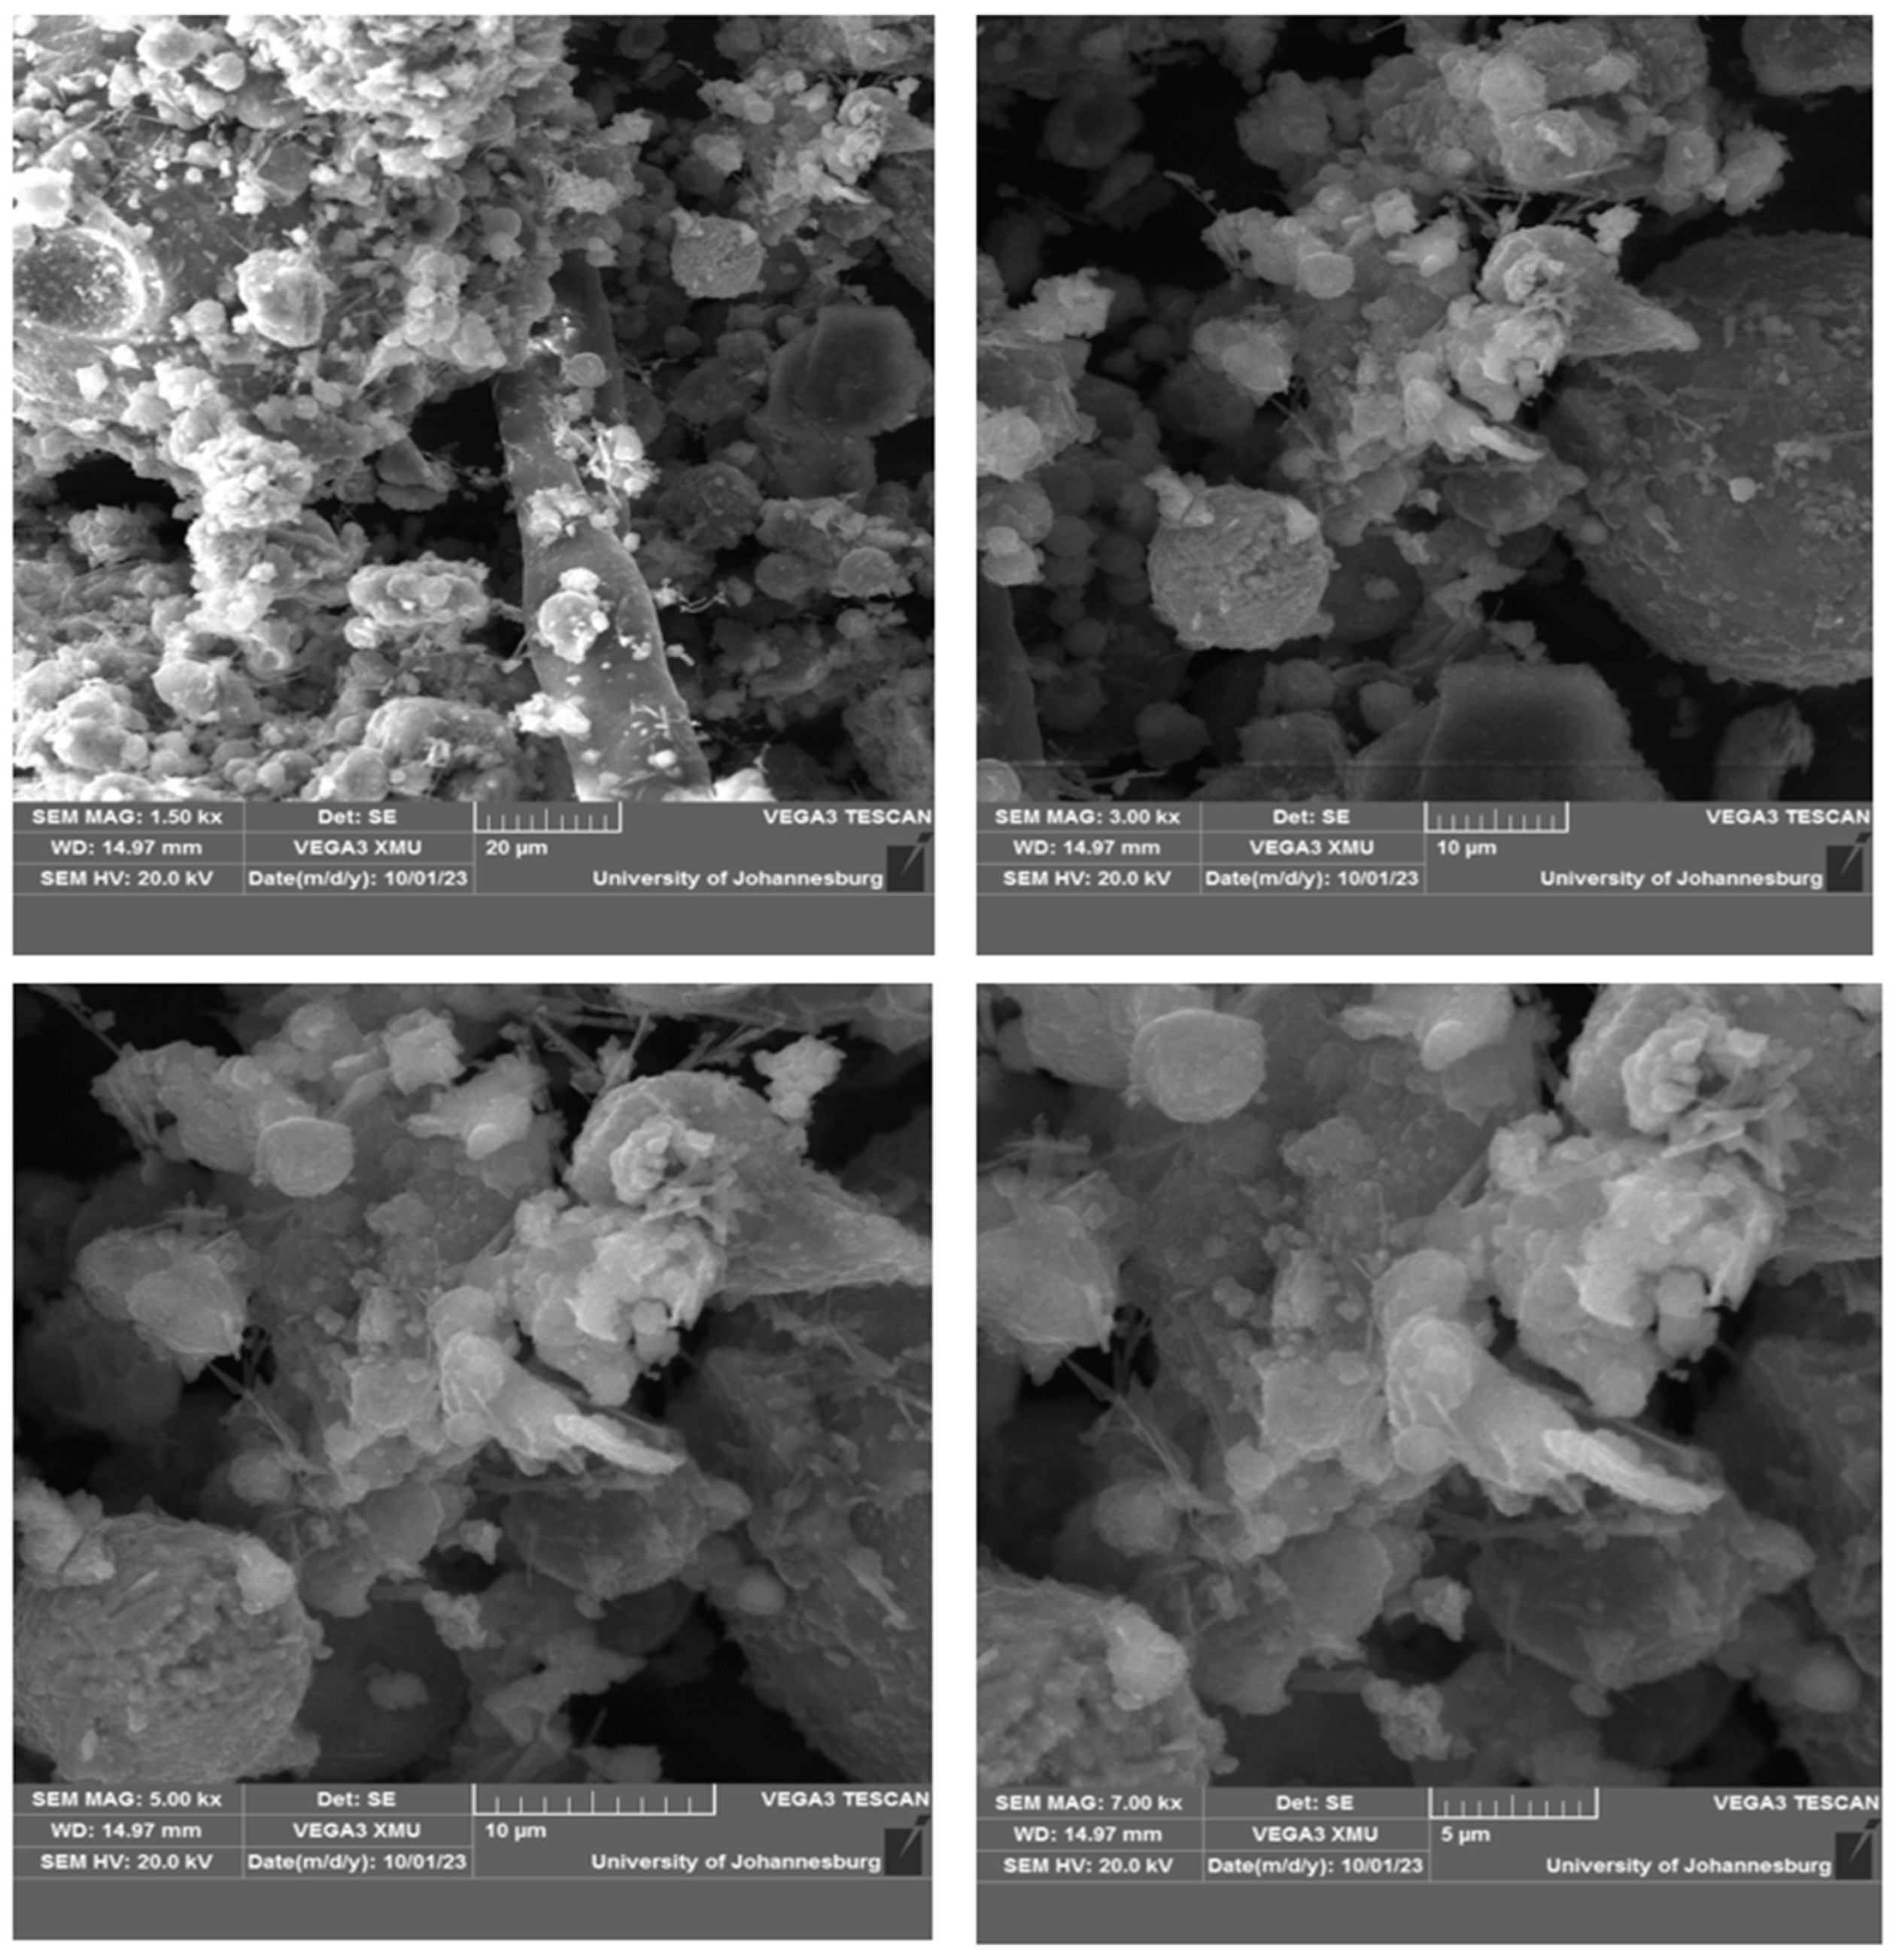
Figure 12.
FTIR for varied sodium hydroxide samples cured at 100 °C.
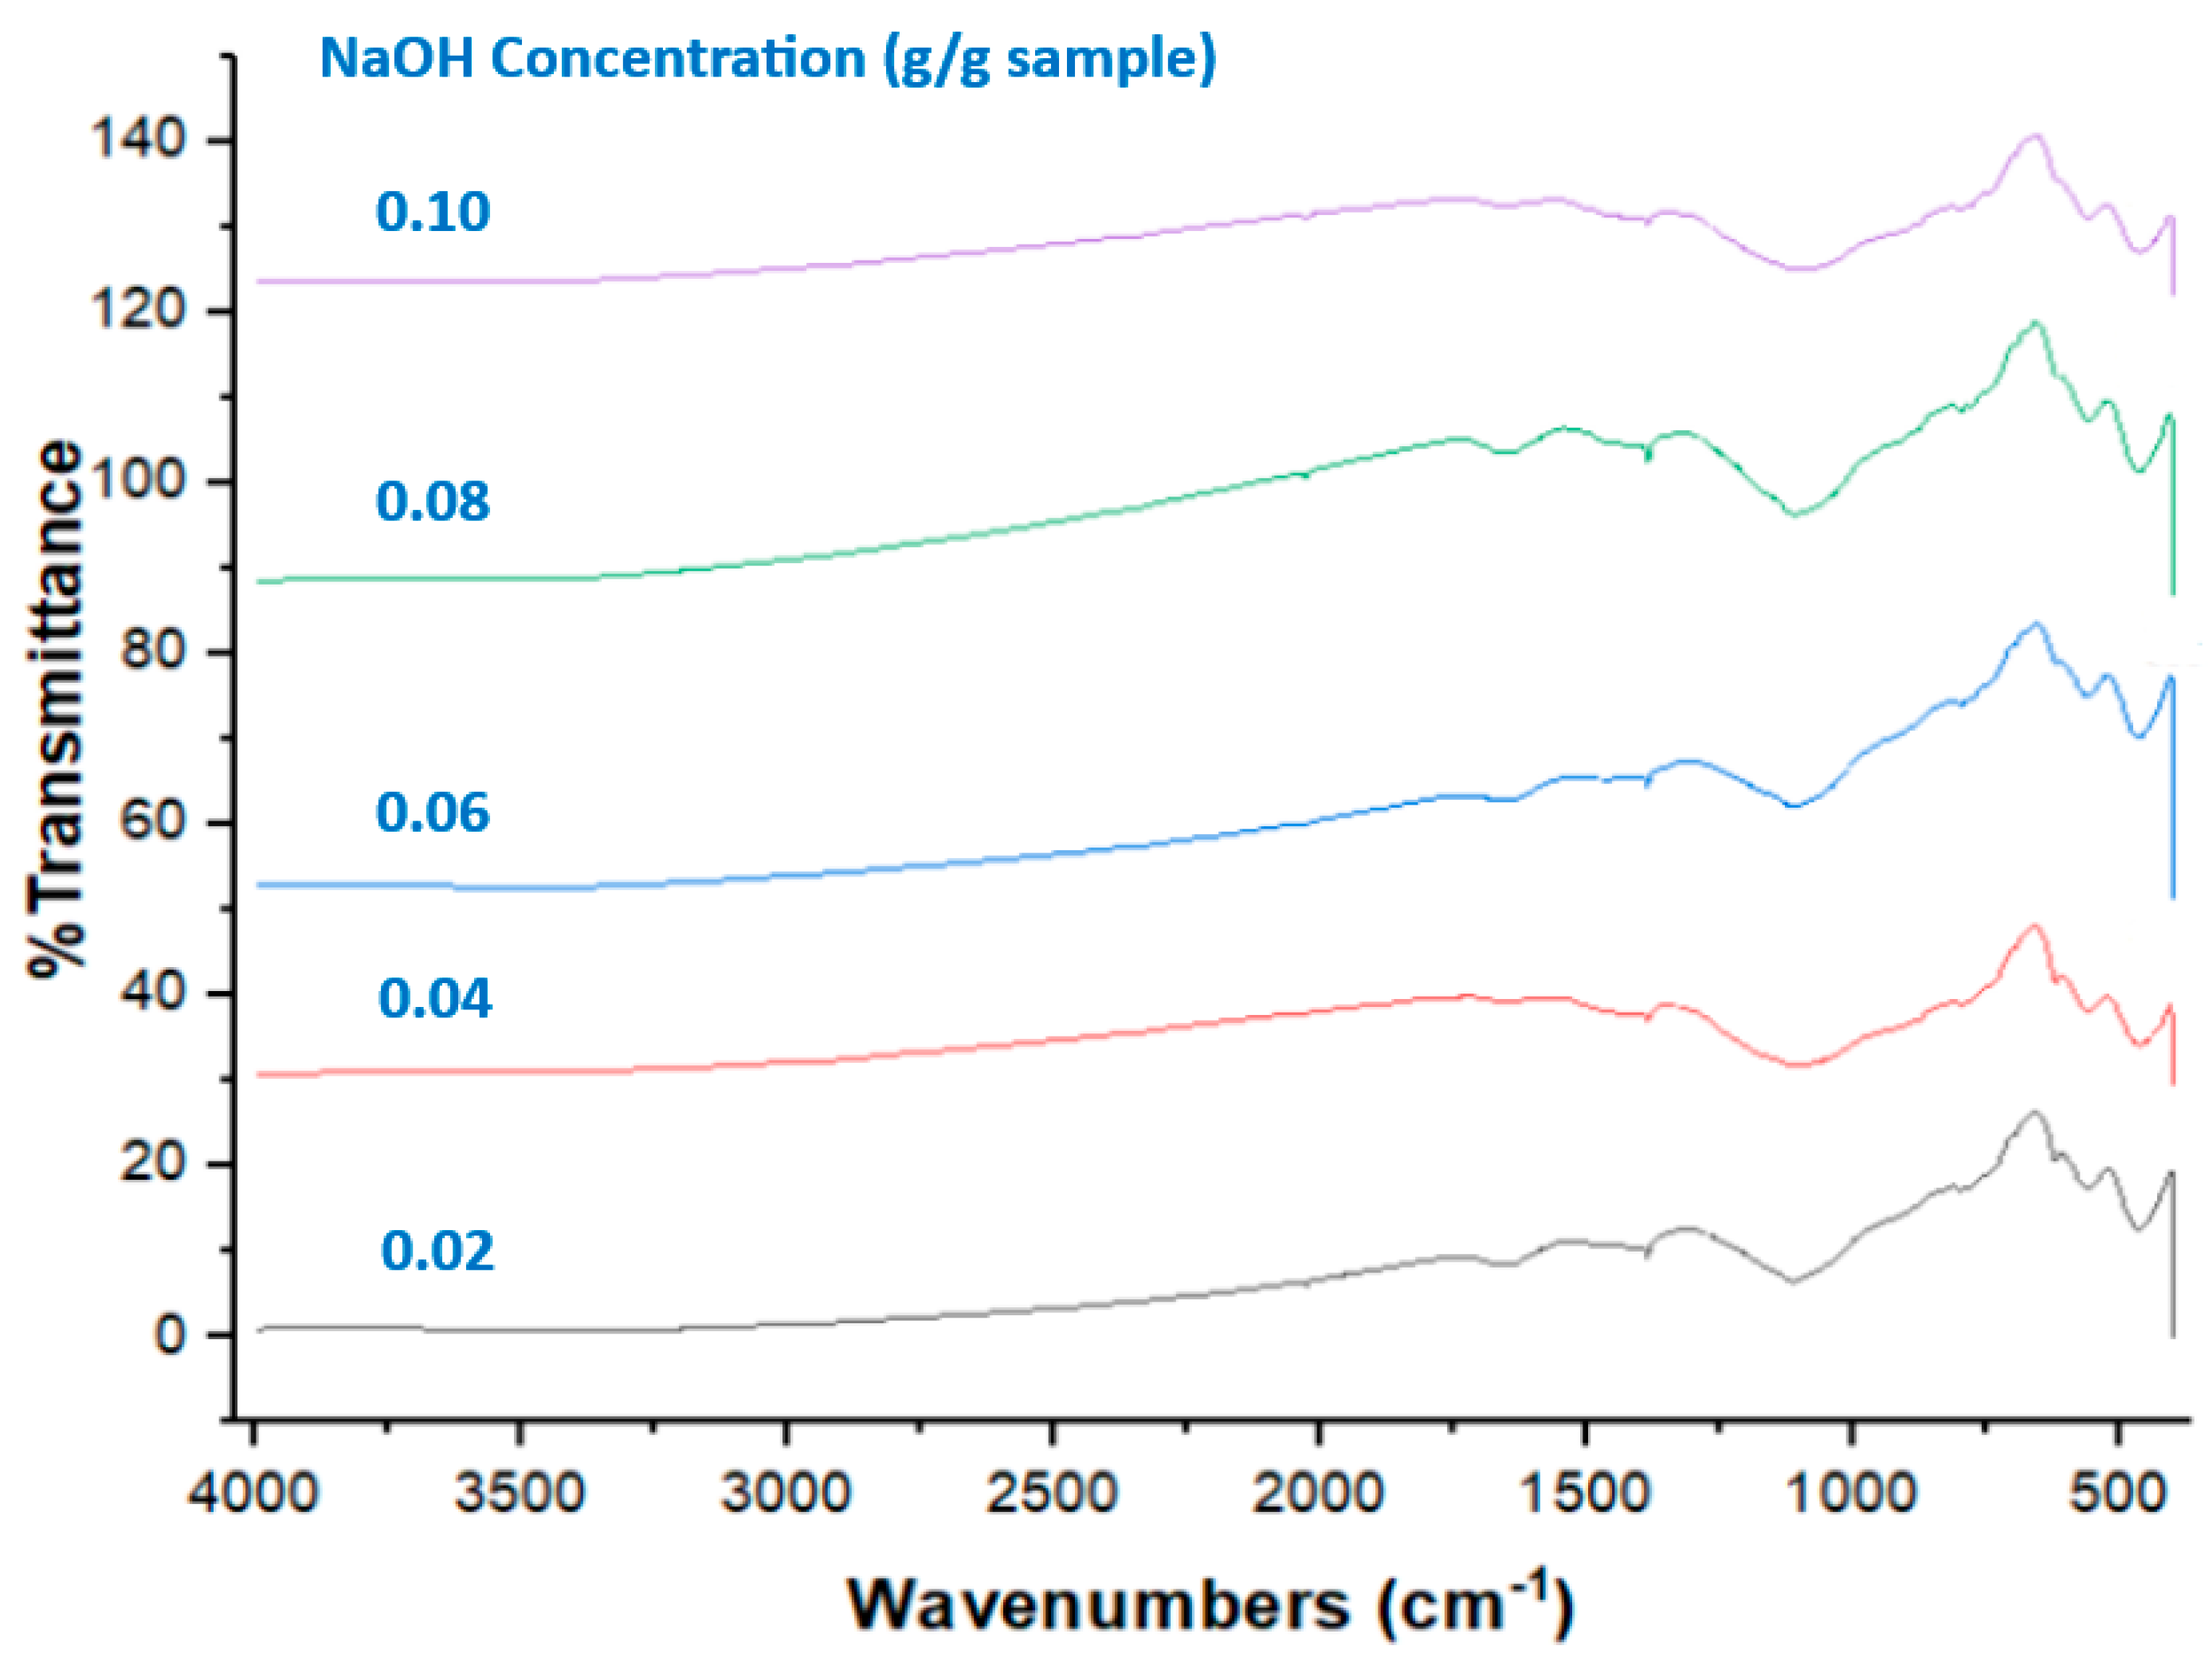
Figure 13.
Density trend for varied sodium hydroxide samples cured at 100 °C.

Figure 14.
Density trend for varied polystyrene samples cured at 60 °C.

Table 1.
Geopolymer sample specifications.
| NaOH Concentration (g/g Sample) | Fly Ash (g) | Water (g) | NaOH (g) | Polystyrene Concentration (g/g Sample) | Fly Ash (g) | Water (g) | NaOH (g) | Polystyrene (g) |
|---|---|---|---|---|---|---|---|---|
| 0.02 | 300 | 110 | 8.5 | 0.01 | 400 | 200 | 52.5 | 6.7 |
| 0.04 | 300 | 110 | 17.2 | 0.02 | 400 | 200 | 52.5 | 13.5 |
| 0.06 | 300 | 110 | 26.5 | 0.03 | 400 | 200 | 52.5 | 20.5 |
| 0.08 | 300 | 110 | 36 | 0.04 | 400 | 200 | 52.5 | 27.5 |
| 0.10 | 300 | 110 | 47 | 0.05 | 400 | 200 | 52.5 | 34.5 |
| 0.06 | 400 | 200 | 52.5 | 42 |
Table 2.
XRF results of fly ash.
| Component | Composition (%) |
|---|---|
| 0.2219 | |
| MgO | 9.6648 |
| 6.4166 | |
| 38.1873 | |
| 0.1350 | |
| 2.6967 | |
| Cl | 0.0555 |
| 1.0861 | |
| 9.5524 | |
| 1.1964 | |
| 6.5742 | |
| 0.2424 | |
| 23.2966 | |
| 0.3990 | |
| 0.1302 | |
| 0.0500 | |
| 0.0106 | |
| 0.0521 | |
| 0.0323 |
Table 3.
Atterberg results for fly ash.
| Liquid Limit (LL) | Plastic Limit (PL) | Plastic Index (PI) |
|---|---|---|
| 49% | 26% | 23% |
Table 4.
Water absorption test results for varied sodium hydroxide samples cured at 100 °C.
| Sodium Hydroxide Concentration (g/g Sample) | (g) | (g) | Water Absorption (%) |
|---|---|---|---|
| 0.02 | 144.30 | 165.73 | 14 |
| 0.04 | 156.54 | 173.89 | 11 |
| 0.06 | 166.80 | 181.03 | 8.53 |
| 0.08 | 169.62 | 176.91 | 4.30 |
| 0.10 | 175.70 | 184.67 | 5.11 |
Table 5.
Water absorption test results for varied polystyrene samples cured at 60 °C.
| Polystyrene Concentration (g/g Sample) | (g) | Water Absorption (%) | |
|---|---|---|---|
| 0.01 | 161.27 | 177.70 | 10 |
| 0.02 | 129.36 | 143.65 | 11.05 |
| 0.03 | 127.58 | 141.75 | 11.11 |
| 0.04 | 121.20 | 135.55 | 11.84 |
| 0.05 | 98.87 | 112.30 | 13.58 |
| 0.06 | 91.29 | 105.78 | 15.87 |
Disclaimer/Publisher’s Note: The statements, opinions and data contained in all publications are solely those of the individual author(s) and contributor(s) and not of MDPI and/or the editor(s). MDPI and/or the editor(s) disclaim responsibility for any injury to people or property resulting from any ideas, methods, instructions or products referred to in the content. |
© 2024 by the authors. Licensee MDPI, Basel, Switzerland. This article is an open access article distributed under the terms and conditions of the Creative Commons Attribution (CC BY) license (https://creativecommons.org/licenses/by/4.0/).
Share and Cite
MDPI and ACS Style
Ncube, B.; Roopchund, R. Development of a Low-Density Waste-Based Geopolymer Construction Material. Buildings 2024, 14, 684. https://doi.org/10.3390/buildings14030684
AMA Style
Ncube B, Roopchund R. Development of a Low-Density Waste-Based Geopolymer Construction Material. Buildings. 2024; 14(3):684. https://doi.org/10.3390/buildings14030684
Chicago/Turabian StyleNcube, Brian, and Rishen Roopchund. 2024. "Development of a Low-Density Waste-Based Geopolymer Construction Material" Buildings 14, no. 3: 684. https://doi.org/10.3390/buildings14030684
Note that from the first issue of 2016, this journal uses article numbers instead of page numbers. See further details here.