Article

Innovative Closed Cavity Façades (CCF) with Inner Shading and Advanced Coatings for Enhancing Thermal Performance in the Tropics

by
Nedhal Al-Tamimi
1,
Ahmad Fadel Al Kahlout
2,
Abdultawab M. Qahtan
1,* and
Anas A. M. Alqanoo
3
1
Architectural Engineering Department, College of Engineering, Najran University, Najran 66246, Saudi Arabia
2
School of Housing, Building & Planning, Universiti Sains Malaysia, Gelugor 11800, Pinang, Malaysia
3
Physics Department, Islamic University of Gaza, Gaza P.O. Box 108, Palestine
*
Author to whom correspondence should be addressed.
Buildings 2024, 14(3), 603; https://doi.org/10.3390/buildings14030603
Submission received: 14 December 2023 / Revised: 30 January 2024 / Accepted: 1 February 2024 / Published: 24 February 2024
(This article belongs to the Section Building Energy, Physics, Environment, and Systems)

Abstract

:
In its simplest terms, a closed-cavity façade (CCF) is a sealed, unventilated enclosure equipped with motorized shading devices, internal double or triple glazing, and external single glazing. This technology effectively controls solar energy and daylight entry into buildings. This research aims to enhance the thermal efficiency of CCFs in tropical climates using Venetian blinds (VB) and advanced glass coatings. EnergyPlus and DesignBuilder were employed to assess various CCF designs and compare them to a single glazing unit (SGU) with grey coatings. This was inspired by a residential case study on Penang Island, Malaysia. The findings indicate that CCFs surpass SGUs in thermal performance and occupant comfort, particularly in Malaysia’s humid tropical climate. CCFs reduced operating temperatures by a monthly percentage ranging from 33.5% to 68.75% in all operations. On an annual basis, temperature reductions ranged from 27.5% to 80.25%, with maximum decreases between 2 °C and 4 °C and minimum decreases between 0.5 °C and 1 °C compared to SGU units. The results show that CCFs outperform SGUs in thermal performance and comfort, reducing operating temperatures by 33.5% to 68.75% monthly and 27.5% to 80.25% annually. Temperature reductions ranged between 2 °C and 4 °C at maximum and 0.5 °C and 1 °C at minimum compared to SGU. Notably, Venetian blinds with nano-coatings (83/58) and low-E coatings (83/23) (Tvis/Tsol) were the most effective. This study highlights the importance of selecting appropriate coatings for CCFs, and demonstrates their potential in enhancing interior temperatures and comfort in Malaysia’s climate. The findings emphasize the significant impact of innovative glazing technologies on improving operational temperatures and occupant comfort using closed-cavity façades in the tropics.

1. Introduction

Climate change and Malaysia’s tropical conditions adversely affect poorly insulated buildings. New high-rise residential buildings with extensive glazing in Malaysia’s hot–humid climate create discomfort, boosting reliance on air conditioning [1,2]. A significant majority (87–100%) seldom go outdoors [3]. Approximately 50% of the energy consumed by a building is due to air conditioning systems [4,5]. Widespread indoor air conditioning use in Malaysia has doubled electricity consumption since 1997, with commercial and residential sectors accounting for almost half (49.5%) in 2018 [6,7]. Glass in buildings, responsible for half of energy loss, especially through windows, contributes to energy inefficiency due to thermal discomfort inside buildings [8,9]. Careful planning and glass selection are vital for optimal thermal comfort and minimal energy use [10]. The building’s “skin” is vital for insulation and environmental control [11,12]. Recent advances in window and glazing technologies, including coatings, have boosted energy efficiency [13]. Traditional glazing methods often result in inefficient heat transfer. Sustainable building design in the last two decades has emphasized high-performance façade systems for enhanced thermal insulation, adaptability to environmental conditions, and improved comfort. Key aspects include indoor temperature regulation, strategic building orientation for shade, and the use of materials with optimal thermal properties.
Double-skin façades (DSFs), defined as “a glazed double skin façade with an external glazed skin and an internal skin forming the building’s actual façade, separated by an air cavity” [14], have been extensively studied for their thermal benefits, surpassing traditional glazing systems and improving comfort [13,14,15]. In a study by Reza and Suleiman (2021) [16], three DSF types were examined, showing enhancements in thermal comfort: multi-story DSF (3.24% to 3.85%), shaft box (5.38% to 4.78%), and box window (10.42% to 10.48%). Despite these benefits, however, due to certain constraints, many buildings are unable to incorporate DSFs. These constraints include DSFs requiring higher initial investments, as well as continuous maintenance and cleansing costs. During their life cycle, DSFs demand more energy and carbon than conventional fuels. The long corridor necessary for DSFs, according to F. Pomponi et al. [14], reduces usable building space. Adding internal openings for cleaning and other concerns resulted in a smaller usable building space and increased maintenance, repair, and sanitation costs, prompting the search for other alternatives. The University of Cambridge addressed these issues by introducing a CCF concept, revolutionizing the traditional DSF by positioning double- or triple-glazed glass panels internally, separated from an external single-glazed layer by a cavity with a shading system [17], as shown in Figure 1. CCFs offer operational advantages by preventing dust accumulation, managing airflow, and extending component lifespan [18,19]. The sealed panels and a pressurized air supply system ensure consistent internal pressure, preventing moisture accumulation and overheating. While a CCF typically measures 130–150 mm, practical implementations may expand to 200–250 mm, significantly reducing material and labor costs compared to a standard DSF [17].
Recent studies [17,18,19,20] have explored the potential of CCFs to enhance indoor air quality and reduce the energy consumption of buildings. Tests across various cities have had promising outcomes, such as reduced total energy consumption (21.8–40.7%), energy demand (21.8–40.7%), and cooling load (79.8 kwh/m2), with effective temperature control, particularly at temperatures exceeding 27 °C [17]. Despite these encouraging results, comprehensive evaluations of CCFs, considering their key characteristics, performance, advantages, and limitations, are limited due to their novelty in glazed façade technology. A literature gap exists regarding CCF configurations in diverse climatic conditions.
The current research explores the effectiveness of integrating double-glazed units (DGU) as the innermost glazing system in glazed façade buildings to reduce external heat gain and internal temperatures. In Malaysia’s humid tropical climate, this façade technology offers notable advantages compared to SGU with a grey coating. CCFD signifies a significant advancement for double-skin façades in contemporary architecture [20]. Malaysia’s heat and humidity challenges provide an intriguing context for studying CCFD applications. While potential benefits exist in relation to using CCFD in Malaysia’s tropical climate, further research is necessary to develop a comprehensive understanding of these advantages. In a preceding investigation, Al Kahlout et al. (2023) [21] substantiated the effectiveness of the CCF product under tropical climatic conditions, employing three internal glass panes (TGU). The findings revealed an annual enhancement in the operative temperature reduction within the indoor environment of the building, ranging from 38.5% to 90%. Notably, the maximum temperature decrease reached 3.5 °C, while the minimum reduction was 1.5 °C. Despite the achievement of significant improvements in the previous study in terms of attaining thermal comfort within the building’s internal environment, the increased number of layers in the CCF-TGU product results in both weightiness and elevated costs. Therefore, the current study concentrates on replicating the same thermal comfort attributes with a reduced number of glass layers.
This study’s importance centers on investigating the innovative CCF-DGU technology as an extension of an earlier research study that undertook a CCF-TGU study on Malaysia’s tropical climate, a notable development in architectural design that holds particular promise for warm, tropical environments such as those found in Malaysia. This research delves into the utilization of various Venetian blinds and advanced glazing coatings within CCFDs, aiming to optimize the thermal performance of glazed façades in diverse orientations, particularly in tropical regions. Its significance is amplified by the current lack of extensive research on CCFs across varying climates. This research offers the prospect of markedly enhancing building thermal performance and reducing energy consumption, representing a vital advancement in the pursuit of sustainable architectural practices.

2. Methodology

This research utilized quantitative methodologies, incorporating simulation work and field measurements. The study explored and compared different configurations, geometries, and materials for CCFs against the conventional SGU baseline. Simulation tools were employed to construct diverse CCF configurations, and their thermal performance was assessed by measuring indoor air temperatures in various scenarios. The subsequent section provides a detailed account of the methodological steps undertaken in this investigation.

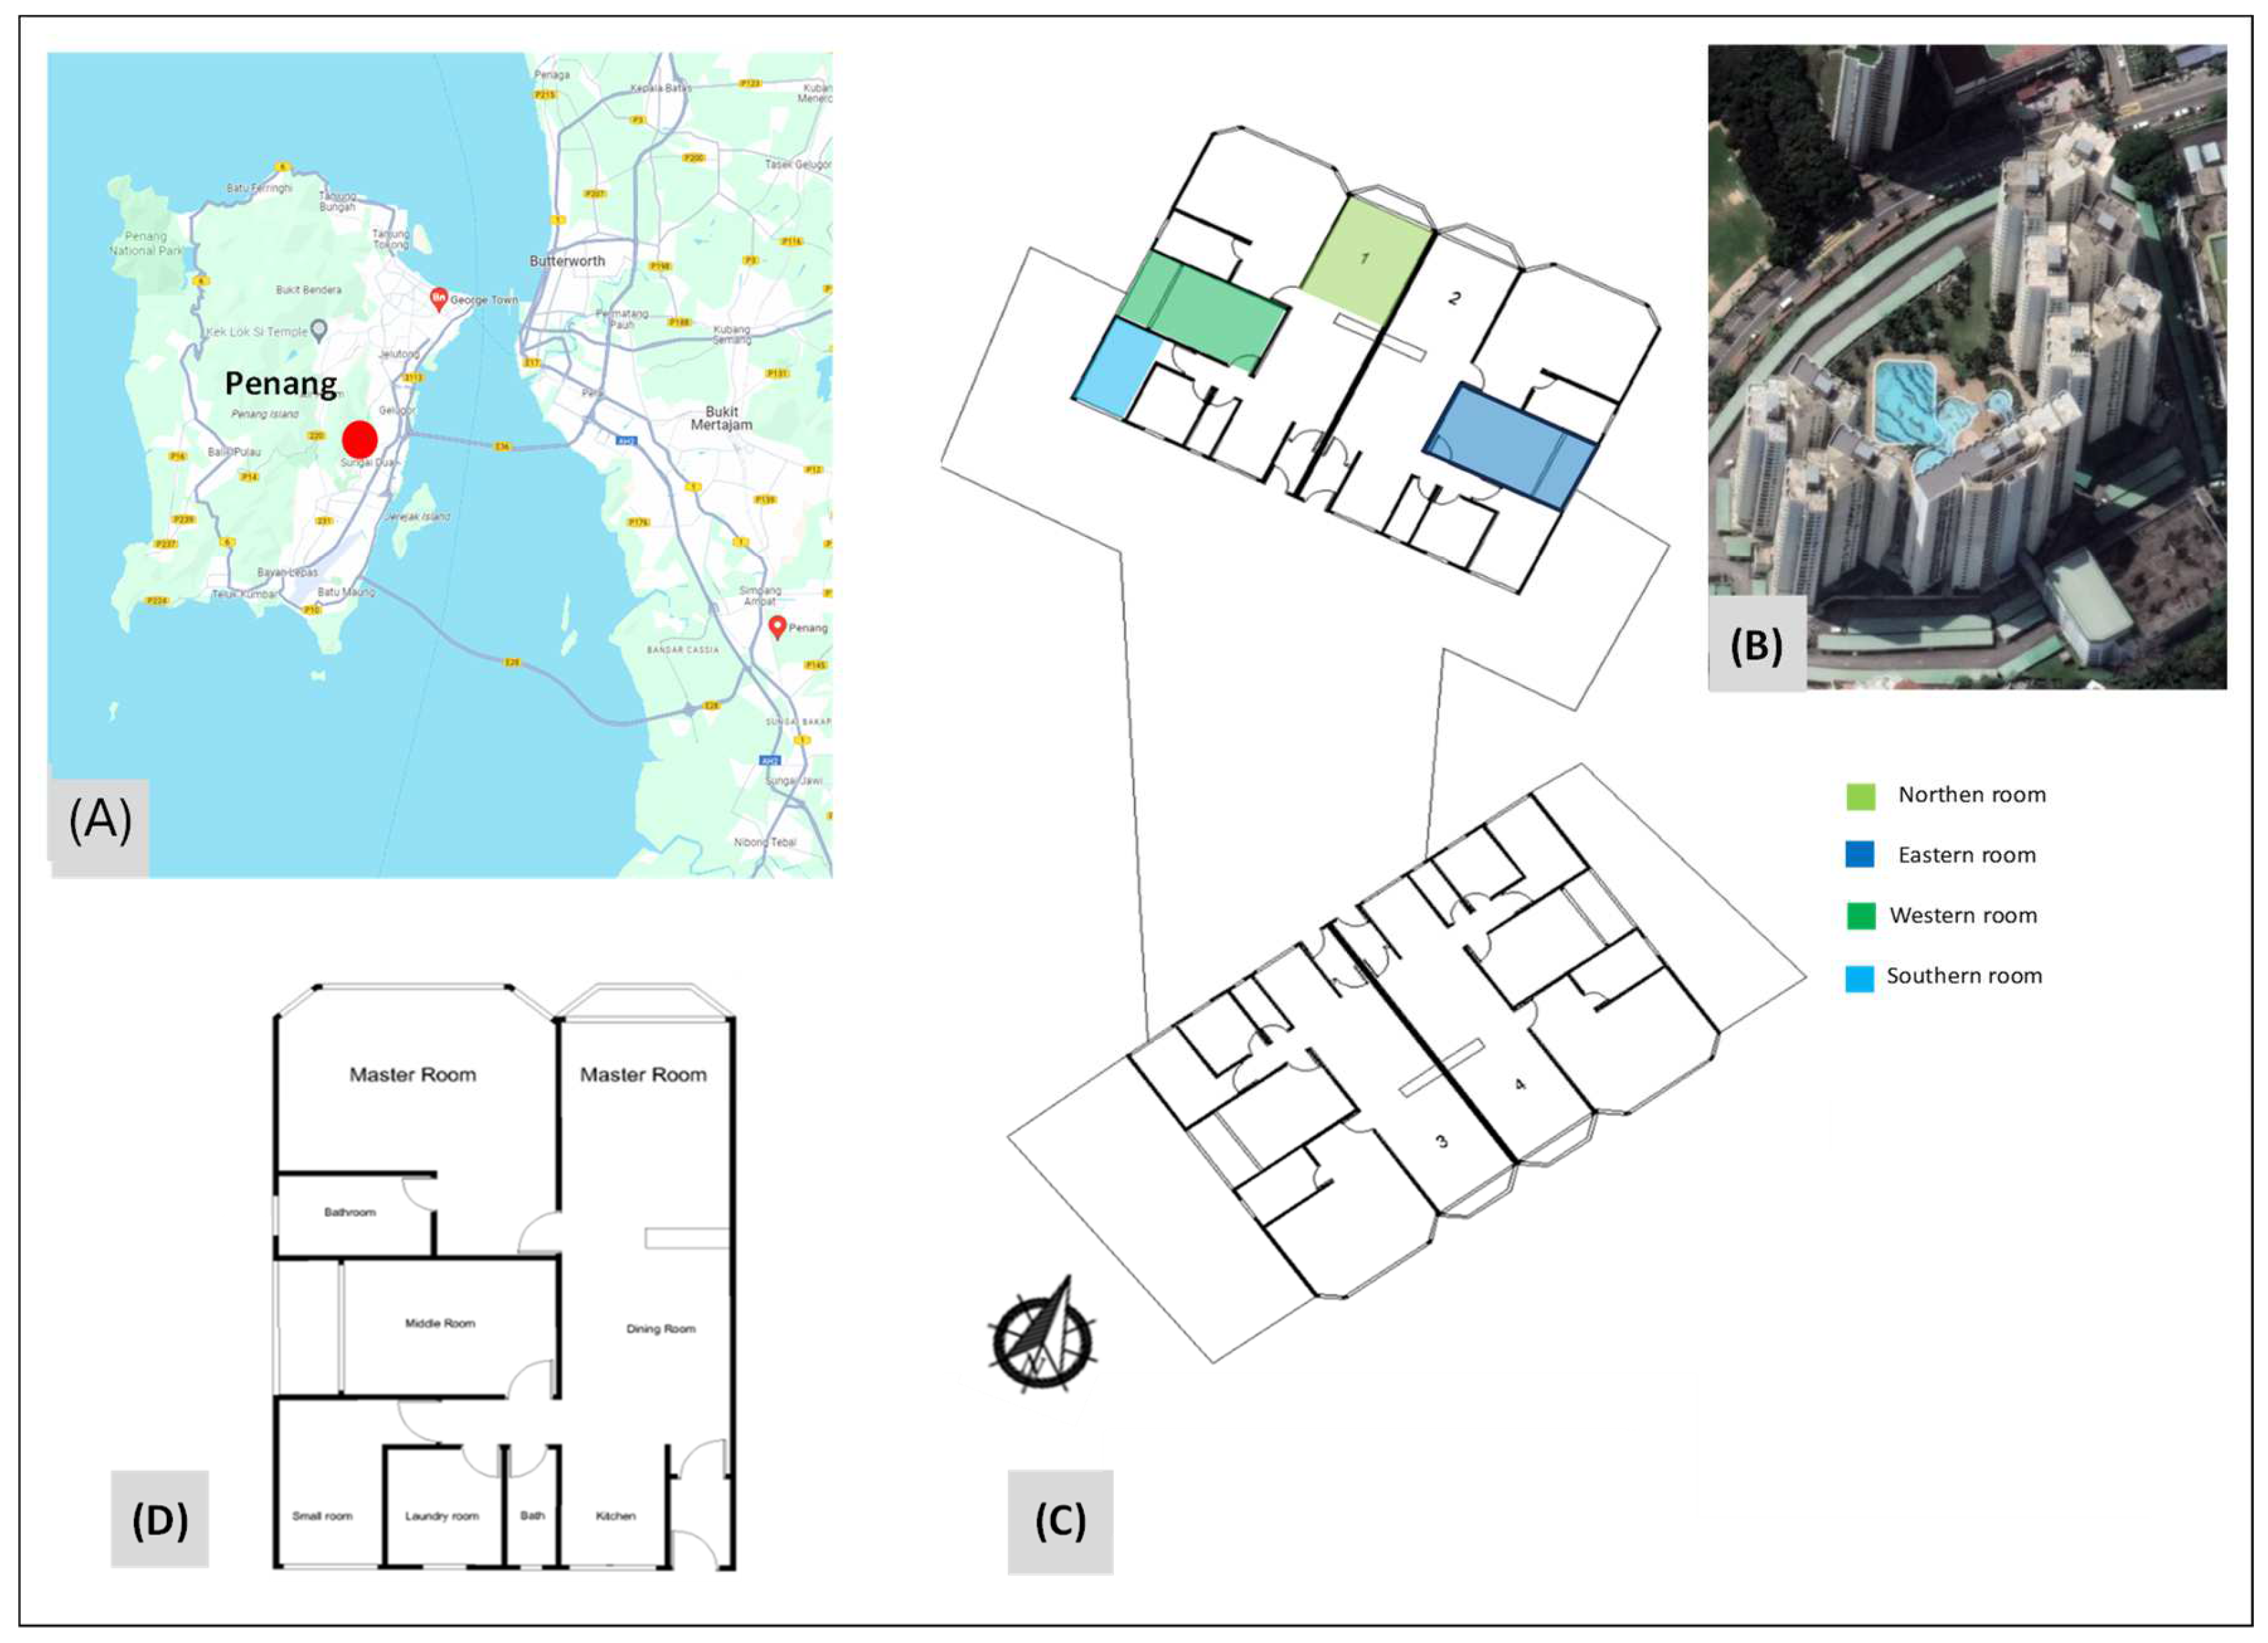
2.1. Climate Condition of Penang, Malaysia

Penang, situated north of Peninsular Malaysia on the west coast, has a local latitude of 5.35° N and a longitude of 100.30° E. The regional climate is characterized as hot and humid tropical, marked by consistently high temperatures, elevated humidity levels, and abundant rainfall year-round. According to the Malaysian Meteorological Department, the diurnal temperature in Malaysia ranges from a minimum of 23 °C to 27 °C to a maximum of 30 °C to 34 °C, resulting in the absence of distinct hot or cold seasons. The annual rainfall is evenly distributed across the year. Table 1 presents the pertinent information and data on air temperatures, relative humidity, and solar radiation for Penang City, the location of the case study conducted.

2.2. Baseline Configuration

Sunny-Ville Condominium, situated in the Gelugor District of Penang, Malaysia, is a residential complex comprising 22-storey buildings, each with four apartments per floor. Each apartment spans an area of about 184 square meters. Selected for its representation of contemporary highrise residential architecture, Sunny-Ville is characterized by its predominantly glass exteriors. This feature is often at odds with energy-efficient designs in tropical climates, as depicted in Table 2. The specifics of the building, including the layout of the apartments and rooms, are depicted in Figure 2.

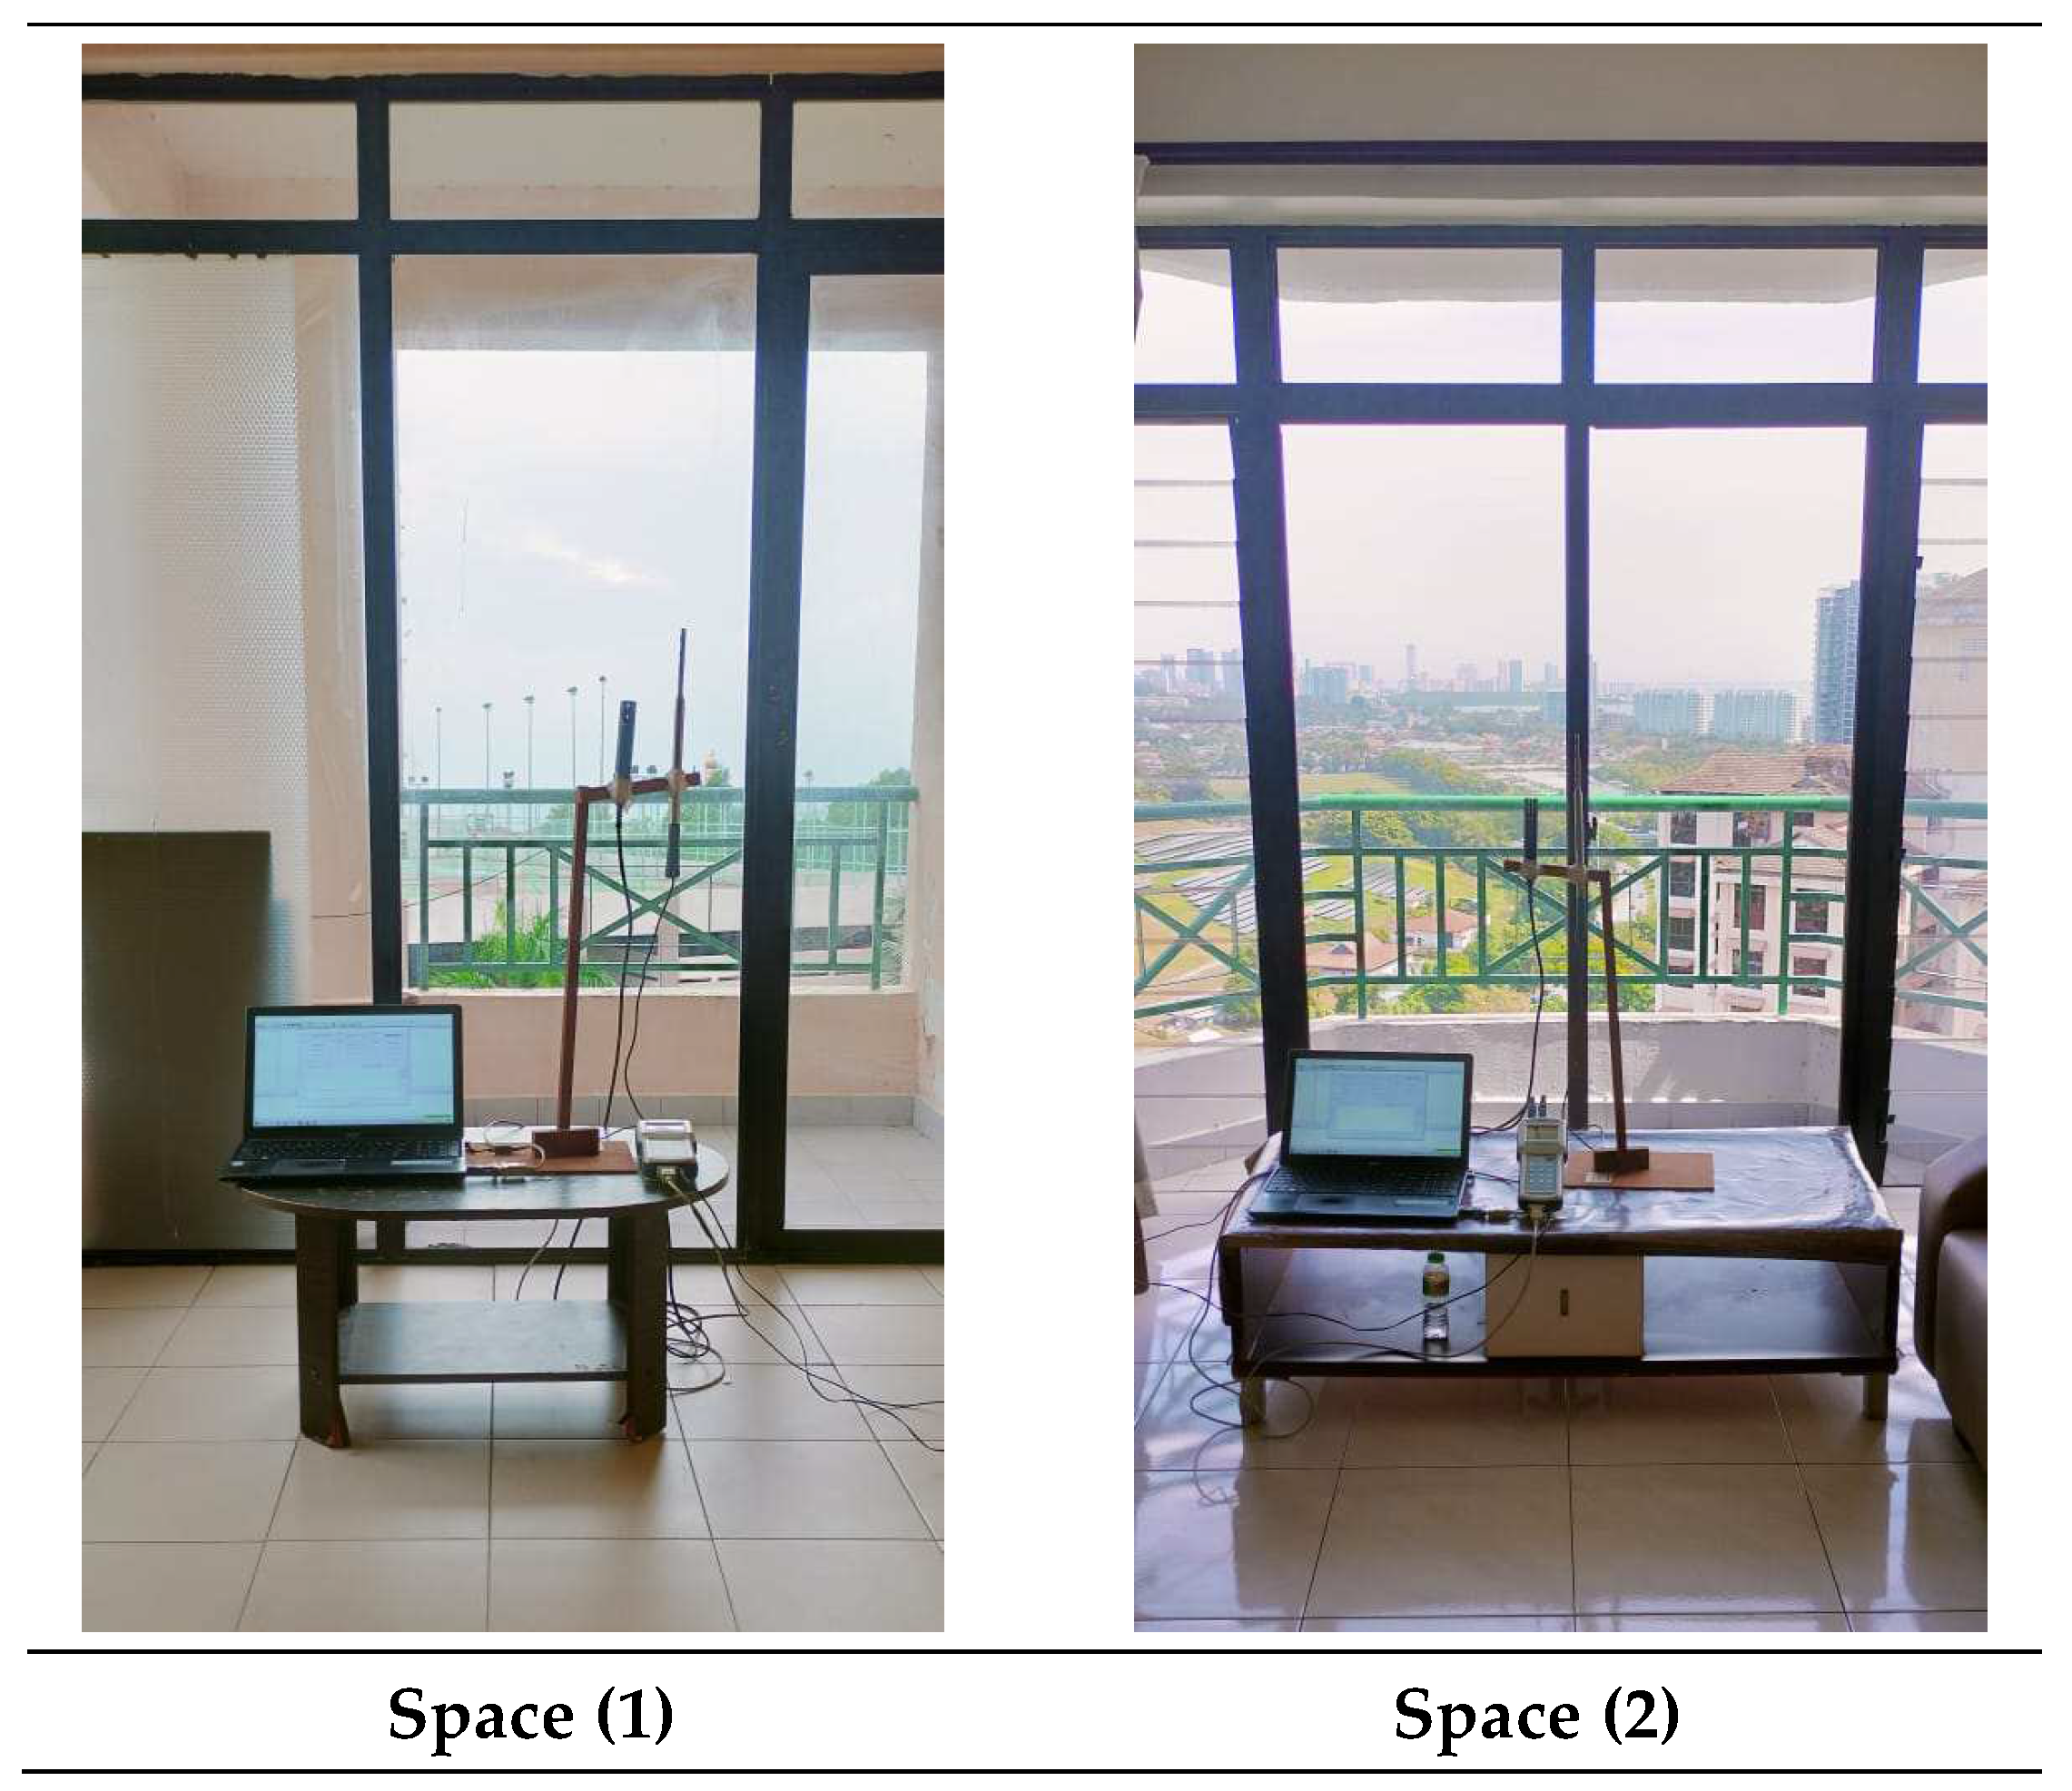
2.3. Field Measurement

Indoor air temperature (Ti) was recorded in four areas featuring 85% glass façade s, each facing different directions. The location, orientation and geometry of the rooms are shown in Figure 2. Continuous environmental monitoring was conducted in each room between 3 and 8 March 2023 using an Ohm-Srl data logger model DO9847. As shown in Figure 3 the datalogger station was placed in the central part of each room at a height of 1.1 m above floor level, i.e., in accordance with ASHRAE standards [23]. To achieve a thorough analysis, it is imperative to compare solutions involving walls devoid of ventilation openings or enclosed cavities. As such, careful efforts were undertaken to ensure that all examined spaces remained entirely devoid of mechanical ventilation, including air conditioners or fans. This approach guarantees a robust evaluation by isolating the impact of ventilation solutions, providing a clearer understanding of their effectiveness in influencing the thermal performance of the enclosed spaces.

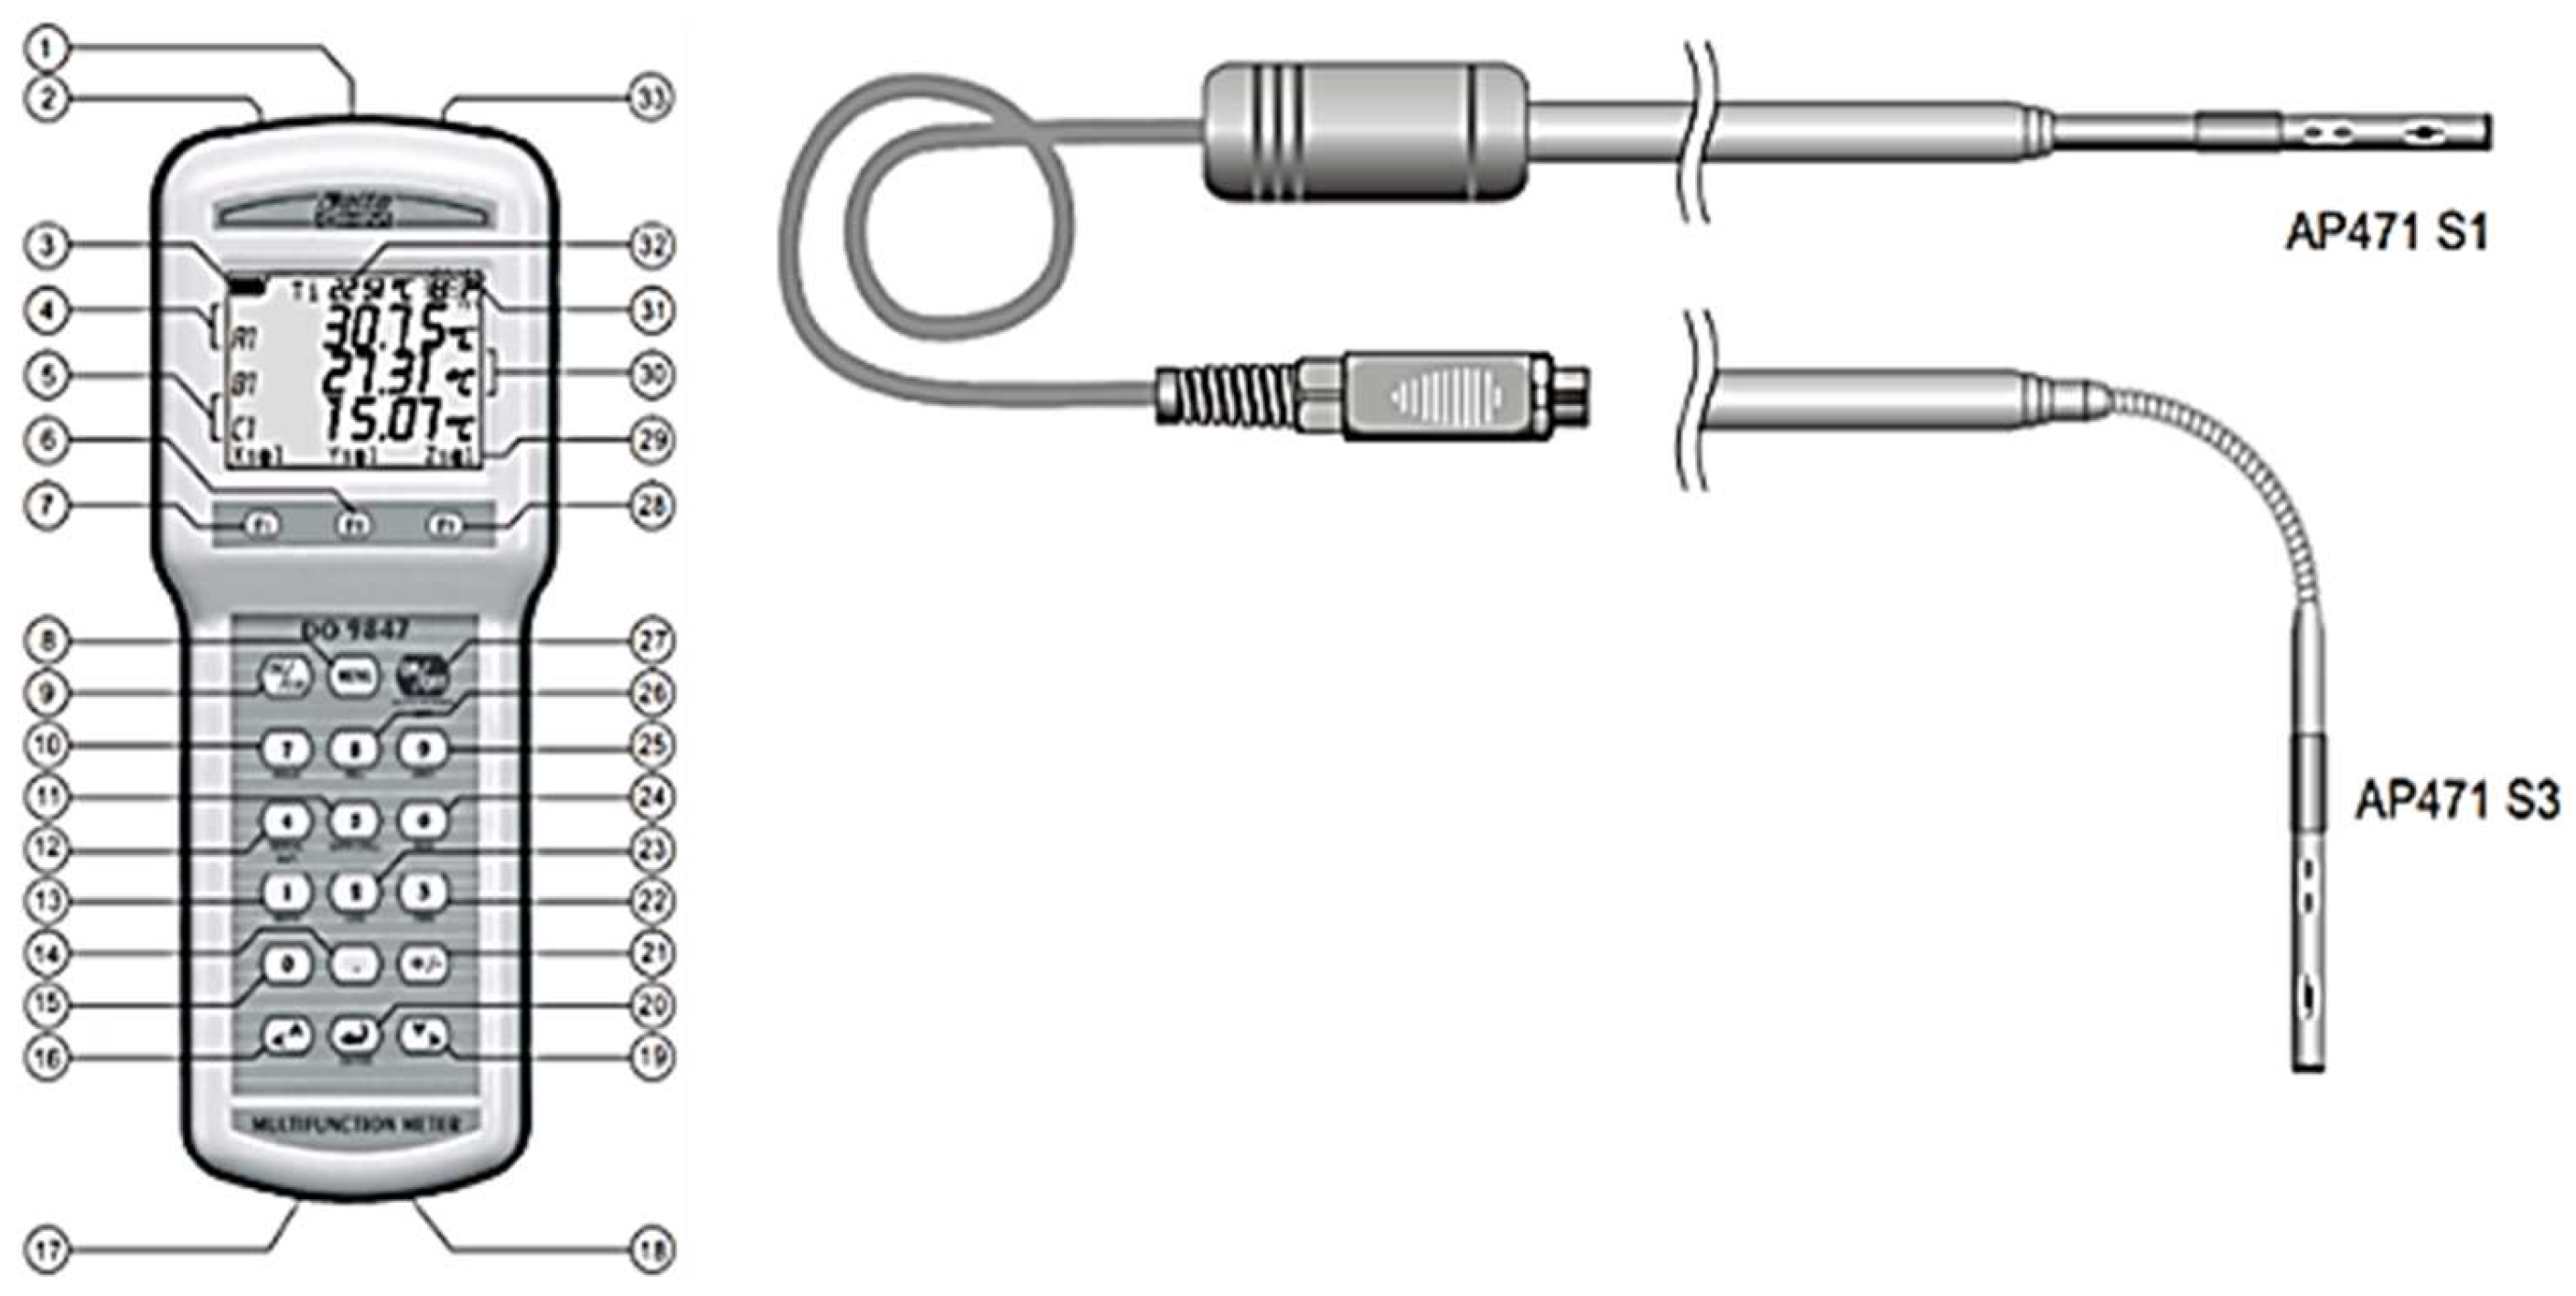
2.3.1. Instrument of Measurement

In Figure 4, environmental factors are measured using the DO 9847K instrument, which is manufactured by Delta Ohm Srl. This Italian datalogger has the capability to assess airspeed, moist bulb temperature, air temperature, relative humidity, and globe temperature. Additionally, medium radiant temperature (Tr), predicted mean vote (PMV), predicted percentage dissatisfied (PPD), and damp bulb globe temperature (WBGT) can be determined from measured quantities, following ISO 7243, ISO 8996, ISO 7726, and ISO 7730 standards as cited in ref. [20]. A detailed listing of its features can be found in Table 3.

2.3.2. Measurement of (Ti) Variable

In each space, façade measurements were carried out continuously over a full 24 h period. The findings reveal that the highest Ti recorded was 35.76 °C, with an average of 35.5 °C across all examined locations. Conversely, the lowest Ti was 29.3 °C, with an average of 29.6 °C. It is noteworthy that in most areas, there was an average daily Ti variation of up to 5 °C. This fluctuation is attributable to various factors, including the prevailing weather conditions during the measurement period, the specific locations of the measurements, and the influence of solar radiation on surfaces, particularly in higher-floor areas.

2.4. Simulation Investigation

Various configurations, shapes, and materials of CCFs were examined and contrasted with a standard grey-coated SGU, aiming to address the primary inquiry of this research: “What are the ways by which we can improve the thermal and comfort performance of buildings through the use of CCFs”. To this end, the CCFs were configured using several different simulation tools (WINDOW 7.8, (Energy Plus 8.9.0, and DesignBuilder 6.1 Software Ltd., Gloucs, UK)), and their indoor climate and energy performance were simulated for the climate of Malaysia. Windows 7.8 software gives total window thermal performance indices (i.e., U-values, solar heat gain coefficients, shading coefficients, and visible transmittances) that can be computed with the aid of Berkeley Lab WINDOW, a freely available computer program. The National Fenestration Rating Council’s (NFRC) new rating system complies with ISO 15,099 [24], making it compatible with WINDOW, a versatile heat transfer analysis instrument developed by Berkeley Lab [25]. Michael and Overend (2022) [20] determined that new product creation and design are both possible with this software. EnergyPlus 6.1 is recognized as one of the most reliable software packages for simulating energy and thermal performance in buildings [26,27]. Many researchers have relied on it to predict the thermal behaviour and performance of CCF-equipped buildings. In addition, Design Builder 6.1 is innovative software for analysing building energy, CO2, illumination, and comfort. Design builder facilitates construction simulation, allowing one to evaluate various building concepts while adhering to budgets and schedules. Design Builder combines rapid and straightforward building modelling with dynamic energy simulation. Innovative productivity features enable novices to rapidly model complex systems [28,29]. Many researchers have relied on it to predict the thermal behaviour and performance of CCF-equipped buildings. DesignBuilder is a simulation software that offers a robust graphical user interface for the energy modelling program EnergyPlus [30].

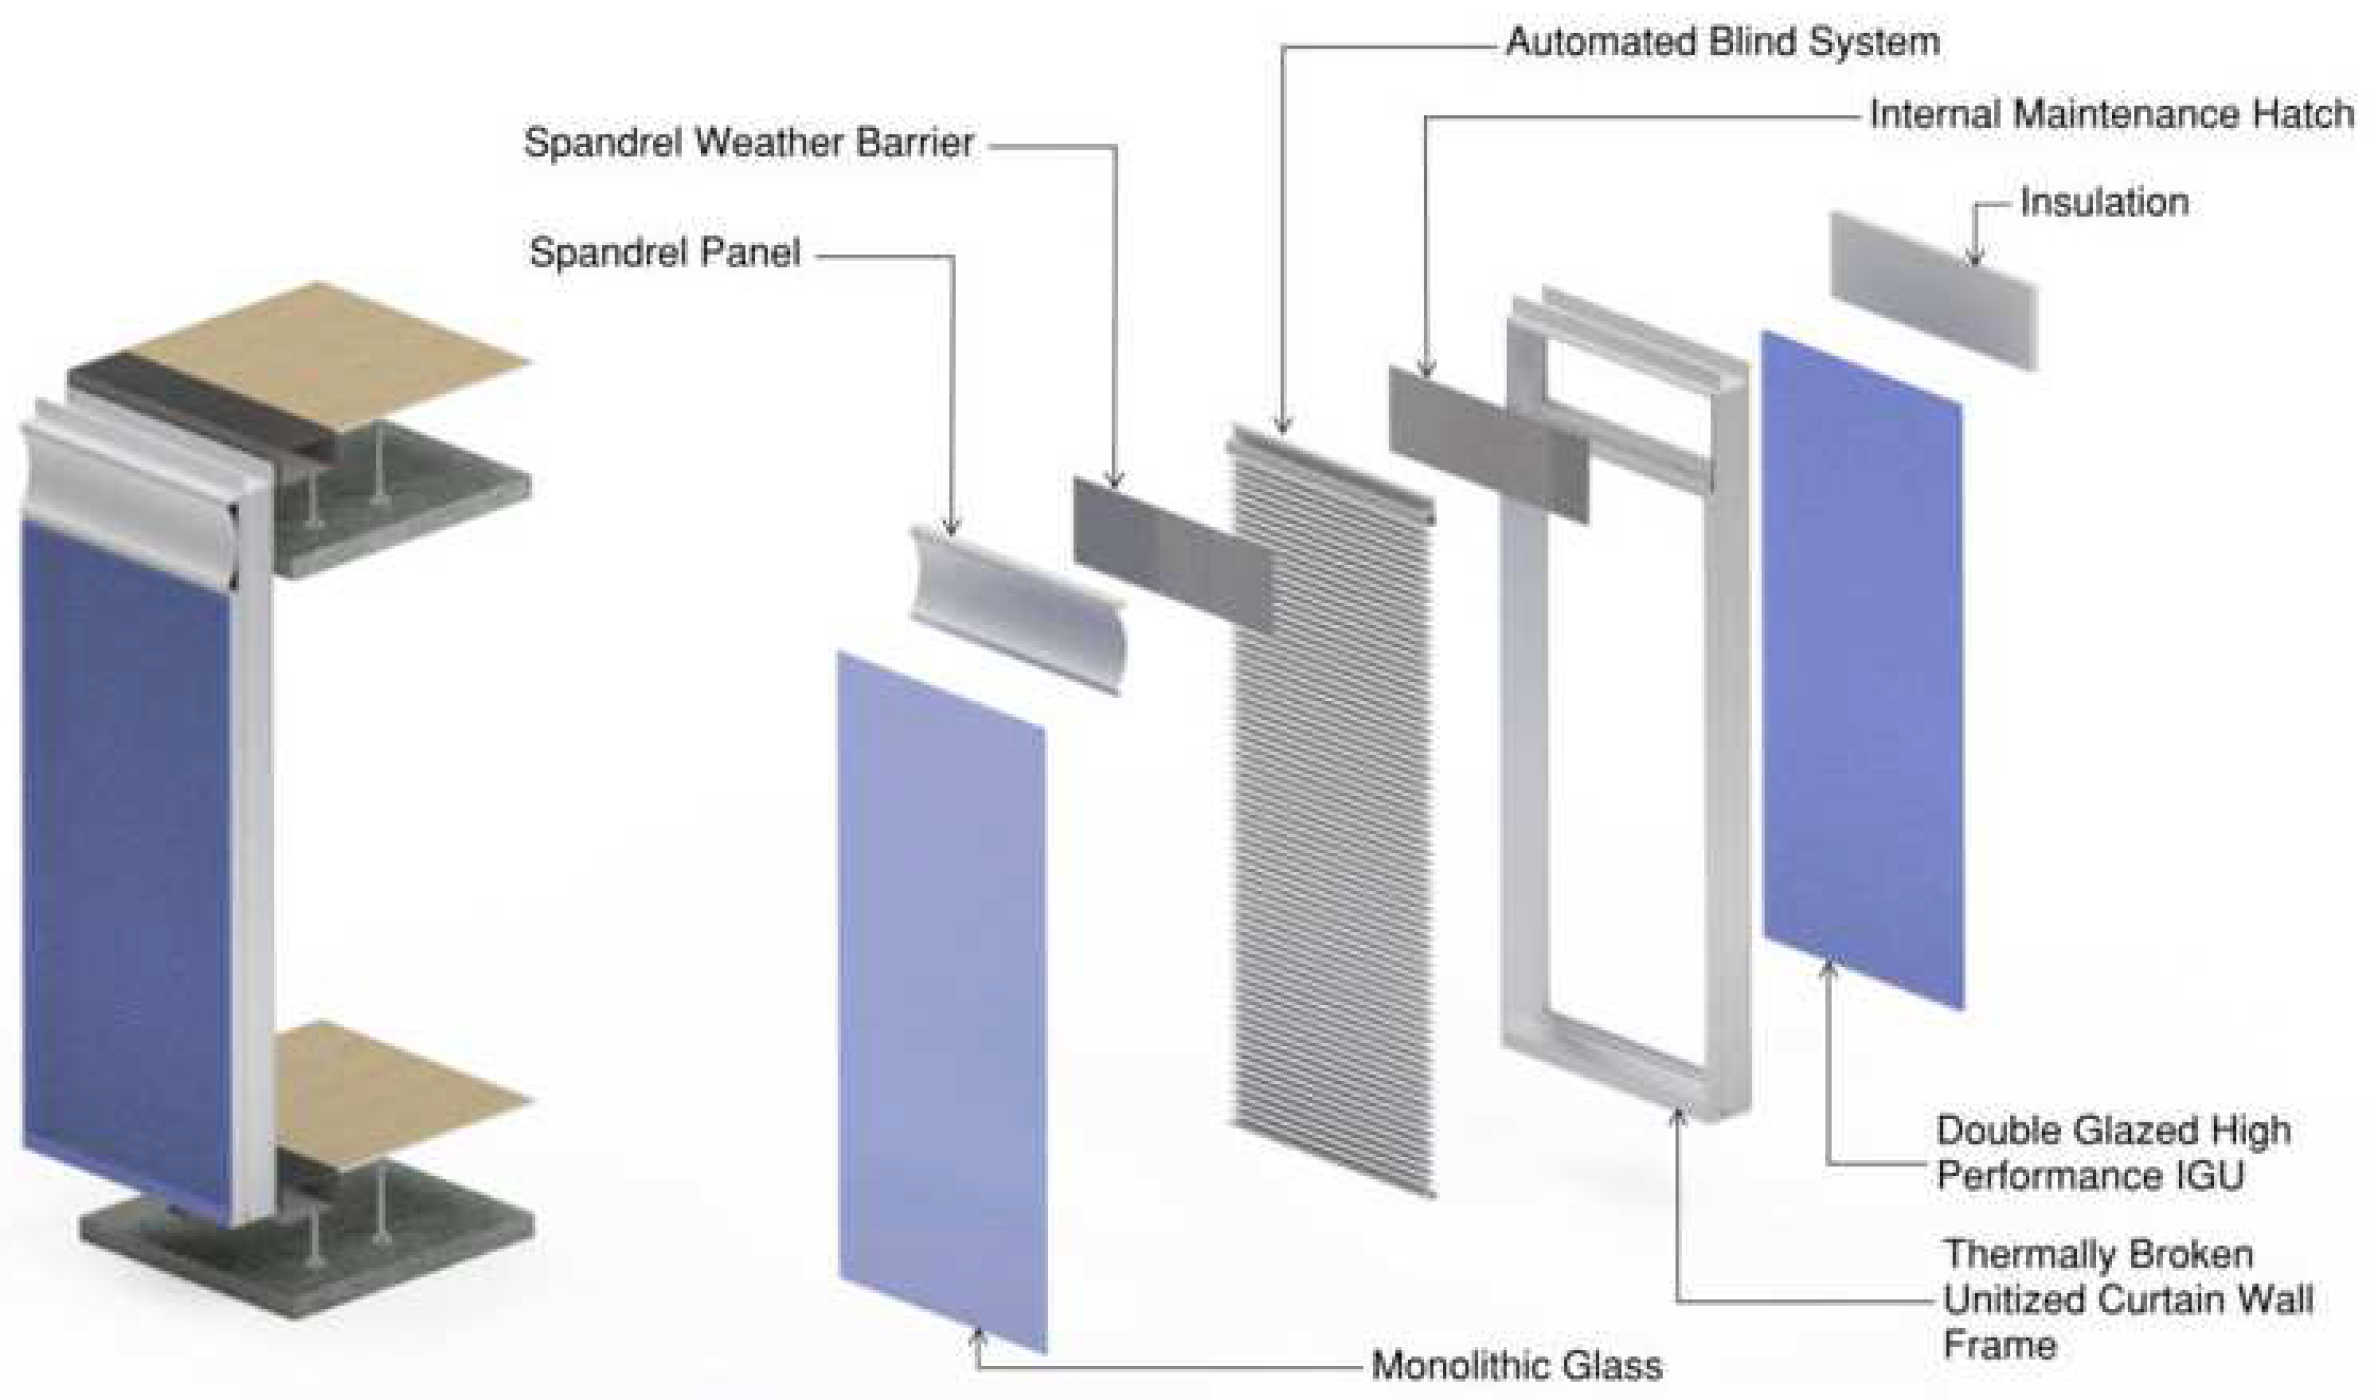
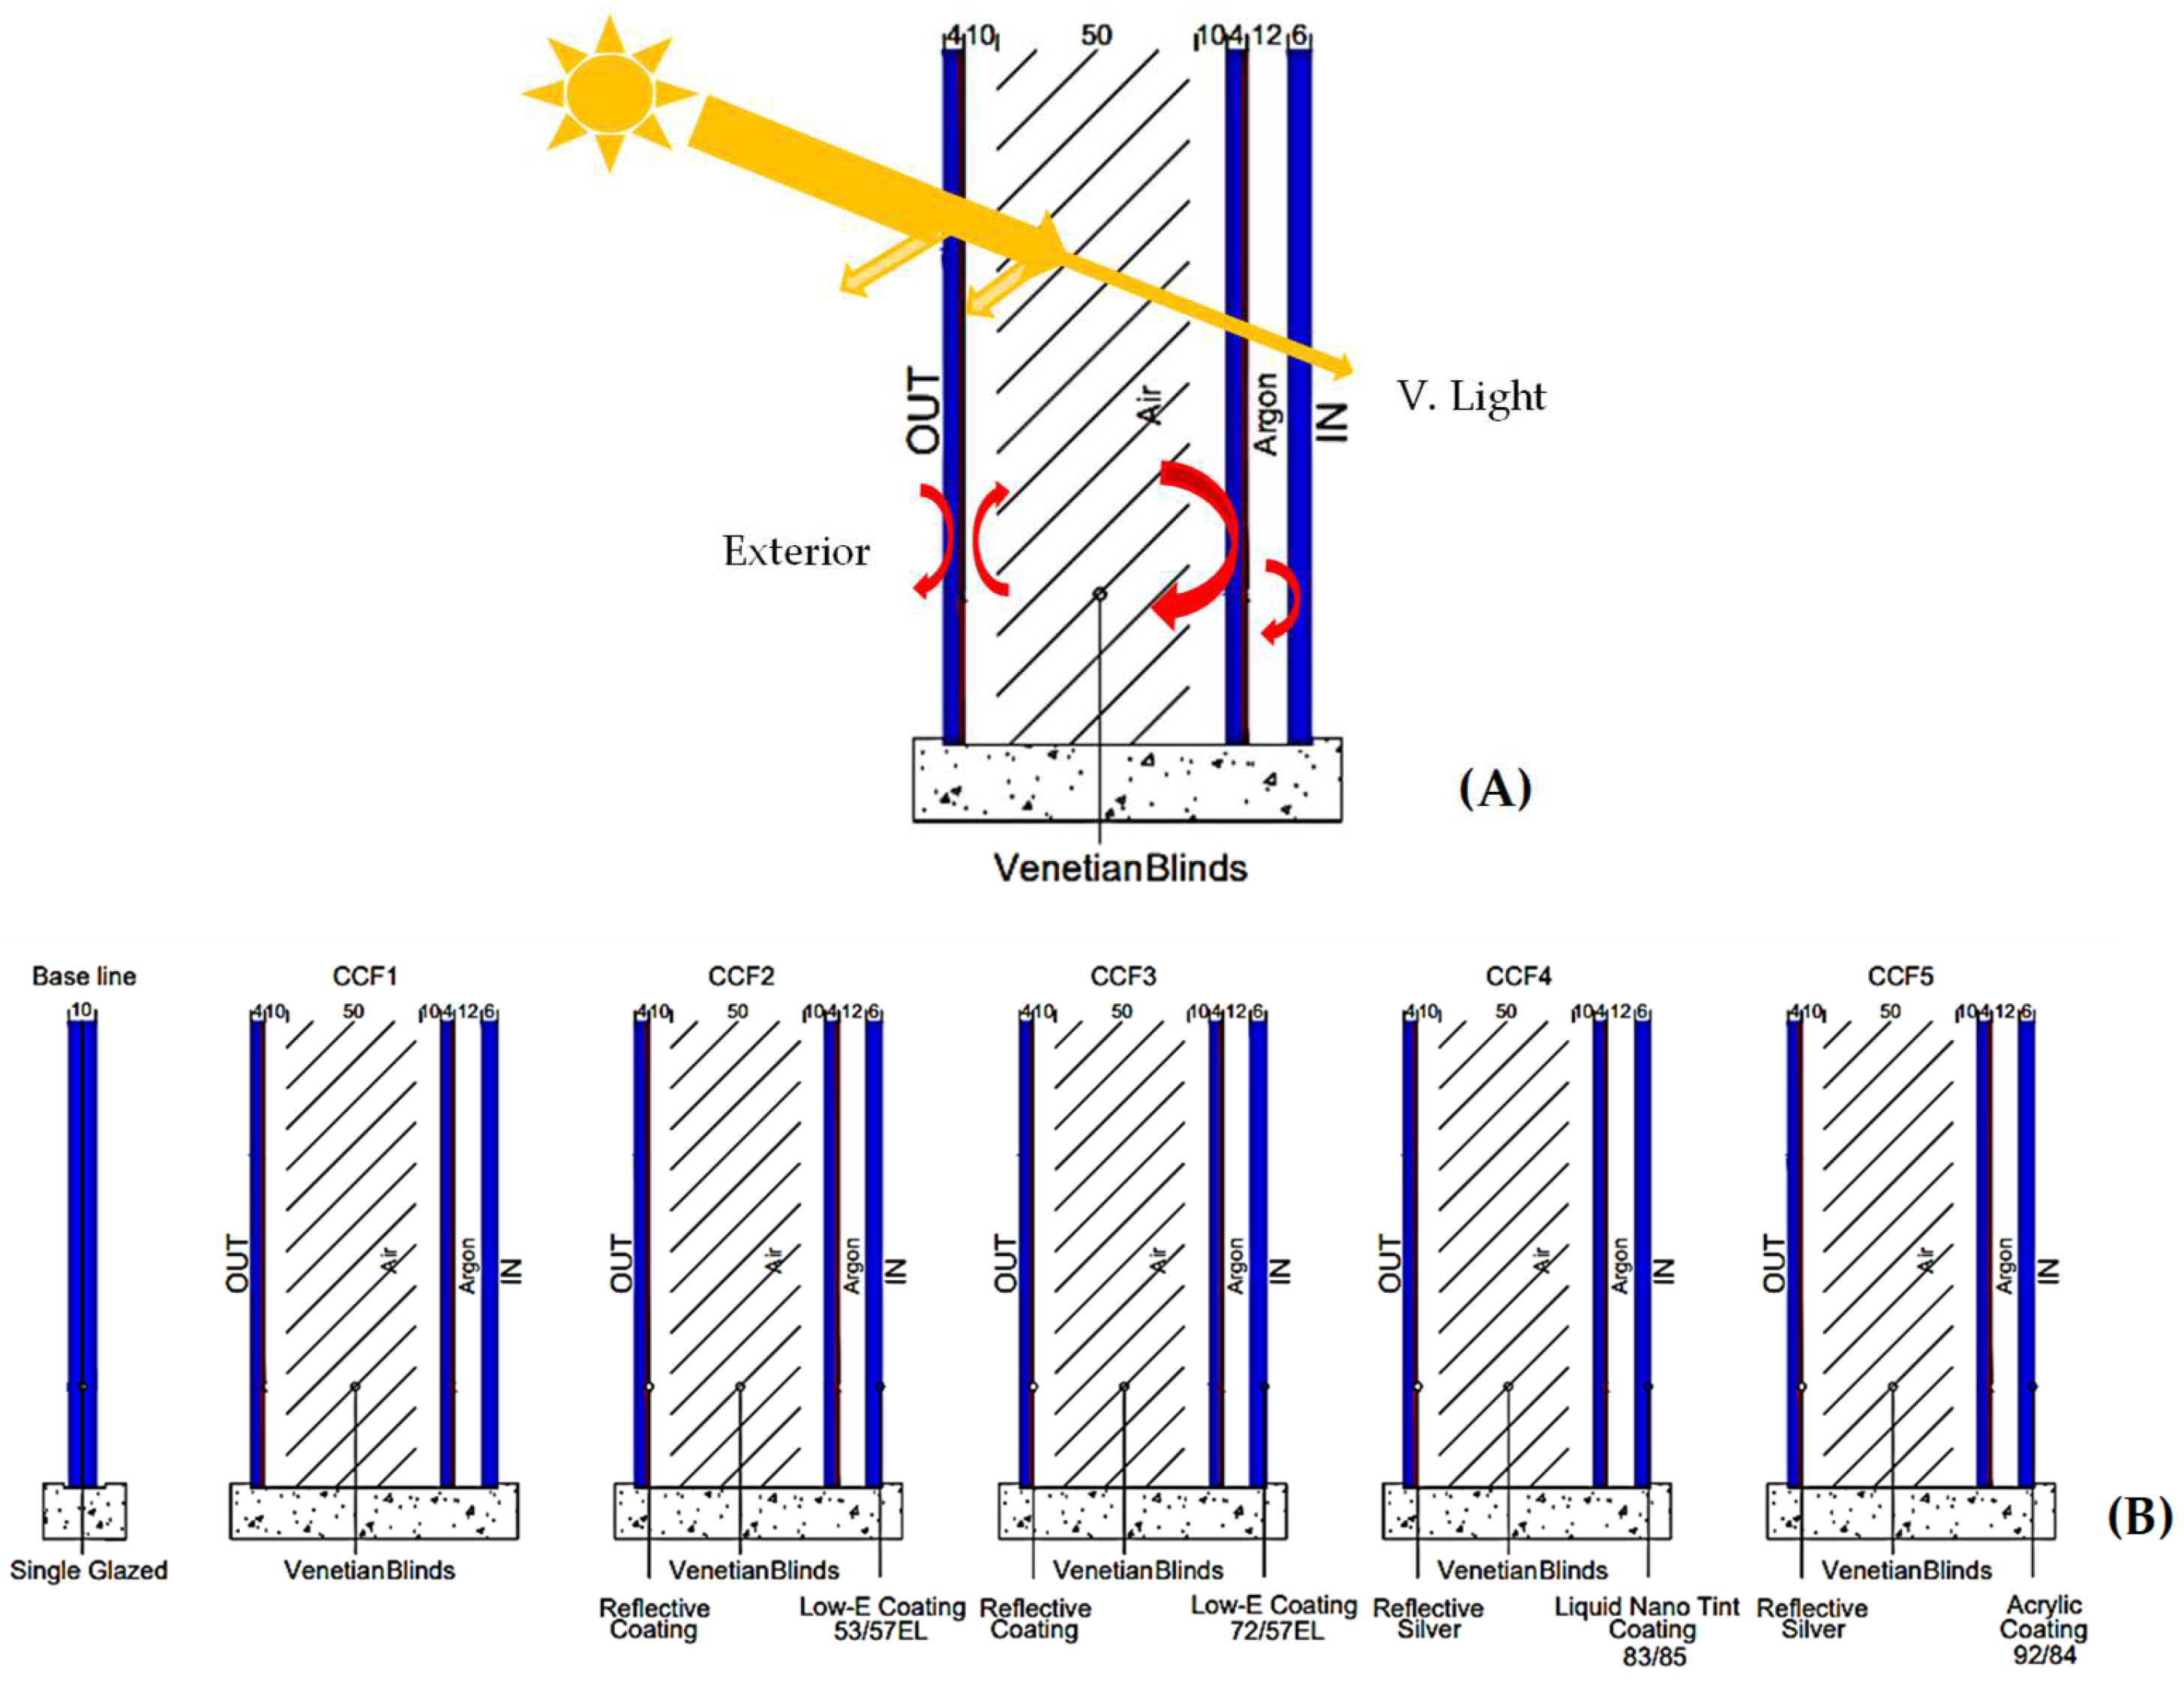
2.4.1. Build-Up of CCF Configurations

This study, which continues and builds upon the previous research by [21] that used triple glazing as the CCF inner skin, shifts the focus to double glazing (DG) as the inner skin. This adjustment aims to potentially enhance both thermal performance and construction aspects. In exploring the operational efficiency of CCFs under typical Malaysian weather conditions, a variety of configurations were examined. These included different coated glass panels, complemented by two types of integrated Venetian blinds, to test various shading solutions. For safety considerations, the innermost pane of the DGU was tempered to a thickness of 6 mm, while both the exterior skin glass and the DGU glass were maintained at a thickness of 4 mm, as shown in Figure 5A. Figure 5B provides schematic illustrations of the diverse CCF setups, namely, CCFD1, CCFD2, CCFD3, CCFD4, and CCFD5. This study’s focus on double glazing as an inner skin represents a strategic shift from the triple-glazed approach of the previous study, potentially offering improvements in thermal efficiency and construction methodologies.
For groups CCFD1, CCFD2, and CCFD3, there are three layout variations available: the first features no blinds (VB0), the second includes white blinds positioned at a 45° angle (VB1), and the third has blinds in a wooden hue, also set at 45° (VB2). Conversely, for groups CCFD4 and CCFD5, there are also three different layouts: the first incorporates reflective silver 20/16 with white horizontal blinds at a 45° angle (VB1), the second uses reflective silver 38/30 combined with white blinds, again at a 45° angle (VB1), and the final configuration consists of reflective silver 56/47 with white horizontal blinds set at a 45° slat angle (VB1).
Integrated Venetian blinds are preferred as shading elements within the cavity because of their adjustable rotation angle, providing users with increased control over shading conditions. In the initial group (CCFD1), the systems include uncoated glass panes. In the subsequent groups (CCFD2 and CCFD3), a high-performance coating with a Tvis/Tsol ratio of 53/57 and 72/57 Low-E, along with a reflective coating, is applied to reduce the solar radiation entering the CCF cavity. The fourth group (CCFD4) utilizes a high-performance Liquid Nanotinted coating, specifically designed to deflect solar rays and prevent the excessive heating of the CCF cavity. The fifth group (CCFD5) closely resembles the fourth group, incorporating an acrylic high-performance coating to achieve comparable performance.

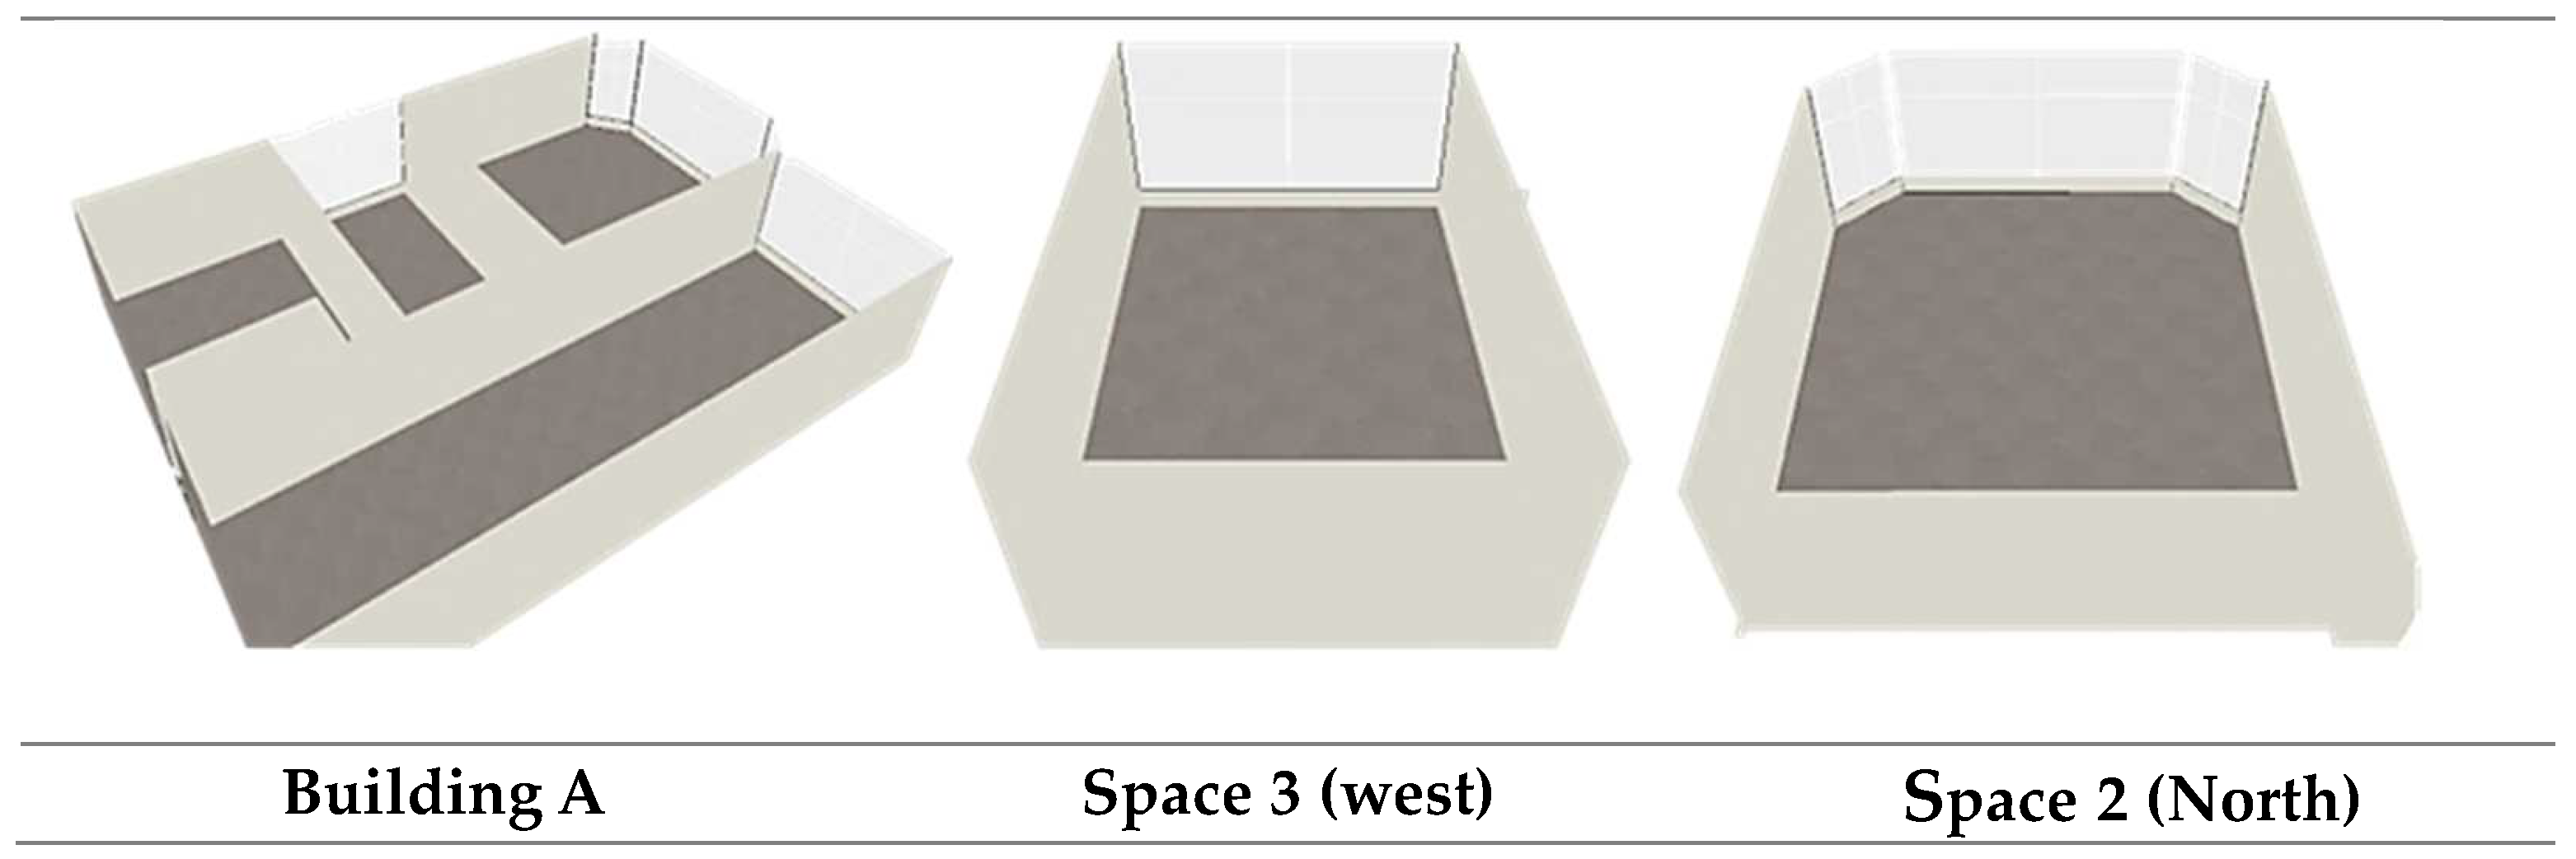
2.4.2. Building Model (Case Study)

For comprehensive analysis, a detailed model of the building, including each investigated room, is crafted utilizing the data elucidated in Table 2 and Figure 6. This model faithfully represents the actual dimensions, materials, and openings of the apartment, ensuring a thorough and accurate examination.

2.4.3. Modeling and Performance Simulation of the CCF Configurations

As per the Chartered Institution of Building Services Engineers (CIBSE) Guide A: Environmental Design (2015, amended January 2021) [7], each occupant is associated with an average power consumption of 120 watts. Of this, 50 watts are allocated for electronic devices like laptops and phone chargers. Each room is equipped with a 1-tonne-capacity air conditioning (AC) system operating at 220 volts, utilized for a minimum of 12 h daily. This usage is intended to maintain indoor temperatures within the range of 18 °C to 24 °C, achieving a balanced interplay between natural and mechanical ventilation. Additionally, the lighting system consists of LED lamps, utilized to meet the recommended lux level outlined in the CIBSE (CIBSE, The SLL Lighting Handbook (2018)), promoting adherence to academic integrity standards.
The CCF systems were simulated using the EnergyPlus program, incorporating SHGC, Tvis, and U-value as key factors. This simulation aids in identifying the optimal classification for achieving desired factors, such as coating and Venetian blind effectiveness. The study assessed thermal comfort using operating temperature, including indoor air temperature and radiant temperature, along with relative humidity as metrics. The evaluation was conducted on a monthly and yearly basis for all considered models. The experiment, aligned with Penang’s sun path, was carried out monthly, focusing on March (east and west orientation), June (North orientation), and December (south orientation).

2.4.4. The validity Ratio of Simulations to Real Measurements

Figure 7 illustrates a comparative assessment of the predicted Ti generated by EnergyPlus using recent weather data, juxtaposed with the Ti measured in the field from 3 to 8 March 2023. This comparison is vital in validating the accuracy of the building model developed for the study. To ensure the reliability of the final outcomes and the precise incorporation of building material properties into simulation programs for the case study, it is imperative to minimize the margin of error between actual and simulated results [22]. The analysis indicates an average error margin of approximately 1%, underscoring a high level of precision in the predicted Ti. This precision is further supported by a correlation coefficient of around 0.95.

3. Result and Discussion

The results of computations performed using Window 7.8 software to assess the performance of the constructed CCF configurations are presented in Table 4. These performance indicators encompass thermal transmittance (U-value), the solar heat gain coefficient (SHGC-value), the solar transmittance (Tsol), and the visible solar transmittance (Tvis). The algorithms employed in Window 7.8 originate from the Lawrence Berkeley National Laboratory (LBNL) and adhere to international standards such as ISO 15,099 [24], which are utilized for evaluating the thermal and solar-optical performance of glazing systems.
The values obtained from Table 4 are utilized in EnergyPlus and DesignBuilder to assess CCFD configurations relative to a baseline SGU with a grey coating. When the incident radiation on the façade is below 250 W/m2, the integrated Venetian blinds retract completely, and if it exceeds this threshold, the blinds deploy automatically. The selected coatings are based on prior scientific research [17,31,32,33], detailed in Table 4, indicating optimal properties for reducing thermal conductivity. This reduction is crucial as it directly influences the internal temperature of the building. Notably, the SGU value is 5.885 W/m2.k, while the other coatings range from 0.5 to 1.7 W/m2.k. The significant difference of 4.185 between the ratios suggests a promising potential for temperature mitigation in building interiors.

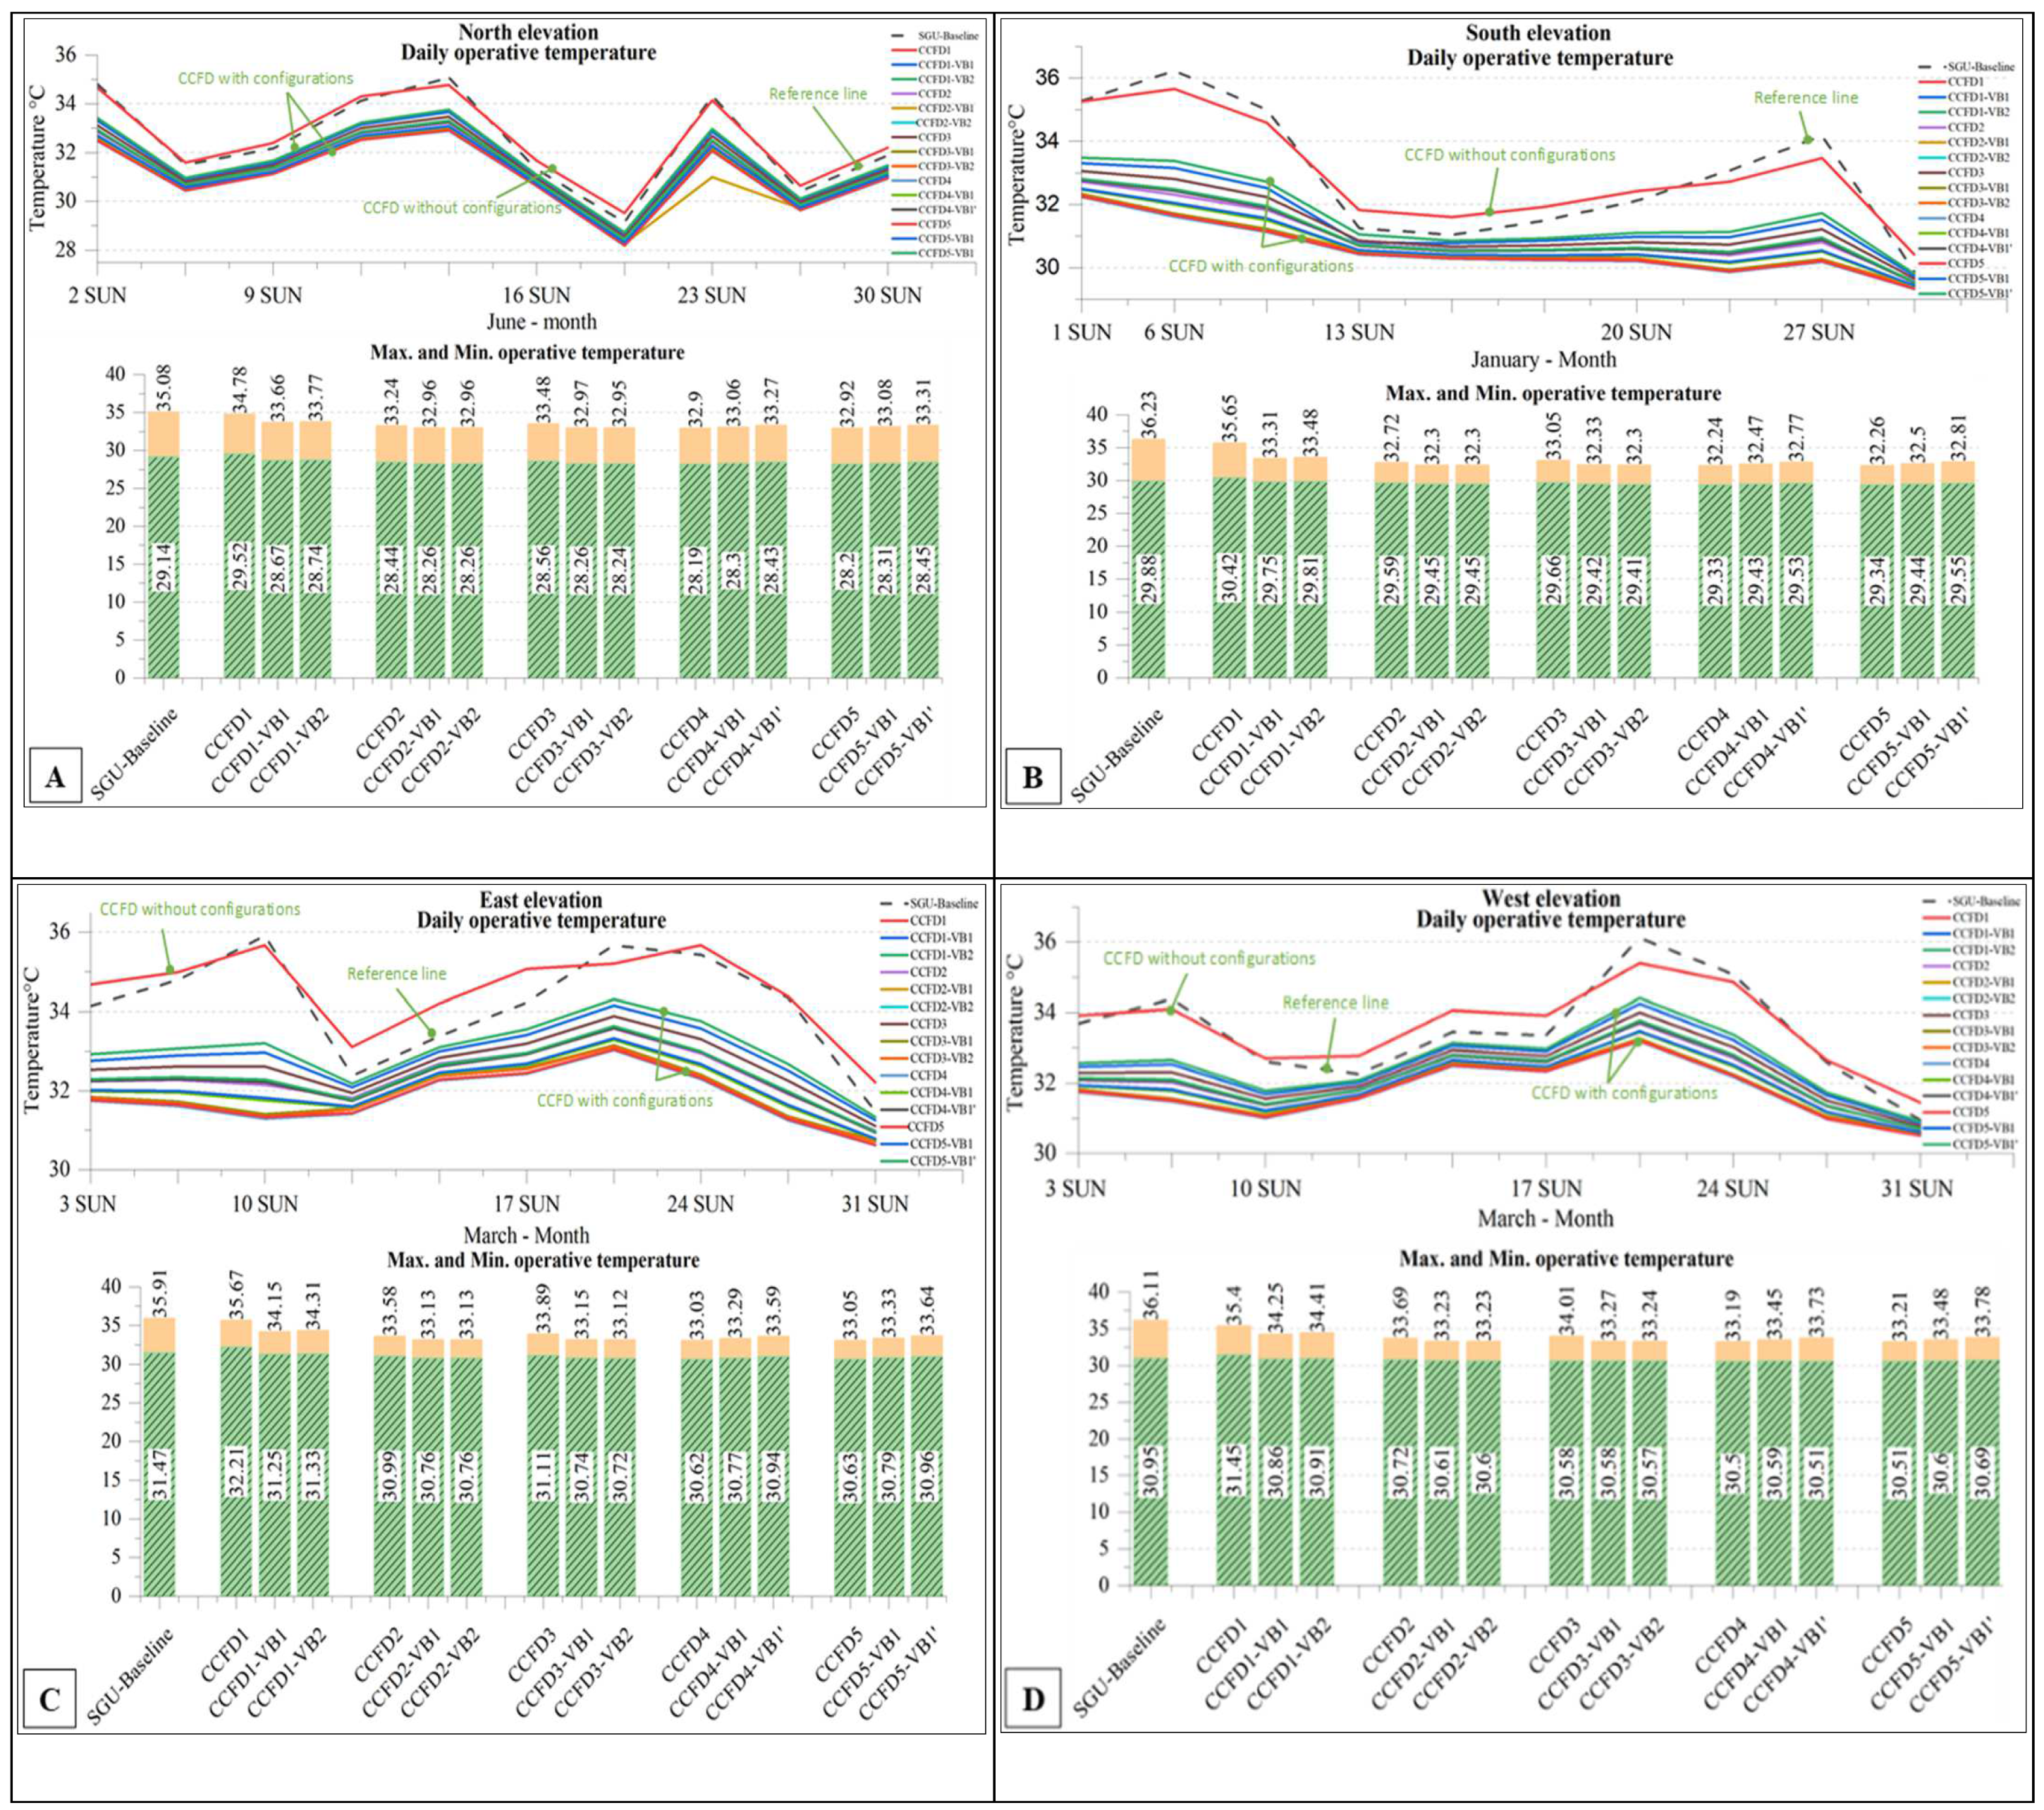
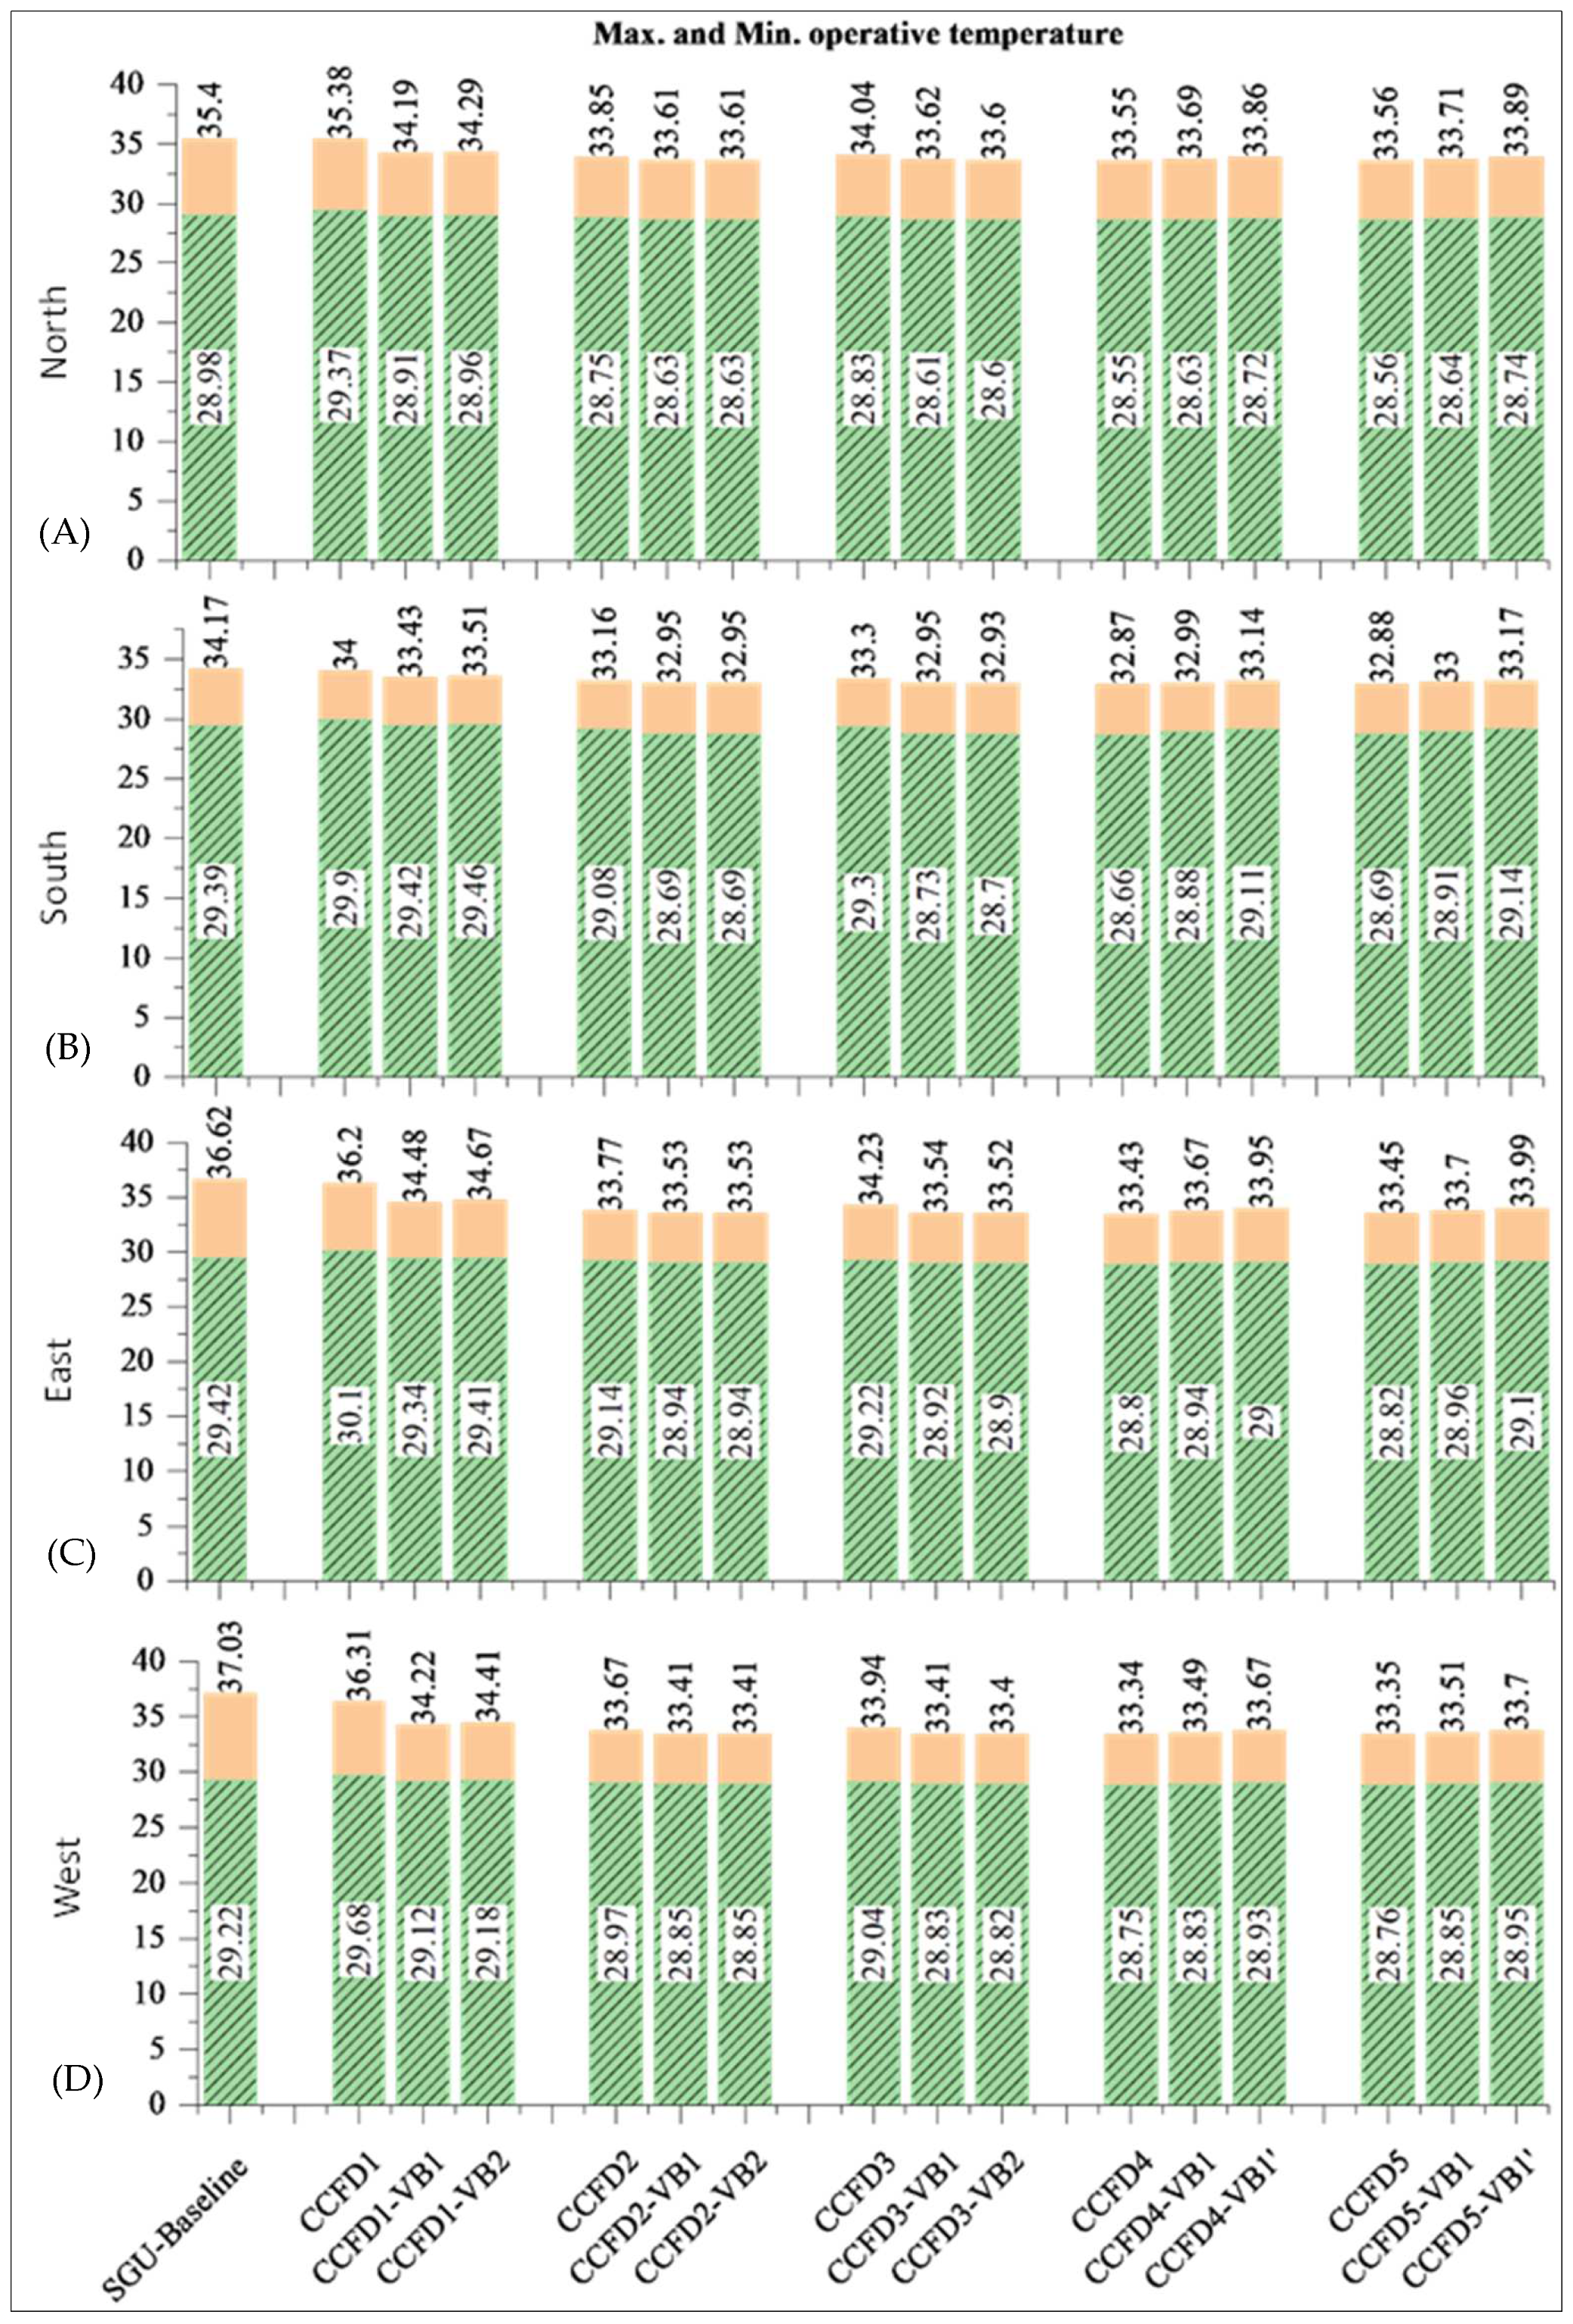
3.1. The Impacts of CCFDs on Peak Temperature Reduction

The comparative analysis of the daily peak operative temperature is depicted in Figure 8, which shows the performance of CCFDs against the reference condition, designated as SGU. The results obtained indicate a significant thermal performance improvement when integrating CCFDs, encompassing various coat configurations and two distinct variations of in-between Venetian blinds denoted as CCFDs-VB1 and CCFDs-VB2, into CCFD.
On the north elevation, as shown in Figure 8A, the application of CCFDs led to a noticeable reduction in daily peak operative temperatures at the various configurations. Particularly noteworthy is the preference for CCFD2, where the recorded average monthly peak temperatures for this configuration range from 28.26 °C to 32.96 °C, which are markedly lower than the reference case peak of 35.08 °C. Turning to the southern façade (Figure 8B), the CCFD2 configuration also exhibits a pronounced temperature moderation effect. The average monthly operative temperature peaks for the south-facing CCFD configurations were recorded between 29.45 °C and 32.3 °C. This range is significantly lower than the reference case, which stands at 36.23 °C. Given that the southern façade often receives the most substantial amount of solar radiation throughout the year, the reduction in peak temperatures here is particularly beneficial. For the eastern façade, as shown in Figure 8C, the CCFDs show a reduction in the monthly peak temperatures, with values ranging from 30.76 °C to 33.13 °C, compared to the reference condition peak of 35.91 °C. Similarly, the western façade (Figure 8D), which is subject to high afternoon temperatures, sees a reduction in peak operative temperatures with CCFD2 implementation, with values varying from 30.61 °C to 33.23 °C, in contrast to the reference condition’s peak of 36.11 °C. This indicates that the CCFDs are capable of reducing the thermal load during the later parts of the day when the sun is at its most intense. In summation, the CCFD2 in both configurations, CCFD2-VB1 and CCFD2-VB2, has shown a consistent pattern of reducing peak operative temperatures across all façades when compared to the SGU baseline. The data suggest that the integration of CCFDs can be an effective passive cooling strategy, contributing to the reduction of cooling loads and enhancing the indoor environmental quality for occupants.
Figure 9, in conjunction with the performance data from Table 4, provides for an insightful quantification of the efficiency improvements offered by CCFDs in a humid tropical climate, exemplified by the Malaysian context. Specifically, CCFD2 and CCFD4, when equipped with horizontal white Venetian blinds (VB1), are exemplified in Figure 5 as the most efficient configurations through simulation. The efficiency gains for these CCFDs configurations are depicted in Figure 9, which presents the quantitative efficiency percentages in comparison to the SGU.
The efficiency is calculated using the formula SGU/(SGU − CCF) × 100, indicating the proportional improvement of CCFDs over SGU. For the northern façade, CCFD2 and CCFD4 demonstrate efficiency improvements ranging from 27% to 85%. On the southern façade, the improvements are between 43% and 74%, while on the eastern and western façades, the gains are 32% to 58% and 32% to 61%, respectively. The improvements are mainly due to the decrease in SHGC values resulting from the integration of Venetian blinds into the cavities of CCFs. Table 4 substantiates this, with an SHGC value of 0.070 for CCFD2 equipped with white Venetian blinds and a 53/57 Low-E coating, and an SHGC value of 0.083 for CCFD4 with white Venetian blinds and an 83/58 nano-coating. This lower SHGC indicates the greater efficiency of CCFDs over SGU in reducing solar gain, which in turn contributes to a lower cooling load. The comparison of blinds with different coating characteristics further demonstrates the nuanced performance advantages. CCFD2’s lighter-colored blinds and 53/57 Low-E coating show a marginal performance increase of 1% over the darker-coated 57/72 Low-E blinds in CCFD3. Similarly, CCFD4’s light-colored blinds and 83/58 nano-coating exhibit a slight performance improvement of about 1% compared to the darker-coated 92/84 acrylic material in the other configurations. As Figure 8 and Figure 9 indicate, the most significant improvements in operative temperature are observed on the southern, western, eastern, and northern façades, in descending order. This hierarchy of performance improvement correlates with the orientation of the façade s and the amount of thermal radiation received, affirming the importance of façade orientation and the solar radiation ratio in the evaluation of façade performance.

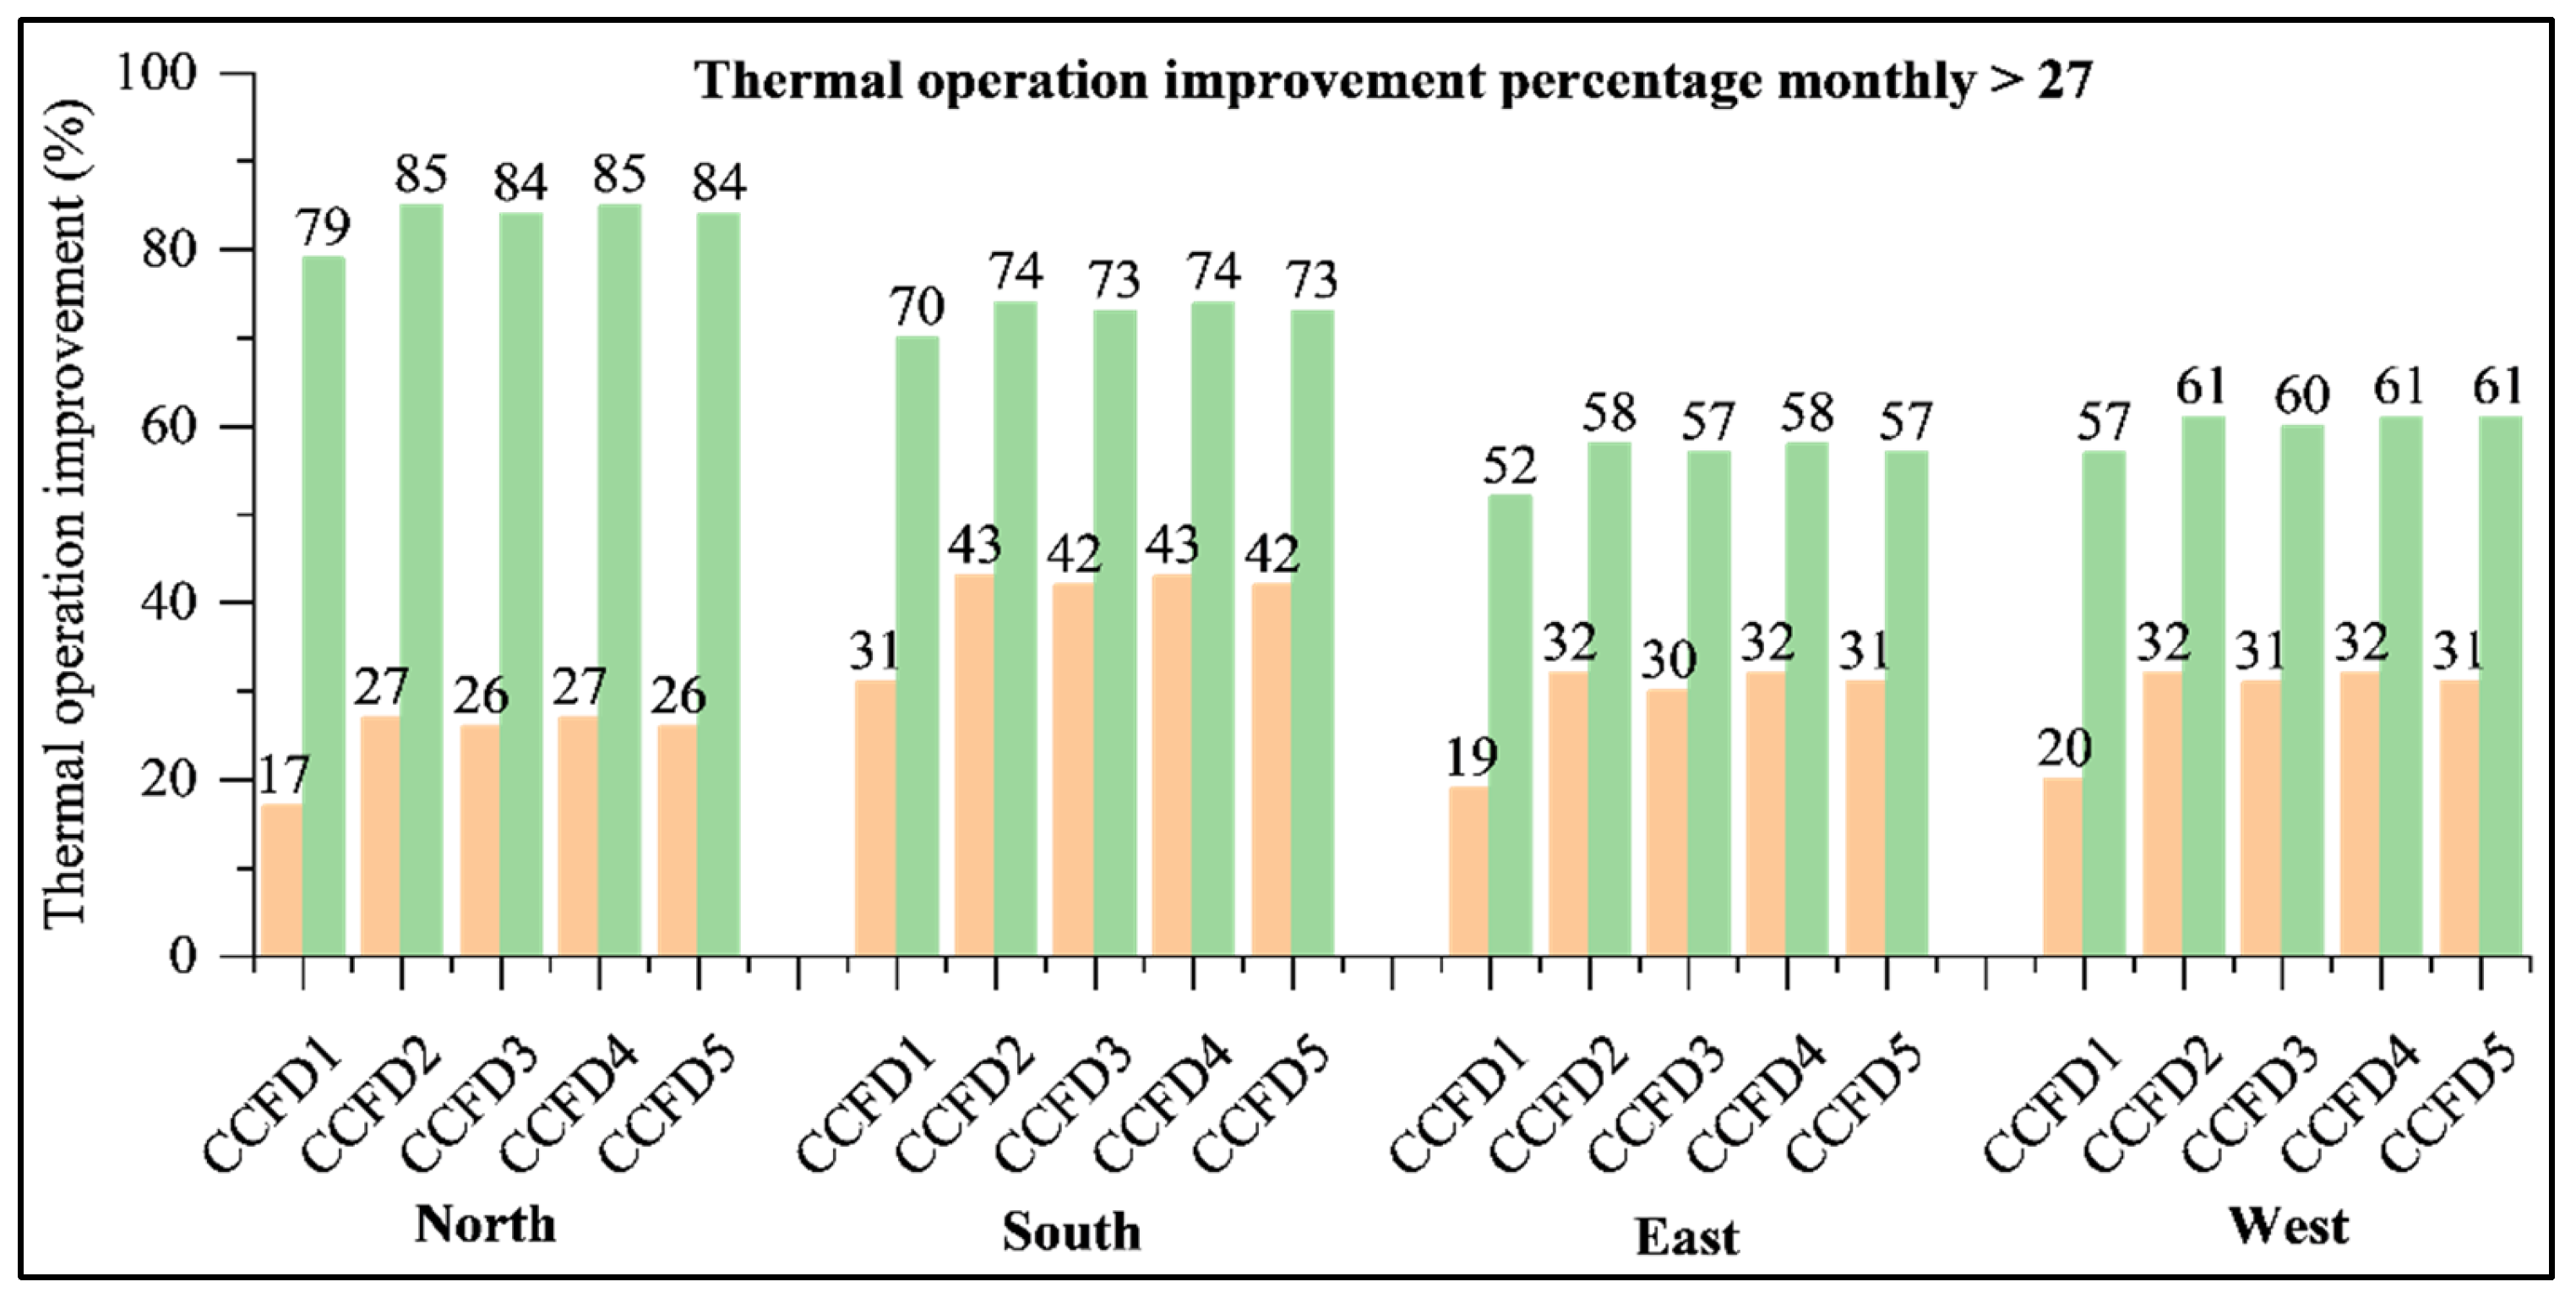
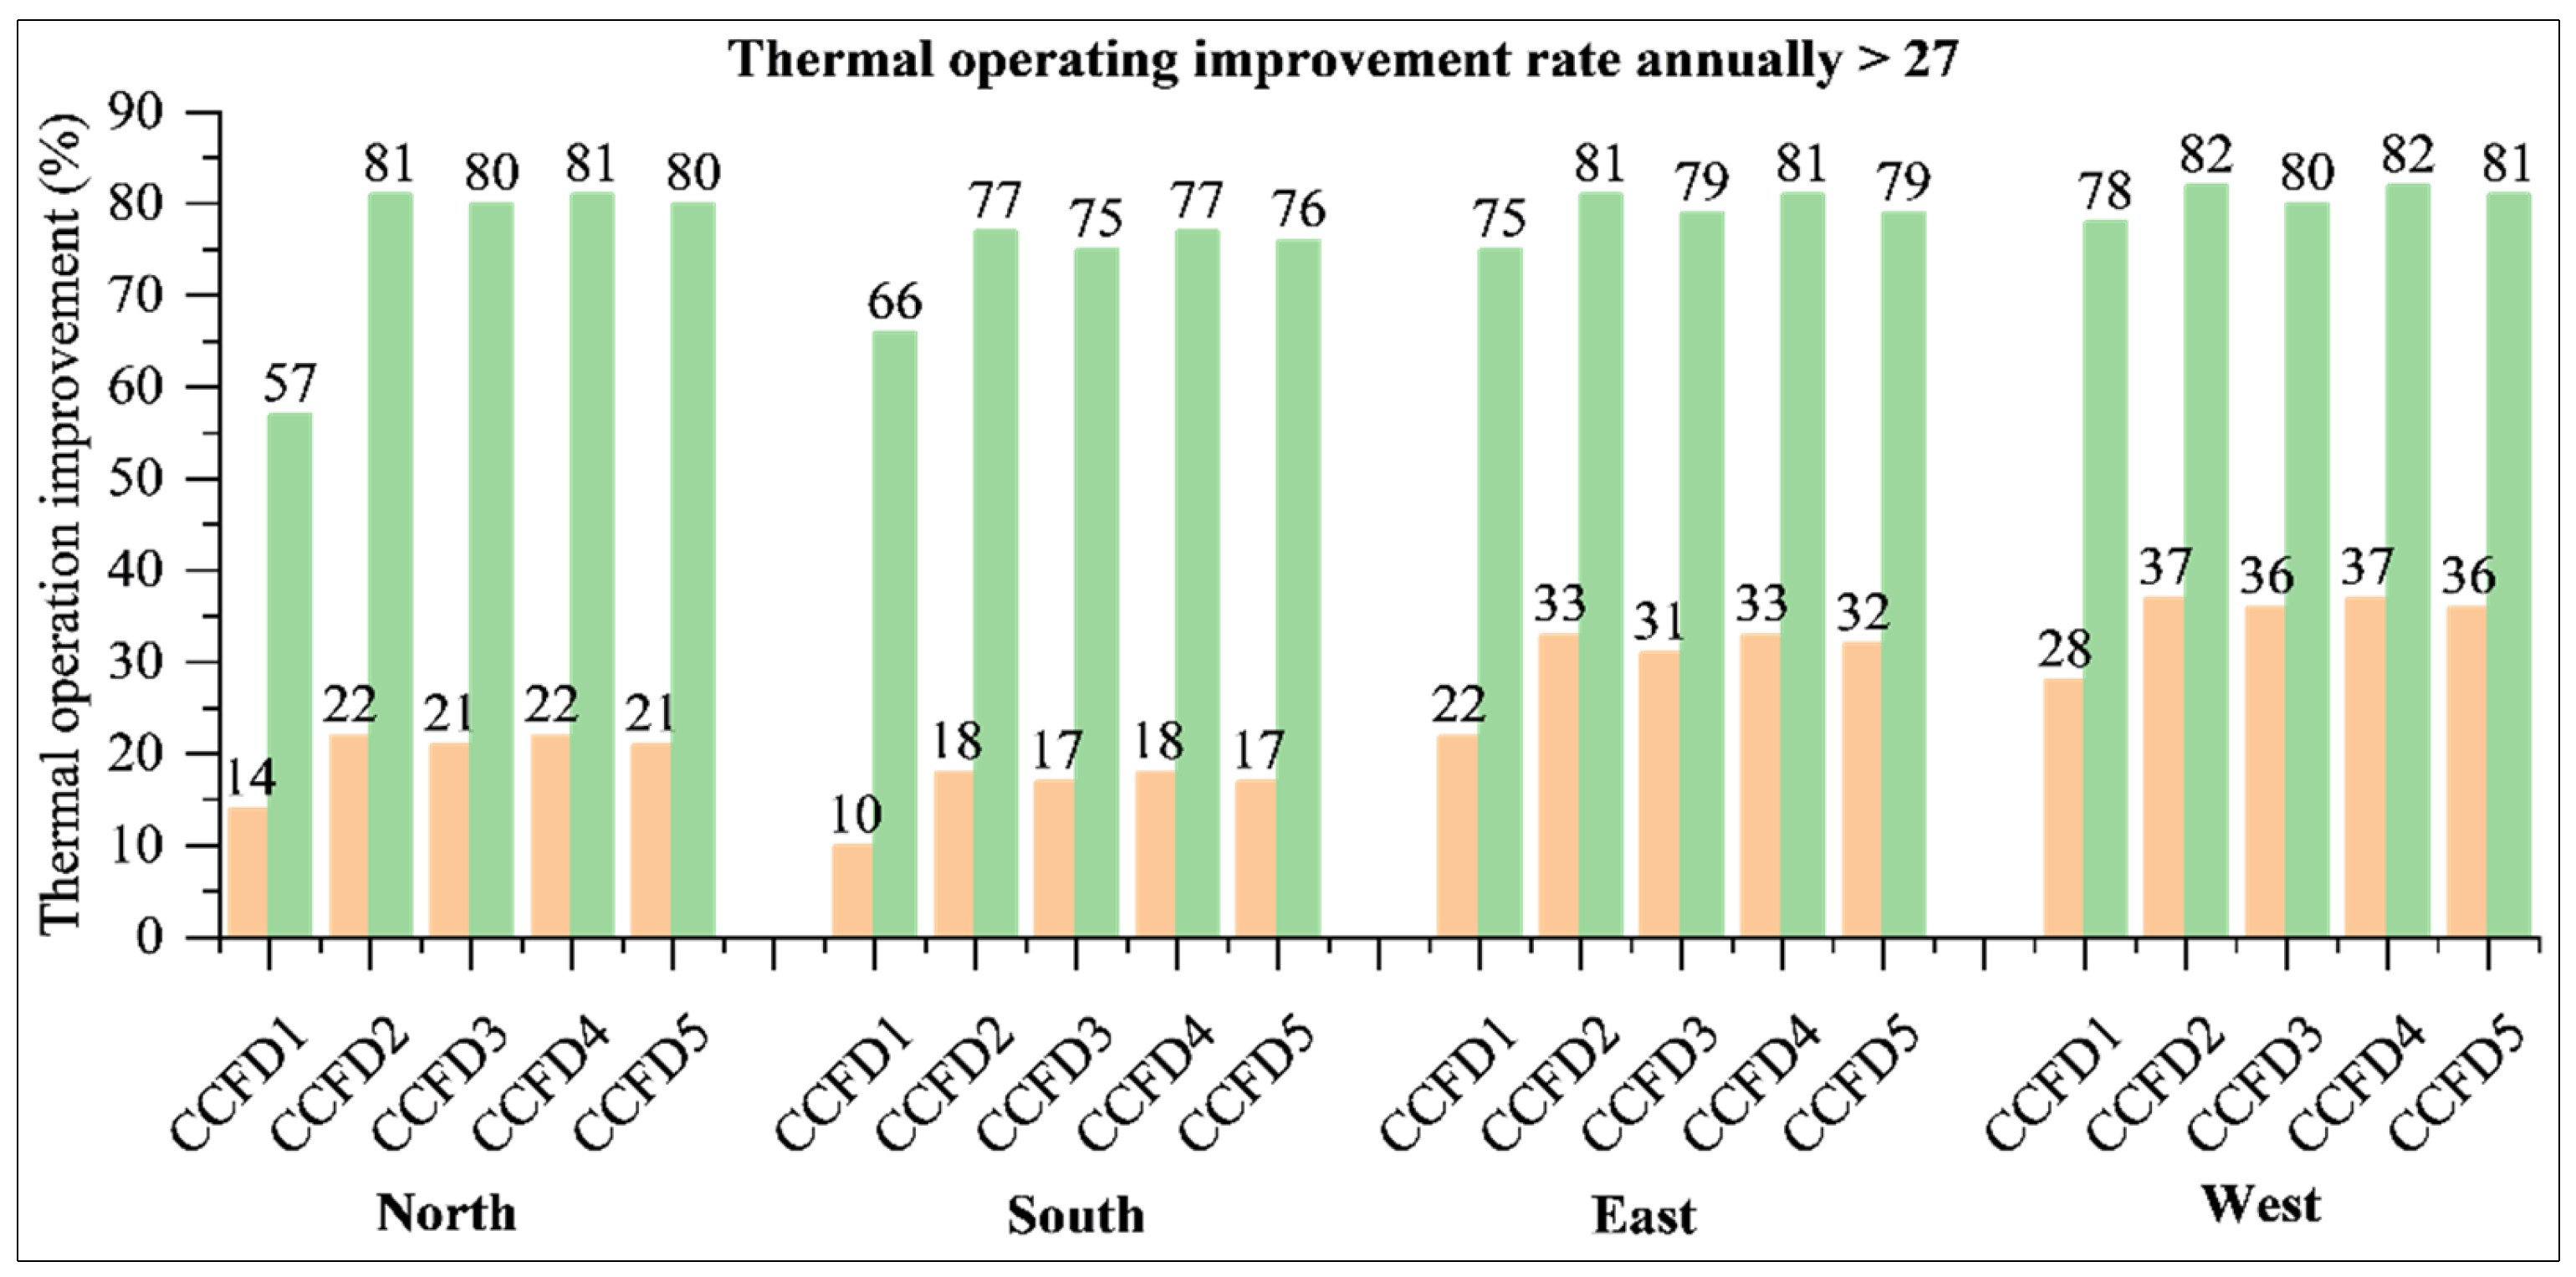
3.2. Year-Round Performance and Effectiveness of CCFDs

The yearly performance and effectiveness of CCFDs were evaluated against a baseline (SGU) for operational temperature comparison. As depicted in Figure 10, there was a noticeable year-round reduction in the peak operating temperatures across all the façade s assessed. For instance, the northern façade showed a 2 °C decrease in its maximum temperature, dropping from approximately 35.4 to 33.61 °C, and a 0.5 °C reduction in its minimum temperature, from 28.98 to 28.63 °C. This equates to an enhancement rate of 22–81%, particularly evident in the top-performing groups CCFD2 and CCFD4, as illustrated in Figure 11. On the southern façade, there was a 2 °C reduction in the upper temperature range, from 35.17 to 32.95 °C, and a 1 °C drop in the lower range, from 29.39 to 28.69 °C. This translates to an improvement rate of 18–77% for groups CCFD2 and CCFD4. The eastern façade exhibited a 3 °C decrease in its maximum temperature, from around 36.62 to 33.53 °C, and a 0.5 °C fall in the minimum temperature, from 29.42 to 28.94 °C, achieving an enhancement rate of 33–81% for the same leading groups. Moreover, the western façade showed a 4 °C decline in the upper temperature limit, from 37.03 to 33.41 °C, and a 0.5 °C drop in the lower limit, from 29.22 to 28.85 °C, resulting in an improvement ranging from 37 to 82% for groups CCFD2 and CCFD4.
As previously outlined in Figure 8, Figure 9 and Figure 10, Figure 11 affirms the hierarchical improvement sequence in façade performance, commencing with the most enhanced: western, eastern, northern, and southern. This progression is linked to each façade ’s distinct orientation and the varying intensity of thermal radiation it receives.
The current study indicates a notable decline in peak temperatures, with the highest temperatures above 27 °C falling by 2 to 4 °C and settling within a 33 to 31 °C range. Similarly, the lowest temperatures, initially at 27 °C, show a modest decrease of 0.5 to 1 °C. These reductions align with the thermal comfort thresholds for the interior environment’s operative temperatures (comprising both air and radiant temperatures) as delineated by prior research [5,17]. Consequently, there is a decrease in cooling demand within the humid tropical climate, a setting typically reliant on mechanical cooling systems. This change translates into energy savings ranging from 27% to 30% annually, thereby facilitating thermal comfort for occupants without relying on mechanical cooling solutions [20].
The predominant improvements observed in CCFD2 and CCFD4 are mainly due to the SHGC values resulting from the incorporation of Venetian blinds into the CCF, as delineated in Table 4. Specifically, CCFD2, equipped with white Venetian blinds and a 53/57 LE coating, exhibits an SHGC value of 0.070, while CCFD4, featuring white Venetian blinds and an 83/58 LE nano coating, registers an SHGC value of 0.083. This is due to the value of the SHGC, which is affected by the type of coating, internal mechanical shading, and the quantity of internal glass layers, and there is a proportional relationship between temperature and SHGC. Thus, the lower the SHGC value, the lower the temperature.
A comparative analysis reveals that, when contrasted with blinds incorporating a darker coating (57/72 LE) in CCFD3, the deployment of lighter-colored blinds and coating (53/23 LE) in CCFD2 results in a marginal performance enhancement (1%). Furthermore, in the case of CCFD4, the impact is manifested by a reduction in the operational temperature of the blinds, influenced by both the color and the type of glass coating applied. Specifically, the use of blinds with light colors and an 83/58 coating leads to a small enhancement in performance (around 1%) compared to blinds featuring a darker coating (92/84 acrylic material).
Table 5 describes a comparative analysis of this study with others [17,20,21], highlighting its unique context in Malaysia, characterized by a humid tropical climate. The investigation examined all façade orientations independently, adopting a meticulous approach to monthly assessments, starting with peak months and progressing to annual averages. Notably, the northern façade exhibited a monthly improvement rate of 27–85%, and the southern façade showed a rate of 43–74%, while the eastern and western façade s demonstrated rates of 32–58%. Furthermore, the annual average operating temperature indicated a potential improvement ranging from 27.5% to 80.25%.
When compared with previous studies conducted across nine distinct locations with varied climatic conditions—from the tropical savanna of Rio de Janeiro to the continental monsoon-influenced climate of Beijing—it becomes evident that these studies typically assessed temperature comfort levels on an annual basis within a room with three open walls (east, west and south), achieving a temperature comfort level between 68.2% and 89.6%. Furthermore, a prior investigation undertaken by researchers [21] examined the CCF-TGU façade under identical tropical climatic conditions in four orientations. It demonstrated a monthly enhancement in the northern façade ranging from 38.5% to 94.5%, the southern façade from 49% to 86%, the eastern façade from 40.5% to 67.5%, and the western façade from 40.5% to 69.5%. The average annual improvement percentage was reported to be between 38.5% and 90%, as detailed in Table 5.
These studies have underscored CCFD2 with a 53/57 Low-E coating as the optimal configuration for achieving thermal comfort. Furthermore, this investigation aligns with and builds upon the findings of other studies [31,32,33], validating the superior performance of the CCFD4 configuration, which utilizes a 58/83 nano-coating with a silver reflector, particularly effective in the tropical climate.
Interestingly, while Table 5 indicates that improvement percentages across these diverse studies are somewhat analogous when considering annual results, the current study exhibits a notably high rate of improvement within the humid tropical climate. This suggests that while CCFD applications are broadly effective, their performance is particularly enhanced in climates characterized by high humidity, where the reduction in solar gain and cooling load is of paramount importance. The integration of CCFD technologies, as demonstrated by the current study, therefore not only aligns with global trends in improving thermal comfort, but also highlights the distinct advantages offered in tropical humid climates. These results reinforce the position of CCFDs as a viable and effective solution for passive climate control in building design, contributing to energy conservation and sustainable building practices.
In general, the study’s findings regarding the effectiveness of CCFs in tropical climates have significant implications for building design, energy policy, and sustainability. In real-world scenarios, incorporating CCFs with advanced glass coatings and Venetian blinds in building designs leads to substantial improvements in thermal efficiency. This could result in reduced reliance on air conditioning, leading to lower energy consumption and costs, and a corresponding decrease in greenhouse gas emissions. These benefits align well with global sustainability goals and energy efficiency policies. Additionally, the enhanced occupant comfort provided by CCFs, as evidenced by their superior performance compared to SGUs, can improve living and working environments in hot and humid climates like Malaysia’s. The study underscores the potential of integrating innovative glazing technologies in building design as a strategy for achieving thermal comfort, energy savings, and sustainability in the construction sector, especially in tropical regions.

4. Conclusions and Future Work

The recently investigated CCF systems exert a discernible influence on thermal comfort, specifically pertaining to the operative temperature within buildings. Employing simulation tools such as Design Builder, EnergyPlus, and Windows 7.8, this investigation systematically evaluated the performance of SGUs in comparison to various configurations of CCFs within a tropical humid climate. The analysis underscores the superior thermal comfort provided by CCFs over SGUs equipped with grey coatings.
Notably, the efficacy and success of the CCFs are contingent upon several factors, encompassing the number of interior layers, the composition of the coating material, the material utilized for mechanical shading within the inner cavity, and the depth of said cavity. These variables collectively influence the SHGC value, which plays a pivotal role in determining the product’s effectiveness in specific climates and environments. Given the proportional relationship between the SHGC value and temperature, the study reveals noteworthy reductions in internal operating temperatures. The investigation concludes by outlining several key findings derived from the comprehensive analysis:
The monthly growth rates of the CCF-DGU exhibited the following patterns—a range of 27–85% for the northern façade, 43–74% for the southern façade, 32–58% for the eastern façade, and 32–58% for the western façade. Furthermore, the annual growth rate demonstrated variability within the range of 27.5% to 80.25%;
The most significant reductions in peak operating temperatures were achieved with the implementation of CCFD2 featuring a 53/57 Low-E coating and CCFD4 equipped with an 83/58 Low-E nano-coating;
Regarding occupant comfort, CCFD2 and CCFD4 configurations delivered consistent year-round performance, achieving a maximum annual reduction in peak operating temperatures of 2 to 4 °C and a minimum annual reduction of 0.5 to 1 °C;
Improvements in thermal efficiency can be ascribed to the integration of Venetian blinds within the CCF cavities and the judicious utilization of glass coatings. These modifications have had a favorable impact on U-value and SHGC, leading to decreased energy consumption, particularly in settings where cooling requirements are predominant. The correlation between temperature and humidity is inversely proportional. Consequently, a lower SHGC value correlates with lower temperatures and higher relative humidity;
The study further reveals that opting for lighter-colored blinds or glass coatings with a 53/23 (Tvis/Tsol) ratio and an 83/58 nano-coating as opposed to 72/57 Low-E or 92/84 acrylic materials can lead to a performance increase of around 1%.
An inherent limitation encountered in this research was due to the innovative nature of the CCF product. As a novel entity, it lacked a pre-existing simulation block for direct application, necessitating the creation of a custom block within the WINDOW 7.8 program. Significant challenges were faced during the development of this custom block, primarily caused by the unavailability of specific materials crucial to the CCF product. In response to this issue, alternative materials were employed, chosen for their close resemblance in physical properties to the original materials. It is imperative to acknowledge that this substitution, despite being carefully selected to closely match the original properties, might lead to certain deviations in the simulation results as compared to those that would have been obtained using the original materials.
This study emphasizes the need for the additional validation of CCF simulations through experiments. Given potential variations in optimal CCF application based on climate, it is crucial to assess their effectiveness across diverse climatic conditions in Malaysia. To comprehensively understand CCFs’ impact on energy consumption, investigations should be conducted under continuous day and night air conditioning. Assessing multiple coatings on CCFs is vital to ensuring optimal thermal comfort. Additionally, it is recommended to thoroughly analyze transient CCF performance using CFD, exploring variations in control mechanisms and slat angles. Due to its closed nature, potential overheating within the CCF cavity needs scrutiny, considering the absence of natural ventilation openings. This is important to prevent internal room air from becoming excessively hot during prolonged use, particularly given the inverse relationship between temperature and humidity, which can lead to moisture retention and increased building temperature. Therefore, experimental validation, supported by a mechanical vacuum and sensors, in real climate conditions, is proposed for the product process.

Research Contributions

This study’s principal contributions are as follows:
It has been confirmed that in Malaysia’s tropical climate, the application of CCF serves as an effective passive cooling strategy for buildings reliant on natural ventilation;
The practicality of CCF installation on external building walls has been substantiated, aligning with the anticipated outcomes;
The study has successfully demonstrated a reduction in the highest indoor temperatures, thereby extending the range of conditions considered comfortable for occupants;
It has been established that a singular, optimal CCF configuration can deliver consistent thermal comfort throughout the year;
The research has pinpointed the most effective coating attributes to enhance the ability of CCF applications to deliver optimal indoor thermal comfort levels.

Author Contributions

Conceptualization, A.F.A.K. and A.A.M.A.; Methodology, N.A.-T. and A.M.Q.; Software, A.F.A.K.; Validation, N.A.-T., A.F.A.K. and A.M.Q.; Formal analysis, A.A.M.A.; Data curation, A.M.Q.; Writing—original draft, A.F.A.K.; Writing—review & editing, N.A.-T. and A.M.Q.; Funding acquisition, N.A.-T. All authors have read and agreed to the published version of the manuscript.

Funding

This research was funded by Deanship of Scientific Research at Najran University grant number NU/DRP/SERC/12/14.

Data Availability Statement

The raw data supporting the conclusions of this article will be made available by the authors on request.

Acknowledgments

The authors are thankful to the Deanship of Scientific Research at Najran University for funding this work, under the Distinguished Research Funding program, grant code NU/DRP/SERC/12/14. Additionally, they would like to acknowledge “Universiti Sains Malaysia” for providing the necessary instruments needed for conducting field measurements.

Conflicts of Interest

The authors declare no conflict of interest.

Abbreviations

ASHRAEAmerican Society of Heating, Refrigerating, and Air-Conditioning EngineersRHRelative humidity
CCFClosed-cavity façadesSGUSingle glazing unit
CCFDClosed-cavity façades with inner double-glazed unit SHGCSolar heat gain coefficient
CIBSEChartered Institution of Building Services Engineers TGUTriple glazing unit
DGUDouble glazing unitTinIndoor air temperature
HVACHeating ventilation and air conditioningToOperative temperature
ISOInternational Organization for StandardizationTsolSolar transmittance
Low-eLow emissivity TvisVisible transmittance
PMVPredicted mean voteU-valueThermal transmittance
PPDPredicted percentage of dissatisfiedVBVenetian blind

References

  1. Tuck, N.W.; Zaki, S.A.; Hagishima, A.; Rijal, H.B.; Zakaria, M.A.; Yakub, F. Effectiveness of free running passive cooling strategies for indoor thermal environments: Example from a two-storey corner terrace house in Malaysia. Build. Environ. 2019, 160, 106214. [Google Scholar] [CrossRef]
  2. Al-Tamimi, N.A.; Syed Fadzil, S.F. Energy Efficient Envelope Design for High-Rise Residential Buildings in Malaysia. Archit. Sci. Rev. 2012, 55, 119–127. [Google Scholar] [CrossRef]
  3. Birchmore, R.C.; Berry, T.-A.; Wallis, S.L.; Tsai, S.; Hernandez, G. Thermal performance and indoor air quality in new, medium density houses—Auckland, New Zealand. Int. J. Build. Pathol. Adapt. 2023, 41, 279–300. [Google Scholar] [CrossRef]
  4. Taban, E.; Soltani, P.; Berardi, U.; Putra, A.; Mousavi, S.M.; Faridan, M.; Samaei, S.E.; Khavanin, A. Measurement, modeling, and optimization of sound absorption performance of Kenaf fibers for building applications. Build. Environ. 2020, 180, 107087. [Google Scholar] [CrossRef]
  5. Al-Absi, Z.A.; Mohd Isa, M.H.; Ismail, M. Phase Change Materials (PCMs) and Their Optimum Position in Building Walls. Sustainability 2020, 12, 1294. [Google Scholar] [CrossRef]
  6. Shaikh, P.H.; Nor, N.B.M.; Sahito, A.A.; Nallagownden, P.; Elamvazuthi, I.; Shaikh, M.S. Building energy for sustainable development in Malaysia: A review. Renew. Sustain. Energy Rev. 2017, 75, 1392–1403. [Google Scholar] [CrossRef]
  7. Al-Absi, Z.A.; Mohd Hafizal, M.I.; Ismail, M.; Mardiana, A.; Ghazali, A. Peak indoor air temperature reduction for buildings in hot-humid climate using phase change materials. Case Stud. Therm. Eng. 2020, 22, 100762. [Google Scholar] [CrossRef]
  8. Cuce, E. Development of Innovative Window and Fabric Technologies for Low-Carbon Buildings. Ph.D. Thesis, University of Nottingham, Nottingham, UK, 2015. [Google Scholar]
  9. Shaeri, J.; Habibi, A.; Yaghoubi, M.; Chokhachian, A. The Optimum Window-to-Wall Ratio in Office Buildings for Hot–Humid, Hot–Dry, and Cold Climates in Iran. Environments 2019, 6, 45. [Google Scholar] [CrossRef]
  10. Al-Tamimi, N.A.; Syed Fadzil, S.F. Thermal Performance Analysis for Ventilated and Unventilated Glazed Rooms in Malaysia (Comparing Simulated to Field Data). Indoor Built Environ. 2011, 20, 534–542. [Google Scholar] [CrossRef]
  11. IEA. Global Status Report for Buildings and Construction 2019; International Energy Agency: Paris, France, License: CC BY 4.0; 2019; Available online: https://www.iea.org/reports/global-status-report-for-buildings-and-construction-2019 (accessed on 1 December 2019).
  12. Qahtan, A.M. Thermal conditions in workspace centre and adjacent to inclined glazed façade of a green-certified office building in the tropics. Case Stud. Therm. Eng. 2024, 53, 103798. [Google Scholar] [CrossRef]
  13. Somasundaram, S.; Thangavelu, S.R.; Chong, A. Improving building efficiency using low-e coating based retrofit double glazing with solar films. Appl. Therm. Eng. 2020, 171, 115064. [Google Scholar] [CrossRef]
  14. Pomponi, F.; Piroozfar, P.A.E.; Southall, R.; Ashton, P.; Farr, E.R.P. Energy performance of Double-Skin Façades in temperate climates: A systematic review and meta-analysis. Renew. Sustain. Energy Rev. 2016, 54, 1525–1536. [Google Scholar] [CrossRef]
  15. Qahtan, A.M. Thermal performance of a double-skin façade exposed to direct solar radiation in the tropical climate of Malaysia: A case study. Case Stud. Therm. Eng. 2019, 14, 100419. [Google Scholar] [CrossRef]
  16. Reza, E.; Suleiman, A.S. Assessing the Effect of Prefabricated Double-Skin Façade on the Thermal Comfort of Office Building to Achieve Sustainability: Case Studies of Office Complex, Kuchigoro and Office Complex, Garki, Abuja-Nigeria. Future Cities Environ. 2021, 7, 15. [Google Scholar] [CrossRef]
  17. Michael, M.; Overend, M. The impact of using Closed Cavity Façades (CCF) on buildings’ thermal and visual performance. J. Phys. Conf. Ser. 2021, 2069, 012021. [Google Scholar] [CrossRef]
  18. Bonham, M.B. Elevating a facade theory into practice. In Proceedings of the ARCC Conference Repository, Toronto, ON, Canada, 29 May–1 June 2019; Volume 1. [Google Scholar]
  19. Romano, R.; Aelenei, L.; Aelenei, D.; Mazzucchelli, E.S. What is an adaptive façade? Analysis of Recent Terms and definitions from an international perspective. J. Facade Des. Eng. 2018, 6, 65–76. [Google Scholar]
  20. Michael, M.; Overend, M. Closed cavity façade, an innovative energy saving façade. Build. Serv. Eng. Res. Technol. 2022, 43, 279–296. [Google Scholar] [CrossRef]
  21. Al Kahlout, A.F.; Baharum, F.; Alqanoo, A.A.; Nawi, M.N.M. Investigation of CCF with TGU as Inner Skin to Reduce Peak Operating Temperature for Thermal Comfort in an Indoor Environment in a Hot, Humid Climate. J. Adv. Res. Fluid Mech. Therm. Sci. 2023, 110, 108–123. [Google Scholar]
  22. Al-Absi, Z. The Performance of Pcm-Enhanced Walls for the Reduction of Peak Indoor Temperature in Tropical Climate. Ph.D. Thesis, Universiti Sains Malaysia, George Town, Malaysia, 2021. [Google Scholar]
  23. ASHRAE. Thermal Environmental Conditions for Human Occupancy, in ASHRAE Standard 55, American Society of Heating, Refrigerating and Air-Conditioning Engineering; ASHRAE: Atlanta, GA, USA, 2010. [Google Scholar]
  24. ISO 15099:2003; Thermal Performance of Windows, Doors and Shading Devices-Detailed Calculations. International Organization for Standardization: Geneva, Switzerland, 2003.
  25. Catto Lucchino, E.; Gelesz, A.; Skeie, K.; Gennaro, G.; Reith, A.; Serra, V.; Goia, F. Modelling double skin façades (DSFs) in whole-building energy simulation tools: Validation and inter-software comparison of a mechanically ventilated single-story DSF. Build. Environ. 2021, 199, 107906. [Google Scholar] [CrossRef]
  26. Ramakrishnan, S.; Wang, X.; Sanjayan, J.; Wilson, J. Thermal performance of buildings integrated with phase change materials to reduce heat stress risks during extreme heatwave events. Appl. Energy 2017, 194, 410–421. [Google Scholar] [CrossRef]
  27. Kośny, J. PCM-Enhanced Building Components: An Application of Phase Change Materials in Building Envelopes and Internal Structures; Springer International Publishing: Cham, Switzerland, 2015. [Google Scholar]
  28. Curpek, J.; Hraska, J. Simulation Study on Thermal Performance of a Ventilated PV Façade Coupled with PCM. Appl. Mech. Mater. 2017, 861, 167–174. [Google Scholar] [CrossRef]
  29. DesignBuilder. User Manual; Design Builder Software Ltd.: Stroud, UK, 2021. [Google Scholar]
  30. Sovetova, M.; Memon, S.A.; Kim, J. Thermal performance and energy efficiency of building integrated with PCMs in hot desert climate region. Sol. Energy 2019, 189, 357–371. [Google Scholar] [CrossRef]
  31. Maduru, V.R.; Shaik, S.; Cuce, E.; Afzal, A.; Panchal, H.; Cuce, P.M. UV coated acrylics as a substitute for generic glazing in buildings of Indian climatic conditions: Prospective for energy savings, CO2 abatement, and visual acceptability. Energy Build. 2022, 268, 112231. [Google Scholar]
  32. Alqanoo, A.A.M.; Ahmed, N.M.; Hashim, M.R.; Alsadig, A.; Al-Yousif, S.; Taya, S.A.; Aldaghri, O.A.; Ibnaouf, K.H. Coating Readily Available Yet Thermally Resistant Surfaces with 3D Silver Nanowire Scaffolds: A Step toward Efficient Heater Fabrication. Coatings 2023, 13, 315. [Google Scholar] [CrossRef]
  33. Jastaneyah, Z.; Kamar, H.M.; Alansari, A.; Al Garalleh, H. A Comparative Analysis of Standard and Nano-Structured Glass for Enhancing Heat Transfer and Reducing Energy Consumption Using Metal and Oxide Nanoparticles: A Review. Sustainability 2023, 15, 9221. [Google Scholar] [CrossRef]
Figure 1. Foundational elements of the closed-cavity façade (created by (Michael & Overend, 2021) [17].
Buildings 14 00603 g001
Figure 2. Details of the case study: (A) location map, (B) the six blocks of the condominium, (C) layout of each building, (D) floor plan of each unit.
Buildings 14 00603 g002
Figure 3. Selected building for field measurements, tools used in these measurements, and examples of instrument installation.
Buildings 14 00603 g003
Figure 4. DO 9847K datalogger instrument with the sensors used.
Buildings 14 00603 g004
Figure 5. (A) Diagram illustrating the heat transfer mechanism in CCF, (B) schematic diagrams of the five groups of CCFs configurations simulated.
Buildings 14 00603 g005
Figure 6. A numerical representation of the original structure and its rooms [29].
Buildings 14 00603 g006
Figure 7. Validation of measured-to-predicted Ti (°C) for the four façades.
Buildings 14 00603 g007
Figure 8. Daily and monthly highs and lows averaged across north (A), south (B), east (C), and west (D) Façade s for each CCFDs variant.
Buildings 14 00603 g008
Figure 9. Monthly averaged percentage of operating temperature enhancement across north, south, east, and west Façade s for CCFDs.
Buildings 14 00603 g009
Figure 10. Annual averages of high and low temperatures for north (A), south (B), east (C), and west (D) Façade s as a function of different configurations of CCFs.
Buildings 14 00603 g010
Figure 11. Annual daily average of operating temperature improvement percentage across north, south, east, and west Façade s for CCFDs.
Buildings 14 00603 g011
Table 1. Climatic data for the selected location (retrieved from EnergyPlus and OneBuilding website) [22].
LocationClimate ClassMonthly Air TemperatureRelative HumidityMonthly
Global Radiation
Max.Min.Max.Min.Max.Min.
Penang, MalaysiaTropical–humid34 °C26 °C97%55%9.17.1
Table 2. Building construction specifications and characteristics of the investigated rooms in the building.
Characteristics Description [22]
Number of storeys22
Number of unites in each floor4
Gross floor areas of each unit184 m2
Number of occupations per unit3
Total height of the storey2.85 m2
External walls
from outside to inside
(U-value = 3.398 W/m2K)
17 mm External cement render
100 mm Concrete blocks
13 mm Internal cement plaster
Internal partitions
(U-value = 2.299 W/m2K)
13 mm Cement plaster
100 mm Brick wall
13 mm Cement plaster
Floor
(U-value = 2.86 W/m2K)
10 mm Ceramic tiles
13 mm Internal cement plaster
150 mm Concrete slab
WWR85%
Each unit has: Three bedrooms, two bathrooms, a kitchen and a living room
Type of glass
(U-value = 6.121 W/m2K)
Single gray 6 mm + aluminium frame
RoomDescriptionFloorAreaOrientation
Space 1Bedroom3rd24 m2East
Space 2Living Room20rd26 m2North
Space 3Bedroom20rd22 m2West
Space 4Living Room20th26 m2South
Table 3. Sensors used with the DO 9847K datalogger instrument.
SensorVariablesRangeAccuracyResolution
HP3217.2RHumidity0 to 100% RH0.1% RH0.1% RH
AP471 S1Air speed0.05 to 40 m/s0.05 m/s (0.05 to 0.99 m/s)
0.2 m/s (1.00 to 9.99 m/s)
0.6 m/s (10 to 40 m/s)
0.01 m/s
AP471 S1Temperature−30 to +110 °C±0.4 °C0.1 °C
Table 4. Performance values of the CCF glazing configurations simulated [17].
GroupsGlazing ConfigurationU-Value (w/m2k)SHGCTsolTvis
BaselineSGU with grey coating5.8820.6700.5500.559
Group 1CCFD11.6720.6530.5310.701
CCFD1-VB11.2400.2590.1230.169
CCFD1-VB21.2470.2860.0390.045
Group 2CCFD20.9710.1560.1150.343
CCFD2-VB10.7800.0700.0260.077
CCFD2-VB20.7830.0700.0070.022
Group 3CCFD31.2550.2190.1650.460
CCFD3-VB11.0210.0860.0380.103
CCFD3-VB21.0260.0810.0290.011
Group 4CCFD41.3780.0830.02480.049
CCFD4-VB11.3790.1290.03800.074
CCFD4-VB1′1.3790.1770.05090.096
Group 5CCFD51.3650.0870.03410.055
CCFD5-VB11.3660.1350.05280.083
CCFD5-VB1′1.3660.1840.07130.108
Table 5. Comparison of prior research with the current study on CCFDs.
The StudyLocationClimate CharacteristicElevationsThermal Operation Improvement Percentage Monthly > 27Thermal Operating Improvement Rate Annually > 27Configuration with the Best Results
The current studyPenang—MalaysiaTropical humidityNorth27–85%27.5–80.25%CCFD2 with E-low coating 53/23LE and CCFD4 with nano-coating 83/58
South43–74%
East32–58%
West32–58%
Previous study [21]Penang—MalaysiaTropical humidityNorth38.5–94.5%38.5–90%CCFT2 with E-low coating 53/23LE and CCFT4 with nano-coating 83/58
South49–86%
East40.5–67.5%
West40.5–69.5%
Previous study [17,20]Rio de JaneiroTropical savannaA room with three open sides, south, east and west.N/A68.2–89.6%CCFD2 with E-low coating 53/23 LE
DubaiDry desert hot
SydneyTemperature humidity
New YorkTemperature humidity
ShanghaiTemperature humidity
LondonTemperature oceanic
TorontoContinental hot summer humid
BeijingContinental monsoon-influenced
HelsinkiContinental warm summer humid
Disclaimer/Publisher’s Note: The statements, opinions and data contained in all publications are solely those of the individual author(s) and contributor(s) and not of MDPI and/or the editor(s). MDPI and/or the editor(s) disclaim responsibility for any injury to people or property resulting from any ideas, methods, instructions or products referred to in the content.

