Article

Determining the Most Consensus-Based Assessment Method for Social Sustainability—Case Study of a Suburb of Karlstad, Sweden

1
Department of Biotechnology and Health, School of Engineering Sciences in Chemistry, KTH, Royal Institute of Technology, 114 28 Stockholm, Sweden
2
Department of Engineering and Chemical Sciences, Karlstad University, 651 88 Karlstad, Sweden
3
Department of Architecture and Civil Engineering, Chalmers University of Technology, 412 96 Gothenburg, Sweden
4
Independent Researcher, 661 30 Säffle, Sweden
*
Author to whom correspondence should be addressed.
Buildings 2024, 14(11), 3395; https://doi.org/10.3390/buildings14113395
Submission received: 11 August 2024 / Revised: 13 October 2024 / Accepted: 23 October 2024 / Published: 25 October 2024
(This article belongs to the Section Architectural Design, Urban Science, and Real Estate)

Abstract

An assessment method for sustainability was developed by the authors in a previous article. Many social sustainability assessment methods rely on assessors’ subjective judgments, which can be problematic. This study aims to examine the level of consensus different assessors can achieve using various assessment methods and to compare their results with an assessment made by one of the authors, to reduce subjectivity. A selective sample of engineering students from Karlstad University were surveyed to test and compare three as-assessment methods against the initial assessment. The three methods are: Woxnerud’s (the authors’) method, Jan Gehl’s twelve quality criteria, and a structured survey. Seven student groups conducted the first assessment, followed by 12 individual students who performed the second and third assessments. The objectives were to determine whether multiple assessors could reach a consensus using each method, identify which method yielded the most consensus and was most effectively implemented, and measure each method’s consonance rate in relation to Woxnerud’s initial assessment. The first method achieved a 75.0% assessor consensus and 98.4% consonance. The second method achieved a 67.0% assessor consensus and 75.0% consonance. The third method achieved a 50% assessor consensus and 91.0% consonance. This limited study suggests that a subjective method, such as an assessment method for social sustainability, can yield somewhat similar results, and in addition, Woxnerud’s method is more objectively applicable than the two other methods tested in this article.

1. Introduction and Background

Examining urban sustainability is crucial for urban planning. Analyses of urban quality often focus on approaches that assess quality goals at environmental, urban, and building scales (Garau et al.) [1].
However, policymakers within the sustainability discourse have not equally prioritized the different dimensions of sustainable development (e.g., social, eco-nomic, and environmental) (Drakakis-Smith, 1995) [2].
The concept of social sustainability is the least developed of the three pillars (Kunz; Littig et al.; Partridge) [3,4,5]. Cuthill [6] states that it is simpler to quantify the environmental and techno-economic aspects of sustainability compared to the social aspect, primarily due to the lack of focus on assessing social sustainability. Colantonio [7] echoes this concern, emphasizing that this is largely due to the absence of concretely defined metrics and universal standards for guidance.
Happiness, social integration, and connection to a specific region are increasingly being integrated into discussions about social sustainability, either as alternatives to or in addition to more traditional, measurable factors like employment and poverty reduction.
Kordi, N.E., S. Belayutham, and C.K.I. Che Ibrahim [8], stated that, social sustainability may be perceived as a complex and highly subjective concept due to the qualitative nature of measurement, as social measurements include variables such as peoples’ opinions, perceptions, and satisfaction (Valdes-Vasquez and Klotz; Eizenberg and Jabareen; Nakamba et al.) [9,10,11].
This complicates the examination of social sustainability, particularly from an assessment perspective (Colantonio) [7]. Consequently, urban development often neglects the aspect of social sustainability, resulting in it becoming an afterthought rather than an important primary consideration (Bebbington et al.; Opp, 2017; Woodcraft et al., 2011) [12,13,14].
Social sustainability investments offer latent benefits that are nearly impossible to monetize, and ignoring these could have dire consequences. For example, increases in crime rates and greater residential segregation over time can serve as proxy measures, symptoms, or indicators of the “absence of social sustainability” (Kelly; Larsson; Woodcraft et al.) [14,15,16] and can be associated with areas that have ‘failed socially’ (Woodcraft et al.; Birmingham; Jobard; Miller) [14,17,18,19]. These could be considered the ‘proverbial canaries in the coal mine’. The Swedish police (2015) [20] and the Delegation against Segregation (2021) [21] have also observed these symptoms in many Swedish cities.
Sustainable communities and cities have recently shifted their attention to the social component as a critical aspect of long-term planning. Over the last few decades, a growing body of literature has developed a variety of approaches and methods for assessing sustainability (Colantonio) [7]. To assess the quality of social life in a given area, such as a city, there is a need for sets of indicators that help us understand the social conditions of the place. (Marans et al.) [22] However, there is a lack of specific evaluations focused on social sustainability. The Social Impact Assessment (SIA), which now includes other sustainability themes, is one of the few regular assessments conducted in this field (Colantonio) [7].
Stagl [23] notes that assessment is based on the use of multiple methods of investigation and analysis to generate policy-relevant information. This information is then used to analyze the impact of human activities on the objective of sustainable development. Additionally, Colantonio [7] pointed out that sustainability indicators are process indicators because they examine the processes by which sustainability principles and goals are established, agreed upon, and implemented. These indicators allow for the observation of project or phenomenon execution and the evaluation of progress toward specified goals in a more participatory manner compared to conventional social indicators.
A new method for assessing social sustainability was presented by Woxnerud [24] and Woxnerud, Najar, and Nylander [25]. The method can be particularly helpful in situations where experts and non-experts need to understand a location’s advantages and disadvantages concerning a social element. Since the approach relies on subjective evaluations, it would be worthwhile investigating whether various users of the different assessment methods might arrive at the same conclusions.
According to Marans et al. [22], individuals may subjectively evaluate the features of their urban environment that affect their quality of life based on their own unique perceptions of such features. Given the subjective nature of the dimension, the methods used to measure it, and the results, this study employed a comparative method to identify the most consensus-based matrix for optimal implementation and to understand how a consensus was reached across different assessments and indicators. The consensus in the context of this research relies on Cultural Consensus Theory (CCT). This method uses models to compile interviewees’ answers to questions about their shared cultural knowledge (Batchelder et al.) [26].
The authors believe that understanding consensus factors in appraisals of urban sustainability may shift the assessment process toward greater objectivity. In 1961, De Groot defined objectivity as the act of making judgments without any influence or possibility of influence from personal beliefs, preferences, ways of observation, viewpoints, interests, or feelings (Ten Cate et al.) [27].
Glasersfeld defines objectivity as the intersubjective construction of reality. The degree to which individuals share commonalities in their perception and processing of the world’s information determines the conceivable collective realities (Weller et al.) [28]. This shared perception is based on the idea that individuals from similar backgrounds see the world in the same manner, partly due to shared genetic material between humans and other primates (Weller et al.) [28]. In contrast, Romney et al. [29,30] have established a cultural framework they call “consensus theory”, based on an alternative epistemic perspective. Their argument rests on the premise that greater agreement indicates a deeper understanding of a cultural fact. One possible explanation for the lack of a consensus is that people have different interpretations of the same information. Another is that distinct groups of people (such as men and women) have very diverse opinions. A third possibility is that many people share the same opinion and seldom deviate from it (Schnegg et al.) [31]. Even if we accept agreement as cultural truth, it does not change the fact that it may not align with how our other senses and data reveal the world. (Weller et al.) [28].
In this study, the objectivity of different assessment methods for social sustainability will be tested. The objective of the study is to:
  • Measure the level of agreement among assessors using three distinct assessment methods.
  • Measure the rate of consonance of various assessment methods by comparing them to Woxnerud’s [24] theory-based method.

2. Literature Review

Survey, Structured Interview, and Sampling in Qualitative Research

Selecting an appropriate research methodology is crucial for the success of any study (Rashidi et al.) [32]. Surveys, widely used in fields like anthropology and ethnology, are also beneficial across various domains (Weller et al.) [28], allowing direct data collection through structured questions. The reliability of surveys hinges on both participant accuracy and survey design quality (Queirós et al.) [33]. Reliability refers to the consistency of findings upon repeated data collection (Bernardi et al.) [34]. Systematic methods like questionnaires generally offer higher reliability, balancing it with validity (Weller) [35]. Surveys encompass various methodologies, including participant selection and questionnaire design (Fowler) [36]. Random or representative sampling is key for generalization, although nonrandom samples can still yield valuable insights if applied cautiously (Weller) [37].
Much of our understanding of human behavior is derived from interviews and surveys (Weller) [35]. Structured interviews, a common form in survey research, involve asking participants identical questions in a predetermined order (Rashidi et al.; Bryman) [32,37]. Also known as standardized interviews or researcher-administered surveys (Abdul-Rahman et al.) [38], this method is designed to elicit consistent responses (Gill et al.) [39]. The structured format ensures uniformity in phrasing and sequence (Kumar) [40], producing data that aligns with research objectives (Rashidi et al.) [32]. According to Kumar [40], structured interviews provide the advantage of consistent data for easy comparison, though they may limit precision due to inflexible answer options (Queirós et al.) [34]. Despite the preparation time, their efficiency and replicability make them valuable (Queirós et al.) [34]. When measuring different constructs, diverse question types may complement one another by addressing different aspects of the criterion variance (Trull et al.) [41].
In qualitative research, sampling involves selecting a subset of a larger population, an approach gaining traction in fields like public health and international development (Mack) [42]. Sampling requires careful management to maintain research validity (Oppong; DePaulo) [43,44]. A clear sampling design establishes criteria for selecting participants or locations that best address the research questions (Devers et al.) [45]. According to Marshall [46], the three broad categories of natural sampling methodologies in qualitative research are convenience sampling, judgment sampling, and theoretical sampling. Common qualitative sampling methods include purposive, quota, and snowball sampling (Mack) [42], with purposive sampling—where participants are deliberately chosen for their expertise—being the most widely used (Mack; Oppong; Devers et al.) [42,43,44,45]. Determining the adequate sample size is key to minimizing errors and ensuring research integrity (Hanly) [47]. Data collection in qualitative research continues until data saturation—when no new information emerges—is achieved (Kumar; Hennink et al.) [40,48], helping determine the appropriate sample size (Rashidi et al.) [32]. To address sampling bias, researchers can employ multiple data collection approaches to validate consistency (Oppong) [43]; alternative methods, as suggested by Tuckett [49], also mitigate bias. Comparing data from different collection methods ensures its consistency and accuracy (Greene et al.) [50].
Interviews, whether individual or group-based, differ in effectiveness. While group interviews reflect collective ideas, individual interviews are more effective for generating distinct insights (Weller et al.) [28]. Group interviews cover about 60% of the material individual interviews do (Fern; Morgan) [51,52], with smaller groups proving more productive. Dividing participants into smaller groups enhances insight, with data saturation often achieved with four to six groups of eight participants (Morgan) [52,53].

3. The Method

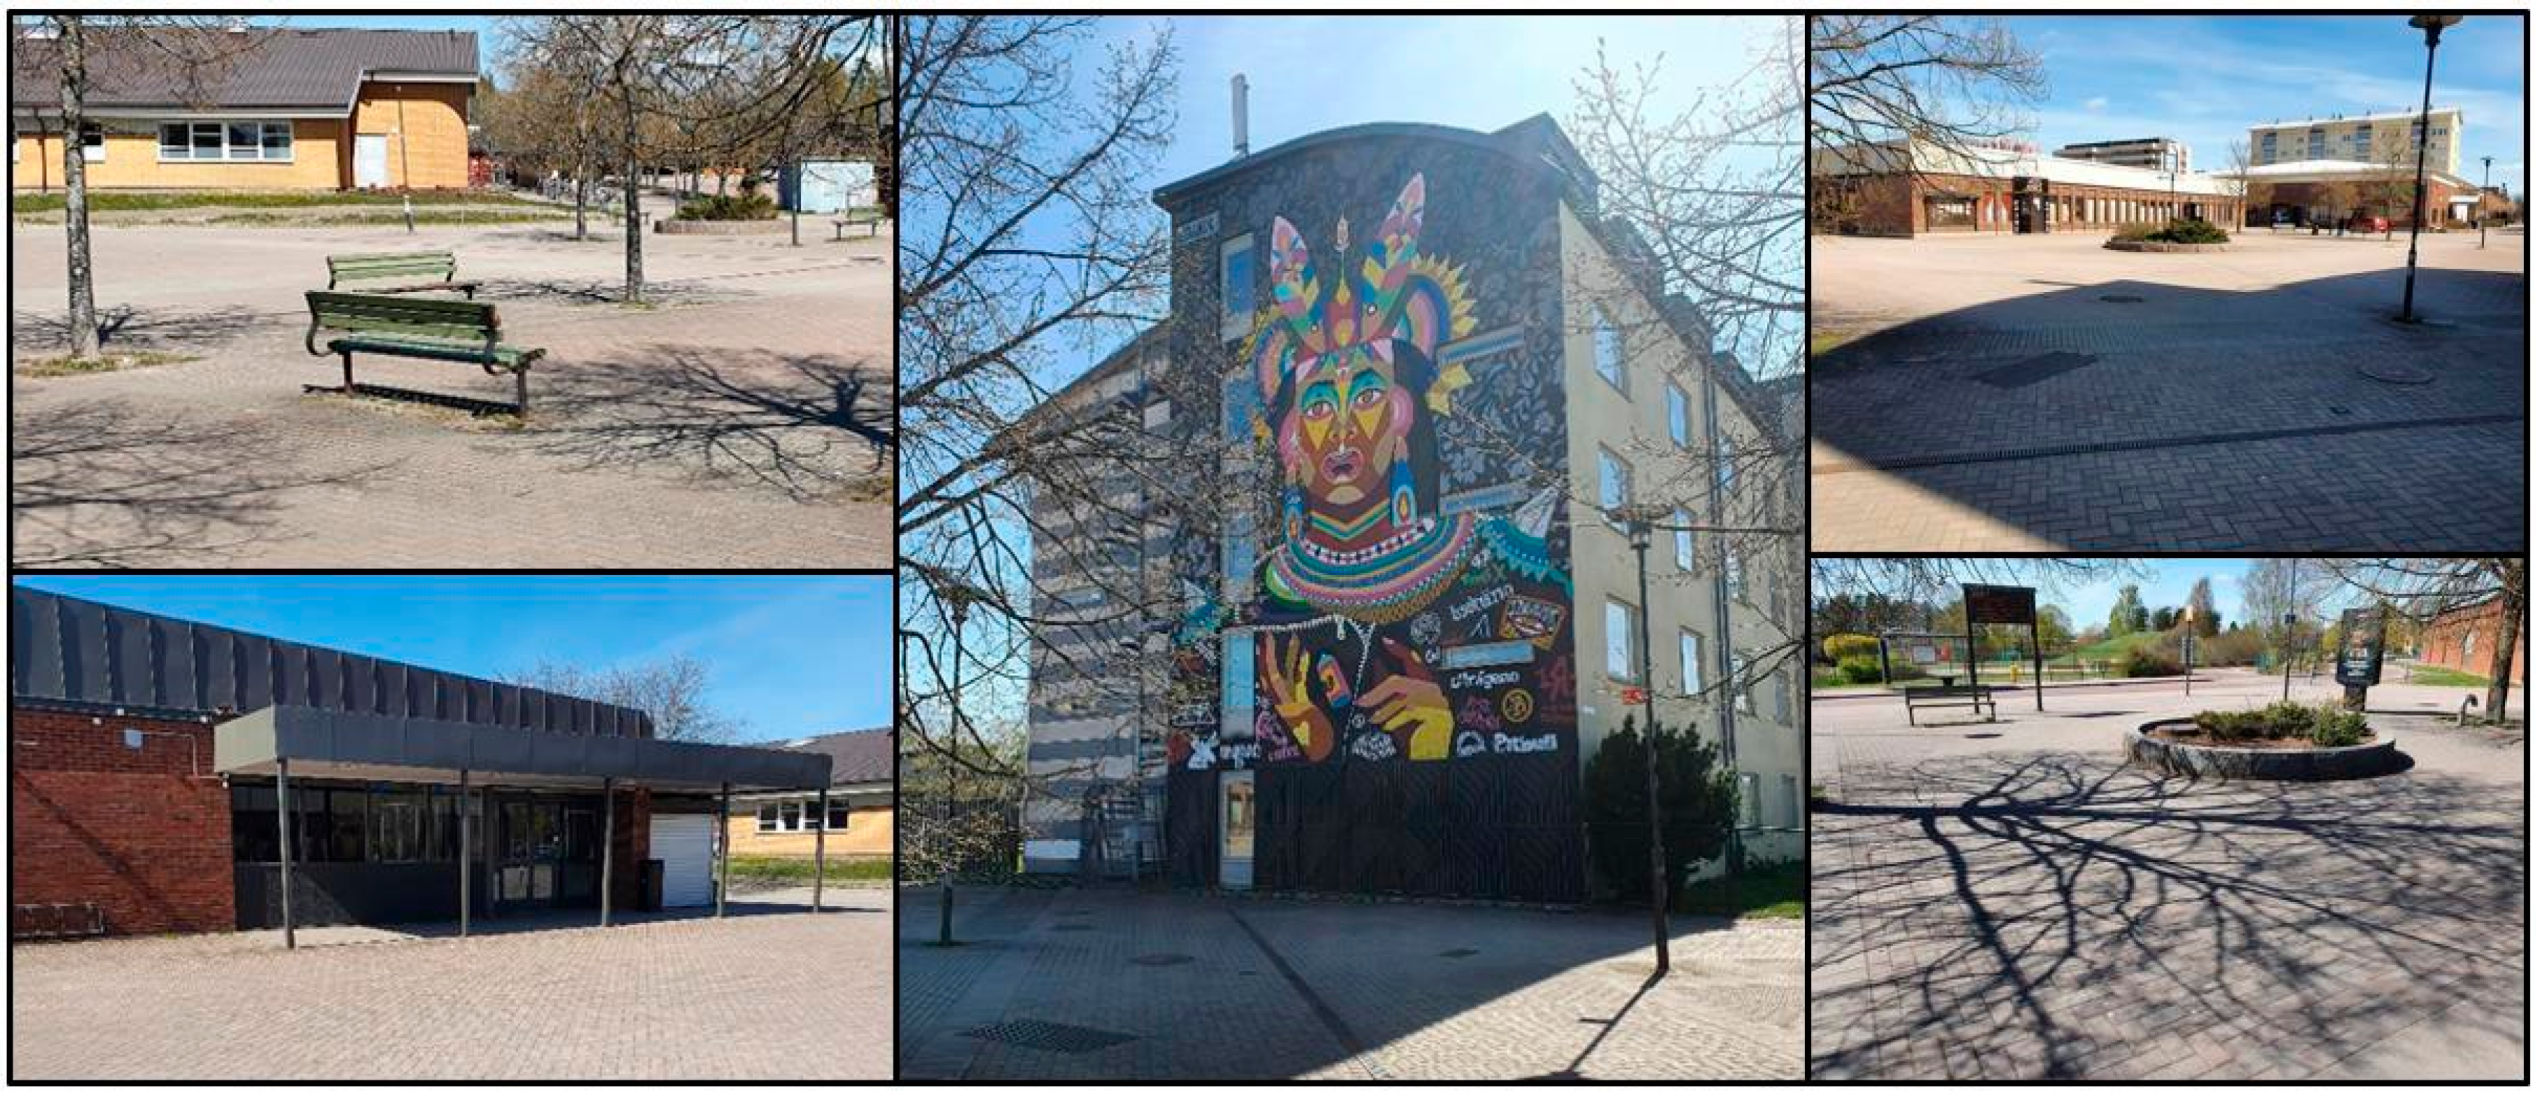
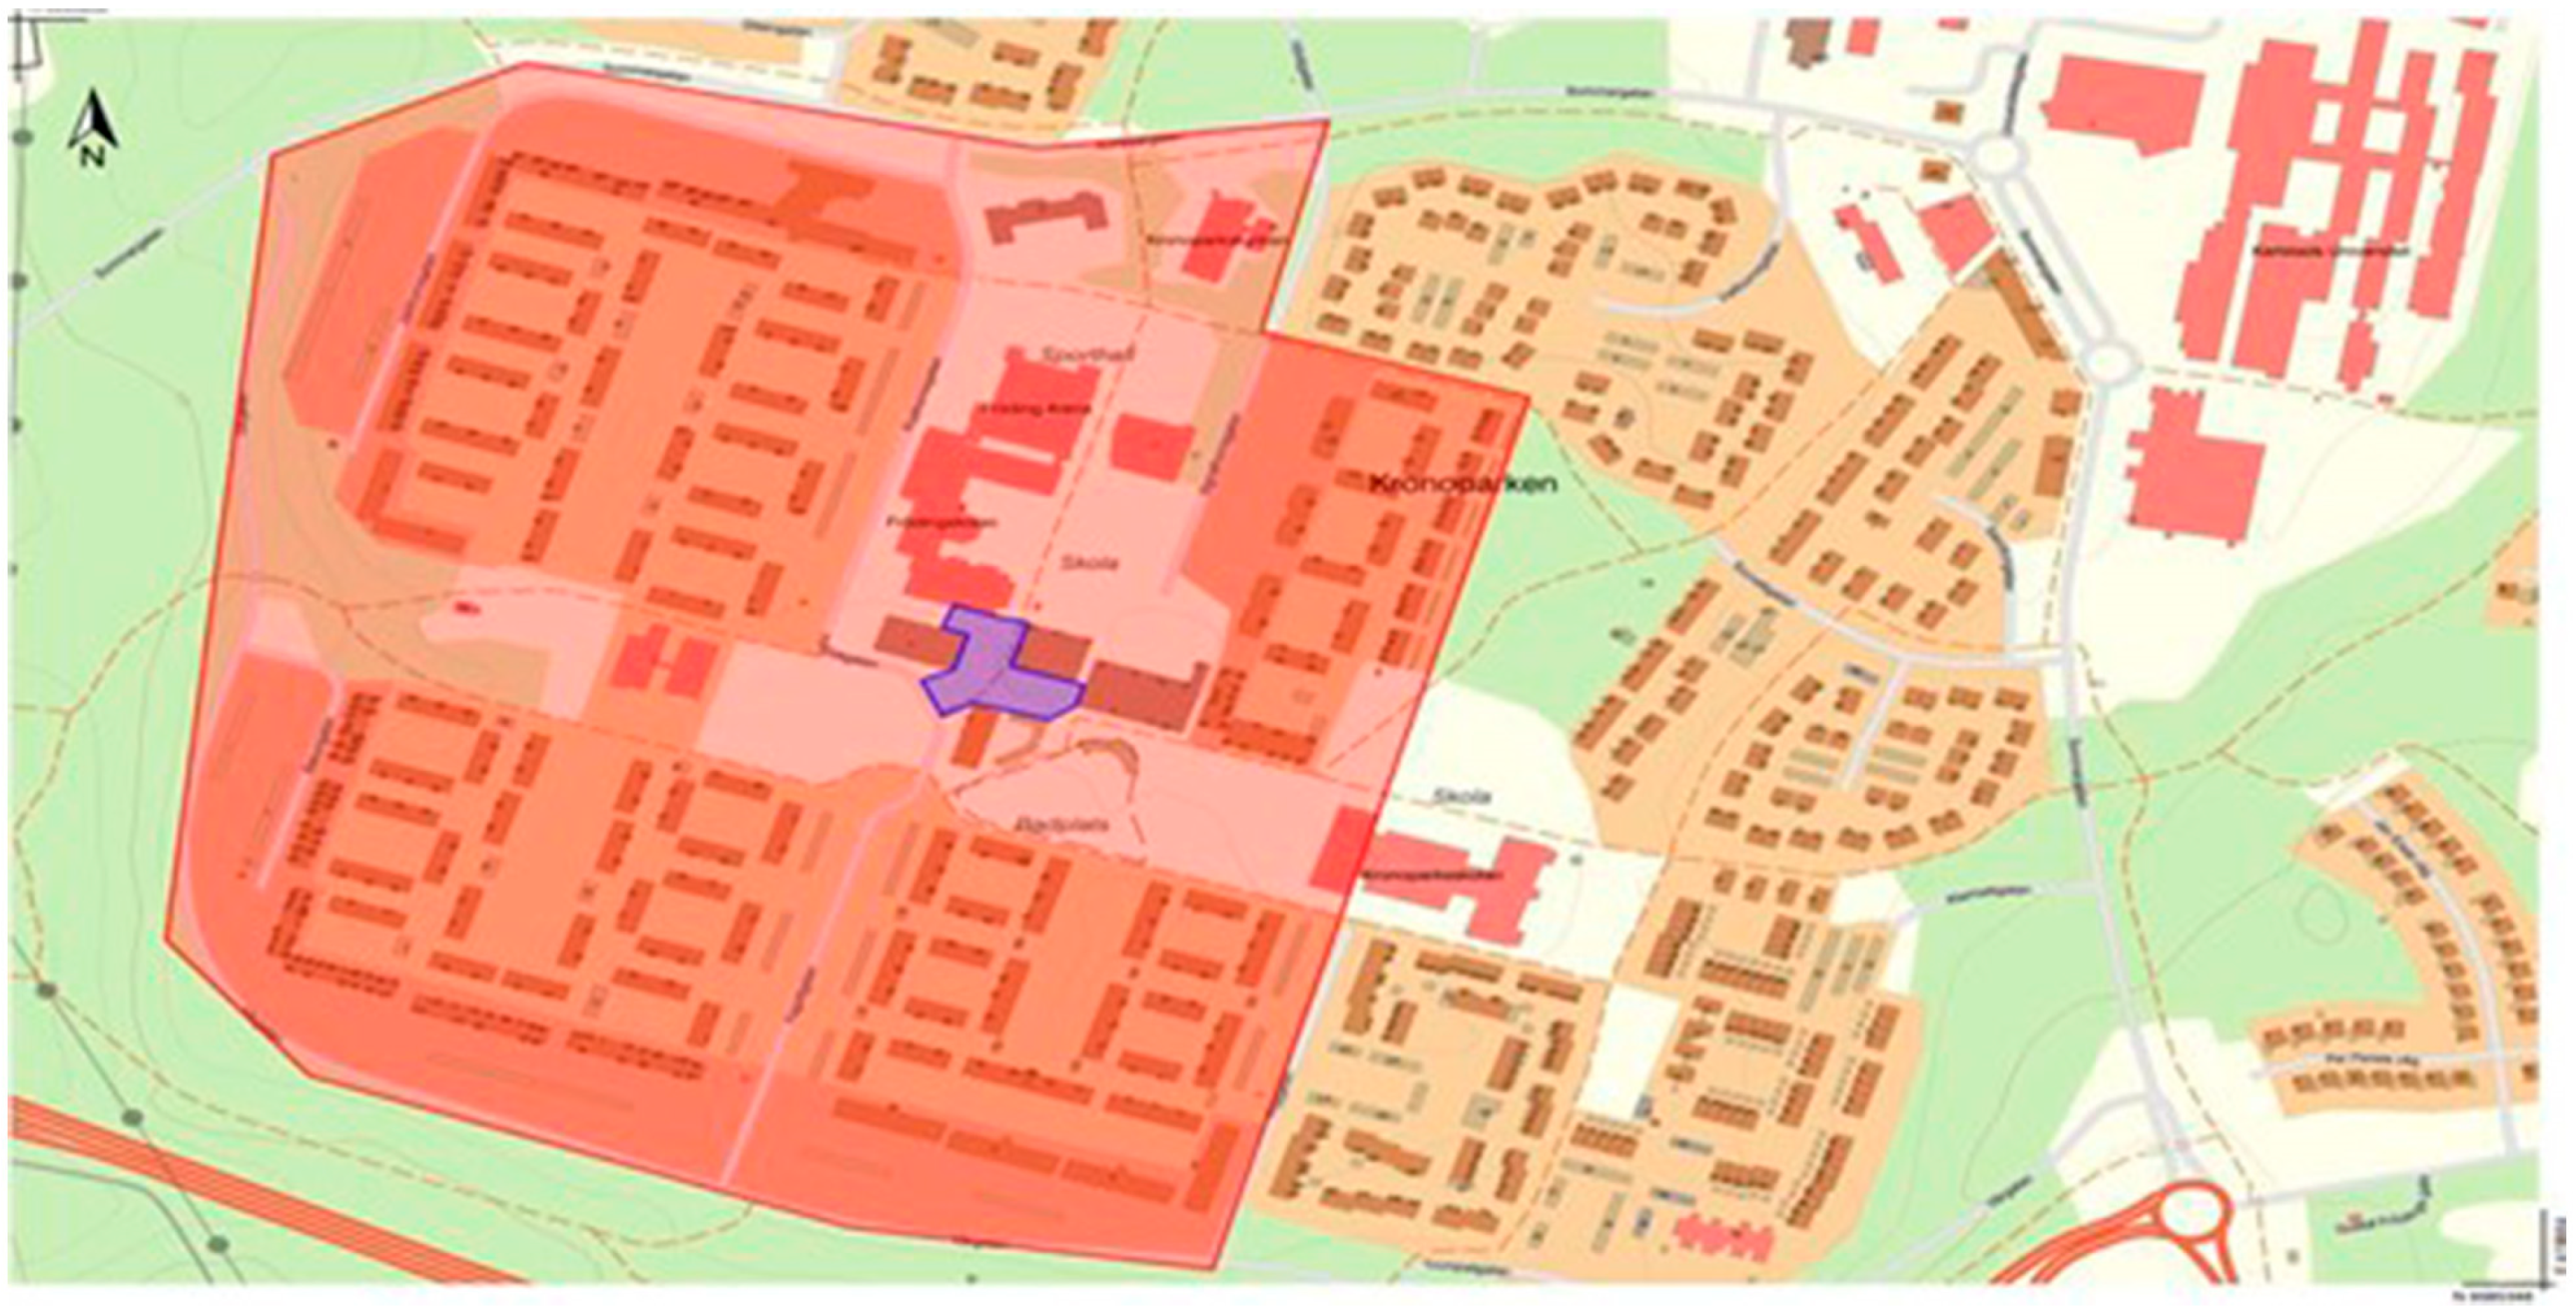
3.1. The Assessed Site

To use the method developed by Woxnerud [24], a site and area must be defined. The site chosen for this study is the central square of Kronoparken, Karlstad, with the area covering the southern and western parts of Kronoparken see Appendix A. Kronoparken is a district in Karlstad, Sweden, the capital of Värmland, a province in south-central Sweden (Karlstad Municipality) [54]. The district includes Karlstad University’s main campus, which has significantly contributed to its growth, with a population of around 9000 in 2020 (Wiik) [55].
As noted by Dahlgren et al. [56], Kronoparken’s rapid development during the 1960s and 1970s was heavily influenced by modernist architecture (Törnberg) [57]. The original plan envisioned a large suburb accommodating 20,000 inhabitants, but due to a drop in housing demand and the oil crisis’ impact on the Swedish economy, the plan was scaled back. This resulted in a more diverse range of housing than initially intended (Wiik) [55]. The area’s center reflects the modernist ideals of the time, featuring large-scale multi-family housing (Törnberg) [57]. Dahlgren et al. [56] critiqued the planning process, noting the lack of citizen dialog and reliance on “drawing board planning”, which contributed to social problems and a negative reputation for the suburb. Compared to other districts in Karlstad, Kronoparken has a lower socio-economic status, with the highest number of families relying on state support and the lowest disposable income, according to Karlstad Municipality [58].
Dahlgren et al. [56] also highlighted the suburb’s high ethnic segregation, with approximately 40% of residents being of foreign origin (compared to 13% in the city overall), and noted that most university students live in the northern part of the area. Reports describe Kronoparken as often unsafe, with issues of drug trafficking and crime (Karlstad Municipality; Krums-Vabins, 2021) [59,60] (Asplid) [61].
The site was chosen for two main reasons: its social issues made it an interesting subject for study, and its proximity to Karlstad University facilitated easier access for the students participating in the research.

3.2. Methodology

To assess and compare three assessment methods against Woxnerud’s [24] initial assessment, a survey was presented to a selected group of engineering students at Karlstad University. For effective research execution, selecting an appropriate methodology is essential (Rashidi et al.) [32]. Purposive sampling, also known as judgment sampling, was employed to interview engineering students with similar scientific backgrounds. This sampling technique selects individuals who can provide the most valuable data for the research (Rashidi et al.; Kumar; Mack; Oppong et al.) [32,40,42,43,45]. Informants should be chosen based on the study’s purpose and come from the target population (Spradley) [62], with at least one year of relevant experience (Weller) [35]. Samples were selected for their expertise in urban planning. The authors sought individuals with the necessary expertise who were willing to assist. However, an informant’s lack of interview experience may reduce accuracy (Rashidi et al.) [32].
In purposive sampling, participants are chosen based on knowledge, personality, and suitability for the study. Given the complexity of the research questions, this method was preferred (Rashidi et al.) [32]. The study follows the four steps outlined in Figure 1, with further details provided afterward.

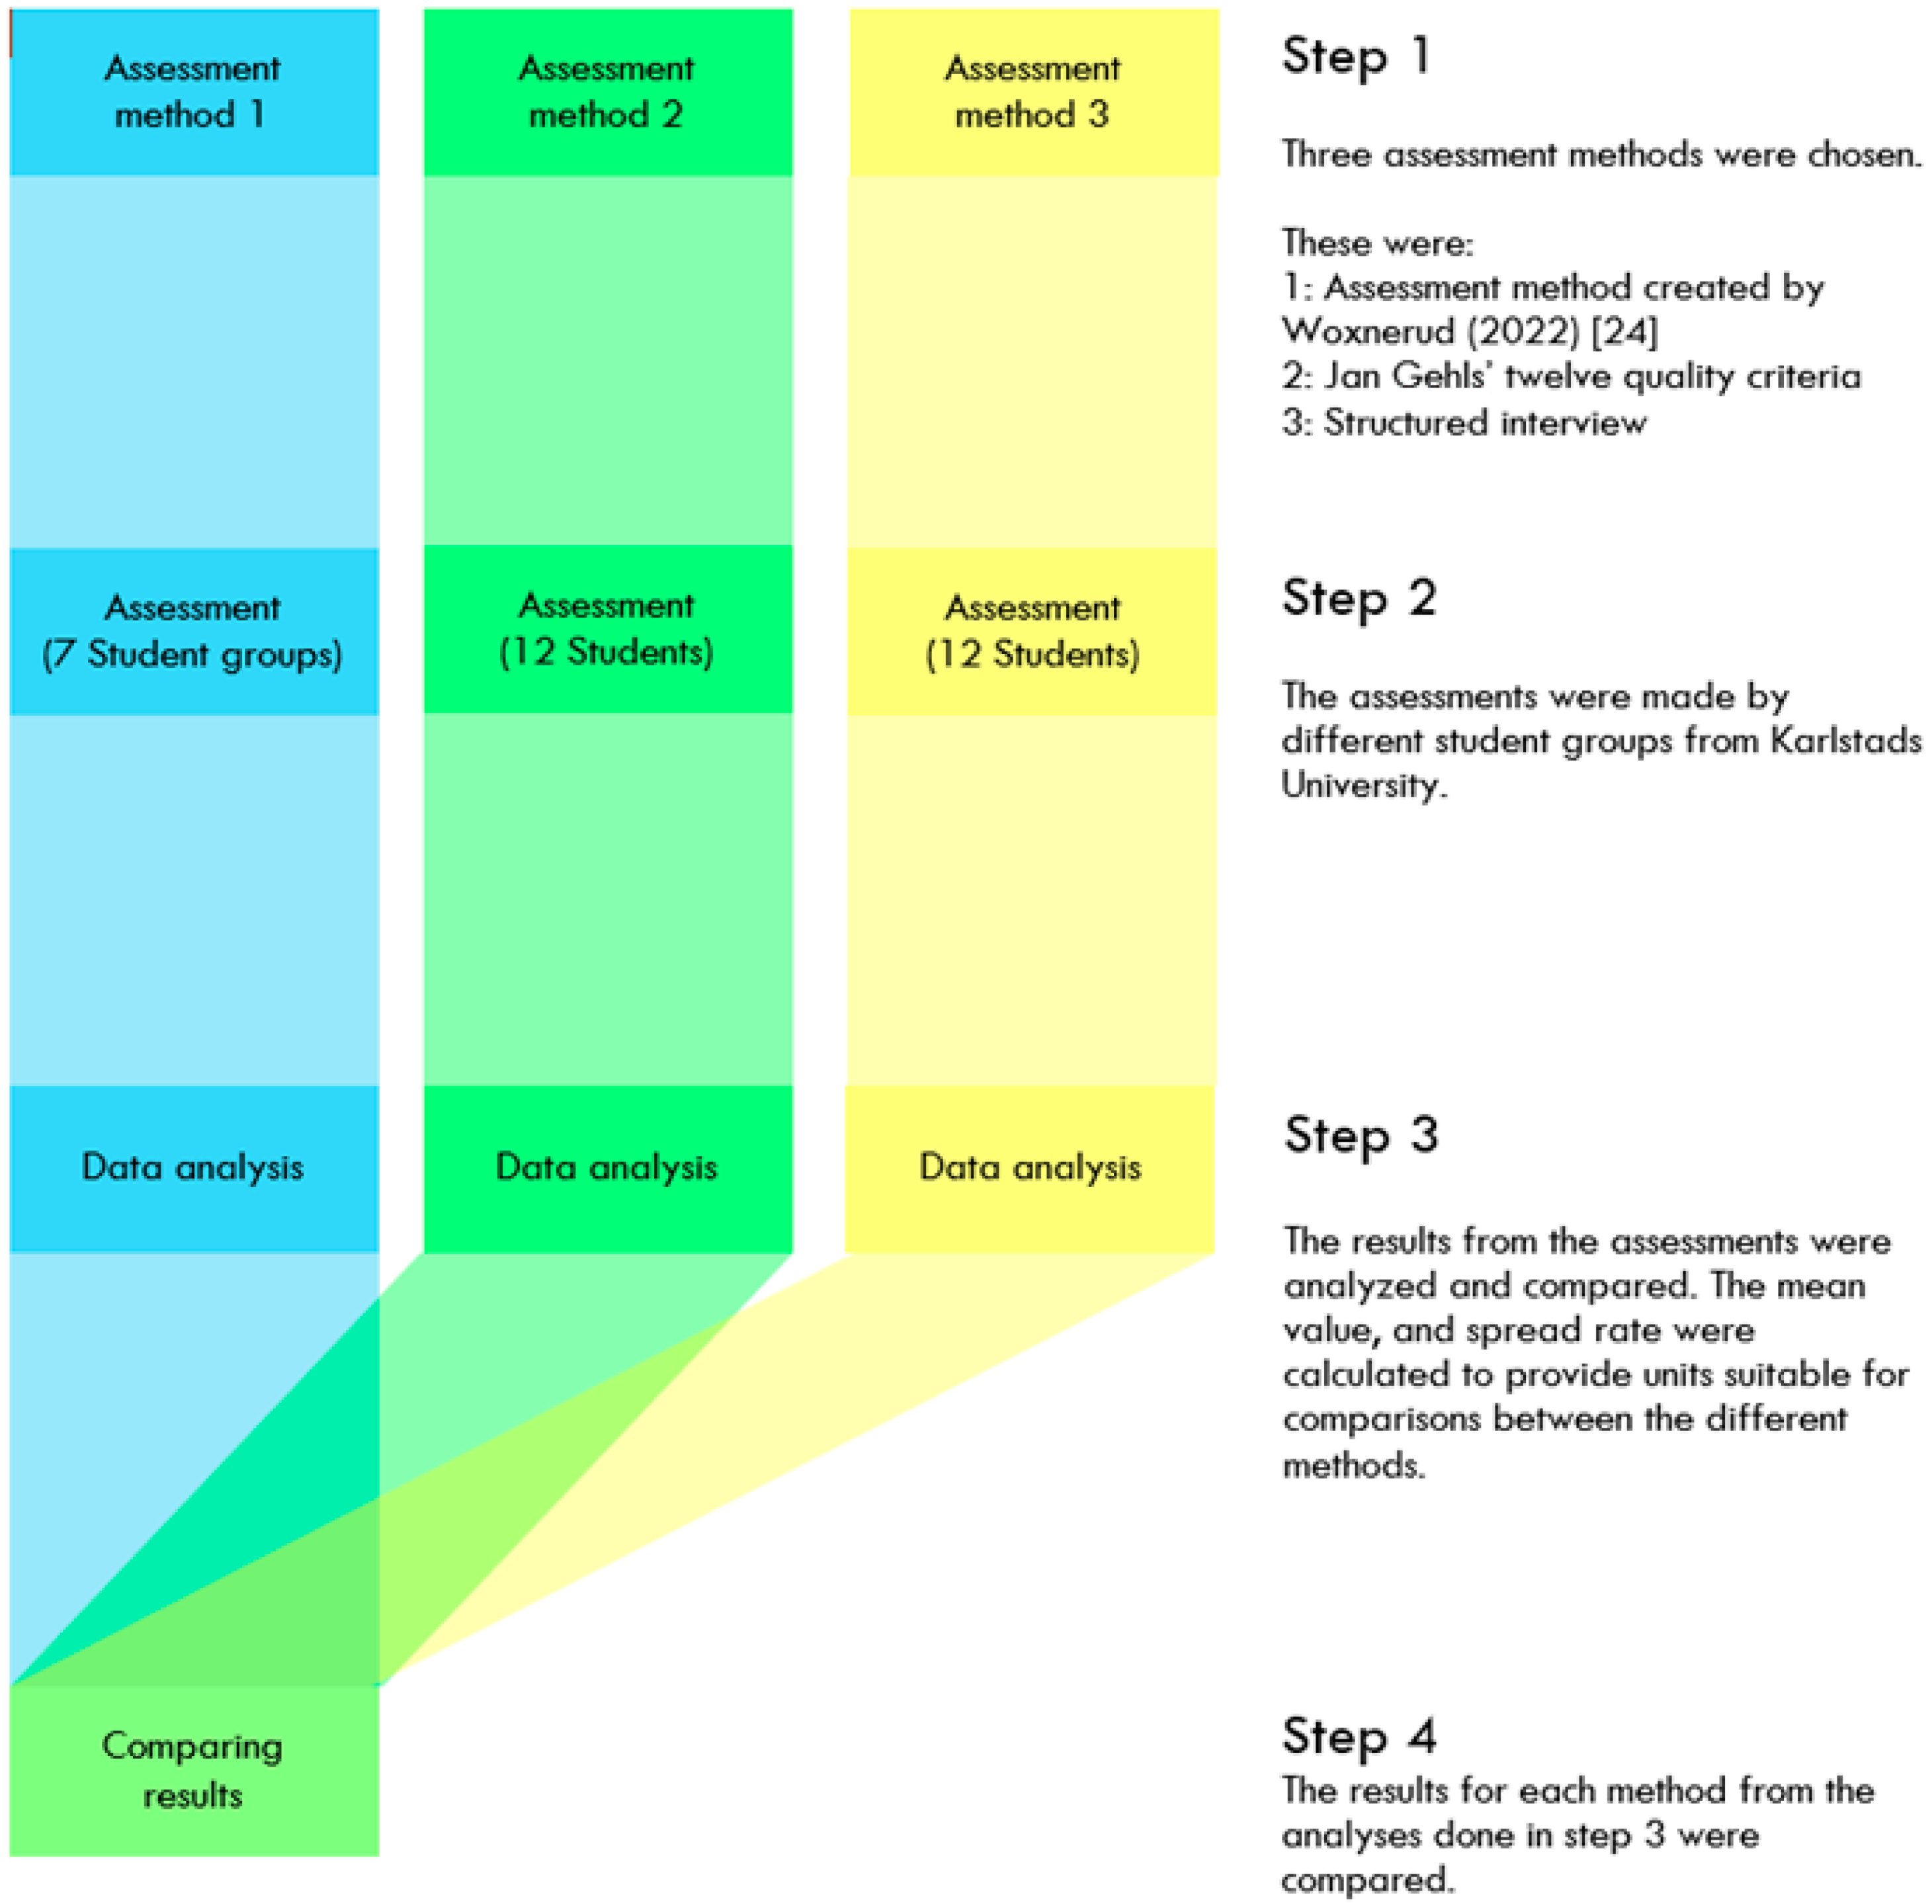
3.3. Step 1 Selection of Three Assessment Methods

The following three assessment methods were chosen:

3.3.1. Step 1.1: Assessment Method Created by Woxnerud [24] (Assessment Method 1)

This research builds on an earlier bachelor’s thesis in which Woxnerud [24] developed an assessment matrix for social sustainability, promoting it as an easy-to-use tool for identifying a locale’s strengths and weaknesses from a social sustainability perspective. This matrix combines Jan Gehl’s twelve quality criteria (Gehl Institute) [63], Social Life’s building blocks (Woodcraft et al.) [14], and additional specific information from the Swedish social context, adapted to Swedish conditions. The first author of this research supervised the bachelor’s thesis in 2022, and the authors further developed the thesis into a peer-reviewed journal article (Woxnerud, Najar et al., 2024) [25], aiming to enhance the method’s objectivity by subjecting all the questions to a three-part filter to ensure their theory-based qualification.
The assessment matrix comprises 40 questions evenly distributed among eight categories: architecture and esthetics, meeting places, social sustainability, accessibility, traffic, security, senses and experience, and development (see Appendix B).

3.3.2. Step 1.2: Jan Gehl’s Twelve Quality Criteria (Assessment Method 2)

Assessment Method 2 is a modified version of Jan Gehl’s twelve quality standards. There are many advantages to using existing questionnaires and standardized scales. Most importantly, it allows researchers to leverage the considerable work that went into developing the scale and facilitates communication with larger groups of scholars (Weller et al.) [35]. Gehls twelve quality criteria is a well-recognized assessment matrix, to evaluate the quality of urban spaces (Eken et al.) [64]. To facilitate comparison with the authors’ method (Woxnerud 2022; Woxnerud, Najar et al.) [24,25], the authors adjusted the twelve quality criteria to fit into eight categories and used a scale of 1–5, instead of the common three-point scale. The questions used are available as Appendix C.

3.3.3. Step 1.3: Structured Interviews (Assessment Method 3)

Structured interviews serve as an assessment method designed to gather and compare responses from all participants (Queirós et al.) [33]. Assessment Method 3 is a structured questionnaire constructed to facilitate comparison with the authors’ assessment methods (Woxnerud 2022; Woxnerud, Najar et al.) [24,25]. The questions used in the questionnaire are presented in Table 1.
To rate the qualitative responses of the participants and align them with assessment methods 1 and 2, the authors needed to address the following question: Are the items reasonable, and do they appear to measure the same thing? The answer is “yes” because the eight questions in this structured questionnaire align with the eight categories in the other assessments, facilitating the use of rating scales. Weller et al. [28] assert that individuals can occasionally use rating scales, provided they carefully include both positive and negative items and utilize the full range of scale values. A summative score of responses to a series of questions creates an index or scale (Weller et al.) [28].
To overcome the problem of different units of measure, variables were dichotomized (so they would be in the same units) and summed (Weller et al.) [35]. The rating scale in this structured questionnaire is 1–5.

3.4. Step 2: Assessment

Different student groups at Karlstad University conducted the assessments. The assessors first observed the site for approximately 20 min.
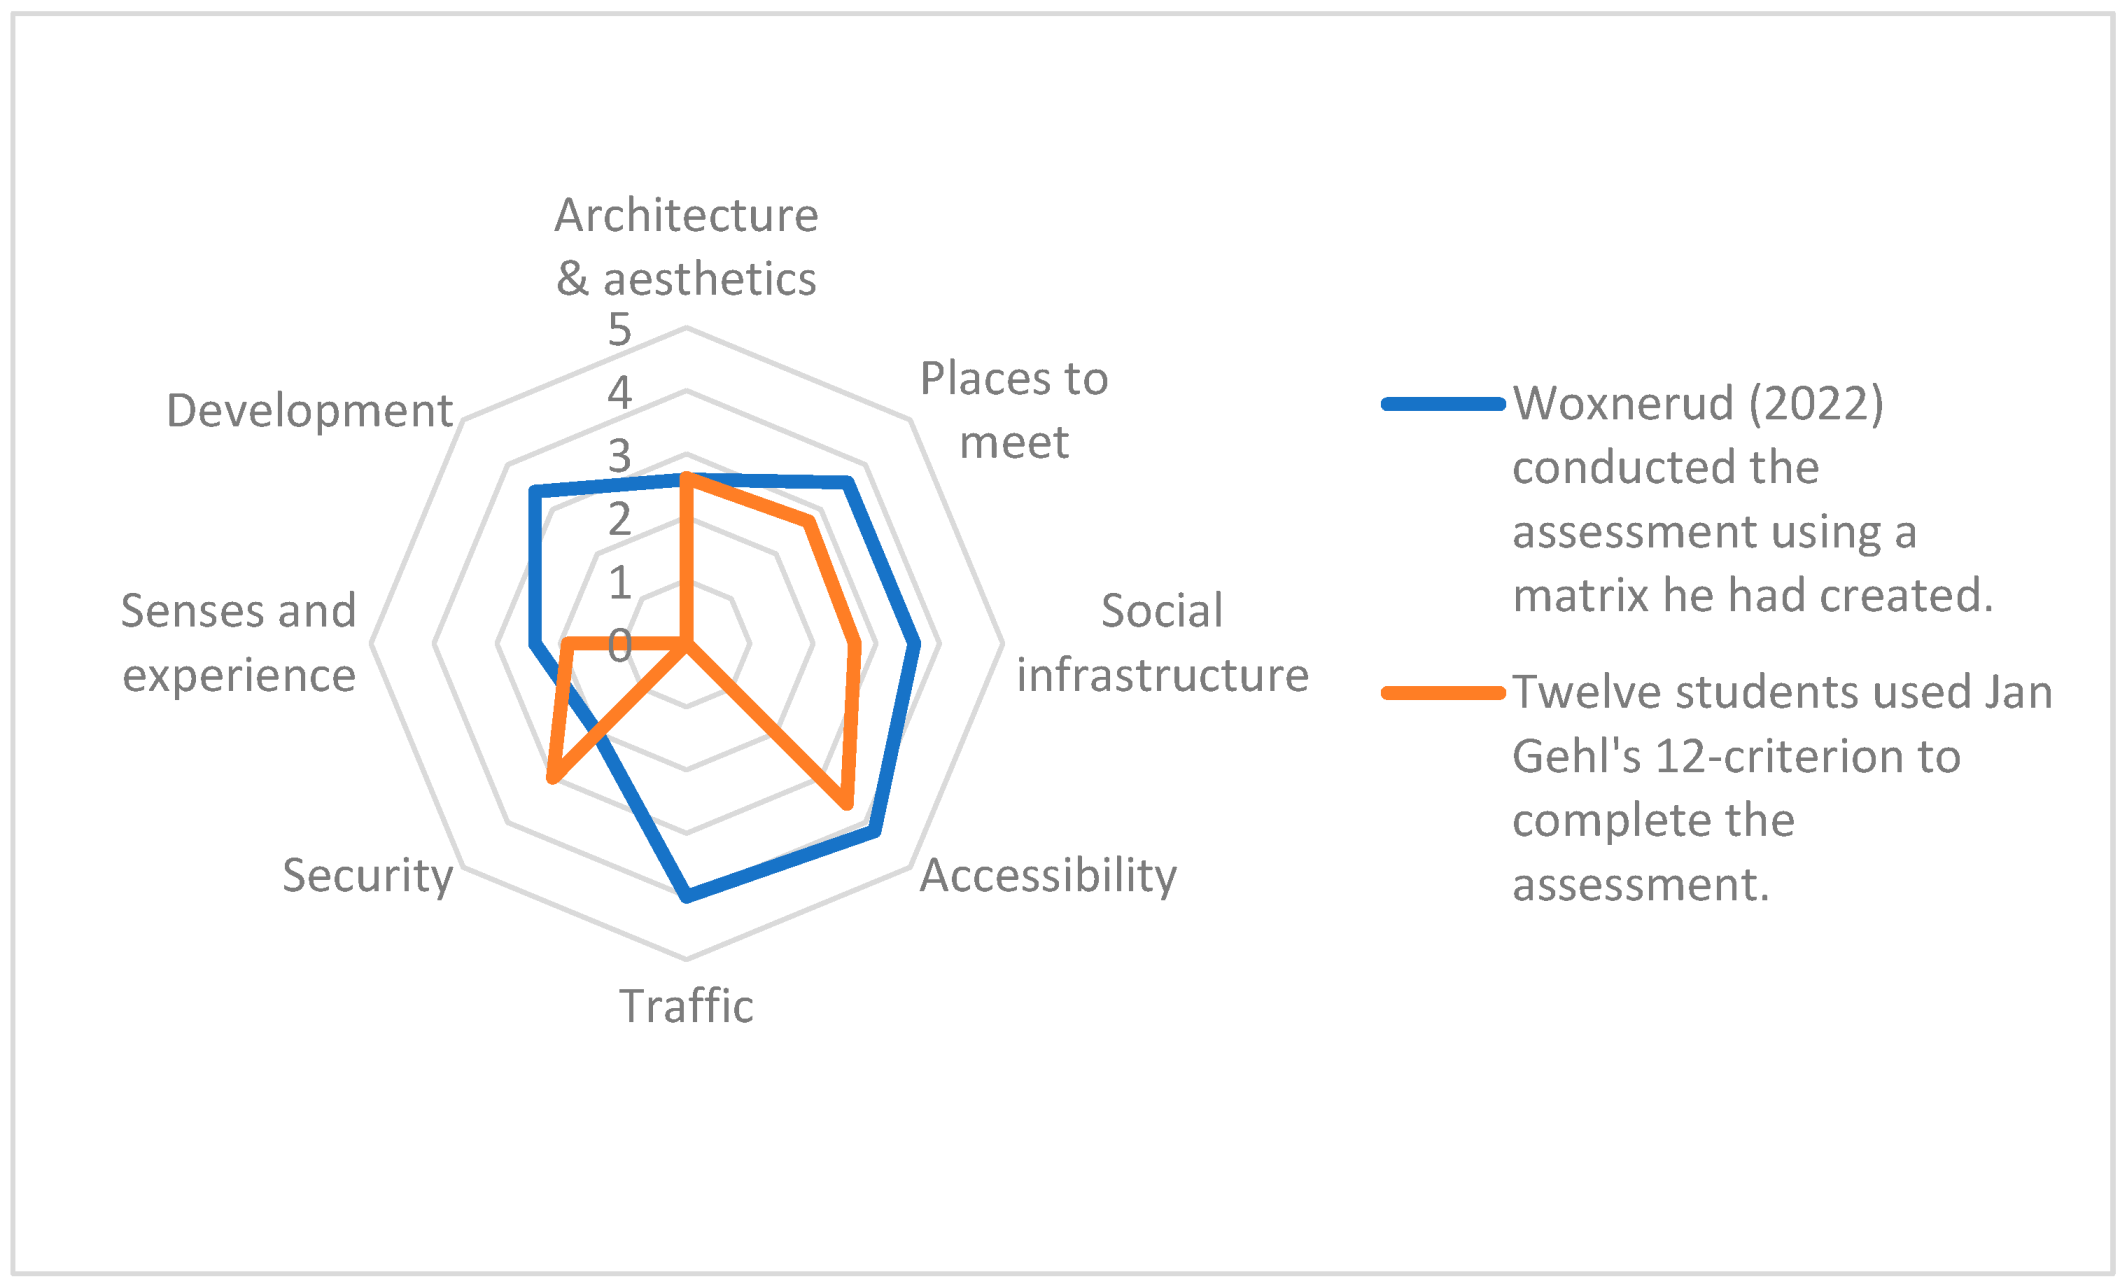
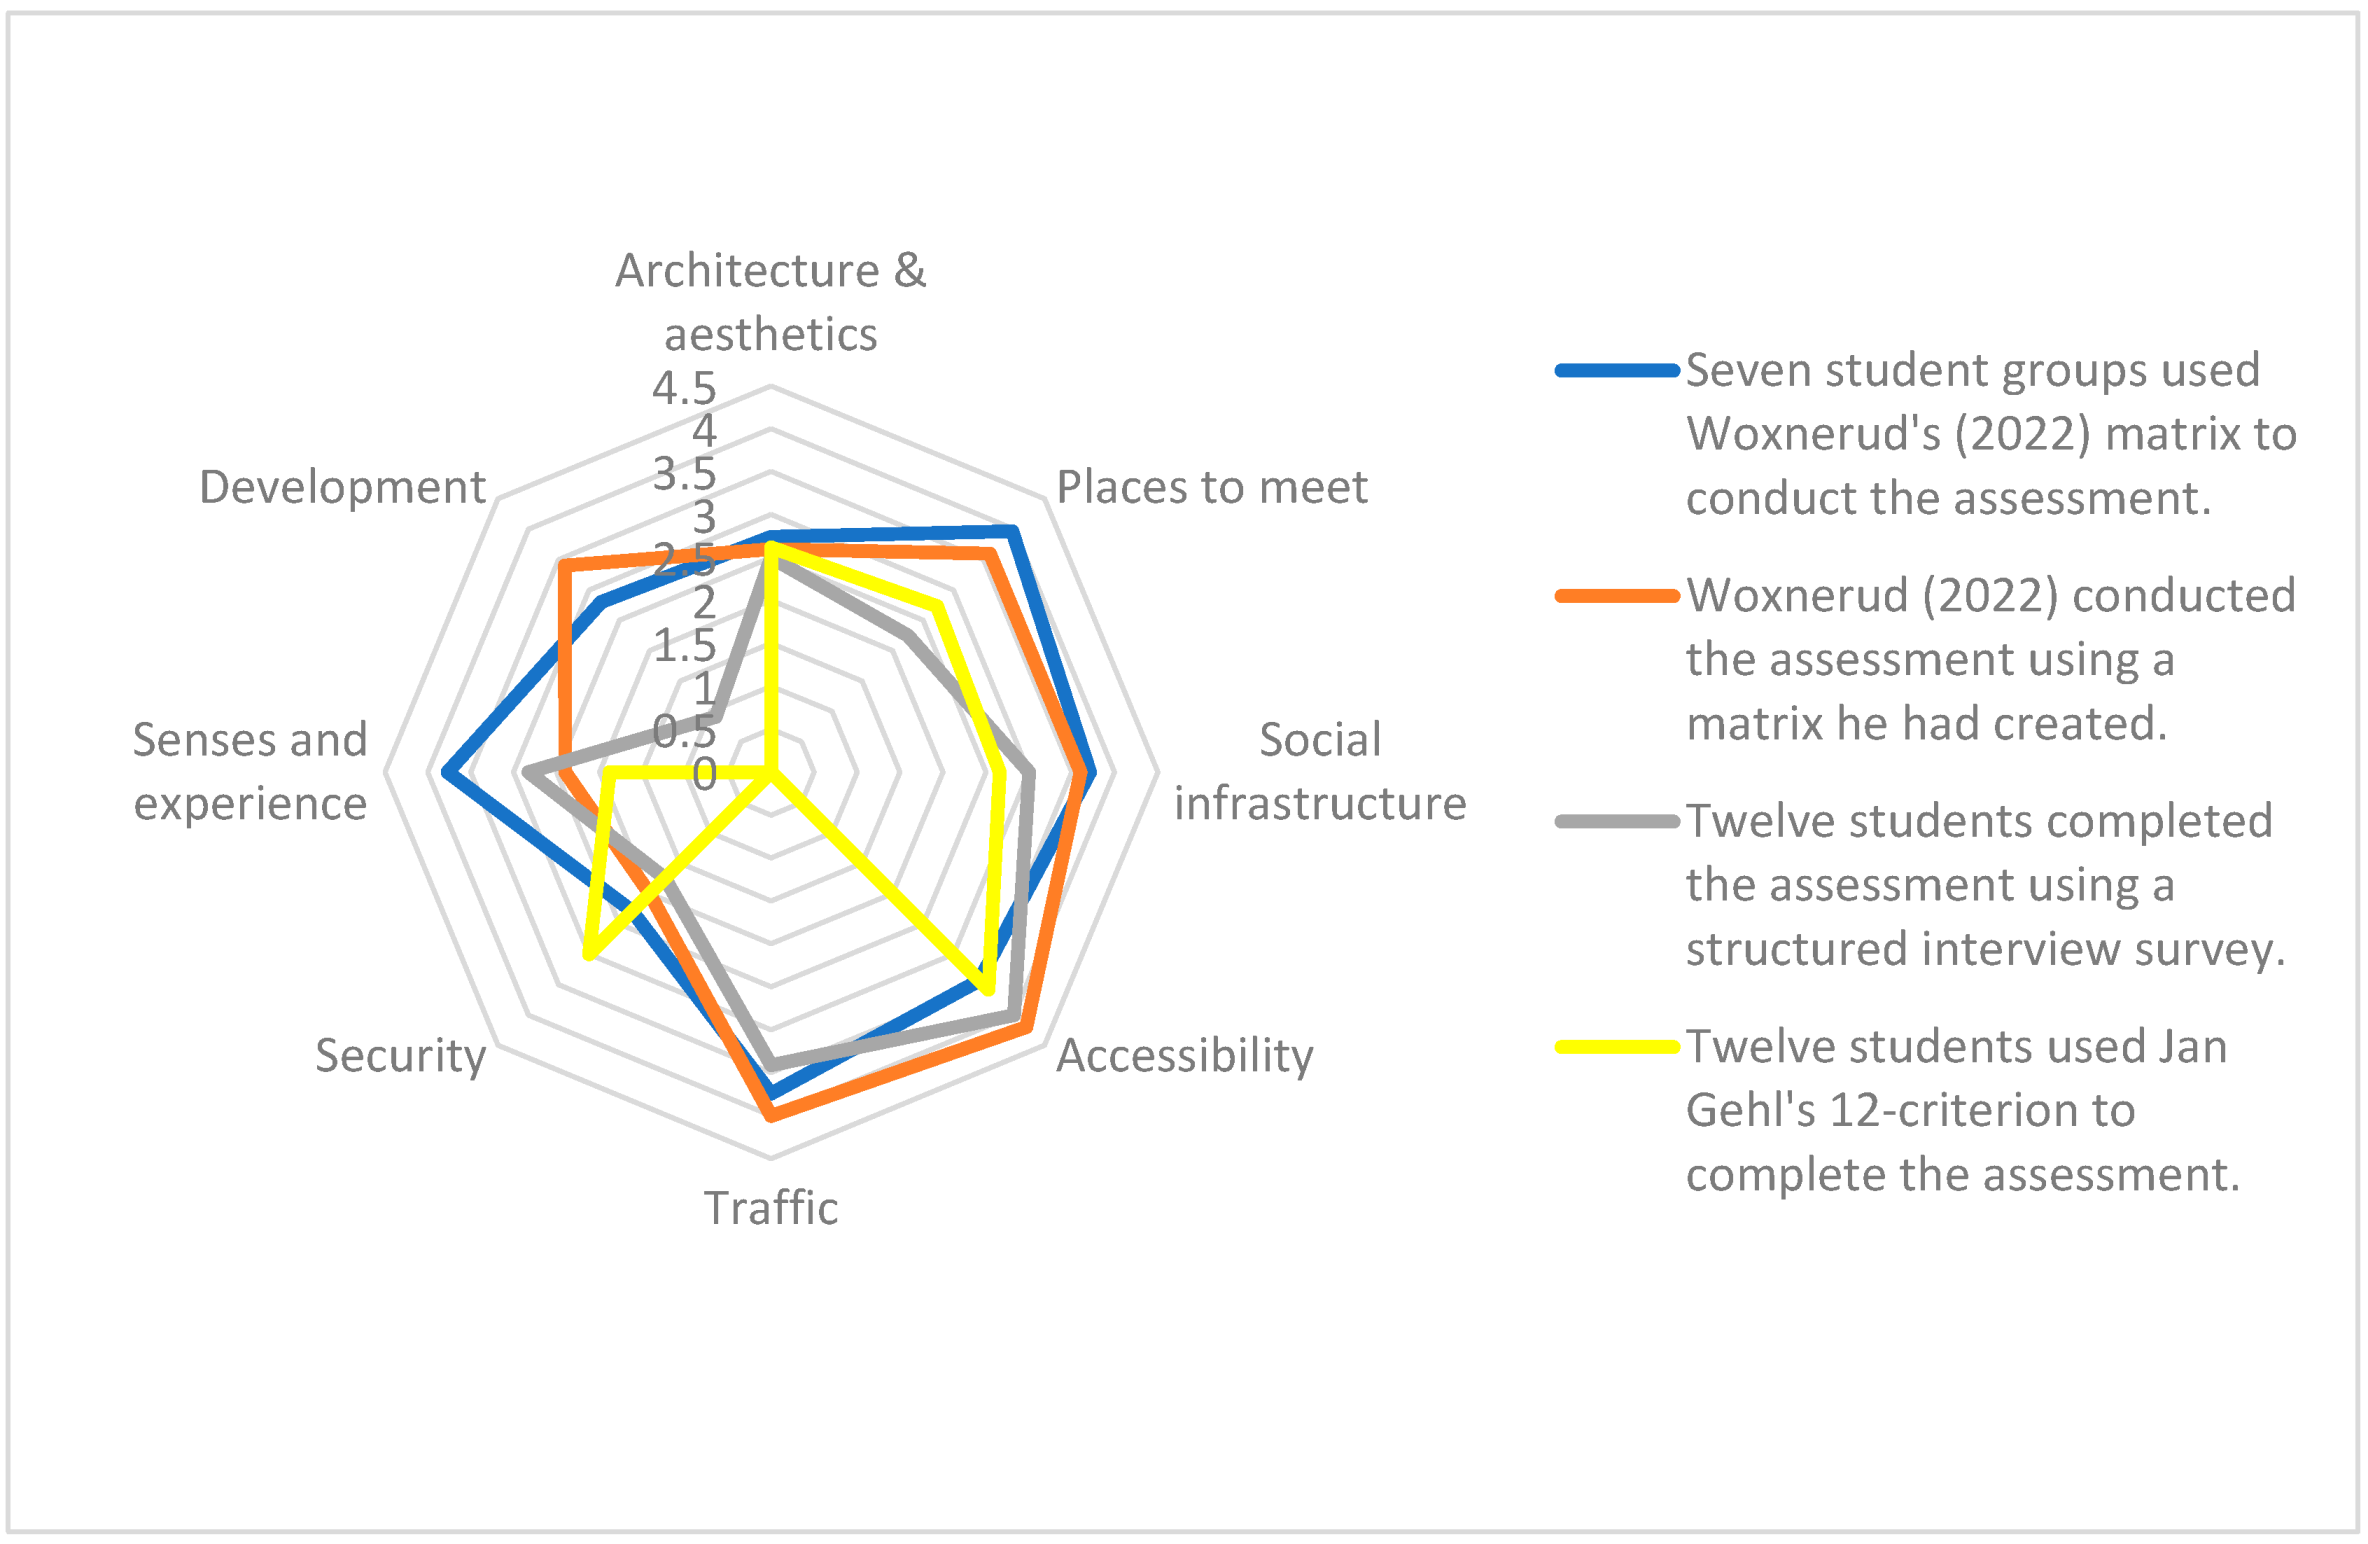
  • Seven groups of five undergraduate students from Karlstad University’s Building and Construction Engineering program conducted the first assessment using Woxnerud’s 2022 method (Assessment Method 1) at the beginning of September 2022, in slightly colder weather. They graded all 40 questions on a five-point Likert scale as follows: very bad = 1, bad = 2, neutral = 3, good = 4, and very good = 5. After entering all the grades, they calculated the average scores for the eight different categories. They then used a radar chart to graphically present the results (see Figure 2).
  • Twelve undergraduate students from the same Building and Construction Engineering program at Karlstad University conducted the second assessment in May 2024, under sunny and slightly windy conditions. This assessment was guided by Jan Gehl’s twelve quality criteria. (Assessment Method 2).
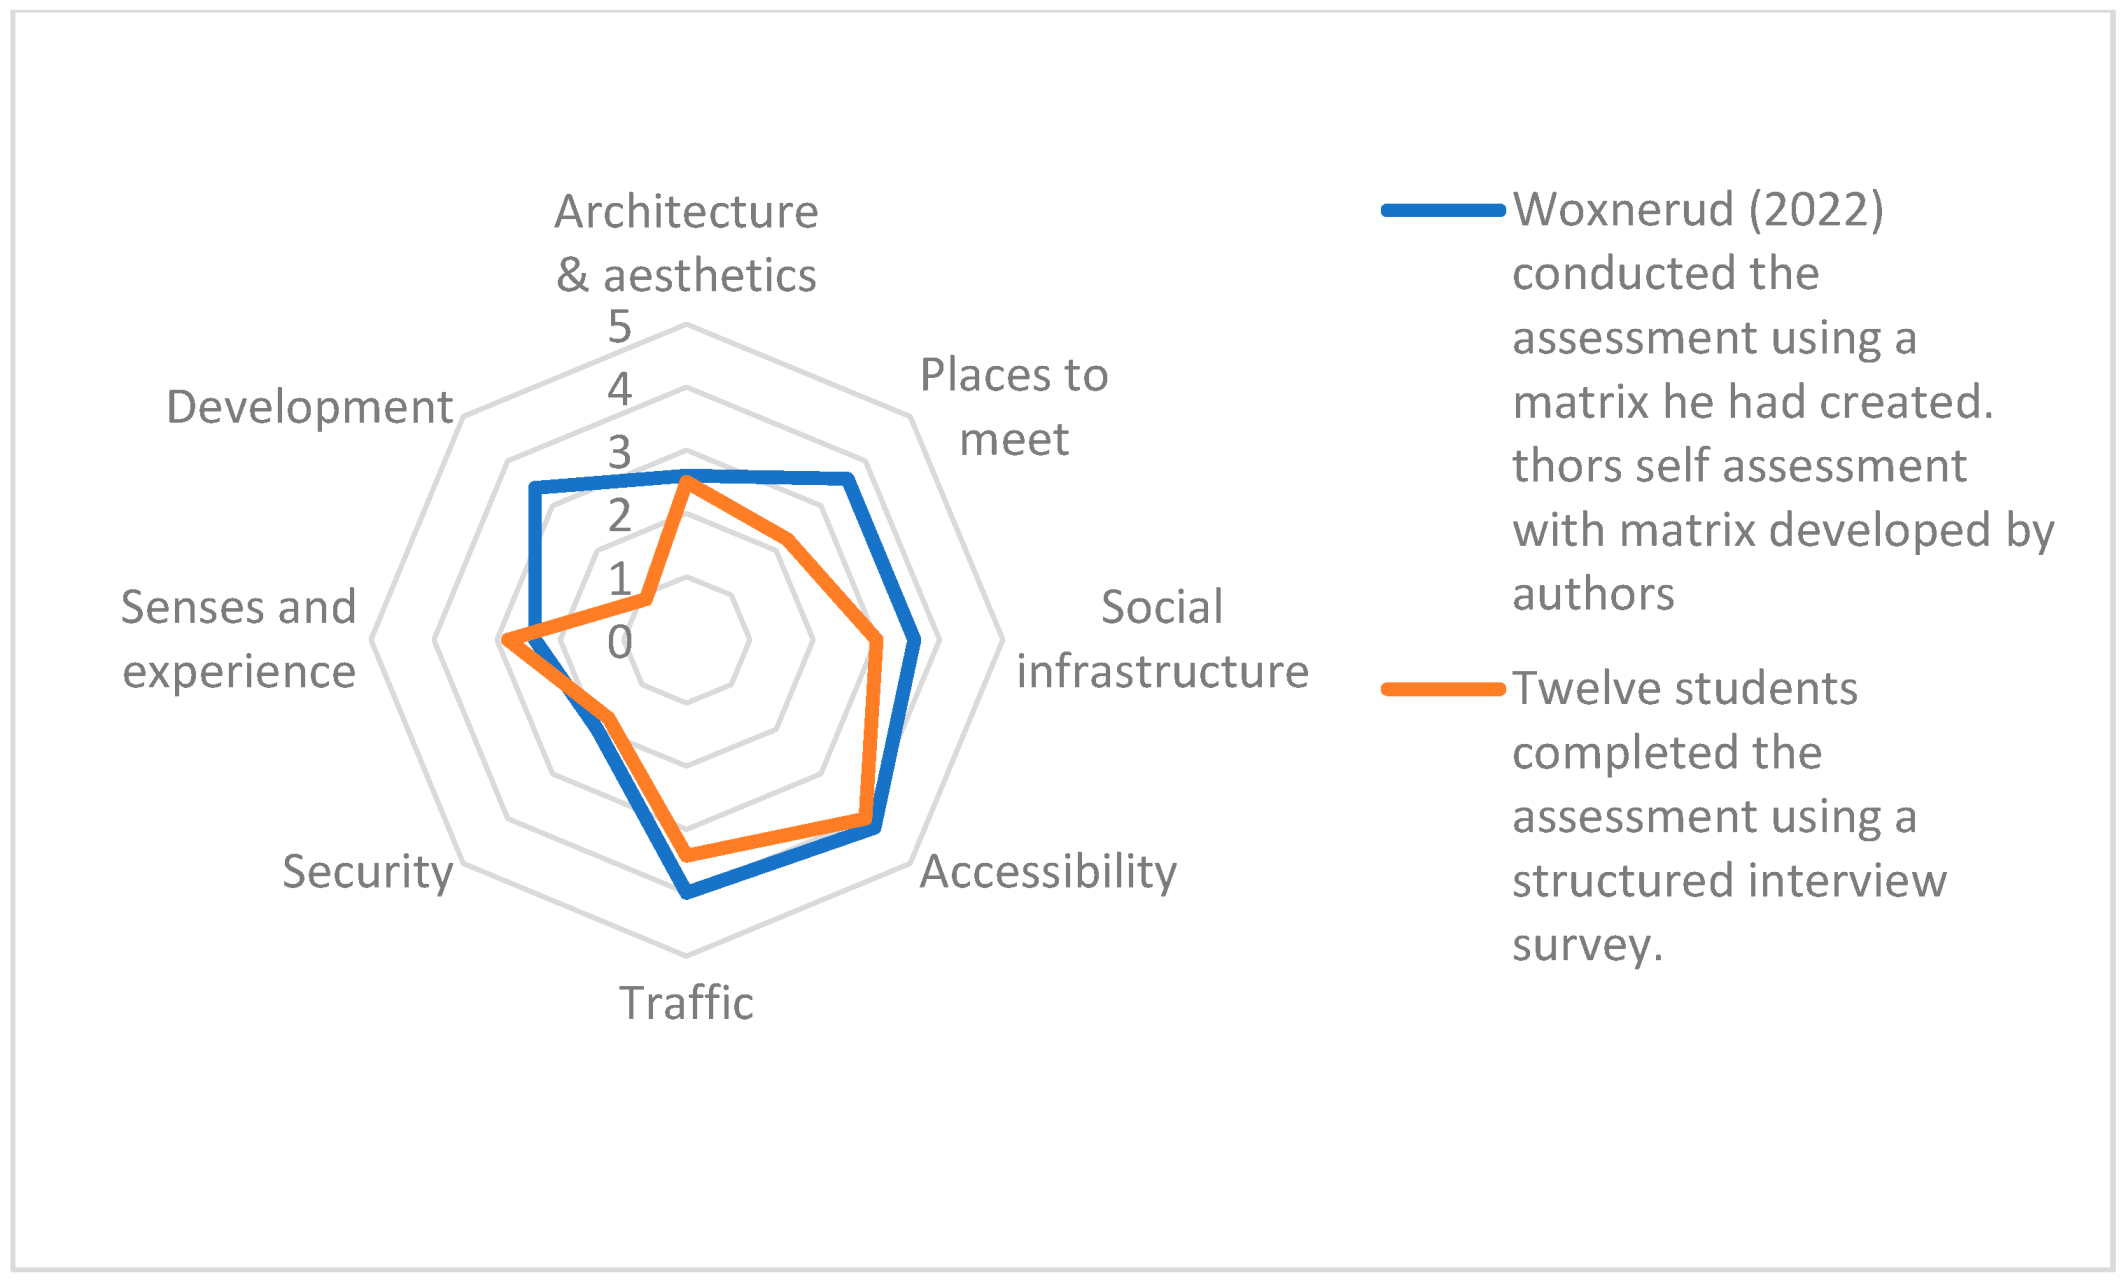
  • In May 2024, twelve undergraduate students from the same program at Karlstad University conducted the third assessment under sunny and slightly windy conditions. The third assessment was guided by the survey assessment matrix. The students first observed the site for approximately 20 min, then answered all the questions. The authors converted the last eight questions into a rating scale and graded them on a five-point Likert scale as follows: 1 = very bad impression, 2 = bad impression, 3 = neutral impression, 4 = good impression, 5 = very good impression (refer to Table 4b). Weller et al. [28] assert that individuals can occasionally use rating scales, provided they carefully utilize both positive and negative items and adhere to the entire range of scale values. After entering all the grades, the authors calculated the average scores for the eight different categories, then used a radar chart to graphically present the results.

3.5. Step 3: Analyzing Results

The mean value and spread rate of the results were calculated to provide units suitable for comparisons between the different methods.
The mean value was calculated using Formula (1).
  • Formula (1)—Mean value calculation
M e a n   v a l u e = S u m   o f   s t u d e n t   g r o u p   r a t i n g s N u m b e r   o f   s t u d e n t   g r o u p s
The spread rate was calculated using Formula (2).
  • Formula (2)—Spread rate calculation
S p r e a d   r a t e = M a x i m u m   v a l u e M i n i m u m   v a l u e

3.6. Step 4: Comparing Results

After the analysis the results were compared and conclusions were drawn.

4. Results

The results will be concisely presented in three subcategories related to the three different methods used in this study. For the full results see Table 3.

4.1. Assessment Method Created by Woxnerud [24] (Assessment Method 1)

Table 2 numerically displays the results for all seven groups, along with the mean and spread scores assigned to each of the eight categories. The groups rated “Places to Meet” the highest (3.97), followed by “Senses and Experience” (3.77), “Traffic” (3.74), “Social Infrastructure” (3.71), and “Accessibility” (3.43), “Development” (2.80), “Architecture and Aesthetics” (2.74), and “Security” (2.29) received the lowest ratings.
When examining the spreads in Table 2, we can see that “Security” (2.4) has the largest variation among the assessment categories, followed by “Development” (2.2) and “Accessibility” (2). The remaining five categories show fewer differences. Consequently, the assessment suggests a 62.5% consensus among the assessors.
Figure 2 shows the assessment of Woxnerud [24] using the first assessment method alongside the mean values from the seven student groups. This comparison highlights differences in five of the eight categories: Architecture and Aesthetics (0.14), Places to Meet (0.37), Social Infrastructure (0.11), Security (0.29), and Senses and Experience (1.37). In these categories, the average value from the student groups is higher than the authors’ assessment. Conversely, for Accessibility (0.77), Traffic (0.26), and Development (0.60), the authors’ assessment values are higher. When recording the former differences as positive values and the latter as negative ones, the average difference is 0.65/8 = 0.08.

4.2. Jan Gehl’s Twelve Quality Criteria (Assessment Method 2)

Twelve students used Jan Gehl’s twelve quality criteria. When examining the spreads in Table 3, we see that six corresponding quality criteria show values higher than 3, while two criteria show values less than 3.
Table 3 displays the mean and spreads for the twelve student assessments (A–L) using the second assessment method.
Figure 3 displays the assessment of Woxnerud [24] using the first assessment method alongside the mean values from the twelve students who used the second assessment method. This comparison illustrates significant differences in two of the six categories: Architecture and Aesthetics (0.02) and Security (1). In these categories, the average value from the twelve students using Jan Gehl’s 12-criterion assessment matrix is higher than the authors’ assessment values. Conversely, for Places to Meet (0.87), Social Infrastructure (0.94), Accessibility (0.62), and Senses and Experiences (0.52), the authors’ assessment values are higher. Recording the former differences as positive values and the latter as negative values results in an average difference of 1.93/6 = 0.32.

4.3. Structured Interviews (Assessment Method 3)

Table 4a presents the responses to the first two questions from the structured interview matrix, which probed the assessors’ familiarity with Kronoparken. The results indicate that nine respondents live in Kronoparken, while only three visit often, have visited a few times, or have visited twice. The next question asked assessors to describe Kronoparken using three at-tributes, exploring their initial impressions of the location. The results show that 94.0% of respondents had a negative impression of Kronoparken, describing it with attributes such as poverty, crime, poor social aspects, evening insecurity, and monotonous architecture.
Table 4b presents the scores that students received on the twelve assessments (samples A–L), along with the mean spread rate (differences between the highest and lowest scores). To facilitate comparison with different assessment matrices, the authors translated the respondents’ expressions into numerical values from 1 to 5, as shown in the table below. The students completed this task in May 2024 using a structured interview assessment matrix. The graphic shows that Architecture and Aesthetics (3), Places to Meet (4), Social Infrastructure (4), and Senses and Experiences (3) have the largest differences between assessment categories. Accessibility (2), Traffic (2), and Security (2) showed fewer differences across all categories. Development (1) received the lowest ranking.
Figure 4 displays the assessment of Woxnerud [24] using the first assessment method alongside the mean values from the twelve students who used the third assessment method. This comparison illustrates differences in one of the eight categories: Senses and Experiences (0.43). In this category, the average value from the twelve students who completed the assessment using a structured interview survey is higher than the authors’ assessment value. Conversely, for Architecture and Aesthetics (0.10), Places to Meet (1.35), Social Infrastructure (0.60), Accessibility (0.20), Traffic (0.59), Security (0.25), and Development (2.49), the authors’ assessment values are higher. Recording the former differences as positive values and the latter as negative values results in an average difference of 3.60/8 = 0.45.
Figure 5 graphically depicts the comparison between the mean of the authors’ first assessments (orange), the mean of the results of the first assessment method by the seven student groups (blue), the mean of the third assessment by the twelve students (green), and the mean of the second assessment by the twelve students (yellow).

5. Discussion

Sustainable communities and cities have recently focused on the social aspects as a vital element of long-term planning. In recent decades, a growing amount of literature has established many approaches and methodologies for evaluating sustainability (Colantonio) [7].
Social sustainability is often regarded as a difficult and subjective notion because its measurement is qualitative, encompassing elements such as individuals’ ideas, perceptions, and satisfaction [8].
People may subjectively assess the aspects of their urban environment that influence their quality of life based on their own particular impressions of those aspects, claim Marans et al. [22].
This study used a comparison between three methods to determine the most consensus-based matrix for optimal implementation and to understand how consensus was obtained across many assessments and indicators, given the subjective character of the dimension, the methods used to measure it, and the findings.
The three methods are: Woxnerud’s method, Jan Gehl’s twelve quality criteria, and a structured survey. Seven student groups performed the initial assessment, followed by 12 individual students who conducted the second and third assessments.
Survey research commonly employs structured interviews. One significant benefit is that it ensures consistency in the information gathered, allowing for the accurate comparison of data. Researchers use structured interviews to obtain precise responses from participants that align with the study’s purpose. This approach helps focus the study on the subject matter and directs participants toward the main objective of the investigation.
The authors believe that Table 5 provides a valuable foundation for discussing the research findings because they present the mean results of all assessments both numerically and graphically. In this section, the authors will individually analyze each assessment to compare how different assessors evaluated the eight categories, revealing any consensus or differences between individual and collective assessments.
As previously stated, the findings reveal that nine participants claimed to reside in Kronoparken, while only three indicated frequent, infrequent, or occasional visits. This is why the results show that 94.0% of respondents had a negative impression of Kronoparken, describing it with attributes such as poverty, crime, poor social aspects, evening insecurity, and monotonous architecture. Von Glasersfeld and Berger et al. [65] argue that people who grew up under similar circumstances perceive the world in similar ways, which explains the shared interpretations.
In his assessment, Woxnerud [24] scored architecture and esthetics at 2.6 on a five-point Likert scale. This score reflects a negative impression but is considered fair. As noted by Dahlgren et al. [58], during the 1960s and 1970s, Kronoparken developed rapidly, and modernism greatly influenced the area’s architecture (Törnberg) [58]. The differences in consensus for architecture and aesthetics were +0.14, −0.1, and +0.02, indicating that the three assessors evaluated it similarly and objectively. The positive sign indicates that the score exceeds Woxnerud’s [24] assessment, while the negative sign indicates the opposite.
On a five-point Likert scale, Woxnerud [24] scored accessibility at 4.2. All assessors deemed the center of Kronoparken, like all district centers in Sweden, to have excellent accessibility, with consensus scores of −0.46, −0.2, and −0.62. This indicates that the three assessors evaluated it objectively, with a high validity score.
Reports indicate that Kronoparken is often dangerous (Karlstad Municipality; Krums-Vabins) [59,60] due to crime and drug dealing (Asplid,) [61]. In 2022, Woxnerud rated the security category at 2 on a five-point Likert scale. It appears that all three assessors agreed with this rating. The scores for differences in security consensus were +0.29, −0.25, and +1, indicating a high level of validity and objectivity, as the grades were nearly identical.
The traffic category received a score of 4, reflecting the ease of cycling and walking in the area, as well as the well-developed public transportation system. Differences in consensus for traffic were −0.26 among the seven student groups using Woxnerud’s [24] matrix and −0.59 for the twelve students who completed the assessment using a structured interview survey. Since the traffic category was not defined in Jan Gehl’s 12-criterion, the score became −4, which can be considered negligible.
The lack of social infrastructure in Kronoparken showed a favorable consensus, with differences in consensus for social infrastructure being +0.11, −0.6, and −0.94, indicating that the three assessors evaluated it almost identically. Woxnerud [24] scored social infrastructure at 3.6 on a five-point Likert scale. The authors define social infrastructure as areas and places that facilitate social interaction, such as schools, cafes, play areas, and sports facilities.
Due to its social problems, the suburb has a somewhat negative reputation, leading to a passive increase in the population and zero development in the center of Kronoparken. According to Woxnerud [24], the development category scored 3.4 on a five-point Likert scale. The authors perceive this score as somewhat elevated. Differences in the development consensus were evident when comparing scores of +0.6, −2.49, and -3.4. One reason for these large differences is that respondents have an unclear definition of development. Since the development category was not defined in Jan Gehl’s 12-criterion, the score dropped to −3.4, which can also be considered negligible, similar to the traffic category.
Regarding meeting places, the results indicated a higher level of consensus between Woxnerud [24], who scored 3.6, and the seven student groups, who scored 3.9, as they used the same assessment method. Twelve students who conducted the assessment using a structured interview and those who applied Jan Gehl’s 12-criterion showed almost the same degree of consensus, with scores of 2.25 and 2.73, respectively. The similarity in scores between the second set may relate to the influence of similar experiences, as noted by Von Glasersfeld. The results indicate that nine respondents declared they live in Kronoparken.
The lack of consensus for the senses and experiences category between Woxnerud [24], who scored 2.4, and the seven student groups, who scored 3.77 using the first assessment method, may be attributed to different ethnicities. Among the seven groups, three were of foreign origin and were more familiar with Kronoparken centrum. This led them to place a higher value on the senses and experiences category compared to Woxnerud [24], citing the power of similar experiences to explain observed differences (Von Glasersfeld). Dahlgren et al. [56] observed that Kronoparken was highly segregated based on ethnicity, with approximately 40% of its residents being of foreign origin.
Since the first assessment shows a 75.0% assessor consensus and 98.4% consonance compared to Woxnerud’s [24] assessment, the authors will discuss in more detail a thorough comparison of the first assessment with Woxnerud’s [24] assessment results.
In general, Woxnerud’s [24] assessment scores were not very different from the averages of the seven student-group assessment scores. The authors observed a mean difference of less than 10% (less than 0.5 points on a 5-point scale), with traffic, accessibility, and development registering slightly higher differences of 5.2%, 9.4%, and 12.0%, respectively. These three categories also showed the highest mutual differences among the seven student groups. Table 5 shows that there is significant variation between the highest and lowest grades assigned by the student groups in some categories of the matrix. Averaging the eight individual spread values yields a mean difference of 1.985 points. This is quite intuitive, as the method itself is based on subjective assessments, and social sustainability is a complex dimension characterized by a lot of subjectivity. Individual attitudes can influence the assessment, even if all assessors have the same educational or scientific background.
A comparison of mutual rankings revealed a reasonable degree of agreement among the seven student groups and Woxnerud’ s (2022) [28] assessment. For instance, the students frequently ranked security low while consistently ranking meeting places high. Generally, a pattern emerged where the same categories received the highest and lowest rankings. Some groups rated the category Development lowest, while others placed it among the top four. We also found a noticeable difference between the categories Accessibility and Senses and Experience.
Table 6 shows the larger difference seen in the category Accessibility can be attributed to two issues. Question 4b in the category—“Is the fastest route through the area clear?” “Is there a risk of detours?” “Is there a risk of disorientation?”—may not be straightforward for the assessors to interpret. This also presumably applies to question 4d—“Is the location’s lighting sufficient to read sign language when it is dark outside?” The spreads for these two questions are 4 and 3, respectively (compared to 2 or 1 for the others in the category). It would also be beneficial to conduct the assessment at night with different groups of students and examine the effect of ambient brightness variation on the results. Regarding the category Development, notable differences are seen among the seven groups for four of the five questions. According to the analysis, there are large differences for all questions except question 8b—Does the area of the site have multiple types of housing or only one type of housing? Development, like Senses and Experience, need not be interpreted or appreciated similarly by everyone, as this question (or all questions related to this category) pertains more to the area (Kronoparken as a whole) than just the location. There may have been a lack of clarity regarding the delimitation of the area for the study, which could have affected the results.
While subjectivity impacts measurements related to social sustainability—due to individual differences in experiencing and interpreting, as well as variations over time that make the timing of measurement a key factor—the resident interviewed pointed out that the character of the place is very sensitive to the weather. We must also consider that both Woxnerud’s [24] assessment and the student-group assessments were conducted four months apart, during two distinct seasons of the year: the end of spring and the beginning of autumn. It may be beneficial to repeat the assessments at different times of the year, including winter and summer, to test the sensitivity of the results to weather variations. Furthermore, we could expand the study by interviewing more local residents, representing different age groups and educational backgrounds, and including both men and women.
There are two categories out of eight with a high and almost identical spread score: security and development. Consequently, the first assessment suggests a 62.5% assessor consensus.
There are four categories out of six that have a high and almost identical spread score: architecture and esthetics, places to meet, social infrastructure, and accessibility. Consequently, the second assessment suggests a 67% assessor consensus.
As shown in Table 6 and Table 4b, there are four categories out of eight that have a high and almost similar spread score: accessibility, security, traffic, and development. Consequently, the third assessment suggests a 50.0% assessor consensus.
We observed a mean difference of 1.6% (on a 5-point scale) between the assessments conducted by the seven student groups using Woxnerud’s [24] matrix and those conducted by Woxnerud [24] using a matrix he had created. The second and third assessments demonstrate a mean difference of 25.0% and 9.0%, respectively. This means that the first method had 98.4% consonance, the second method had 75.0% consonance, and the third method had 91.0% consonance. This indicates that Woxnerud’s [24] method is more objectively applicable than the two other methods tested.

6. Conclusions

The study showed that a subjective tool (an assessment method based on subjective evaluations) can yield some notable differences in the data when used by different individuals. Among the tested methods, Woxnerud’s method showed the least fluctuations in results. Moreover, it achieved 75.0% assessor consensus and 98.4% consonance.
However, factors such as the unclear boundaries of the study area, differing interpretations of the linked category’s definition, and seasonal variations during the assessment period come into play. There were some notable differences in the data, with an 8% variation in consensus between the first and second assessments, and a 25% variation between the first and third. The difference in consensus between the first and third assessments is 8%, while between the first and second, it is 23%. Compared to the other two methods tested in this article, Woxnerud’s method proves to be more objectively useful.
In general, a matrix is a useful tool for assessing a place’s strengths and weaknesses from a social sustainability perspective (noting that social sustainability here refers to a dimension rather than a specific category within it). The mutual ranking of the categories indicates that similar categories are ranked positively and negatively by various researchers and assessors. Moreover, the comparison between the individual assessment and the average of the student-group assessments shows that similar grades can be obtained from various assessments, though exceptions, as seen in this study, will always occur for some categories.

7. Recommendations for Further Research

The following recommendations for further research can be listed:
  • The utility of the matrix can be reinforced and the assessments made more robust by testing for temporal and seasonal sensitivities of the results.
  • Interviewing those who frequent the place most often could provide a more holistic and comprehensive perspective of the place.
  • To improve clarity and measurability, the questions in the categories of Accessibility, Senses and Experience, and Development could be further developed.
  • The number of participants in the study (i.e., the student groups) may influence the results to some extent. More accurate results might be achieved by recruiting additional students and increasing the number of assessment sets.
  • Consideration could be given to the equi-weighting approach adopted in this study. If different weightings need to be assigned (both intra-categorical to the questions and inter-categorical), an expert panel comprising a wide range of stakeholders could be established and consulted to enhance the robustness of the matrix and methodology.

Author Contributions

Conceptualization. K.N.; data curation. K.N. and W.W.; investigation. K.N. and W.W.; methodology. K.N.; resources. K.N. and W.W.; supervision. K.N.; visualization. W.W.; writing—original draft. K.N. and W.W.; writing—review and editing. K.N. and W.W. and O.N. supported the whole research process. provided various insightful opinions. and oversaw the study. All authors have read and agreed to the published version of the manuscript.

Funding

This research received no external funding.

Data Availability Statement

The data used to support the findings of this study are included within the paper.

Acknowledgments

This paper is an enhanced edition of William Woxnerud’s bachelor thesis, which was finalized in 2022 under the supervision of Karim Najar, the first author at the Department of Engineering and Chemical Sciences, Karlstad University, Karlstad. Sweden. The authors express their gratitude to the students who actively contributed to this study by carrying out the assessments.

Conflicts of Interest

No conflicts of interest have been made known by the authors.

Appendix A

Figure A1. Location of Kronoparken (in yellow) in Karlstad, Värmland. Map created with Lantmäteriet’s “Min karta” service (Lantmäteriet, 2023) [66].
Buildings 14 03395 g0a1
Figure A2. Collage depicting the center of Kronoparken in north-eastern Karlstad. Pictures are taken by the authors.
Buildings 14 03395 g0a2
Figure A3. Approximate demarcation of the area (red) and place (blue) in Kronoparken. Map created with Lantmäteriet’s “Min karta” service (Lantmäteriet, 2022) [67].
Buildings 14 03395 g0a3

Appendix B

Table A1. The 40 questions under the 8 categories of the social sustainability assessment matrix, including Categories 1–4 (Woxnerud 2022), (Woxnerud, Najar et al. 2024) [24,25].
1. ARCHITECTURE AND ESTHETICS
1aIs the public space beautiful? Is it evident that there is good design both in terms of how things are shaped, as well as their durability?
1bAre the site and its buildings adapted to the human scale? Can people on the outer edges of the place be distinguished as people?
1cAre seating options placed in such a way that there are interesting things to look at?
1dDoes the location’s area have a distinctive profile compared to nearby areas? (for example: by virtue of having a different style of architecture)
1eIs there access to any form of public art at the place?
2. PLACES TO MEET
2aHow are the acoustics at the place? For example, is it possible to have a conversation, or is the ambient noise too loud?
2bAre there good “primary seats” such as benches or are there only “secondary seats” such
as stairs, facades, or fountain edges?
2cDoes the place have details that make it possible to stop and lean against? (for example: bus shelters, benches, facades, trees, niches, or ledges)
2dIs there access to places in the vicinity of the site that enable larger events? (for
instance: squares, parks, wide sidewalks)
2eIs the site free from hostile architecture such as benches that are difficult to sit on?
3. SOCIAL INFRASTRUCTURE
3aCan the whole place be used for activities and play? Are there major obstacles to this?
3bIs there access to basic social infrastructure in the vicinity of the location? (e.g., shops, gyms, community facilities, and green spaces)
3cAre there schools, leisure centers, and preschools in close proximity to the site?
3dAre there “third places” such as cafes adjacent to the site?
3eAre there dedicated playgrounds in the vicinity of the site?
4. ACCESSIBILITY
4aIs the location available? Are there physical elements that limit the site’s accessibility?
4bIs the fastest route through the area clear, or is there a risk of detours? Is there a risk of disorientation?
4cIs the walking surface relatively flat? Are there ramps alongside the stairs for wheelchair users?
4dIs the location’s lighting sufficient for it to be possible to read sign language when it is dark outside?
4eIs there guidance for the visually impaired through, for example, tactile walking boards or handrails?
Table A2. The 40 questions under the 8 categories of the social sustainability assessment matrix, including Categories 6–8 (Woxnerud 2022), (Woxnerud, Najar et al., 2024) [24,25].
5. TRAFFIC
5aIs it possible to cycle and walk safely without the risk of accidents?
5bDoes the area offer good communications through regular public transport?
5cIs the area well connected to nearby areas by roads and shared surfaces?
5dIs environmentally friendly transport made possible for both pedestrians and cyclists? Are these networks well developed?
5eHow does the streetscape change in winter? Do the roof shapes look like they cause
snowfall on the street?
6. SECURITY
6aIs the location safe both day and night?
6bIs there movement on the site at all hours of the day?
6cDoes lighting create security and a good atmosphere?
6dIs there a natural surveillance of the site with many windows overlooking it?
6eDoes the design of the place give the appearance of security or are there, for example, iron bars and steel shutters for windows?
7. SENSES AND EXPERIENCE
7aAre there noises, dust, smells, or other pollution?
7bDoes the character of the place change when it is windy or stormy?
7cDoes the location offer a good microclimate all year round?
7dWhere are the seats located? Full sun or shade? How are seats positioned in relation to the wind? Do they offer protection?
7eAre there many trees adjacent to the site? Are there big trees?
8. DEVELOPMENT
8aDo the location and the area offer flexible workplaces, like cafes and libraries for instance?
8bDoes the area of the site have housing of different sizes, or is the variation minimal?
8cDoes the site area have premises for varying needs? (for instance: shop premises of different sizes)
8dDoes the area seem to be developing?
8eIs it clear that the area’s residents have had influence over the area’s design?

Appendix C

Table A3. The 12 questions under the 3 categories of Jan Gehl’s 12-criterion assessment matrix have been adjusted to eight categories to facilitate comparison with the authors’ method (Woxnerud, Najar et al.) [25].
CategoriesCorresponding Quality CriteriaDefinition of Each Quality CriteriaCategories of the Matrix
ProtectionProtection against traffic and accidents.Do groups across age and ability experience traffic safety in the public space? Can one safely bike and walk without fear of being hit by a driver?Security
Protection against harm by othersIs the public space perceived to be safe both day and night? Are there people and activities at all hours of the day because the area has, for example, both residents and offices? Does the lighting provide safety at night as well as a good atmosphere?
Protection against unpleasant sensory experienceAre there noises, dust, smells, or other pollution? Does the public space function well when it is windy? Is there shelter from strong sun, rain, or minor flooding?
ComfortOptions for mobilityIs this space accessible? Are there physical elements that might limit or enhance personal mobility in the forms of walking, using a wheelchair, or pushing a stroller? Is it evident how to move through the space without having to take an illogical detour?Accessibility
Options to stand and lingerDoes the place have features you can stay and lean on, like a façade that invites one to spend time next to it, a bus stop, a bench, a tree, or a small ledge or niche?Places to meet
Options for sittingAre there good primary seating options such as benches or chairs? Or is there only secondary seating such as a stair, seat wall, or the edge of a fountain? Are there adequate non-commercial seating options so that sitting does not require spending money?
Options for seeingAre seating options placed so there are interesting things to look at?Senses and experience
Options for talking and listening/hearingIs it possible to have a conversation here? Is it evident that you have the option to sit together and have a conversation?Places to meet
EnjoymentOptions for play, exercise, and activitiesAre there options to be active at multiple times of the day and year?Social infrastructure
ScaleIs the public space and the building that surrounds it at a human scale? If people are at the edges of the space, can we still relate to them as people or are they lost in their surroundings?Architecture and esthetics
Opportunities to enjoy the positive aspects of climateAre local climatic aspects such as wind and sun taken into account? Are there varied conditions for spending time in public spaces at different times of year? With this in mind, where are the seating options placed? Are they located entirely in the shadows or the sun? And how are they oriented/placed in relation to wind? Are they protected?Senses and experience
Experience of esthetic qualities and positive sensory experiencesIs the public space beautiful? Is it evident that there is good design both in terms of how things are shaped, as well as their durability?
Traffic
Development

References

  1. Garau, C.; Pavan, V.M. Evaluating urban quality: Indicators and assessment tools for smart sustainable cities. Sustainability 2018, 10, 575. [Google Scholar] [CrossRef]
  2. Drakakis-Smith, D. Third world cities: Sustainable urban development. Urban Stud. 1995, 32, 659–677. [Google Scholar] [CrossRef]
  3. Kunz, J. Social Sustainability and Community Involvement in Urban Planning: Lessons from the ECOCITY Project; University of Tampere, Department of Social Policy and Social Work, Unit for Research into Housing and the Environment: Tampere, Finland, 2006. [Google Scholar]
  4. Littig, B.; Griessler, E. Social sustainability: A catchword between political pragmatism and social theory. Int. J. Sustain. Dev. 2005, 8, 65–79. [Google Scholar] [CrossRef]
  5. Partridge, E. Social sustainability’: A useful theoretical framework. In Australasian Political Science Association Annual Conference; University of Technology: Delft, The Netherlands, 2005. [Google Scholar]
  6. Cuthill, M. Strengthening the ‘social’ in sustainable development: Developing a conceptual framework for social sustainability in a rapid urban growth region in Australia. Sustain. Dev. 2010, 18, 362–373. [Google Scholar] [CrossRef]
  7. Colantonio, A. Social Sustainability: A Review and Critique of Traditional Versus Emerging Themes and Assessment Methods; Loughborough University: Loughborough, UK, 2009. [Google Scholar]
  8. Kordi, N.E.; Belayutham, S.; Ibrahim, C.K.I.C. Mapping of social sustainability attributes to stakeholders’ involvement in construction project life cycle. Constr. Manag. Econ. 2021, 39, 513–532. [Google Scholar] [CrossRef]
  9. Eizenberg, E.; Jabareen, Y. Social sustainability: A new conceptual framework. Sustainability 2017, 9, 68. [Google Scholar] [CrossRef]
  10. Nakamba, C.C.; Chan, P.W.; Sharmina, M. How does social sustainability feature in studies of supply chain management? A review and research agenda. Supply Chain. Manag. Int. J. 2017, 22, 522–541. [Google Scholar] [CrossRef]
  11. Valdes-Vasquez, R.; Klotz, L.E. Social sustainability considerations during planning and design: Framework of processes for construction projects. J. Constr. Eng. Manag. 2013, 139, 80–89. [Google Scholar] [CrossRef]
  12. Bebbington, J.; Dillard, J. Social sustainability: An organizational-level analysis. In Understanding the Social Dimension of Sustainability; Routledge: London, UK, 2008; pp. 173–189. [Google Scholar]
  13. Opp, S.M. The forgotten pillar: A definition for the measurement of social sustainability in American cities. Local Environ. 2017, 22, 286–305. [Google Scholar] [CrossRef]
  14. Woodcraft, S.; Hackett, T.; Caistor-Arendar, L. Design for Social Sustainability: A Framework for Creating Thriving New Communities; The Young Foundation: London, UK, 2011. [Google Scholar]
  15. Kelly, M. Inequality and crime. Rev. Econ. Stat. 2000, 82, 530–539. [Google Scholar] [CrossRef]
  16. Larsson, D. Exposure to Crime as a Consequence of Poverty: Five Investigations About Relative Deprivation, Poverty and Exposure to Crime; Sociologi: Copenhagen, Denmark, 2006. [Google Scholar]
  17. Birmingham, E. Refraining the ruins: Pruitt-Igoe, structural racism and African American rhetoric as a space for cultural critique. West. J. Commun. 1999, 63, 291–309. [Google Scholar] [CrossRef]
  18. Jobard, F. Policing the banlieues. In Policing in France; Routledge: London, UK, 2020; pp. 187–201. [Google Scholar]
  19. Miller, B.J. The struggle over redevelopment at Cabrini-Green 1989–2004. J. Urban Hist. 2008, 34, 944–960. [Google Scholar] [CrossRef]
  20. Swedish Police Utsatta Områden—Polisens Arbete (Swedish) [Marked/Targeted Areas—The Work of the Police]. 2015. Available online: https://polisen.se/om-polisen/polisens-arbete/utsatta-omraden/ (accessed on 4 September 2022).
  21. Delegationen Mot Segregation [The Delegation Opposing Segregation]. Segregation i Sverige:—Årsrapport Om Den Socioekonomiska Boendesegregationens Utveckling. [Annual Report of the Status of the Socio-Economic Segregation of Inhabitants]. 2021. Available online: https://delmos.se/wp-content/uploads/2021/07/Segregation-i-Sverige.pdf (accessed on 4 September 2022).
  22. Marans, R.W.; Stimson, R.J. Investigating Quality of Urban Life: Theory, Methods, and Empirical Research; Springer Science & Business Media: New York, NY, USA, 2011; Volume 45. [Google Scholar]
  23. Stagl, S. Theoretical foundations of learning processes for sustainable development. Int. J. Sustain. Dev. World Ecol. 2007, 14, 52–62. [Google Scholar] [CrossRef]
  24. Woxnerud, W. Mänskligare städer: Framtagande av en ny bedömningsmetod för social hållbarhet och bedömning av Kronoparkens centrum i Karlstad. [More Humane Cities: Developing a New Assessment Method for Social Sustainability and Evaluating Central Kronoparken in Karlstad]. 2022. Available online: https://www.diva-portal.org/smash/record.jsf?pid=diva2%3A1675407&dswid=-5592 (accessed on 4 September 2022).
  25. Woxnerud, W.; Najar, K.; Nylander, O. The Human City: The Development of an Easy-to-Use Assessment Method Calibrated to Swedish Conditions. Sustainability 2024, 16, 5702. [Google Scholar] [CrossRef]
  26. Batchelder, W.H.; Anders, R. Cultural consensus theory: Comparing different concepts of cultural truth. J. Math. Psychol. 2012, 56, 316–332. [Google Scholar] [CrossRef]
  27. Ten Cate, O.; Regehr, G. The power of subjectivity in the assessment of medical trainees. Acad. Med. 2019, 94, 333–337. [Google Scholar] [CrossRef] [PubMed]
  28. Weller, S.C.; Romney, A.K. Systematic Data Collection; Sage Publications: Thousand Oaks, CA, USA, 1988; Volume 10. [Google Scholar]
  29. Romney, A.K.; Moore, C.C. Toward a theory of culture as shared cognitive structures. Ethos 1998, 26, 314–337. [Google Scholar] [CrossRef]
  30. Romney, A.K.; Weller, S.C.; Batchelder, W.H. Culture as consensus: A theory of culture and informant accuracy. Am. Anthropol. 1986, 88, 313–338. [Google Scholar] [CrossRef]
  31. Schneggm, M.; Lang, H. Die Analyse kultureller Domänen. Eine praxisorientierte Einführung. Methoden der Ethnographie [The analysis of cultural domains. A practice-oriented introduction. Methods of ethnography]. 2008. Available online: https://www.researchgate.net/publication/285282734_Die_Analyse_kultureller_Domanen_Eine_praxisorientierte_Einfuhrung (accessed on 4 September 2022).
  32. Rashidi, M.N.; Begum, R.A.; Mokhtar; Pereira, J.J. The conduct of structured interviews as research implementation method. J. Adv. Res. Des. 2014, 1, 28–34. [Google Scholar]
  33. Queirós, A.; Faria, D.; Almeida, F. Strengths and limitations of qualitative and quantitative research methods. Eur. J. Educ. Stud. 2017, 3, 369–386. [Google Scholar]
  34. Bernardi, S.; Merseguer, J.; Petriu, D.C. A dependability profile within MARTE. Softw. Syst. Model. 2011, 10, 313–336. [Google Scholar] [CrossRef]
  35. Weller, S.C. Structured interviewing and questionnaire construction. In Handbook of Methods in Cultural Anthropology; Rowman & Littlefield Publishers: Lanham, MD, USA, 1998; pp. 365–409. [Google Scholar]
  36. Fowler, F.J., Jr.; Cosenza, C. Design and evaluation of survey questions. In The SAGE Handbook of Applied Social Research Methods; SAGE Publications, Inc.: Newbury Park, CA, USA, 2009; Volume 2, pp. 375–412. [Google Scholar]
  37. Bryman, A. Social Research Methods; Oxford University Press: New York, NY, USA, 2016. [Google Scholar]
  38. Abdul-Rahman, H.; Wang, C.; Wood, L.C.; Low, S.F. Negative impact induced by foreign workers: Evidence in Malaysian construction sector. Habitat Int. 2012, 36, 433–443. [Google Scholar] [CrossRef]
  39. Gill, P.; Stewart, K.; Treasure, E.; Chadwick, B. Methods of data collection in qualitative research: Interviews and focus groups. Br. Dent. J. 2008, 204, 291–295. [Google Scholar] [CrossRef] [PubMed]
  40. Kumar, R. Research Methodology: A Step-by-Step Guide for Beginners; Sage Publications Ltd.: Thousand Oaks, CA, USA, 2018. [Google Scholar]
  41. Trull, T.J.; Widiger, T.A.; Useda, J.D.; Holcomb, J. A structured interview for the assessment of the Five-Factor Model of Personality. Psychol. Assess. 1998, 10, 229. [Google Scholar] [CrossRef]
  42. Mack, N. Qualitative Research Methods: A Data Collector’s Field Guide; Family Health International: Durham, NC, USA, 2005. [Google Scholar]
  43. Oppong, S.H. The problem of sampling in qualitative research. Asian J. Manag. Sci. Educ. 2013, 2, 202–210. [Google Scholar]
  44. DePaulo, P. How Large Should the Sample Size Be in a Qualitative Study? DePaulo Research Consulting: Montgomeryville, PA, USA, 2000. [Google Scholar]
  45. Devers, K.J.; Frankel, R.M. Study design in qualitative research—2: Sampling and data collection strategies. Educ. Health 2000, 13, 263–271. [Google Scholar]
  46. Marshall, M.N. Sampling for qualitative research. Fam. Pract. 1996, 13, 522–526. [Google Scholar] [CrossRef]
  47. Hanly, P. The sampling problem. Am. Cathol. Sociol. Rev. 1947, 8, 258–265. [Google Scholar]
  48. Hennink, M.; Kaiser, B.N. Sample sizes for saturation in qualitative research: A systematic review of empirical tests. Soc. Sci. Med. 2022, 292, 114523. [Google Scholar] [CrossRef]
  49. Tuckett, A.G. Qualitative research sampling: The very real complexities. Nurse Res. 2004, 12, 47–61. [Google Scholar] [CrossRef]
  50. Greene, J.; McClintock, C. Triangulation in evaluation: Design and analysis issues. Eval. Rev. 1985, 9, 523–545. [Google Scholar] [CrossRef]
  51. Fern, E.F. The use of focus groups for idea generation: The effects of group size, acquaintanceshiand moderator on response quantity and quality. J. Mark. Res. 1982, 19, 1–13. [Google Scholar] [CrossRef]
  52. Morgan, D.L. Focus groups. Annu. Rev. Sociol. 1996, 22, 129–152. [Google Scholar] [CrossRef]
  53. Murphy, E.; Dingwall, R. Informed consent. anticipatory regulation and ethnographic practice. Soc. Sci. Med. 2007, 65, 2223–2234. [Google Scholar] [CrossRef] [PubMed]
  54. Karlstads Kommun [Karlstad Municipality]. Kronoparken. 2020. Available online: https://karlstad.se/Bygga-och-bo/Bygglov-tillstand-och-fastighetsfragor/Kulturhistoriska-byggnader/Omradesbeskrivningar/kronoparken/ (accessed on 4 November 2022).
  55. Wiik, C. 50 år sedan de första flyttade in på Kronoparken [Fifty years ago. the first residents moved to Kronoparken]. Nya Wermlands Tidningen, 23 September 2020. [Google Scholar]
  56. Dahlgren, B.; Gustafsson, G. Stadsdelen Kronoparken i Karlstad: Stadsplaneringens Vedermödor. [The Suburb of Kronoparken in Karlstad: Tribulations of Urban Planning]; Universitetstryckeriet: Karlstad, Sweden, 2016; Available online: https://karlstad.se/Uppleva-och-gora/Kultur/kommunarkiv/Kulturhistoria/Karlstads-lokalhistoria/samhallsbyggande/stadsdelen-kronoparken/ (accessed on 4 November 2022).
  57. Törnberg, M. Kronparken skapades efter tidens ideal. [Kronoparken was created according to the ideals of the time]. Nya Wermlands-Tidningen, 1 October 2020. [Google Scholar]
  58. Karlstads Kommun [Karlstad Municipality]. Socioekonomiska Förutsättningar i Karlstad [Socio-Economic Conditions in Karlstad]. 2018. Available online: https://segregationsbarometern.boverket.se/kommun/karlstad/ (accessed on 2 May 2022).
  59. Karlstads Kommun [Karlstad Municipality]. Medborgardialog om Brottsbekämpning och Trygghetsarbete [Citizen Dialogue on Crime Prevention and Safety Work]. 2016. Available online: https://www.svt.se/nyheter/lokalt/varmland/vill-ha-fler-poliser-pa-stan (accessed on 4 November 2022).
  60. Krums-Vabins, M. Rösterna Från Kronoparken i Karlstad—Efter Larm om Droghandel Och Otrygghet. [Voices from Kronoparken in Karlstad After Reports of Drug Misuse and Safety Concerns]. Sveriges Television. 10 September 2021. Available online: https://www.svt.se/nyheter/lokalt/varmland/fyra-roster-om-kronoparken-i-karlstad (accessed on 4 November 2022).
  61. Asplid, Å. ”Det har blivit vanligare med skyddsväst”. [Use of protective gear has been more commonplace]. Nya Wermlands-Tidningen, 25 September 2020. [Google Scholar]
  62. Spradley, J.P. The Ethnographic Interview; Waveland Press: Long Grove, IL, USA, 2016. [Google Scholar]
  63. Gehl Institute. Twelve Quality Criteria. 2022. Available online: https://issuu.com/gehlarchitects/docs/twelve-quality-criteria_gehl (accessed on 19 June 2024).
  64. Eken, A.; Magnusson, J.; Hildesson, A.; Molnar, S.; De Fine Licht, K. Rätt verktyg för jobbet? En översikt över verktyg för social hållbarhetsanalys i städer. [The right tool for the job?: An overview of tools for social sustainability analysis in cities]. Mistra Urban Futures Rep. 2017, 1, 17–36. [Google Scholar]
  65. Von Glaserfeld, E.; Johsua, S.; Von Glasersfeld, E. Radical Constructivism. A Way of Knowing and Learning; The Falmer Press: London, UK, 1995. [Google Scholar]
  66. Lantmäteriet Karlstad [Land Survey Karlstad]. SWEREF 99 TM, RH 2000. [Kartografiskt Material] [Cartographic Material]. 2023. Available online: https://minkarta.lantmateriet.se/plats/3006/v1.0/?e=419232&n=6585933&z=9&mapprofile=karta&background=1&boundaries=false (accessed on 9 May 2023).
  67. Lantmäteriet (2022) Kronoparken. SWEREF 99 TM, RH 2000. [Kartografiskt Material]. Available online: https://minkarta.lantmateriet.se/plats/3006/v1.0/?e=418809&n=6585774&z=11&mapprofile=karta&background=1&boundaries=false (accessed on 29 May 2022).
Figure 1. Flow chart of the method used for the study (Woxnerud 2022) [24].
Buildings 14 03395 g001
Figure 2. Compares the assessment of the Woxnerud [24] (blue) and median assessment results from seven student groups (orange) using the first assessment method.
Buildings 14 03395 g002
Figure 3. Compares the assessment of the Woxnerud [24] (blue) and mean assessment results from twelve student assessments in orange using the second assessment method.
Buildings 14 03395 g003
Figure 4. Compares the assessment of the Woxnerud [24] (blue) and median assessment results from twelve student assessments in orange used the third assessment method.
Buildings 14 03395 g004
Figure 5. Compares the assessment of the Woxnerud [24] (orange) and the three different assessment methods used.
Buildings 14 03395 g005
Table 1. The questions used in the questionnaire and the purpose of the questions.
NoQuestionPurpose
1Do you live in Kronoparken? If not, have you ever visited the site?Location familiarity
2Describe the location with three adjectives.First impressions
3How do you experience the site’s architecture and esthetic appearance? What is good and what is bad?Easing comparison
4Do you think the venue works as a meeting place? For example, is it possible to have good conversations on site, and is the place tempting to meet friends? What is good and what is bad?
5How do you experience the social infrastructure on site and in the area? (Social infrastructure can be said to be areas and places that enable social interaction. Examples of this are schools and cafes and play and sports facilities.) What is good and what is bad?
6Does the location look accessible? Can people with reduced mobility use the site? What is good and what is bad?
7Is it easy to cycle and walk in the area? Is public traffic (transportation) well developed? What is good and what is bad?
8Are the location and the area secured? Does it feel like the place is alive or is it desolate? What’s good/bad?
9How is the emotional (senses) and experience on site? Smell, sensation, hearing… How does the weather affect the experience of the location? What’s good/bad?
10Does it feel like the area is developing? Can the inhabitants be involved in directing the development? What’s good/bad?
Table 2. The results of the seven different group assessments (A-G) conducted by the students, along with the mean, and spreads (differences between the highest and lowest values), are shown.
CategoriesStudent GroupsMeanSpread
ABCDEFG
Architecture & esthetics3.41.82.63.22.823.42.741.6
Places to meet4.23.243.6444.83.971.6
Social infrastructure4.83443.633.63.711.8
Accessibility3.62.23.44.23.6433.432.0
Traffic4.23.84.43.43.42.84.23.741.6
Security3.81.422.41.822.62.292.4
Senses and experience43.43.44.24.43.63.43.771.0
Development42.43.823.81.81.82.802.2
Table 3. The mean and spreads for the twelve student assessments (A–L) using the second assessment method. The quality criteria are sorted by the categories of assessment method 1 to ease comparison.
Categories of the MatrixCorresponding Quality CriteriaABCDEFGHIJKLMeanSpread
Architecture & estheticsScale31333222.532252.624
Places to meetOptions to stand
and linger
42352312523532.7343.1
Options for sitting5213332452122.754
Options for talking and listening/hearing33223223.532222.451.5
Social infrastructureOptions for play. exercise. and activities1124233253242.664
AccessibilityOptions for mobility3124344454453.583
SecurityProtection against traffic and accidents5255554424534332.66
Protection against
harm by others
41121123322223
Protection against
unpleasant sensory experience
4222223232233.252
Senses and experienceOptions for seeing4111123321111.751.8832.66
Opportunities to enjoy the positive aspects of climate2211223322342.253
Experience of
esthetic qualities and positive sensory experiences
3121212321111.662
DevelopmentNo corresponding criteria
TrafficNo corresponding criteria
Table 4. (a) Shows the twelve students’ answers to the first two questions in the structured interview assessment matrix, which was completed in May 2024. (b). The mean and spreads for the twelve student assessments (A–L) using the third assessment method.
(a)
The QuestionsThe Answers of 12 Students on the Structured Interview MatrixRate
1. Do you live in Kronoparken? If not, have you ever visited the site?22 yearsLiveLiveLiveLiveLiveLiveLived some yearsLiveDon’t live but visit oftenVisited few times
Visited two times
2. Describe the location with three adjectives.BoringNice to walk inCrime
MulticulturalMulticulturalMulticulturalVery empty
Open
Gray
Boring
Uniform
Open
94%
(b)
Question CategoryABCDEFGHIJKLMeanSpread
Architecture and esthetics3314242322222.53
Places to meet15313211331322.25
Social infrastructure43334345212234
Accessibility32444444444442
Traffic2442443344433.412
Security2312321111221.752
Senses and
experience
2444241124332.833
Development11111111111111
Table 5. The average calculated difference across all the categories for the different assessment methods.
The Eight Distinct Categories of the Assessment Matrix.Woxnerud [20] Conducted the Assessment Using a Matrix He Had Created.Seven Student Groups Used Woxnerud’ s [24] Matrix to Conduct the Assessment.
(Mean Value)
Twelve Students Completed the Assessment Using a Structured Interview Survey.
(Mean Value)
Twelve Students Used Jan Gehl’s 12-Criterion to Complete the Assessment.
(Mean Value)
Architecture & esthetics2.62.74Result differences2.5Result differences2.62Result differencesSpread
+0.14−0.1+0.020.12
Places to meet3.63.97+0.372.25−1.352.73−0.871.72
Social infrastructure3.63.71+0.113−0.62.66−0.941.05
Accessibility4.23.43−0.474−0.23.58−0.620.77
Traffic43.74−0.263.41−0.590−40.59
Security22.29+0.291.75−0.253+11.25
Senses and experience2.43.77+1.372.83+0.431.88−0.521.89
Development3.42.8−0.60.91−2.490−3.42.49
An average difference across all the categories0.65/8 = 0.08 3.6/8 = 0.45 10.35/8 = 1.25
Table 6. Comparison of the scores assigned for each of the five ‘indicators’ of the category Accessibility in the matrix by the seven student groups labeled A–G (refer to Table 1 also for the notations for the questions; and also tally with the average score for the category reported in Table 2).
QuestionABCDEFGSpread (Highest–Lowest)
4a54455541
4b31353524
4c43555542
4d52243433
4e11322122
Average3.62.23.44.24432
Disclaimer/Publisher’s Note: The statements, opinions and data contained in all publications are solely those of the individual author(s) and contributor(s) and not of MDPI and/or the editor(s). MDPI and/or the editor(s) disclaim responsibility for any injury to people or property resulting from any ideas, methods, instructions or products referred to in the content.

