Abstract
Ensuring the structural integrity of window frames and detecting subtle defects, such as dents and scratches, is crucial for maintaining product quality. Traditional machine vision systems face challenges in defect identification, especially with reflective materials and varied environments. Modern machine and deep learning (DL) systems hold promise for post-installation inspections but face limitations due to data scarcity and environmental variability. Our study introduces an innovative approach to enhance DL-based defect detection, even with limited data. We present a comprehensive window frame defect detection framework incorporating optimized image enhancement, data augmentation, and a core U-Net model. We constructed five datasets using cell phones and the Spot Robot for autonomous inspection, evaluating our approach across various scenarios and lighting conditions in real-world window frame inspections. Our results demonstrate significant performance improvements over the standard U-Net model, with a notable 7.43% increase in the F1 score and 15.1% in IoU. Our approach enhances defect detection capabilities, even in challenging real-world conditions. To enhance the generalizability of this study, it would be advantageous to apply its methodology across a broader range of diverse construction sites.
1. Introduction
The construction industry stands at a pivotal juncture, grappling with the dual challenge of escalating demand for quality inspection and a diminishing pool of available inspectors. Traditional inspection mechanisms, long reliable in controlled manufacturing environments, face redefinition in response to evolving industry dynamics, particularly in construction.
This transformation stems from a growing emphasis on post-installation quality assessments, notably in uncontrolled environments like bustling construction sites. Traditional machine vision systems, foundational to industrial processes, reveal their limitations in these dynamic settings, characterized by unpredictable variables and ceaseless activity. These systems often require extensive parameter tuning and can falter, especially in uncontrolled environments marked by fluctuating lighting conditions and unexpected defects [1,2,3].
In parallel, the allure of machine and deep learning (ML/DL) promises to overcome these challenges by offering a more adaptable approach to defect detection. However, the effectiveness of ML/DL critically hinges on the availability of extensive, high-quality datasets, a rarity in the context of construction quality inspection. Even advanced DL models can underperform due to the scarcity of comprehensive training data and the influence of unpredictable external factors, as exemplified by notable studies [1,2,4,5,6].
To bridge this critical gap, the integration of data augmentation surfaces as the initial solution [7,8]. Furthermore, image enhancement techniques aim to bolster DL models by enhancing image clarity, mitigating shadows, and accentuating defects. The synergistic fusion of DL with a judicious image enhancement (IE) strategy can revolutionize defect identification and reshape the industrial landscape [9]. Recent research, exemplified by Wu et al. [10] and Tang et al. [11], has effectively utilized these strategies to improve segmentation networks. Wu et al. notably enhanced crack segmentation accuracy using MobileNetV2_DeepLabV3, while Tang employed image refinement post-processing with U-Net for similar gains. These studies showcase the applicability of these strategies in current research. Alongside technological challenges, the construction sector faces an escalating demand for rigorous quality inspections and a diminishing pool of human inspectors. Even seemingly minor defects can tarnish a brand’s reputation and compromise functional aesthetics [3].
This paper introduces a novel amalgamation of advanced image processing, data augmentation techniques, and DL methodologies to address the challenges posed by intricate lighting conditions and limited data availability on construction sites. We aim to ensure consistent inspections in uncontrolled domains and establish a benchmark for construction quality assessments. Additionally, through a rigorous comparison with a sophisticated segmentation model, we underscore the potential of our proposed methodology, particularly in the burgeoning domain of automated building inspection [7,8].
Our primary research objective is to develop an advanced defect detection method utilizing deep learning (DL). Specifically, we present an innovative DL-based framework for detecting defects in window frames. This framework combines data augmentation, customized image enhancement techniques, and a detection model designed to enhance the quality of defect detection.
In this context, we operate under the assumption that construction sites often present intricate lighting conditions and suffer from limited data availability. These inherent challenges in uncontrolled environments require a more robust defect detection solution. Our research addresses these assumptions by establishing a new benchmark for quality inspections in construction sites.
2. Related Work
This section provides a comprehensive overview of prior research and methodologies in defect detection, tracking the historical evolution of techniques and highlighting recent advancements.
2.1. Traditional Computer Vision Approaches
Defect detection in construction and manufacturing has been a prominent research focus. Traditional machine vision systems, relying on predefined algorithms, have played a pivotal role in quality control across diverse industries [12].
- Threshold Techniques: Automatic thresholding has been crucial in industries such as glass manufacturing [13,14] and textiles [15]. Dynamic thresholding has found applications in road crack segmentation [16]. The Retinex Algorithm has been used for edge detection [17,18], and innovative approaches like combining morphological processing with genetic algorithms have introduced new dimensions to defect detection strategies [19].
- Edge Detection and Morphological Processing: The Retinex Algorithm has been prominent in edge detection for defect identification. The fusion of morphological processing with genetic algorithms has also introduced innovative dimensions to defect detection strategies.
- Fourier and Texture Analysis: Fourier series is useful in line defect detection [20], while texture analysis proves reliable in labs [18,21,22,23]. Combining impulse/response testing with statistical pattern recognition has helped to detect defects in concrete plates [24].
- Innovative Approaches: Recent innovations, such as impulse/response testing and statistical pattern recognition, have effectively detected defects in concrete plates. However, traditional machine vision systems have limitations in complex, dynamic settings like construction sites, where unpredictable variables like complex lighting challenge their efficacy.
2.2. Challenges in Conventional Machine Vision Methods
Traditional machine vision methods excel in controlled environments but face significant hurdles in complex settings like construction sites. Key challenges include the following:
- Variable Lighting: Fluctuating natural and artificial lighting conditions impact system performance [1,2,3].
- Dynamic Environments: Rapid changes in construction sites challenge machine vision adaptability, reducing accuracy.
- Noise and Interference: Visual noise and electromagnetic interference disrupt defect detection [1].
- Scale and Perspective Variations: Varying object sizes and perspectives require extensive system adjustments.
- Real-Time Demands: Meeting real-time requirements can be challenging for traditional methods.
- Data Annotation: Creating and maintaining labeled datasets is labor-intensive and complex in dynamic environments.
Innovative approaches, including deep learning and adaptive algorithms, are needed to enhance defect detection in construction.
2.3. Machine Learning and Deep Learning-Based Methods
This subsection explores recent advancements in machine learning, particularly deep learning (DL) models, for defect detection. With increased computing power and data availability, DL, particularly convolutional neural networks (CNNs), has gained popularity in quality inspection.
- Supervised object detection supervised defect detection relies on labeled datasets with defect-free and defective samples, resulting in high detection rates. This approach annotates each object with its class label and bounding box coordinates during training. Various datasets are used in supervised learning, including fabric defect datasets [25] and rail defect datasets [26,27].
- Unsupervised object detection unsupervised methods aim to overcome the limitations of supervised learning by leveraging inherent data characteristics for classification. These approaches detect defects and objects in images without using labeled training data. Instead, they rely on patterns, structures, or anomalies in the data to identify objects. Techniques like clustering, anomaly detection, and feature extraction are commonly used for unsupervised defect detection.
- Object detection model current object detection in deep learning falls into two main categories. The first encompasses two-stage object detection models, which include R-CNNs [28], Fast R-CNNs [29], and Faster R-CNNs [30]. For example, U-Net for defect segmentation using synthetic data was used by Boikov et al. [31]. The second category features one-stage models like YOLO [32] and SSD [33].
2.4. Challenges in DL-Based Defect Detection
In the realm of deep learning-based defect detection in construction, formidable challenges persist despite significant advancements in computer vision for monitoring structural health and identifying unsafe behaviors [34]. These challenges encompass a range of issues, including identifying multiple defects or concurrent unsafe behaviors, which remain problematic due to the high noise levels inherent in construction settings. Balancing datasets for deep learning training poses difficulties, particularly when certain defects or behaviors occur infrequently, leading to unbalanced data [35]. Moreover, the scarcity of labeled data, especially for rare defects, hampers the development of robust models. Pursuing real-time performance without compromising accuracy is an ongoing challenge, and the issue of inaccurate or inconsistent labeling adversely affects model precision. Furthermore, the variability in inspection standards hinders integrating deep learning models with human inspectors. At the same time, environmental factors like changing lighting conditions introduce variability in model accuracy in the dynamic construction environment.
2.5. Hybrid Models for Defect Detection
Hybrid models for defect detection represent a compelling approach by integrating image processing techniques (IPTs) and image enhancement techniques (IETs) with machine learning (ML) and deep learning (DL) methodologies. This fusion has demonstrated significant advantages across various domains, including defect identification. This section delves into such hybrid models’ underlying principles and practical applications. One avenue of exploration involves the integration of IPTs with ML techniques, offering a robust framework for defect detection. For instance, combining edge detection algorithms with convolutional neural networks (CNNs) has yielded substantial improvements in tasks like weld segmentation, resulting in enhanced accuracy and efficiency in defect identification processes. Additionally, the domain of deep learning has witnessed a transformative impact on defect detection, particularly through models like CNNs. However, integrating image enhancement techniques can further elevate their performance, making them increasingly applicable in industries such as construction. Techniques like data augmentation, which generates diverse training data, and image enhancement algorithms that enhance image clarity, reduce shadows, and accentuate defects, contribute to fine-tuning DL models for more effective defect identification tasks, ultimately facilitating their integration into real-world applications such as construction [36].
These hybrid models find applications across industries, from manufacturing to construction, demonstrating their ability to handle complex image data and enhance defect identification in challenging settings. However, challenges remain, including parameter optimization and dataset availability. Some recent research used image enhancement and refinement to improve crack segmentation [10,11]. Our research addresses these challenges, focusing on the domain-specific context of cosmetic quality inspection for window frames. We aim to uncover the most effective image enhancement strategies and data augmentation techniques to enhance defect detection systems’ precision, robustness, and real-world applicability.
3. Proposed Method
The demand for robust defect detection becomes paramount in industrial environments marked by unpredictable lighting conditions. Our proposed method is a comprehensive solution that integrates an image quality assessment tool, a sophisticated image enhancement strategy, advanced data augmentation processes, and a deep learning-based defect detection model. The framework of our approach, illustrated in Figure 1, visually represents the various components and their interplay.
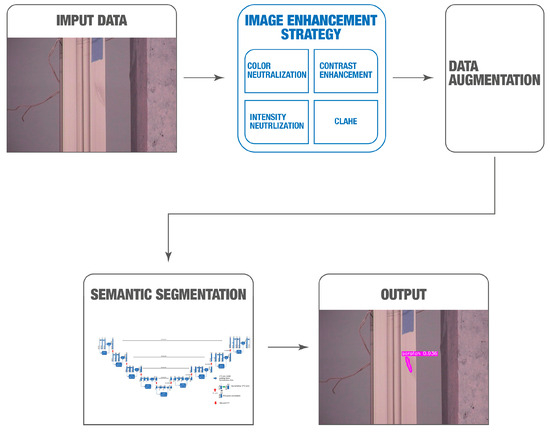
Figure 1.
The framework of the window frame defect detection system (WFDD). The input comprises RGB images captured by the Spot Robot. The data augmentation module employs geometric operations and applies different image enhancement techniques. The preprocessing module is then employed to enhance the performance of the defect detection model. Within the detection module, defects are identified among all detected window frames, with the output showcasing U-Net-generated segmentation blobs.
Our system begins with inputting RGB images captured by the Spot Robot. Subsequently, the data augmentation module comes into play, employing a combination of geometric operations and a range of image enhancement techniques to generate vast enhanced data.
The preprocessing module further enhances the defect detection model’s performance, ensuring optimal results. Finally, within the detection module, defects are identified among all detected window frames, with the output showcasing U-Net-generated segmentation blobs, ultimately providing a comprehensive overview of detected defects within the industrial setting. This holistic approach empowers the system to operate effectively in dynamic and challenging environments, setting new standards for defect detection accuracy and reliability.
3.1. Data Collection
Our dataset consists of 1356 original images sourced from five distinct datasets:
- Cellphone Dataset (441 Images): This dataset comprises color images capturing non-installed window frames both indoors and outdoors (see Figure 2).
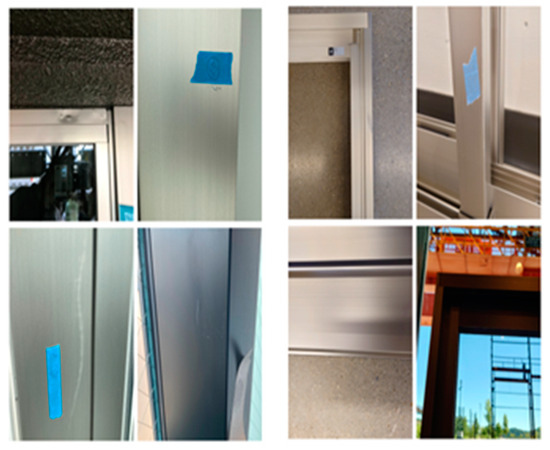 Figure 2. Example from Cellphone Dataset.
 - Construction Site Dataset (235 Images): Captured on a real-world construction site using inspector cellphone cameras, this dataset includes various installed window frame types and diverse conditions (see Figure 3).
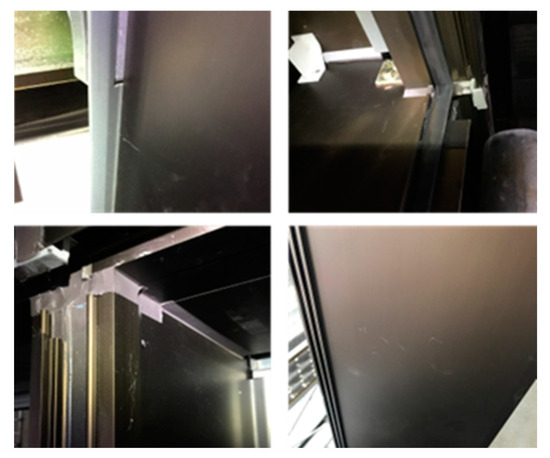 Figure 3. Samples of Construction Site Dataset.
 - Lab-1 Dataset (100 Images): Collected in a controlled lab environment using the Spot Robot’s PTZ camera, this dataset features a range of window frame samples with variations in colors, lighting conditions and angles (see Figure 4).
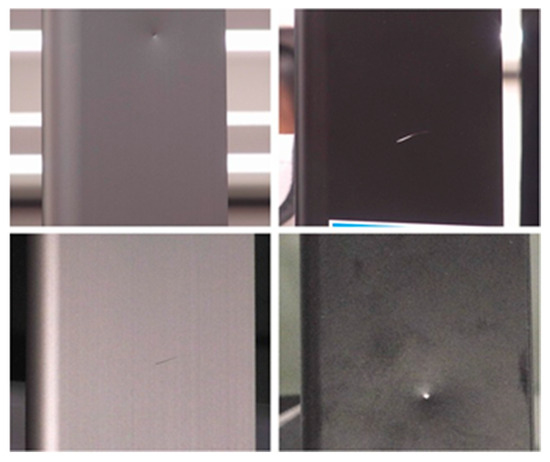 Figure 4. Example from Lab-1 Dataset.
 - Lab-2 Dataset (80 Images): Focused on a single window frame within a cluttered lab setting, this dataset offers images captured at different zoom levels (see Figure 5).
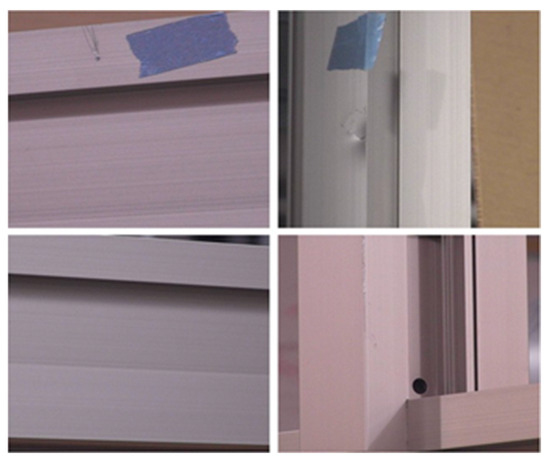 Figure 5. Example from Lab-2 Dataset.
 - Demo Site Dataset (500 Images): Captured at a construction site using the Spot Robot, this dataset encompasses multiple window frame types and a variety of lighting conditions (see Figure 6).
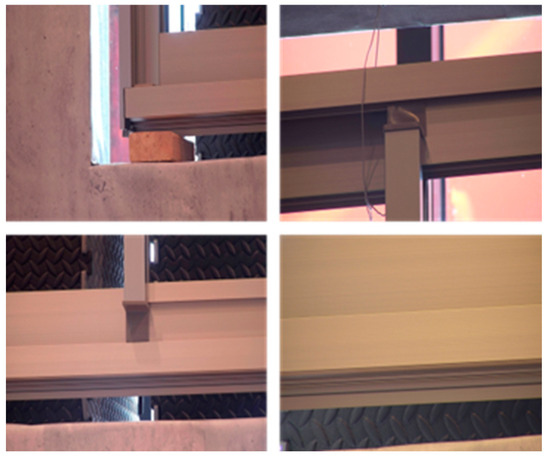 Figure 6. Samples of Demo Site Dataset.
3.2. Data Labeling
Our data labeling process was meticulously designed to accurately identify defects within the images. The manual labeling of images was conducted using the Roboflow Platform [37]. Examples of labeled defects, including dents and scratches, are visually depicted in Figure 5 and Figure 6.
The labeling process is visualized in Figure 7. Following the meticulous labeling procedure, images were stored in COCO format at a resolution of 500 × 500 pixels. This curated labeled image dataset was an invaluable reference standard for our defect detection methodology.
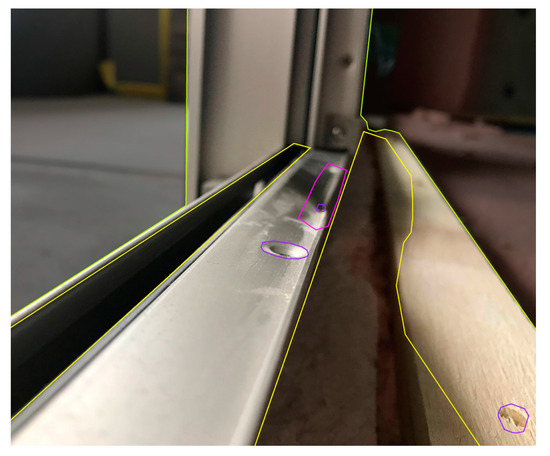
Figure 7.
Example of labeling.
3.3. Geometric Data Augmentation
In the first stage, we leveraged geometric data augmentation techniques to enhance dataset diversity and size. This process involved applying three geometric transformations: anti-clockwise rotation, clockwise rotation, and horizontal flipping. By incorporating these transformations, we expanded our dataset threefold, enriching the variety of samples available for training and validation.
3.4. Image Enhancement Techniques (IETs)
Our defect detection methodology incorporates a range of image enhancement techniques (IETs) carefully selected to enhance the quality of input images before input into the segmentation network. These techniques are pivotal in accentuating object details, reducing noise, and optimizing overall image quality, thus facilitating more precise detection. Below is an overview of the IETs employed in our approach:
- Shadow Removal (SR): To address shadow removal, we adopted the pre-trained dual hierarchical aggregation network (DHAN) developed by Cun et al. [38], which is based on VGG16 with the context aggregation network (CAN). This approach effectively mitigates shadows, a common challenge in image quality.
- Color Neutralization (CN): CN plays a crucial role in ensuring a consistent foundation for subsequent processing by harmonizing color variations across images, promoting uniformity.
- Contrast Enhancement (CE): CE significantly enhances image clarity, making even subtle defects more discernible. This enhancement aids in the accurate identification of defects.
- Intensity Level Neutralization (IN): IN standardizes intensity levels across the dataset, reducing disparities that could otherwise affect the analysis. This step contributes to data consistency.
- CLAHE (Contrast-Limited Adaptive Histogram Equalization): CLAHE, a localized contrast enhancement technique, enhances small-scale details while preserving overall image contrast. It improves the visibility of fine details without oversaturating the image.
The choice of these five image enhancement techniques and our data augmentation strategy was informed by extensive experimentation, explained in Section 4. We rigorously assessed various combinations of techniques to ensure they collectively enhanced image quality without introducing noise or misleading information. This careful selection process ensures the reliability and effectiveness of our approach in the context of defect detection.
3.4.1. Shadow Removal (SR) Process
Harnessing the capabilities of the pre-trained dual hierarchical aggregation network (DHAN) proposed by Cun et al. [38], we adeptly addressed the challenge of shadow removal. The DHAN network, underpinned by the esteemed VGG16 architecture—a convolutional neural network archetype—employs the context aggregation network (CAN) for encoding.
The DHAN network pinpoints and eliminates shadows from the imagery by orchestrating dilation convolutions and leveraging hierarchical aggregation of multi-contextual features. With weights furnished by the original authors, our application of the network inference method effectively expunged shadows from the entire dataset, as elucidated in Figure 8.
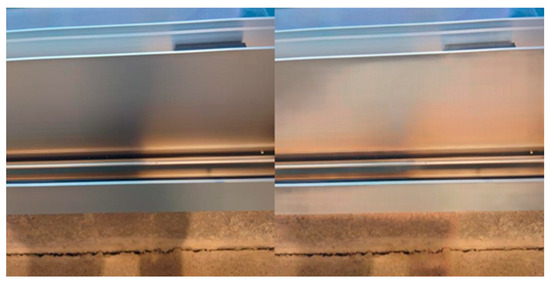
Figure 8.
Comparative sample using the shadow removal technique.
3.4.2. Color Neutralization (CN)
It was imperative to refine the color definition within the dataset. Our approach pivoted on the Von Kries chromatic adaptation transformation [39], a robust chromatic adaptation methodology. This technique seamlessly transitions from source to target colors within the LMS (long, medium, short) color spectrum. By adapting the RGB illuminant color of dataset samples to varied illuminates, it preserves the pristine white color. This equates to enhanced color consistency and bolsters feature extraction, as illustrated in Figure 9.
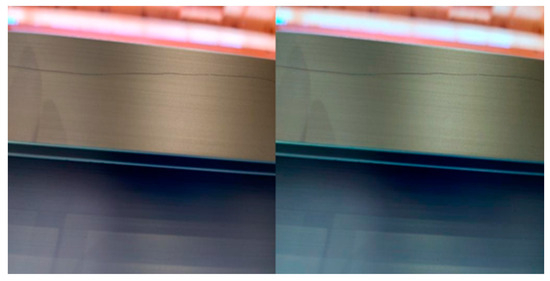
Figure 9.
Comparative sample using the color neutralization technique.
3.4.3. Contrast Enhancement (CE)
Our image processing strategy concluded with a pivotal step—contrast enhancement. By transmuting dataset samples into RGB channels, we embraced a histogram equalization approach [40]. This technique magnifies the visual fidelity of the image, making defect spotting significantly more intuitive. The overall image contrast is augmented by streamlining the histogram, translating it to an enriched feature representation, and consequently enhancing it in the deep-learning phase, as showcased in Figure 10.
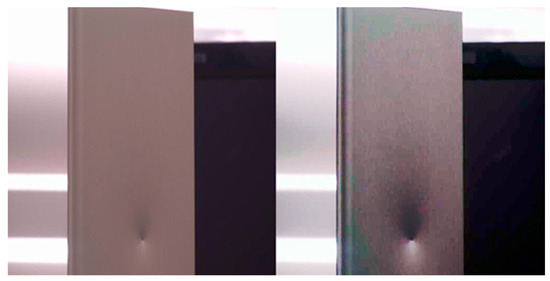
Figure 10.
Comparative sample using the contrast enhancement technique.
3.4.4. Intensity Level Neutralization (IN)
The multi-scale Retinex (MSR) algorithm was brought to refine the intensity channel. The outcome colors were fine-tuned such that the chromaticity mirrored the original snapshot. This meticulous filtration aids in preserving relative lightness, ensuring a harmonized image intensity without any distortion to chromaticity and color composition.
Land and Maccan’s research [41] laid the groundwork for this approach. They postulated that the visual cortex discerns relative, not absolute, lightness—nuances in localized image segments.
Our adherence to this philosophy culminated in negating intensity variations that might otherwise hamper feature extraction and image data processing, as captured in Figure 11.
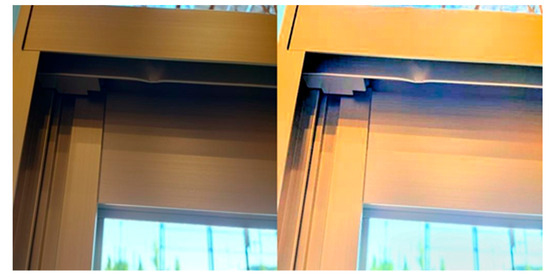
Figure 11.
Comparative sample using the intensity neutralization technique.
3.4.5. Contrast-Limited Adaptive Histogram Equalization or CLAHE (CLAHE)
CLAHE plays a pivotal role in our novel strategy, enhancing image contrast by equalizing the histogram for each contextual region or tile in an image. This technique effectively limits histogram amplification via clipping at a predefined limit. The crucial steps of the CLAHE algorithm are as follows:
- Divide the input image into non-overlapping tiles of size m × n, resulting in M × N tiles.
- Perform histogram equalization on each tile, using the probability density function (PDF) and cumulative distribution function (CDF) to distribute pixel intensities effectively.
- Apply contrast limiting by clipping the histogram at a predefined limit, CL, to prevent excessive amplification.
- Conduct bilinear interpolation to eliminate artificial boundaries between tiles, resulting in a smoothly enhanced output image.
Our study applied the contrast-limited adaptive histogram equalization (CLAHE) method to the luminance (L) channel within the lab color space. Results are shown in Figure 12.
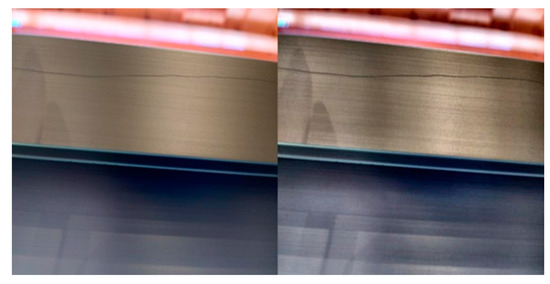
Figure 12.
Comparative sample using the CLAHE technique.
3.5. IE-Enhanced Data Augmentation
We implemented an advanced data augmentation process involving an IE-enhanced augmentation. For the second stage of data augmentation, we harnessed the power of 40 IE combinations, including the ‘Normal’ dataset and results from five image enhancement techniques (IETs) where the order of application was irrelevant. This comprehensive approach created 40 distinct datasets, each representing a unique IE combination. These augmented datasets played a vital role in training our model, enabling it to learn from various enhanced variations, ultimately enhancing its defect detection capabilities. Notably, this 40 included the 4! (4 factorial) combinations from the five IEs, and 16 additional datasets were created by inserting CLAHE into the best-performing ones.
3.6. Defect Detection Model
Our defect detection model is a culmination of data augmentation and image enhancement techniques strategies, meticulously designed to enhance its performance. The model leverages a U-Net neural network architecture to segment defects within the input images effectively. A detailed breakdown of our defect detection process is described as follows:
- Data Preprocessing: Following data augmentation and IPT application, we preprocess the images to prepare them for defect detection. These preprocessed images, post-IPT, were resized to a standardized 500 × 500 pixel format.
- Ground Truth-Guided Learning: During the training phase, our U-Net neural network relied on ground truth masks. These masks serve as invaluable references, guiding the network to detect defects with exceptional precision.
- Intersection of Classes: Our defect detection is specifically tailored to identify defects within window frames. We utilize the concept of the intersection of classes, ensuring that our results exclusively represent defects inside the window frames.
- Neural Network Architecture: Our neural network architecture is a fusion of two powerful components: ResNet152 and U-Net. We employ transfer learning to harness the feature extraction capabilities of ResNet152. Its encoder is utilized, with the last layer discarded and then integrated with a decoder. This fusion results in an expansive feature map that excels in defect localization.
- Semantic Segmentation Model: The architecture of our deep learning-based semantic segmentation model. This model combines the robustness of ResNet152 with the precision of U-Net, providing an ideal balance between feature extraction and localization.
Integrating U-Net with the feature-rich ResNet152 encoder enhances the model’s ability to accurately detect defects within window frames, making it a formidable tool for defect detection in industrial environments.
4. Experiments and Results
In this section, we delve into the practical aspects of our experiments, which aimed to optimize defect detection in window frames through the strategic deployment of image enhancement techniques (IETs). Our objective was to evaluate the performance enhancements achieved by these strategies, comparing them against a baseline machine learning (ML) model. To quantitatively assess the efficacy of our approach, we employed two key metrics: the F1-score and IoU (intersection over union). The F1 score provides a balanced measure of precision and recall, allowing us to gauge the accuracy of our defect detection model. Additionally, IoU quantifies the overlap between predicted and ground truth defect regions, offering insights into the model’s localization precision. Together, these metrics enable us to comprehensively evaluate and present the results of our defect detection system.
4.1. Data Collection
To assess the efficacy of our IET-enhanced deep learning-based defect detection model, we utilized the Spot Robot using Boston Dynamics in our experiments. This robotic platform allowed us to capture high-resolution images of window frames under various lighting conditions, enabling a comprehensive examination of defect detection in complex real-world environments.
4.2. Experimental Setup
At the heart of our defect detection model lies the integration of image enhancement techniques (IETs). Informed by insights from our experiments, we devised four distinct methods and their synergistic combinations tailored for robust industrial-scale deployment. These strategies draw from our findings in Experiments 1 and 2, wherein specialized techniques and IET-based data augmentation played pivotal roles in improving the defect detection accuracy.
4.3. Experiment 1: Integration of Image Enhancement Techniques
This experiment enhanced defect detection accuracy by optimizing our preprocessing pipeline’s sequence of image enhancement techniques (IETs). We evaluated IETs individually and in various combinations.

Table 1.
Comparison of F1 scores for bend, dent, and scratch detection.
Table 2.
Comparison of IoU scores for bend, dent, and scratch detection.
4.3.1. Experiment 1 Results
In our pursuit of elucidating the factors behind our results, particularly concerning performance disparities across different defect detection categories, we comprehensively explored over 40 image enhancement (IE) combinations. The derivation of this extensive set of combinations involved a meticulous examination of 24 permutations of the 4 enhancement techniques, each applied in varying orders—a total of 24 of the 4 factorials. Additionally, we introduced the “CLAHE” (contrast-limited adaptive histogram equalization) enhancement technique to the best 16 combinations, further enriching our analysis.
We present the top 10 image enhancement (IE) combinations for each defect out of the over 40 combinations tested.
Bend Detection Results
Table 3 shows the top 10 IE combinations with the highest F1 scores for bend detection.
Table 3.
Bend F1 scores for IE combinations.
Dent Detection Results
Table 4 presents the top 10 IE combinations with the highest F1 scores for dent detection.
Table 4.
Dent F1 scores for IE combinations.
Scratch Detection Results
Table 5 displays the top 10 IE combinations with the highest F1 scores for scratch detection.
Table 5.
Scratch F1 scores for IE combinations.
4.3.2. Experiment 1 Insights
This thorough exploration allowed us to systematically evaluate a broad spectrum of enhancement strategies and their influence on defect detection performance. From this exhaustive analysis, the following key insights emerged:
- IE Strategy Effectiveness: The most notable discovery revolves around the substantial enhancements observed in F1 and IoU scores across all defect categories (bend, dent, and scratch) when implementing the ‘Best IE Strategy’. The improvement in dent detection is particularly striking, showcasing a remarkable 9.92% increase in the F1 score and an impressive 10.70% surge in the IoU score. This underscores the pivotal role of tailored image enhancement strategies in effectively addressing specific defect characteristics, particularly those highly susceptible to lighting conditions, as exemplified by the dent defects.
- Overall Improvement: On average, our model featuring the “Best IE Strategy” consistently outperformed the baseline U-Net model, achieving a noteworthy 7.67% improvement in F1 scores and an impressive 8.60% enhancement in IoU scores. This serves as compelling evidence for the efficacy of integrating IE techniques into the defect detection pipeline.
- Performance Variability: It is crucial to acknowledge that the magnitude of improvement varied across defect categories. This variability emphasizes the need for adaptable defect detection systems capable of accommodating the diverse characteristics and challenges associated with different defect types.
- Enhancement Strategies: A consistent trend emerges in our findings, revealing that the combination of image enhancement techniques consistently enhances F1 scores and precision. This underscores the intrinsic value of systematic experimentation in optimizing image enhancement for defect detection.
- CLAHE Success: The “CLAHE” technique consistently played a pivotal role in enhancing F1 scores and precision across various defect categories. This reaffirms its significance in improving detection accuracy and highlights its effectiveness.
- Trade-offs and Context: It is essential to strike a balance between accuracy and localization precision, as certain enhancements may influence IoU values differently. This trade-off consideration underscores the need for a nuanced approach in selecting and fine-tuning enhancement techniques based on specific detection requirements.
- Fine-tuning Opportunities: The results underscore the potential for further customization by exploring enhancement combinations and adjustments to model architectures. This fine-tuning process holds the key to optimizing defect detection systems for specific application contexts.
In summary, our meticulous exploration of over 40 IE combinations, driven by 24 permutations of the 4 enhancement techniques and incorporating “CLAHE” into the best 16 combinations, provides a robust foundation for understanding the intricate relationship between image enhancement strategies and defect detection performance. These findings offer valuable insights into the dynamic interplay of enhancement techniques in optimizing the accuracy and precision across diverse defect categories.
4.4. Experiment 2: IE-Data Augmentation and Results
In Experiment 2, we investigated the impact of IE (image enhancement) as a data augmentation technique on object detection performance across various categories, including bend, dent, and scratch. IE-based data augmentation involves enhancing the quality and features of input images before applying object detection algorithms.
4.4.1. Experiment 2 Results
This subsection discusses the findings and insights gained from this experiment. These results are visualized in Table 6 and Table 7.
Table 6.
Comparison of F1 scores for bend, dent, and scratch detection in Experiment 2.
Table 7.
Comparison of IoU scores for bend, dent, and scratch detection in Experiment 2.
We exhaustively explored 30 IE combinations to identify the most effective strategies. The outcomes of the top 10 IE combinations are presented in Table 8, Table 9 and Table 10. Our approach resulted in over 30 combinations tested, as we initially generated 24 combinations using the permutations of 4 enhancement techniques (4 factorial) and subsequently inserted CLAHE into the 6 best-performing combinations. This approach ensured a thorough evaluation of enhancement strategies, considering their individual and collective impact on defect detection performance. Table 8 presents the top 10 combinations of Image Enhancement (IE) techniques that yield the highest F1 scores for detecting bends. Similarly, Table 9 continues this analysis, showcasing the top 10 IE combinations with the highest F1 scores specifically for scratch detection. Meanwhile, Table 10 focuses on the top 10 IE combinations that have achieved the best F1 scores for detecting dents.
Table 8.
Top 10 image enhancement combinations for bend defect.
Table 9.
Top 10 image enhancement combinations for the scratch defect.
Table 10.
Top 10 image enhancement combinations for the dent defect.
4.4.2. Experiment 2 Insights
Experiment 2 introduced a distinct dimension to our exploration by employing image enhancement (IE) techniques not only to enhance the quality of the existing data but also to create new data samples through augmentation. This innovative approach provided valuable insights into the interplay between IE techniques and defect detection performance, particularly in the context of industrial applications.
- Impact of Image Enhancement Techniques: We assessed the influence of individual image enhancement techniques (e.g., CE, IN, CN, SR, and CLAHE) on object detection accuracy. These techniques exhibited varying effects on IoU scores, highlighting trade-offs between localization accuracy and detection precision.
- Combination Strategies: Combinations of enhancement techniques, such as “CN + CE” and “SR + IN”, were explored to evaluate their impact on detection performance. Different combinations produced diverse outcomes, emphasizing the complexity of selecting the right strategy.
- CLAHE Effectiveness: CLAHE consistently improved IoU values across multiple detection categories, underscoring its importance in enhancing accuracy and precision.
- Comprehensive Combinations: Comprehensive combinations like “SR + CN + IN + CE + CLAHE” were investigated to identify strategies with strong overall performance regarding IoU scores, but their complexity warrants careful evaluation.
- Balancing Trade-offs: IE-based data augmentation involves balancing improved IoU scores and detection accuracies. Some techniques may favor one aspect, requiring thoughtful adaptations to specific detection needs.
- Comparison of F1 and IoU Scores: We compared F1 and IoU scores for bend, dent, and scratch detection under “Normal” and “Best IE” strategies. Our strategy consistently improved both scores, enhancing detection accuracy.
In summary, IE-based data augmentation significantly enhances object detection accuracy and precision. The enhancement techniques and combinations should align with the specific detection goals and trade-offs that are set. Experiment 2 highlights the importance of IE-based data augmentation and its potential to improve object detection performance substantially.
4.5. Experiment 1 vs. Experiment 2: A Comparison
4.5.1. Experiment 1 Insights
- Category-Specific Improvement: Experiment 1 showed significant F1 score improvements for bend (5.70%), dent (9.92%), and scratch (8.11%) detection, highlighting the importance of tailored enhancement strategies.
- IoU Improvement: IoU scores were improved, with bend IoU and dent IoU increasing by 6.49% and 10.70%, respectively, and scratch IoU improving by 9.60%.
- Model Architecture Impact: Our model consistently outperformed U-Net, emphasizing the role of the model’s architecture.
4.5.2. Experiment 2 Insights
- IE-Based Data Augmentation: Experiment 2 introduced IE-based data augmentation, resulting in substantial F1 and IoU score improvements across all defect categories. Notably, the scratch detection F1 score improved by 9.82%.
- Category-Specific Improvement: Category specific enhancement, with bend F1 and dent F1 scores showing notable increases (11.65% and 0.83%, respectively).
- IoU Improvement: IoU scores were improved, with bend IoU and dent IoU increasing by 12.33% and 1.13%, respectively, and scratch IoU showing a remarkable 31.84% improvement.
- Overall Model Performance: Our model enhanced with IE-based data augmentation outperformed the baseline U-Net model, with a 7.43% improvement in the F1 score and a substantial 15.10% improvement in IoU scores.
4.5.3. Comparative Insights
Both experiments emphasize the importance of tailored strategies and model architecture choices in defect detection. Experiment 2’s IE-based data augmentation approach demonstrated superior results, particularly in improving IoU scores, making it a promising avenue for enhancing defect detection accuracy in complex environments. The insights from both experiments contribute to the understanding of how image enhancement techniques can be seamlessly integrated into deep learning architectures for defect detection.
5. Discussion
Our extensive experiments have underscored the significant impact of image enhancement (IE) techniques on enhancing defect detection accuracy and offered crucial insights for their application in industrial contexts. Our findings’ implications extend to industrial quality control, where precise defect identification is paramount.
In Experiment 1, we unequivocally demonstrated the effectiveness of tailored enhancement strategies. These strategies led to substantial improvements in both F1 and IoU scores across all defect categories. The marked enhancement in dent detection, with a notable 9.92% increase in the F1 score and a 10.70% surge in the IoU score, emphasizes the value of personalized enhancement techniques. These findings underscore the importance of making informed choices when selecting enhancement methods, thereby optimizing defect detection accuracy.
Building on the insights from Experiment 1, Experiment 2 introduced an innovative concept—IE-based data augmentation. This novel approach further elevated detection performance, particularly in improving IoU scores. The implications of this experiment are profound, as they suggest a promising avenue for substantially enhancing defect detection accuracy in complex industrial environments. In industrial settings where precise localization of defects is critical, the improved IoU scores offer a compelling advantage.
The practical implications of these insights for industrial applications are significant. Our research highlights the transformative potential of seamlessly integrating IE techniques into deep learning architectures for defect detection. By doing so, we not only enhance the accuracy of defect detection but also open valuable opportunities for fine-tuning and optimizing industrial quality control processes. Our findings offer a path to more reliable and effective quality control in the industrial sector, where even minor defects can compromise product quality, reputation, and safety. The ability to detect defects accurately, particularly in challenging environments with varying lighting conditions and defect types, is essential for ensuring product excellence and safety.
In conclusion, our experiments provide valuable guidance for implementing IE techniques in industrial defect detection, showcasing their potential to revolutionize the field. These insights promise to enhance the accuracy and efficiency of quality control processes, ultimately benefiting industrial applications and contributing to improved product quality and safety.
6. Conclusions
In conclusion, our study has illuminated a path of profound significance in industrial defect detection by integrating image enhancement (IE) techniques with deep learning. Our research is not just a scientific endeavor; it is a practical solution that holds transformative implications for industries relying on precise defect identification in challenging operational environments.
Across two comprehensive experiments, we have emphasized the critical importance of customization, underlining the necessity of tailoring enhancement strategies to specific defect categories. Furthermore, we have highlighted the pivotal role played by the selection of model architecture, showcasing how it can influence the accuracy and precision of defect detection. Experiment 2, introducing IE-based data augmentation, has emerged as an innovative development. It has yielded remarkable improvements in F1 and IoU scores, offering a novel method for enhancing detection accuracy in complex industrial settings. This innovative approach unlocks the potential for industries to significantly elevate their product quality and bolster their production efficiency by ensuring precise defect detection.
Our research is not confined to theoretical insights; it provides practical solutions for real-world challenges. We have demonstrated that industries can achieve more accurate and reliable defect detection with the right combination of enhancement techniques and thoughtful adaptations. As computer vision continues to evolve, our findings offer a clear roadmap for implementing advanced defect detection systems, ultimately enhancing product quality, safety, and operational efficiency within industrial settings. There are numerous avenues for future research, including expanding datasets to encompass a broader range of defect types and operational conditions, exploring adaptive strategies for automatic technique selection, and integrating our enhanced defect detection approach into real-time industrial quality inspection using mobile robots.
In summary, our research signifies a pivotal moment in the domain of image enhancement techniques for industrial defect detection. It provides practical solutions and novel insights that empower industries to embrace cutting-edge technology, ensuring product excellence, reputation protection, and efficient production processes. Our journey has just begun, and we look forward to further advancing the field and driving excellence in industrial quality control.
Author Contributions
Methodology, J.V. and T.F.; investigation, J.V.; data curation, J.V.; writing—original draft preparation, J.V.; writing—review and editing, J.V.; supervision, T.F. and K.S.; project administration, K.S.; funding acquisition, K.S. All authors have read and agreed to the published version of the manuscript.
Funding
This research received no external funding.
Data Availability Statement
We published our data publicly at https://github.com/jvasqueza/Inspection (accessed on 1 November 2023).
Conflicts of Interest
The authors declare no conflict of interest.
References
- Silva, W.R.; Lucena, D.S. Concrete Cracks Detection Based on Deep Learning Image Classification. Proceedings 2018, 2, 489. [Google Scholar] [CrossRef]
- Dung, C.V.; Anh, L.D. Autonomous concrete crack detection using deep fully convolutional neural network. Autom. Constr. 2019, 99, 52–58. [Google Scholar] [CrossRef]
- Garcia, J.; Villavicencio, G.; Altamirano, F.; Crawford, B.; Soto, R.; Minatogawa, V.; Franco, M.; Martínez-Muñoz, D.; Yepes, V. Machine learning techniques applied to construction: A hybrid bibliometric analysis of advances and future directions. Autom. Constr. 2022, 142, 104532. [Google Scholar] [CrossRef]
- Zhao, Z.Q.; Zheng, P.; Xu, S.T.; Wu, X. Object Detection with Deep Learning: A Review. IEEE Trans. Neural Netw. Learn. Syst. 2019, 30, 3212–3232. [Google Scholar] [CrossRef] [PubMed]
- Bang, H.; Min, J.; Jeon, H. Deep learning-based concrete surface damage monitoring method using structured lights and depth camera. Sensors 2021, 21, 2759. [Google Scholar] [CrossRef]
- Yang, J.; Li, S.; Wang, Z.; Dong, H.; Wang, J.; Tang, S. Using deep learning to detect defects in manufacturing: A comprehensive survey and current challenges. Materials 2020, 13, 5755. [Google Scholar] [CrossRef]
- Wang, J.; Perez, L. The Effectiveness of Data Augmentation in Image Classification using Deep Learning. arXiv 2017, arXiv:1712.04621. Available online: https://arxiv.org/abs/1712.04621 (accessed on 1 November 2023).
- Saberironaghi, A.; Ren, J.; El-Gindy, M. Defect Detection Methods for Industrial Products Using Deep Learning Techniques: A Review. Algorithms 2023, 16, 95. [Google Scholar] [CrossRef]
- Shorten, C.; Khoshgoftaar, T.M. A survey on Image Data Augmentation for Deep Learning. J. Big Data 2019, 6, 60. [Google Scholar] [CrossRef]
- Wu, Z.; Tang, Y.; Hong, B.; Liang, B.; Liu, Y. Enhanced Precision in Dam Crack Width Measurement: Leveraging Advanced Lightweight Network Identification for Pixel-Level Accuracy. Int. J. Intell. Syst. 2023, 2023, 9940881. [Google Scholar] [CrossRef]
- Tang, Y.; Huang, Z.; Chen, Z.; Chen, M.; Zhou, H.; Zhang, H.; Sun, J. Novel visual crack width measurement based on backbone double-scale features for improved detection automation. Eng. Struct. 2023, 274, 115158. [Google Scholar] [CrossRef]
- Einizinab, S.; Khoshelham, K.; Winter, S.; Christopher, P.; Fang, Y.; Windholz, E.; Radanovic, M.; Hu, S. Enabling technologies for remote and virtual inspection of building work. Autom. Constr. 2023, 156, 105096. [Google Scholar] [CrossRef]
- Ng, H.F. Automatic thresholding for defect detection. Pattern Recognit. Lett. 2006, 27, 1644–1649. [Google Scholar] [CrossRef]
- Bandyopadhyay, Y. Glass Defect Detection and Sorting Using Computational Image Processing. Int. J. Emerg. Technol. Innov. Res. 2015, 2, 73–75. [Google Scholar]
- Wakaf, Z.; Jalab, H.A. Defect detection based on extreme edge of defective region histogram. J. King Saud. Univ. Comput. Inf. Sci. 2018, 30, 33–40. [Google Scholar] [CrossRef]
- Oliveira, H.; Correia, P.L. Automatic road crack segmentation using entropy and image dynamic thresholding. In Proceedings of the European Signal Processing Conference (EUSIPCO), Glasgow, UK, 24–28 August 2009. [Google Scholar]
- Pan, Y.; Lu, Y.; Dong, S.; Zhao, Z.; Zhao, Z. Defect detection based on edge detection and connected region filtering algorithm. In Proceedings of the 2019 International Conference on Communications, Information System, and Computer Engineering, (CISCE), Haikou, China, 5–7 July 2019. [Google Scholar]
- Zhao, H.; Qin, G.; Wang, X. Improvement of canny algorithm based on pavement edge detection. In Proceedings of the 3rd International Congress on Image and Signal Processing (CISP), Yantai, China, 16–18 October 2010. [Google Scholar]
- Zheng, H.; Kong, L.X.; Nahavandi, S. Automated visual inspection of metallic surface defects using genetic algorithms. J. Mater. Process Technol. 2002, 125–126, 427–433. [Google Scholar] [CrossRef]
- Altantsetseg, E.; Muraki, Y.; Matsuyama, K.; Konno, K. Feature line extraction from unorganized noisy point clouds using truncated Fourier series. Vis. Comput. 2013, 29, 617–626. [Google Scholar] [CrossRef]
- Hocenski, Z.; Vasilic, S.; Hocenski, V. Improved Canny Edge Detector in Ceramic Tiles Defect Detection. In Proceedings of the 32nd Annual Conference on IEEE Industrial Electronics (IECON), Paris, France, 6–10 November 2006. [Google Scholar]
- Shi, T.; Kong, J.Y.; Wang, X.D.; Liu, Z.; Zheng, G. Improved Sobel algorithm for defect detection of rail surfaces with enhanced efficiency and accuracy. J. Cent. South. Univ. 2016, 23, 2867–2875. [Google Scholar] [CrossRef]
- Fleyeh, H.; Roch, J. Benchmark Evaluation of HOG Descriptors as Features for Classification of Traffic Signs; Högskolan Dalarna: Borlänge, Sweden, 2013. [Google Scholar]
- Sajid, S.; Taras, A.; Chouinard, L. Defect detection in concrete plates with impulse-response test and statistical pattern recognition. Mech. Syst. Signal Process. 2021, 161, 107948. [Google Scholar] [CrossRef]
- Silvestre-Blanes, J.; Albero-Albero, T.; Miralles, I.; Pérez-Llorens, R.; Moreno, J. A Public Fabric Database for Defect Detection Methods and Results. Autex Res. J. 2019, 19, 363–374. [Google Scholar] [CrossRef]
- Gan, J.; Li, Q.; Wang, J.; Yu, H. A Hierarchical Extractor- Based Visual Rail Surface Inspection System. IEEE Sens. J. 2017, 17, 7935–7944. [Google Scholar] [CrossRef]
- Shim, S.; Kim, J.; Lee, S.W.; Cho, G.C. Road surface damage detection based on hierarchical architecture using lightweight auto-encoder network. Autom. Constr. 2021, 130, 103833. [Google Scholar] [CrossRef]
- Girshick, R.; Donahue, J.; Darrell, T.; Malik, J. Rich feature hierarchies for accurate object detection and semantic segmentation. In Proceedings of the IEEE Conference on Computer Vision and Pattern Recognition (CVPR), Columbus, OH, USA, 23–28 June 2014. [Google Scholar]
- Girshick, R. Fast R-CNN. In Proceedings of the IEEE International Conference on Computer Vision (ICCV), Santiago, Chile, 7–13 December 2015. [Google Scholar]
- Ren, S.; He, K.; Girshick, R.; Sun, J. Faster R-CNN: Towards Real-Time Object Detection with Region Proposal Networks. In Proceedings of the Advances in Neural Information Processing Systems (NIPS), Montreal, QC, Canada, 7–12 December 2015. [Google Scholar]
- Boikov, A.; Payor, V.; Savelev, R.; Kolesnikov, A. Synthetic data generation for steel defect detection and classification using deep learning. Symmetry 2021, 13, 1176. [Google Scholar] [CrossRef]
- Redmon, J.; Divvala, S.; Girshick, R.; Farhadi, A. You Only Look Once: Unified, Real-Time Object Detection. In Proceedings of the IEEE Conference on Computer Vision and Pattern Recognition (CVPR), Las Vegas, NV, USA, 27–30 June 2016. [Google Scholar]
- Liu, W.; Anguelov, D.; Erhan, D.; Szegedy, C.; Reed, S.; Fu, C.Y.; Berg, A.C. SSD: Single Shot MultiBox Detector. In Proceedings of the European Conference on Computer Vision (ECCV), Amsterdam, The Netherlands, 11–14 October 2016. [Google Scholar]
- Liu, J.; Luo, H.; Liu, H. Deep learning-based data analytics for safety in construction. Autom. Constr. 2022, 140, 104302. [Google Scholar] [CrossRef]
- Panella, F.; Lipani, A.; Boehm, J. Semantic segmentation of cracks: Data challenges and architecture. Autom. Constr. 2022, 135, 104110. [Google Scholar] [CrossRef]
- Panella, F.; Boehm, J.; Loo, Y.; Kaushik, A.; Gonzalez, D. Deep learning and image processing for automated crack detection and defect measurement in underground structures. Int. Arch. Photogramm. Remote Sens. Spatial Inf. Sci. 2018, 42, 829–835. [Google Scholar] [CrossRef]
- Lin, Q.; Ye, G.; Wang, J.; Liu, H. RoboFlow: A Data-centric Workflow Management System for Developing AI- enhanced Robots. In Proceedings of the 5th Conference on Robot Learning, London, UK, 8–11 November 2022. [Google Scholar]
- Cun, X.; Pun, C.M.; Shi, C. Towards Ghost-free Shadow Removal via Dual Hierarchical Aggregation Network and Shadow Matting GAN. In Proceedings of the AAAI Conference on Artificial Intelligence, New York, NY, USA, 7–12 February 2020. [Google Scholar]
- Lecca, M.; Messelodi, S. Computing von Kries Illuminant Changes by Piecewise Inversion of Cumulative Color Histograms. ELCVIA Electron. Lett. Comput. Vis. Image Anal. 2009, 8, 1–17. [Google Scholar] [CrossRef]
- Mustafa, W.A.; Kader, M.M. A Review of Histogram Equalization Techniques in Image Enhancement Application. J. Phys. Conf. Ser. 2018, 1019, 012026. [Google Scholar] [CrossRef]
- Land, E.H.; Mccann, J.J. Lightness and Retinex Theory. J. Opt. Soc. Am. 1971, 61, 1–11. [Google Scholar] [CrossRef]
Disclaimer/Publisher’s Note: The statements, opinions and data contained in all publications are solely those of the individual author(s) and contributor(s) and not of MDPI and/or the editor(s). MDPI and/or the editor(s) disclaim responsibility for any injury to people or property resulting from any ideas, methods, instructions or products referred to in the content. |
© 2023 by the authors. Licensee MDPI, Basel, Switzerland. This article is an open access article distributed under the terms and conditions of the Creative Commons Attribution (CC BY) license (https://creativecommons.org/licenses/by/4.0/).