
Multi-Zone Infection Risk Assessment Model of Airborne Virus Transmission on a Cruise Ship Using CONTAM

Abstract
:1. Introduction
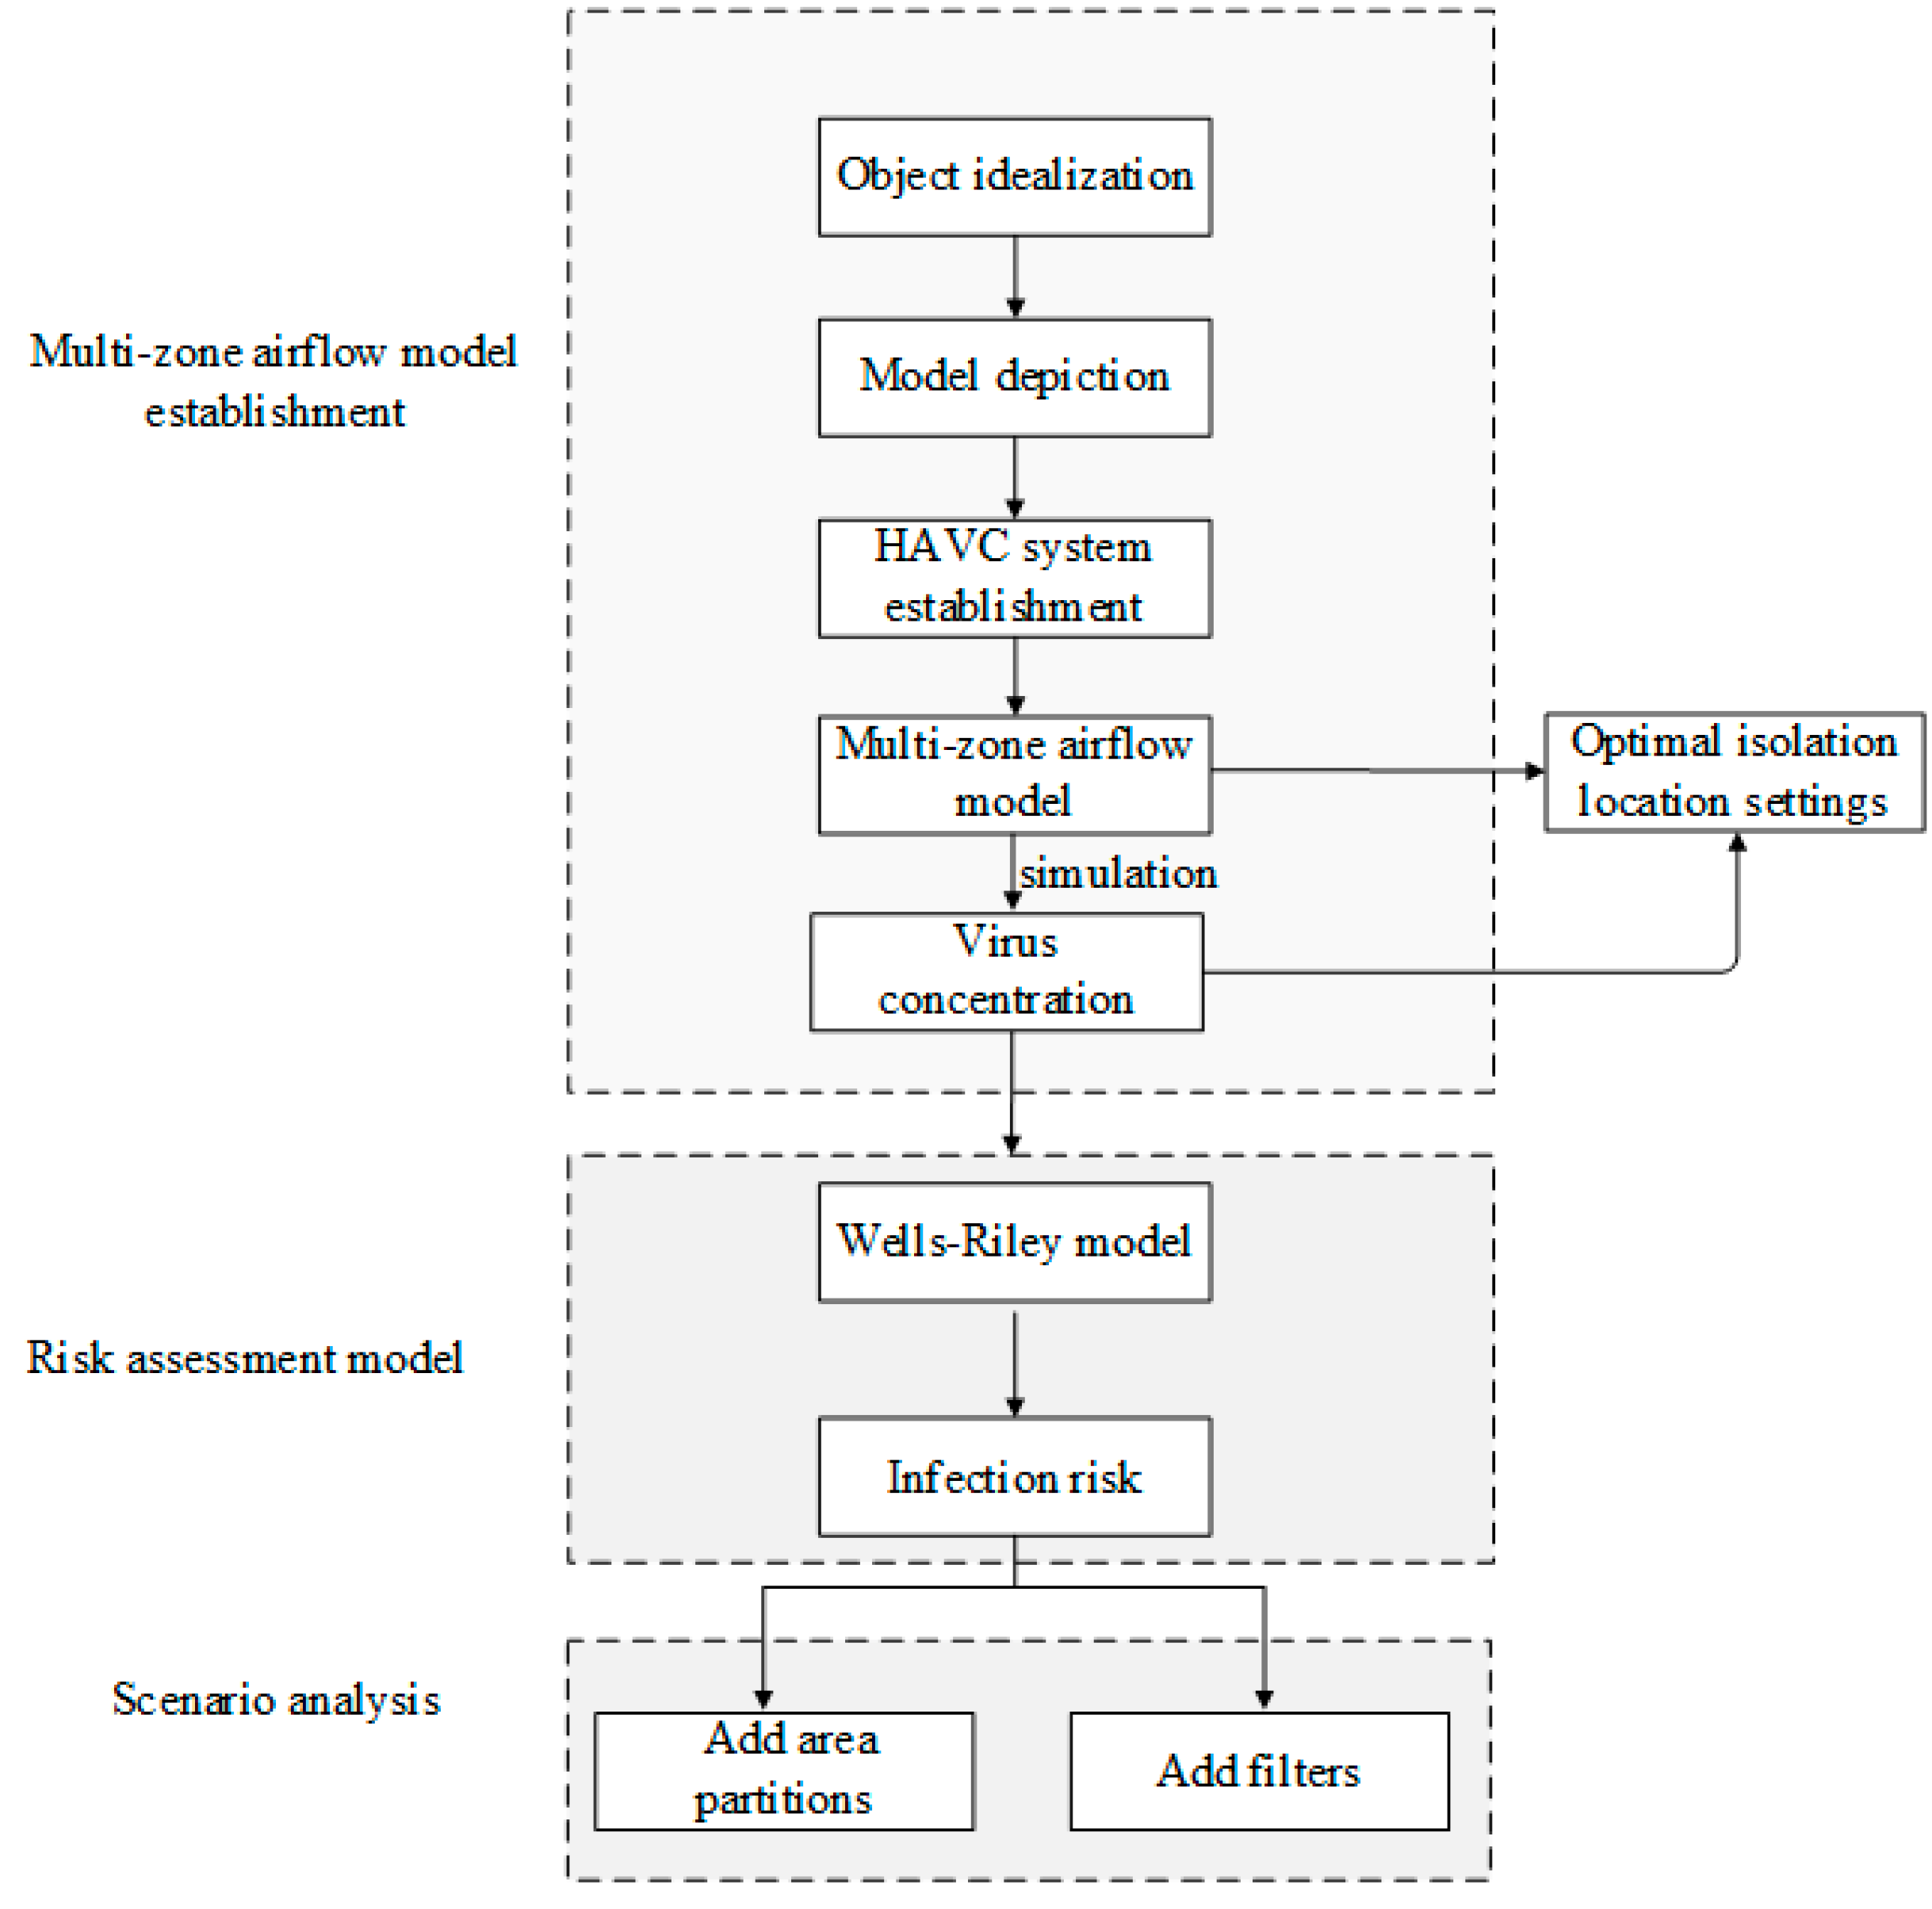
2. Methodology
2.1. Multi-Zone Airflow Model
2.2. Risk Assessment Model
2.3. Infection Risk Assessment Index
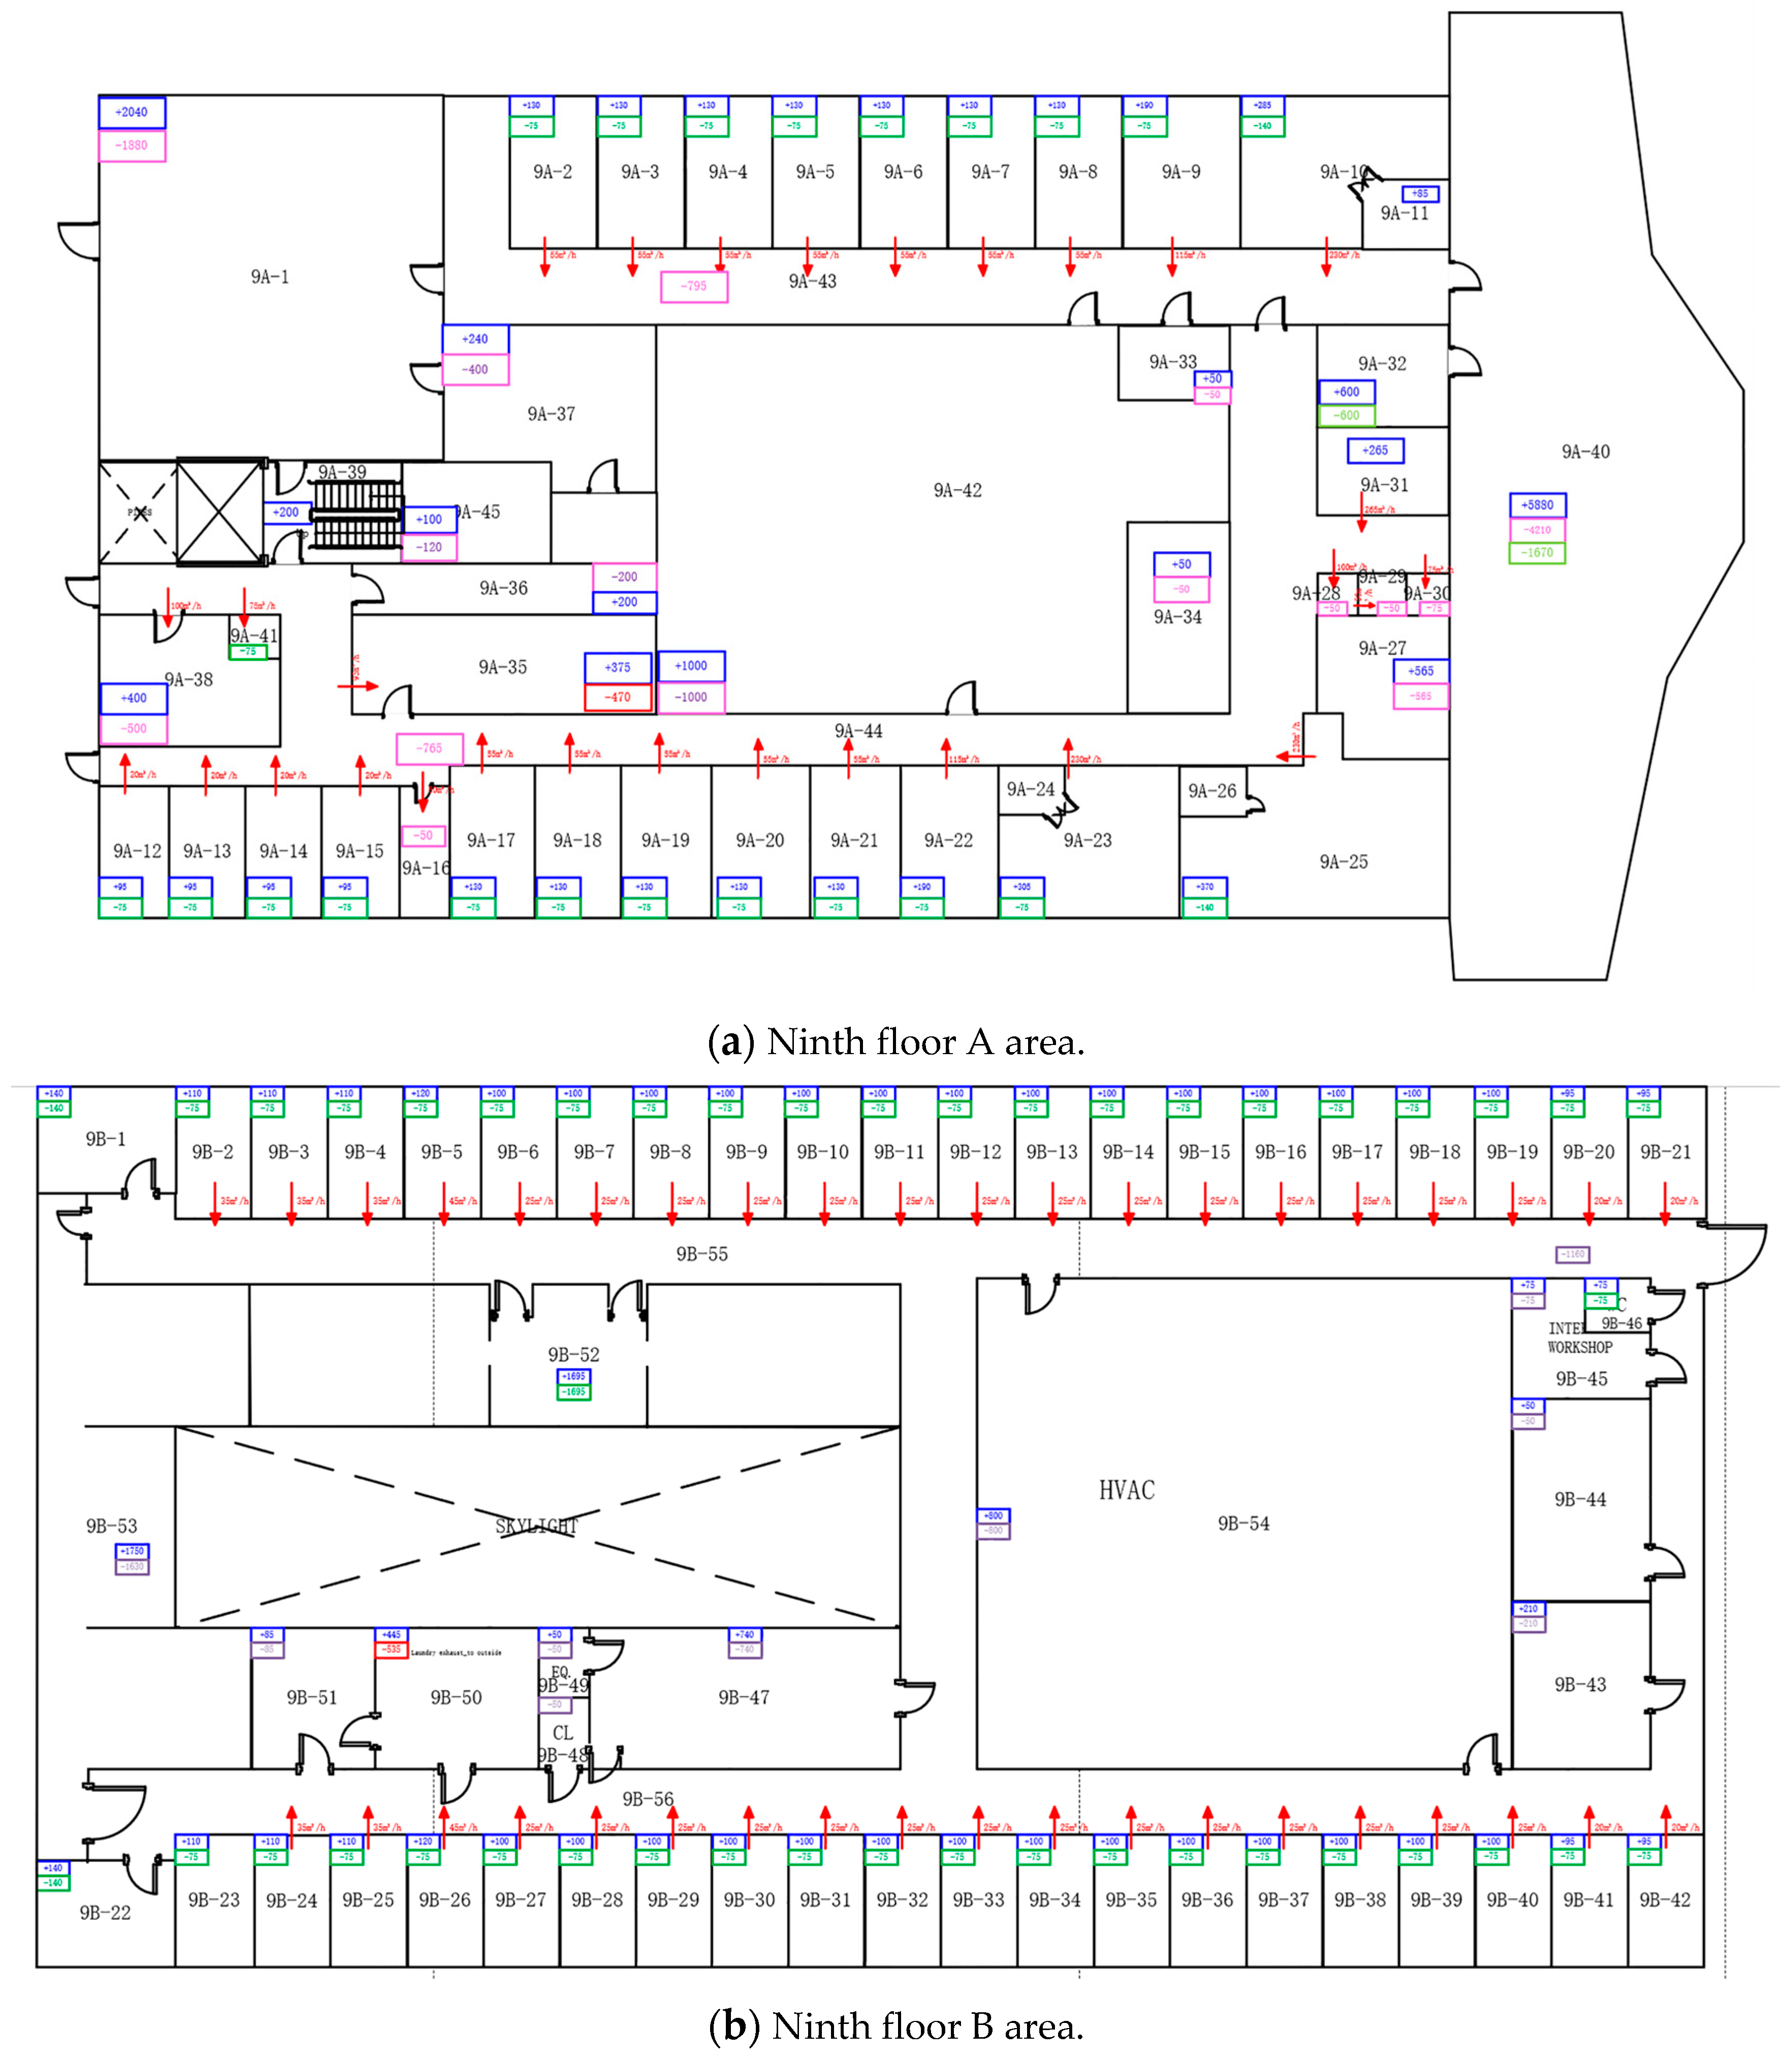
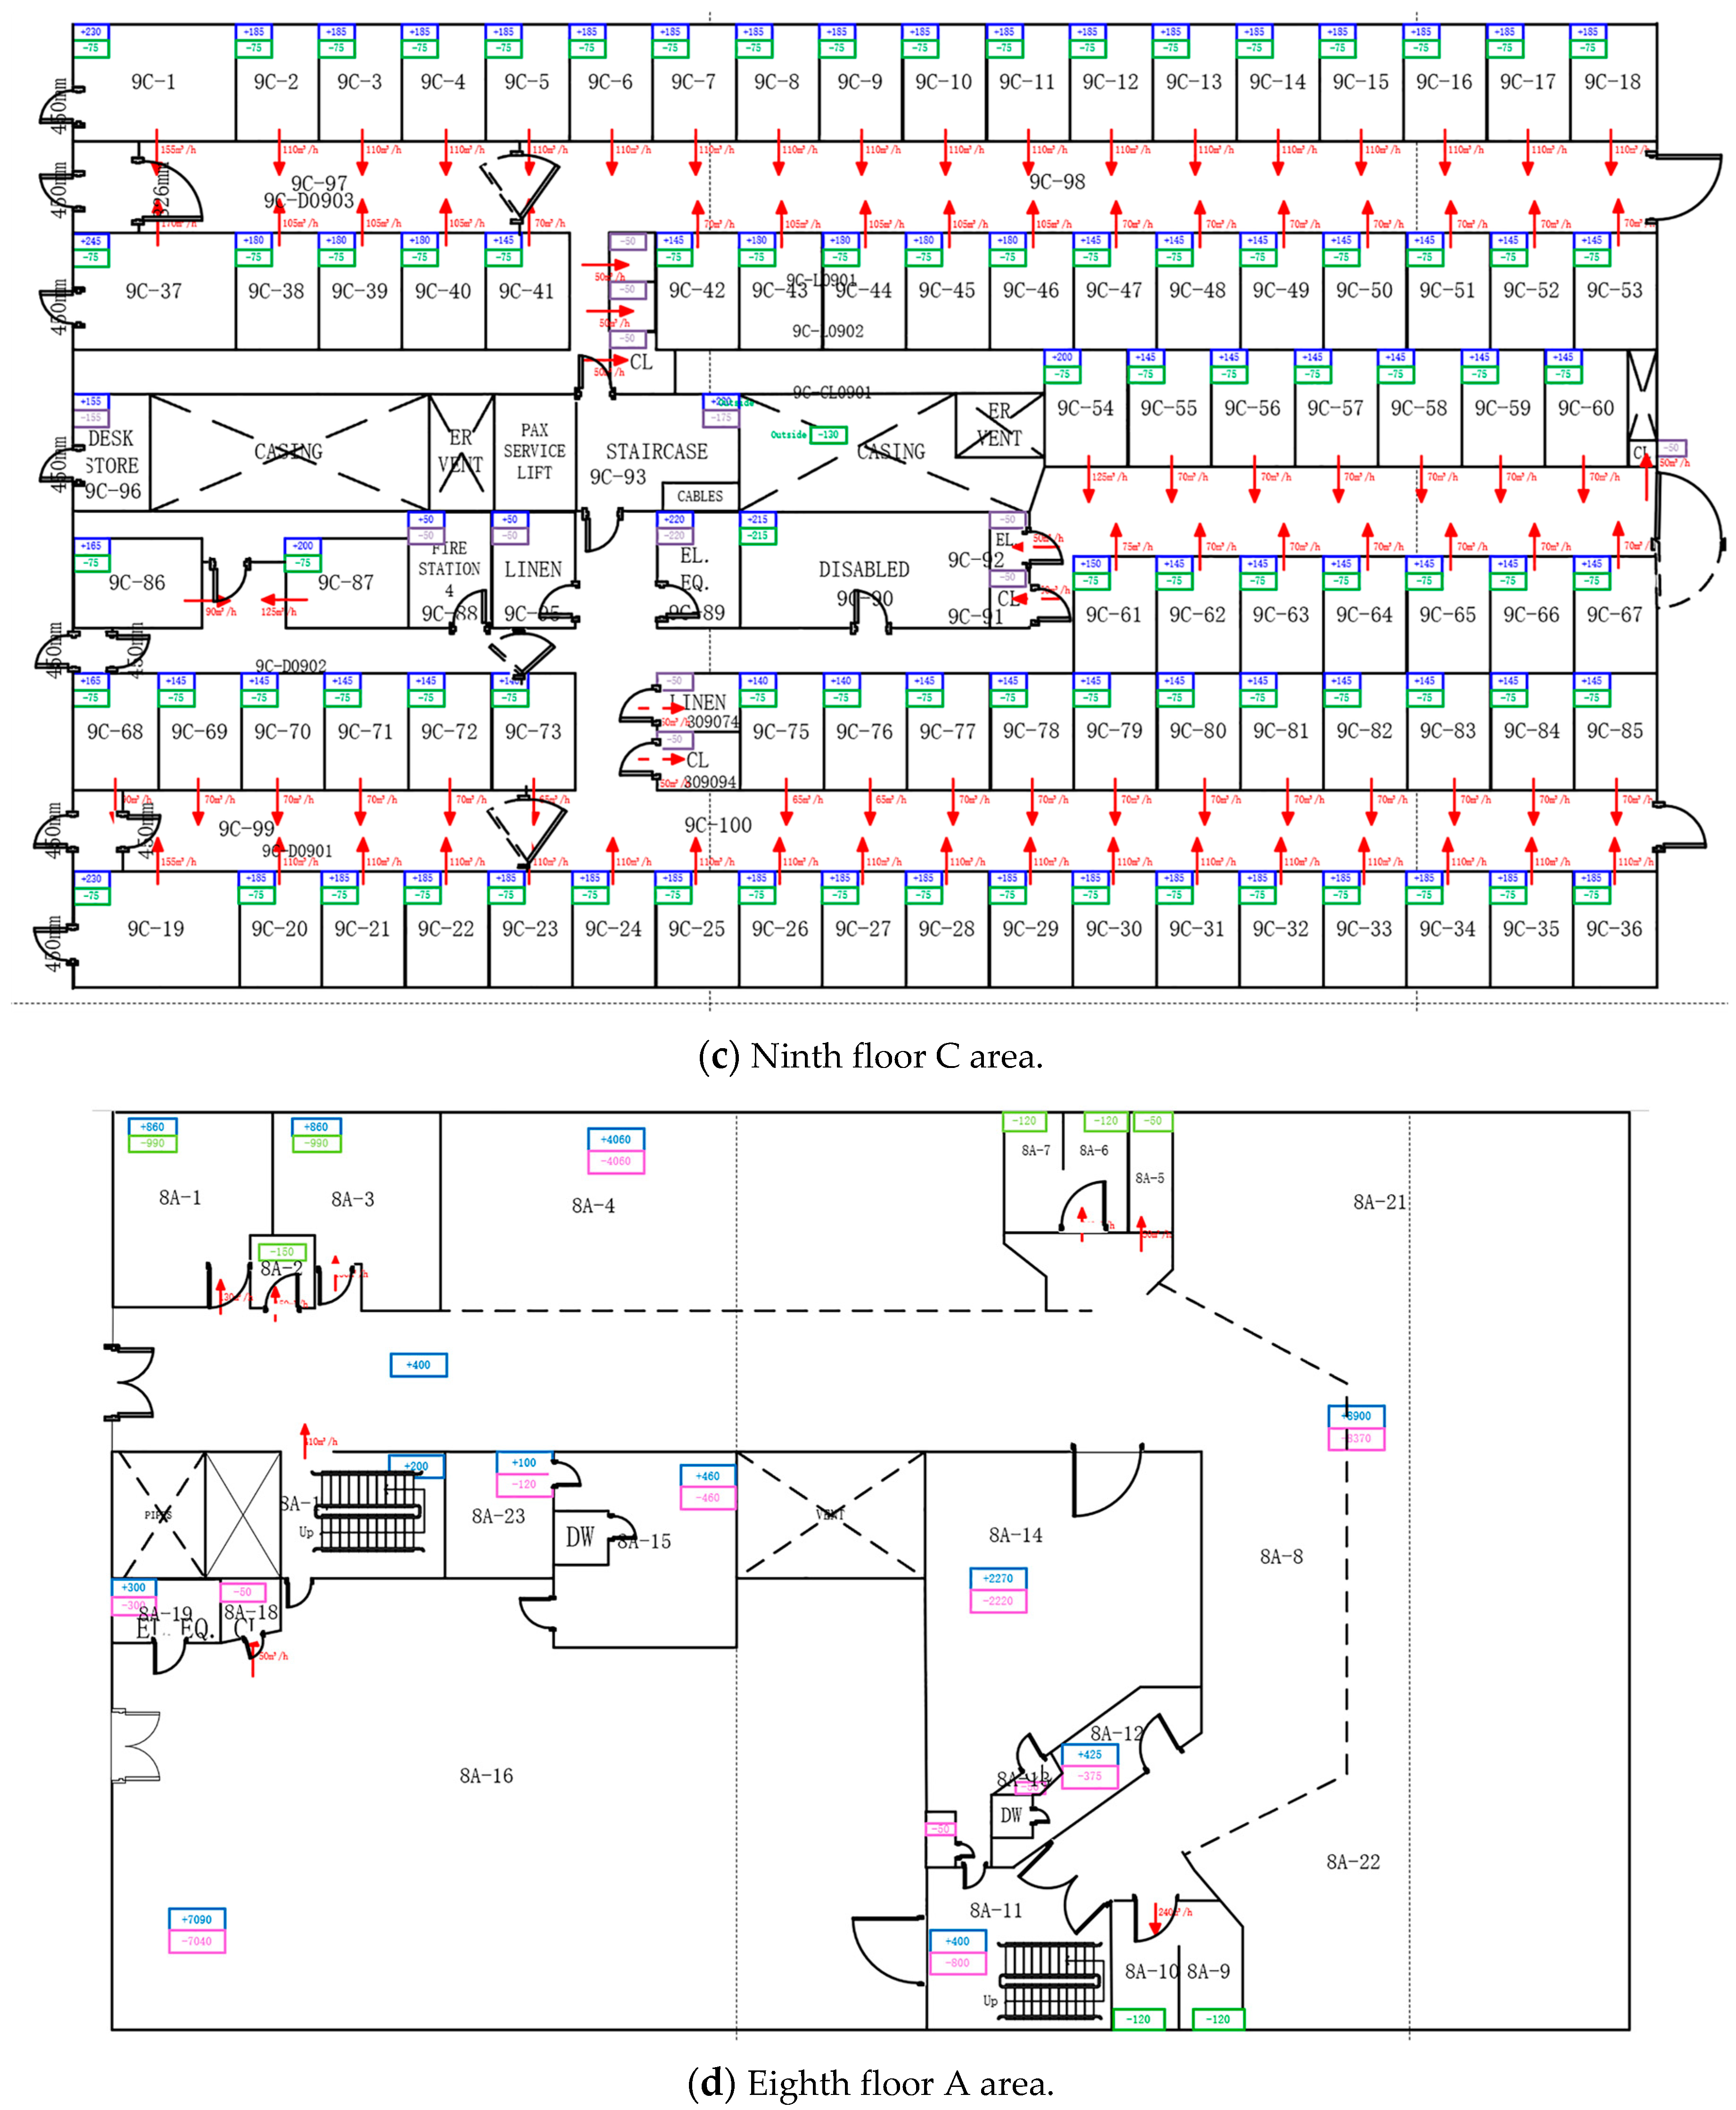
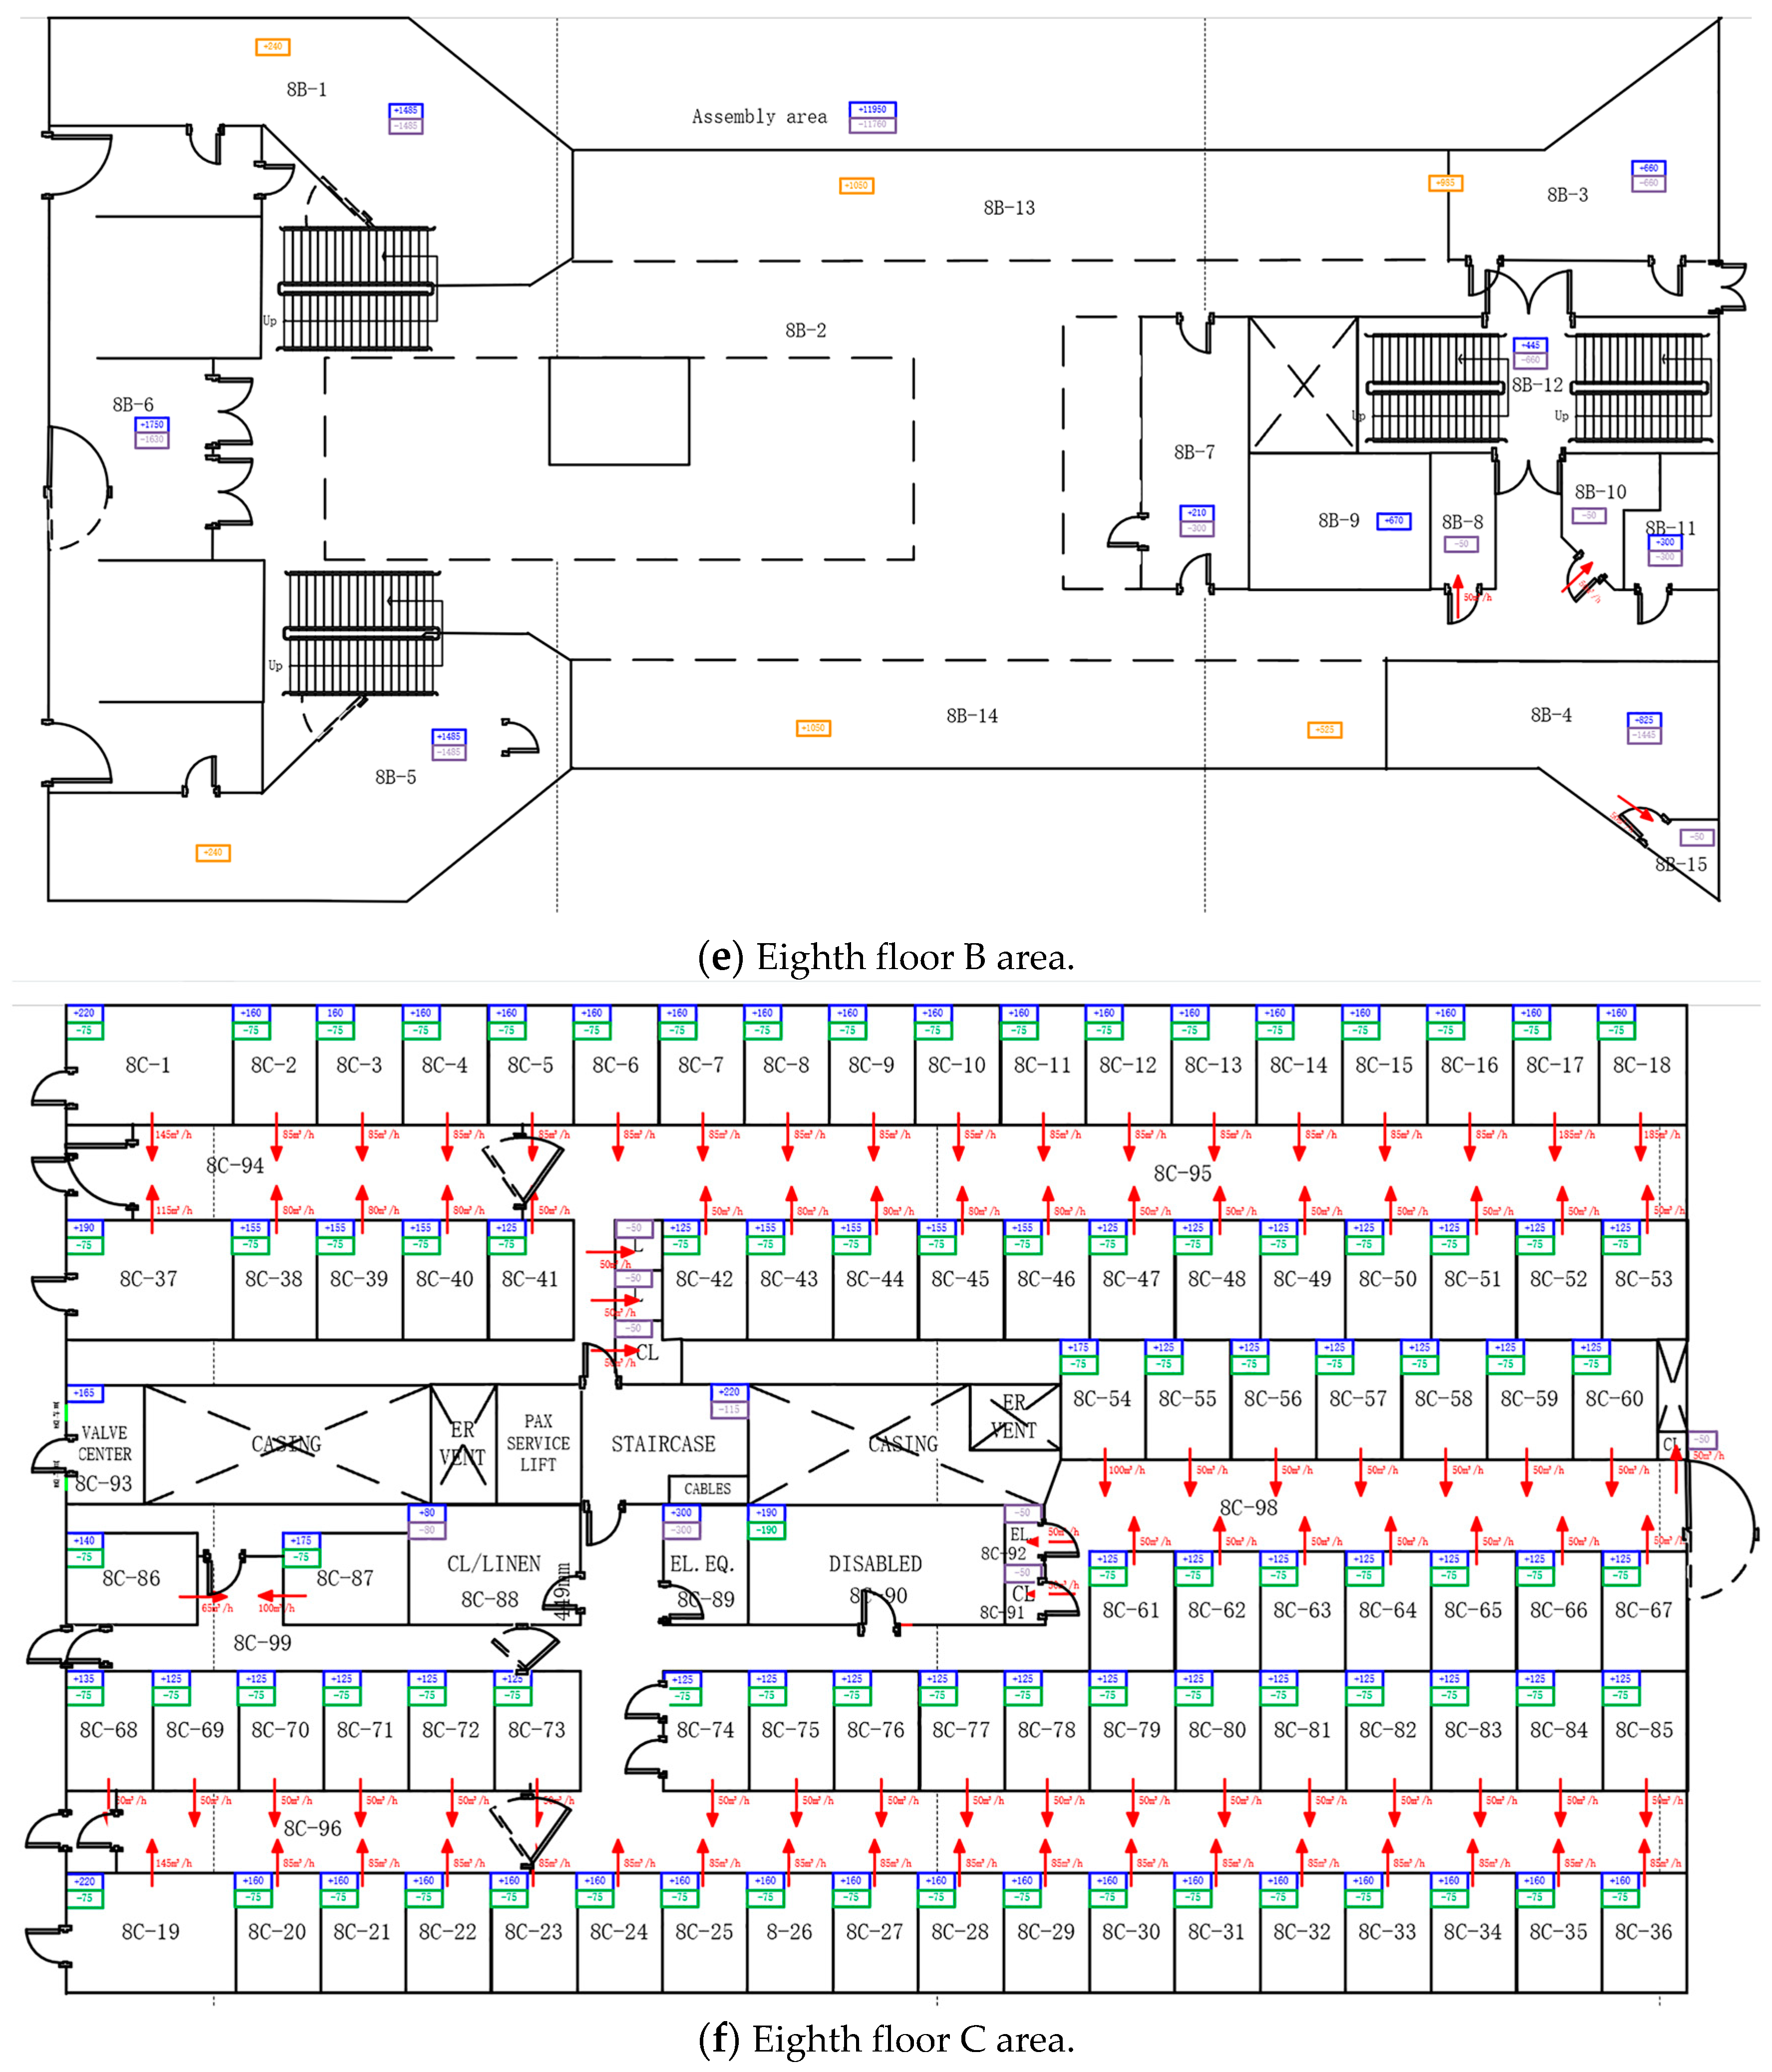
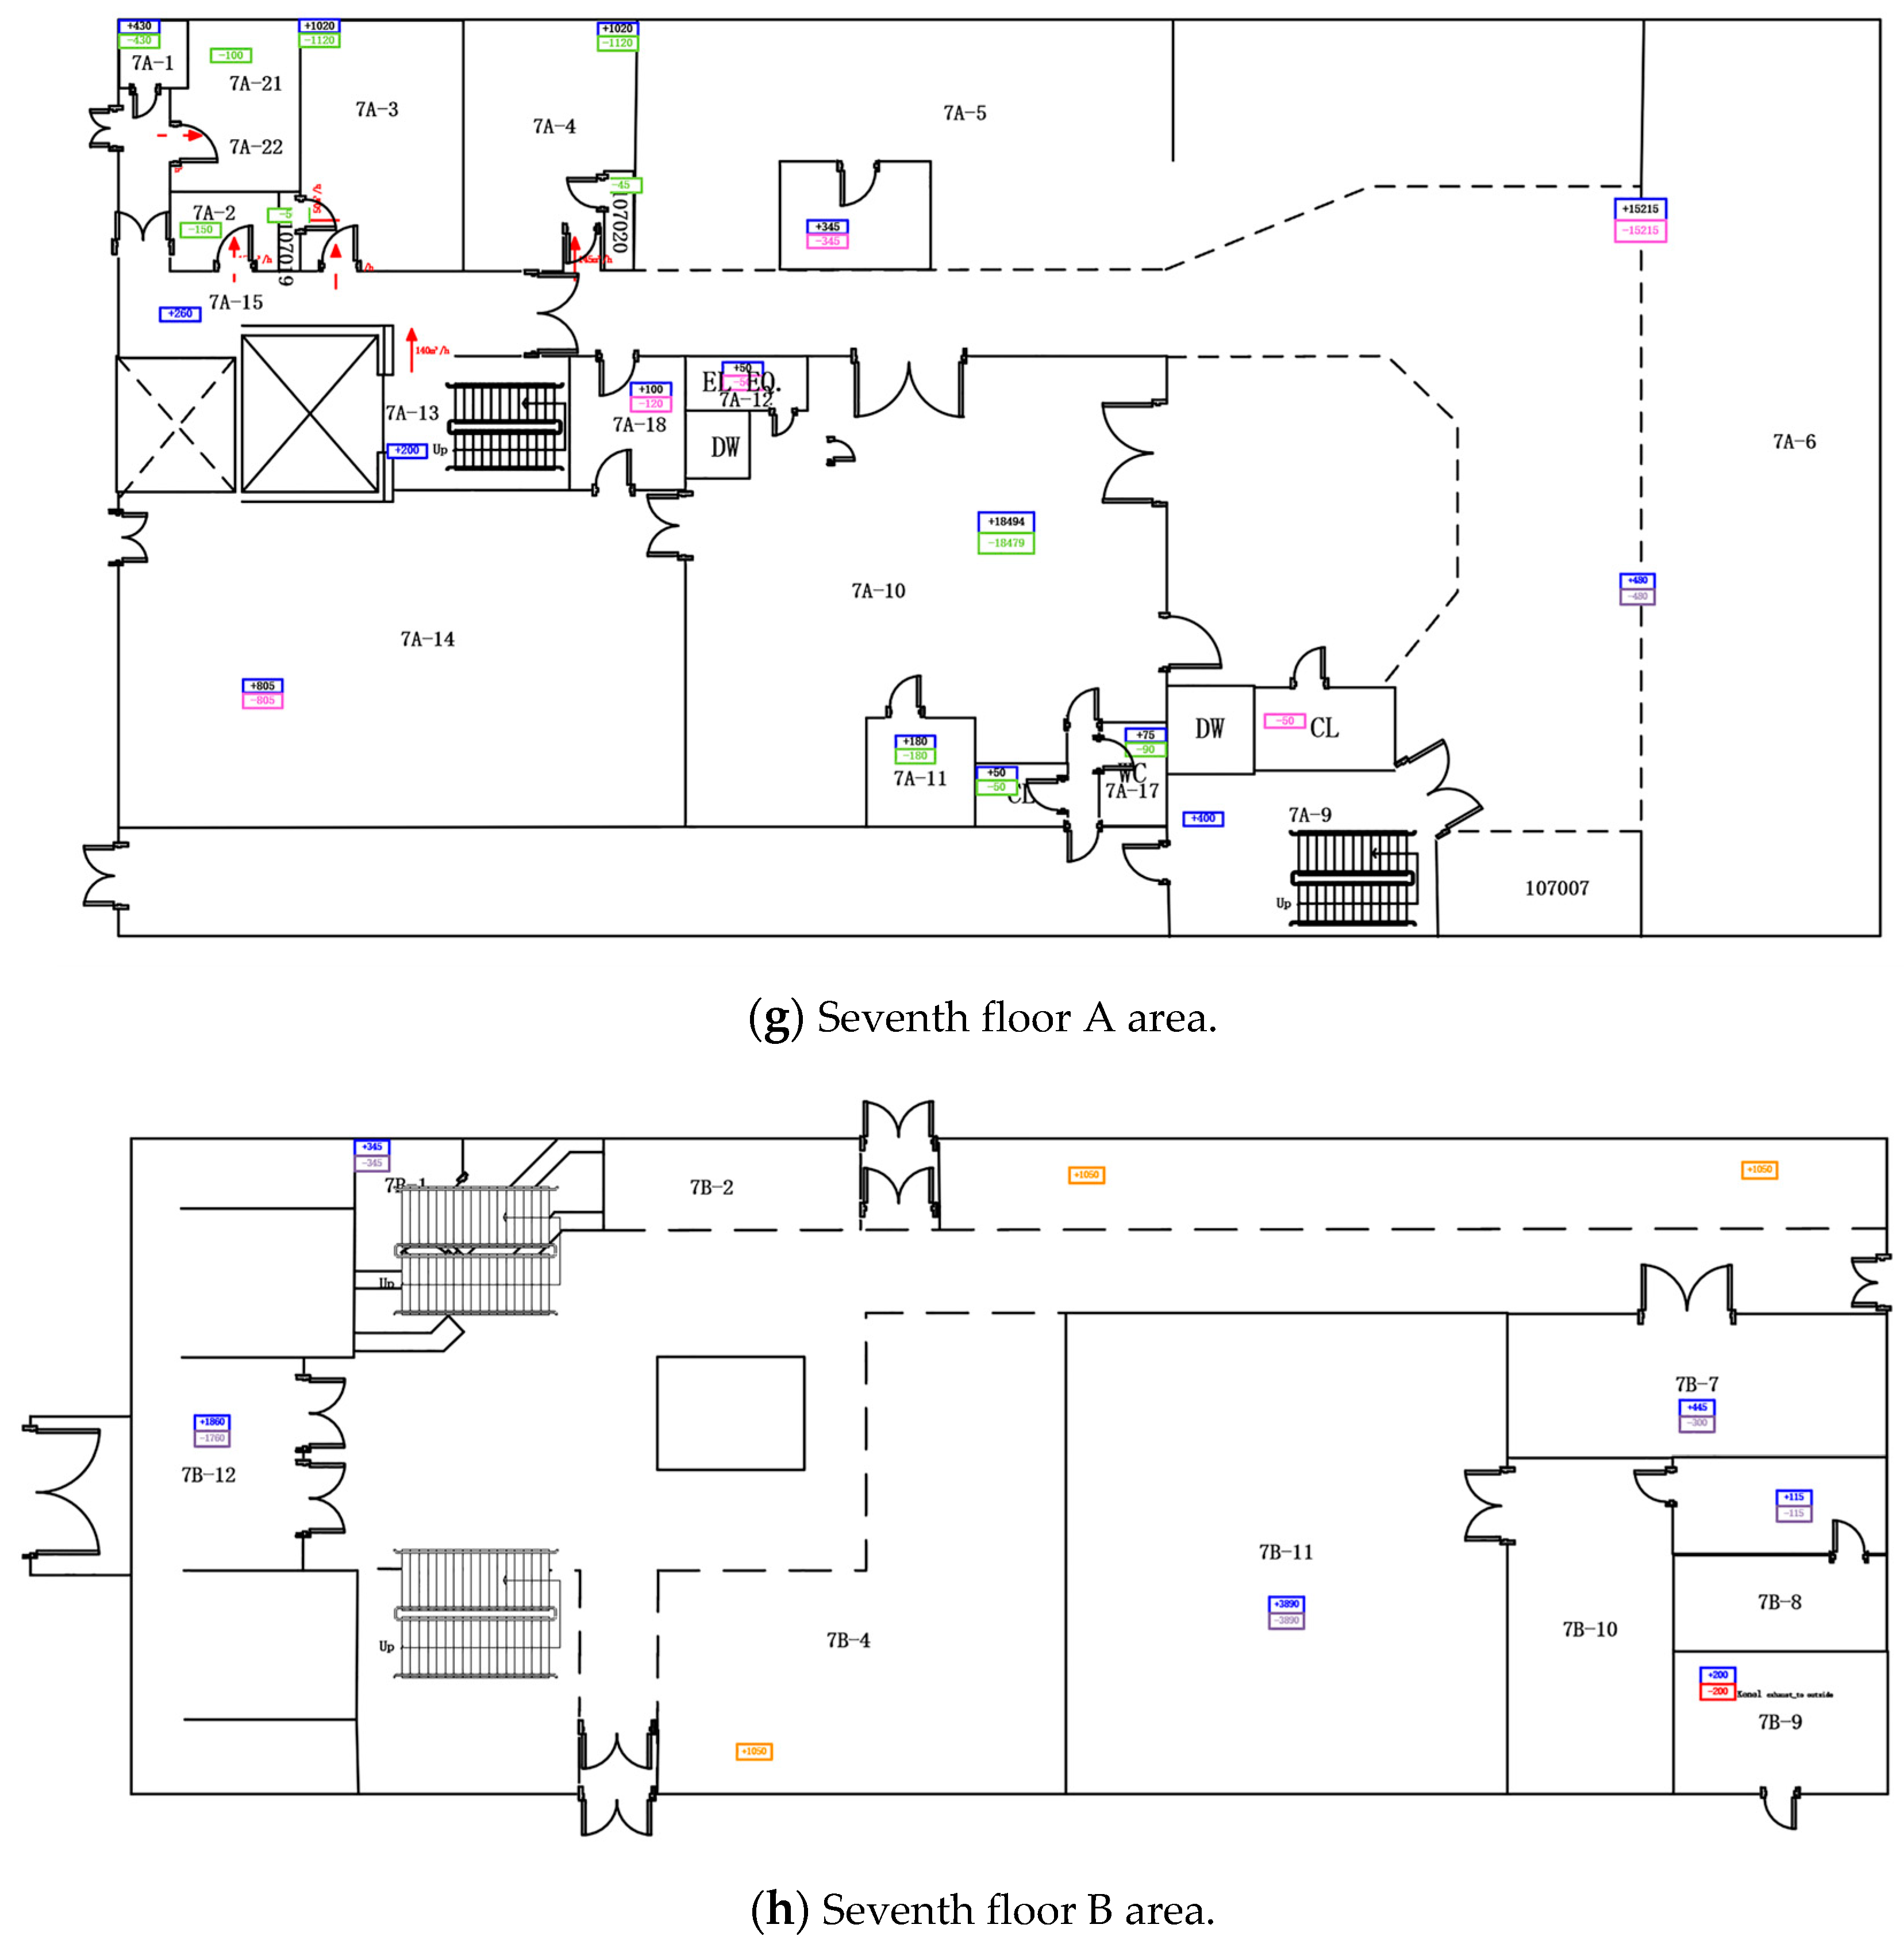
3. Case Study
3.1. Optimal Isolation Location Settings
3.1.1. Room Category Division
3.1.2. Typical Room Infection Risk Analysis
- (1)
- Scenario analysis for rooms belonging to the first category
- (2)
- Scenario analysis for rooms belonging to the second category
- (3)
- Scenario analysis for rooms belonging to the third category
3.2. Infection Risk Evaluation in Public Areas
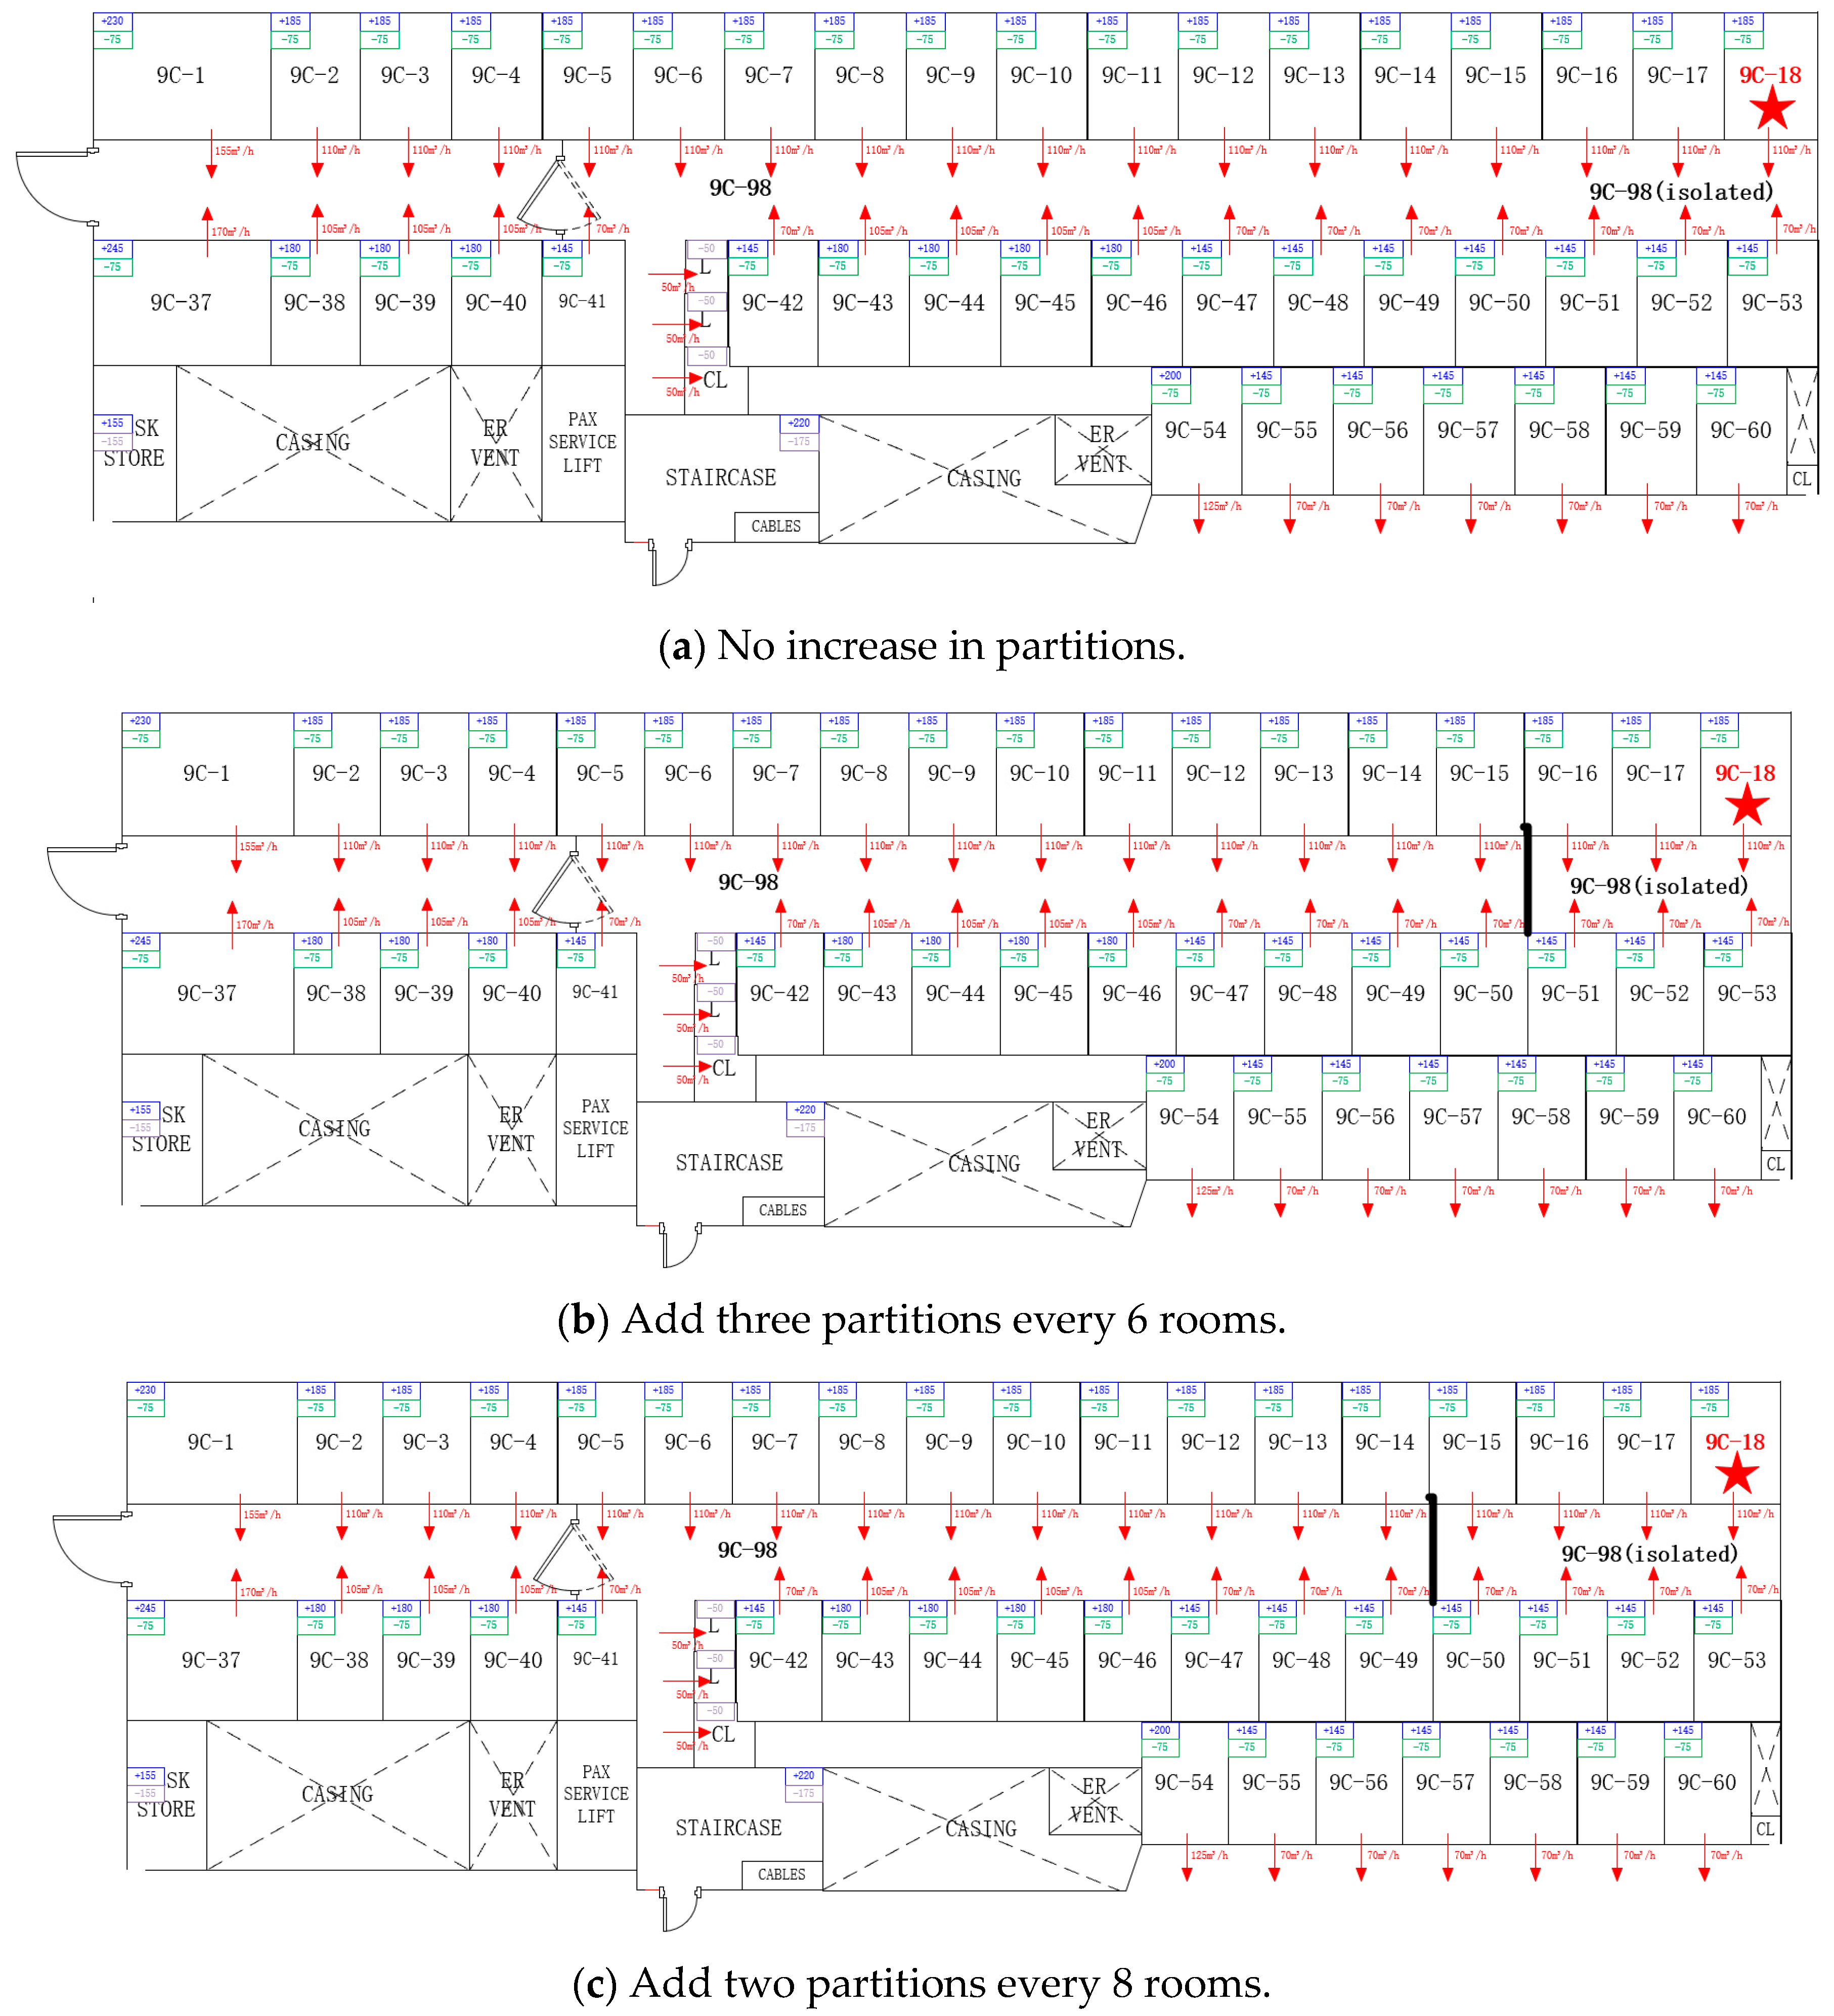
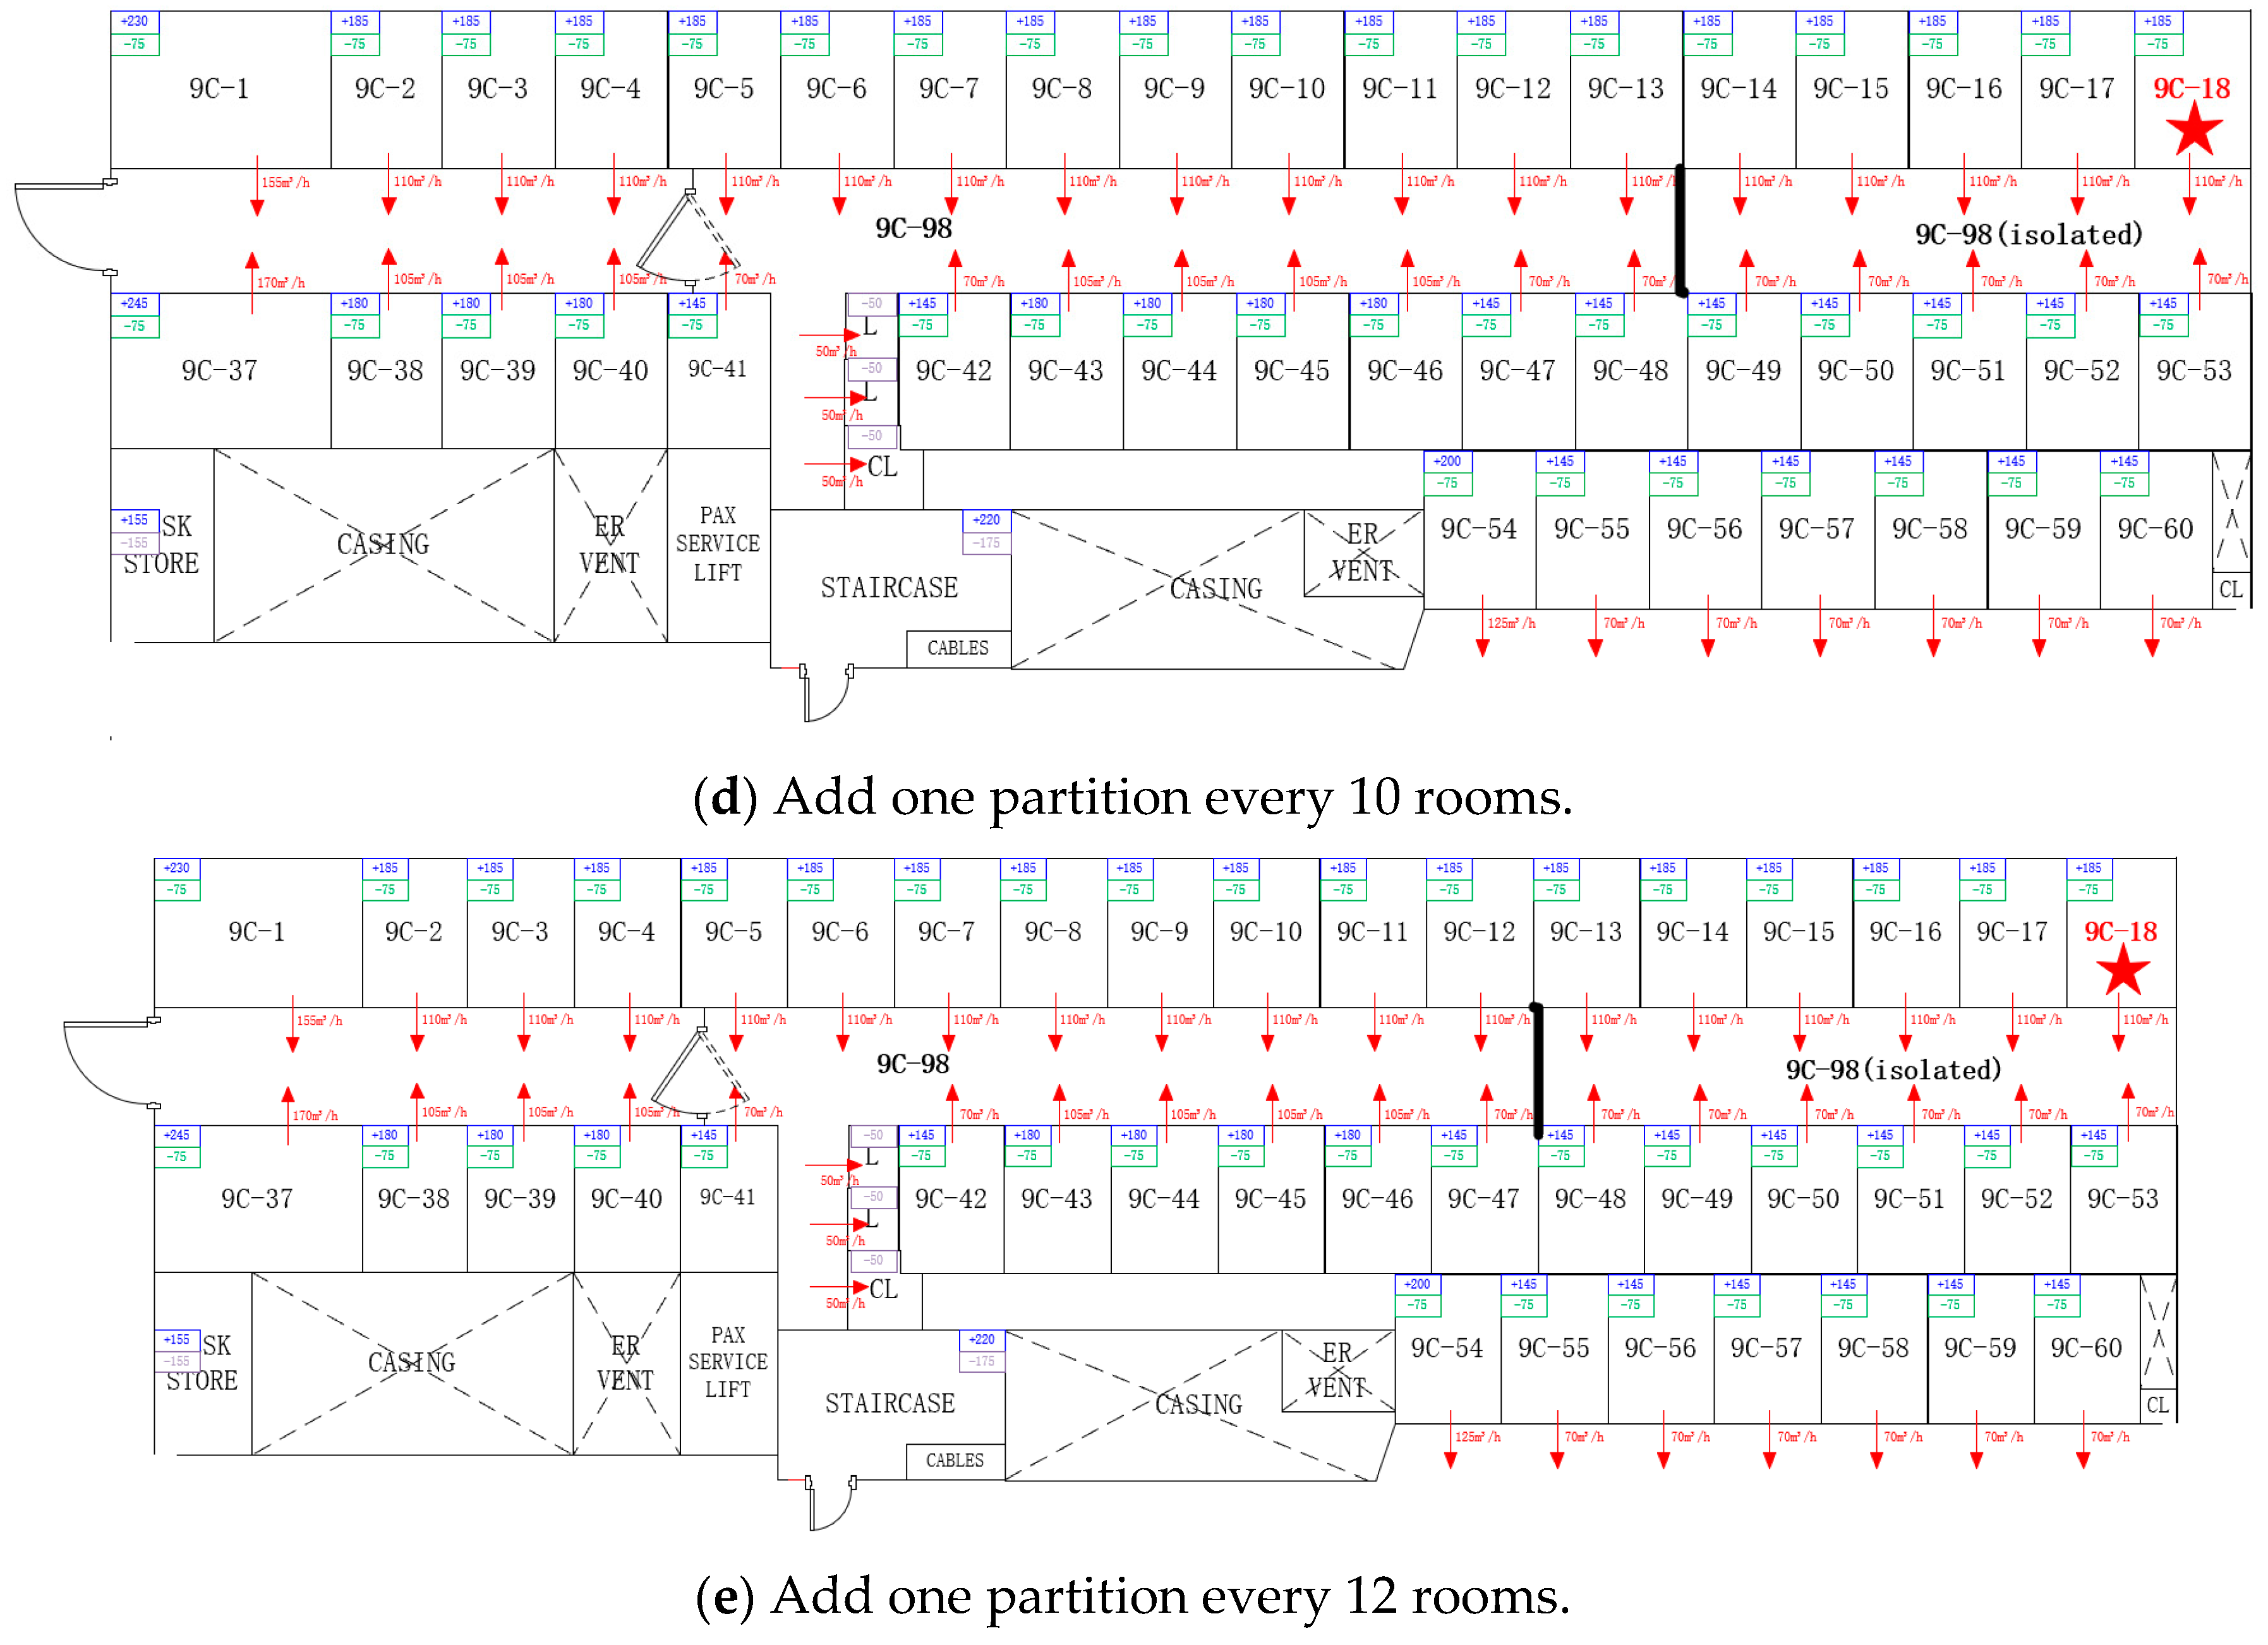
3.3. Building Layout and System Optimization
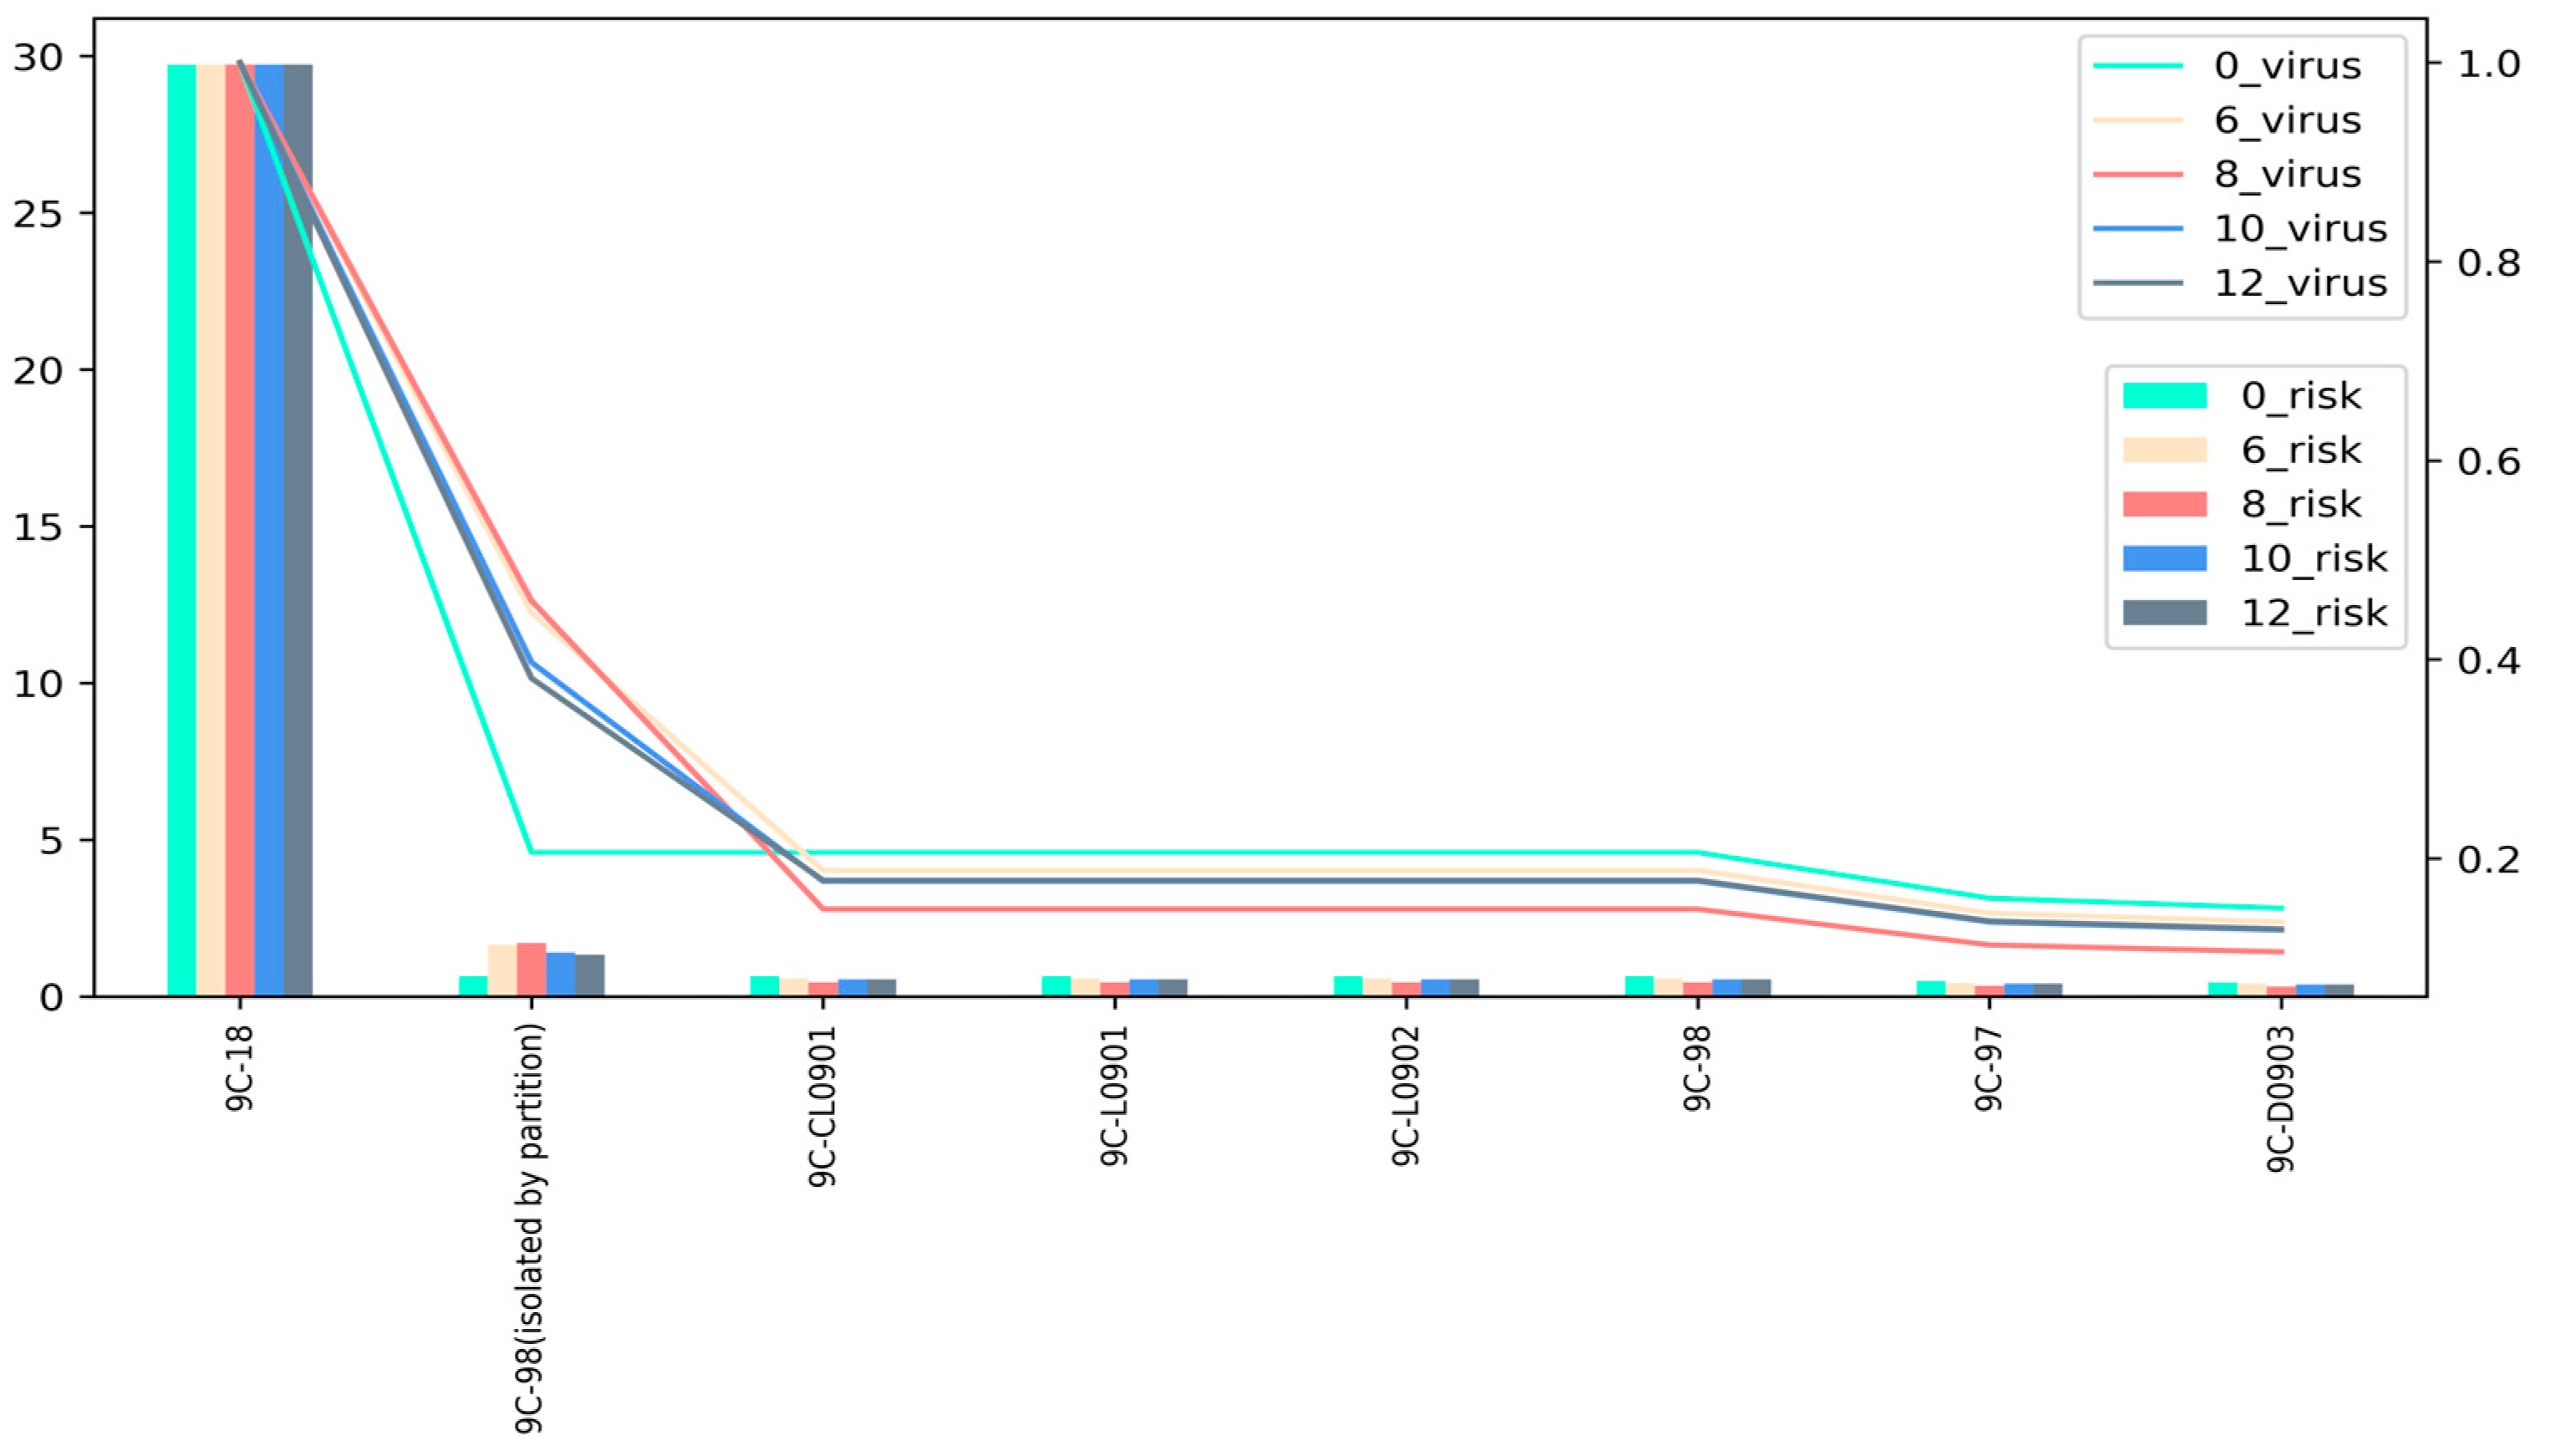
3.3.1. Adding Area Partitions
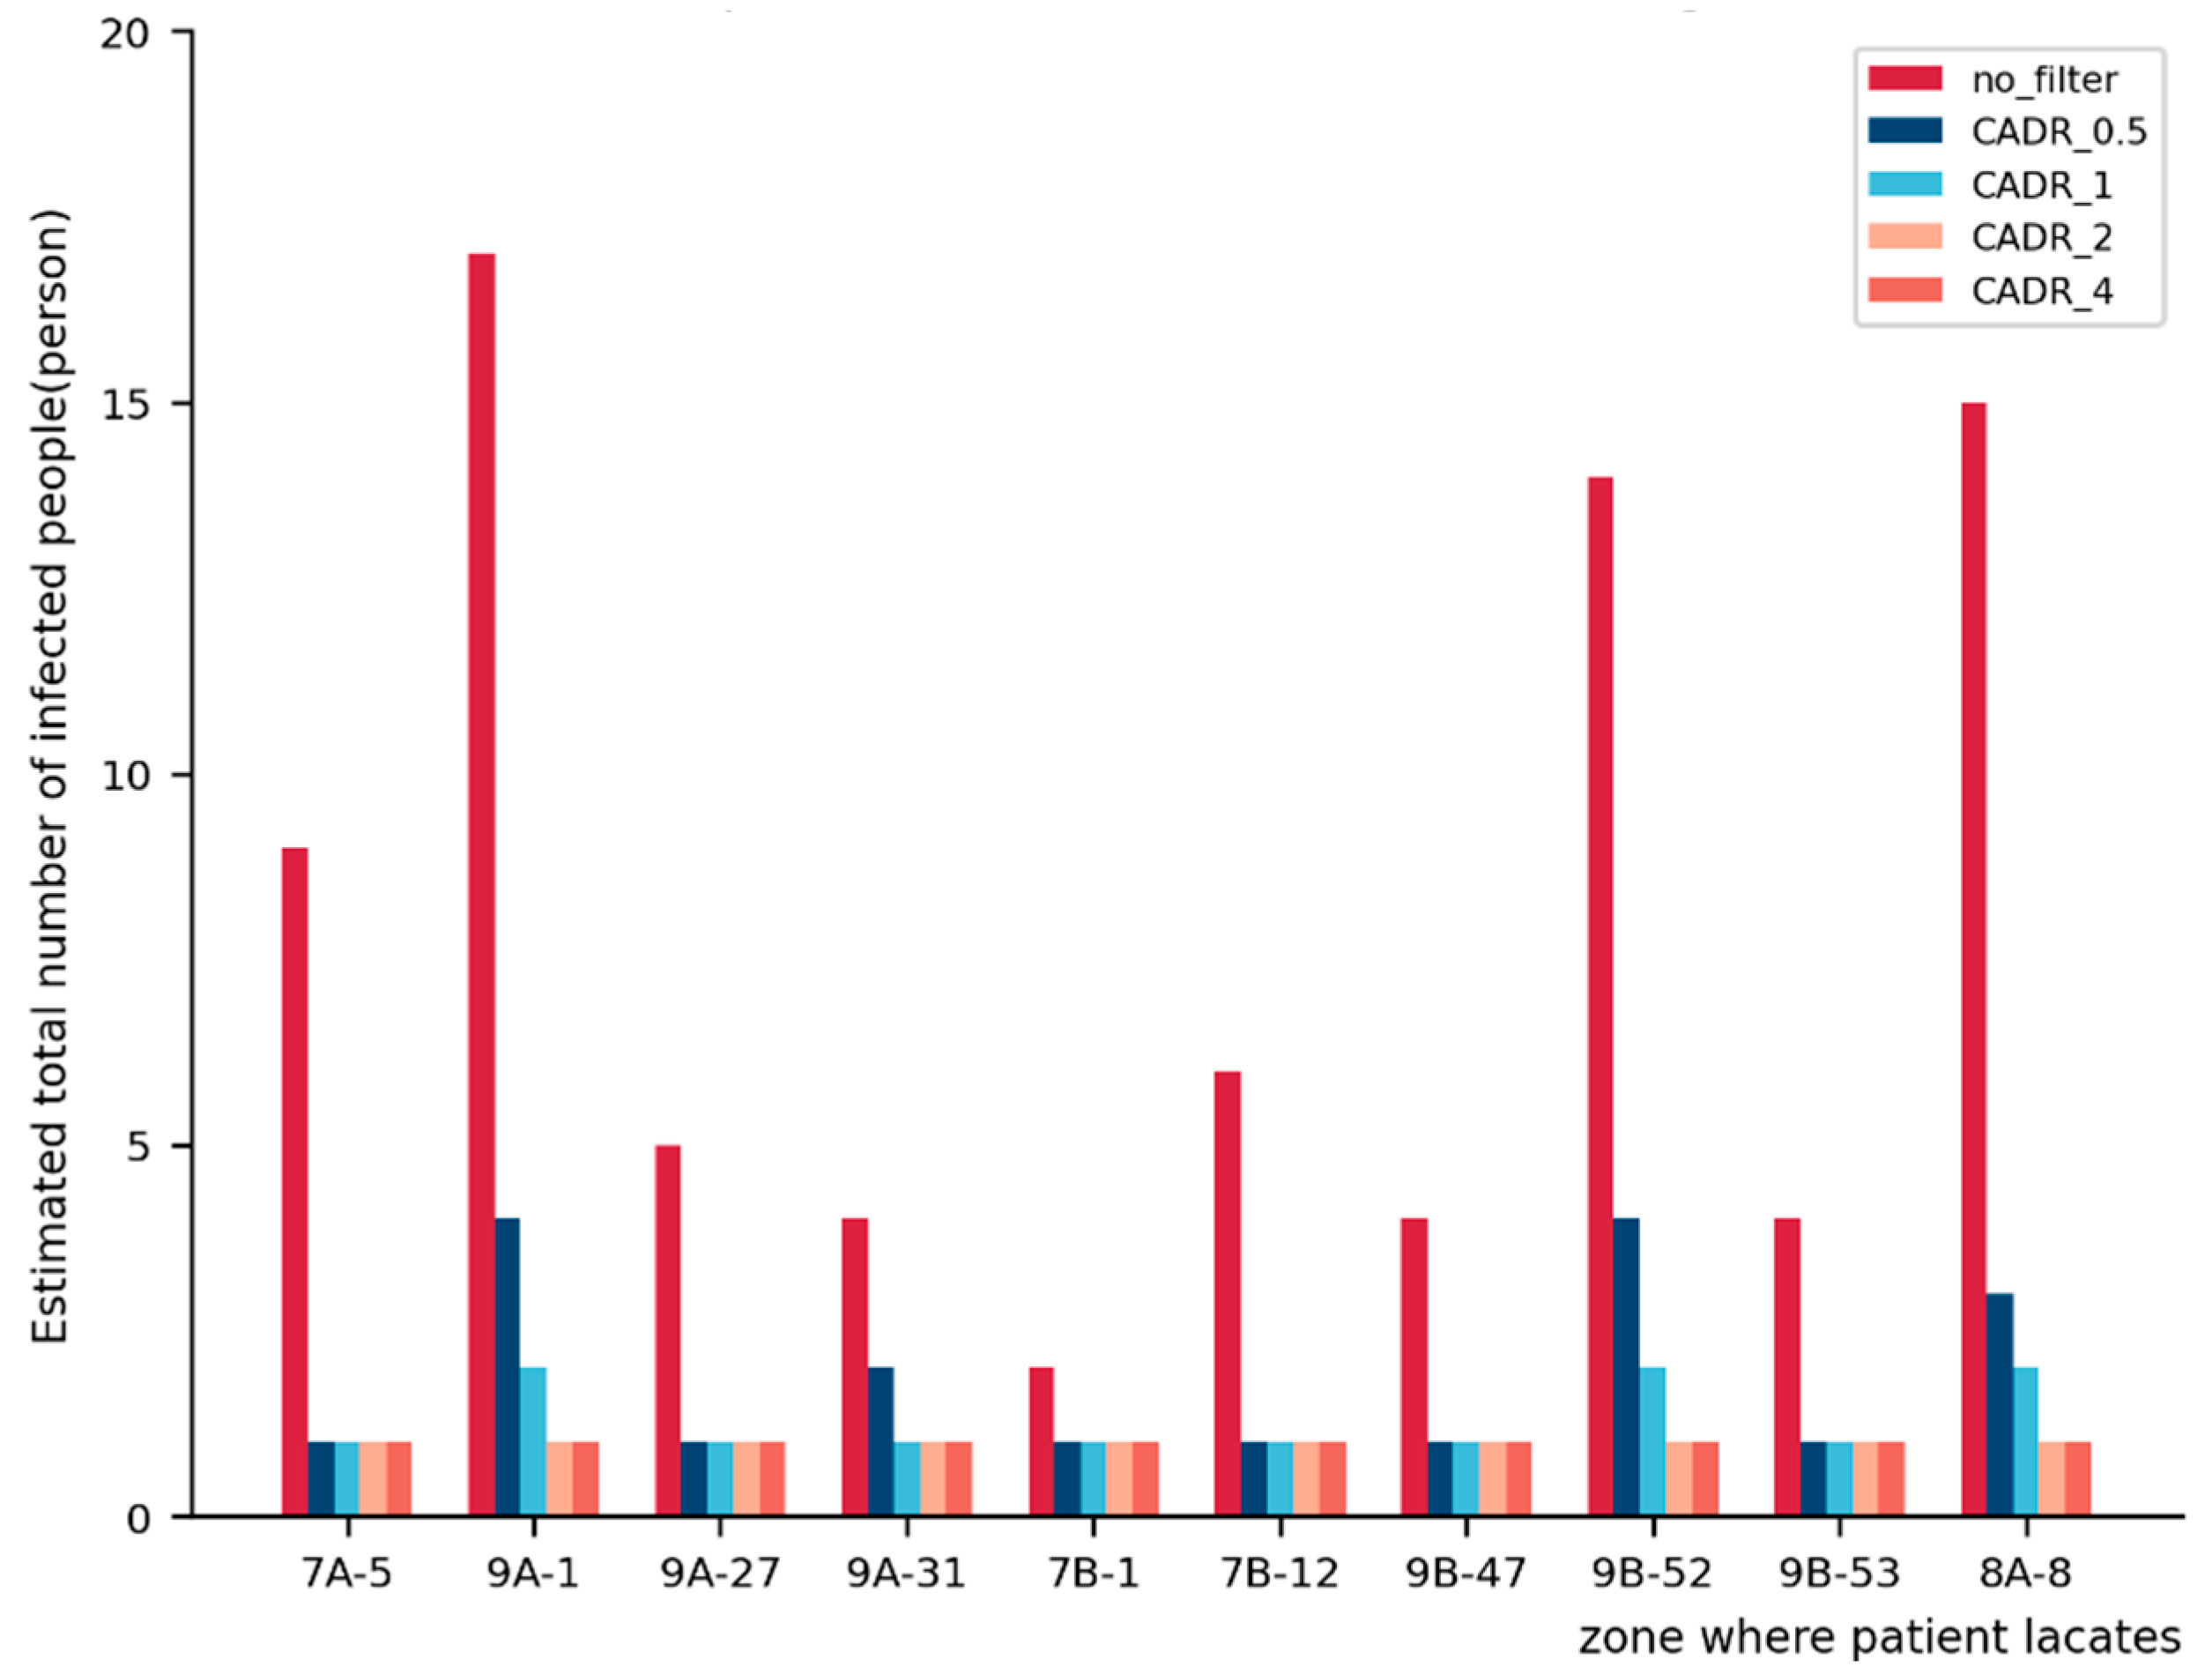
3.3.2. Adding Filters to the System
- (1)
- Carry out a multi-zone airflow simulation and output a stable concentration of virus in each region;
- (2)
- Calculate the final stable concentration in the area where the filter is used according to Function (4);
- (3)
- Calculate the ratio p of the virus concentration in the region where the patient stays before and after filtering and multiply it by the simulated virus concentration in each area to estimate the virus concentration in other regions (outside the region where the patient stays) after using the filter;
- (4)
- Use Function (3) to calculate the total number of infected individuals in the entire ship after using the filter.
4. Conclusions
5. Limitation and Future Work
Author Contributions
Funding
Data Availability Statement
Conflicts of Interest
Appendix A
References
- Zhang, J.; Wu, B.; Yan, X. A Method for Risk Assessment of COVID-19 Infection on Large Cruise Ships. J. Transp. Inf. Saf. 2020, 38, 112–119. [Google Scholar] [CrossRef]
- Ito, H.; Hanaoka, S.; Kawasaki, T. The cruise industry and the COVID-19 outbreak. Transp. Res. Interdiscip. Perspect. 2020, 5, 100136. [Google Scholar] [CrossRef] [PubMed]
- Guo, M.; Xu, P.; Xiao, T.; He, R.; Dai, M.; Miller, S.L. Review and comparison of HVAC operation guidelines in different countries during the COVID-19 pandemic. Build. Environ. 2021, 187, 107368. [Google Scholar] [CrossRef] [PubMed]
- Wang, Z.; Galea, E.R.; Grandison, A.; Ewer, J.; Jia, F. A coupled Computational Fluid Dynamics and Wells-Riley model to predict COVID-19 infection probability for passengers on long-distance trains. Saf. Sci. 2022, 147, 105572. [Google Scholar] [CrossRef] [PubMed]
- Riley, R.L.; Riley, E.C.; Murphy, G. Airborne Spread of Measles in a Suburban Elementary-School. Am. Rev. Respir. Dis. 1978, 107, 421–432. [Google Scholar] [CrossRef] [PubMed]
- Sun, C.; Zhai, Z. The efficacy of social distance and ventilation effectiveness in preventing COVID-19 transmission. Sustain. Cities Soc. 2020, 62, 102390. [Google Scholar] [CrossRef]
- Aganovic, A.; Bi, Y.; Cao, G.; Kurnitski, J.; Wargocki, P. Modeling the impact of indoor relative humidity on the infection risk of five respiratory airborne viruses. Sci. Rep. 2022, 12, 11481. [Google Scholar] [CrossRef]
- Rudnick, S.N.; Milton, D.K. Risk of indoor airborne infection transmission estimated from carbon dioxide concentration. Indoor Air 2003, 13, 237–245. [Google Scholar] [CrossRef]
- Zhang, S.; Lin, Z. Dilution-based evaluation of airborne infection risk-Thorough expansion of Wells-Riley model. Build. Environ. 2021, 194, 107674. [Google Scholar] [CrossRef]
- Ko, G.; Thompson, K.M.; Nardell, E.A. Estimation of tuberculosis risk on a commercial airliner. Risk Anal. 2004, 24, 379–388. [Google Scholar] [CrossRef] [PubMed]
- Aganovic, A.; Bi, Y.; Cao, G.; Drangsholt, F.; Kurnitski, J.; Wargocki, P. Estimating the impact of indoor relative humidity on SARS-CoV-2 airborne transmission risk using a new modification of the Wells-Riley model. Build. Environ. 2021, 205, 14. [Google Scholar] [CrossRef] [PubMed]
- Vuorinen, V.; Aarnio, M.; Alava, M.; Alopaeus, V.; Atanasova, N.; Auvinen, M.; Balasubramanian, N.; Bordbar, H.; Erästö, P.; Grande, R.; et al. Modelling aerosol transport and virus exposure with numerical simulations in relation to SARS-CoV-2 transmission by inhalation indoors. Saf. Sci. 2020, 130, 104866. [Google Scholar] [CrossRef] [PubMed]
- Borro, L.; Mazzei, L.; Raponi, M.; Piscitelli, P.; Miani, A.; Secinaro, A. The role of air conditioning in the diffusion of SARS-CoV-2 in indoor environments: A first computational fluid dynamic model, based on investigations performed at the Vatican State Children’s hospital. Environ. Res. 2021, 193, 110343. [Google Scholar] [CrossRef] [PubMed]
- Yamakawa, M.; Kitagawa, A.; Ogura, K.; Chung, Y.M.; Kim, M. Computational investigation of prolonged airborne dispersion of novel coronavirus-laden droplets. J. Aerosol Sci. 2021, 155, 15. [Google Scholar] [CrossRef] [PubMed]
- Qian, H.; Li, Y.; Nielsen, P.V.; Huang, X. Spatial distribution of infection risk of SARS transmission in a hospital ward. Build. Environ. 2009, 44, 1651–1658. [Google Scholar] [CrossRef]
- Yan, Y.; Li, X.; Shang, Y.; Tu, J. Evaluation of airborne disease infection risks in an airliner cabin using the Lagrangian-based Wells-Riley approach. Build. Environ. 2017, 121, 79–92. [Google Scholar] [CrossRef]
- Foster, A.; Kinzel, M. Estimating COVID-19 exposure in a classroom setting: A comparison between mathematical and numerical models. Phys. Fluids 2021, 33, 021904. [Google Scholar] [CrossRef]
- Pang, S.; Xiao, J.; Fang, Y. Risk assessment model and application of COVID-19 virus transmission in closed environments at sea. Sustain. Cities Soc. 2021, 74, 103245. [Google Scholar] [CrossRef]
- Chen, Q. Ventilation performance prediction for buildings: A method overview and recent applications. Build. Environ. 2009, 44, 848–858. [Google Scholar] [CrossRef]
- Tian, W.; Han, X.; Zuo, W.; Sohn, M.D. Building energy simulation coupled with CFD for indoor environment: A critical review and recent applications. Energy Build. 2018, 165, 184–199. [Google Scholar] [CrossRef]
- Wang, K.; Zhang, Q.; Zhang, G.Q.; Shi, Y.L.; Deng, T.F. Airflow and indoor air quality of residence heating by charcoal basin in rural region. J. Cent. South Univ. Technol. 2007, 14, 81–85. [Google Scholar]
- Cheng, P.; Chen, W.; Xiao, S.; Xue, F.; Wang, Q.; Chan, P.W.; You, R.; Lin, Z.; Niu, J.; Li, Y. Probable cross-corridor transmission of SARS-CoV-2 due to cross airflows and its control. Build. Environ. 2022, 218, 14. [Google Scholar] [CrossRef] [PubMed]
- Szczepanik-Scislo, N. Improving Household Safety via a Dynamic Air Terminal Device in Order to Decrease Carbon Monoxide Migration from a Gas Furnace. Int. J. Environ. Res. Public Health 2022, 19, 1676. [Google Scholar] [CrossRef] [PubMed]
- Heibati, S.; Maref, W.; Saber, H.H. Assessing the Energy, Indoor Air Quality, and Moisture Performance for a Three-Story Building Using an Integrated Model, Part Two: Integrating the Indoor Air Quality, Moisture, and Thermal Comfort. Energies 2021, 14, 5648. [Google Scholar] [CrossRef]
- Pease, L.F.; Wang, N.; Salsbury, T.I.; Underhill, R.M.; Flaherty, J.E.; Vlachokostas, A.; Kulkarni, G.; James, D.P. Investigation of potential aerosol transmission and infectivity of SARS-CoV-2 through central ventilation systems. Build. Environ. 2021, 197, 107633. [Google Scholar] [CrossRef]
- Yan, S.; Wang, L.; Birnkrant, M.J.; Zhai, Z.; Miller, S.L. Multizone Modeling of Airborne SARS-CoV-2 Quanta Transmission and Infection Mitigation Strategies in Office, Hotel, Retail, and School Buildings. Buildings 2023, 13, 102. [Google Scholar] [CrossRef]
- Dols, W.S.; Polidoro, B. CONTAM User Guide and Program Documentation Version 3.4; National Institute of Standards and Technology: Gaithersburg, MD, USA, 2020; p. 1. [CrossRef]
- Andrews, L. Omicron Sub Variant BA.2 just as Contagious as MEASLES, Says Former World Health Organization Official, in DailyMail. UK. 2022. Available online: https://www.dailymail.co.uk/news/article-10614413/Omicron-sub-variant-BA-2-just-contagious-MEASLES.html (accessed on 15 March 2022).
- Guerra, F.M.; Bolotin, S.; Lim, G.; Heffernan, J.; Deeks, S.L.; Li, Y.; Crowcroft, N.S. The basic reproduction number (R-0) of measles: A systematic review. Lancet Infect. Dis. 2017, 17, e420–e428. [Google Scholar] [CrossRef]


| Category | Information | Data Source | Associated CONTAM Object |
|---|---|---|---|
| Geometry | Room volume | Calculation manual + architectural drawings | Zone |
| Room floor area | Calculation manual + architectural drawings | Zone | |
| Cruise layout | Architectural drawings | Zone | |
| HVAC system | Room temperature | Calculation manual | Zone |
| Supply air volume of the rooms | Calculation manual + architectural drawings | Air-handling system | |
| Return air volume of the rooms | Calculation manual + architectural drawings | Air-handling system | |
| Airflow path | Architectural drawings | Airflow path | |
| Virus | Generation rate | The literature | Contaminant |
| Mean diameter | The literature | Contaminant | |
| Diffusion coefficient | The literature | Contaminant |
| Species Properties | Setting |
|---|---|
| Molar mass | 20 kg/kmol |
| Diffusion coefficient | 2 × 10⁻⁵ m3/s |
| Mean diameter | 5 × 10⁻⁶ mm |
| Effective density | 1 kg/m3 |
| Specific heat | 100 J/(kg·K) |
| Corridor Number | Adjoining Rooms | Number of Adjoining Rooms | Room Category |
|---|---|---|---|
| 9C-97 | 9C-1~9C-5, 9C-37~9C-41 | 10 | 1 |
| 9C-98 | 9C-6~9C-18, 9C-42~9C-53 | 25 | 2 |
| 9C-99 | 9C-68~9C-73, 9C-19~9C-23 | 10 | 1 |
| 9C-100 | 9C-54~9C-67, 9C-75~9C-85, 9C-24~9C-36, 9C-90 | 38 | 3 |
| 9C-102 | 9C-86~9C-88 | 3 | 1 |
| Infected Person is in 9C-1 | ||||
|---|---|---|---|---|
| Floor | Room | After 1 h (Quanta/m3) | After 4 h (Quanta/m3) | Risk_P |
| <9> | 9C-1 | 23.834 | 23.908 | 1.000 |
| <9> | 9C-97 | 1.035 | 1.038 | 0.312 |
| <9> | 9C-D0903 | 0.967 | 0.970 | 0.295 |
| Infected Person is in 9C-9 | ||||
|---|---|---|---|---|
| Floor | Room | After 1 h (Quanta/m3) | After 4 h (Quanta/m3) | Risk_P |
| <9> | 9C-9 | 29.717 | 29.723 | 1.000 |
| <9> | 9C-L0901 | 0.639 | 0.640 | 0.206 |
| <9> | 9C-98 | 0.640 | 0.640 | 0.206 |
| <9> | 9C-CL0901 | 0.639 | 0.640 | 0.206 |
| <9> | 9C-L0902 | 0.639 | 0.640 | 0.206 |
| <9> | 9C-97 | 0.484 | 0.484 | 0.160 |
| <9> | 9C-D0903 | 0.452 | 0.452 | 0.150 |
| Infected Person Is LOCATED in9C-36 | ||||
|---|---|---|---|---|
| Floor | Room | After 1 h (Quanta/m3) | After 4 h (Quanta/m3) | Risk_P |
| <9> | 9C-36 | 29.717 | 29.723 | 1.000 |
| <9> | 9C-CL0902 | 0.387 | 0.387 | 0.130 |
| <9> | 9C-91 | 0.387 | 0.387 | 0.130 |
| <9> | 9C-100 | 0.387 | 0.387 | 0.130 |
| <9> | 9C-94 | 0.378 | 0.387 | 0.130 |
| <9> | 9C-92 | 0.386 | 0.387 | 0.130 |
| <9> | 9C-74 | 0.378 | 0.387 | 0.130 |
| <9> | 9C-D0902 | 0.356 | 0.357 | 0.120 |
| <9> | 9C-102 | 0.356 | 0.357 | 0.120 |
| <9> | 9C-99 | 0.289 | 0.290 | 0.099 |
| <9> | 9C-D0901 | 0.279 | 0.279 | 0.096 |
| Zone | 0_virus | 0_risk | 6_virus | 6_risk | 8_virus | 8_risk | 10_virus | 10_risk | 12_virus | 12_risk | ||
|---|---|---|---|---|---|---|---|---|---|---|---|---|
| 9C-18 | 29.723 | 1.000 | 29.723 | 1.000 | 29.723 | 1.000 | 29.723 | 1.000 | 29.723 | 1.000 | ||
| 9C-CL0901 | 0.640 | 0.206 | 0.577 | 0.188 | 0.448 | 0.149 | 0.542 | 0.177 | 0.546 | 0.178 | ||
| 9C-L0901 | 0.640 | 0.206 | 0.577 | 0.188 | 0.448 | 0.149 | 0.542 | 0.177 | 0.546 | 0.178 | ||
| 9C-L0902 | 0.640 | 0.206 | 0.577 | 0.188 | 0.448 | 0.149 | 0.542 | 0.177 | 0.546 | 0.178 | ||
| 9C-97 | 0.484 | 0.160 | 0.434 | 0.145 | 0.335 | 0.113 | 0.407 | 0.136 | 0.410 | 0.137 | ||
| 9C-D0903 | 0.452 | 0.150 | 0.404 | 0.136 | 0.312 | 0.106 | 0.380 | 0.128 | 0.382 | 0.129 | ||
| 9C-98 | 0.640 | 0.206 | 0.577 | 0.188 | 0.448 | 0.149 | 0.542 | 0.177 | 0.546 | 0.178 | ||
| 9C-98 (isolated by partition) | 1.645 | 0.447 | 1.707 | 0.459 | 1.406 | 0.397 | 1.330 | 0.381 | ||||
| No Increase in Partitions | Add One Partition Every 12 Rooms | Add One Partition Every 10 Rooms | Add One Partition Every 8 Rooms | Add One Partition Every 6 Rooms | |
|---|---|---|---|---|---|
| Number of virus spread areas | 6 | 6 | 6 | 6 | 6 |
| Estimated number of infected individuals | 2.41 | 2.35 | 2.35 | 2.29 | 2.37 |
Disclaimer/Publisher’s Note: The statements, opinions and data contained in all publications are solely those of the individual author(s) and contributor(s) and not of MDPI and/or the editor(s). MDPI and/or the editor(s) disclaim responsibility for any injury to people or property resulting from any ideas, methods, instructions or products referred to in the content. |
© 2023 by the authors. Licensee MDPI, Basel, Switzerland. This article is an open access article distributed under the terms and conditions of the Creative Commons Attribution (CC BY) license (https://creativecommons.org/licenses/by/4.0/).
Share and Cite
Xia, Z.; Guan, H.; Qi, Z.; Xu, P. Multi-Zone Infection Risk Assessment Model of Airborne Virus Transmission on a Cruise Ship Using CONTAM. Buildings 2023, 13, 2350. https://doi.org/10.3390/buildings13092350
Xia Z, Guan H, Qi Z, Xu P. Multi-Zone Infection Risk Assessment Model of Airborne Virus Transmission on a Cruise Ship Using CONTAM. Buildings. 2023; 13(9):2350. https://doi.org/10.3390/buildings13092350
Chicago/Turabian StyleXia, Zhuang, Hang Guan, Zixuan Qi, and Peng Xu. 2023. "Multi-Zone Infection Risk Assessment Model of Airborne Virus Transmission on a Cruise Ship Using CONTAM" Buildings 13, no. 9: 2350. https://doi.org/10.3390/buildings13092350
APA StyleXia, Z., Guan, H., Qi, Z., & Xu, P. (2023). Multi-Zone Infection Risk Assessment Model of Airborne Virus Transmission on a Cruise Ship Using CONTAM. Buildings, 13(9), 2350. https://doi.org/10.3390/buildings13092350