Article

Research on Quantitative Assessment and Dynamic Reasoning Method for Emergency Response Capability in Prefabricated Construction Safety

1
Sanya Science and Education Innovation Park, Wuhan University of Technology, Sanya 572000, China
2
School of Civil Engineering and Architecture, Wuhan University of Technology, Wuhan 430070, China
3
School of Real Estate and Management Science, Chongqing University, Chongqing 400044, China
*
Author to whom correspondence should be addressed.
Buildings 2023, 13(9), 2311; https://doi.org/10.3390/buildings13092311
Submission received: 25 July 2023 / Revised: 5 September 2023 / Accepted: 7 September 2023 / Published: 12 September 2023
(This article belongs to the Special Issue Proactive and Advanced Research on Construction Safety Management)

Abstract

:
In response to the common issues of lacking a comprehensive quantitative assessment system and insufficient dynamic understanding of emergency response capability in prefabricated construction safety, this study proposes a research methodology based on decision-making trial and evaluation laboratory (DEMATEL) and fuzzy cognitive maps (FCM) to promote the construction of emergency response capacity. Firstly, a quantitative evaluation indicator system comprising 4 core categories of organizational management, personnel quality, technical measures, and emergency resources, along with 16 main categories, is established using grounded theory and three levels of coding approach. Subsequently, through a combination of expert surveys and quantitative analysis, DEMATEL is employed to unveil the causal relationships and key indicators of the evaluation criteria. Next, the DEMATEL and FCM models are integrated to conduct predictive and diagnostic reasoning analysis based on key indicators. Finally, a case study is conducted to validate the usability and effectiveness of the proposed model and methodology. The results demonstrate that indicators related to organizational management and personnel quality belong to the cause group, while technical measures and emergency resources fall into the effect group. The “completeness of emergency plans” exhibits the most significant influence on other indicators and is also the most influenced indicator by others. Predictive reasoning analysis reveals that well-controlled “emergency organizational structure and procedures” are crucial for enhancing emergency response capacity. Diagnostic reasoning analysis indicates that the improvement of emergency response capability should focus on enhancing the “completeness of emergency plans”. The synergistic effect between “emergency organizational structure and procedures” and “completeness of emergency plans” contributes to the enhancement of emergency response capability in prefabricated construction safety. The study holds both theoretical and practical significance for advancing safety management in prefabricated construction. Considering the dynamic coupling of multiple factors will be the primary direction of research in the field of safety management in the future.

1. Introduction

Compared to traditional construction methods, prefabricated construction involves complex and overlapping processes, resulting in frequent safety accidents [1]. Insufficient emergency response capability often leads to escalated risks and amplified losses [2], making the advancement of emergency response capacity a crucial foundation for engineering project management and its systems [3]. Despite this significance, an effective support system for evaluating emergency response capability in prefabricated construction safety is currently lacking, requiring further research into systematically identifying evaluation indicators, quantifying causal relationships, and conducting dynamic predictive and diagnostic reasoning analyses. Therefore, this study holds paramount importance as it investigates the quantitative assessment and dynamic reasoning of emergency response capability in prefabricated construction safety.
In recent years, numerous scholars have explored construction safety emergency management from various perspectives. Ni et al. (2020) [4] integrated the “capability-time-effectiveness” model to comprehensively evaluate the emergency response effectiveness of construction task scheduling and resource allocation. Cheng et al. (2022) [5] employed DEMATEL and entropy weighting methods to study the emergency response capability in subway tunnel construction. However, these studies often focus on static assessments, overlooking the dynamic nature of construction safety emergency response capabilities. Chen et al. (2017) [6] proposed a dynamic evaluation method for emergency response to rainstorm construction accidents based on system dynamics, but the approach has limitations in handling fuzzy information. Additionally, other studies have explored strategies to enhance construction emergency capabilities from risk identification [7], emergency resource allocation [8], and emergency organizational management [9] perspectives. Overall, these studies provide theoretical support and methodological foundations for improving emergency response capability in prefabricated construction safety, which is crucial for preventing accidents and reducing losses. However, the current research mainly concentrates on static quantitative analysis, overlooking the fuzzy representation of emergency capabilities and the dynamic nature of quantitative assessment. Particularly in the theoretical research and management practices of emergency response capability in prefabricated construction safety, there is a lack of research combining dynamic and static quantitative assessment with dynamic reasoning.
Multicriteria methods are used to address multidimensional decision problems, such as AHP (analytic hierarchy process), TOPSIS (technique for order of preference by similarity to ideal solution), and ELECTRE (elimination and choice translating reality). DEMATEL is chosen because it can help analyze causal relationships between factors, contributing to a more comprehensive understanding of decision problems beyond just weighting and ranking.
With the integration of research methodologies and expanding application scenarios, DEMATEL and FCM have been widely used in quantitative assessment and dynamic reasoning [10]. FCM, as a knowledge and data-driven reasoning method, can describe causal relationships and weights among fuzzy concepts, possessing strong dynamic reasoning capabilities [11]. Kosko (1986) [12] first proposed the FCM model, and since then, it has been extensively applied in fields such as social management [13], energy planning [14], and safety assessment [15]. However, accurately identifying the interrelationships between concepts in FCM poses challenges [16]. DEMATEL, on the other hand, can quantify the interrelationships among complex concepts and has the static assessment capability to accurately identify causal relationships [17]. Fontela et al. (1974) [18] first proposed the DEMATEL method, and since then, it has been widely applied in supply chain management [19], product development [20], innovation evaluation [21], and other fields. These studies have demonstrated the feasibility and rationality of DEMATEL and FCM in static causal assessment and dynamic reasoning of concept relationships, providing theoretical foundations and methodological support for the quantitative assessment and dynamic reasoning research of emergency response capability in prefabricated construction safety.
In essence, this paper explores emergency response capability development in prefabricated construction safety, presenting it as a complex system. We propose a quantitative assessment and dynamic reasoning methodology using DEMATEL-FCM. Grounded theory aids in constructing an emergency capability evaluation system. DEMATEL then uncovers causal relationships within this system. The correlation matrix from DEMATEL evolves into the interaction matrix of the FCM model, enabling dynamic predictive and diagnostic reasoning for key indicators. This reveals emergency capability patterns, offering decision-making insights for enhancing prefabricated construction safety.
The rest of this study is organized as follows: In Section 2, research methods such as DEMATEL and FCM are introduced. In Section 3, the study variables are summarized. In Section 4, an improved model of the DEMATEL-FCM is developed. In Section 5, an empirical analysis is described. In Section 6, a research discussion is initiated. In Section 7, the conclusions, innovations, and limitations of this study are summarized.

2. Methodology

2.1. DEMATEL

DEMATEL is a sophisticated tool developed in the 1970s by the Science and Human Affairs Program of the Battelle Memorial Institute [18]. It aids organizations in comprehending and tackling complex, interconnected issues by revealing the relationships and hierarchies among diverse factors [22].
DEMATEL employs graph theory principles to depict and analyze causality and correlations among these elements [23,24]. This methodology unfolds through four key phases: (1) Factor identification—in the first stage, all potentially influential factors are identified, often through brainstorming or other creative techniques. (2) Direct influence matrix construction—this stage involves developing a matrix to assess and numerically represent the direct influence of each factor on all others. (3) Total influence matrix construction—a subsequent step uses an algorithm based on graph theory to calculate the combined effect of each factor, encompassing both direct and indirect influences. (4) Analysis and interpretation the final phase uses the total influence matrix to determine the relative importance of each factor and their interrelationships.
The advantage of DEMATEL lies in its ability to deal with complex interactions between factors and its use of graphical representation for easy result interpretation. Its limitation, however, is the potential introduction of bias due to reliance on expert subjective evaluations.

2.2. FCM

FCMs offer an advanced methodology for understanding and modeling intricate systems [25]. FCMs center around concepts (or nodes, variables) and relationships (edges, connections). Concepts depict system elements, ranging from tangible to abstract, while relationships illustrate causal links between these concepts, with weights assigned to signify their strength and direction [15].
The FCM process includes the following: (1) Concept identification—the initial stage involves defining and identifying system components. (2) Relationship definition—outlining the causal relationship between concepts. (3) Weight assignment—post relationship definition, weights are assigned to these connections, reflecting their strength and direction; weights, typically subjective, can be derived from expert consultation, literature review, or data analysis. (4) Map construction—constructing a map that encapsulates all concepts and their interconnections. (5) Analysis execution—utilizing the map to analyze the system, which may include evaluating the impact of concept modifications, identifying feedback loops, or predicting future system states.
FCMs provide a robust approach when dealing with systems harboring imprecise or uncertain relationships. They are particularly useful when lacking quantitative data as they rely on subjective judgments or expert opinions. Although FCMs are utilized across numerous fields, like any model, they have limitations, including potential oversimplification of complex systems and a dependency on subjective expert opinion.

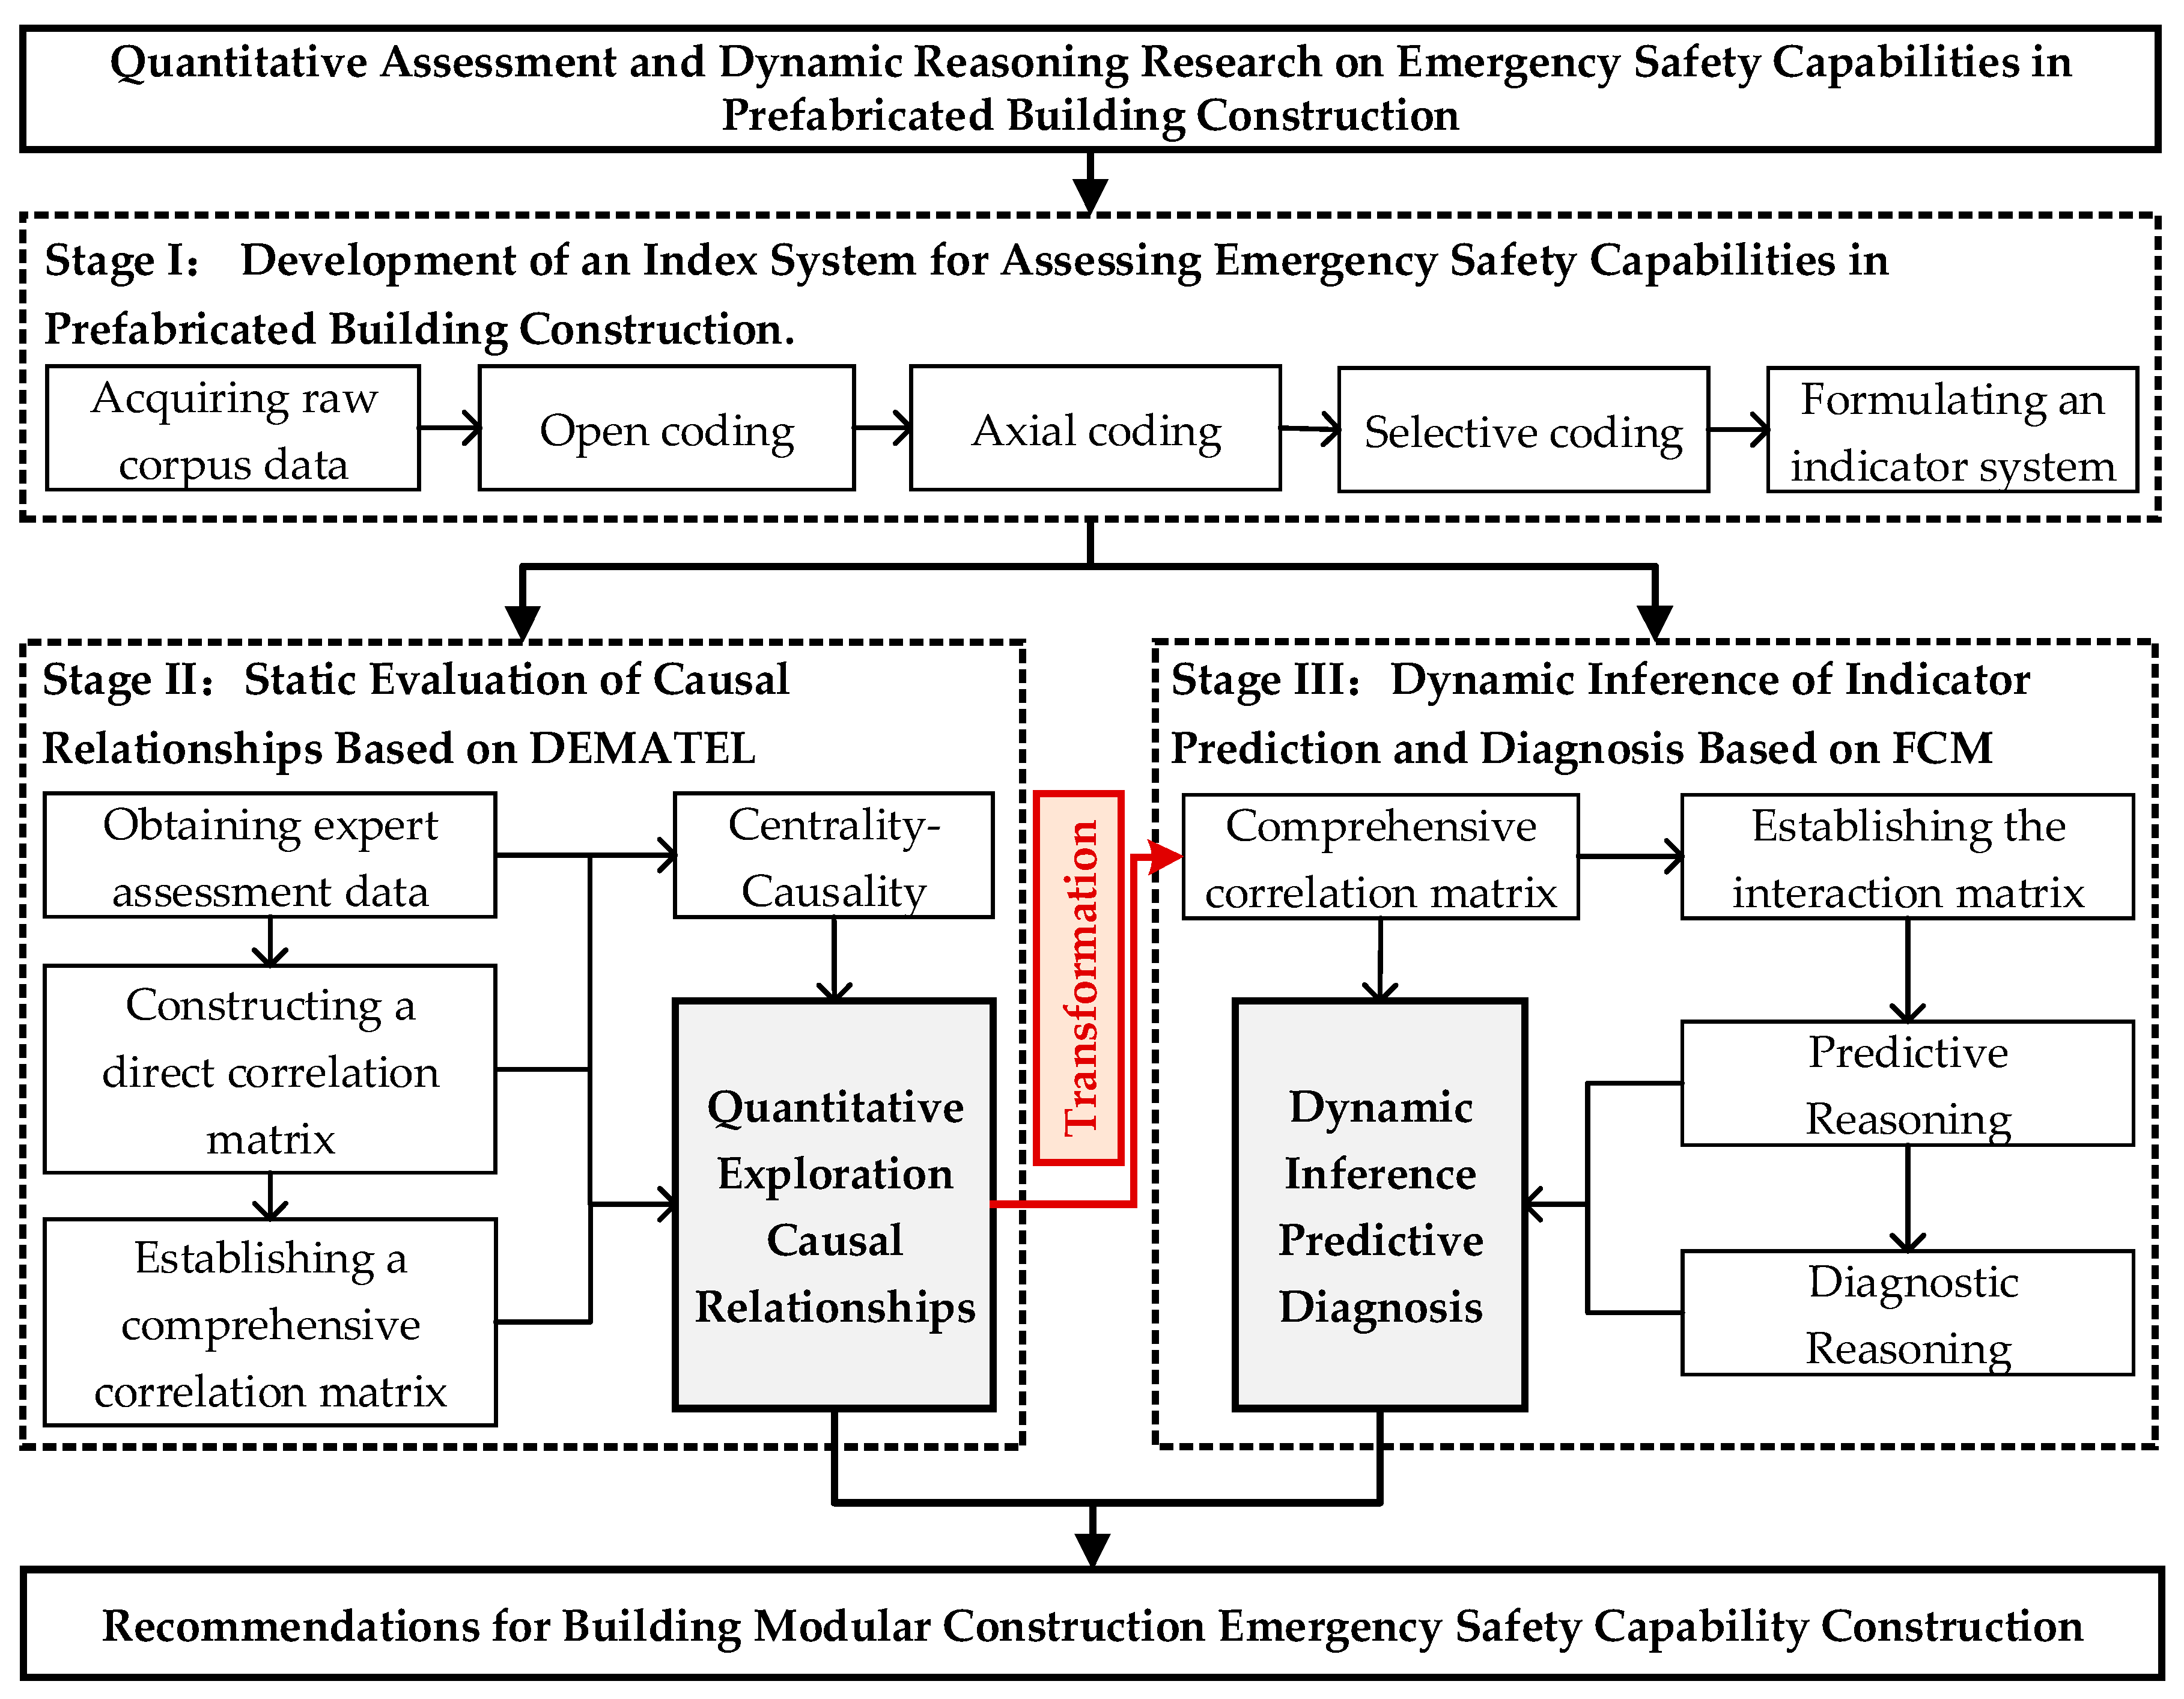
2.3. The Research Framework of the DEMATEL and FCM

The advantages and disadvantages of DEMATEL and FCM are compared, as shown in Table 1. It can be observed that the DEMATEL method provides an accurate base model and initial parameters for the FCM model, reducing errors in the empirical tuning of the FCM model. The dynamic inference of the FCM model, capable of handling uncertain information, compensates for the limitations of DEMATEL in accurately reflecting real-world situations. The combination of DEMATEL and FCM offers advantages such as leveraging the strengths of both methods, mitigating the shortcomings of a single approach, and improving decision accuracy and efficiency.
To address the common issues of the lack of a quantitative assessment system and insufficient dynamic interpretation of emergency preparedness in modular construction safety, a comprehensive assessment method combining DEMATEL and FCM is proposed, as illustrated in Figure 1. Firstly, a safety emergency preparedness assessment index system for modular construction is established through a three-tiered coding analysis using grounded theory. Then, DEMATEL is utilized to quantify the centrality and causality of the assessment indicators, thereby examining the static relationships among them. Finally, the comprehensive association matrix from DEMATEL is transformed into an interaction matrix for the FCM model. This enables dynamic analysis, prediction, and diagnostic reasoning of key indicators, leading to management recommendations for emergency preparedness based on the integrated assessment results.

3. Research Variables

To establish a comprehensive indicator system for evaluating emergency response capability in prefabricated construction safety, this study collected a total of 295 pieces of primary data through literature analysis, policy compilation, and research interviews. In the literature analysis phase, the advanced search method was employed using the following query: ((TI=(prefabricated building OR off-site construction buildings OR PB) AND TS=(construction safety* OR construction risk* OR safety assessment* OR risk assessment* OR risk control* OR safety control*) AND TS=(emergency response capability* OR emergency assessment*)) AND Language:(English)) for a search conducted up to 5 April 2023, with a time span from 2013 to 2023. Among the search results, 100 articles and 7 reviews were retrieved, totaling 107 relevant documents. A selection of 9 highly cited articles was made. Nine relevant articles on emergency management in prefabricated construction safety were compiled from databases such as the Web of Science, resulting in 50 pieces of primary data (these 9 articles are from the reference list of this paper). The policy compilation phase focused on gathering materials, including the “Construction Law of the People’s Republic of China”, “Work Safety Law of the People’s Republic of China”, “Regulations on Safety Production of Construction Projects in the People’s Republic of China”, and “Technical Code for Construction Safety of Assembled Building”, resulting in 72 pieces of primary data from 12 sources. During the research interviews, conducted from October 2022 to May 2023, a total of 20 experts and scholars from various fields were interviewed, including government safety supervision and management departments, China Construction Third Engineering Bureau Co., Ltd., China Construction Third Engineering Bureau Group Co., Ltd., Hainan Branch, China Merchants Sanya Deep Sea Science and Technology City Development Co., Ltd., Hubei Green Intelligent Building Engineering Technology Research Center, Wuhan University of Technology. These interviews yielded 173 pieces of primary data.

3.1. Open Coding

The 295 pieces of primary data were subjected to open coding analysis, and initial concepts were formed through the process of “Primary Data—Open Coding—Labeling”. After categorization and comparison, initial concepts with frequencies lower than four were excluded. The coding process of the 93 resulting labels from open coding is shown in Table 2. The labels from literature analysis, policy compilation, and research interviews are prefixed with KI (e.g., KI111, KI112, etc.), KII (e.g., KII111, KII112, etc.), and KIII (e.g., KIII111, KIII112, etc.), respectively. For instance, “ KI111” indicates that the data source is from literature analysis, and it represents the first labeled concept derived from the primary data of the first literature source.

3.2. Axial Coding

The process of “Open Coding—Axial Coding” was used to achieve the “Labeling—Conceptualization—Categorization” of the primary data. Firstly, based on the frequency of label occurrence, a further refinement of the initial attributes of the 93 labels was carried out to achieve conceptualization through open coding. Next, the conceptualized labels from open coding were synthesized and organized. Based on the inherent logic of “Labeling—Conceptualization” in open coding, 20 initial categories for the emergency response capability in prefabricated construction safety were formed through axial coding. An illustrative example of the axial coding process is presented in Table 3.

3.3. Selective Coding

The process of selective coding was applied to the 20 initial categories, resulting in the identification of 16 main categories ( X 1 to X 16 ). Similar expressions within conceptually related categories were summarized and merged to refine the evaluation indicators’ core categories. This led to the formation of four core categories, namely, organizational management ( Z 1 ), personnel quality ( Z 2 ), technical measures ( Z 3 ), and emergency resources ( Z 4 ). Based on this foundation, a saturation test was conducted on the indicator system, ultimately resulting in the establishment of the assessment indicator system for emergency response capability in prefabricated construction safety, as shown in Table 4.

4. Model Development

To address the common issues of lacking a comprehensive quantitative assessment system and insufficient dynamic understanding of emergency response capability in prefabricated construction safety, a research framework for integrated quantitative assessment and dynamic reasoning based on DEMATEL and FCM is proposed. Firstly, using grounded theory and three levels of coding approach, the assessment indicator system for emergency response capability in prefabricated construction safety is established. Next, DEMATEL is utilized to quantify the centrality and causality of the assessment indicators, thus analyzing the static relationships of causal interactions among the indicators. Finally, the comprehensive correlation matrix derived from DEMATEL is transformed into the interaction matrix of the FCM model, enabling dynamic simulations for predictive and diagnostic reasoning of key indicators. Based on the results of the integrated assessment, management strategies and recommendations for enhancing emergency response capability can be formulated.

4.1. Quantifying Interrelationships Using DEMATEL Method

Experts from the relevant field were invited to assess the indicator system, and the DEMATEL method was employed to quantify the direct association matrix, indirect association matrix, and comprehensive association matrix of the evaluation indicators. The causality between emergency response capability assessment indicators in prefabricated construction safety was analyzed through centrality and causality measures involving the following five steps:
(1) M experts were invited to assess the direct positive relationships between evaluation indicators X i and X j (i, j = 1, 2,…, 16) using a Likert 5-point scale (0 = not important at all, 1 = not important, 2 = no impact, 3 = important, and 4 = very important). The assessment results of the m expert were represented as F m = f i j 16 × 16 , and the direct association matrix of the emergency response capability assessment indicators was synthesized using the arithmetic mean method, resulting in matrix   T = t i j 16 × 16 . The calculation formula for t i j was as follows:
t i j = 1 M m = 1 M f i j i , j 1,2 , , 16 ; m 1,2 , , M
(2) Normalize the direct association matrix T = t i j 16 × 16 to obtain the normalized direct association matrix G = g i j 16 × 16 . Based on the absorbing principle of Markov chains, establish the indirect association matrix Y = y i j 16 × 16 for the evaluation indicators. The formulas for calculating g i j and Y are shown in Equations (2) and (3), respectively:
g i j = T m i n 1 m a x i i = 1 16 t i j , 1 m a x j j = 1 16 t i j   i , j 1,2 , , 16
Y = y i j 16 × 16 = lim t G + G 2 + + G t = lim t I G t I G = G I G 1   i , j 1,2 , , 16
(3) Create the comprehensive association matrix Q = q i j 16 × 16 . By summing Equations (2) and (3), calculate the values of q i j for the emergency response capability assessment indicators. The formula for q i j is given by the following:
q i j = g i j + y i j   i , j 1,2 , , 16
(4) Calculate the influence value (Oi) and the affected value (Pi) for each emergency response capability assessment indicator X i . By summing the row elements and column elements in the comprehensive association matrix Q = q i j 16 × 16 , obtain O i and P i , respectively. The formulas for calculating O i and P i are shown in Equations (5) and (6):
O i = i = 1 16 q i j 16 × 1   i 1,2 , , 16
P i = i = 1 16 q i j 1 × 16   i 1,2 , , 16
(5) Compute the centrality value ( W i ) and the causality value ( R i ) for each emergency response capability assessment indicator X i . According to the DEMATEL principle, W i indicates the position and importance of indicator X i in the evaluation indicator system X 1 ~ X 16 . A larger W i value for X i implies greater importance. Ri distinguishes the assessment indicators into causal factors and result factors, with R i ≥ 0 indicating a causal factor and R i < 0 indicating a result factor. The formulas for calculating W i and R i are given by Equations (7) and (8), respectively:
W i = O i + P i   i 1,2 , , 16
R i = O i P i   i 1,2 , , 16

4.2. Predictive and Diagnostic Reasoning Using the FCM Model

Integrating the DEMATEL method with the FCM model, predictive and diagnostic reasoning analysis of key indicators and emergency response capability is conducted. This process involves the following five steps:
(1) Set the maximum percentage of centrality ω (0 < ω ≤ 1) to calculate the centrality threshold ξ for selecting key indicators. A larger value of ω indicates a higher centrality threshold, resulting in fewer selected key indicators. If S key indicators are obtained, retain the rows and columns corresponding to the key indicators X i (i = 1, 2,…, S) from the comprehensive association matrix Q = q i j 16 × 16 generated by DEMATEL, and resequence the S key indicators as C i (i = 1, 2,…, S, S ≤ 16). This will yield a comprehensive association matrix of key indicators C = c i j S × S . The formula for calculating the centrality threshold ξ is given by the following:
  ξ = ω max W i   i 1,2 , , 16
(2) To investigate the interaction between key indicators and emergency response capability, the key indicators C i (i = 1, 2,…, S) and their comprehensive association matrix C = c i j S × S are used as the basis. The quantified factor C T is introduced to establish the interaction matrix C = c i j S + 1 × S + 1 for the FCM model. Concept node definition based on the FCM model, C i is referred to as the cause node, and C T is referred to as the result node. The correlation weights when C i affects C T , C T affects C i , and C T affects C T are represented by c i , S + 1 , c S + 1 , j , and c S + 1 , S + 1 , respectively. The formulas for calculating c i , S + 1 , c S + 1 , j , and c S + 1 , S + 1 are given by Equations (10)–(12), respectively:
c i , S + 1 = j = 1 S c i , j i , j = 1 S c i , j = c i . i × 1 i , j = 1 S c i , j   i , j 1,2 , , S
c S + 1 , j = i = 1 S c i , j i , j = 1 S c i , j = c . j 1 × j i , j = 1 S c i , j   i , j 1,2 , , S
c S + 1 , S + 1 = 1 S × S i , j = 1 S c i , j   i , j 1,2 , , S
(3) In the FCM model, the initial state matrix for cause nodes C i (i = 1, 2,…, S) and the result node C T is denoted as A i 0 = A 1 0 , A 2 0 , , A S 0 , A S + 1 0 . Through iterative transformation using the threshold function, when A i t + 1 = A i t , it indicates that the model has reached a stable state. The expression for the inference transformation function is given by the following:
A i t + 1 = f A i t + j = 1 , j i S + 1 c j , i A j t   i , j 1,2 , , S
where A i t + 1 represents the value of indicator C i at time t + 1 ; t is the iteration count; A i t and A j t represent the status values of concept nodes C i and C j , respectively, at the t iteration; c j , i denotes the correlation weight of concept node C j affecting C i ; and f · represents the threshold function.
(4) The FCM model ensures that the concept node values are within an interval during the iterative process using the threshold function f x   to maintain simulation randomness. The threshold function f · is represented as follows:
f x = tanh x = e x e x e x + e x
(5) The reasoning analysis of the FCM model includes predictive reasoning and diagnostic reasoning. Predictive reasoning is conducted from cause nodes to the result node, aiming to predict future results of the result node C T based on current evidence from cause nodes C i (i = 1, 2,…, S). Diagnostic reasoning is conducted from the result node to cause nodes, aiming to explore possible causes of cause nodes C i (i = 1, 2,…, S) based on the known status of the result node C T .

5. Case Study

5.1. Empirical Cases

In Wuhan City, a prefabricated construction project with a total floor area of 112,500 square meters is being undertaken. The residential building area is 97,500 square meters, and the commercial area is 15,000 square meters, with a plot ratio of 2.58. The project has an overall assembly rate of 85%, and the construction schedule is tight with complex and overlapping processes. During the construction process, the project team faces various safety risks, including the construction risks associated with high-rise buildings, the quality of prefabricated components, and on-site coordination.
To address these challenges and mitigate unforeseen accidents, a plan is implemented to collect on-site engineering data and focus on the construction safety emergency response capability. A practical and optimized construction safety emergency response system will be developed to enhance the emergency management level at the construction site, ensuring the smooth progress of the project.

5.2. Data Collection and Preprocessing

Twenty domain experts with at least 10 years of experience in management and research related to prefabricated construction were invited, including four government officials, eleven industry professionals, and five experts from academic institutions. The experts used a uniform Likert 5-point scale to rate the questionnaire. The data collection process took nearly 3 months, resulting in a total of 15 valid questionnaires with an effective response rate of 75%. The statistical results of the years of service and unit distribution of domain experts are shown in Table 5.
Using IBM SPSS Statistics 26.0 software for consistency testing, the Cronbach reliability coefficient was 0.923 > 0.8. The single measurement in the intraclass correlation coefficient is 0.918 > 0.75, and the average measurement is 0.902 > 0.75, both of which are significant levels, indicating that the survey data can provide data support for the model construction and empirical analysis of this research. Due to space constraints, we present an example of the rating results for X 1 with respect to X 1 ~ X 16 in Table 6.

6. Results and Discussion

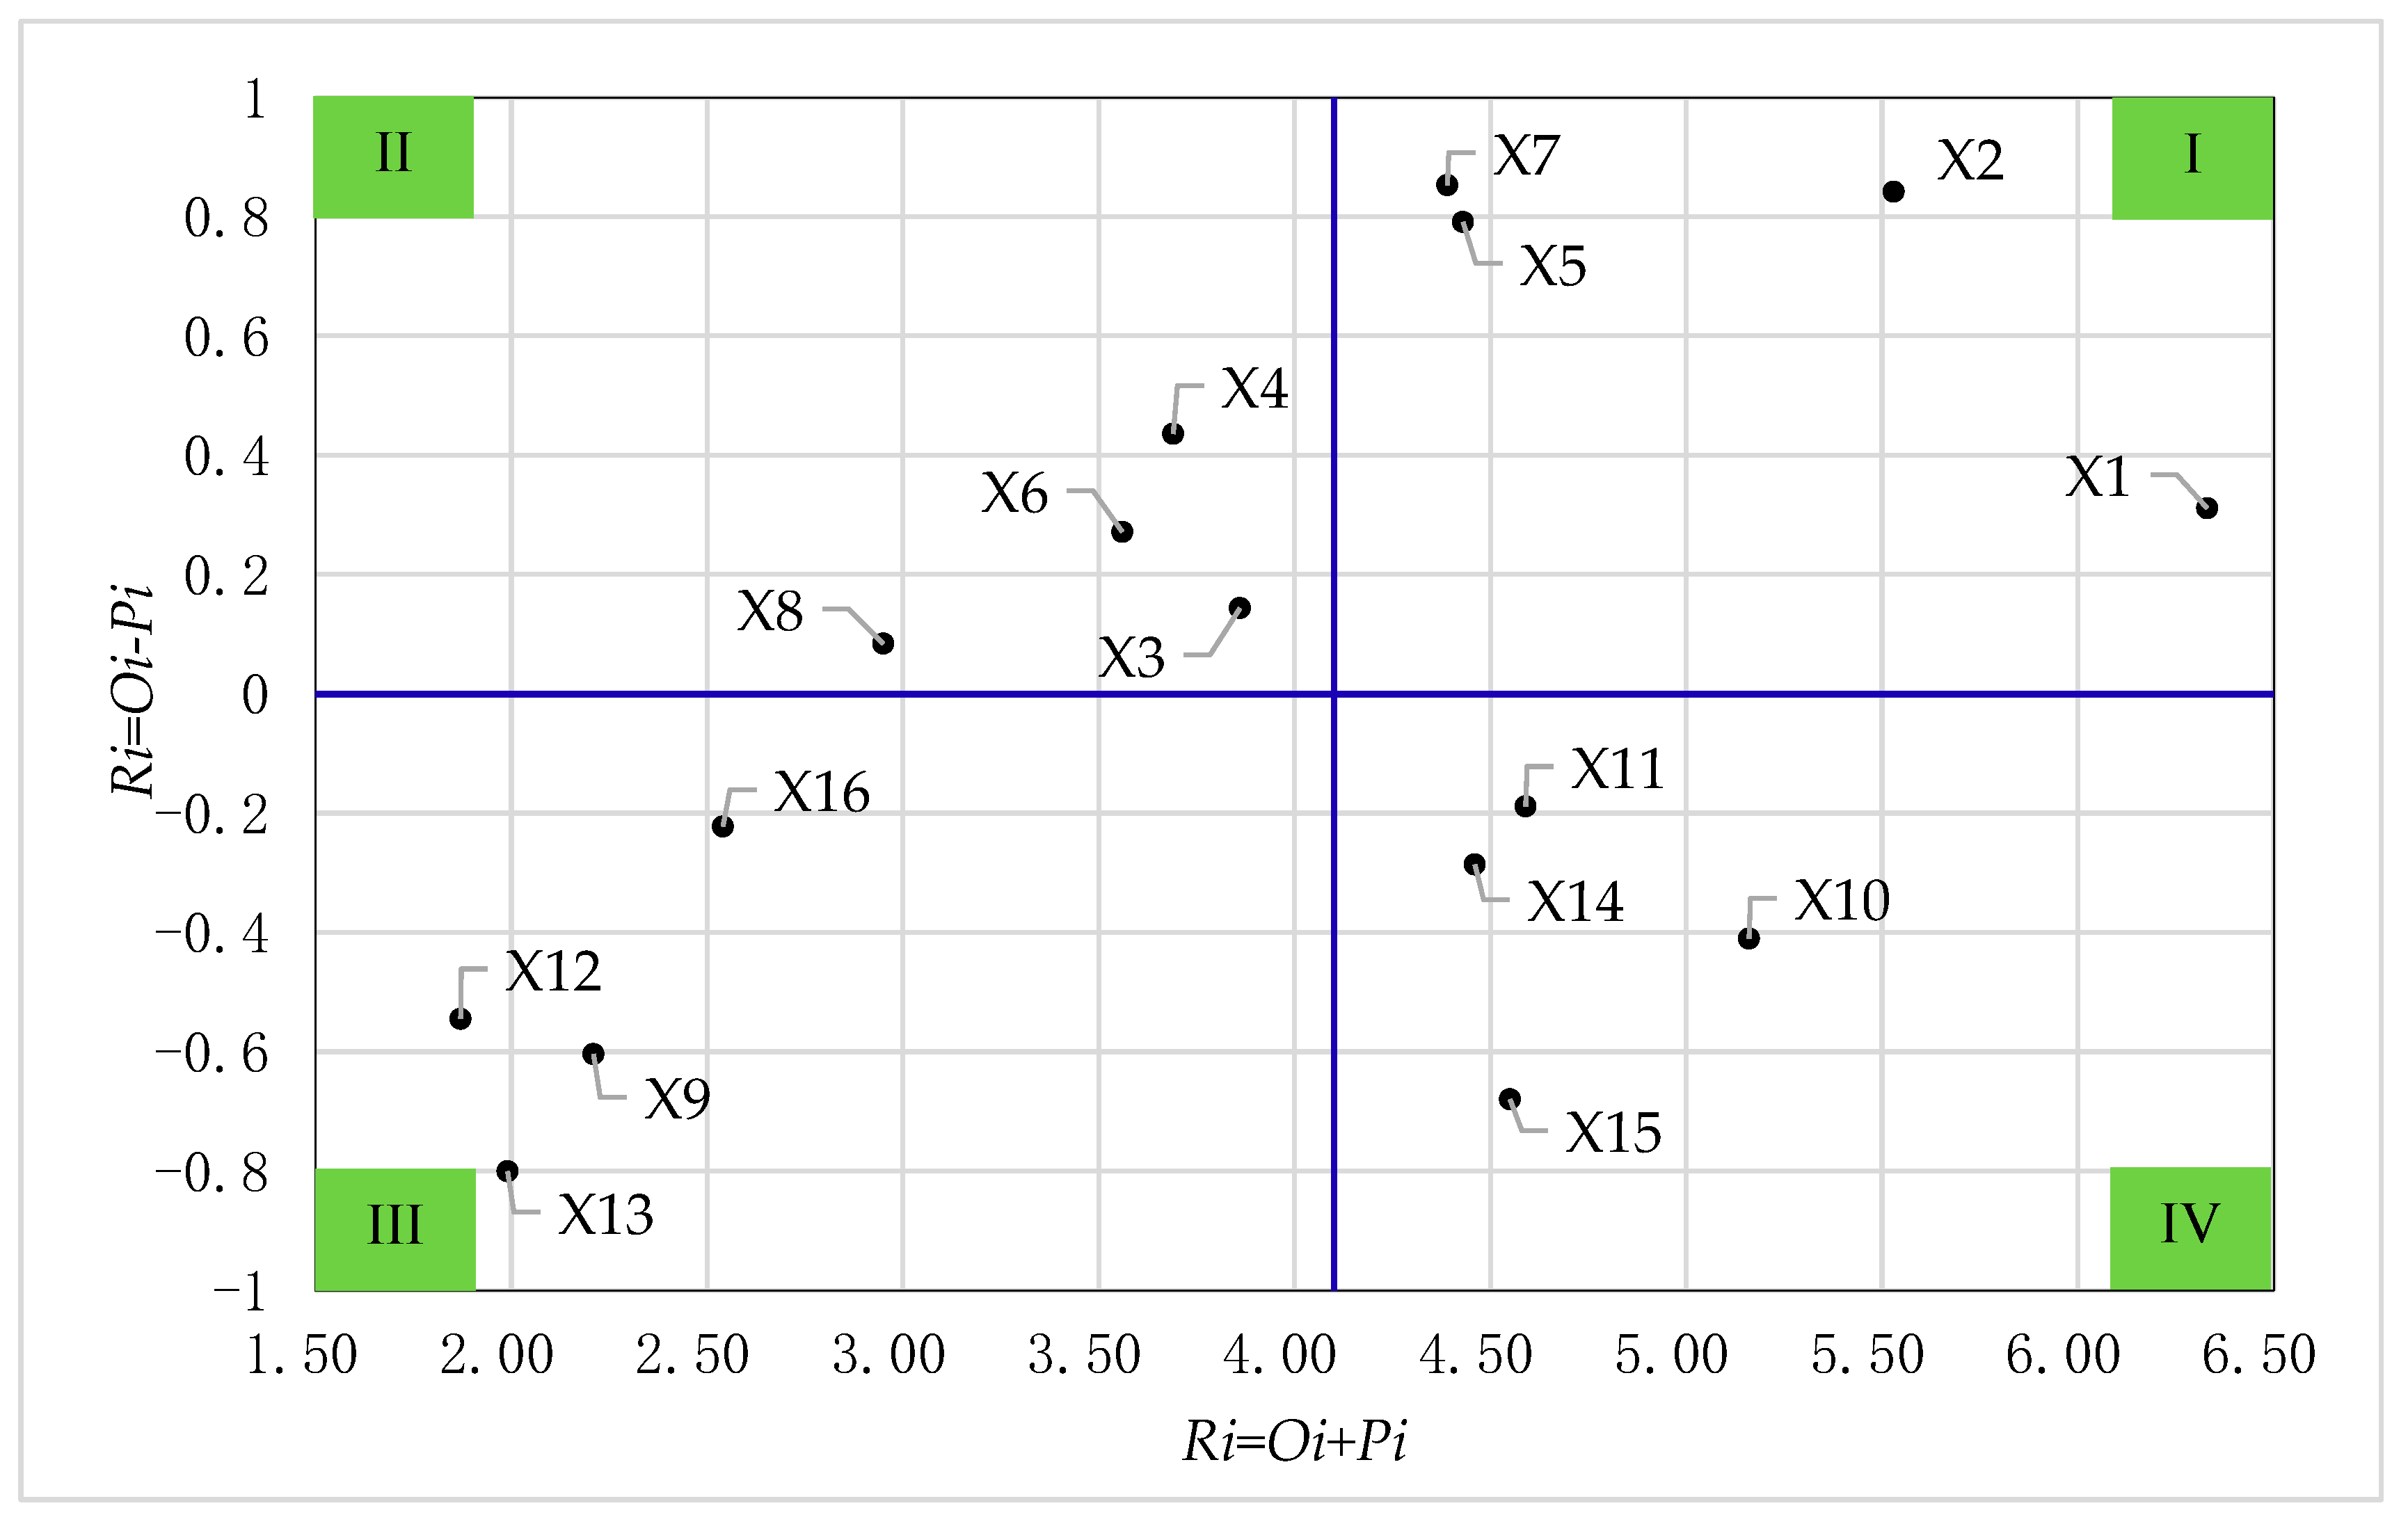
6.1. Static Evaluation of Causal Relationships

Using Equation (1), the average values of the correlation strength between indicator X i and X j (i, j = 1, 2,…, 16) were calculated based on the 15 valid questionnaires, resulting in the direct correlation matrix T = t i j 16 × 16 . The normalization process was performed on T = t i j 16 × 16 using Equation (2), resulting in the normalized matrix G = g i j 16 × 16 . Then, according to Equation (3), the indirect correlation matrix Y = y i j 16 × 16 was constructed. By applying the computation rule q i j from Equation (4), the comprehensive correlation matrix Q = q i j 16 × 16 for the evaluation indicators was established, as shown in Table 7.
Based on the comprehensive correlation matrix Q = q i j 16 × 16 from Table 7, the impact degree values ( O i ), affected degree values ( P i ), centrality values ( W i ), and causality values ( R i ) of the evaluation indicators X 1 ~ X 16 for the safety emergency response capability in modular construction were computed using Equations (5)–(8). The results are presented in Table 8.
Based on the analysis from Table 8, it is evident that in terms of impact degree, indicator X 1 (completeness of emergency plans) exhibits the highest impact, indicating that X 1 is more likely to trigger and influence other construction safety emergency response evaluation indicators. Following that, indicators X 2 (emergency organizational structure and procedures) and X 7 (emergency response experience) rank next in impact degree. Regarding the affected degree, X 1 (completeness of emergency plans), X 10 (emergency technical level), and X 15 (emergency rescue capacity) rank as the top three, indicating that they are more susceptible to the influence of other construction safety emergency response evaluation indicators.
Based on this, a four-quadrant causality diagram was plotted using the central line of centrality (average of the maximum and minimum centrality values W i = 4.10 ) and the differentiation boundary of causality ( R i = 0.00 ), as shown in Figure 2.
Based on the analysis from Figure 2, it is evident that quadrants I and II belong to the cause factor group, while quadrants III and IV belong to the result factor group. In the cause factor group, X 1 to X 4 of Z 1 (organizational management) and X 5 to X 8 of Z 2 (personnel qualification) are classified into quadrants I and II. In the result factor group, X 9 to X 12 of Z 3 (technical measures) and X 13 to X 16 of Z 4 (emergency resources) are classified into quadrants III and IV. Within quadrants I and II, X 1 (completeness of emergency plans) has the highest centrality value of 6.3329, followed by X 2 (emergency organizational structure and procedures), X 5 (emergency training level), and X 7 (emergency response experience). Within quadrants III and IV, X 10 (emergency technical level) has the highest centrality value of 5.1609, followed by X 11 (emergency response efficiency), X 15 (emergency rescue capacity), and X 14 (emergency communication system).
Considering the static analysis of the causality relationship in both Figure 2 and Table 8, the indicators X 1 , X 2 , X 10 , X 11 , X 15 , X 14 , X 5 , and X 7 rank as the top eight in centrality. These indicators should be given priority attention in the construction of the emergency response capacity for prefabricated building construction safety. Among them, X 1 , X 2 , X 5 ,   and X 7 are located in quadrant I, belonging to cause factors with “high centrality and high causality” characteristics. They not only have a significant impact on other indicators but are also strongly influenced by other indicators, making them highly important. On the other hand, X 10 , X 11 , X 15 , and X 14 are in quadrant IV, belonging to result factors with “high centrality and low causality” characteristics. Although they have a low impact on other indicators, they are greatly influenced by other indicators, making them important in the construction of the emergency response capacity for prefabricated building construction safety as well.

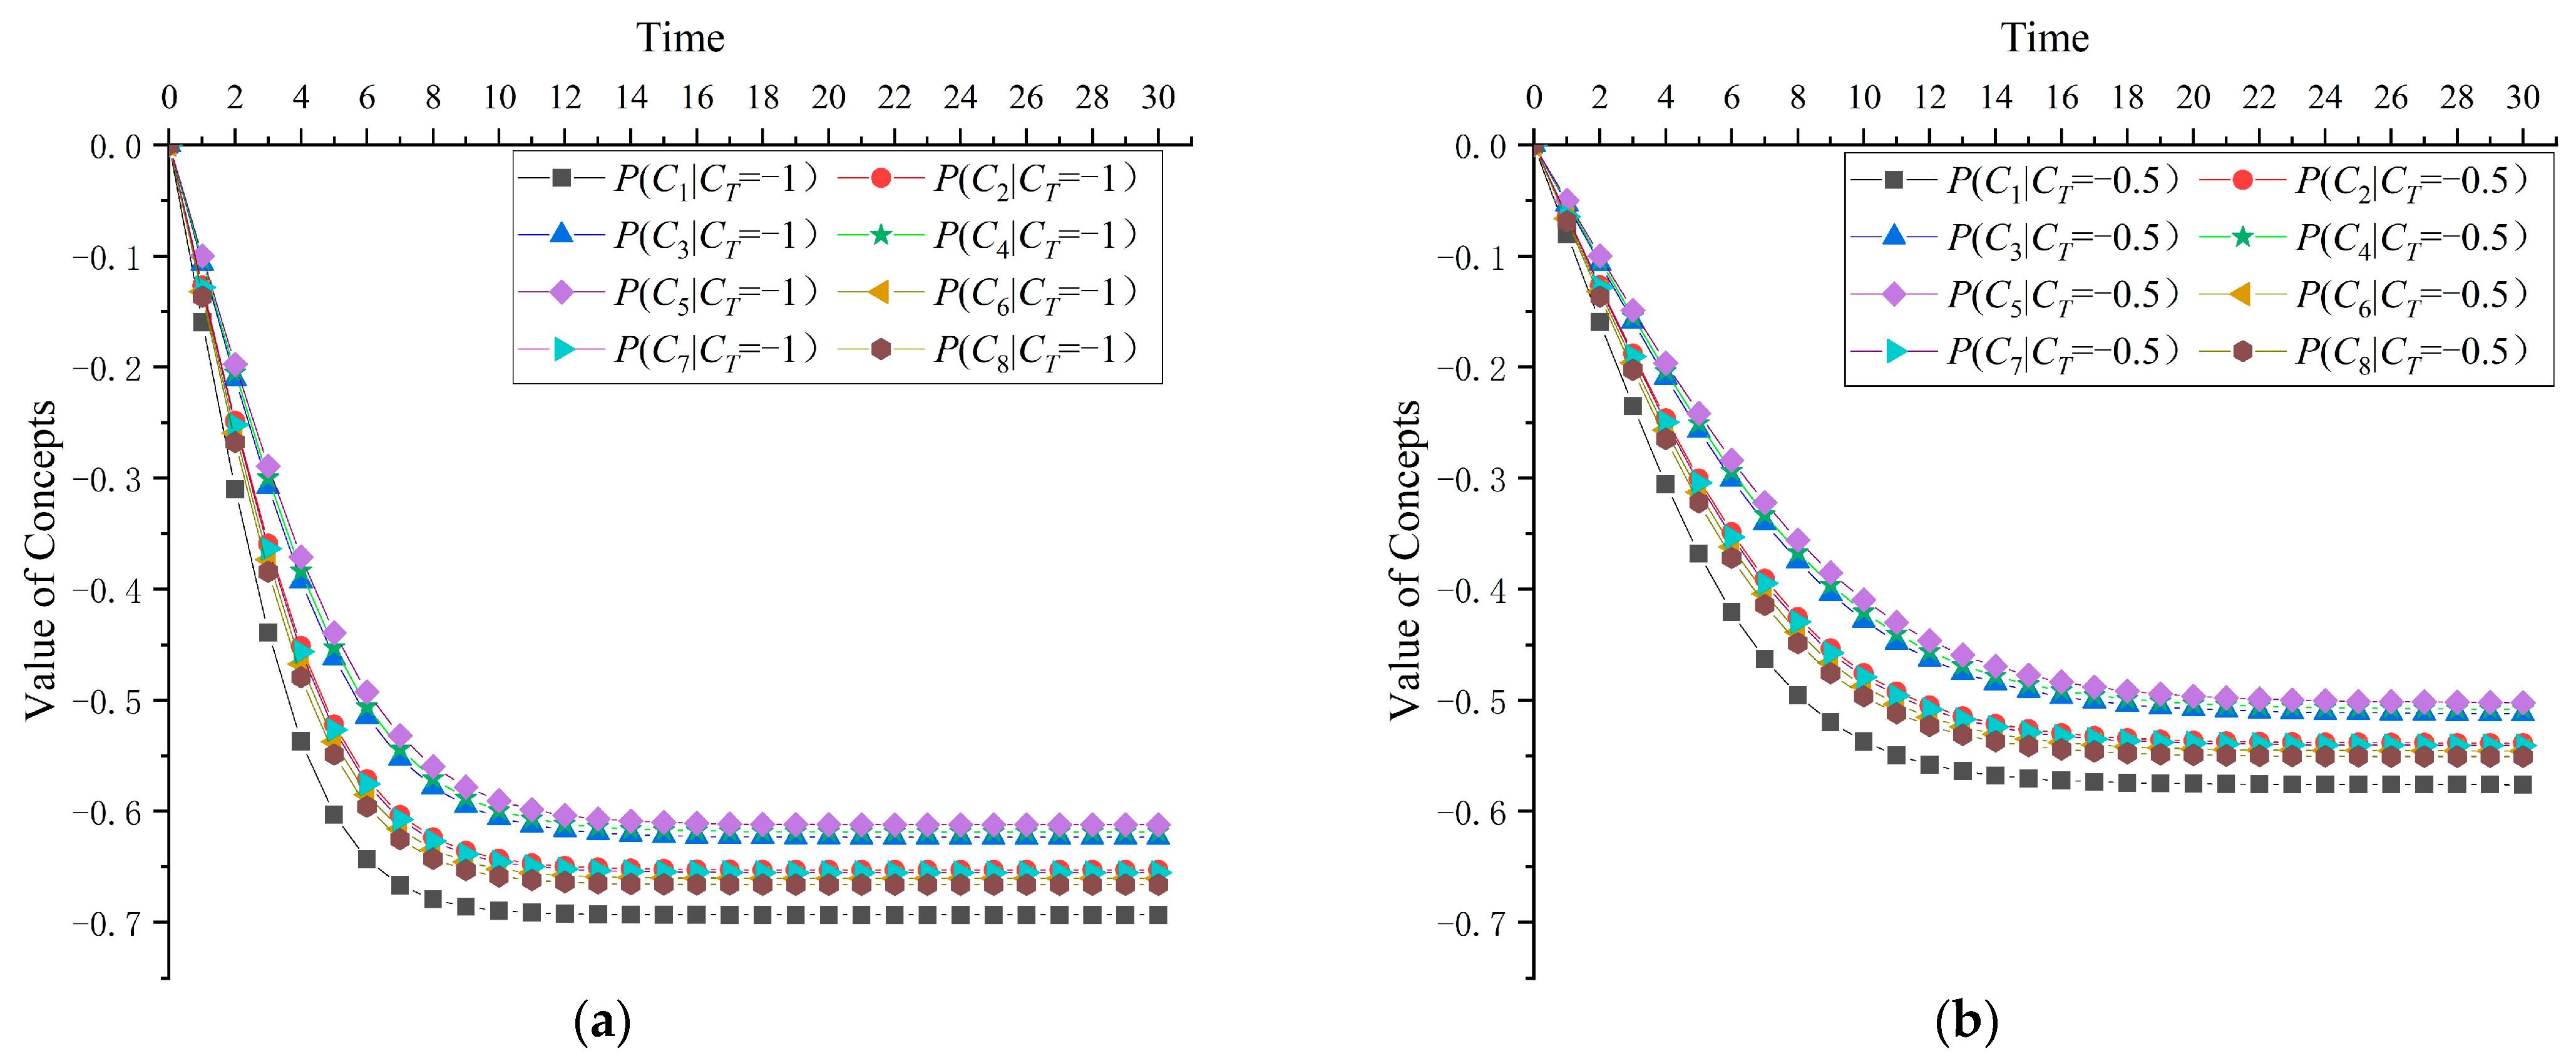
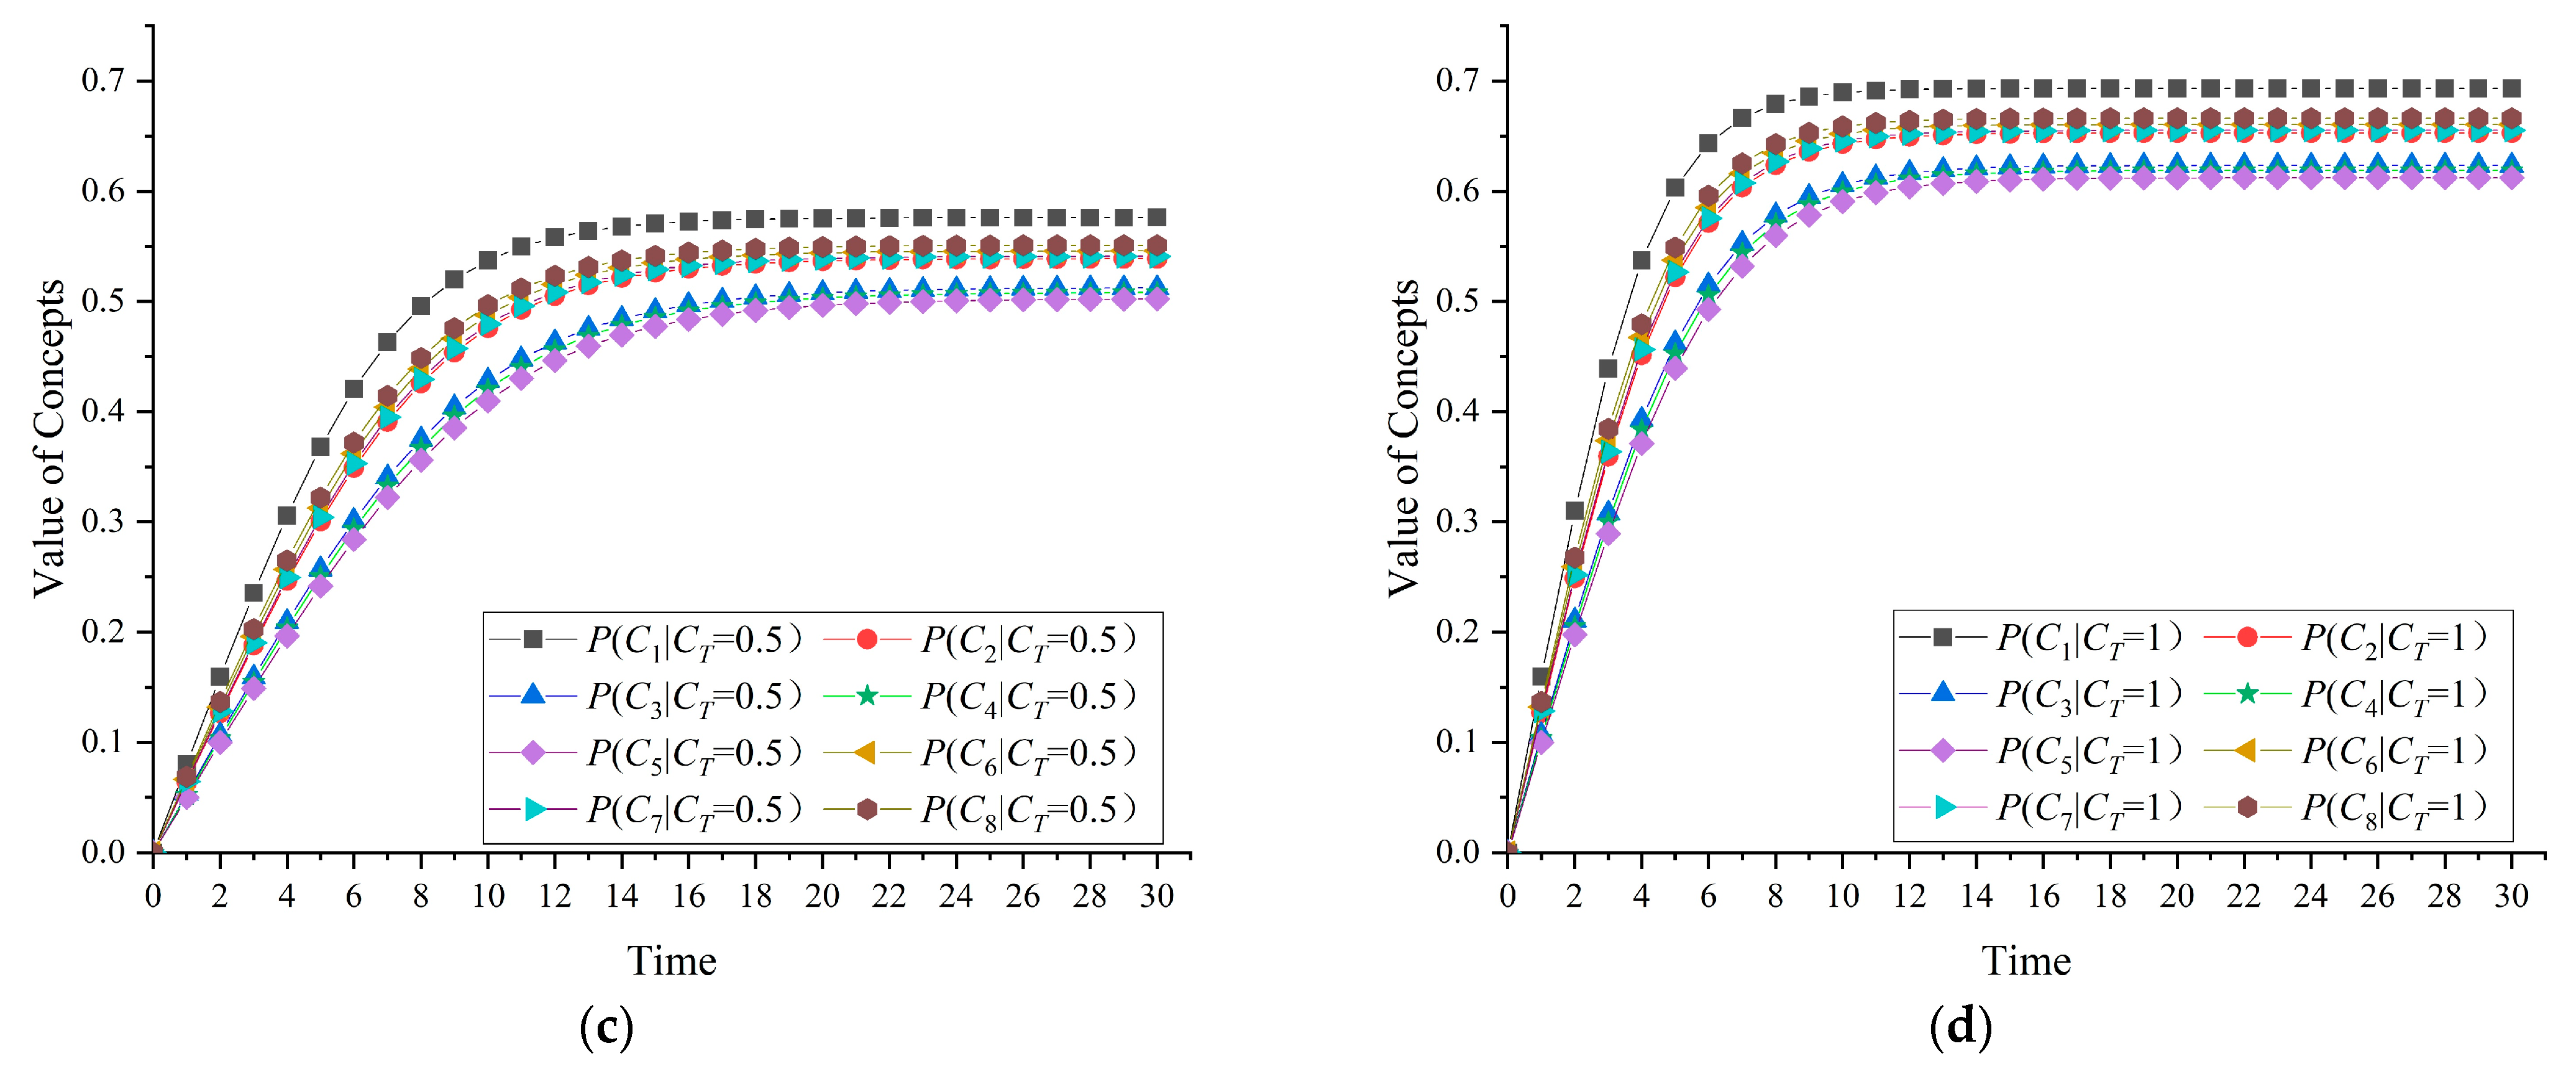
6.2. Dynamic Inference of Indicator Prediction and Diagnosis

Based on expert consultation, we set ω = 0.65 . Using Equation (9), we calculate   ξ = 4.1164 and identify the top eight W i rankings from Table 7 as the key indicators, resequenced as C 1 (completeness of emergency plans), C 2 (emergency organizational structure and procedures), C 3 (emergency training level), C 4 (emergency response experience), C 5 (emergency technical level), C 6 (emergency response efficiency), C 7 (emergency communication system), and C 8 (emergency rescue capacity). Retaining the rows and columns corresponding to the key indicators from Table 7, we obtain the comprehensive association matrix of key indicators as C = c i j 8 × 8 . We introduce the emergency capacity quantification factor C T and establish the interaction matrix of FCM model C = c i j 9 × 9 f according to Equations (10)–(12), as shown in Table 9.
Taking C 1 and C T from Table 9 as an example, we calculate the value of C 1 acting on C T using Equation (10) as c 1,9 = c 1 . / c i . = 1.7486 / 11.2666 = 0.1552 . Here, c 1 . = c 1,1 + c 1,2 + + c 1,8 = 1.7486 , c i . = c 1 . + c 2 . + + c 8 . = 11.2666 . Using Equation (11), we calculate the value of C T acting on C 1 as c 9,1 = c . 1 / c . j = 1.8135 / 11.2666 = 0.1610 . Additionally, utilizing Equation (12), we calculate the value of C T acting on itself as c 9,9 = c i j / 64 = 0.1760 . Similarly, we can perform similar calculations for other cases.
(1)
Predictive Reasoning Analysis
In FCM predictive reasoning analysis, the cause nodes are denoted as C i (i = 1, 2,…, 8), and the result node is C T . Equation (14) for the threshold function is applied to Equation (13) to perform iterations and transformations, quantitatively predicting the impact of each key indicator Ci on the quantified factor C T . To simplify the study, C i is taken as a 5-point linguistic variable (−1 = very unfavorable, −0.5 = unfavorable, 0 = neutral, 0.5 = favorable, and 1 = very favorable). Taking C 1 (emergency organization structure) as an example, in the predictive reasoning of C1 and C T , the initial state of the cause node C 1 takes values of “−1, −0.5, 0, 0.5, 1”, while the initial state values of other cause nodes C i (i = 1, 2,…, 8) and the result node CT are all set to 0, resulting in an initial state matrix A i ( 0 ) = ( ±1/±0.5,0,0,0,0, 0,0,0,0). When the FCM model runs to the t iteration, if A i t = A i t 1 , it indicates that the model has reached a stable state. The results of the predictive reasoning analysis for C i (i = 1, 2,…, 8) and C T are shown in Table 10.
In the FCM predictive reasoning analysis, the iteration trend curves under different scenarios are simulated 30 times, as shown in Figure 3.
Combining Table 10 with Figure 3a analysis, taking the cause node C 1 as an example, when C 1 takes a value of −1 (or −0.5), the stable value of C T is −0.6869 (or −0.5701); when C 1 takes a value of 1 (or 0.5), the stable value of C T is 0.6869 (or 0.5701). This indicates a positive correlation between C 1 and C T . Similarly, there is a positive correlation between other cause nodes C i (i = 2, 3,…, 8) and C T . Additionally, by comparing the stable values and slope of the curves of C T under different scenarios, it is found that the correlation between C 2 and C T is the strongest. In descending order of strength, the correlations are as follows: C 2 (emergency organization and procedures), C 1 (emergency plan completeness), C 5 (emergency technical level), C 4 (emergency response experience), C 3 (emergency training level), C 6 (emergency response efficiency), C 7 (emergency communication system), and C 8 (emergency rescue force). The dynamic analysis of predictive reasoning shows that effective control and continuous optimization of C 2 is crucial for emergency capability construction.
(2)
Diagnostic Reasoning Analysis
In the FCM diagnostic reasoning analysis, the cause nodes are C i (i = 2, 3,…, 8), and the result node is C T . The threshold function (Equation (14)) is applied to the iteration and transformation process (Equation (13)) to quantitatively diagnose the most likely key indicators C i causing changes in the quantitative factor C T . To simplify the study, C T is represented using five linguistic variables (−1 = very unfavorable, −0.5 = unfavorable, 0 = neutral, 0.5 = favorable, and 1 = very favorable). When conducting the diagnostic reasoning for C T and C i , the initial states of the result node C T are set to “−1, −0.5, 0, 0.5, 1”, and the initial states of the cause nodes C i (i = 2, 3,…, 8) are all set to 0. The initial state matrix is A i ( 0 ) = ( 0, 0,0,0,0,0,0,0,±1/±0.5). When the FCM model runs to the t iteration, if A i t = A i t 1 , it indicates that the model has reached a stable state. The results of C T and C i (i = 1, 2,…, 8) diagnostic reasoning analysis are shown in Table 11.
In the FCM diagnostic reasoning analysis, the iterative trend curves under different scenarios are simulated 30 times, as shown in Figure 4.
Based on the analysis of Table 11 and Figure 4a, considering the result node C T = −1 as an example, the stable values of P ( C i | C T = 1 ) (i = 1, 2,…, 8) are −0.6933, −0.6528, −0.6235, −0.6188, −0.6123, −0.6604, −0.6551, and −0.6661. This indicates a positive correlation between C T and C i , which aligns with the results of the predictive reasoning analysis. Additionally, by combining Table 11 with Figure 4b–d and comparing the stable values and slope of the curves for the reason nodes C i (i = 1, 2,…, 8) under different scenarios ( C T = −0.5, 0.5, 1), it is observed that C T exhibits the strongest correlation with C 1 . In descending order, the correlation strength is observed as follows: C 1 (completeness of emergency plans), C 8 (emergency rescue capability), C 6 (emergency response efficiency), C 7 (emergency communication system), C 2 (emergency organizational structure and procedures), C 3 (emergency training level), C 4 (emergency handling experience), and C 5 (emergency technical level). The dynamic analysis of diagnostic reasoning indicates the need to focus on “the completeness of emergency plans” during the development of safety emergency capabilities in prefabricated construction projects.

6.3. Management Strategies and Recommendations

(1)
Organizational management: Establish a dedicated emergency management department and enhance communication and collaboration among various departments. Develop comprehensive emergency plans based on the challenges and safety risks of prefabricated projects. Clearly define emergency response procedures and establish a robust emergency management oversight mechanism.
(2)
Personnel qualifications: Conduct regular emergency training and educational activities to enhance the emergency awareness and skills of construction site personnel. Strengthen team collaboration capabilities and clarify emergency positions and responsibilities. Through training and practical exercises, improve the emergency response and crisis management abilities of dedicated personnel.
(3)
Technical measures: Establish a robust emergency communication system to ensure rapid and accurate information dissemination during emergencies. Utilize advanced monitoring and warning technologies to build emergency resource management systems, warning systems, and emergency decision support systems. These systems will enable real-time monitoring and early warning of safety conditions and risks on the construction site.
(4)
Emergency resources: Establish and strengthen emergency rescue forces to enhance response speed and capabilities. Adequately allocate emergency equipment and tools to effectively respond to various unexpected incidents on the construction site. Set up emergency resource reserves and support mechanisms to share and enhance comprehensive emergency capabilities.

7. Conclusions

Through literature analysis, policy compilation, and research interviews, a total of 295 pieces of original data were obtained. Using the three levels of coding procedure of grounded theory, a comprehensive set of 16 main categories ( X 1 to X 16 ) and 4 core categories ( Z 1 to Z 4 ) was developed for the assessment of emergency response capabilities in prefabricated construction.
Static causal analysis based on DEMATEL, the indicator X 1 (completeness of emergency plans) has the highest impact on other indicators and is also most influenced by them. The top eight indicators in terms of centrality are X 1 (completeness of emergency plans), X 2 (emergency organization and procedures), X 10 (emergency technological level), X 11 (emergency response efficiency), X 15 (emergency rescue force), X 14 (emergency communication system), X 5 (emergency training level), and X 7 (emergency handling experience). These indicators fall into quadrants I and IV, suggesting that they should be prioritized in the construction of emergency response capabilities for prefabricated construction.
Prediction and diagnosis of dynamic inference index based on FCM, the prediction analysis indicates that controlling C 2 (emergency organization and procedures) is crucial for enhancing emergency response capabilities. The diagnosis analysis highlights the importance of focusing on C 1 (completeness of emergency plans) in the construction of emergency response capabilities for prefabricated construction. By combining the results of prediction and diagnosis analyses, it is recommended to fully utilize the organizational management role of C 1 and C 2 , thereby synergistically improving the emergency response capabilities of prefabricated construction.
DEMATEL-FCM combines causal relationship analysis and fuzzy logic, enabling decision-makers to have a more comprehensive understanding of causal relationships within systems and make wiser decisions. This helps improve the quality and efficiency of decision-making, thereby positively impacting decision-making in various fields such as prefabricated construction safety, supply chain management, financial risk analysis, and more.
It should be noted that in the prediction analysis of the FCM model, this study only considers the interaction between individual key indicators and the quantified emergency response factor. It does not explore the combined effects of multiple key indicators or fully reflect the integrated application of emergency response capacity development strategies. Future research will attempt to investigate the synergistic changes in multiple key indicators in prediction inference and introduce cost management mechanisms for implementing combined strategies to achieve the optimal enhancement of emergency response capabilities in prefabricated construction under rational resource allocation.

Author Contributions

Conceptualization, S.T., K.Z. and P.G.; Methodology, K.Z. and P.G.; Software, K.Z. and P.G.; Validation, K.Z. and P.G.; Formal analysis, K.Z. and P.G.; Investigation, K.Z. and P.G.; Resources, K.Z. and P.G.; Data curation, K.Z. and P.G.; Writing—original draft, K.Z. and P.G.; Writing—review & editing, K.Z. and P.G.; Visualization, S.T., K.Z. and P.G.; Supervision, S.T. and K.Z.; Project administration, S.T.; Funding acquisition, S.T. All authors have read and agreed to the published version of the manuscript.

Funding

This research was funded by Hainan Province Major Science and Technology Plan Project, grant number ZDKJ2021024, The PhD Scientific Research and Innovation Foundation of Sanya Yazhou Bay Science and Technology City, grant number HSPHDSRF-2022-03-001, The PhD Scientific Research and Innovation Foundation of Sanya Yazhou Bay Science and Technology City, grant number HSPHDSRF-2023-03-010, The PhD Scientific Research and Innovation Foundation of Sanya Yazhou Bay Science and Technology City, grant number HSPHDSRF-2023-03-001.

Data Availability Statement

The sample data is derived from research interviews conducted by our research team, and due to confidentiality reasons, the data cannot be disclosed.

Conflicts of Interest

The authors declare no conflict of interest.

References

  1. Wang, Q.; Zhu, K.; Guo, P.; Guo, Z.; Zhang, B. Construction safety risk assessment of prefabricated building based on interaction matrix fuzzy cognitive map. J. Saf. Environ. 2023, 23, 2202–2211. [Google Scholar]
  2. Arashpour, M.; Abbasi, B.; Arashpour, M.; Hosseini, M.R.; Yang, R. Integrated management of on-site, coordination and off-site uncertainty: Theorizing risk analysis within a hybrid project setting. Int. J. Proj. Manag. 2017, 35, 647–655. [Google Scholar] [CrossRef]
  3. Xu, X.; Zou, P.X.W. Discovery of new safety knowledge from mining large injury dataset in construction. Saf. Sci. 2021, 144, 105481. [Google Scholar] [CrossRef]
  4. Ni, H.; Yao, X.; Chu, Y.; Shi, B. A pre evaluation model for emergency response effectiveness integrating “capability timeliness decision”. China Saf. Sci. J. 2020, 30, 148–156. [Google Scholar] [CrossRef]
  5. Cheng, J.; Yang, X.; Wang, H.; Li, H.; Lin, X.; Guo, Y. Evaluation of the emergency capability of subway shield construction based on cloud model. Sustainability 2022, 14, 13309. [Google Scholar] [CrossRef]
  6. Chen, W.; Qiao, Z.; Wang, W.; Zhang, K.; Niu, L.; Deng, C. SD model for emergency disposal of construction safety accident caused by rainstorm disaster. China Saf. Sci. J. 2017, 27, 169–174. [Google Scholar] [CrossRef]
  7. Luo, Z.; Guo, J.; Han, J.; Wang, Y. Research on the construction safety risk assessment of prefabricated subway stations in China. Eng. Constr. Archit. Manag. 2022. [Google Scholar] [CrossRef]
  8. Rakhi Vijayakumar, J.-H.C. Emerging trends of ergonomic risk assessment in construction safety management: A scientometric visualization analysis. Int. J. Environ. Res. Public Health 2022, 19, 16120. [Google Scholar] [CrossRef]
  9. Lima, C.B.D.C.; Aranha, P.E.; Castro, J.F.T.D.; Lima, G.B.A.; Hougaz, A.B.; Terra, F.D.S. Integrated risk management: A Petrobras application in offshore well construction safety to minimize critical emergency disconnections. Pet. Sci. 2018, 15, 421–431. [Google Scholar] [CrossRef]
  10. Wang, Q.; Zhu, K.; Wang, J.; Guo, P.; Shen, W. Bibliometric analysis of engineering project risk management literature. China Saf. Sci. J. 2021, 31, 15–23. [Google Scholar] [CrossRef]
  11. Nozari, M.A.; Ghadikolaei, A.S.; Govindan, K.; Akbari, V. Analysis of the sharing economy effect on sustainability in the transportation sector using fuzzy cognitive mapping. J. Clean. Prod. 2021, 311, 127331. [Google Scholar] [CrossRef]
  12. Kosko, B. Fuzzy cognitive maps. Int. J. Man. Mach. Stud. 1986, 24, 65–75. [Google Scholar] [CrossRef]
  13. Genc, T.O.; Ekici, A. A new lens to the understanding and reduction of household food waste: A fuzzy cognitive map approach. Sustain. Prod. Consum. 2022, 33, 389–411. [Google Scholar] [CrossRef]
  14. Ghaboulian Zare, S.; Alipour, M.; Hafezi, M.; Stewart, R.A.; Rahman, A. Examining wind energy deployment pathways in complex macro-economic and political settings using a fuzzy cognitive map-based method. Energy 2022, 238, 121673. [Google Scholar] [CrossRef]
  15. Wang, L.; Liu, Q.; Dong, S.; Soares, C. Effectiveness assessment of ship navigation safety countermeasures using fuzzy cognitive maps. Saf. Sci. 2019, 117, 352–364. [Google Scholar] [CrossRef]
  16. Bas, E. An integrated OSH risk management approach to surgical flow disruptions in operating rooms. Saf. Sci. 2018, 109, 281–293. [Google Scholar] [CrossRef]
  17. Kuzu, A.C. Application of fuzzy DEMATEL approach in maritime transportation: A risk analysis of anchor loss. Ocean. Eng. 2023, 273, 113786. [Google Scholar] [CrossRef]
  18. Fontela, E.; Gabus, A. DEMATEL: Progress achieved. Futures 1974, 6, 361–363. [Google Scholar] [CrossRef]
  19. Bai, C.; Sarkis, J.; Dou, Y. Constructing a process model for low-carbon supply chain cooperation practices based on the DEMATEL and the NK model. Supply Chain. Manag. 2017, 22, 237–257. [Google Scholar] [CrossRef]
  20. Singh, P.K.; Sarkar, P. A framework based on fuzzy Delphi and DEMATEL for sustainable product development: A case of Indian automotive industry. J. Clean. Prod. 2020, 246, 118991. [Google Scholar] [CrossRef]
  21. Feng, C.; Ma, R. Identification of the factors that influence service innovation in manufacturing enterprises by using the fuzzy DEMATEL method. J. Clean. Prod. 2020, 253, 120002. [Google Scholar] [CrossRef]
  22. Khatun, M.; Wagner, F.; Jung, R.; Glaß, M. An application of DEMATEL and fuzzy DEMATEL to evaluate the interaction of safety management system and cybersecurity management system in automated vehicles. Eng. Appl. Artif. Intell. 2023, 124, 106566. [Google Scholar] [CrossRef]
  23. Du, Y.; Shen, X. Group hierarchical DEMATEL method for reaching consensus. Comput. Ind. Eng. 2023, 175, 108842. [Google Scholar] [CrossRef]
  24. Du, Y.; Li, X. Hierarchical DEMATEL method for complex systems. Expert Syst. Appl. 2021, 167, 113871. [Google Scholar] [CrossRef]
  25. Kosko, B. Hidden patterns in combined and adaptive knowledge networks. Int. J. Approx. Reason. 1988, 2, 377–393. [Google Scholar] [CrossRef]
Figure 1. Research framework based on DEMATEL and FCM.
Buildings 13 02311 g001
Figure 2. Causal relationship diagram of emergency response capability assessment indices.
Buildings 13 02311 g002
Figure 3. Iteration curve of predictive inference based on cause nodes. (a) Predictive inference based on C 1 . (b) Predictive inference based on C 2 . (c) Predictive inference based on C 3 . (d) Predictive inference based on C 4 . (e) Predictive inference based on C 5 . (f) Predictive inference based on C 6 . (g) Predictive inference based on C 7 . (h) Predictive inference based on C 8 .
Buildings 13 02311 g003aBuildings 13 02311 g003b
Figure 4. Iteration curve of diagnostic inference based on result nodes. (a) Diagnostic inference based on C T = 1 . (b) Diagnostic inference based on C T = 0.5 . (c) Diagnostic inference based on C T = 0.5 . (d) Diagnostic inference based on C T = 1 .
Buildings 13 02311 g004aBuildings 13 02311 g004b
Table 1. Comparison Analysis of DEMATEL and FCM.
MethodAdvantagesDisadvantagesSimilaritiesCombining
DEMATEL1. Reduced the composition of system elements and simplified the relationships between elements.
2. Quantified causal relationships, providing high credibility and reliability in decision-making and assessment.
3. Graphically intuitive and easy to understand, assisting analysts in better comprehending causal relationships and making decisions.
1. Relies on experts’ experience and knowledge to address complex issues.
2. May not accurately reflect real-world situations when dealing with uncertain problems.
3. Overlapping causal relationships can occur, leading to less precise outcomes.
1. Both can be used to deal with complex systems and uncertain information.
2. Both have graphical features, allowing for an intuitive representation of causal relationships and decision processes.
3. Both exhibit high flexibility and strong adaptability, making them applicable in various domains and scenarios
1. The DEMATEL method provides accurate basic models and initial parameters for the FCM model, reducing the error of empirical parameter tuning in the FCM model.
2. The dynamic reasoning of the FCM model can handle uncertain information, making up for the shortcomings of the DEMATEL method in accurately reflecting the actual situation.
FCM1. Representing and analyzing causal relationships in complex systems.
2. Handling uncertainty and incomplete information.
3. Quantifying different scenarios and requirements by adjusting model weights.
1. The FCM algorithm has a slow convergence rate and requires significant computational resources.
2. Parameter selection and adjustment in the FCM model often rely on trial and error and empirical knowledge.
3. FCM results may be influenced by various fuzzy logic operation methods, thus requiring improvement in result stability and repeatability.
Table 2. Process of open coding in the original corpus.
Data SourceExcerpts from Original StatementsOpen Coding—Labeling
Literature ReviewLiterature 1…qualifications, skills, and experience, safety awareness and responsibilities, supervision plans and allocation of responsibilities, safety supervision inspections and records, safety education, training, and assessment, participation in safety plans, reasonableness of construction schemes, safety management systems and regulations…KI111: Qualifications, skills, and experience
KI112: Safety awareness and responsibility
KI113: Safety education
KI114: Reasonableness of construction schemes
KI115: Safety management system
Literature 2…analyze the basic pattern of emergency response… action objectives, action modules, emergency resources… utilizing time-effectiveness assessment, broad priority relationships, organizational structure… combining to form an integrated “capability-time-effectiveness-decision” emergency response effectiveness pre-assessment model…KI211: Basic modes of emergency response
KI212: Action objectives
KI213: Action modules
KI214: Emergency resources
KI215: Pre-evaluation model for emergency response effectiveness
………………
Policy CompilationPolicy 1The People’s Republic of China Building Law: …prepare safety technical measures plan… it is necessary to strengthen safety production publicity, education, and training, and enhance the safety skills and emergency response capabilities of employees…KII111: Safety technical measures
KII112: Safety production publicity, education, and training
KII113: Safety skills and emergency response capabilities
Policy 2The People’s Republic of China Regulation on Safety Production in Construction Projects: …safety production measures and emergency rescue plans… taking into account the characteristics of different projects and the influence of different construction environments… adopting different safety production measures and emergency rescue measures…KII211: Safety production measures
KII212: Emergency rescue plans
KII213: Engineering characteristics and different environments
KII214: Emergency rescue measures
………………
Expert InterviewsExpert 1…establishing an effective inter-departmental coordination mechanism is crucial for enhancing emergency response capabilities… actively introducing modern technological means to promptly identify safety hazards and violations… the psychological state of personnel is equally important when responding to safety accidents… raising public awareness of safety and self-protection abilities… formulating relevant emergency measures tailored to the construction environment…KIII111: Coordinating mechanism
KIII112: Modern technological means
KIII113: Psychological state of personnel
KIII114: Public safety awareness and self-protection ability
KIII115: Formulating relevant emergency measures for the construction environment
Expert 2…including safety training for all participants… emergency plans are essential… high-quality safety equipment and facilities are crucial for preventing and responding to safety accidents… regular safety drills and assessments are also highly important… a sound safety management system…KIII211: Safety training
KIII212: Emergency plan
KIII213: Safety equipment and facilities
KIII214: Safety drills and evaluations
KIII215: Safety management system
………………
Table 3. Process of implementing axial coding from open coding labels.
Open Coding—LabelingOpen Coding—ConceptualizationAxial Coding—Categorization
KI113 Safety Education
KI114 Rationality of Construction Plan
KI115 Safety Management System
H1 Emergency Plan SystemX1 (Degree of Emergency Plan Adequacy)
KI211 Basic Model of Emergency Response
KI215 Pre-Evaluation Model for Emergency Response Effectiveness
H2 Emergency Plan Procedures
KII111 Safety Technical Measures
KII211 Safety Production Measures
KII214 Emergency Rescue Measures
H3 Emergency Plan Measures
………………
Table 4. Assessment index system for emergency response capability in prefabricated building construction safety.
Core CategoryMain CategoryAbbreviation
Organizational Management ( Z 1 )Emergency Plan Completeness X 1
Emergency Organizational Structure and Procedures X 2
Emergency Coordination Capability X 3
Frequency of Emergency Drills X 4
Personnel Quality ( Z 2 )Level of Emergency Training X 5
Safety Awareness and Occupational Skills X 6
Emergency Response Experience X 7
Team Collaboration Ability X 8
Technical Measures ( Z 3 )Adequacy of Emergency Facilities X 9
Emergency Technological Level X 10
Emergency Response Efficiency X 11
Completeness of Information Systems X 12
Emergency Resources ( Z 4 )Emergency Equipment and Material Reserves X 13
Emergency Communication System X 14
Emergency Rescue Capability X 15
External Support and Collaboration Ability X 16
Table 5. Distribution of field experts by years of work experience and unit type.
Years of Service
(Years)
Owner Unit (Person)Design Unit (Person)Supervision Unit (Person)Construction Unit (Person)Government Department (Person)University (Person)
10 ≤ Years < 15111121
15 ≤ Years < 20111112
20 ≤ Years101112
Total323345
Table 6. Scoring results of emergency response capability assessment index X 1 for X 1 ~ X 16 .
Experts
X 1
X 2
X 3
X 4
X 5
X 6
X 7
X 8
X 9
X 10
X 11
X 12
X 13
X 14
X 15
X 16
10432423344444444
20442233344443344
30442233344443344
40432333433434434
50332334433434434
60332334434434434
70432334434333344
80432334434343344
90322434334443444
100322434344443444
110322434343444444
120432434343434443
130432433343434443
140432423343424444
150432423344424444
Table 7. Comprehensive correlation matrix of emergency response capability assessment indices.
Q16 × 16 X 1 X 2 X 3 X 4 X 5 X 6 X 7 X 8 X 9 X 10 X 11 X 12 X 13 X 14 X 15 X 16
X 1 0.13310.24200.19500.14920.20910.17950.21160.19090.20100.26020.25090.18310.19950.24690.26000.2102
X 2 0.28190.10160.19650.11060.22950.14830.22780.14060.17830.27250.25360.17060.17650.25460.26500.1774
X 3 0.20130.21930.05580.08610.13160.08700.12990.08300.08390.15720.22290.03970.08250.18510.15250.0828
X 4 0.20360.18430.09630.04920.17190.12740.17050.08530.04560.15890.22540.03890.12140.14840.15420.0825
X 5 0.26090.20040.14680.13640.06950.17560.21920.13300.09370.21550.20390.08600.16800.20160.20960.0924
X 6 0.15960.14160.13040.08430.16680.04650.16540.11940.08040.15270.18260.03560.04050.18150.14780.0784
X 7 0.26400.24120.22410.17440.18770.14110.07180.17280.13390.25390.21070.05040.05780.16980.21170.0572
X 8 0.14040.08790.07840.07360.11630.11280.07740.03230.07050.13480.16620.06670.06990.12780.13190.0316
X 9 0.11130.06620.06070.05680.02180.01950.02150.01740.01840.10880.02930.01810.01890.10510.10710.0204
X 10 0.24890.19060.13880.12980.10080.16880.13580.12580.08800.09090.19380.12020.12430.19300.19990.1262
X 11 0.24290.14860.13410.16380.13420.12830.09550.12260.12250.19840.07550.07980.08510.18860.19400.0856
X 12 0.10460.06130.01870.05350.01930.05560.01910.01540.01520.10270.02480.01500.01530.02400.10190.0171
X 13 0.10230.05930.01690.05220.01720.01550.01700.01380.01400.10050.02230.01430.01450.02160.09970.0160
X 14 0.23680.14390.12990.12300.09040.08640.08940.08050.11900.23080.14470.11580.11930.06820.18920.1210
X 15 0.19250.13810.12580.08170.12280.08260.08490.07650.11480.18730.13780.14970.07680.13950.06870.1542
X 16 0.12660.11710.10890.10300.03250.06690.03240.02520.02540.16040.04350.02410.02650.11820.12010.0281
Table 8. DEMATEL calculation results of emergency response capability assessment indices.
Index O i O i Rank P i P i Rank W i W i Rank R i Factor Types
X 1 3.322213.010716.332910.3115Causal Factors
X 2 3.185422.343565.528920.8419Causal Factors
X 3 2.000791.857073.857690.1437Causal Factors
X 4 2.064081.6278113.6918100.4362Causal Factors
X 5 2.612541.821584.434170.7910Causal Factors
X 6 1.9135111.6416103.5551110.2719Causal Factors
X 7 2.622431.769494.391880.8530Causal Factors
X 8 1.5186121.4344122.9530120.0842Causal Factors
X 9 0.8012141.4044132.205614−0.6033Resultant Factors
X 10 2.375552.785525.16093−0.4100Resultant Factors
X 11 2.199362.387844.58714−0.1886Resultant Factors
X 12 0.6635151.2081161.871616−0.5446Resultant Factors
X 13 0.5972161.3971141.994315−0.7998Resultant Factors
X 14 2.088272.374054.46226−0.2858Resultant Factors
X 15 1.9338102.613234.54705−0.6794Resultant Factors
X 16 1.1589131.3810152.539913−0.2221Resultant Factors
Table 9. Comprehensive correlation matrix of key indices for emergency response capability assessment.
C′9×9 C 1 C 2 C 3 C 4 C 5 C 6 C 7 C 8 C T
C 1 0.13310.24200.19500.20910.21160.25090.24690.26000.1552
C 2 0.28190.10160.19650.22950.22780.25360.25460.26500.1607
C 3 0.20130.21930.05580.13160.12990.22290.18510.15250.1153
C 4 0.26090.20040.14680.06950.21920.20390.20160.20960.1342
C 5 0.26400.24120.22410.18770.07180.21070.16980.21170.1403
C 6 0.24290.14860.13410.13420.09550.07550.18860.19400.1077
C 7 0.23680.14390.12990.09040.08940.14470.06820.18920.0970
C 8 0.19250.13810.12580.12280.08490.13780.13950.06870.0897
C T 0.16100.12740.10720.10430.10030.13310.12910.13760.1760
Table 10. Stable prediction inference values based on cause nodes.
State C 1 C 2 C 3 C 4 C 5 C 6 C 7 C 8
P ( C T | C i = 1 ) −0.6869−0.6930−0.6357−0.6618−0.6695−0.6243−0.6067−0.5937
P ( C T | C i = 0.5 ) −0.5701−0.5758−0.5232−0.5469−0.5540−0.5127−0.4968−0.4850
P ( C T | C i = 0.5 ) 0.57010.57580.52320.54690.55400.51270.49680.4850
P ( C T | C i = 1 ) 0.68690.69300.63570.66180.66950.62430.60670.5937
Table 11. Stable diagnostic inference values based on result nodes.
State P ( C i | C T = 1 ) P ( C i | C T = 0.5 ) P ( C i | C T = 0.5 ) P ( C i | C T = 1 )
C 1 −0.6933−0.57600.57600.6933
C 2 −0.6528−0.53870.53870.6528
C 3 −0.6235−0.51210.51210.6235
C 4 −0.6188−0.50780.50780.6188
C 5 −0.6123−0.50190.50190.6123
C 6 −0.6604−0.54570.54570.6604
C 7 −0.6551−0.54080.54080.6551
C 8 −0.6661−0.55090.55090.6661
Disclaimer/Publisher’s Note: The statements, opinions and data contained in all publications are solely those of the individual author(s) and contributor(s) and not of MDPI and/or the editor(s). MDPI and/or the editor(s) disclaim responsibility for any injury to people or property resulting from any ideas, methods, instructions or products referred to in the content.

