Article

Textile Membranes Reused as a Tool for Noise Control

1
School of Architecture, Textiles Hub, Polytechnic of Milan, 20133 Milan, Italy
2
Department Architecture Built Environment Construction Engineering, Textiles Hub, Polytechnic of Milan, 20133 Milan, Italy
*
Author to whom correspondence should be addressed.
Buildings 2023, 13(9), 2134; https://doi.org/10.3390/buildings13092134
Submission received: 28 June 2023 / Revised: 6 August 2023 / Accepted: 11 August 2023 / Published: 23 August 2023
(This article belongs to the Special Issue Acoustics and Noise Control in Buildings)

Abstract

:
Textile membranes are an architectural solution used for their maximal lightness, efficiency and adaptability. Unfortunately, once they reach their end-of-life phase, it is difficult to recover them. To be disposed of, they undergo very expensive and often difficult recycling processes. Their reuse as an acoustic treatment and reverberation control system is a solution to creating a light, economical and effective acoustic system that also solves the difficult end-of-life scenario. The membranes take on the role of acoustic diffusers, elements that, through their geometric conformation, can control the behavior of sound. The structure of the system allows the acoustics of the interior spaces to be conditioned through some peculiar characteristics that are influenced, in part, by the material they are made of but above all by their shape. By cutting and joining the membranes, a modular and repeatable element is created, which, in combination with others, enables the creation of an acoustic control device capable of competing with traditional acoustic treatment systems without the use of newly produced materials. The optimized shape of the membranes is the variable responsible for the effective reduction in reverberation times: 2.2 s compared to the initial value of 7.5 without the textile membranes.

1. Introduction

Textile membranes are an excellent alternative architectural solution to the more common building technologies. However, they present a problem: their difficulty in disposal and recycling, which has a negative impact on environmental issues. The aim of this research is to explore a system that enables the reutilization of textile membranes while minimizing costs and resource usage, becoming a resource rather than a waste. Acoustics offers an opportunity to reimagine the membranes as an acoustic instrument capable of managing the sound within a space. Membranes can therefore become a tool for noise control by modifying the sound field in an environment without using additional energy or materials. This research concerns the attempt to reuse abandoned membranes as acoustic diffusers for noise control in large environments. By exploiting and modifying the shape of the membranes, sound, simulated through a ray-tracing process, can be dispersed or concentrated by directing its reflections. The strength of the system is that of using membranes that would otherwise be discarded as the main material, limiting the use of the resources and energy as much as possible. Its cost-effectiveness and respect for the environment make it possible to give an effective and low-cost response to needs, while also being able to compete with traditional acoustic solutions.

2. Research Development

2.1. Physical Membranes Factors

The membrane decommissioning process seems to be an insurmountable problem. The difficult recycling, the harmful and dangerous disposal for the environment and the very limited reuse opportunities limit the research radius for improving the end-of-life phase of the textile membranes [1]. Acoustics tries to find a solution to deal with the problem. This research concerns the attempt to reuse abandoned membranes as acoustic diffusers for noise control in large environments. The membranes are suspended with a hooking system that allows for the adjustment of the heights of the surfaces, modifying the angle of incidence of the sound waves and diffusing and redirecting them into the environment. The height and, consequently, the curvature of the edges of the fabric change the overall geometry. With suitable solutions, the discarded membranes, as a second use, can be transformed into surfaces that control sound reflections, such as adjustable acoustic diffusers, as shown in Figure 1.
Comparing the reused membrane diffuser with the currently most widespread systems is useful for understanding the potential of this technology. The membranes are designed to fit into acoustic correction systems, those installed after the construction of a building with the aim of remedying acoustic problems that arose in the advanced design phase or even after the completion of the construction. It means thinking of a system that integrates as much as possible but that does not interfere with the activities carried out within it. This is a complex operation that the designer must take into strong consideration, especially since the membranes are reused elements and therefore not specifically designed for this environment [2]. The visible textile system may not be aesthetically suitable for environments with high requirements for design integration. On the other hand, the membranes have very interesting characteristics that could encourage their experimentation and their architectural integration.
The membranes’ materials vary and could change according to the design requirements [3]. They have different physical characteristics and, to be reused, physical factors as well as aesthetic factors must be considered [4]. Indeed, the membranes are composed of various materials and different layers, which give a different weight, density and resistance according to the required needs. These specifications can influence the acoustic performance of the membranes, especially in sound absorption. The higher the sound absorption index of the fabric is, the greater the reverberation time reduction performance obtained. The sound absorption coefficient of a material varies according to its density and porosity. In general, membranes, including those suitable for reuse, have a relatively low average sound absorption coefficient, which is around 0.2, as shown in Table 1 and found in other studies dedicated to the measurements of technical textile proprieties [5].
Another very important parameter to consider is the weight of the membranes [7]. The membrane relies on its own shape to reflect and diffuse sound so the fabric must resist sound waves. With some theoretical simplifications, the following is stated: if the weight of the membrane is high, then the energy of the sound waves passes with difficulty through the fabric and most of it is reflected. In other words, the higher the weight of the membrane, the more difficult it is for the vibrations diffused in the air to pass through the material; sound waves are reflected rather than transmitted. This factor is the most critical for the efficiency of the acoustic control and sound wave redirection system. The membranes, made up of layers of different natures and materials joined together with glues or resins, are often extremely flexible, and therefore easily distorted by vibrations. It is necessary to select the right fabric in order not to allow this phenomenon to occur and so that the membranes oppose resistance to the sound energy that hits them. At the theoretical and experimental level, this research only partially takes into account this phenomenon because the simulation of sound using software is very complex and difficult to control. During the simulation, the surfaces that symbolize the membranes are considered planes that reflect the sound waves, considering the sound-absorbing and diffusing properties of the material, but not the phenomenon of the propagation of vibrations through and beyond the membrane.

2.2. Design Process: Form-Finding

In order to verify the response of the reused membranes as an acoustic instrument, the design process involves many analysis tools and simulation models. Their use is essential as it allows the implementation of an acoustic intervention in real environments that are reconstructed in a virtual environment, with the advantage of acting ante operam, even before the buildings are built. Here are the two main reasons for the defined research methodology. Firstly, this process allows plausible measurements in a virtual environment without having to intervene with tests or analyzes in the real environment. Secondly, the management of the complexity of reality by working on suitably simplified virtual models is possible thanks to simulations; it is well known that the analyses of some environments are very complex, especially that of very large volumes.
The simulation in the virtual environment of the behavior of the textile membrane reused as an acoustic instrument is shown as follows. Two degrees of simulation have been prepared. The first concerns the modification of the shape, starting from a simple simulation in a small environment aiming to verify the “Form-finding” process. The second, on the other hand, translates the simulation into a very large existing environment, verifying the acoustic behavior of the membranes [8].
The shape of the membranes changes according to some parameters in order to interact with the context. The shape of the membrane surfaces is determined through a Form-finding process, which allows for optimizing the shape of the fabric to obtain the best response to solve the acoustic problem [9]. In the architectural field, the Form-finding process has been applied for some time as it is extremely useful for obtaining an objective answer to a problem concerning the shape of a specific architectural element [10]. Form-finding is the simulation design process which, given the shape of the space, the position of the acoustic source, the position of the receiver and the physical properties of the membranes as the input, returns, as the output, the shape of the membrane. Depending on the request, the adaptability of this shape allows us to maximize or minimize the amount of rays which are hitting the receiver [11,12,13]. In fact, within the simulation, sound has been simplified into a variable number of rays which are diffused into the environment starting from the emitter. Through an algorithm, the membrane is modeled in order to change the angle of incidence of the rays and move them away or bring them closer to the sphere (basically the receiver).
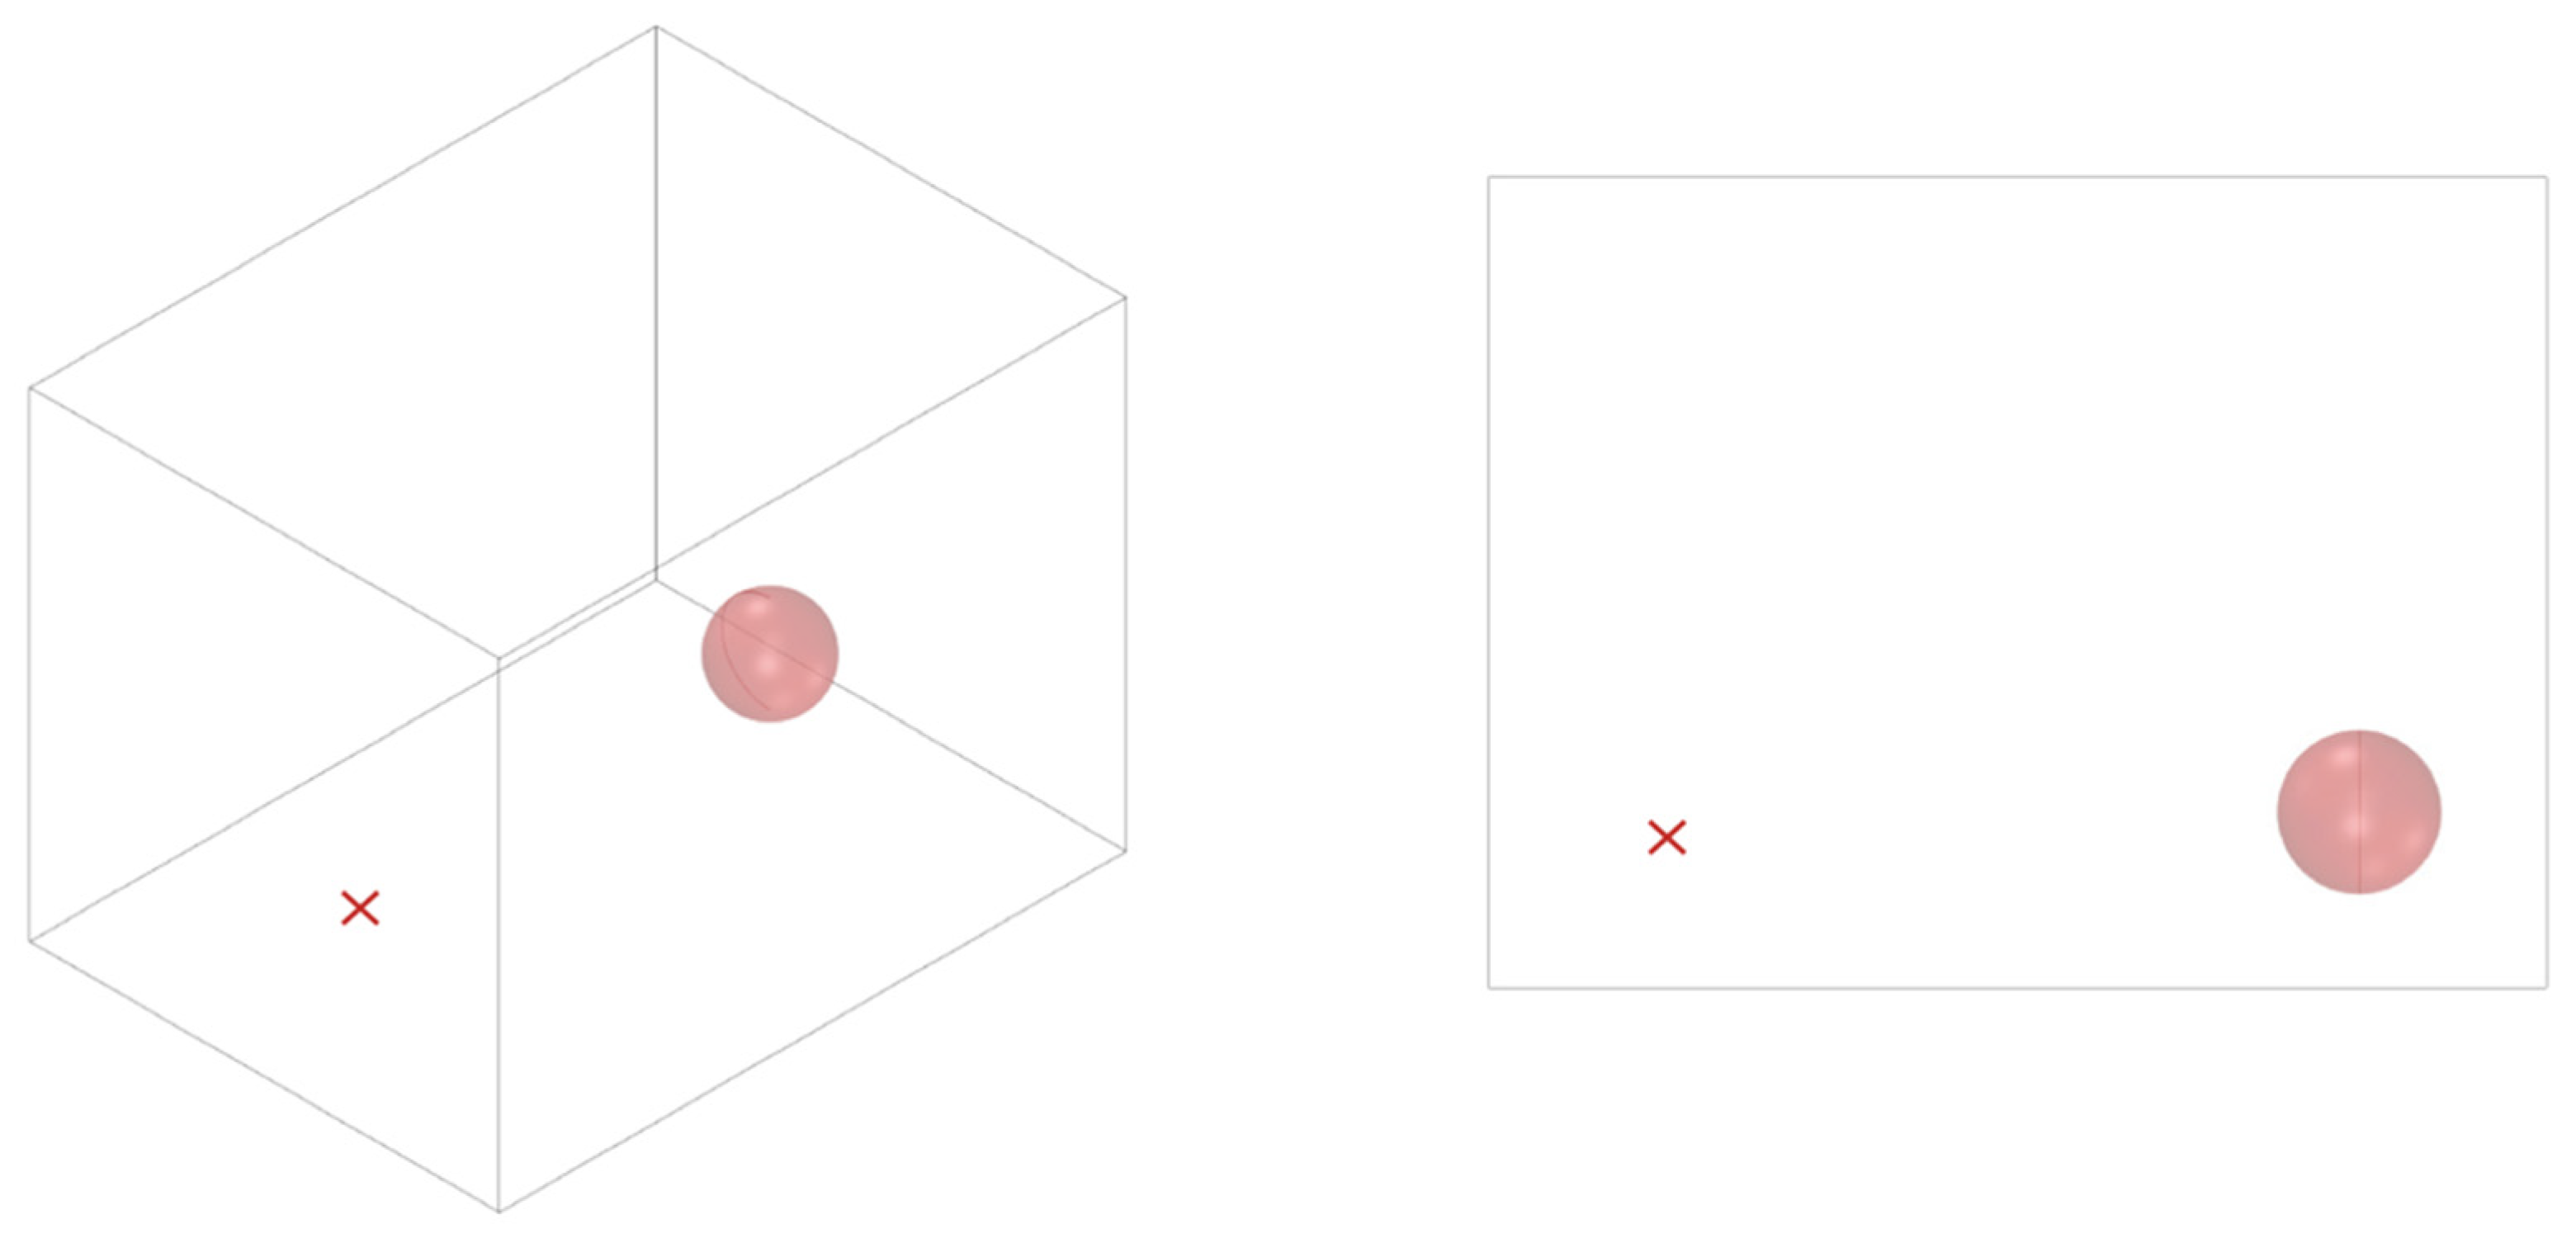
The geometry of the membranes is not univocal for any space but is extremely dependent on the characteristics of the environment, their arrangement in internal spaces, the position of the sources and, above all, the position of the listeners. Consequently, this means that the shape of each surface varies in relation to the variation of these parameters. The Form-finding process is implemented through various simulation software. First Rhinoceros3D version 7.29, a three-dimensional modeling software that allows for the creation of the space for simulating the acoustic field. The next step is the creation of the simulation space, including building surfaces and three-dimensional elements that interact with the acoustic simulation. The current simulation concerns the analysis of a fictitious environment with the aim of highlighting the phases which are then actually carried out for the large-scale environment exposed in the following section of the article. To simplify the problem as much as possible, consider a room with a base of 9 × 12 m and a height of 7 m, as shown in Figure 2. It is important that the simulation space is closed and well-confined, without cracks or holes from which the sound could come out and preclude the fidelity of the result. In this environment it is necessary to indicate two points to represent a source and a receiver. Even if the environment is small, it is assumed that the source emits sound uniformly in all directions and the receiver is a three-dimensional shape which is intersected by the rays.
This demonstration helps us to fully understand the simulation procedure. A step further is to proceed with the complete large-scale simulation. It is important to understand that, in a room of this size, a Finite Element Method (FEM) or Boundary Element Method (BEM) would probably be used. FEM and BEM are mathematical methods of calculation and acoustic prediction suitable for small objects or environments. These methods can achieve high accuracy thanks to the rationalization and discretization of the elements they analyze. Their precision hinders their application in large environments and for large objects where the size of the analysis does not require such detailed processing, preferring a faster and broader approach instead [14,15]. Since the main interest of the acoustics application for the reused membranes is a very large room, a geometric simulation of the acoustic phenomenon was used to better understand the design process. In this way, the shape variation of the membrane due to the Form-finding procedure is even more evident.
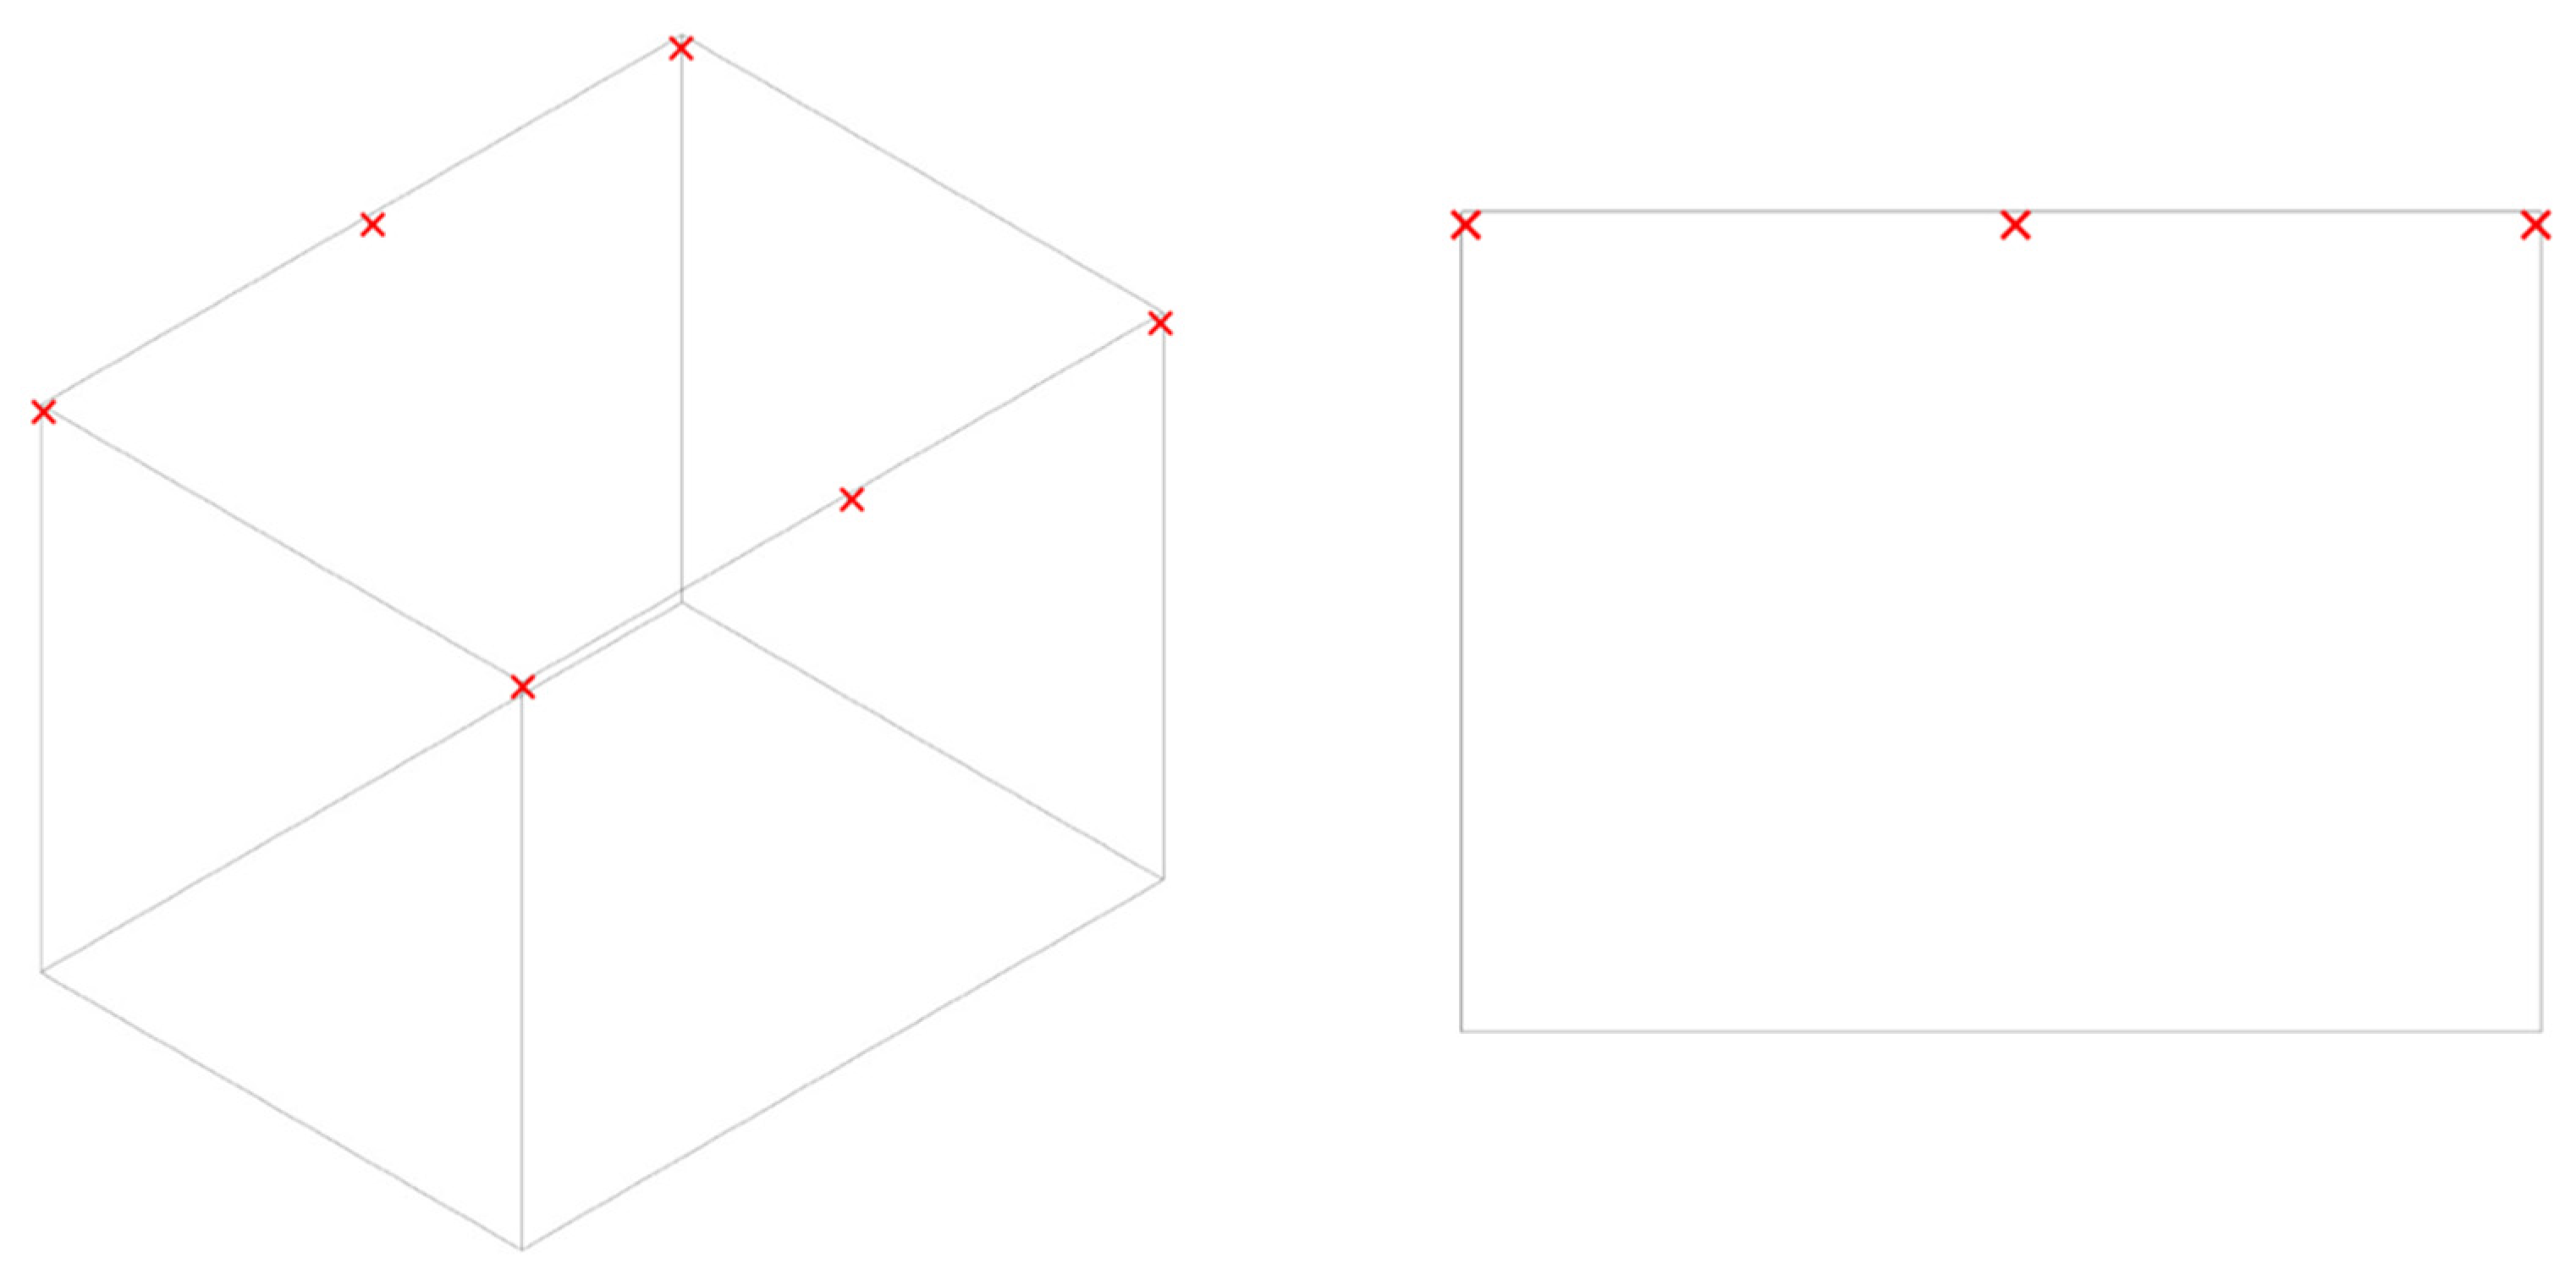
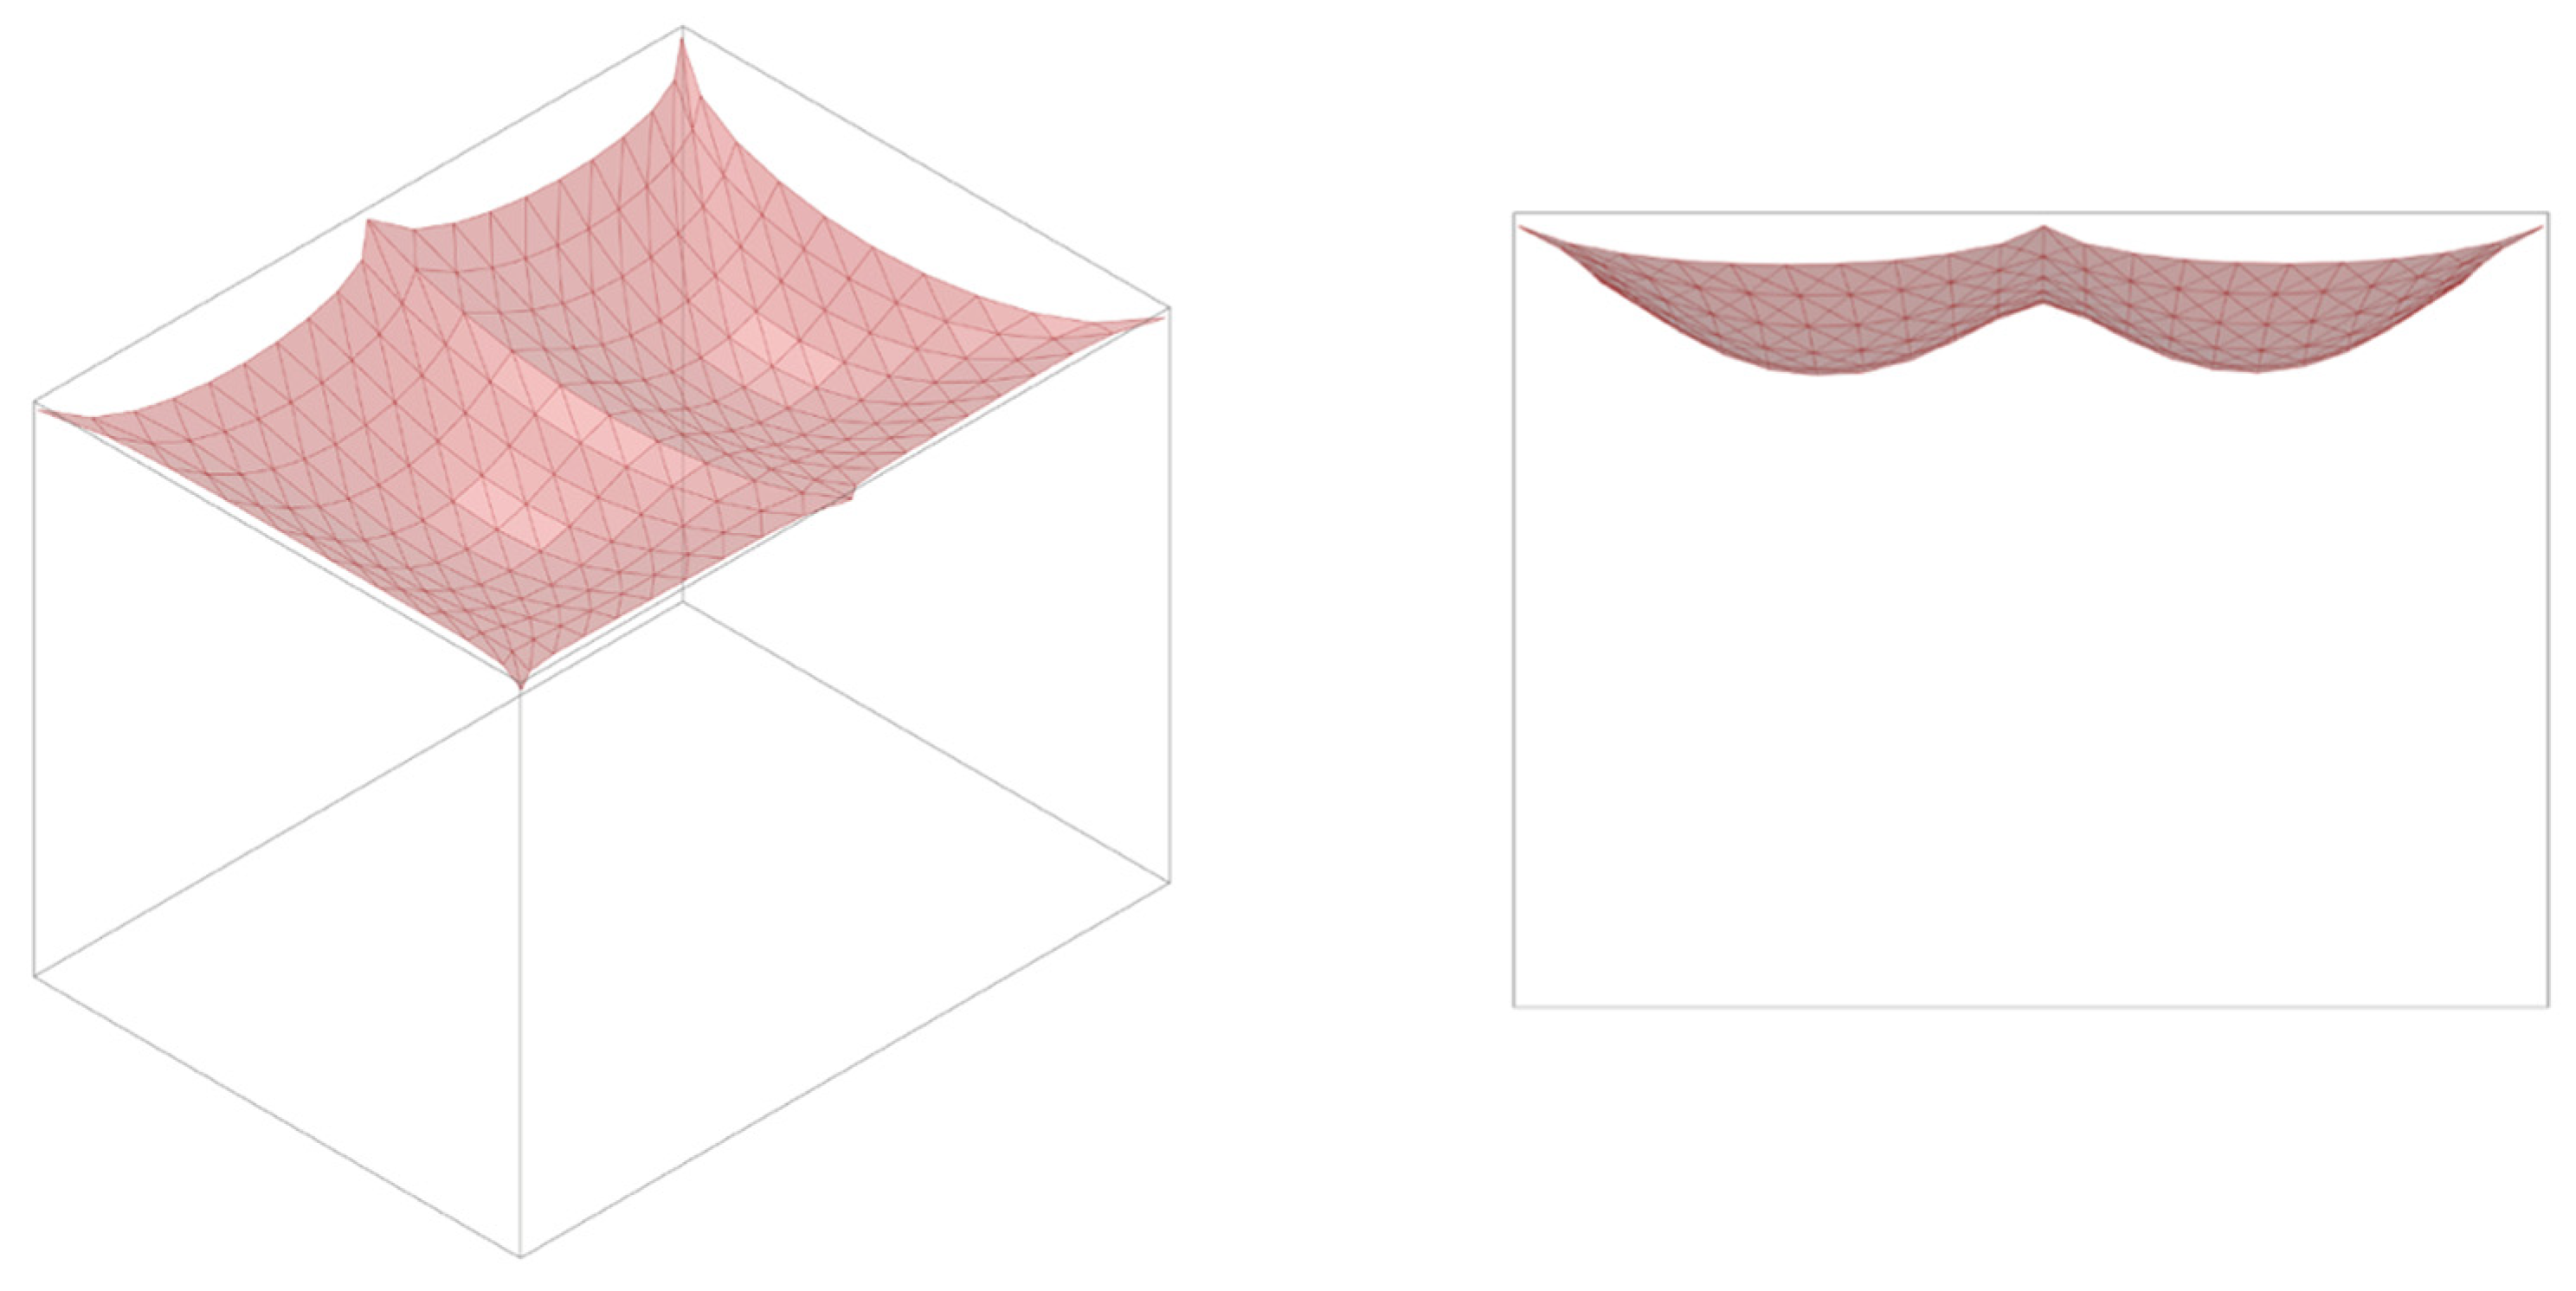
The suspended textile surface that completely covers the ceiling of the fictitious room is then added. Because it is composed of textile materials, it was decided to anchor the membrane at six points (
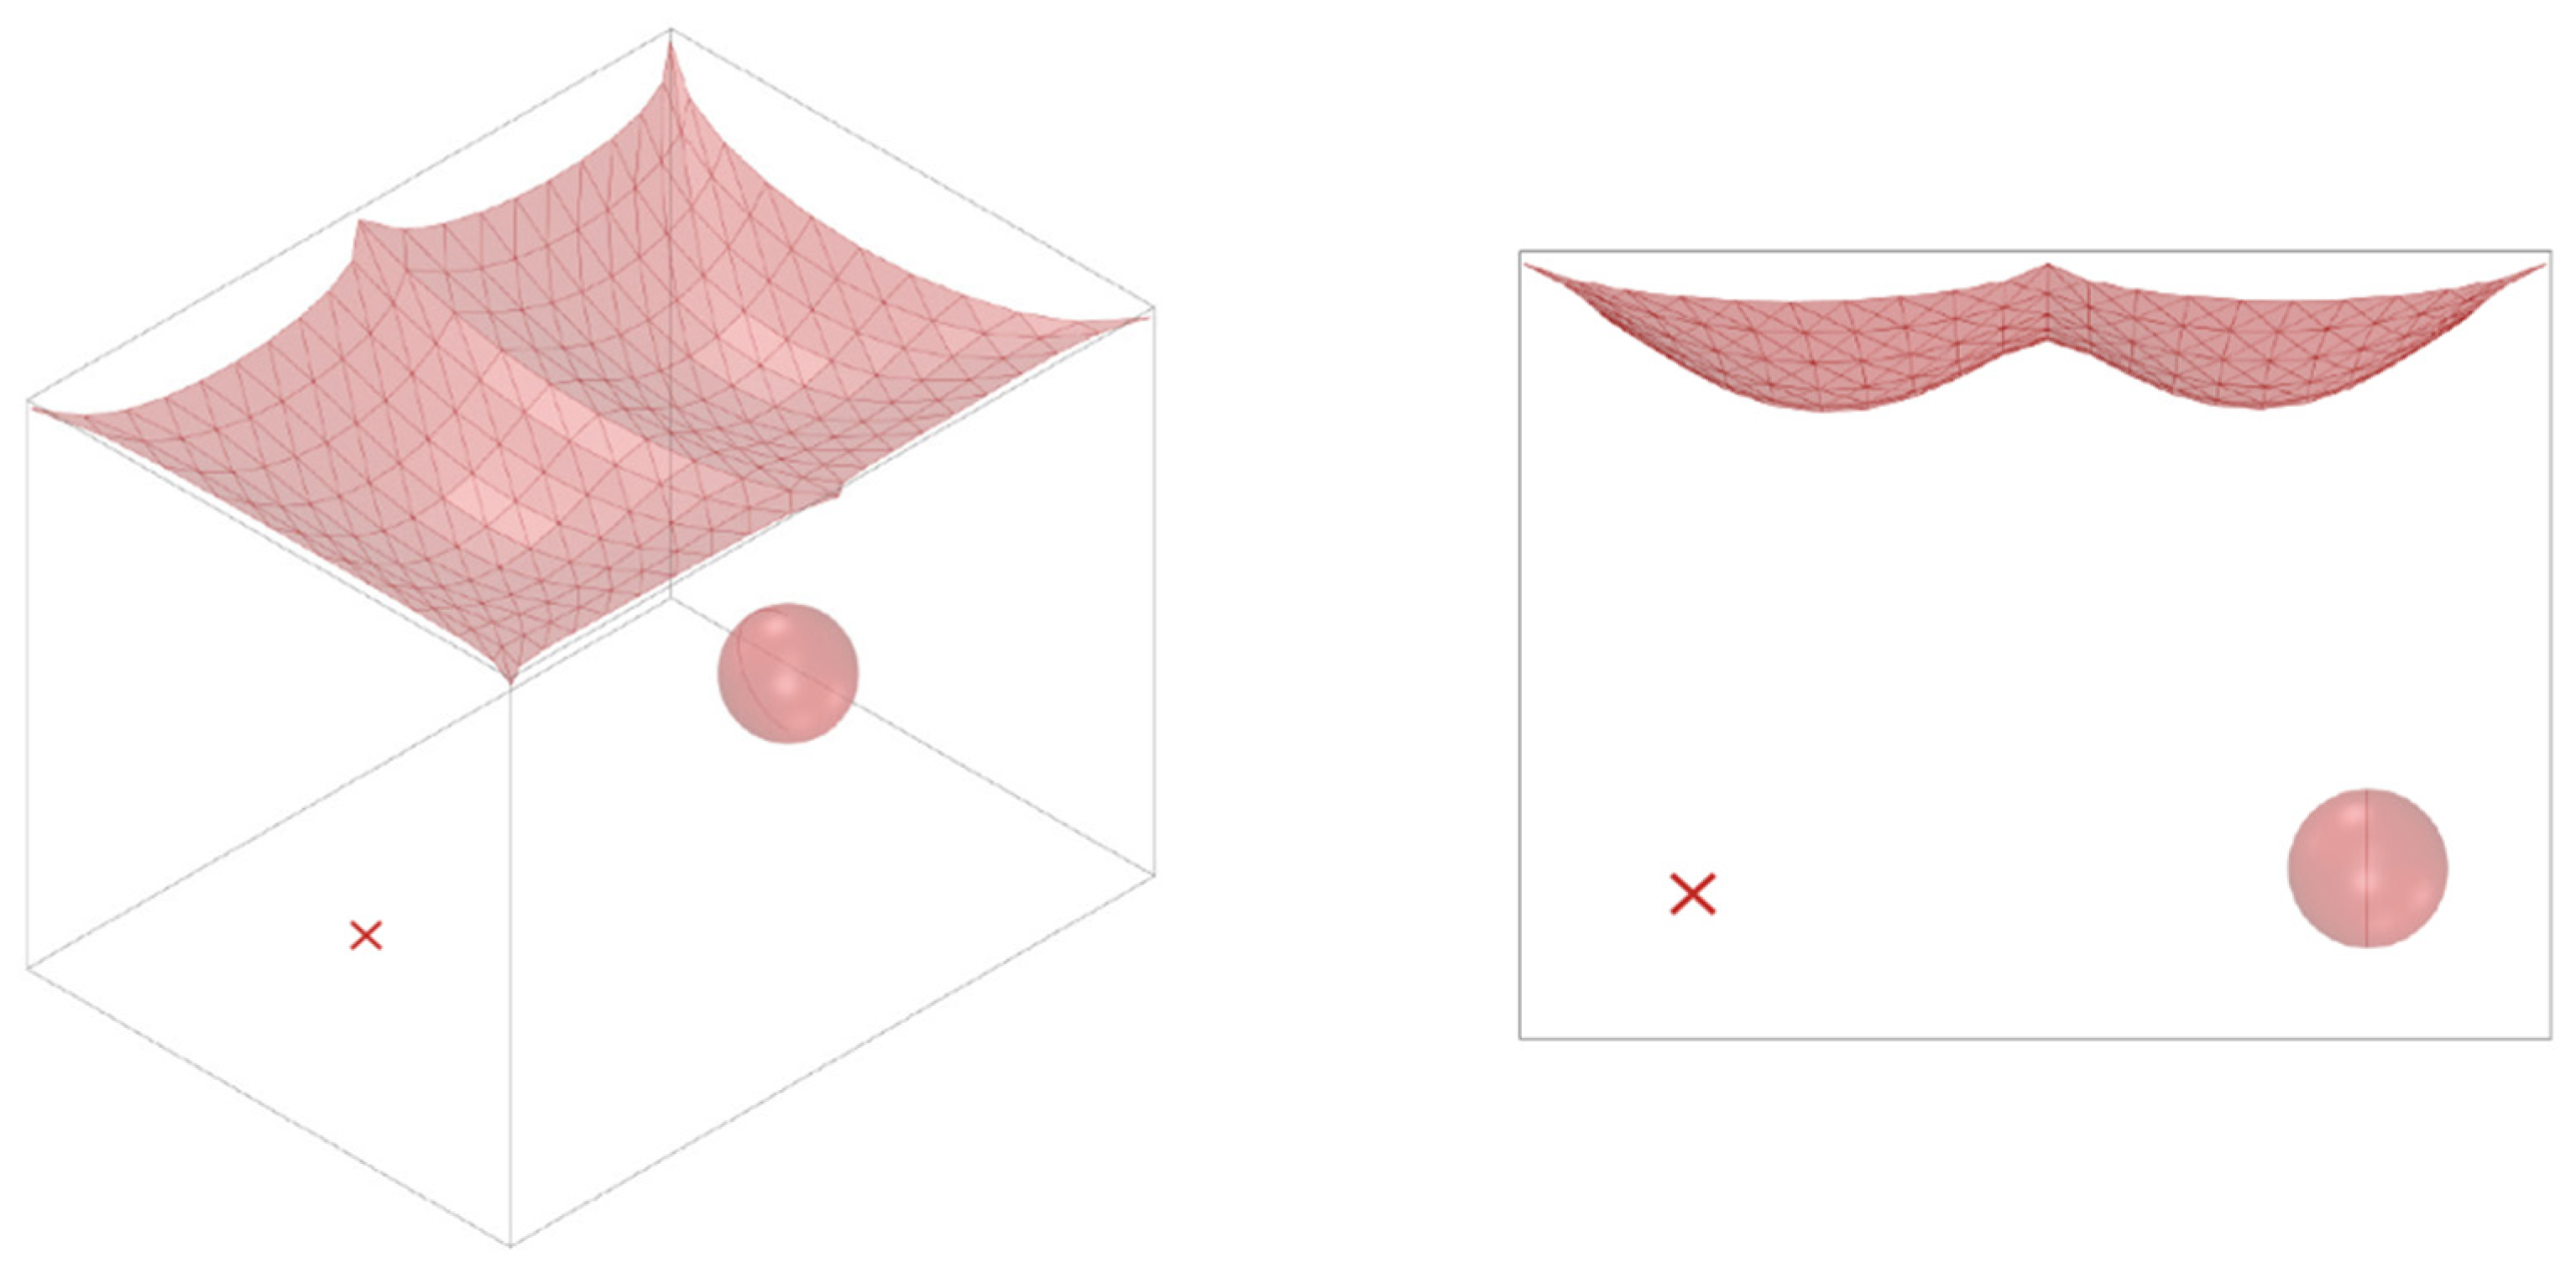
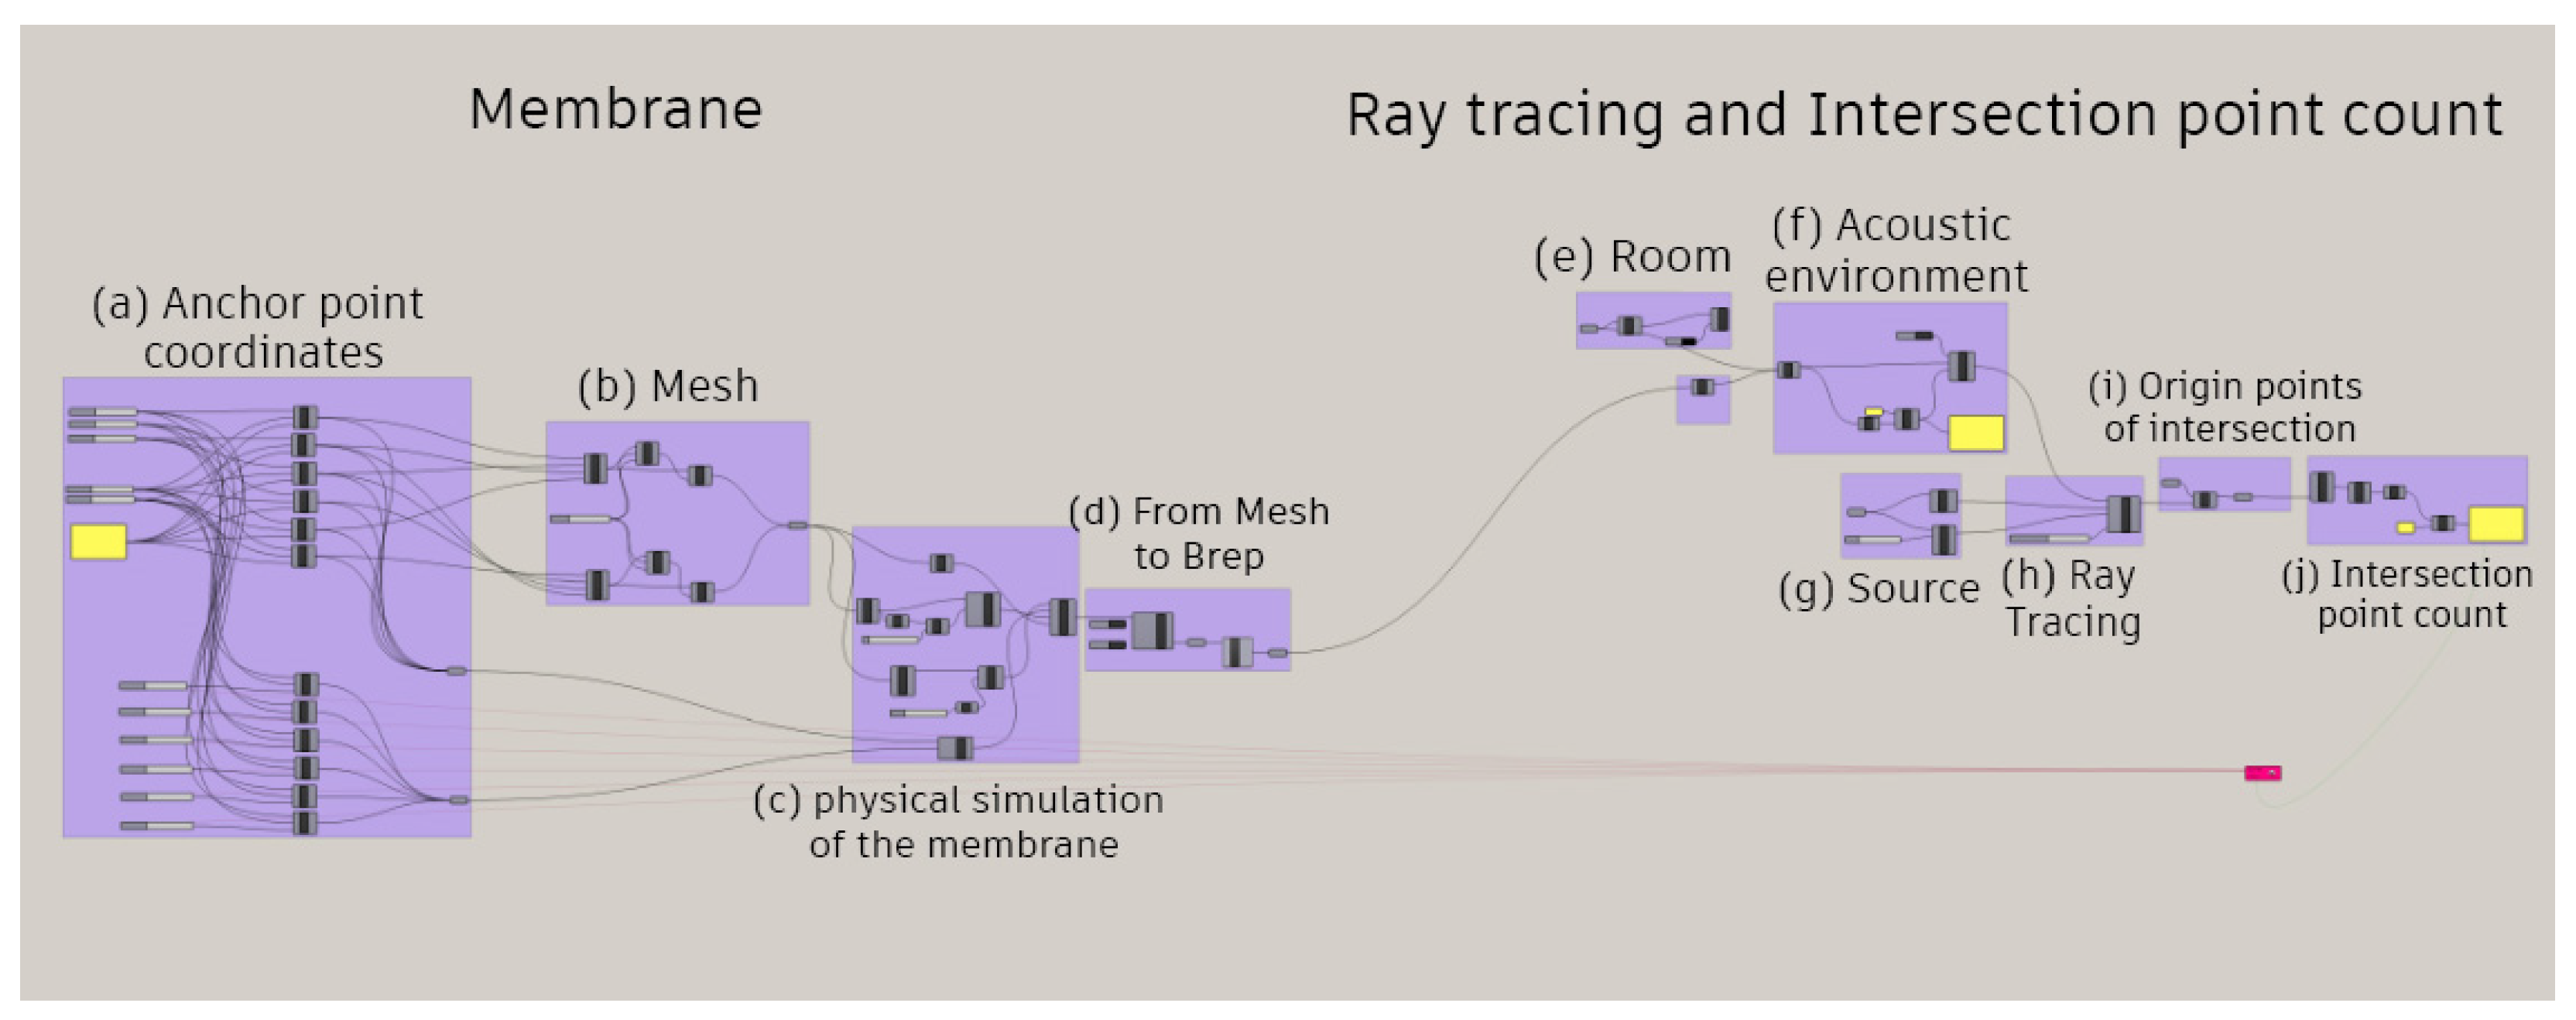
Figure 3) to be able to intervene more effectively on the shape of the membrane without compromising the resistance of the material. Since the fabric models itself thanks to its own weight, the simulation considers the force of gravity acting on the membrane. If there were fewer points, the robustness and modifiability of the system would be compromised, while if there were more, the complexity of the optimization calculation would enormously increase without obtaining better results from an acoustic point of view. The use of the program Grasshopper, as part of the software Rhinoceros 3D version 7, allows for the creation of complex shapes otherwise impossible to simulate [16]. To give the surfaces their real behavior it is necessary to use a Grasshopper plug-in called Kangaroo. It is therefore possible to subject the surfaces to the force of gravity and, in the meantime, constrain them at some points, also simulating the tension to which the membrane is subjected (Figure 4). By varying the height of the points, the shape of the surface changes, respecting the laws of physics, as if the edges of the membrane were raised or lowered.
It is now necessary to create the acoustic field by simulating the behavior of the sound, making it interact both with the environment and with the surfaces that simulate the suspended membrane. This is certainly one of the most complex phases because the calculation algorithm is very heavy. The behavior of sound can be simplified in the form of rays which, interacting with the boundary environment, are reflected and diffused in space. The large number of rays, the complex surfaces and the high number of reflections cause an increase in the calculation time of the simulation. For this reason, in order to make the simulation faster without precluding its acceptability, it is possible to act by decreasing the number of beams and, if possible, the number of sound sources. The more rays considered, the greater the precision of the calculation achieved; therefore, it is necessary to find a fair compromise between the two parameters.
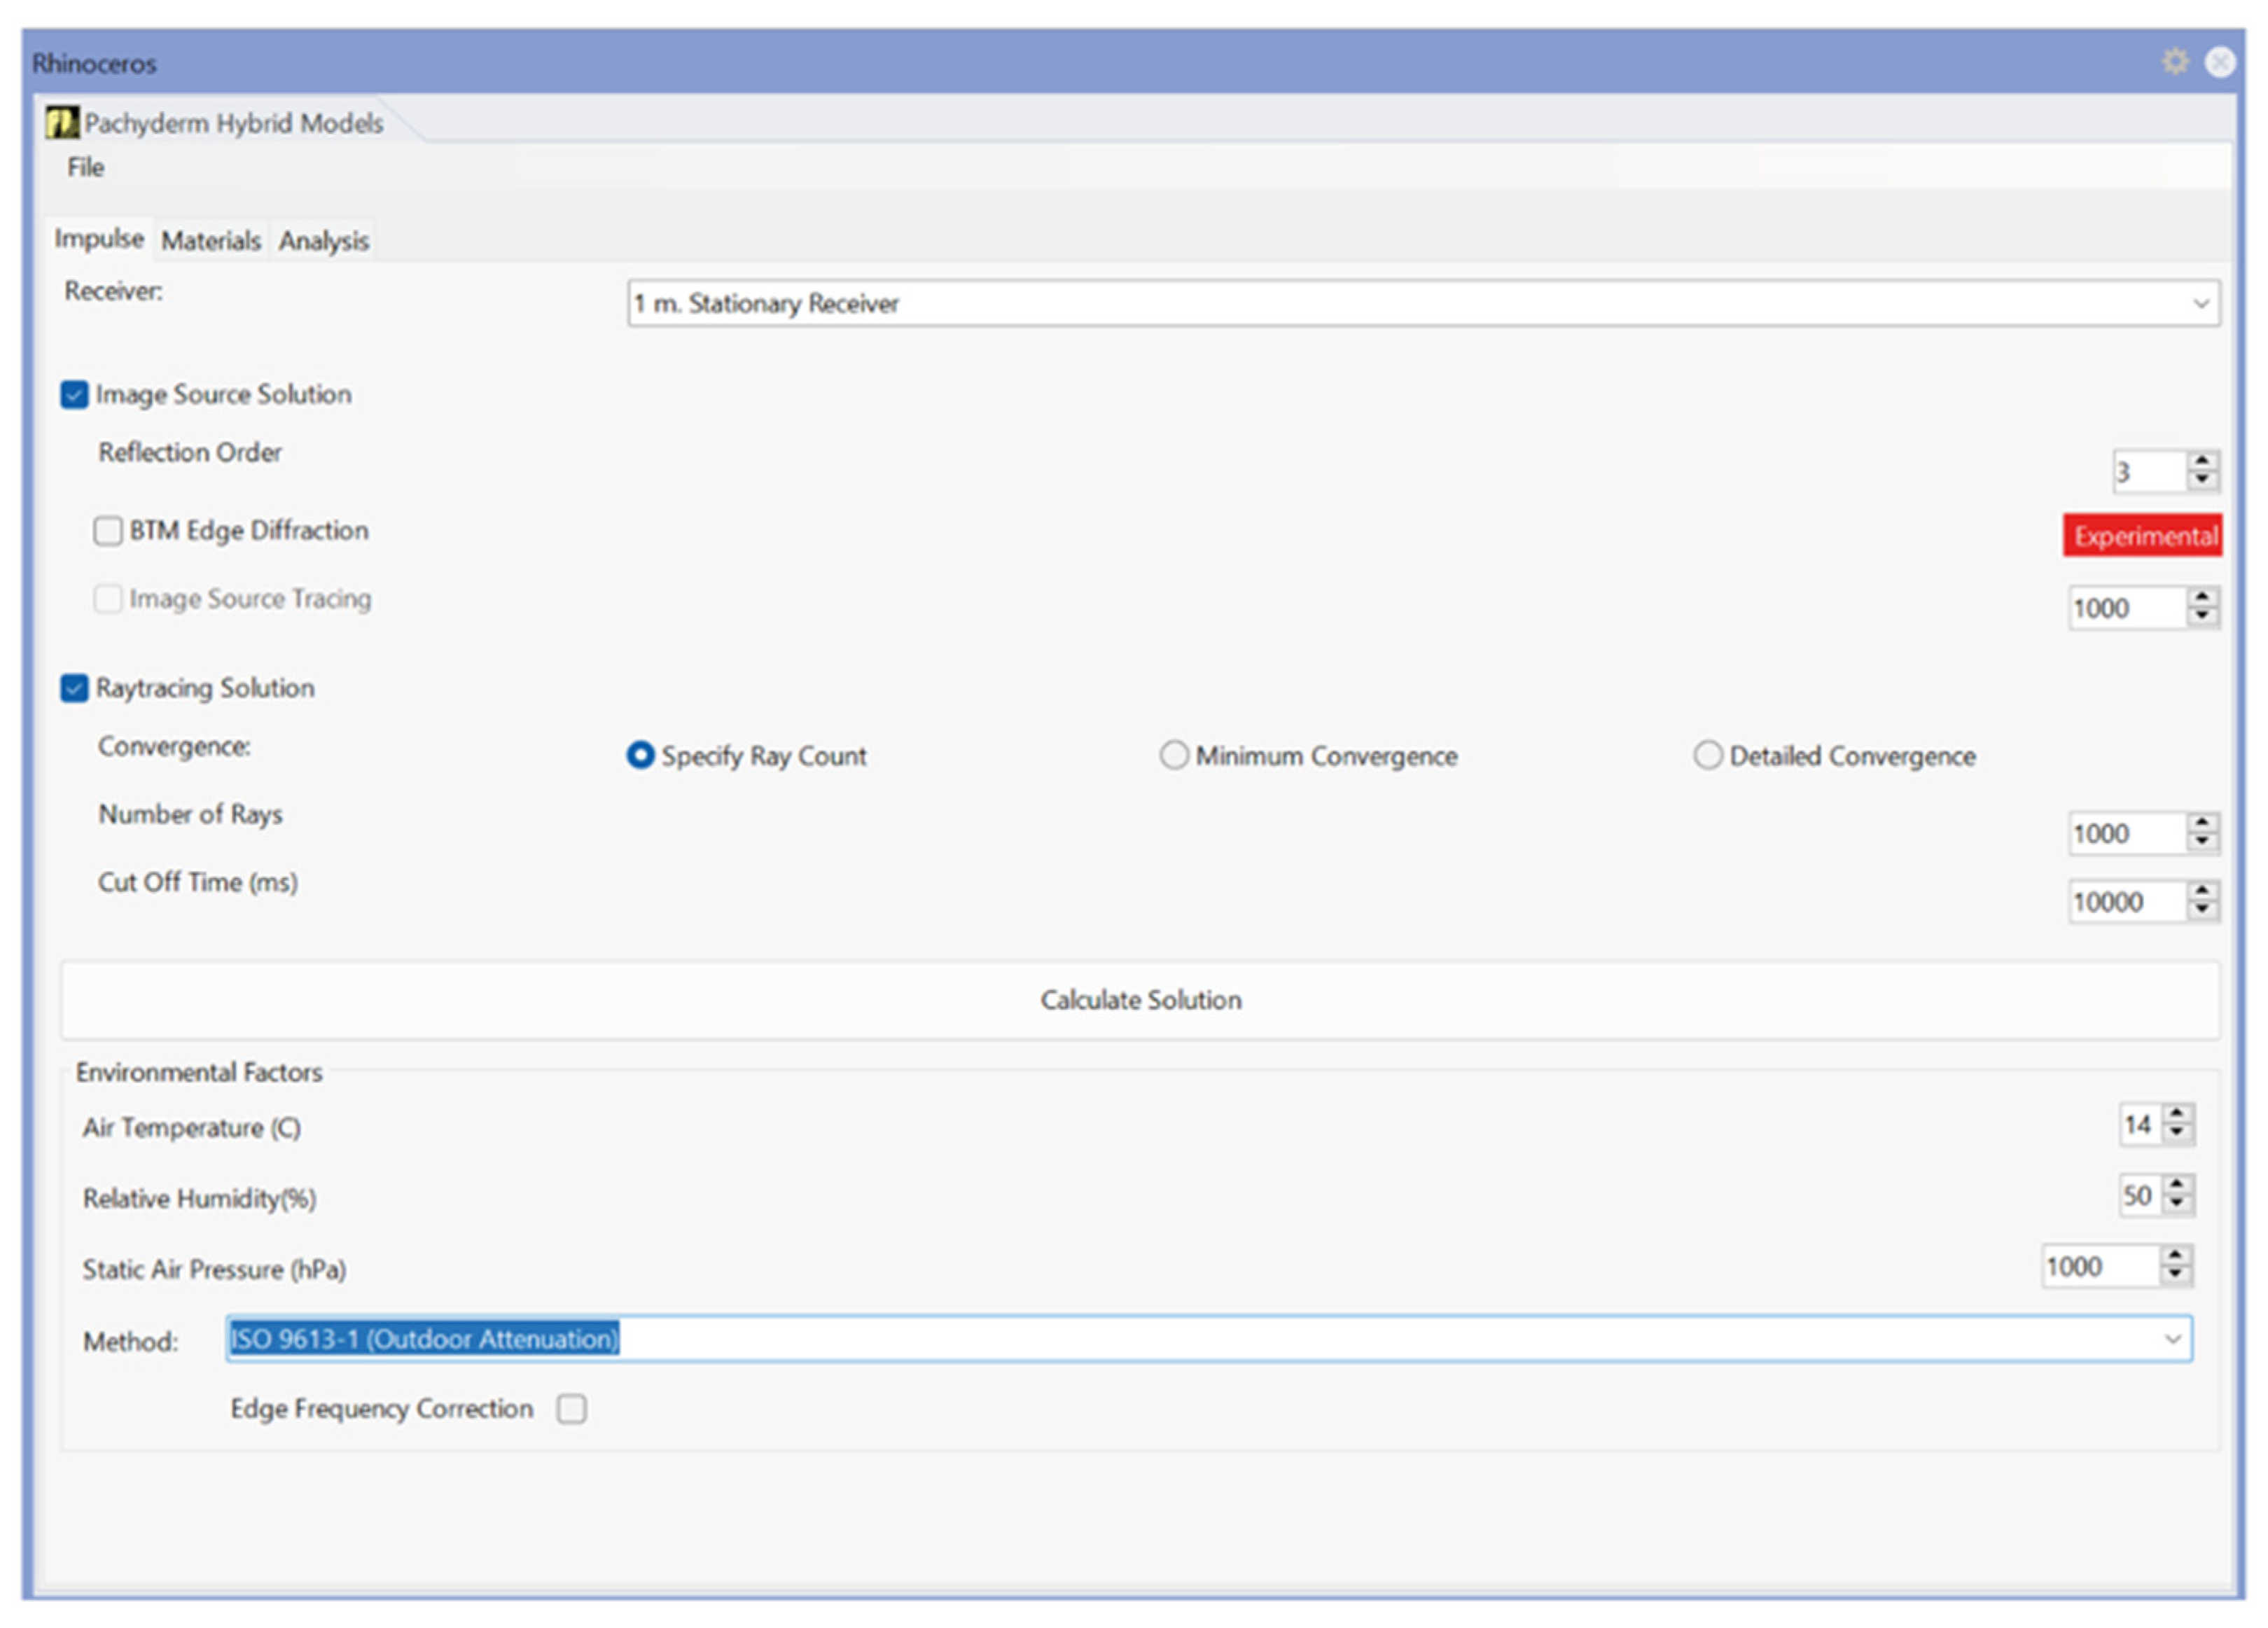
All acoustic operations are simulated thanks to another Grasshopper Plug-in called Pachyderm [17]. This allows certain functions to confer to the entities present in the space. In this case, the point represents the sound source, the environment and the textile surfaces are the border surfaces, and the sphere is the receiving space. The rays originate from the sources according to the procedure of the deterministic sphere: the sphere is simplified and divided into many polygons [18]. The direction of the acoustic rays is determined by the line passing through one of the vertices of a polygon and the center of the sphere. In this way the rays spread uniformly in all directions and encounter the geometries of the environment (Figure 5).
To analyze the receiving area from the point of view of reverberation, an intuitive procedure was conceived, which is then evaluated with an algorithm composed of a series of commands by which Pachyderm can return the reverberation time at a point, considering the environment in which the receiver is located. The algorithm is a series of graphic commands, capable of generating complex three-dimensional mathematics through the definition of a node diagram. The procedure is like the Reflection Free Zone phenomenon, a particular situation in which the reverberated sound, thanks to some devices regarding reflections and absorption, is excluded from a given area. In other words, the calculation tries to isolate a part of a room from reflections, receiving only the direct sound and not the reverberated one. The textile membrane is modeled with a shape, thanks to which the reflections are not directed towards the receiving area, leaving it free from a good fraction of sound waves. The reverberation time decreases as the receiving area is excluded from a part of the rays that act to create a reverberated sound field.
An optimization process is required to obtain the right geometry of the textile membranes. The operation consists of acting on some parameters to find the best formal solution for the problem. In this case, the question concerns the shape of the suspended membranes to reflect the least number of sound waves towards the receiving area, modifying the length of the supports. The Grasshopper Plug-in that allows such an algorithm to run is called Galapagos. This procedure is called Multi Objective Optimization, as it acts on various parameters simultaneously in order to find the best possible result. The lengths of the supports that regulate the shape and the position of the membrane have infinite combinations, but the algorithm can identify the best one.
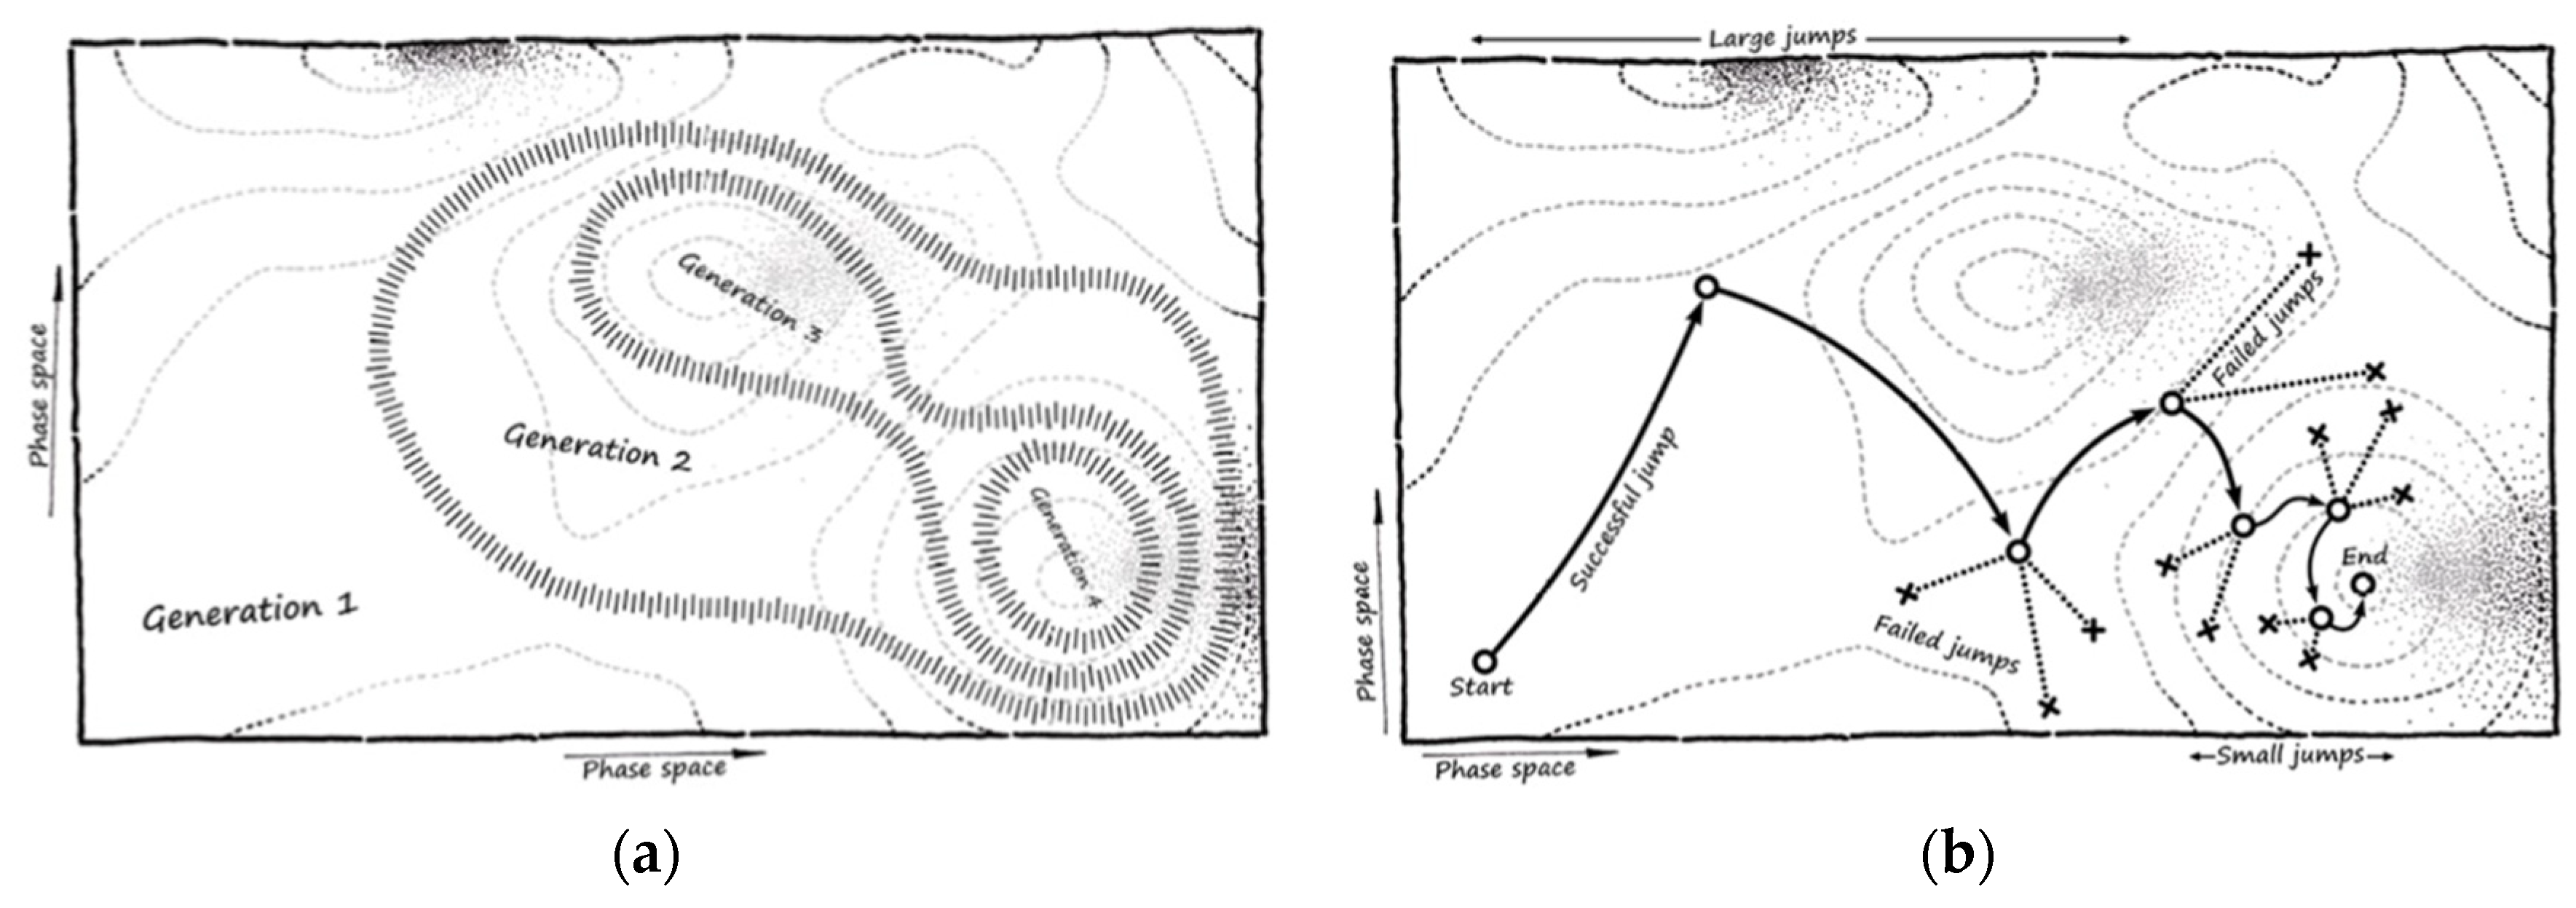
The Plug-in has two different optimization methods that are different from each other but acceptable for research purposes. The first method is called the Evolutionary Process (Figure 6a) and consists of determining the best solution by comparing all possible combinations originating from the variables. It works by comparing solutions one by one and finally choosing the best one. Of the two processes, it is the more precise but also the one that requires the most time as it compares all the solutions. This means that having many variables in the system will make the algorithm very slow. The second method is called the Annealing Process (Figure 6b) and works differently. This method works by trial and error, jumping from solution to solution until it gets to the best one. This procedure is much faster as it is not a question of verifying every combination but rather of happening on the best one. The process, however, is not as casual it might seem but the attempts become more and more precise as the procedure progresses [19].
To better explain the two methods, here is an example of the mountain for which the Optimization Process must find the point on a map where the highest peak among those present is located. In the case of the Evolutionary Optimization Process, all the level curves are analyzed, proceeding slowly and excluding unsatisfactory solutions. In the case of the Annealing Optimization Process, the proceedings go on by leaps, which are shorter where the solution seems promising. If, by chance, an attempt results in a backwards leap, then it is excluded and it returns to the previous leap, attempting this an infinite number of times until it finds the leap that leads to the top of the mountain. For research, both methods work great but the first is much slower. By slightly sacrificing the precision of the process, it is decided to opt for the faster execution to reduce the calculation times without compromising the precision of the analysis.
Knowing the variables, that is, the height of the membrane supports, which in this case have a range of 170 cm, and knowing the output of the algorithm, that is, the shape of the textile surfaces, it is necessary to understand which parameter to search for in order to find the right solution. Thanks to the “Acoustic Manual” by Renato Spagnolo, which deepens the acoustic theory by referring to the simplification of sound by means of acoustic rays and to the simplification of the receiver by means of a sphere that surrounds it, the synergy between the two factors determines a new valid parameter on which the simulation can intervene: the interaction between the acoustic beams and the sphere [20]. In this way, a value is obtained which symbolizes the parameter on which the algorithm can act. The process finds the shape of the membrane for which it is verified that the receiving area is hit by the least number of acoustic rays in order to isolate it as much as possible from the reflected waves.
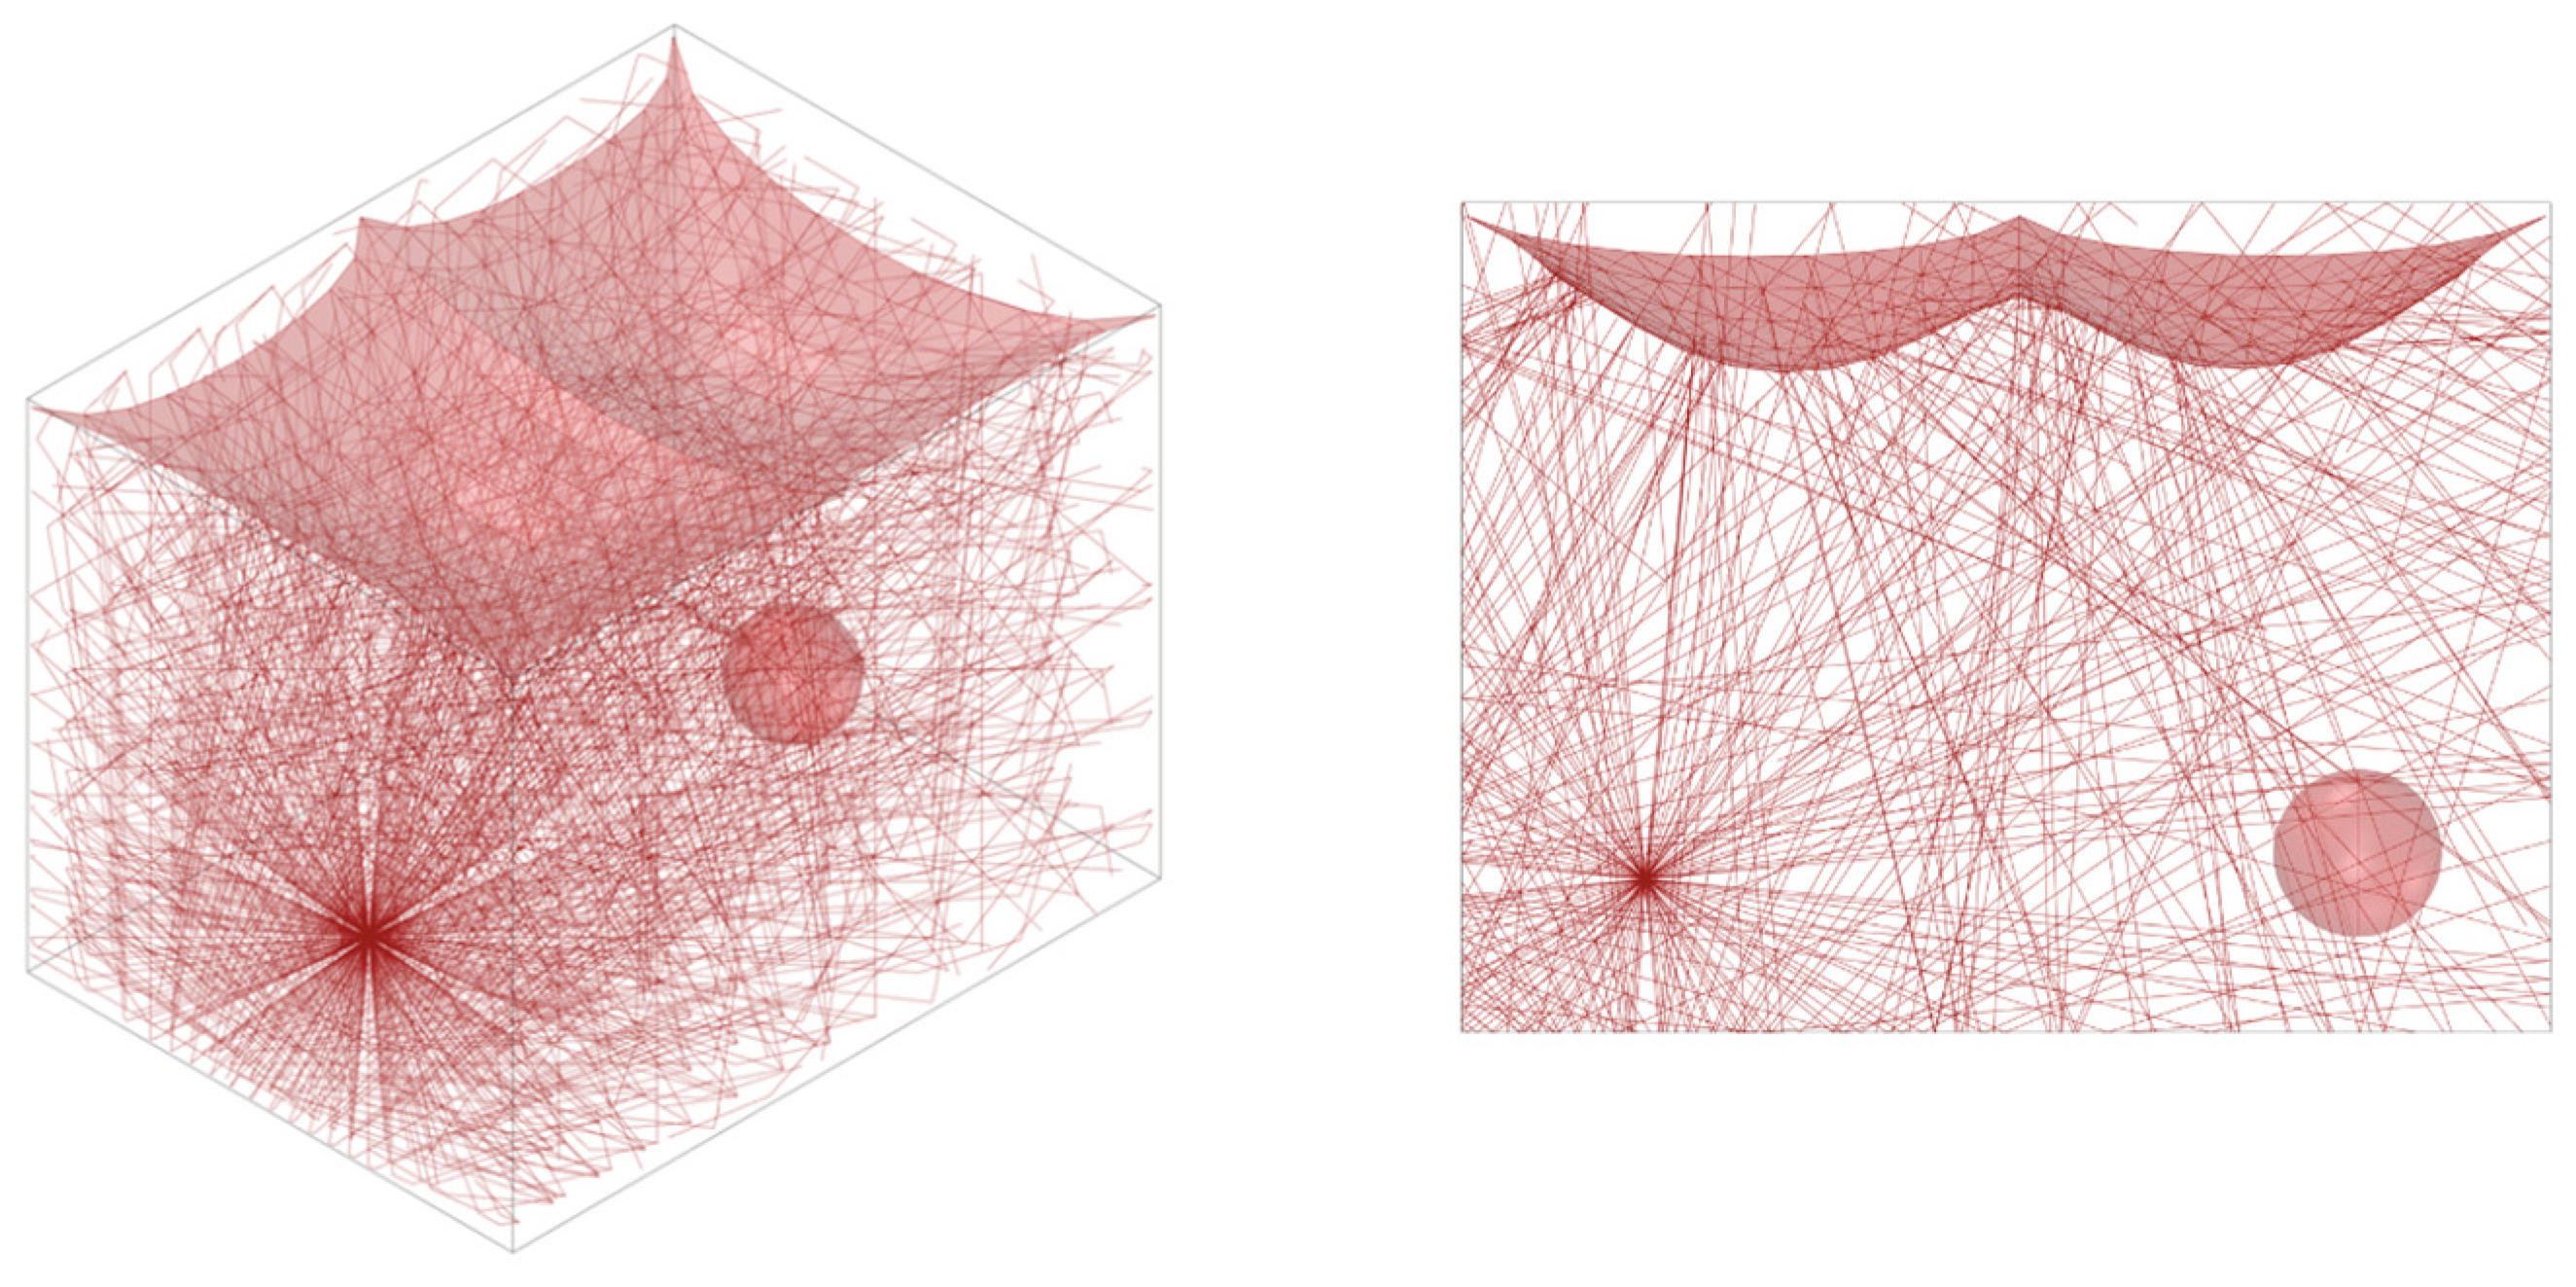
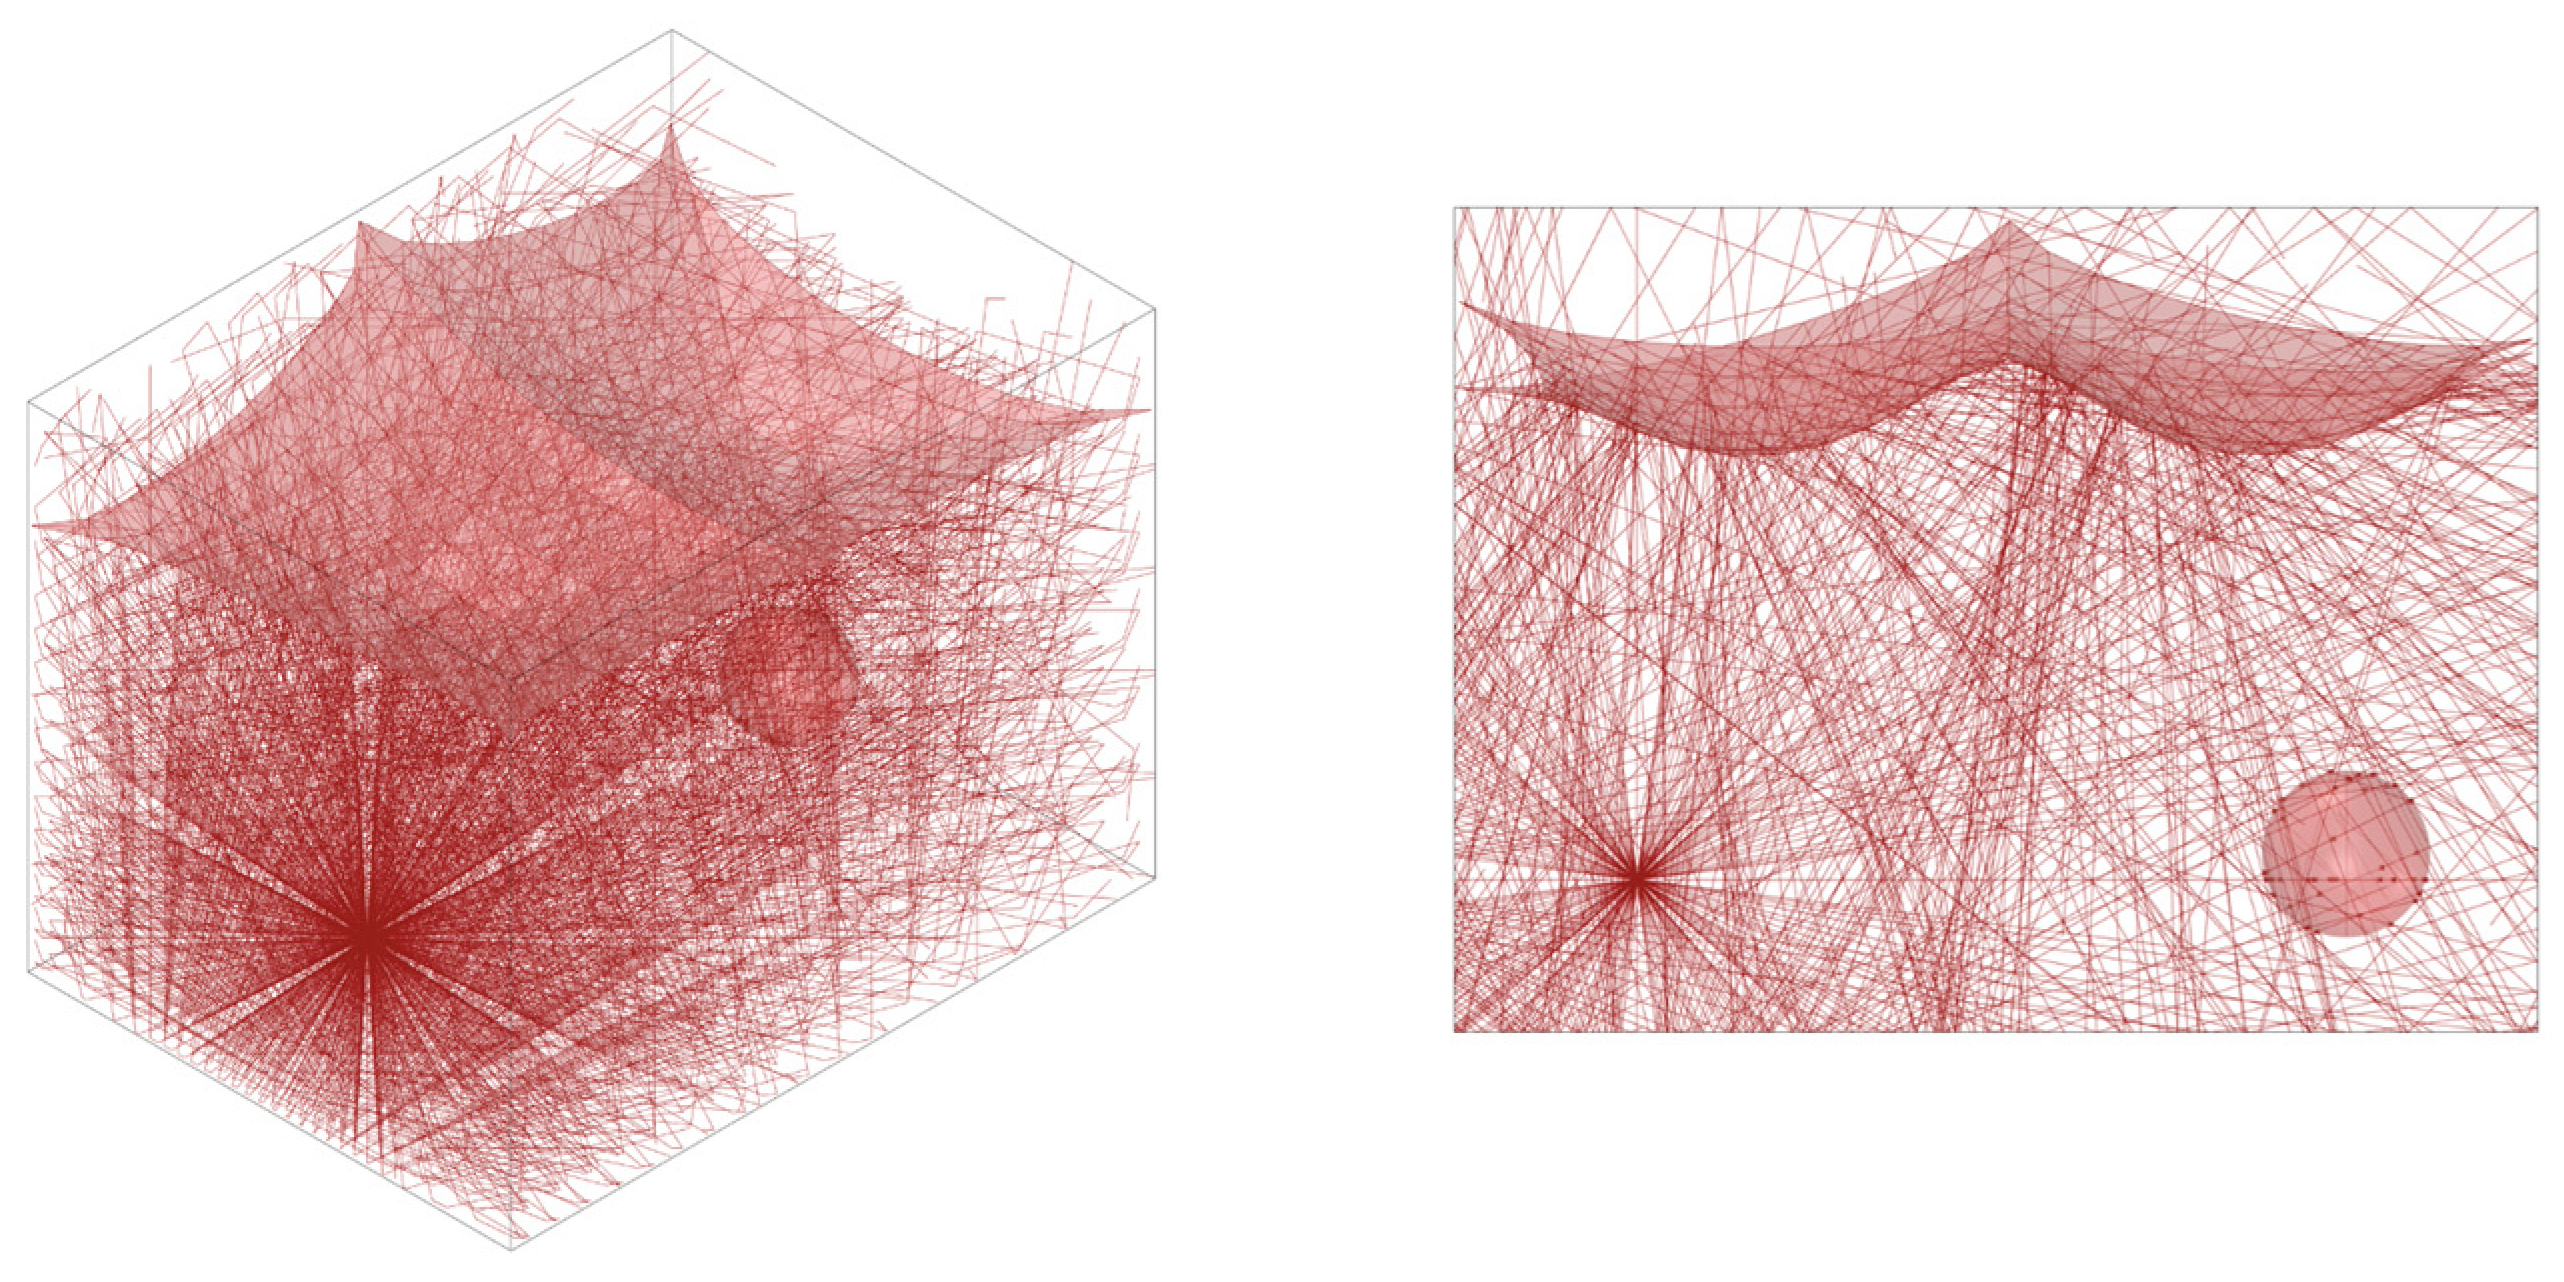
The effect of the Form-finding process is highlighted in Figure 7, Figure 8 and Figure 9. By acting on the height of the anchoring points of the membrane, it is possible to find the shape that best modifies the reflections of the rays and moves them further away from the receiver. Once the algorithm has been performed and the best possible surface has been found, the number of rays that intersect the receiving area is lower than in the environment without the membrane. The test highlights the limited effectiveness of the system if it consists of a single surface in a very small room. The objective of this brief simulation, however, as already mentioned, is not to demonstrate the system’s ability to attenuate reverberation but rather to demonstrate how the membrane adapts to the surrounding conditions, showing the procedure of the Form-finding.
In the next paragraph, the same procedure is used but in a realistic environment with probable boundary conditions and with much larger dimensions and entities, describing the real acoustic capacities of many membranes in a hypothetical and plausible area of use.

2.3. Form-Finding, Simulation in Big Spaces: “Fruit and Vegetable Logistics Platform”

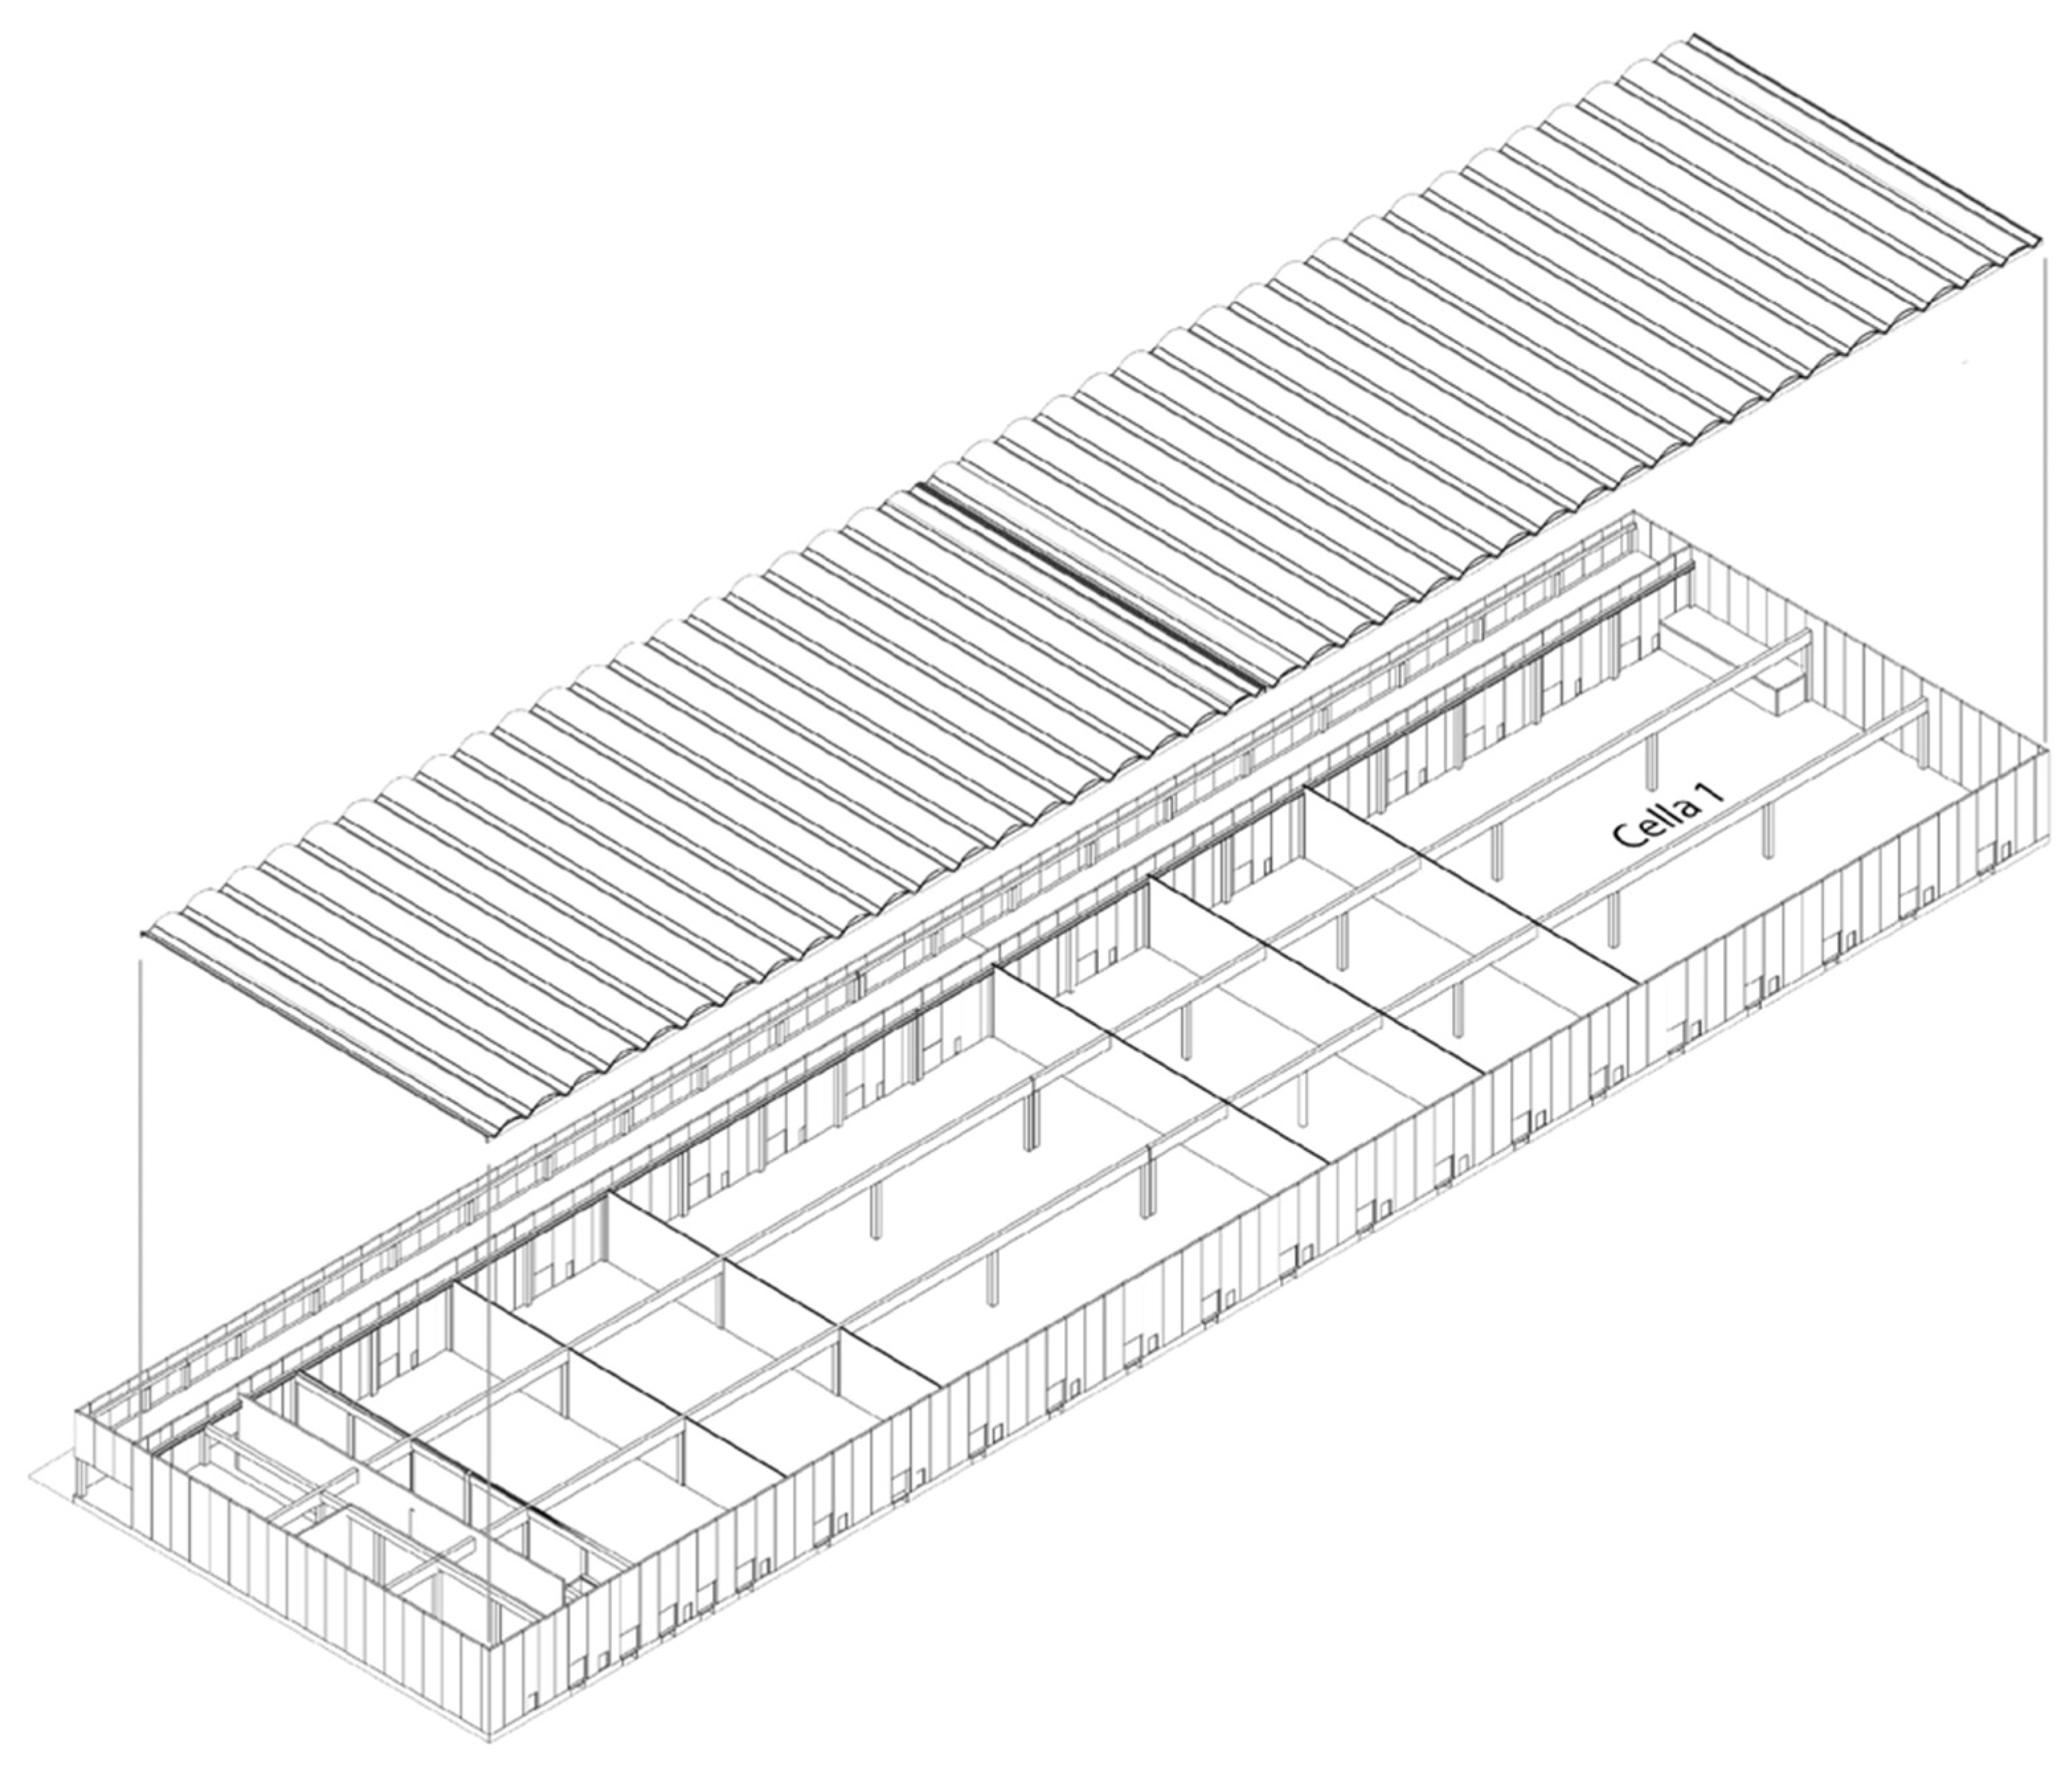
To test the reused membranes as a tool for acoustic control, a simulation path was implemented for the acoustic analysis and simulation of the Milanese Fruit and Vegetable Logistics Platform (PLO) (Figure 10) during the construction phases carried out in 2022, resulting in an ante operam development of the analyses. It is a very large industrial shed that houses the goods storage and handling services. The building is part of a large commercial complex: the Milan Fruit and Vegetable Market. The entire market underwent a complete reconstruction with the aim of improving the management of sales and warehouse activities. The research analysis was conducted for only one part of the building, the room called “Cella 1”. For the closed acoustic environment, reference is made to ISO 3382 [21].
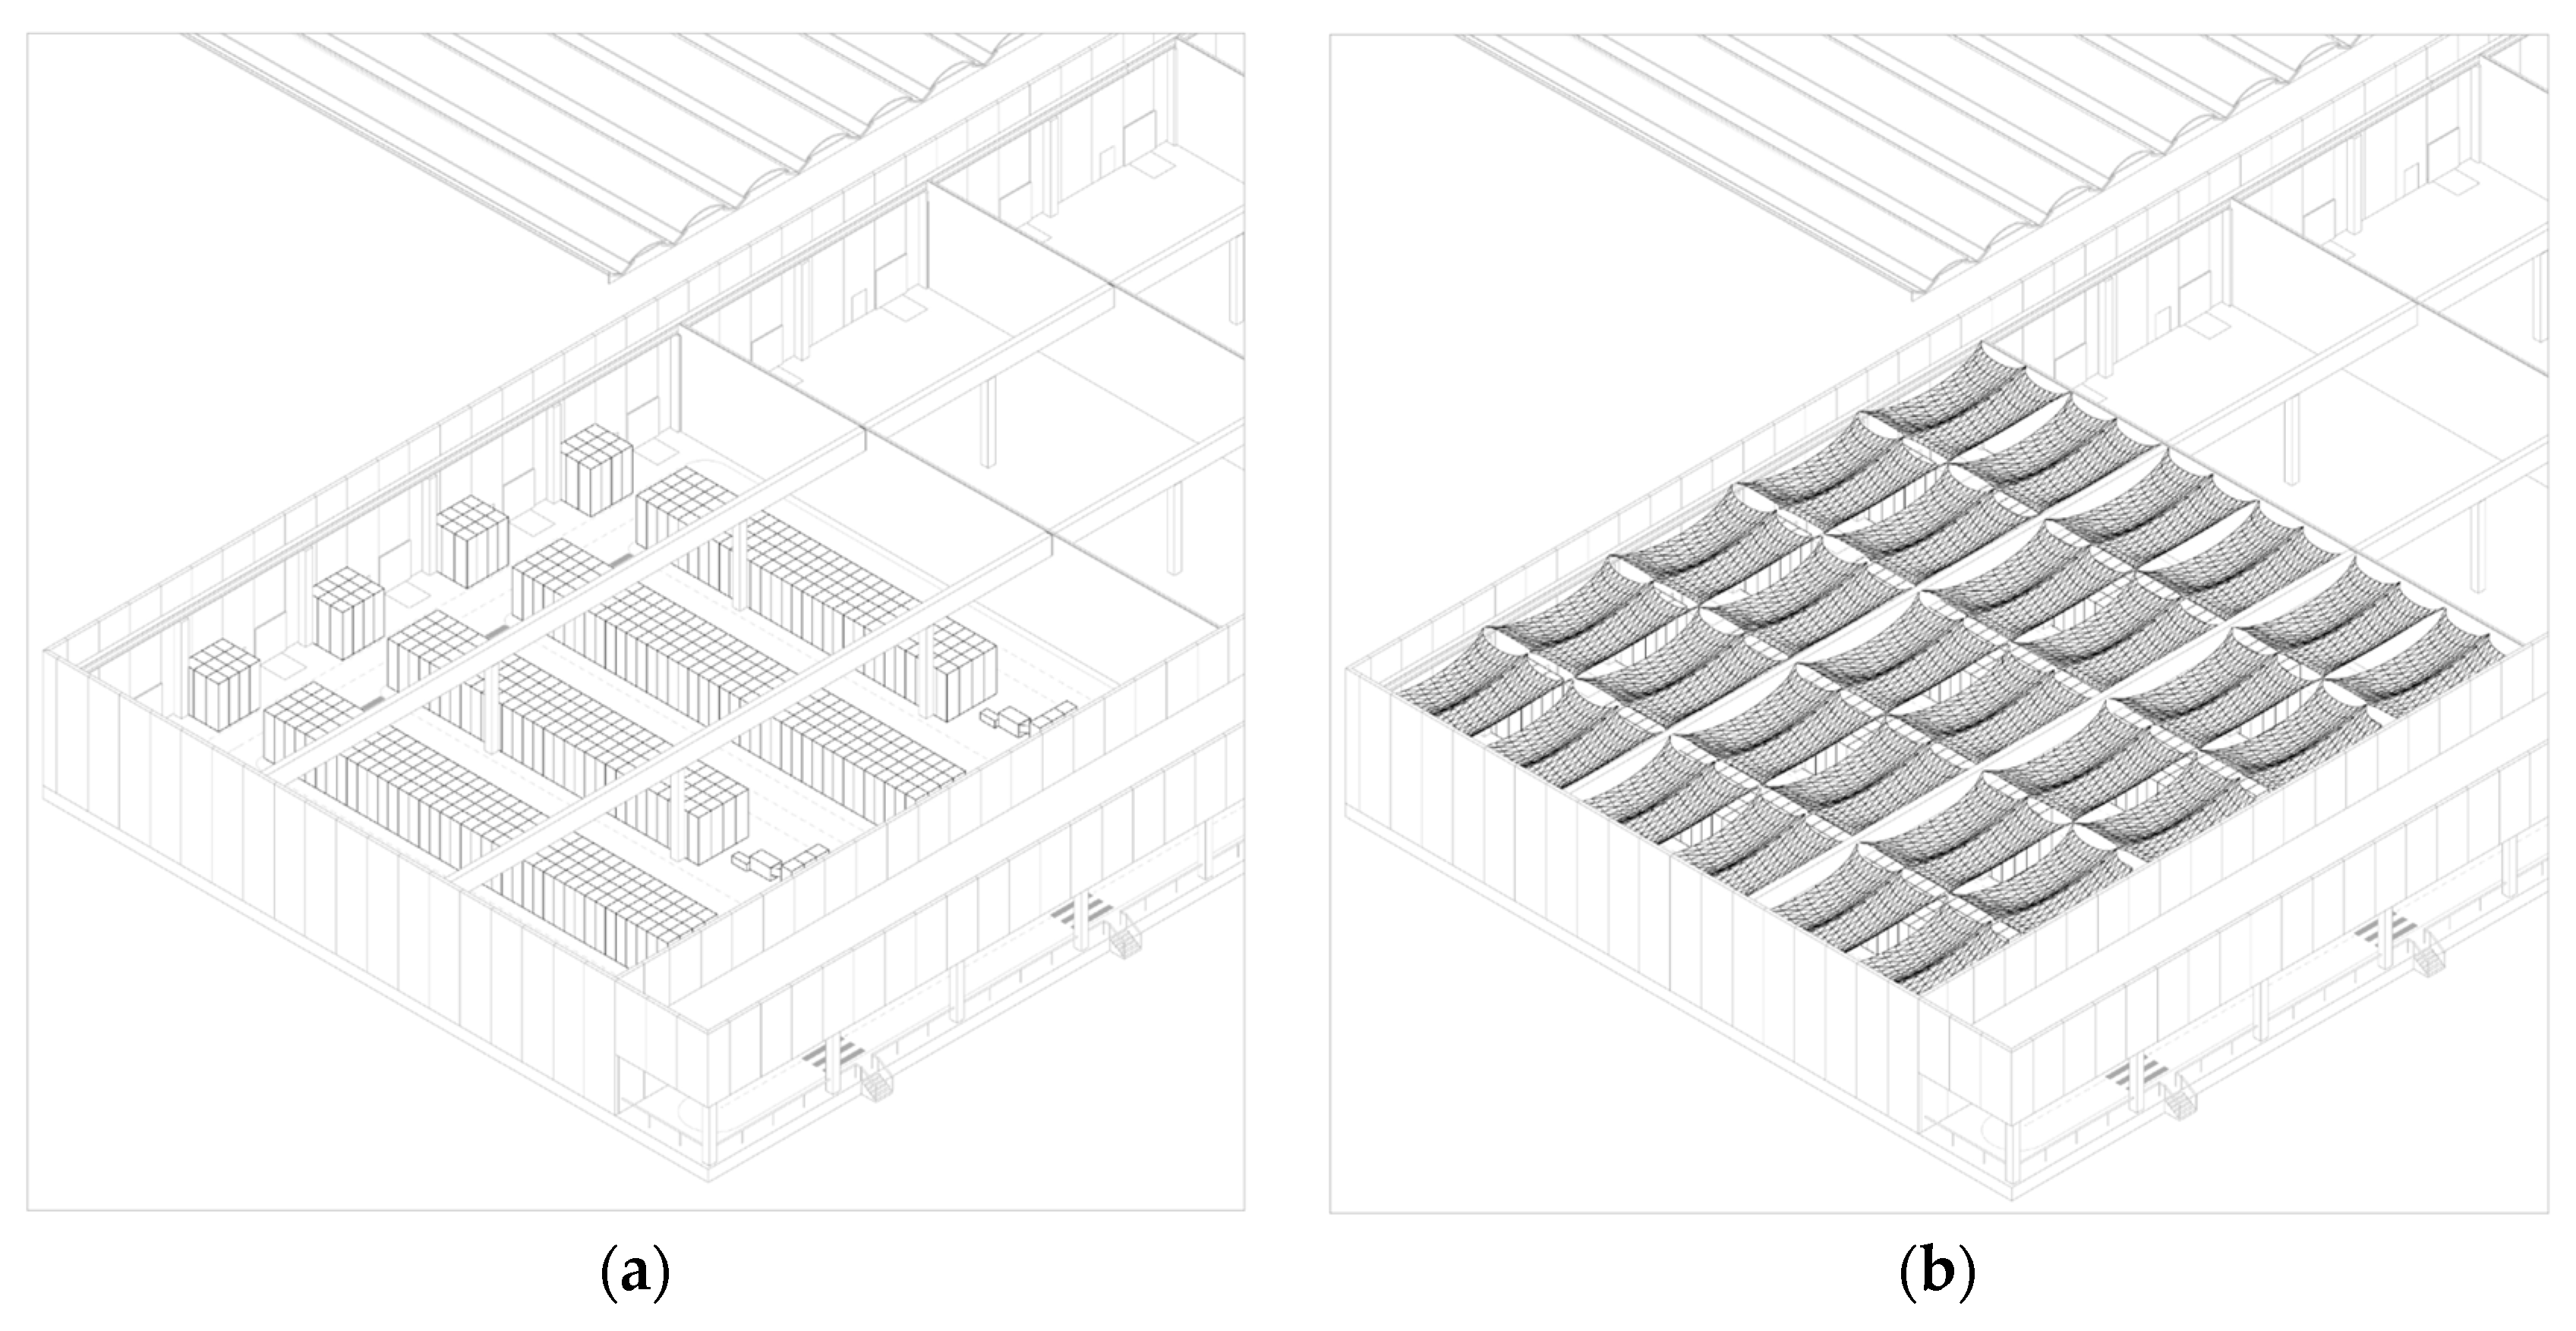
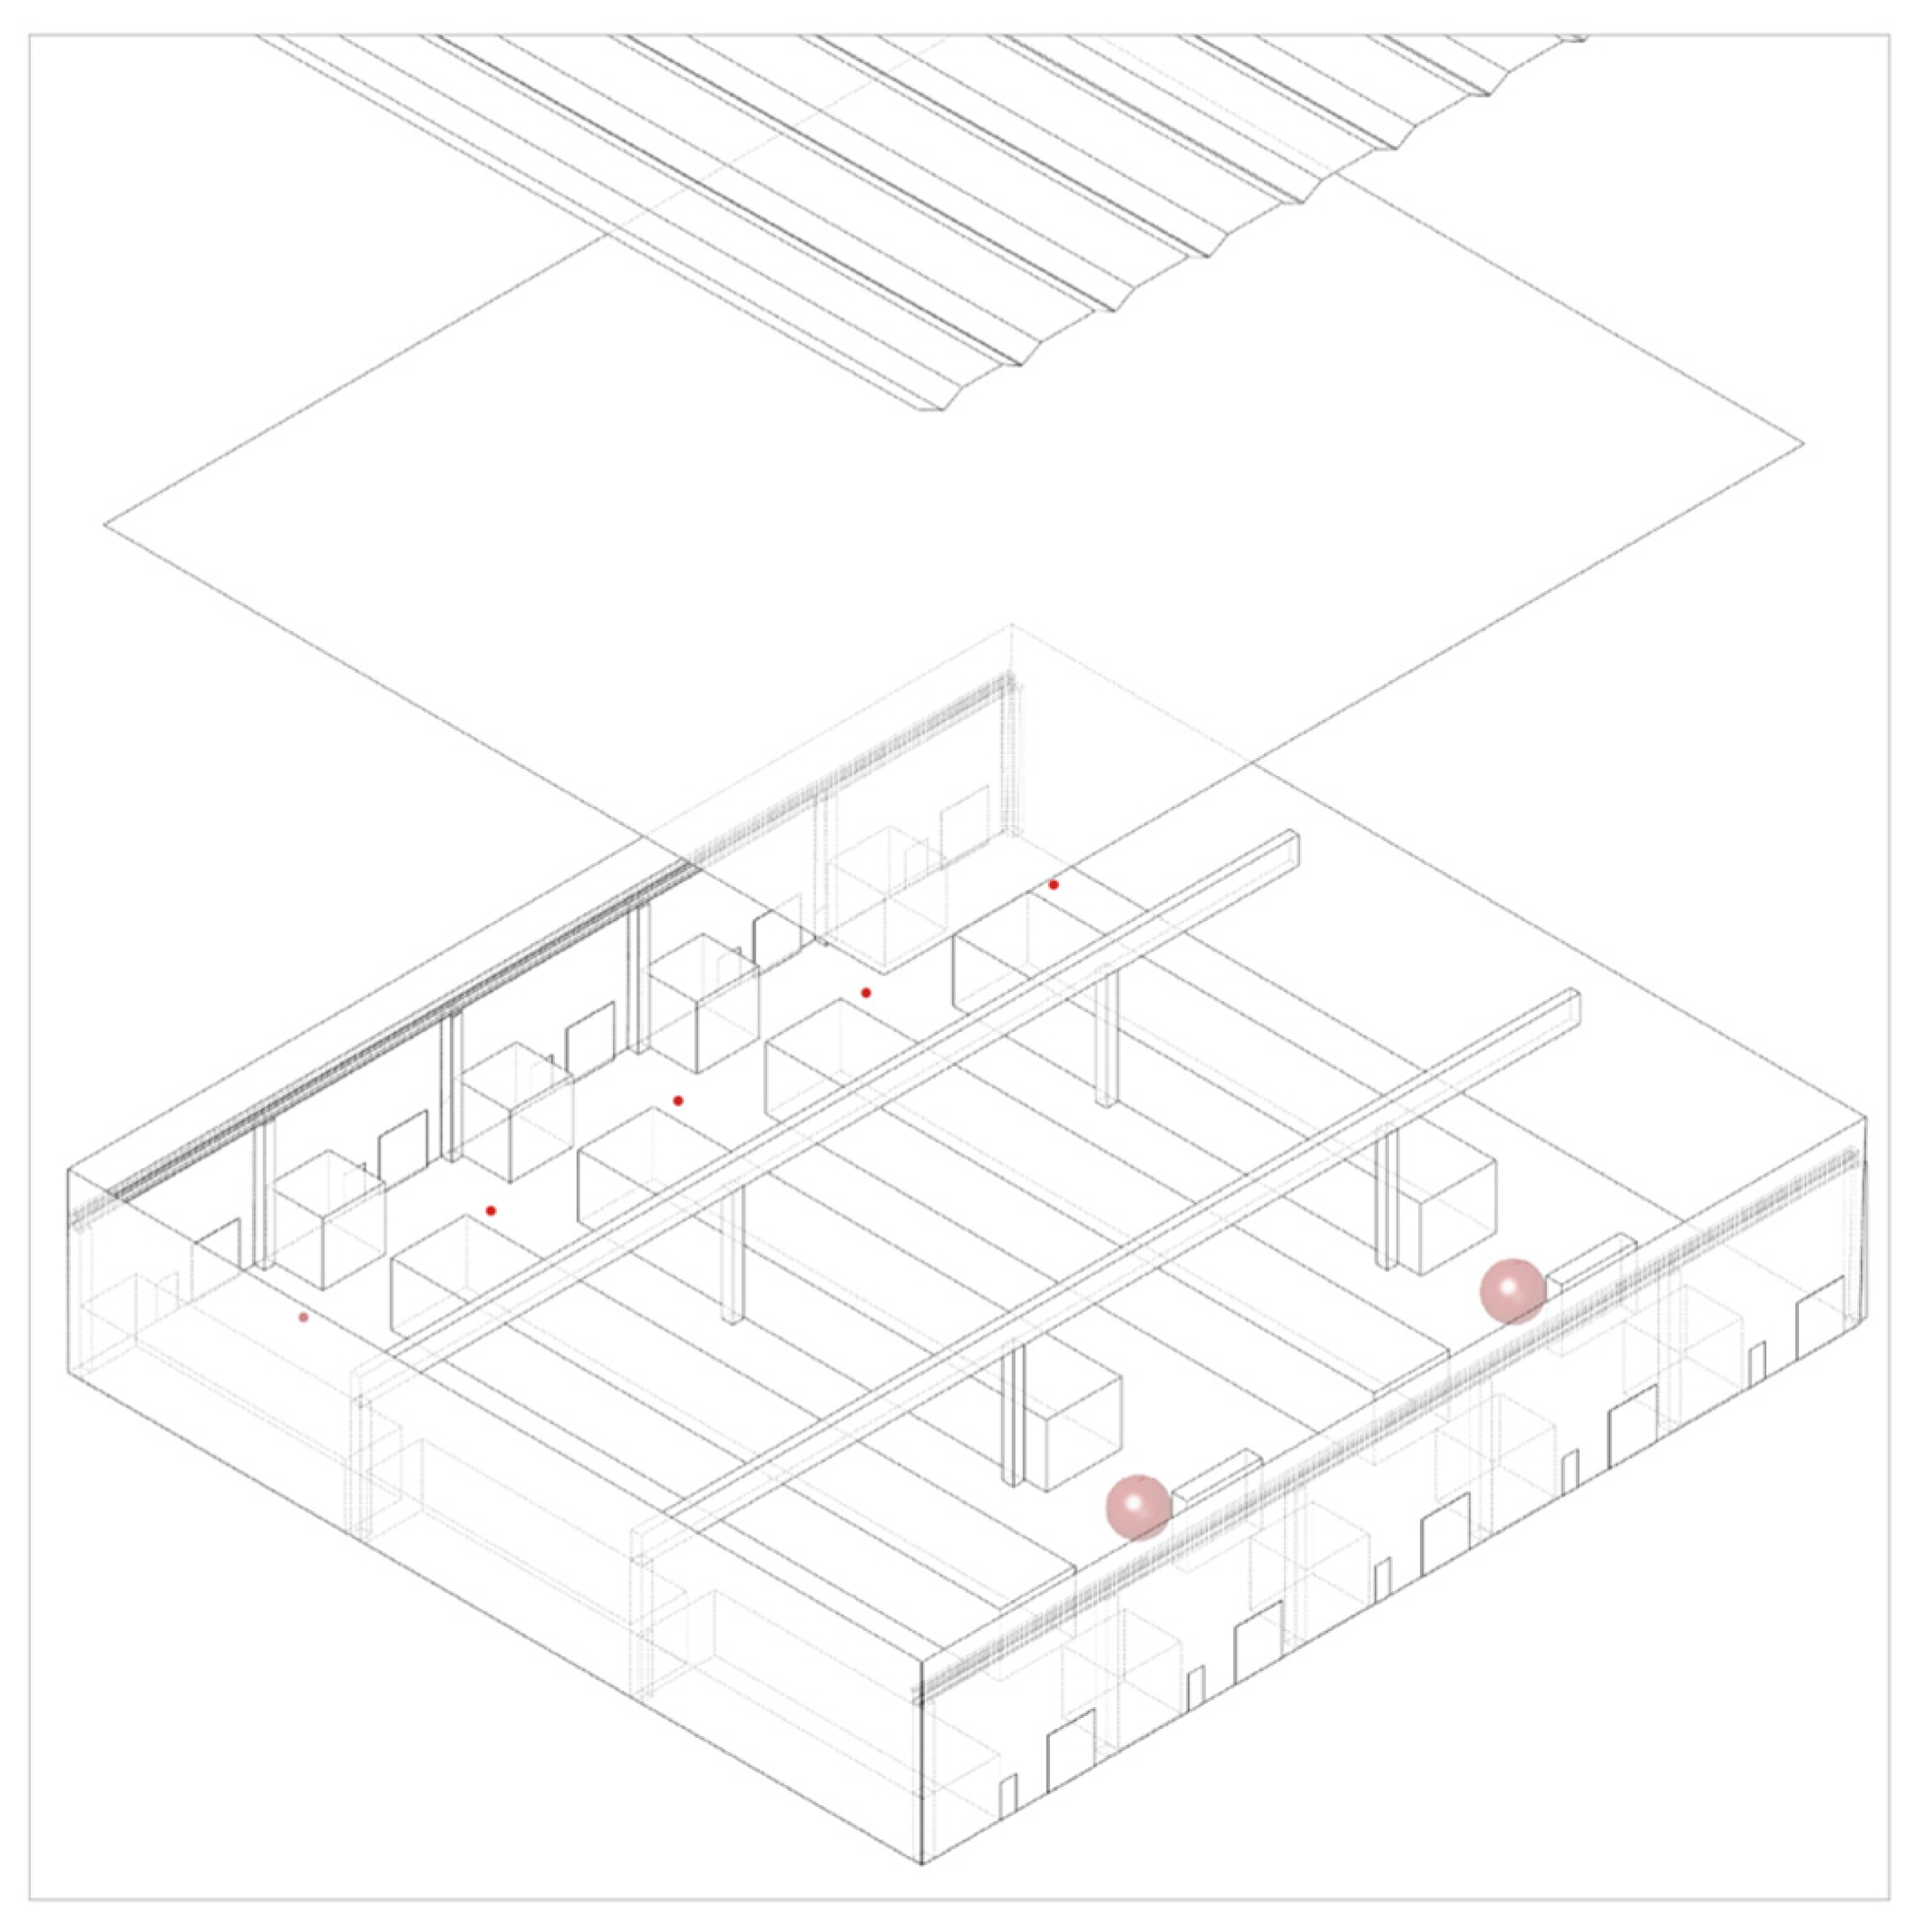
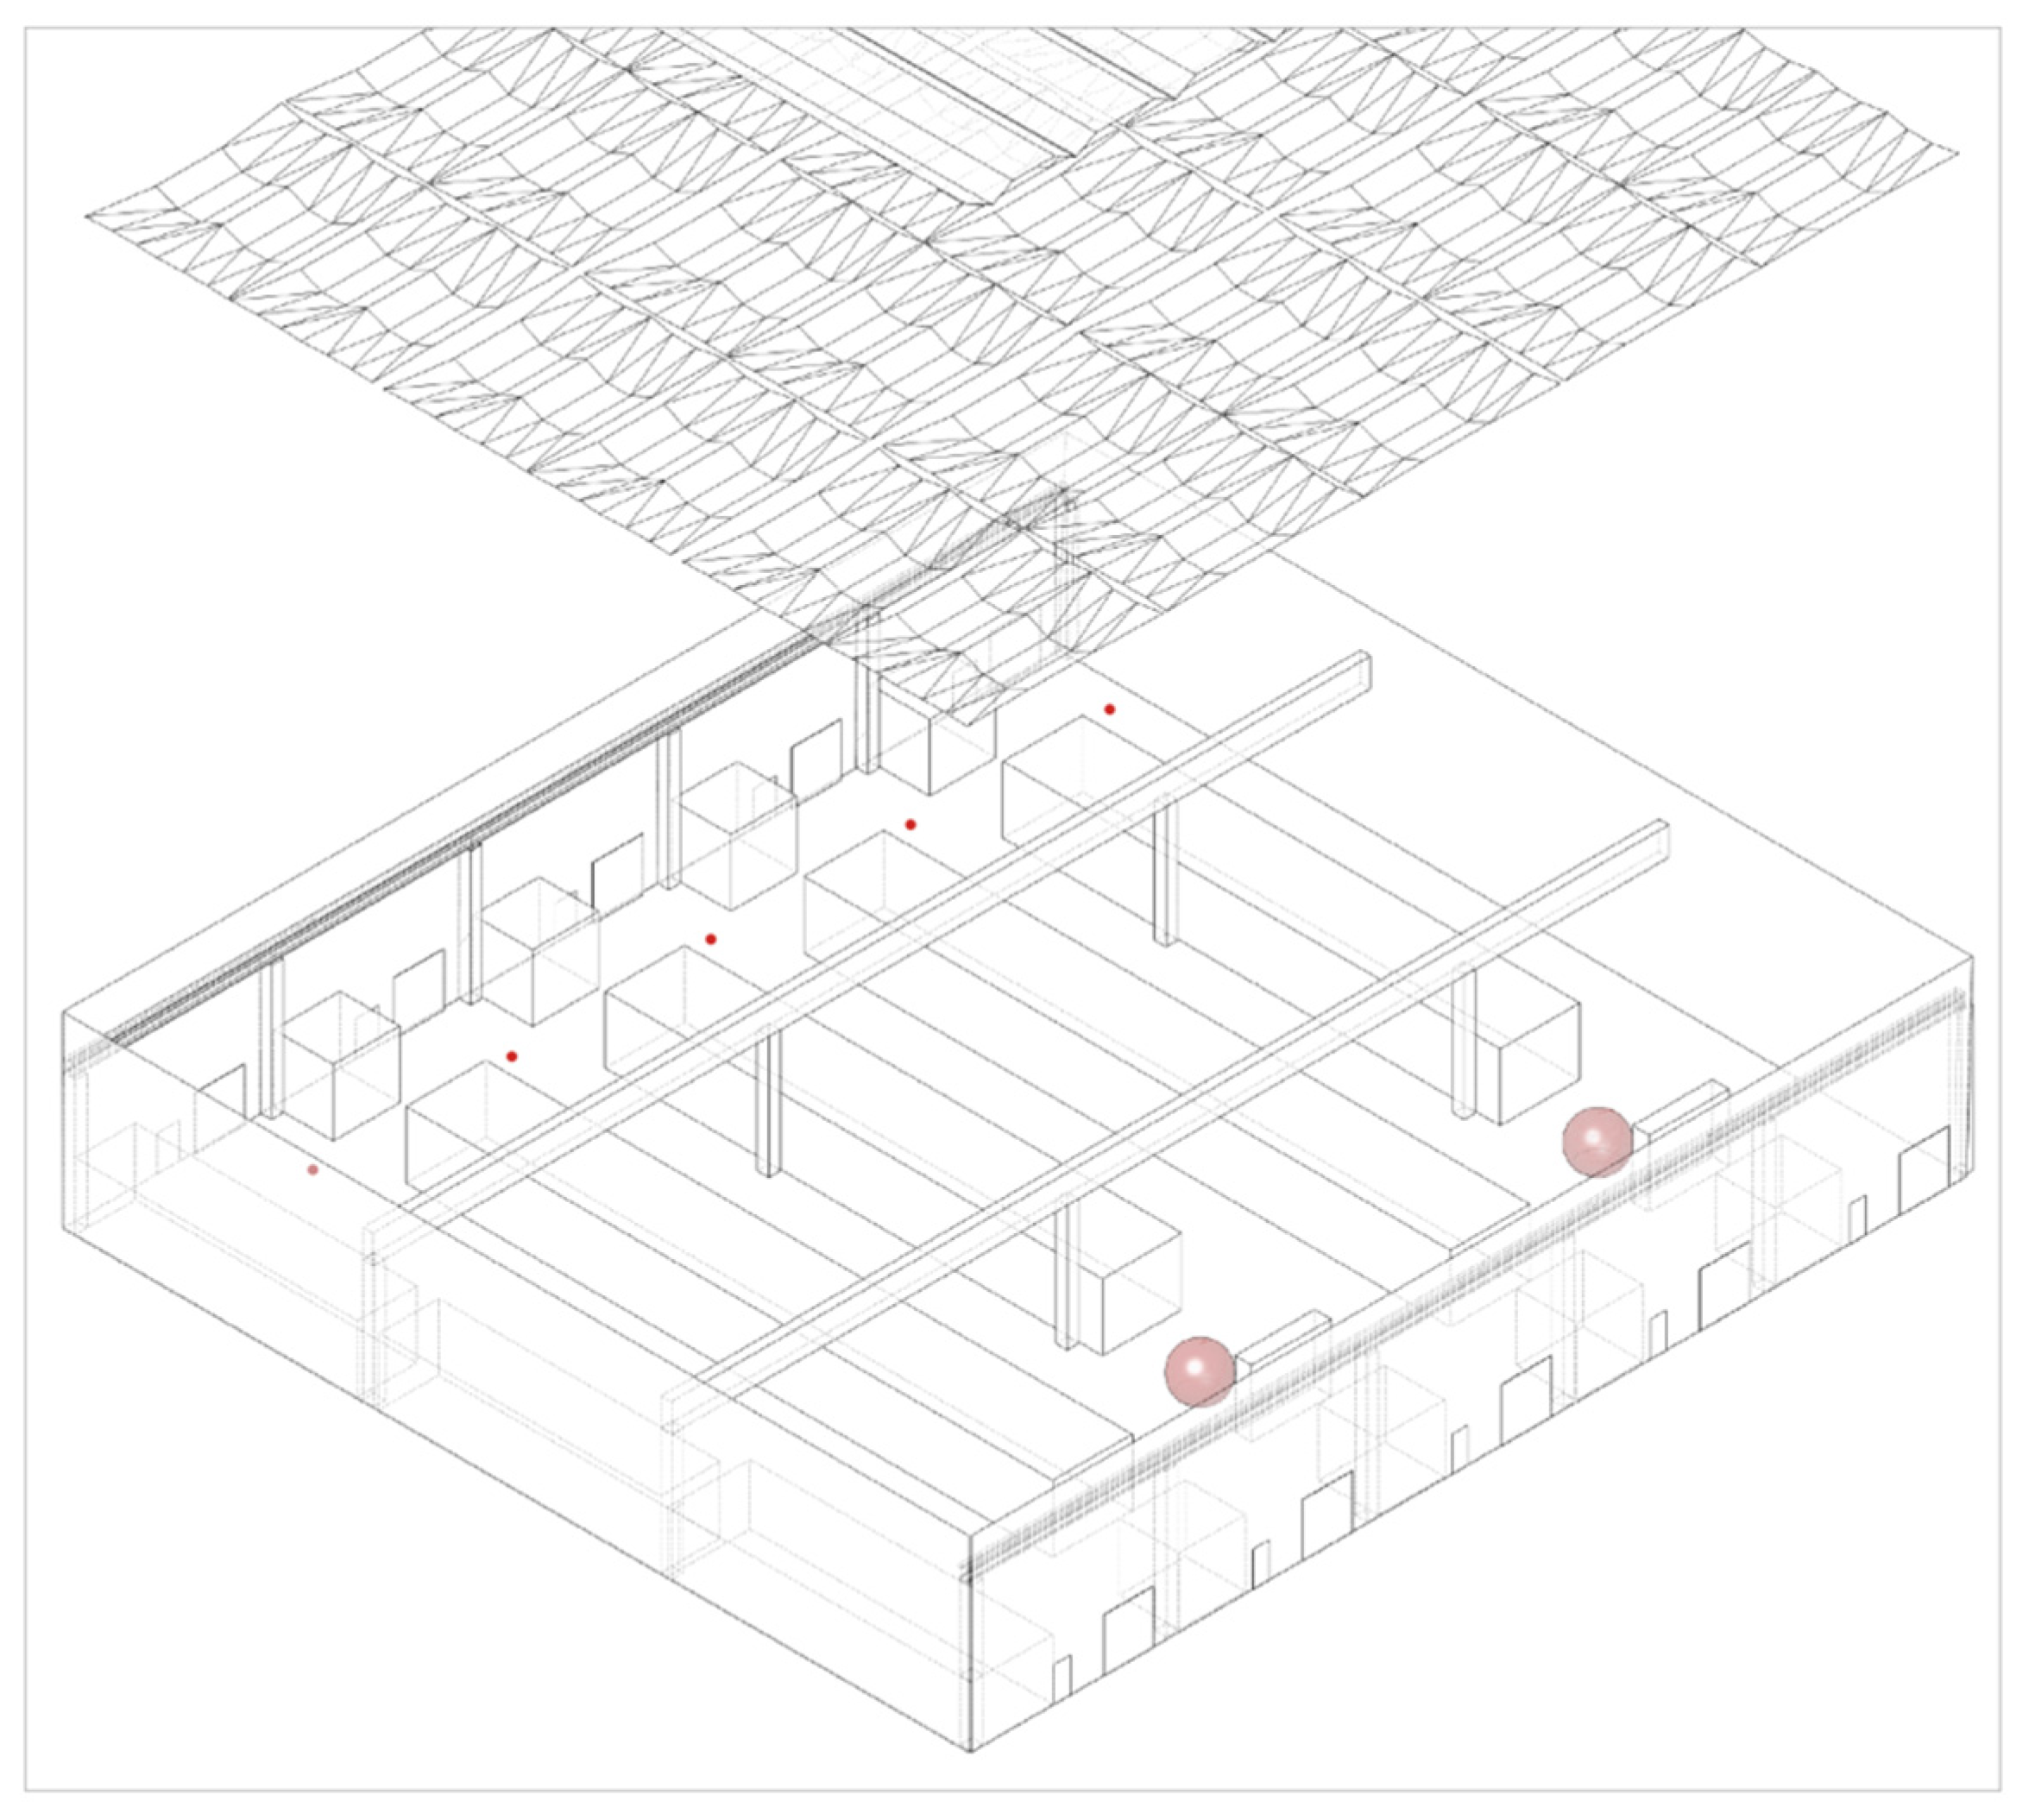
To proceed with an effective analysis, it is necessary to recreate, in a simplified way, the environment in which the membranes were added to verify their acoustic effectiveness (Figure 11a,b). For this reason, various pieces of information were collected which allowed the building to be simulated and faithfully recreated on a virtual level. This information includes the construction system, the dimensions of the room, the materials of the surface finishes and the position of the acoustic sources and of the receivers, coinciding with the areas characterized by a high permanence of personnel. All the spatial and geometric properties of the building are considered: the environment is disproportionate as it is a very large space and flattened in height. This means that the operation is carried out in an acoustic field in which the extended dimensions of the surrounding surfaces and the volume of the room make it possible to approximate the sound waves to acoustic rays that interact with the environment, reflecting themselves specularly in contact with the spatial limits.
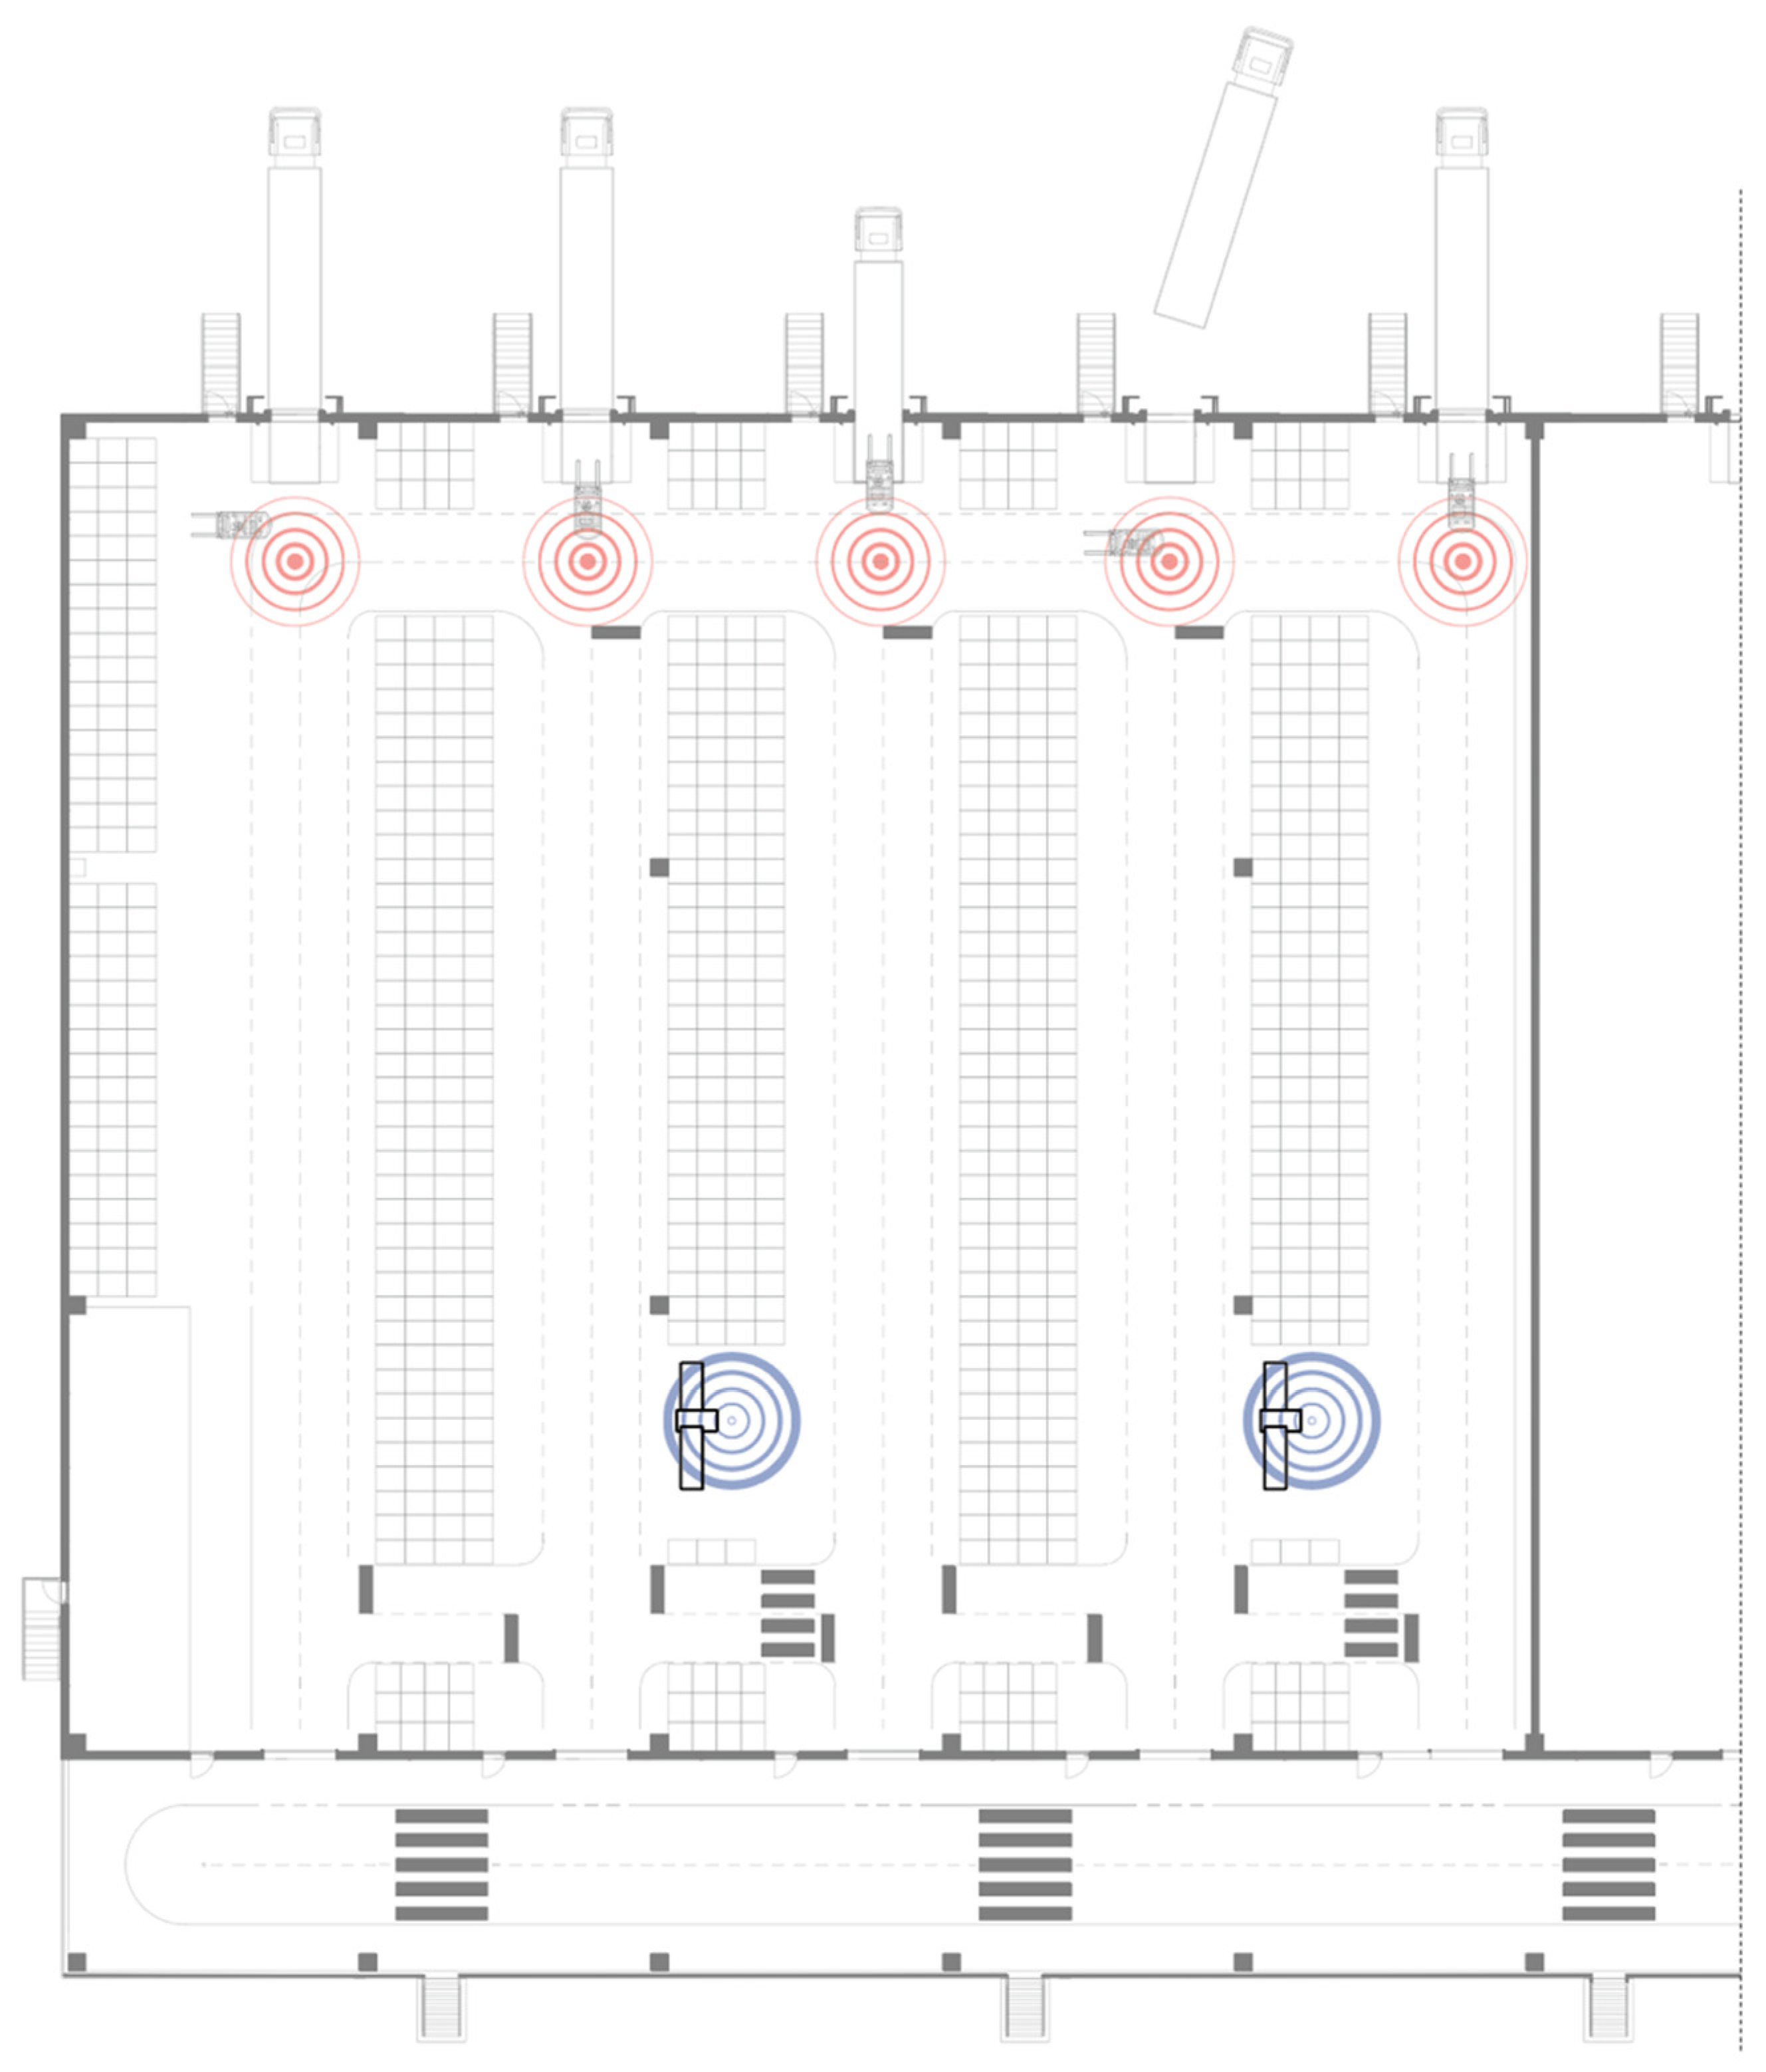
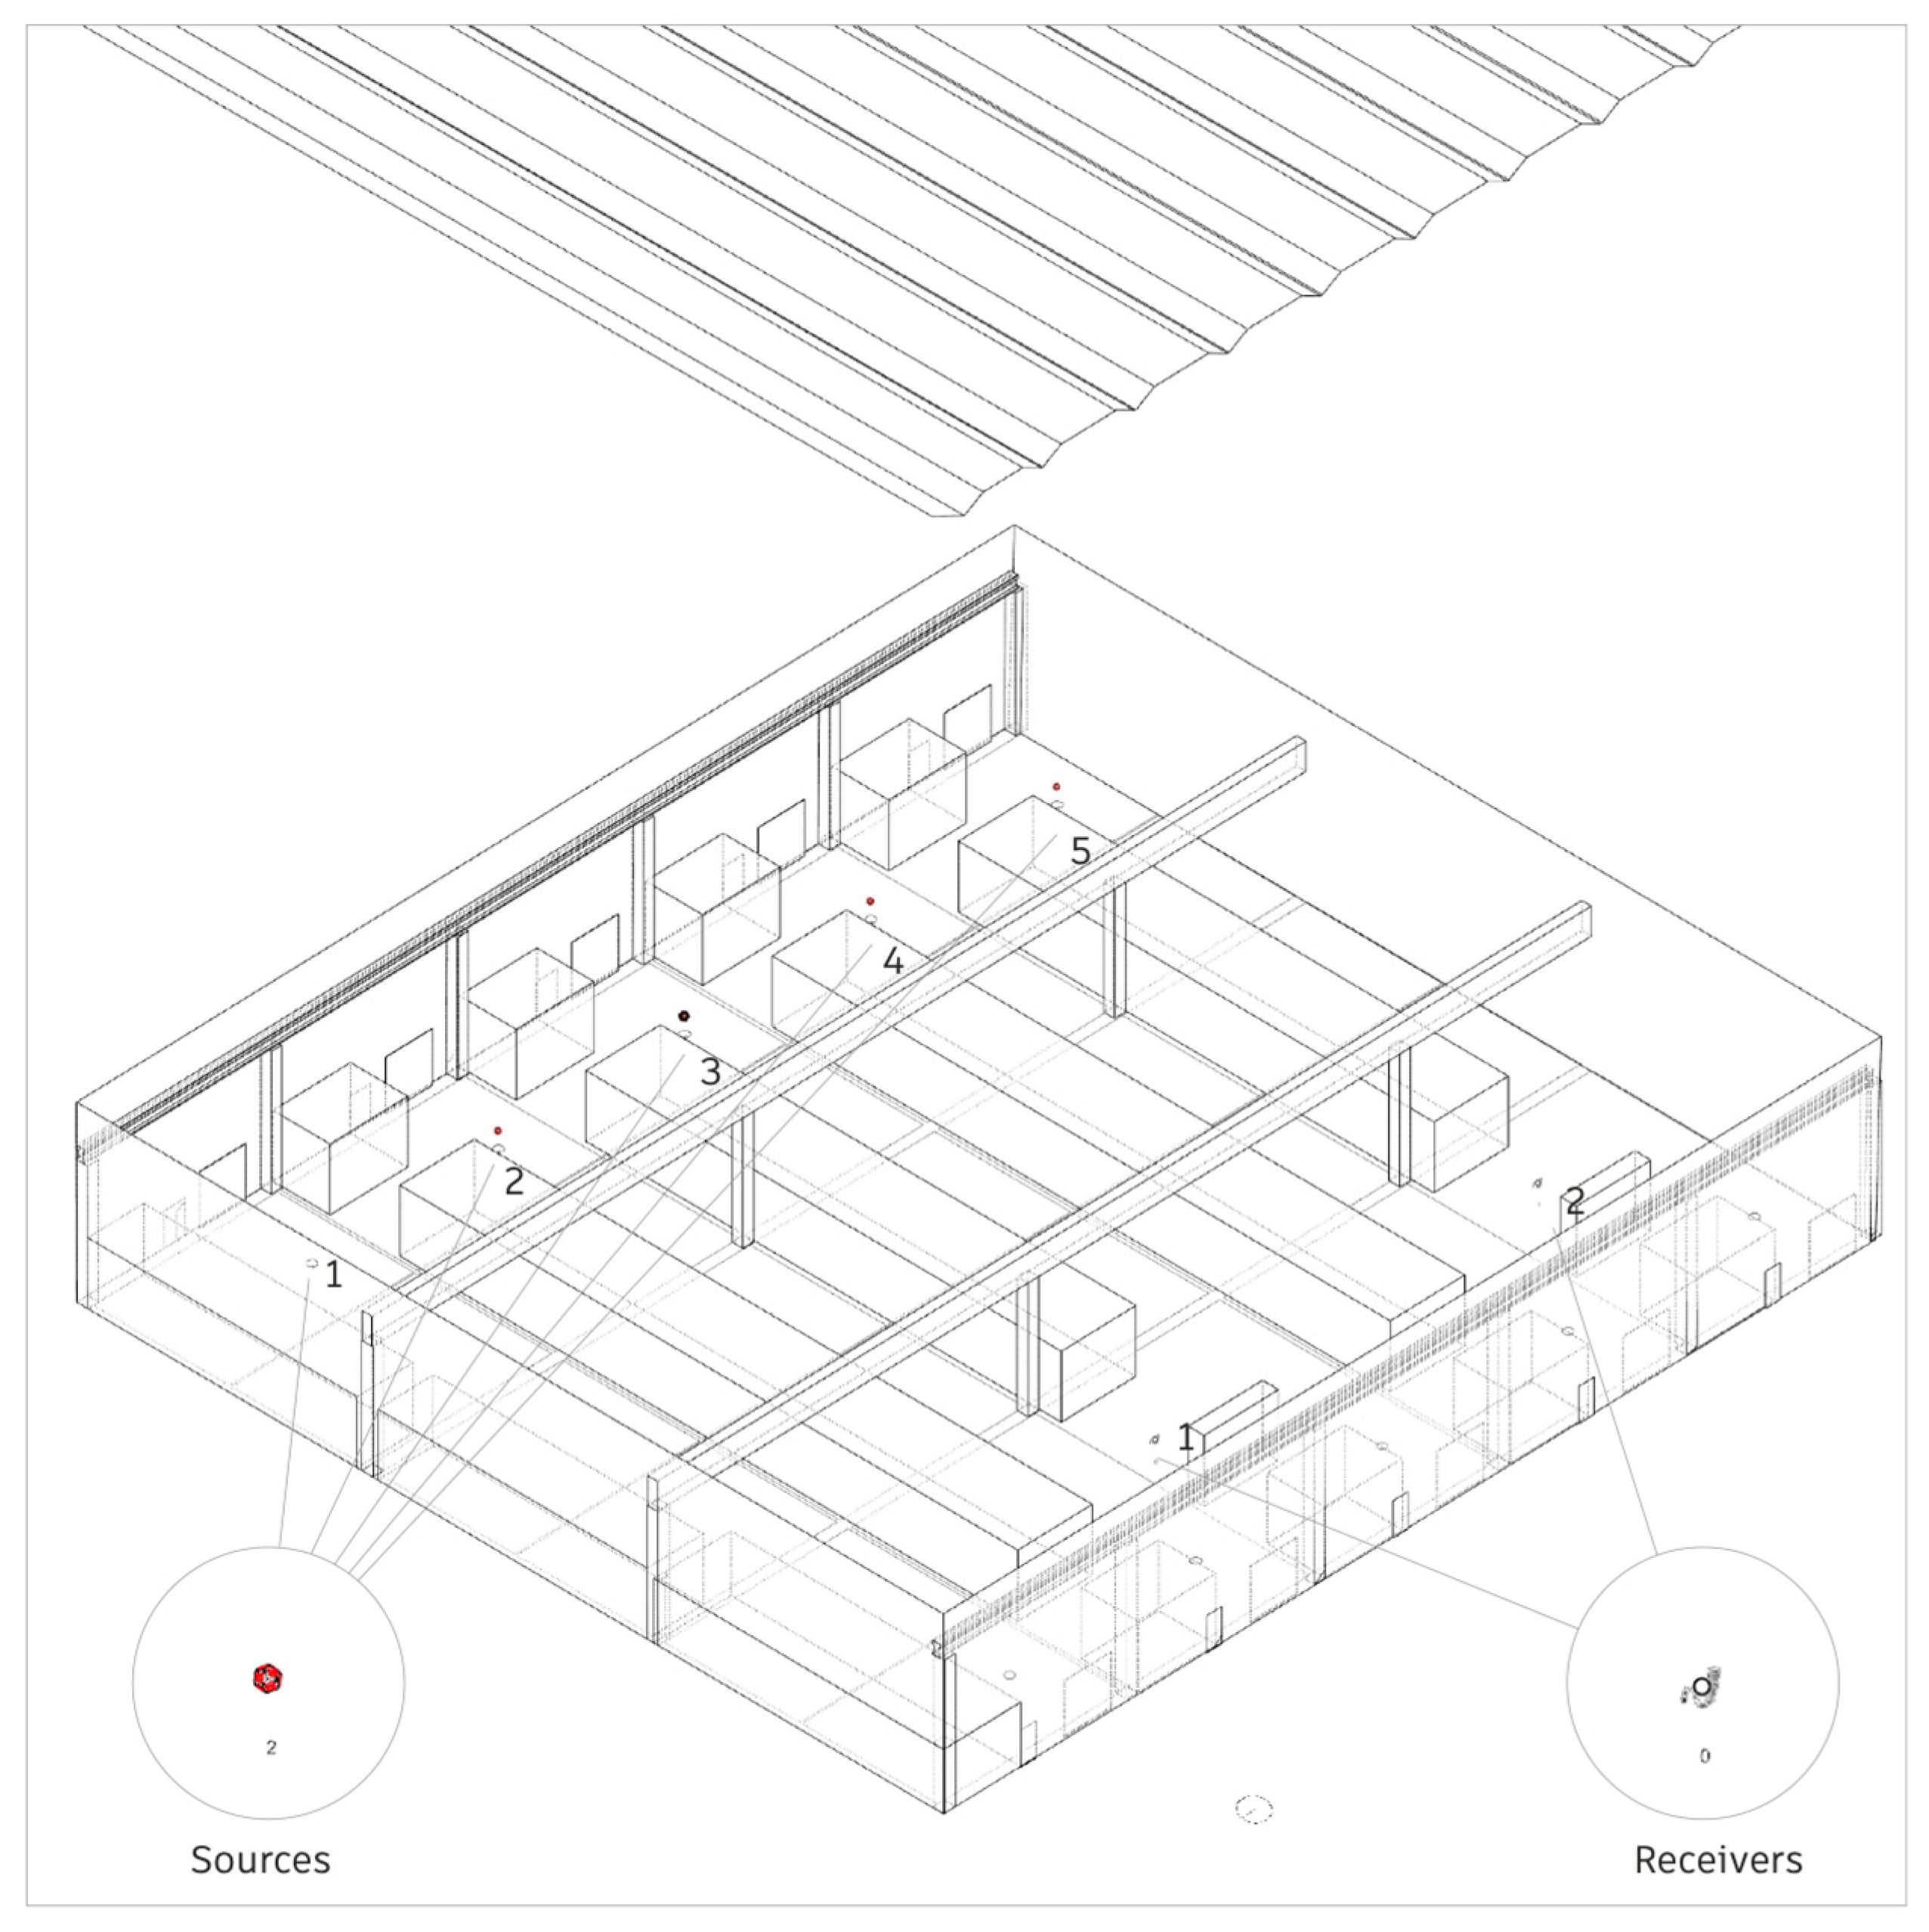
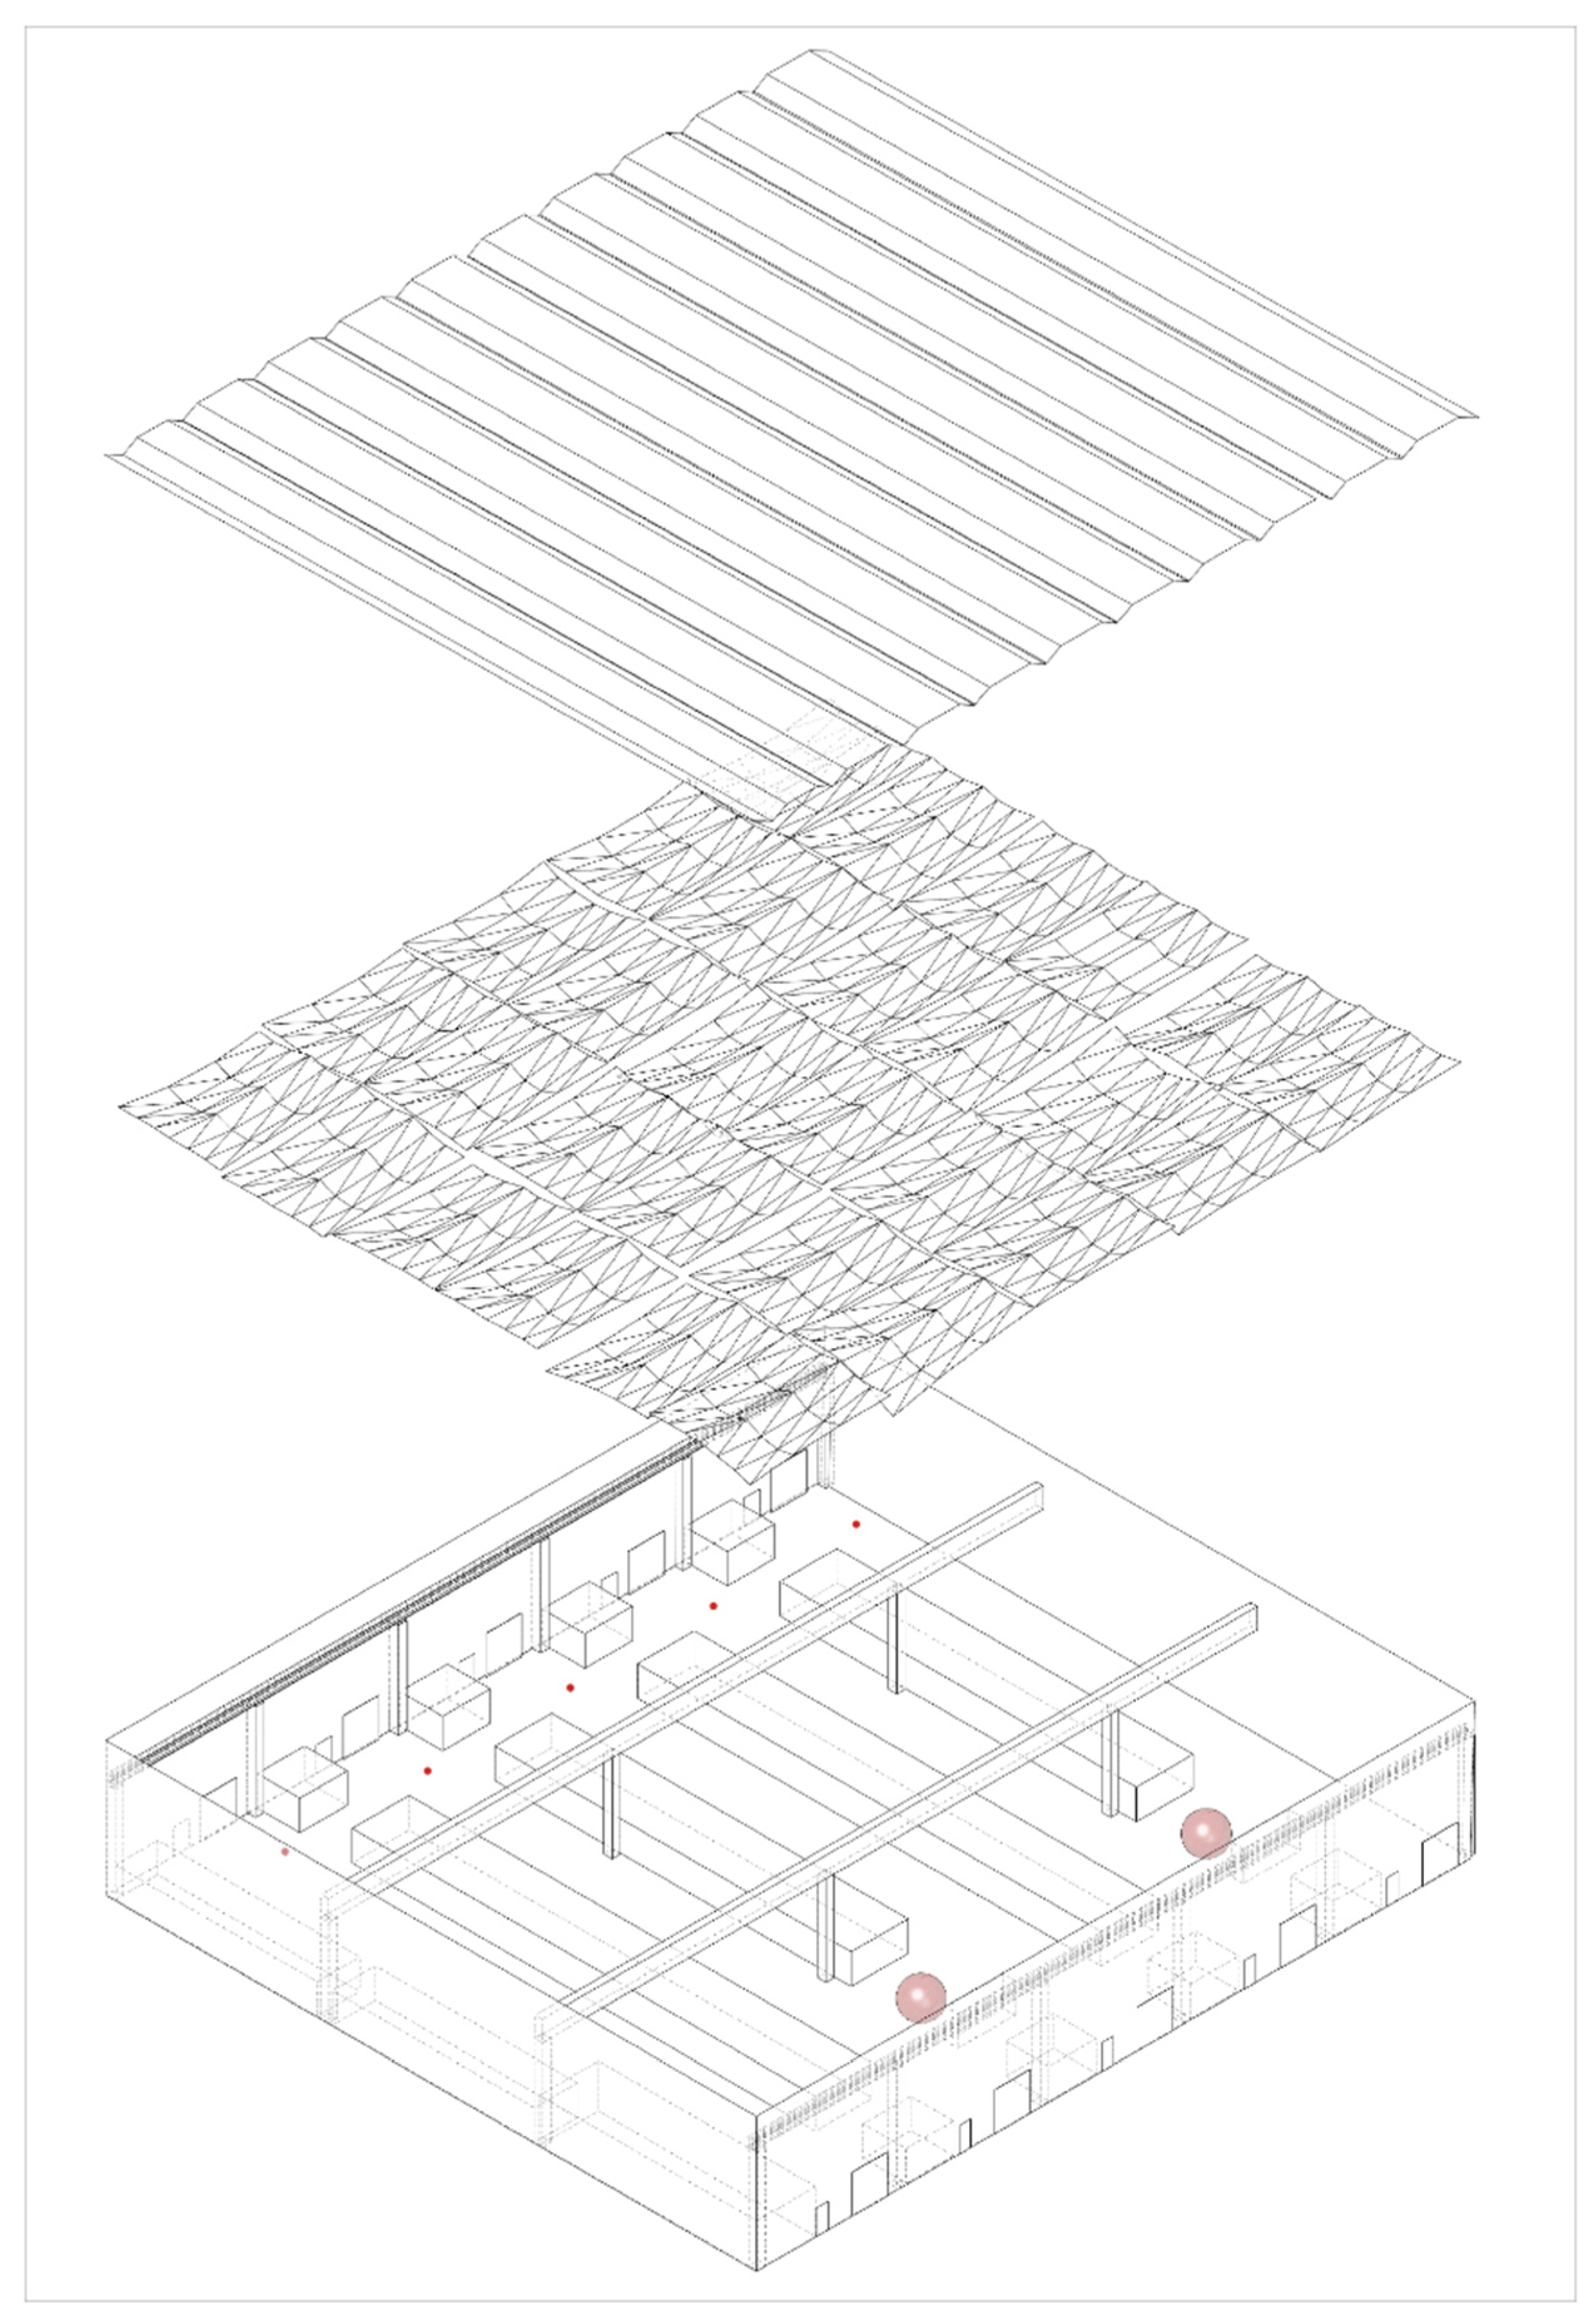
Since the acoustic field is strongly influenced by the boundary surfaces, it is necessary to better understand the characteristics of these limits. Being part of an industrial structure, the “Cella 1” room is closed from the outside by walls composed of insulated prefabricated panels with an external and internal concrete finish and from the adjacent cell by a wall of sandwich panels with a galvanized steel finish. The floor surface is made by a smooth concrete casting. The load-bearing structural elements, such as the beams and pillars, are prefabricated reinforced concrete elements. Finally, the roof is made up of a series of monolithic reinforced concrete tiles which support a system of insulating sandwich panels, covered and made waterproof by bituminous sheaths and PVC domes. There are five entrances on the west side of the room and another five on the east side in the textile material that allow for the transit of forklifts and unloading through the loading bays. The five loading bays coincide with five sources that spread the sound uniformly in all directions of the space, while the receivers are represented by two fixed positions towards the center of the room (Figure 12). The set of noises produced by the handling of loads in correspondence with the loading bays allows them to be assimilated to sources that produce a noise equal to 64.4 dB(A) measured at 5 m, which can be taken as a value for the acoustic analysis (value deduced from similar experiences [22]).
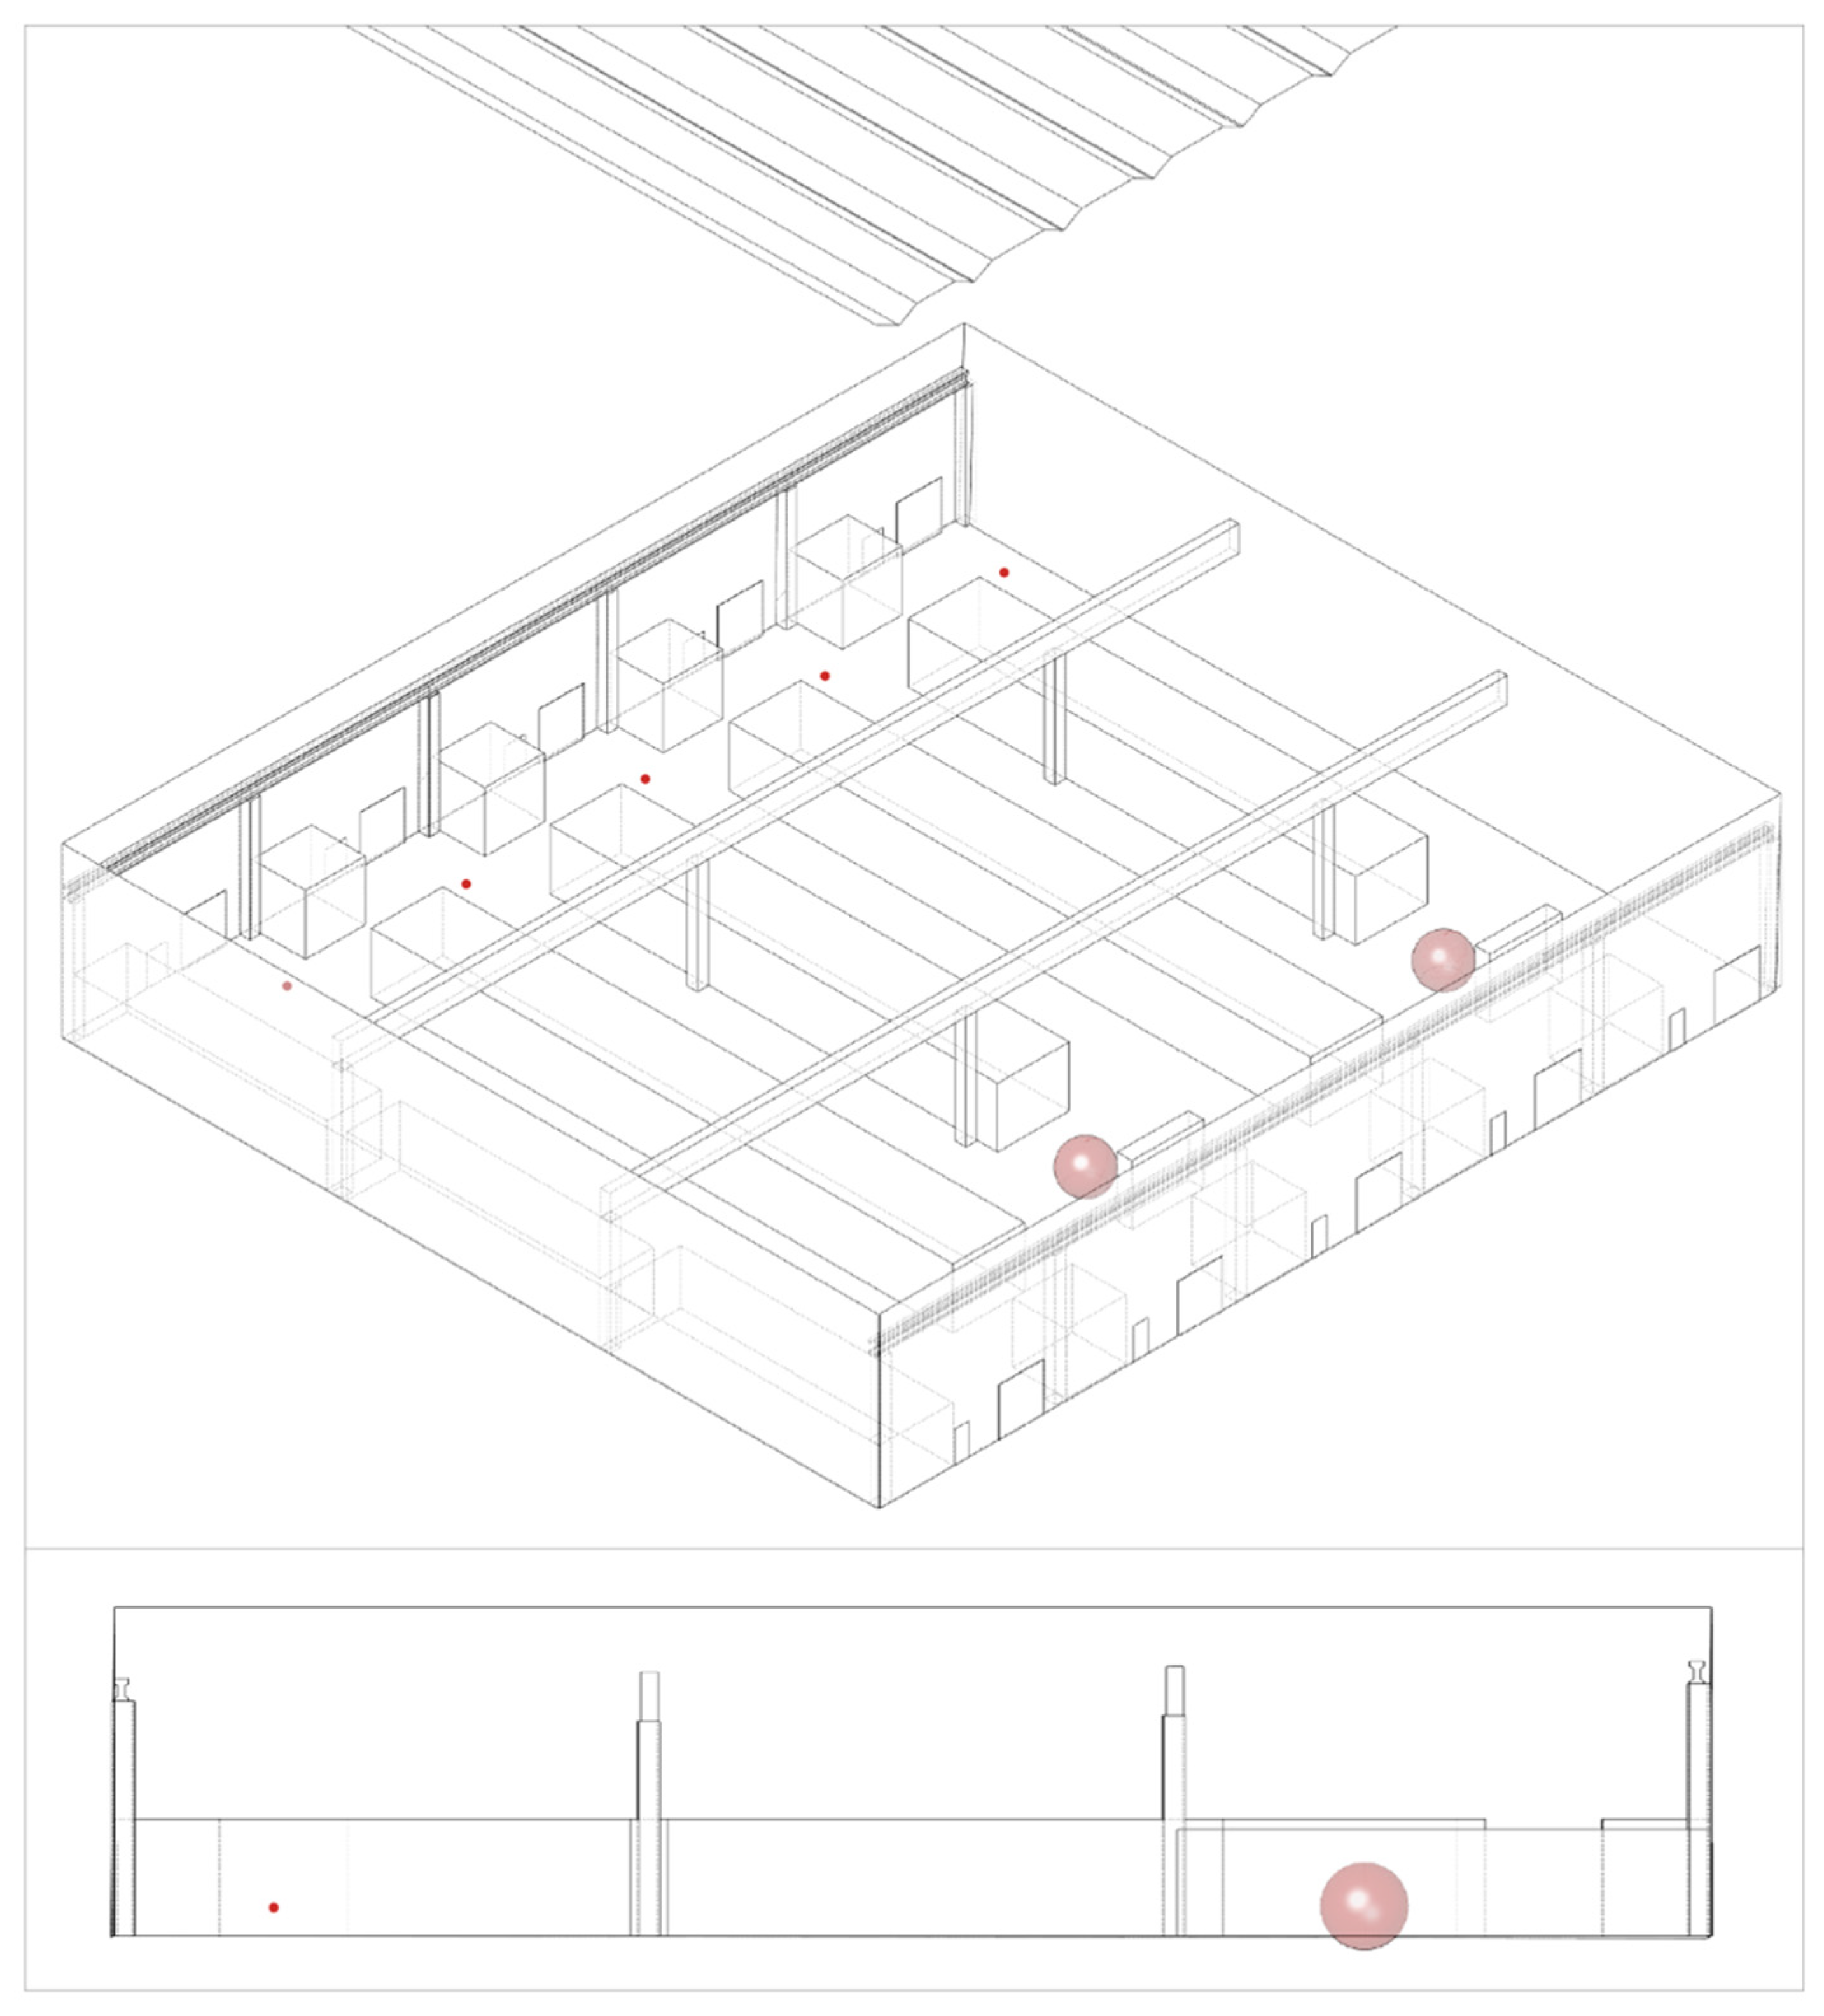
To proceed with the analyses, Form-finding of the membranes installed in the Logistics Platform is carried out. The same procedure used in the previous section is used but this time on a larger scale. The membranes are positioned regularly, covering almost the entire ceiling and increasing the possibility of acoustic control as much as possible. They are suspended by six points, which change the shape of the fabric by changing in height. This procedure is very expensive in terms of the calculation, for this reason the operation is completed in a three-dimensional environment simplified as much as possible. The two spheres corresponding to the areas of action of the sources and the receivers, represented by the five points positioned near the loading bays, are shown in Figure 13.
The size of the spheres is particularly important as they must be big enough to intercept the rays originating from the sources but not too large as to alter the precision of the simulation. In this case, the spheres have a radius of 1.5 m. Since the users who occupy these areas are never at a height greater than 3 m, it was decided to lower the spheres, making them intersect the ground plane. In this way, it is possible to perform a more precise simulation.
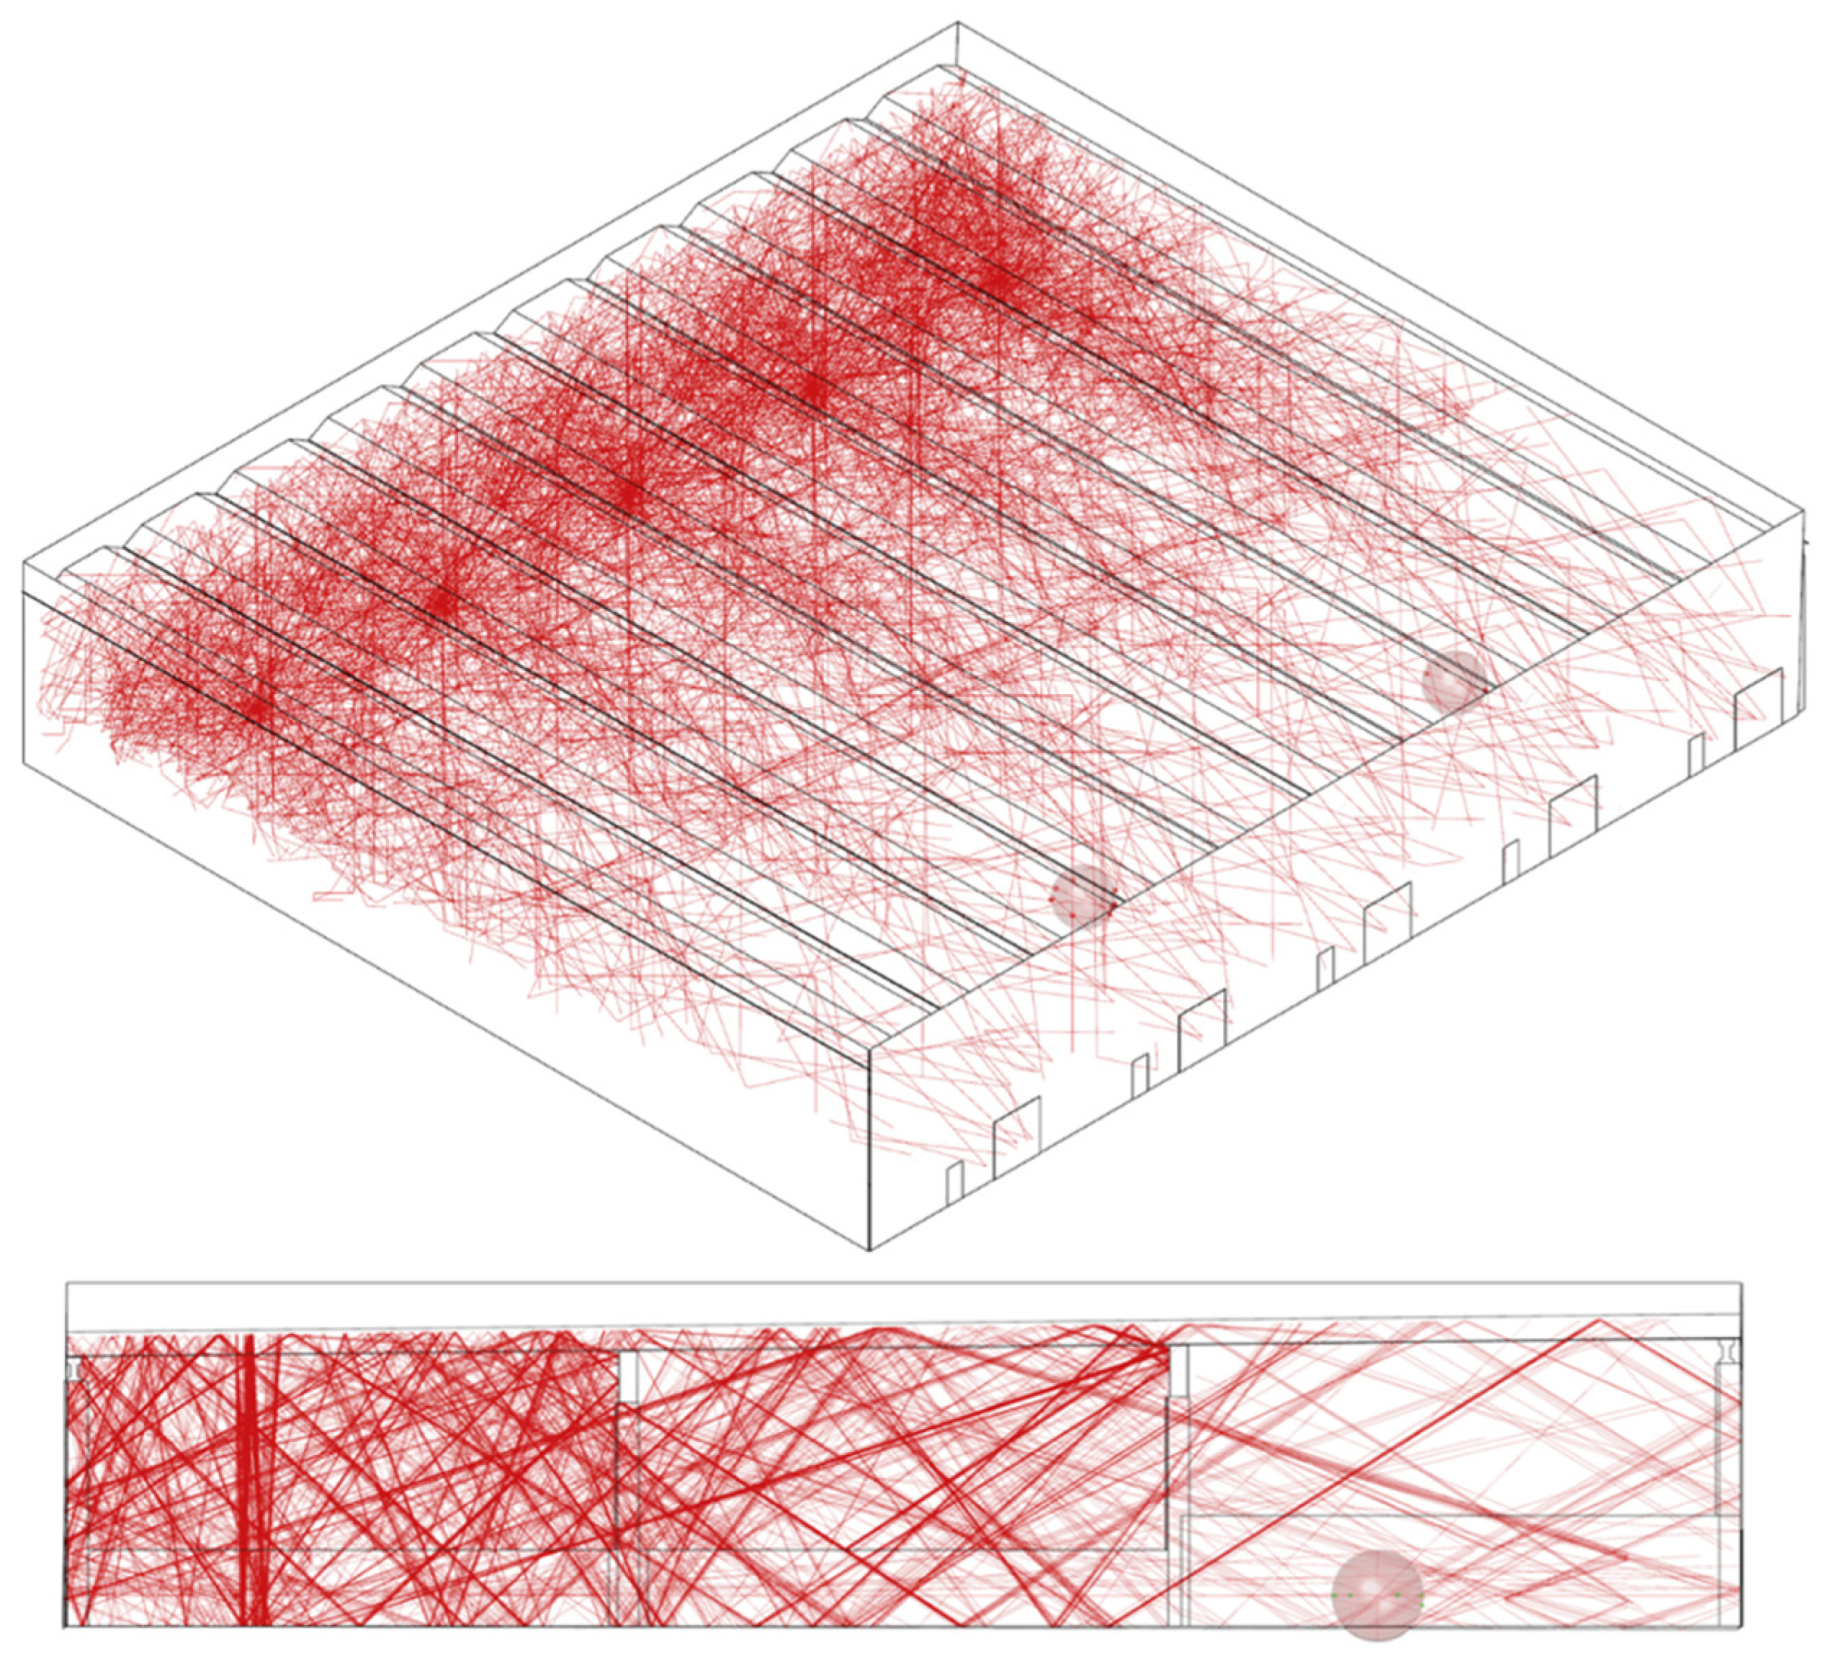
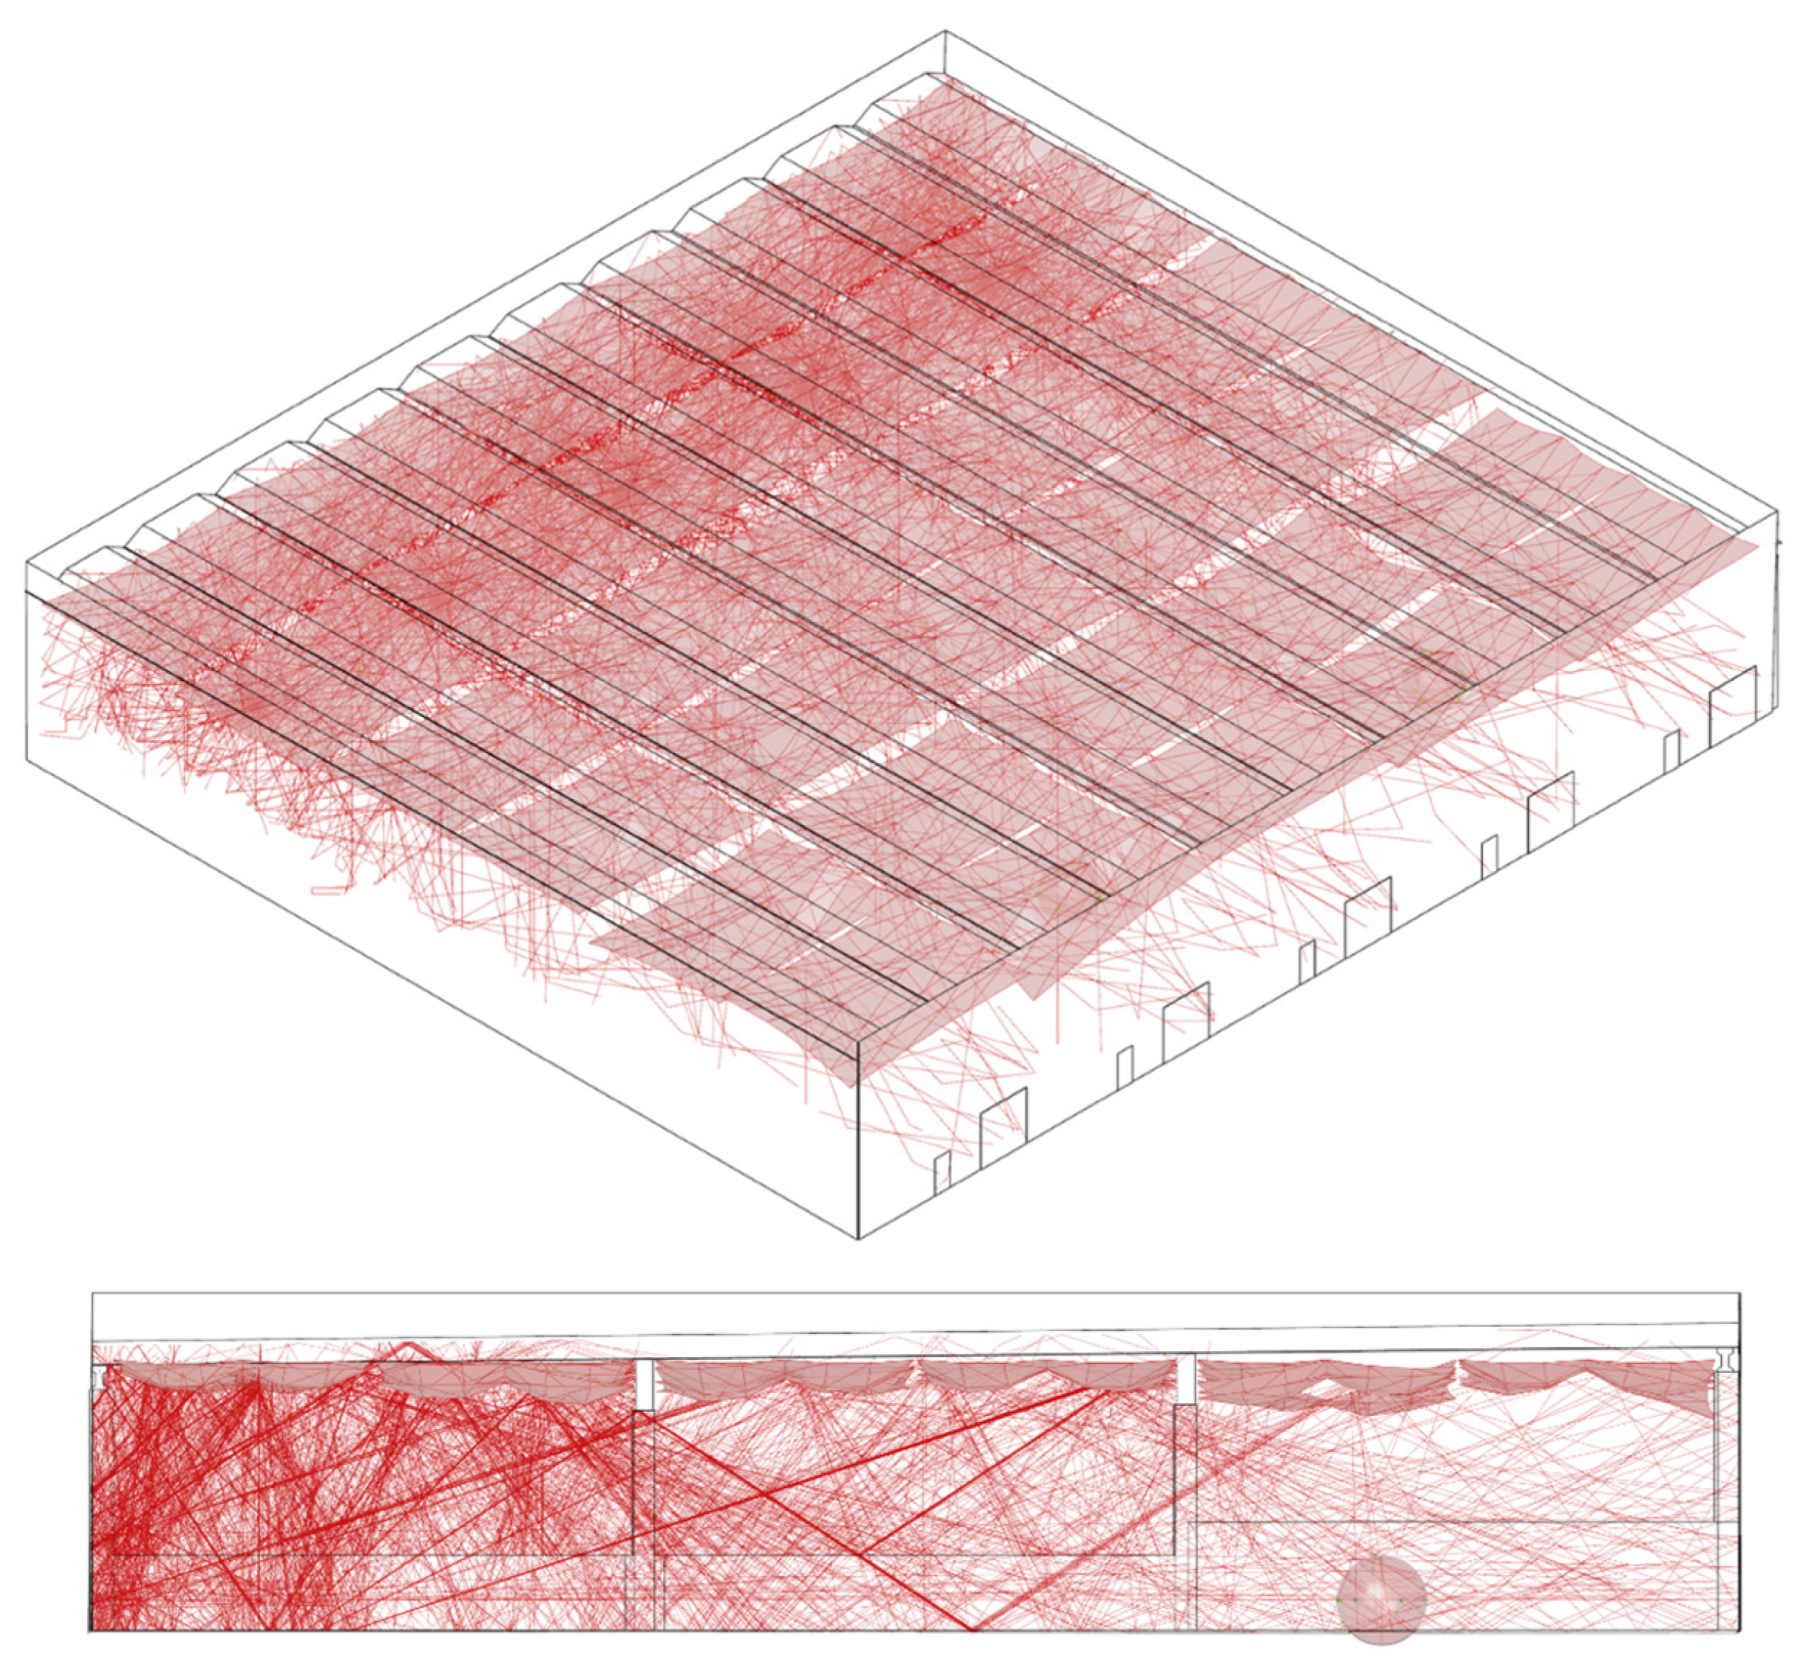
To proceed, it is necessary to identify the rays coming from the sources. Since these entities contribute to an increased calculation time, it is crucial to set their parameters correctly. The rays, represented by the red lines, interact with the contour surfaces up to the fifth reflection, another value that can be set from the interface of the software used for the simulation. It is specified that for Figure 14, Figure 15 and Figure 16, the number of rays originating from the sources has been minimized to make them readable. The membranes are added, all suspended at the same height. The procedure considers both the surfaces of the objects and those of the environment, treating them as interactive surfaces that the rays can interact with.
As explained in the previous section, the Form-finding process in this case is also based on a precise parameter: the number of intersections between the rays and the receiving spheres. The algorithm is set so that it takes this number as the reference value. The process tries to find the lowest possible value by interacting with all the variables represented by the heights of each anchor point of the membranes.
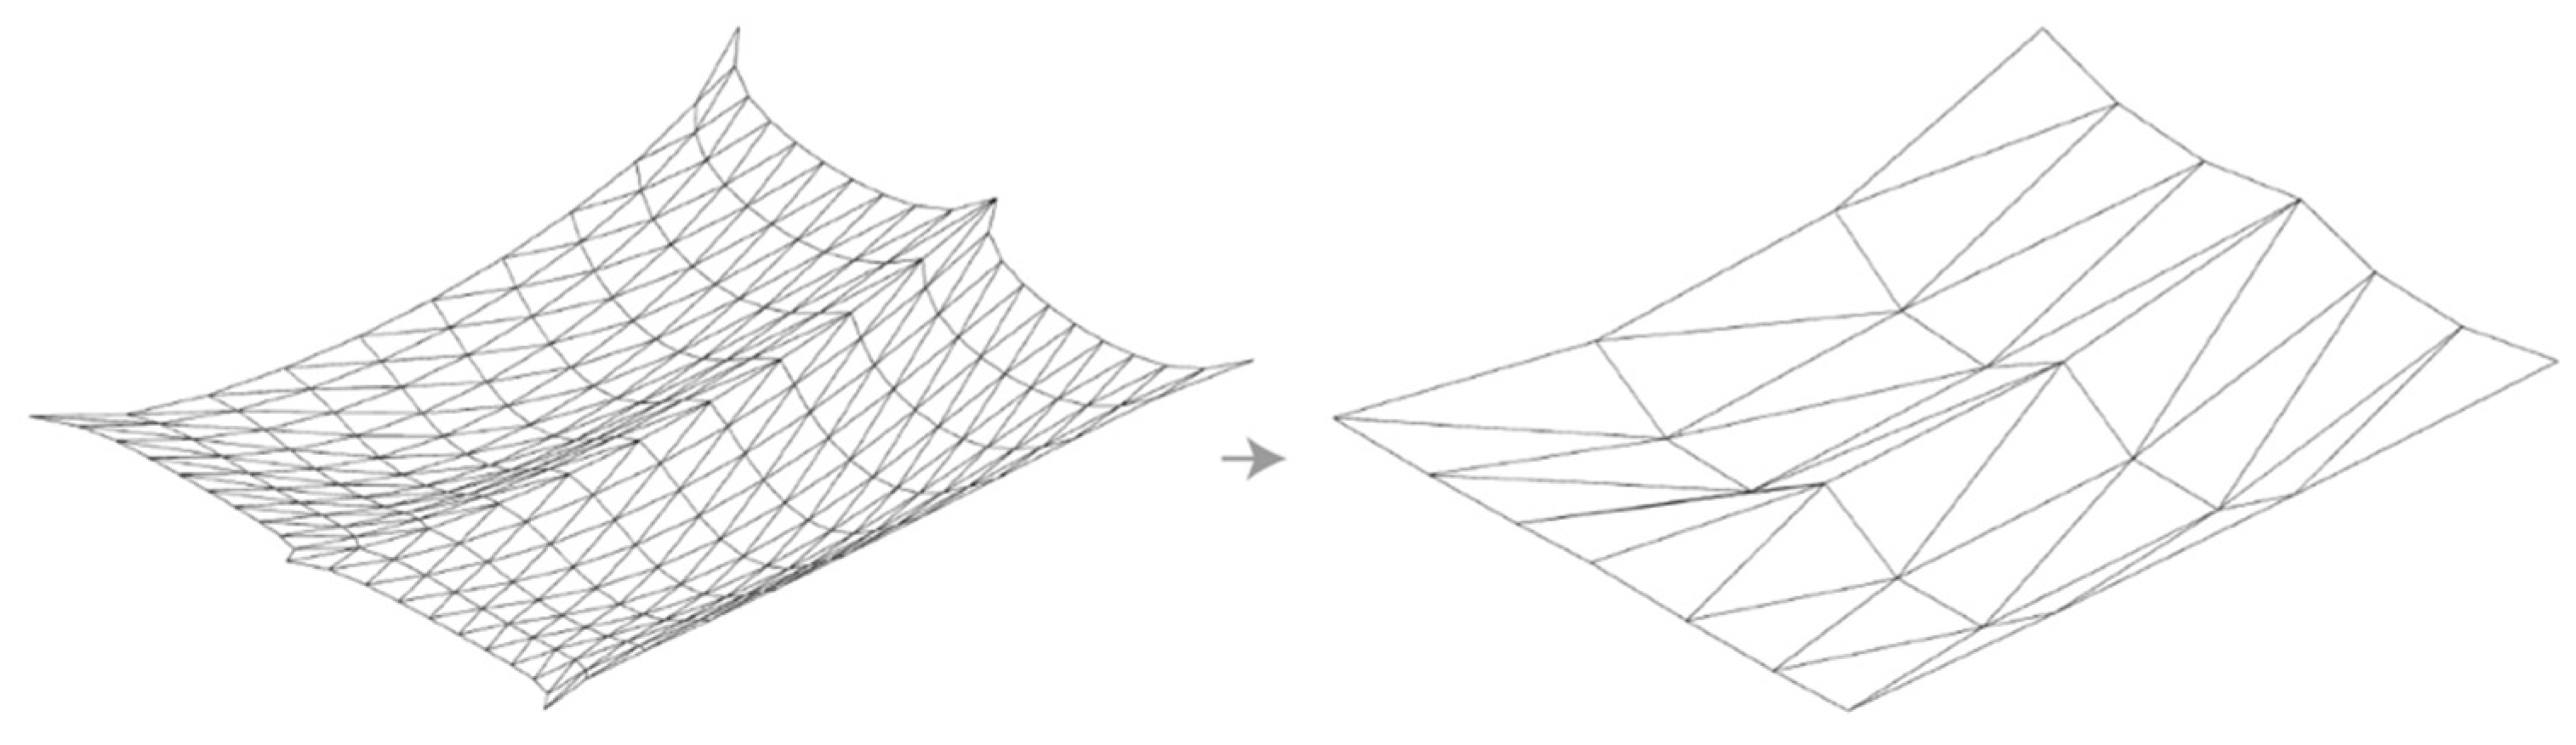
It should also be noted that, to obtain a good result in an acceptable calculation time, the surfaces of the membranes must also undergo a simplification process (Figure 17). First of all, this is necessary because the PLO environment is very large, so the rays can interact with medium-large surfaces, with the minimum being of the order of a couple of meters. Since the surfaces of the membranes are composed of a sum of flat surfaces, it is possible to decrease the number of such segments and obtain simpler entities.
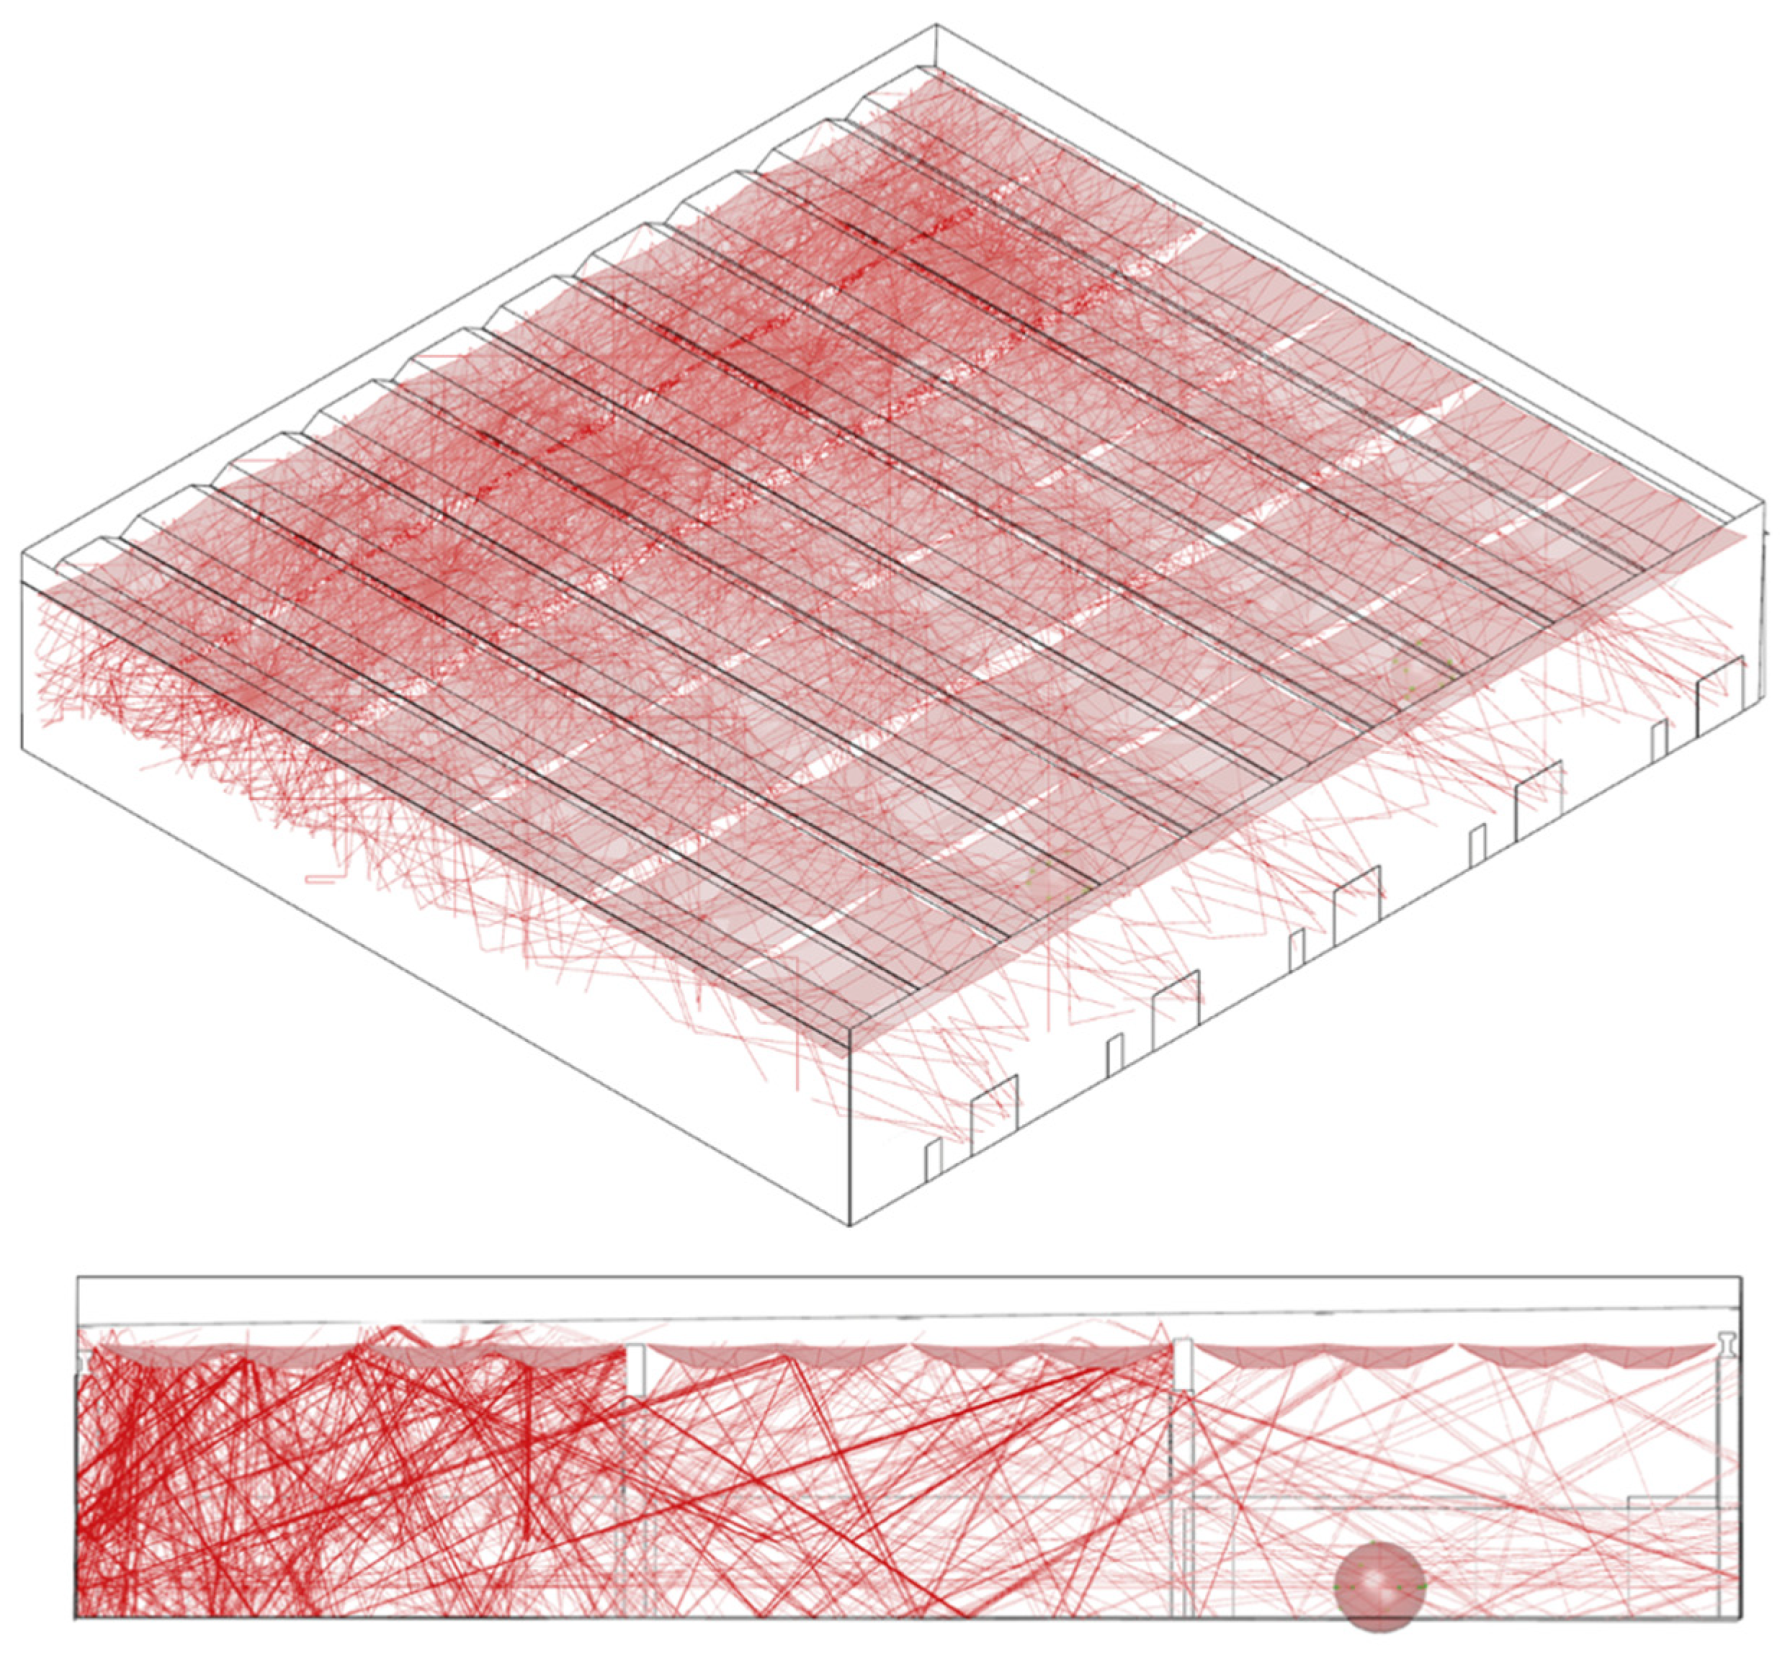
The Optimization Process performs the same procedure described in the previous section, which involved only one membrane, but now the calculation takes into consideration all the membranes at the same time. In simpler terms, the process changes the height of each attachment point on all the membranes, aiming to find the lowest number of intersections possible (Figure 18).
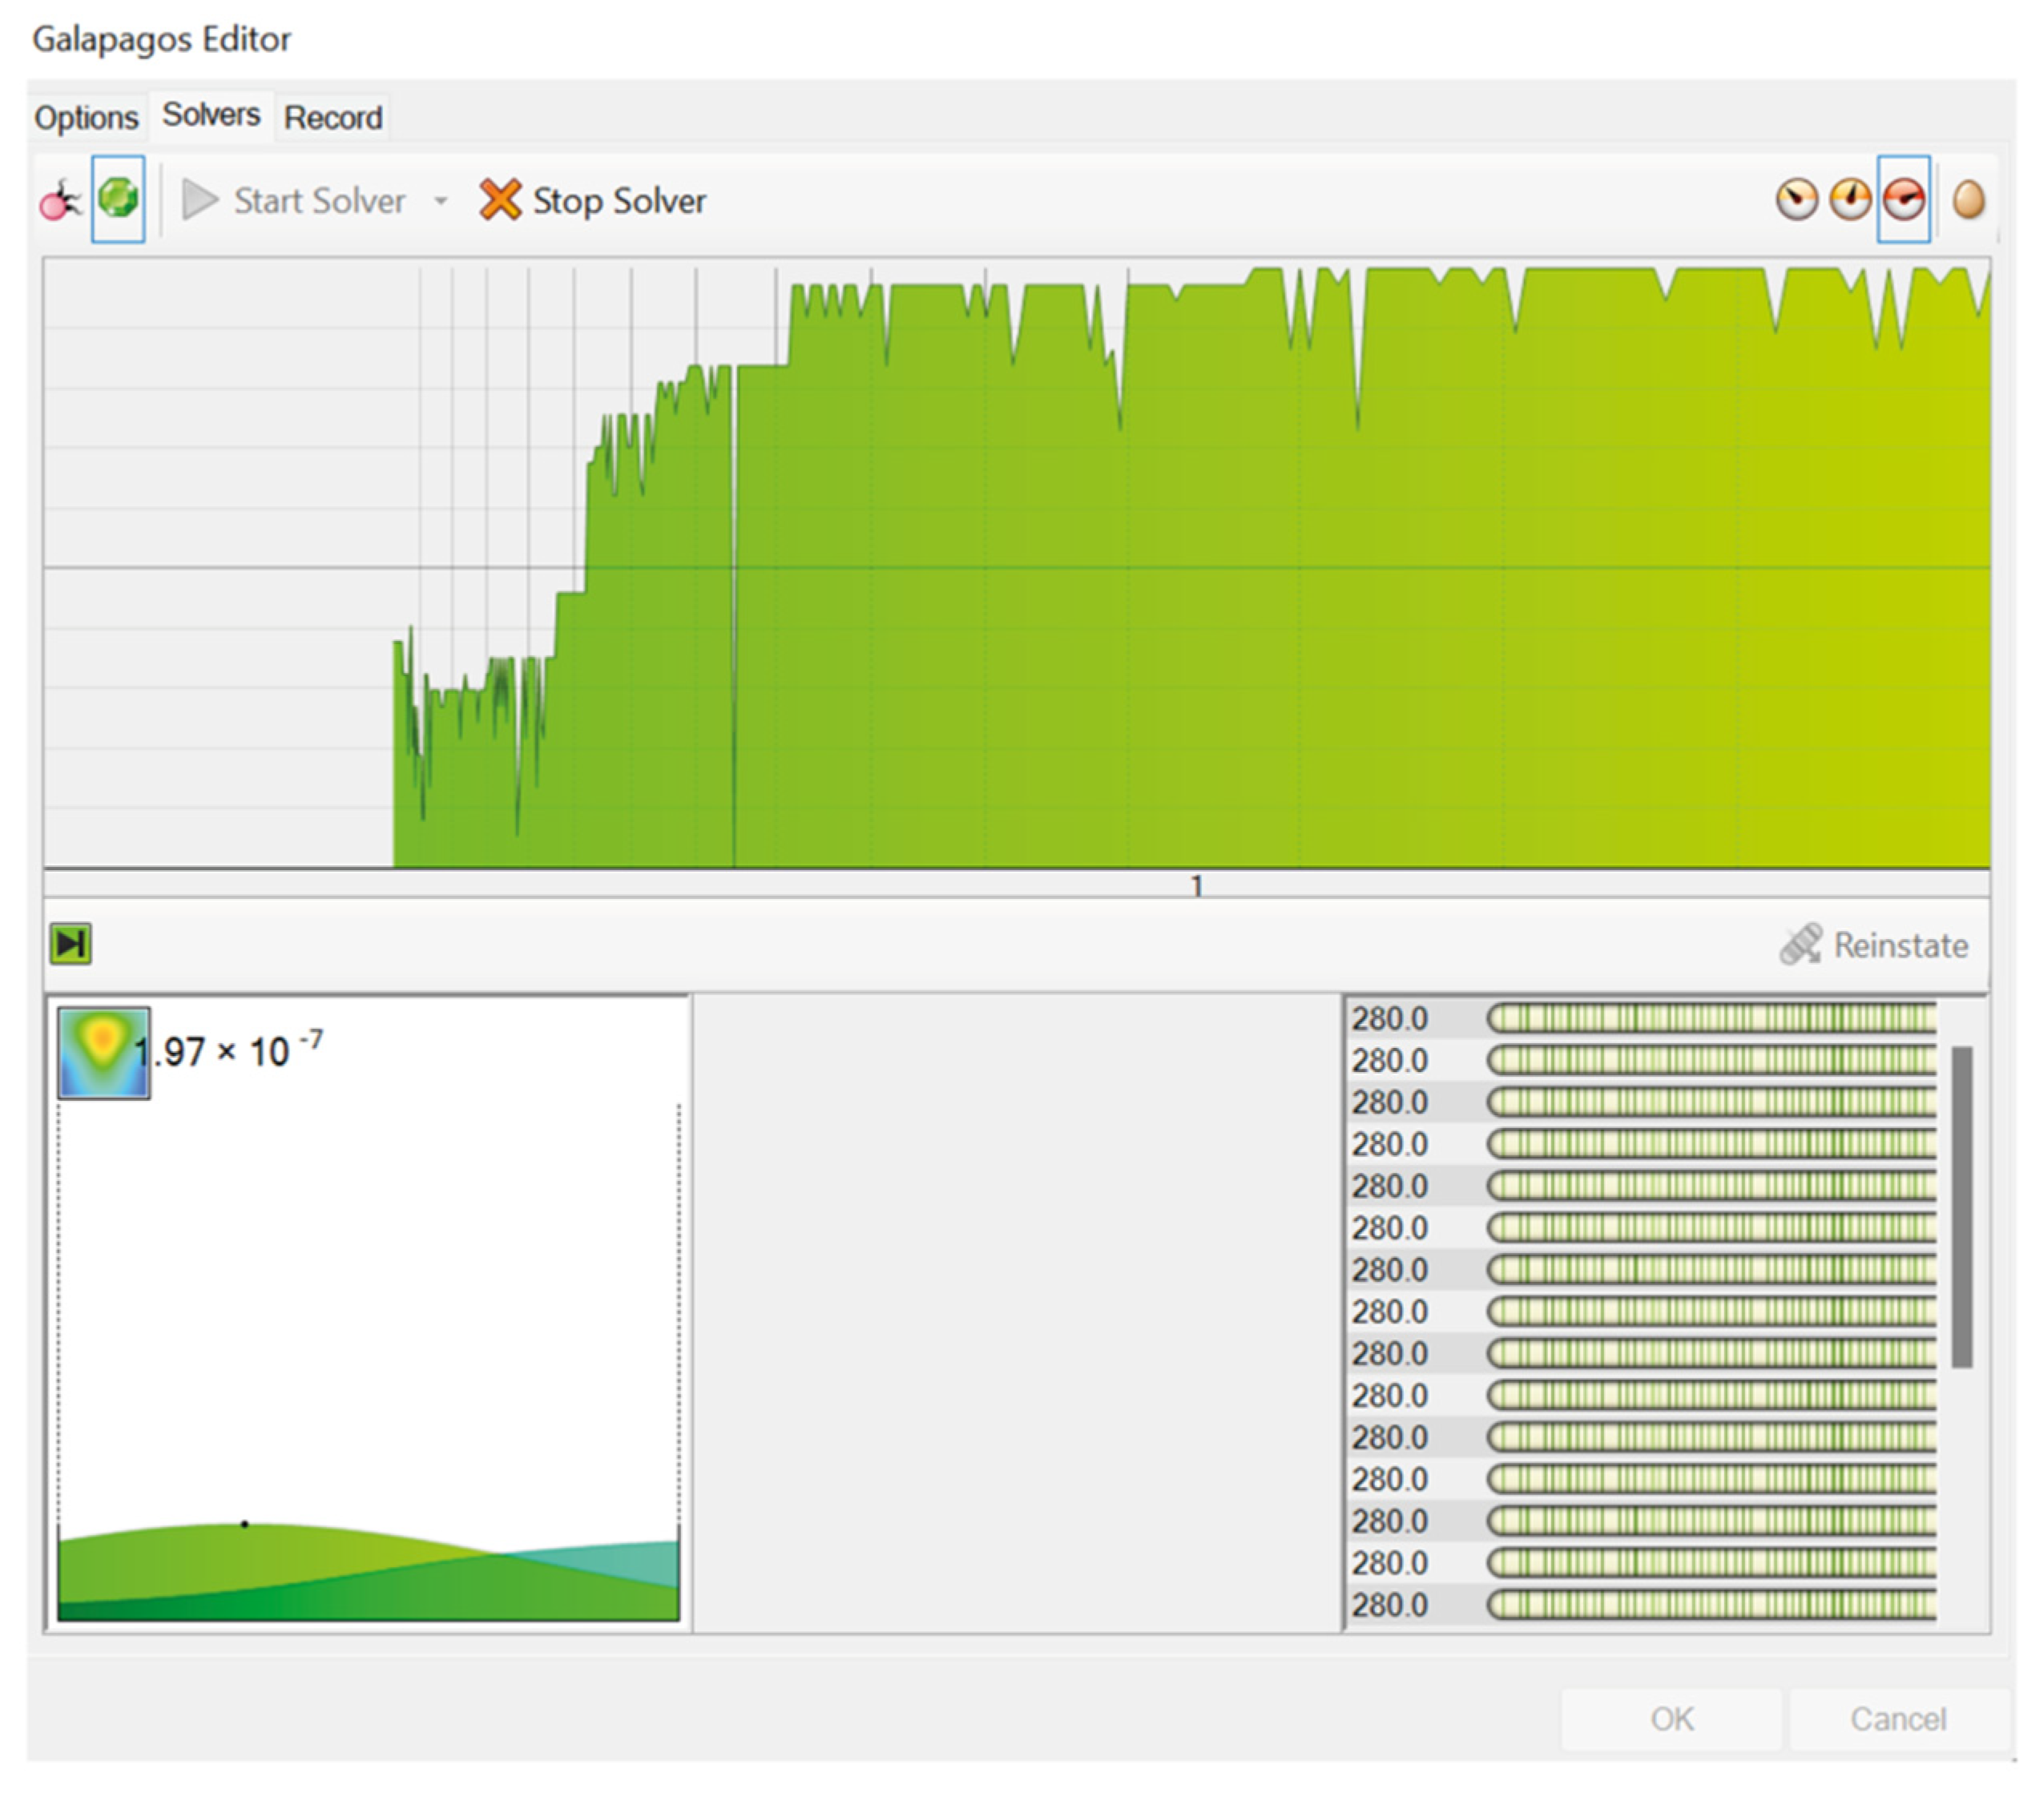
The program works by modifying the parameters each time, returning a graph showing the improvement and, at the same time, saving the result to then be visible directly in the main interface. The end of the search, using the Annealing solver, occurs when the operation produces a graph that presents a stalemate due to the impossibility of finding a better solution than the one of the previous tests.
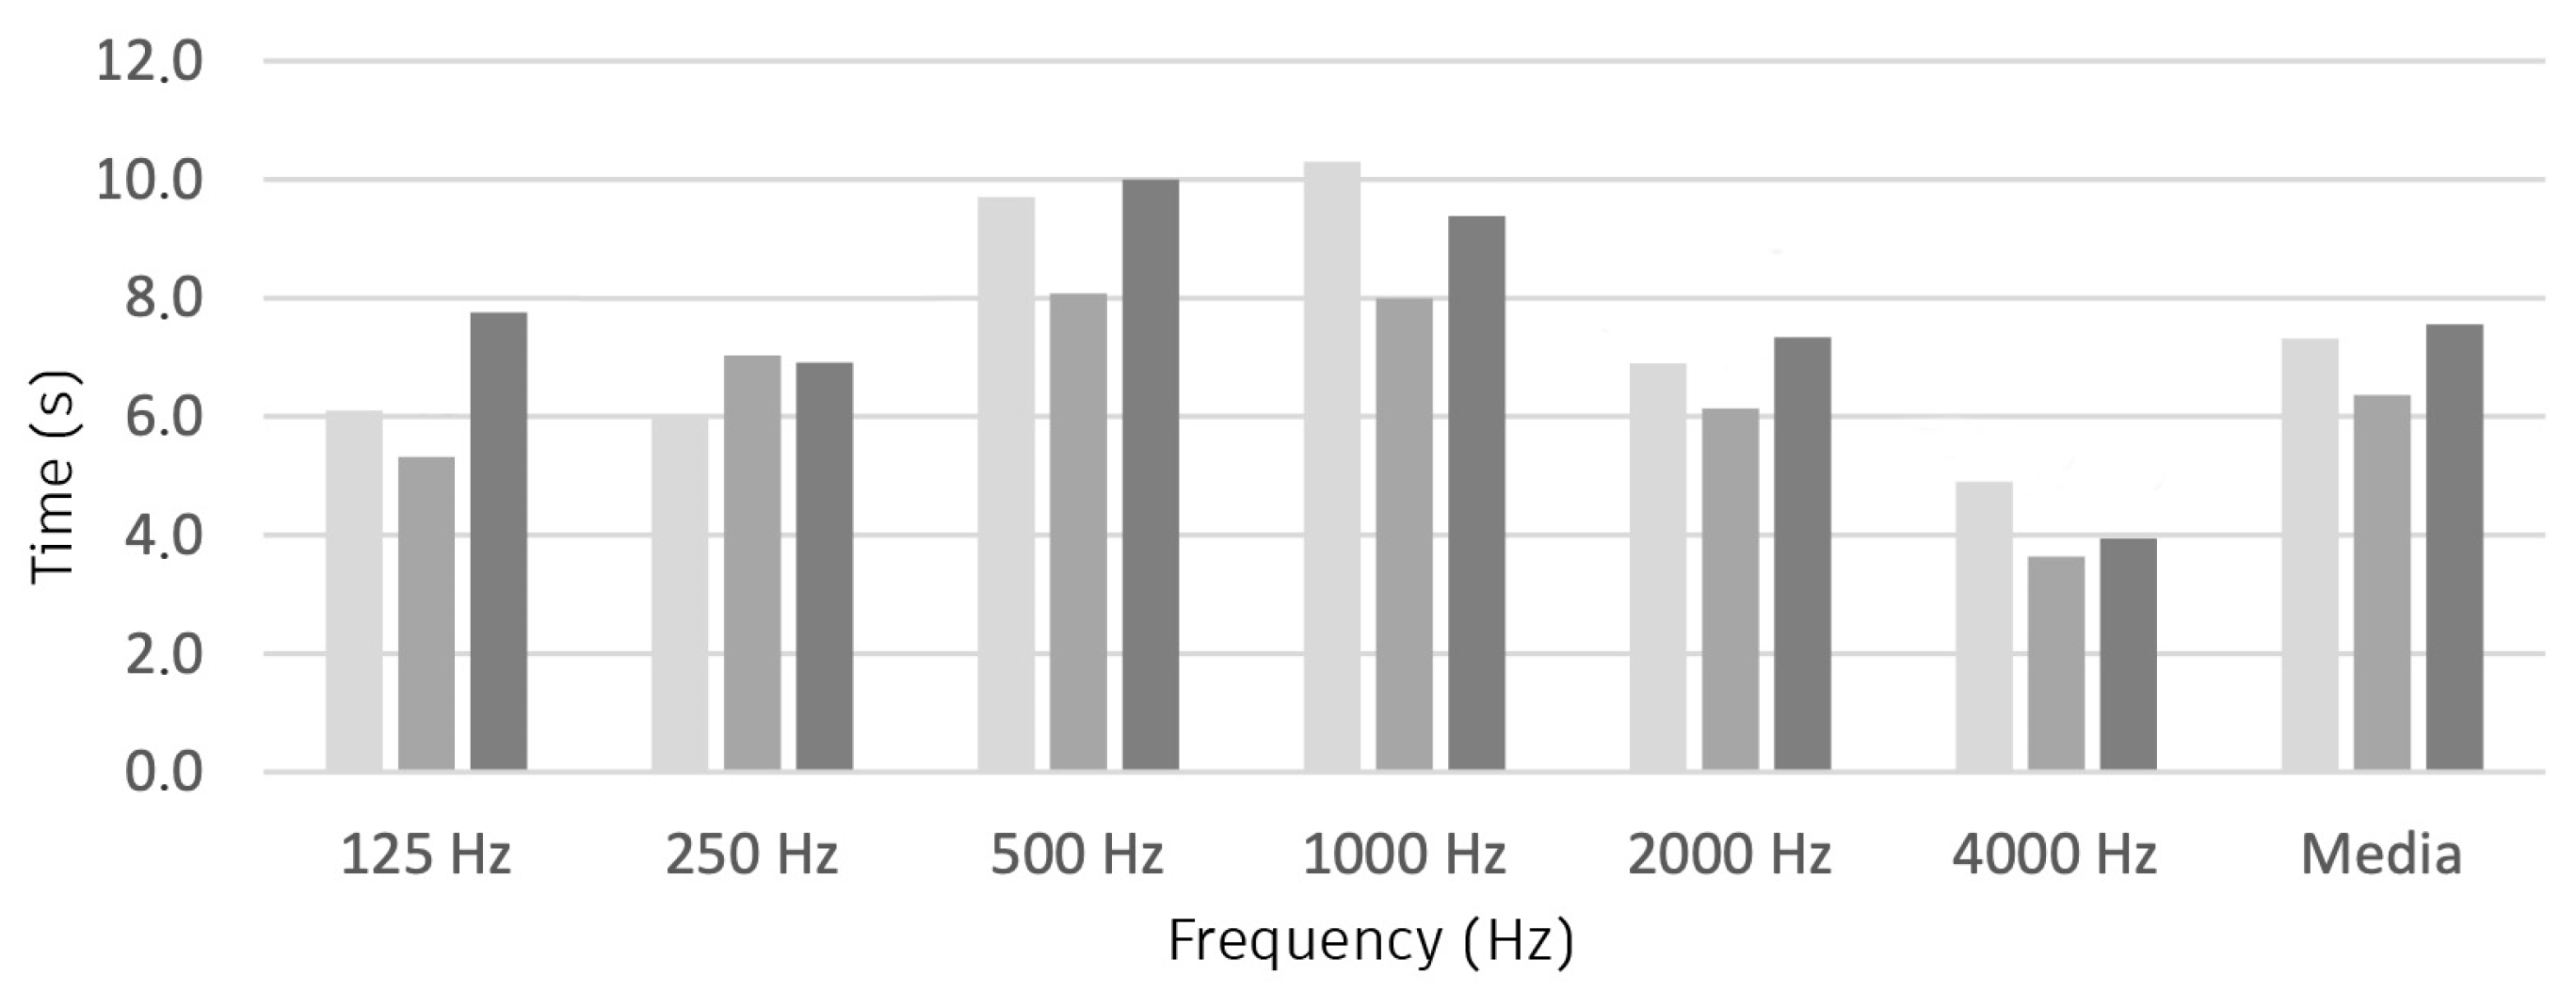
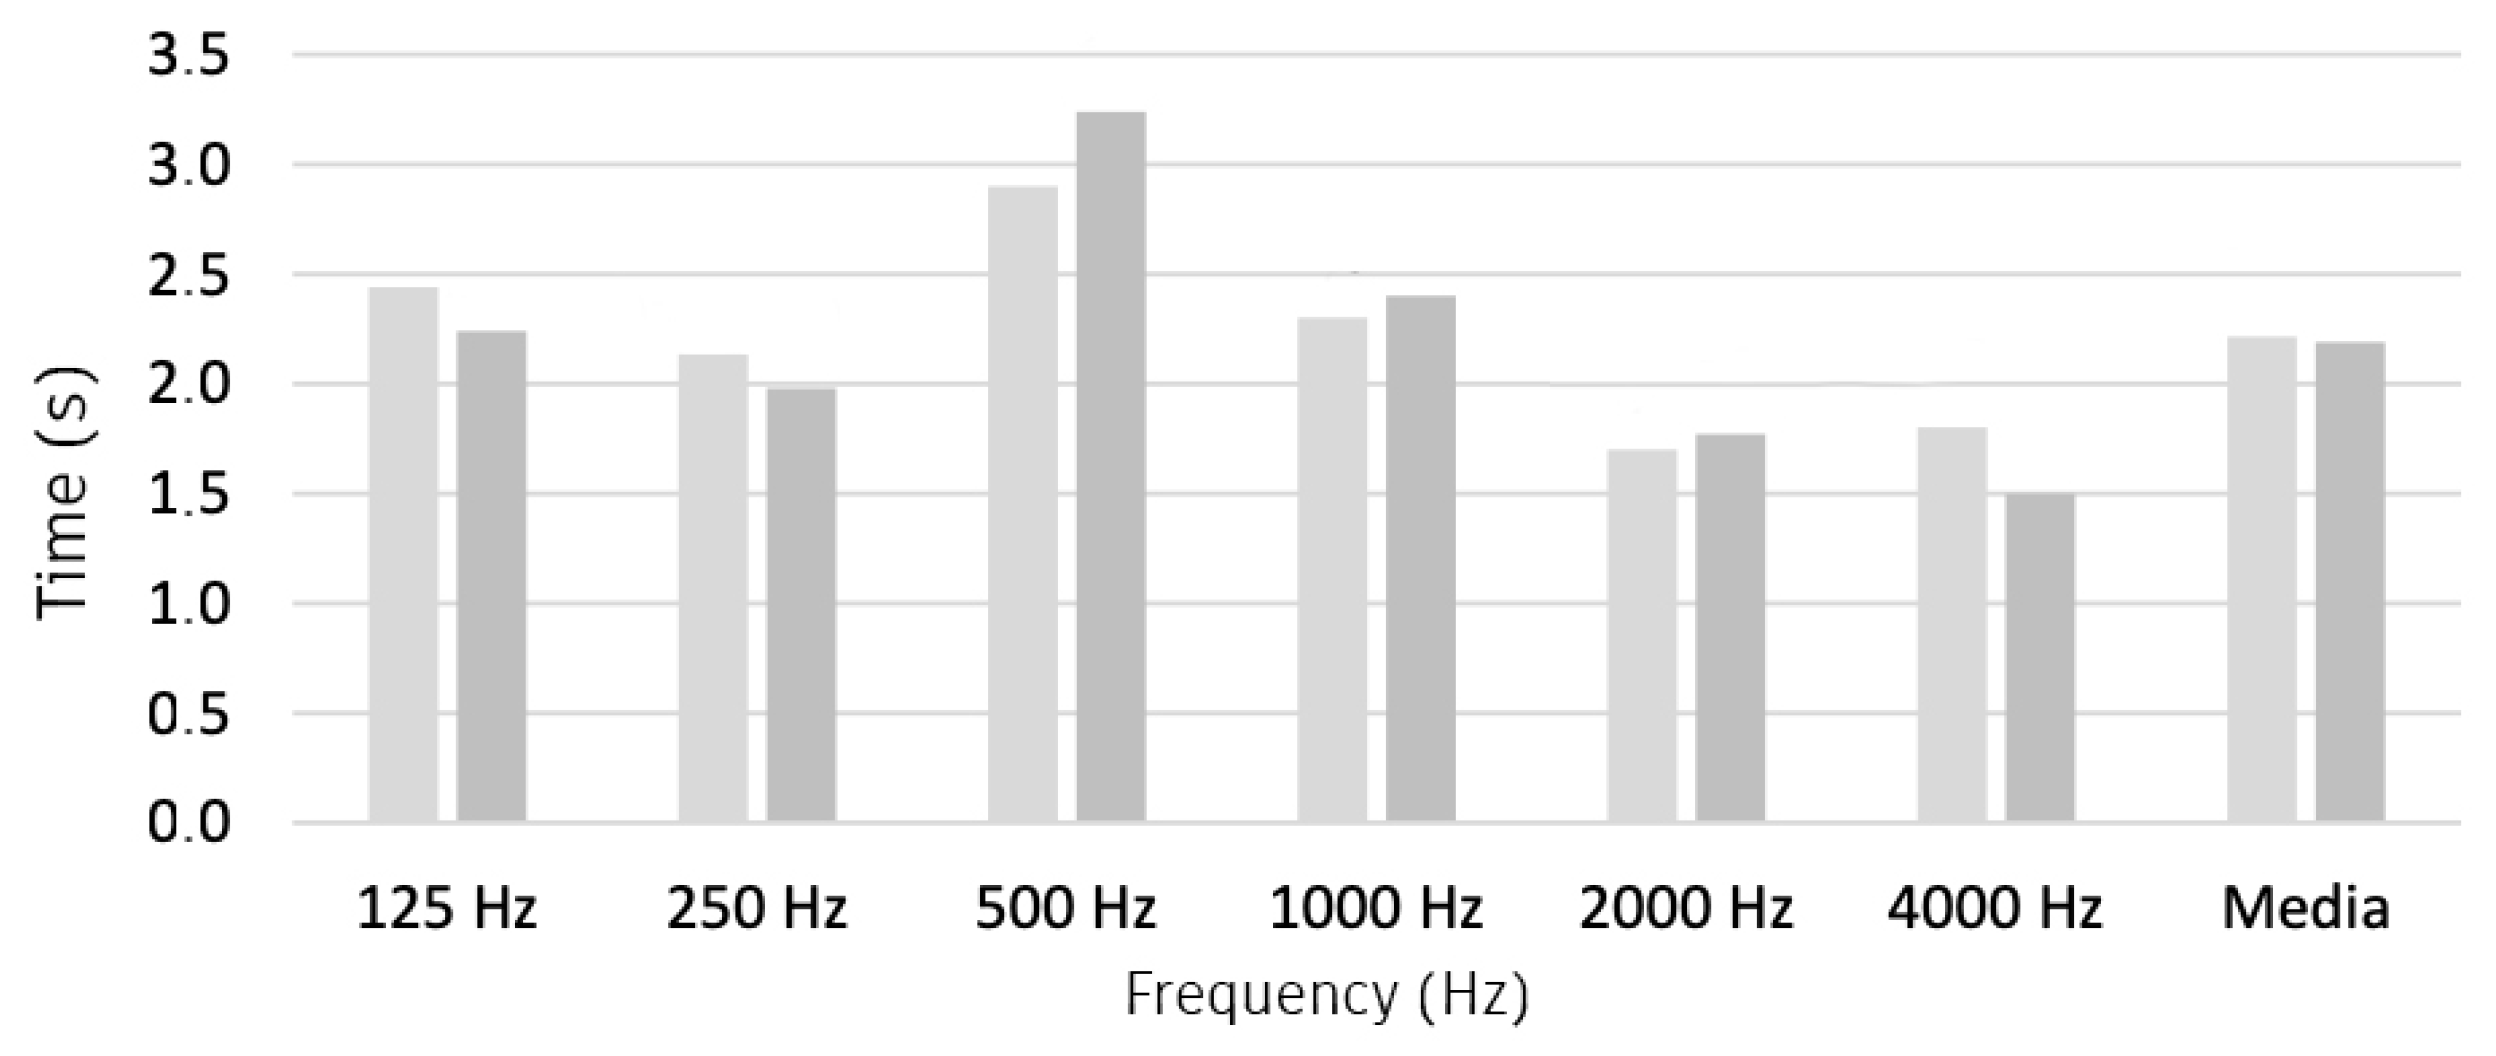
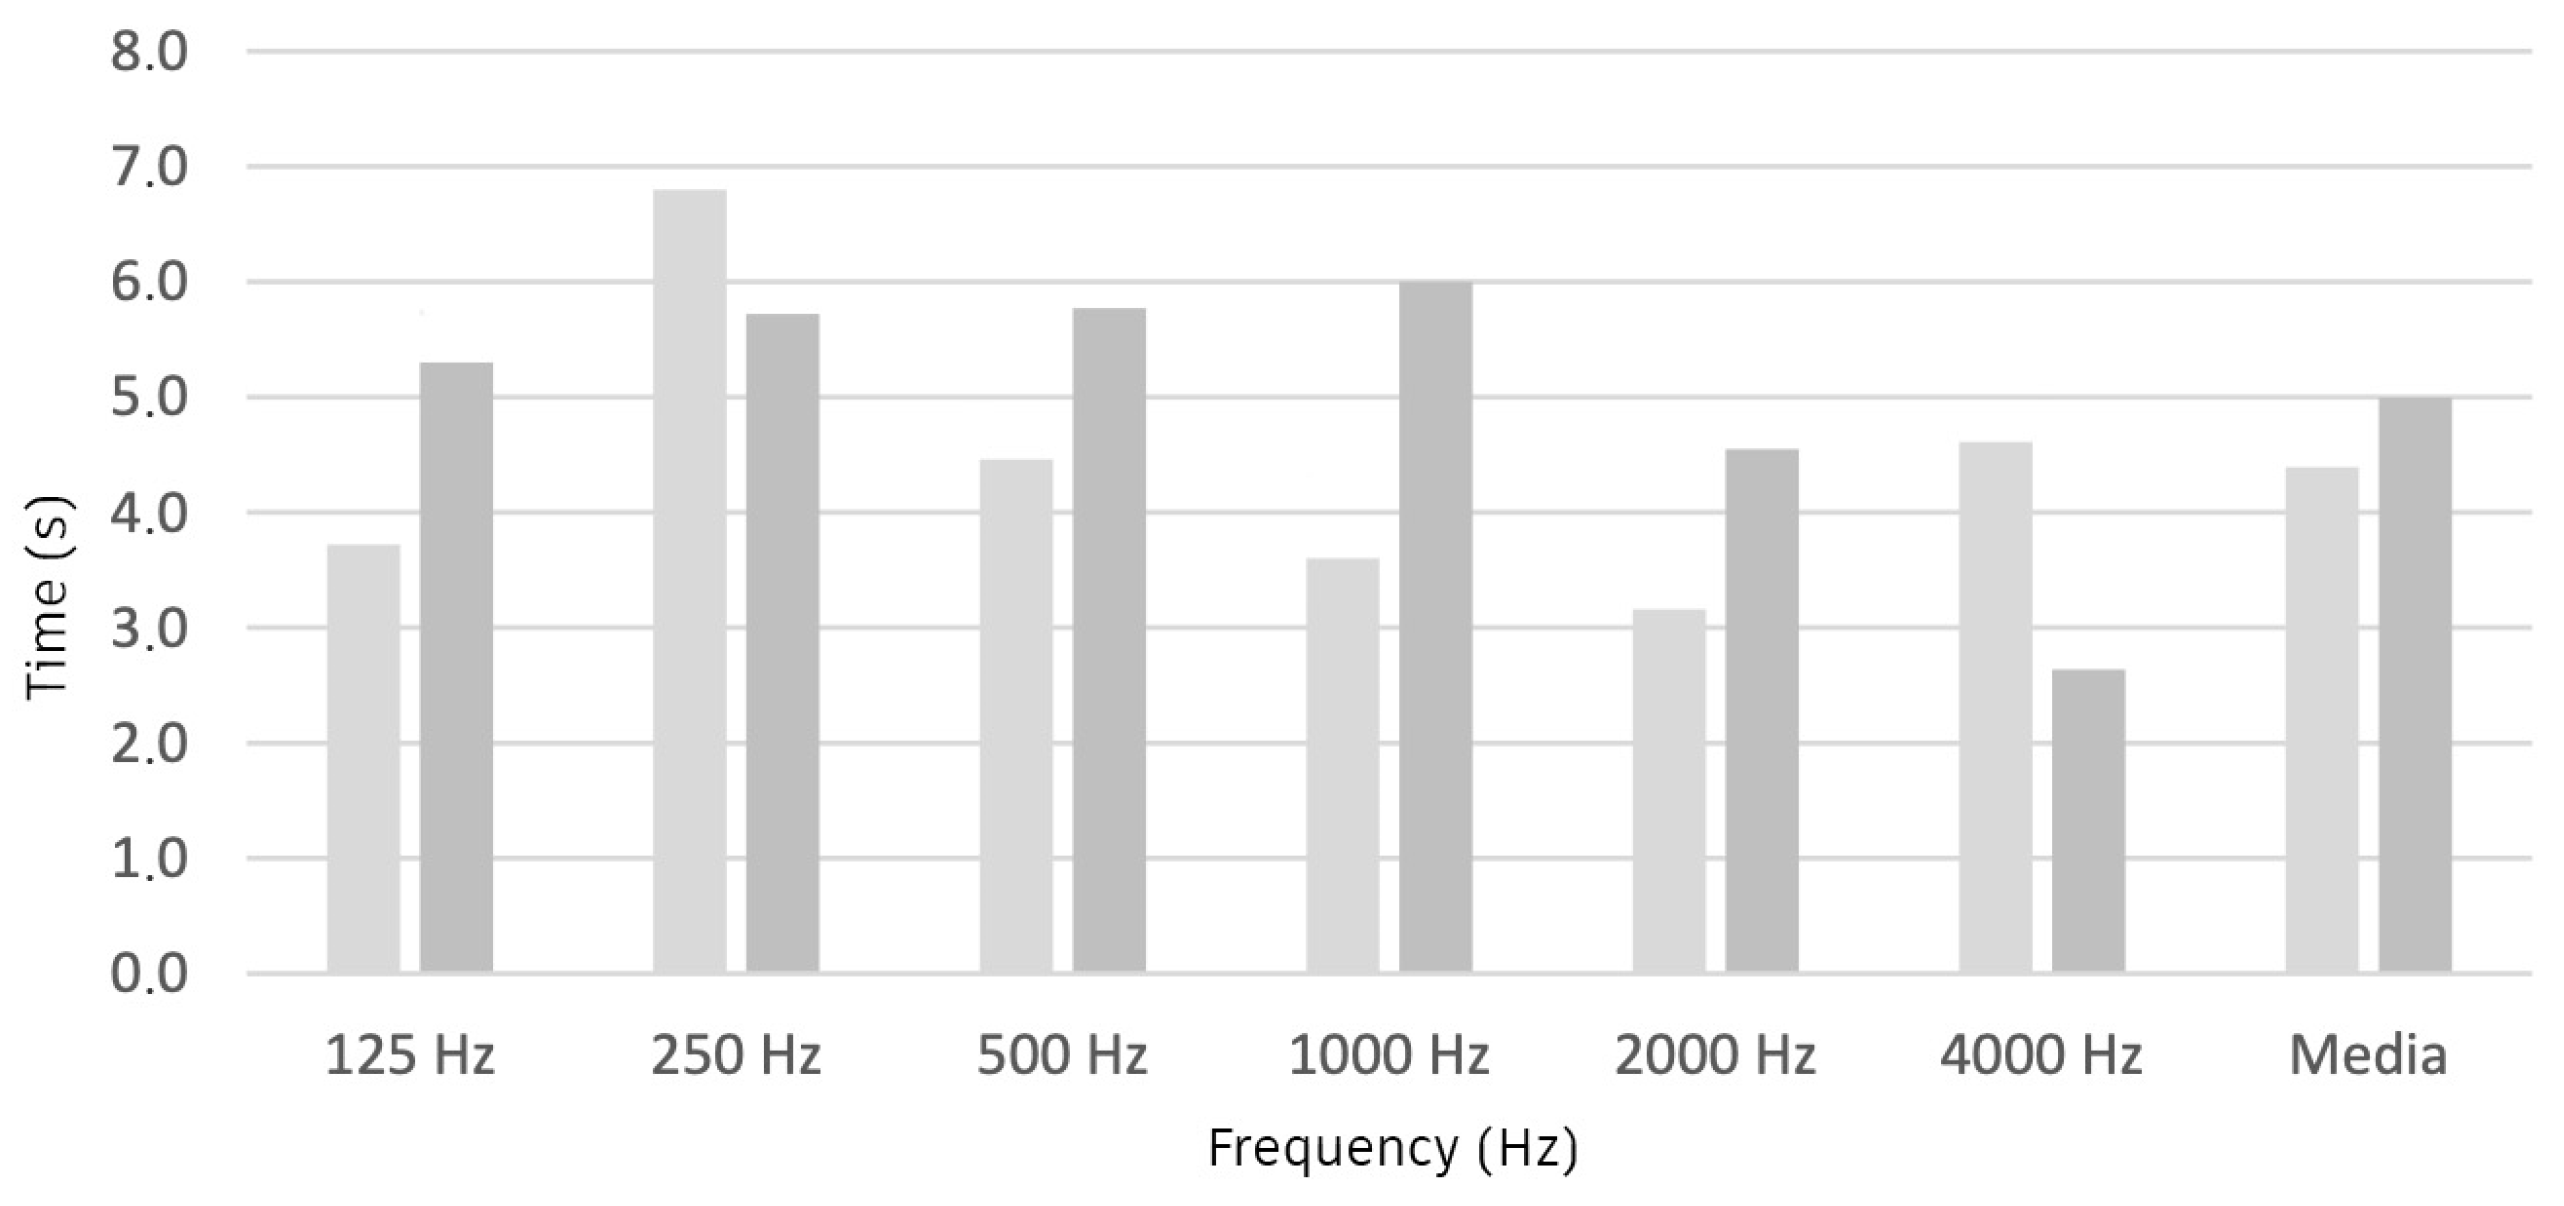
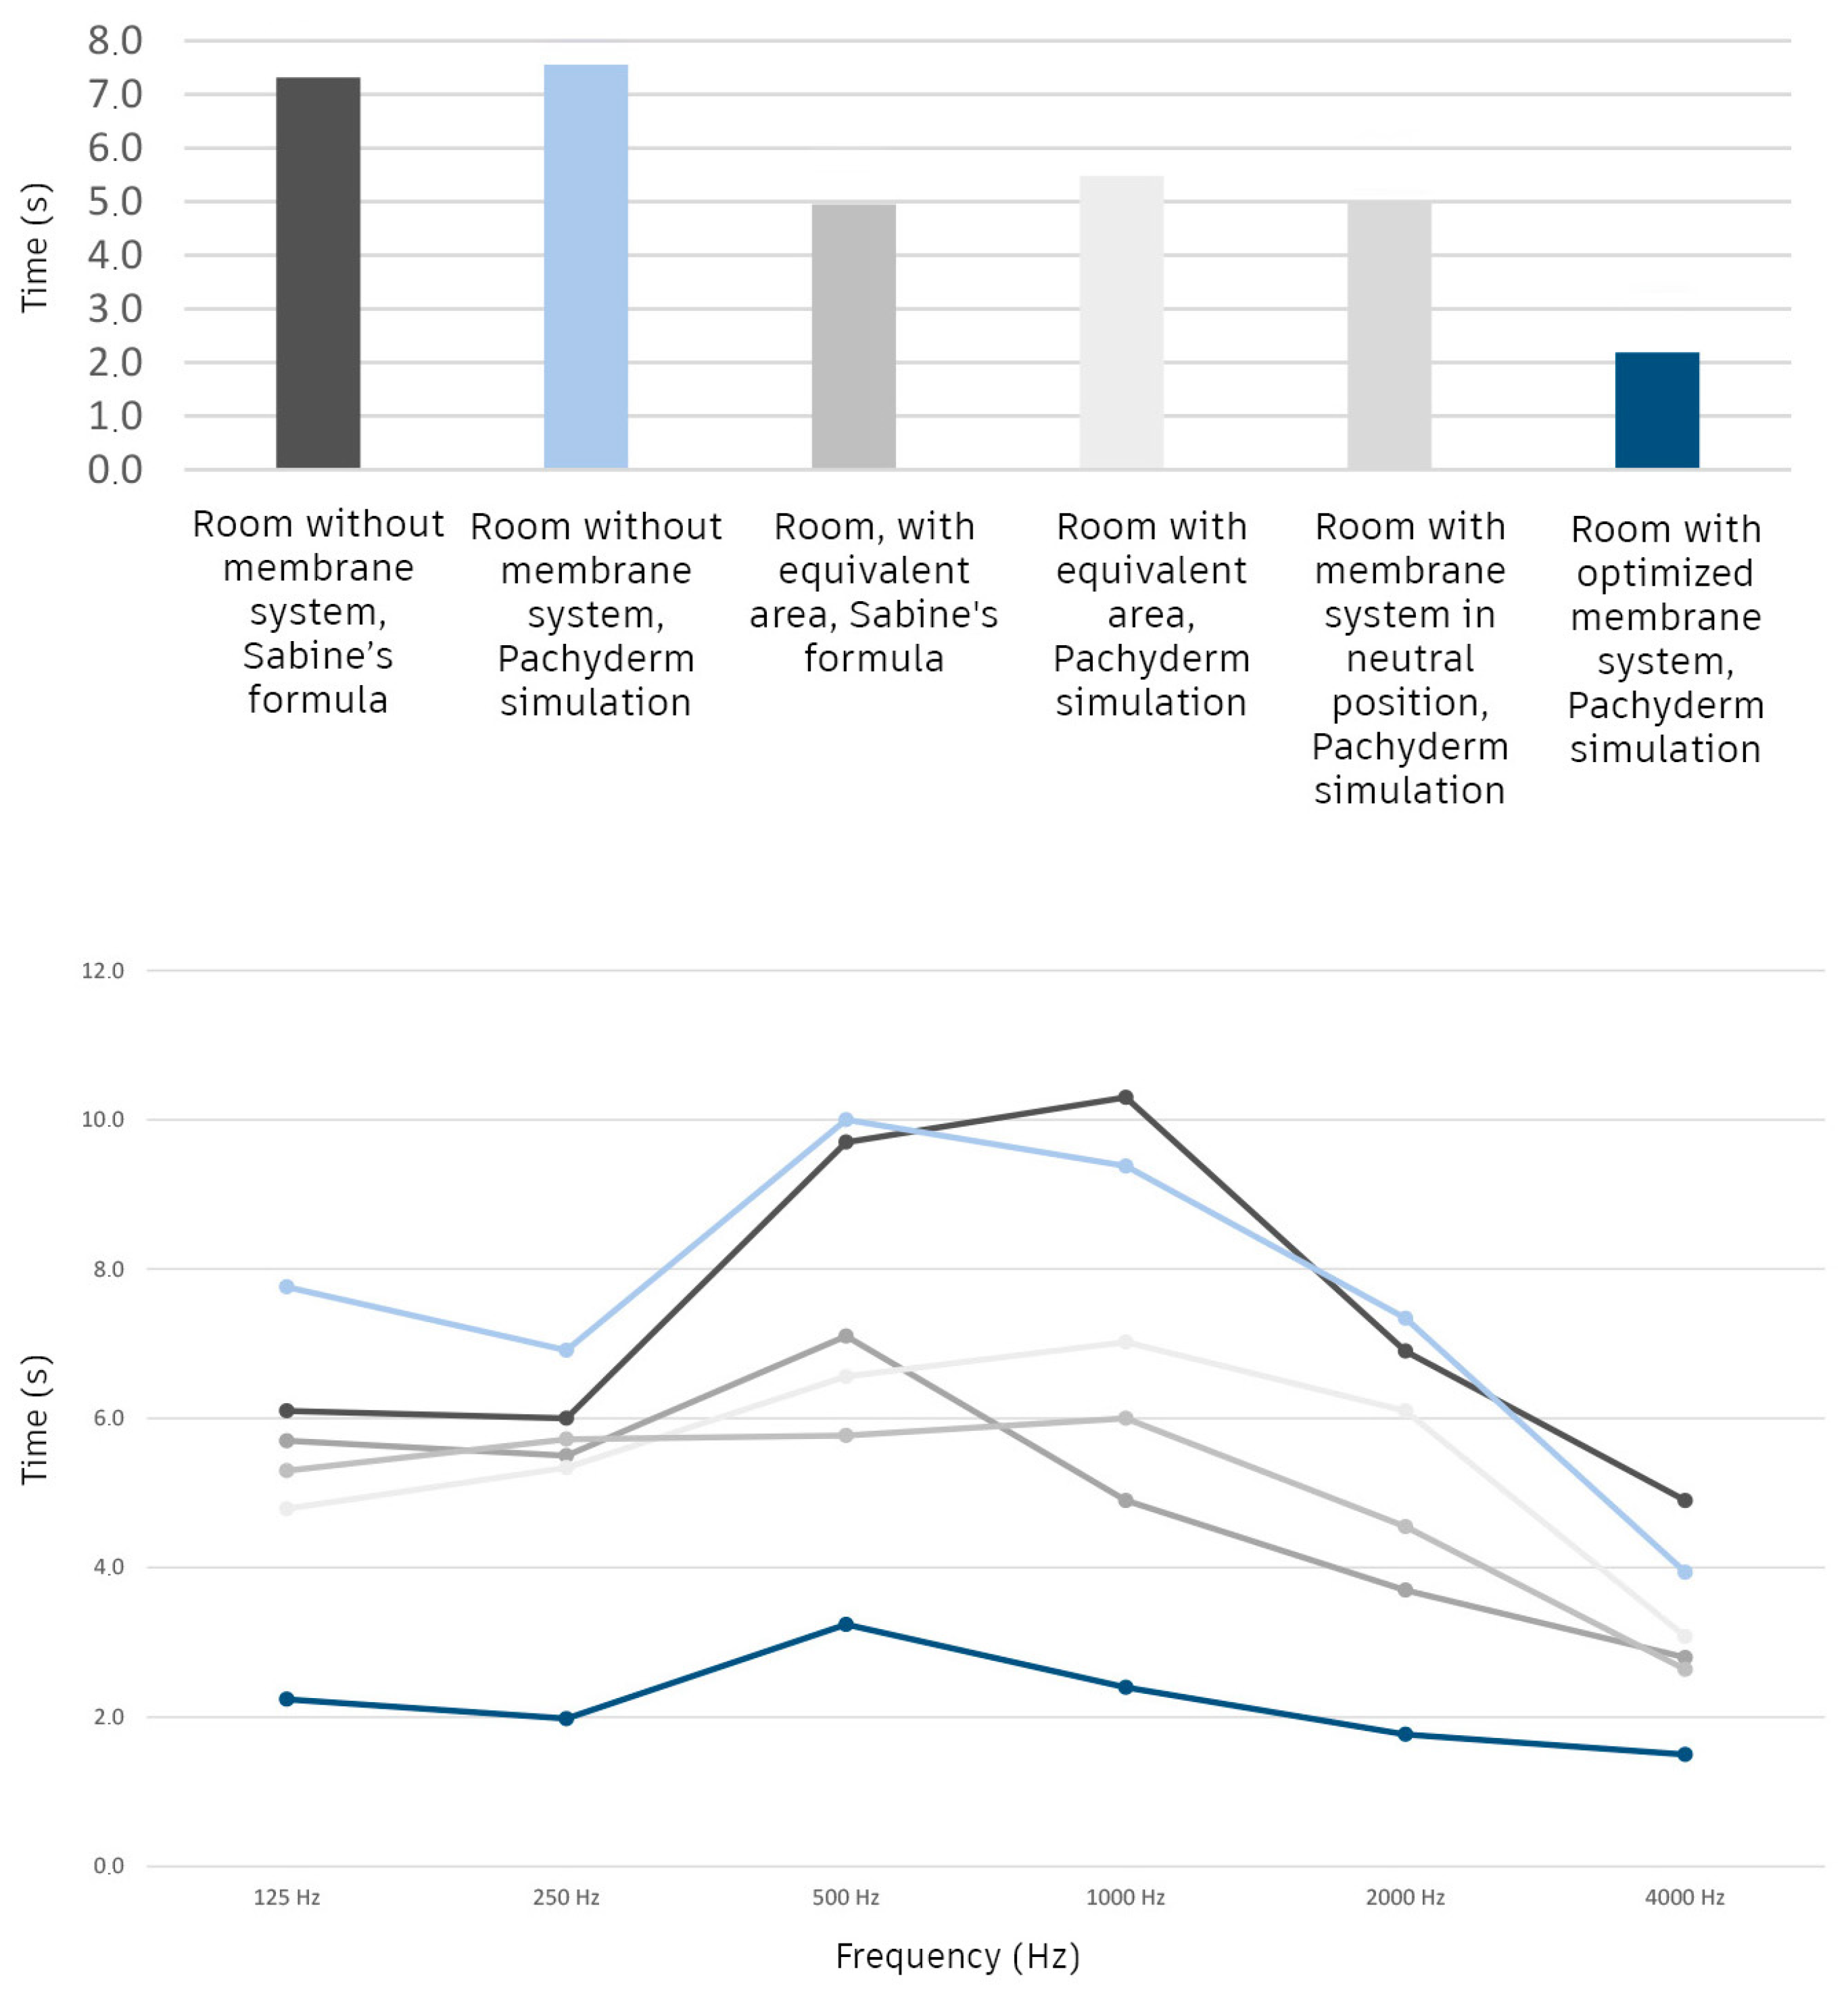
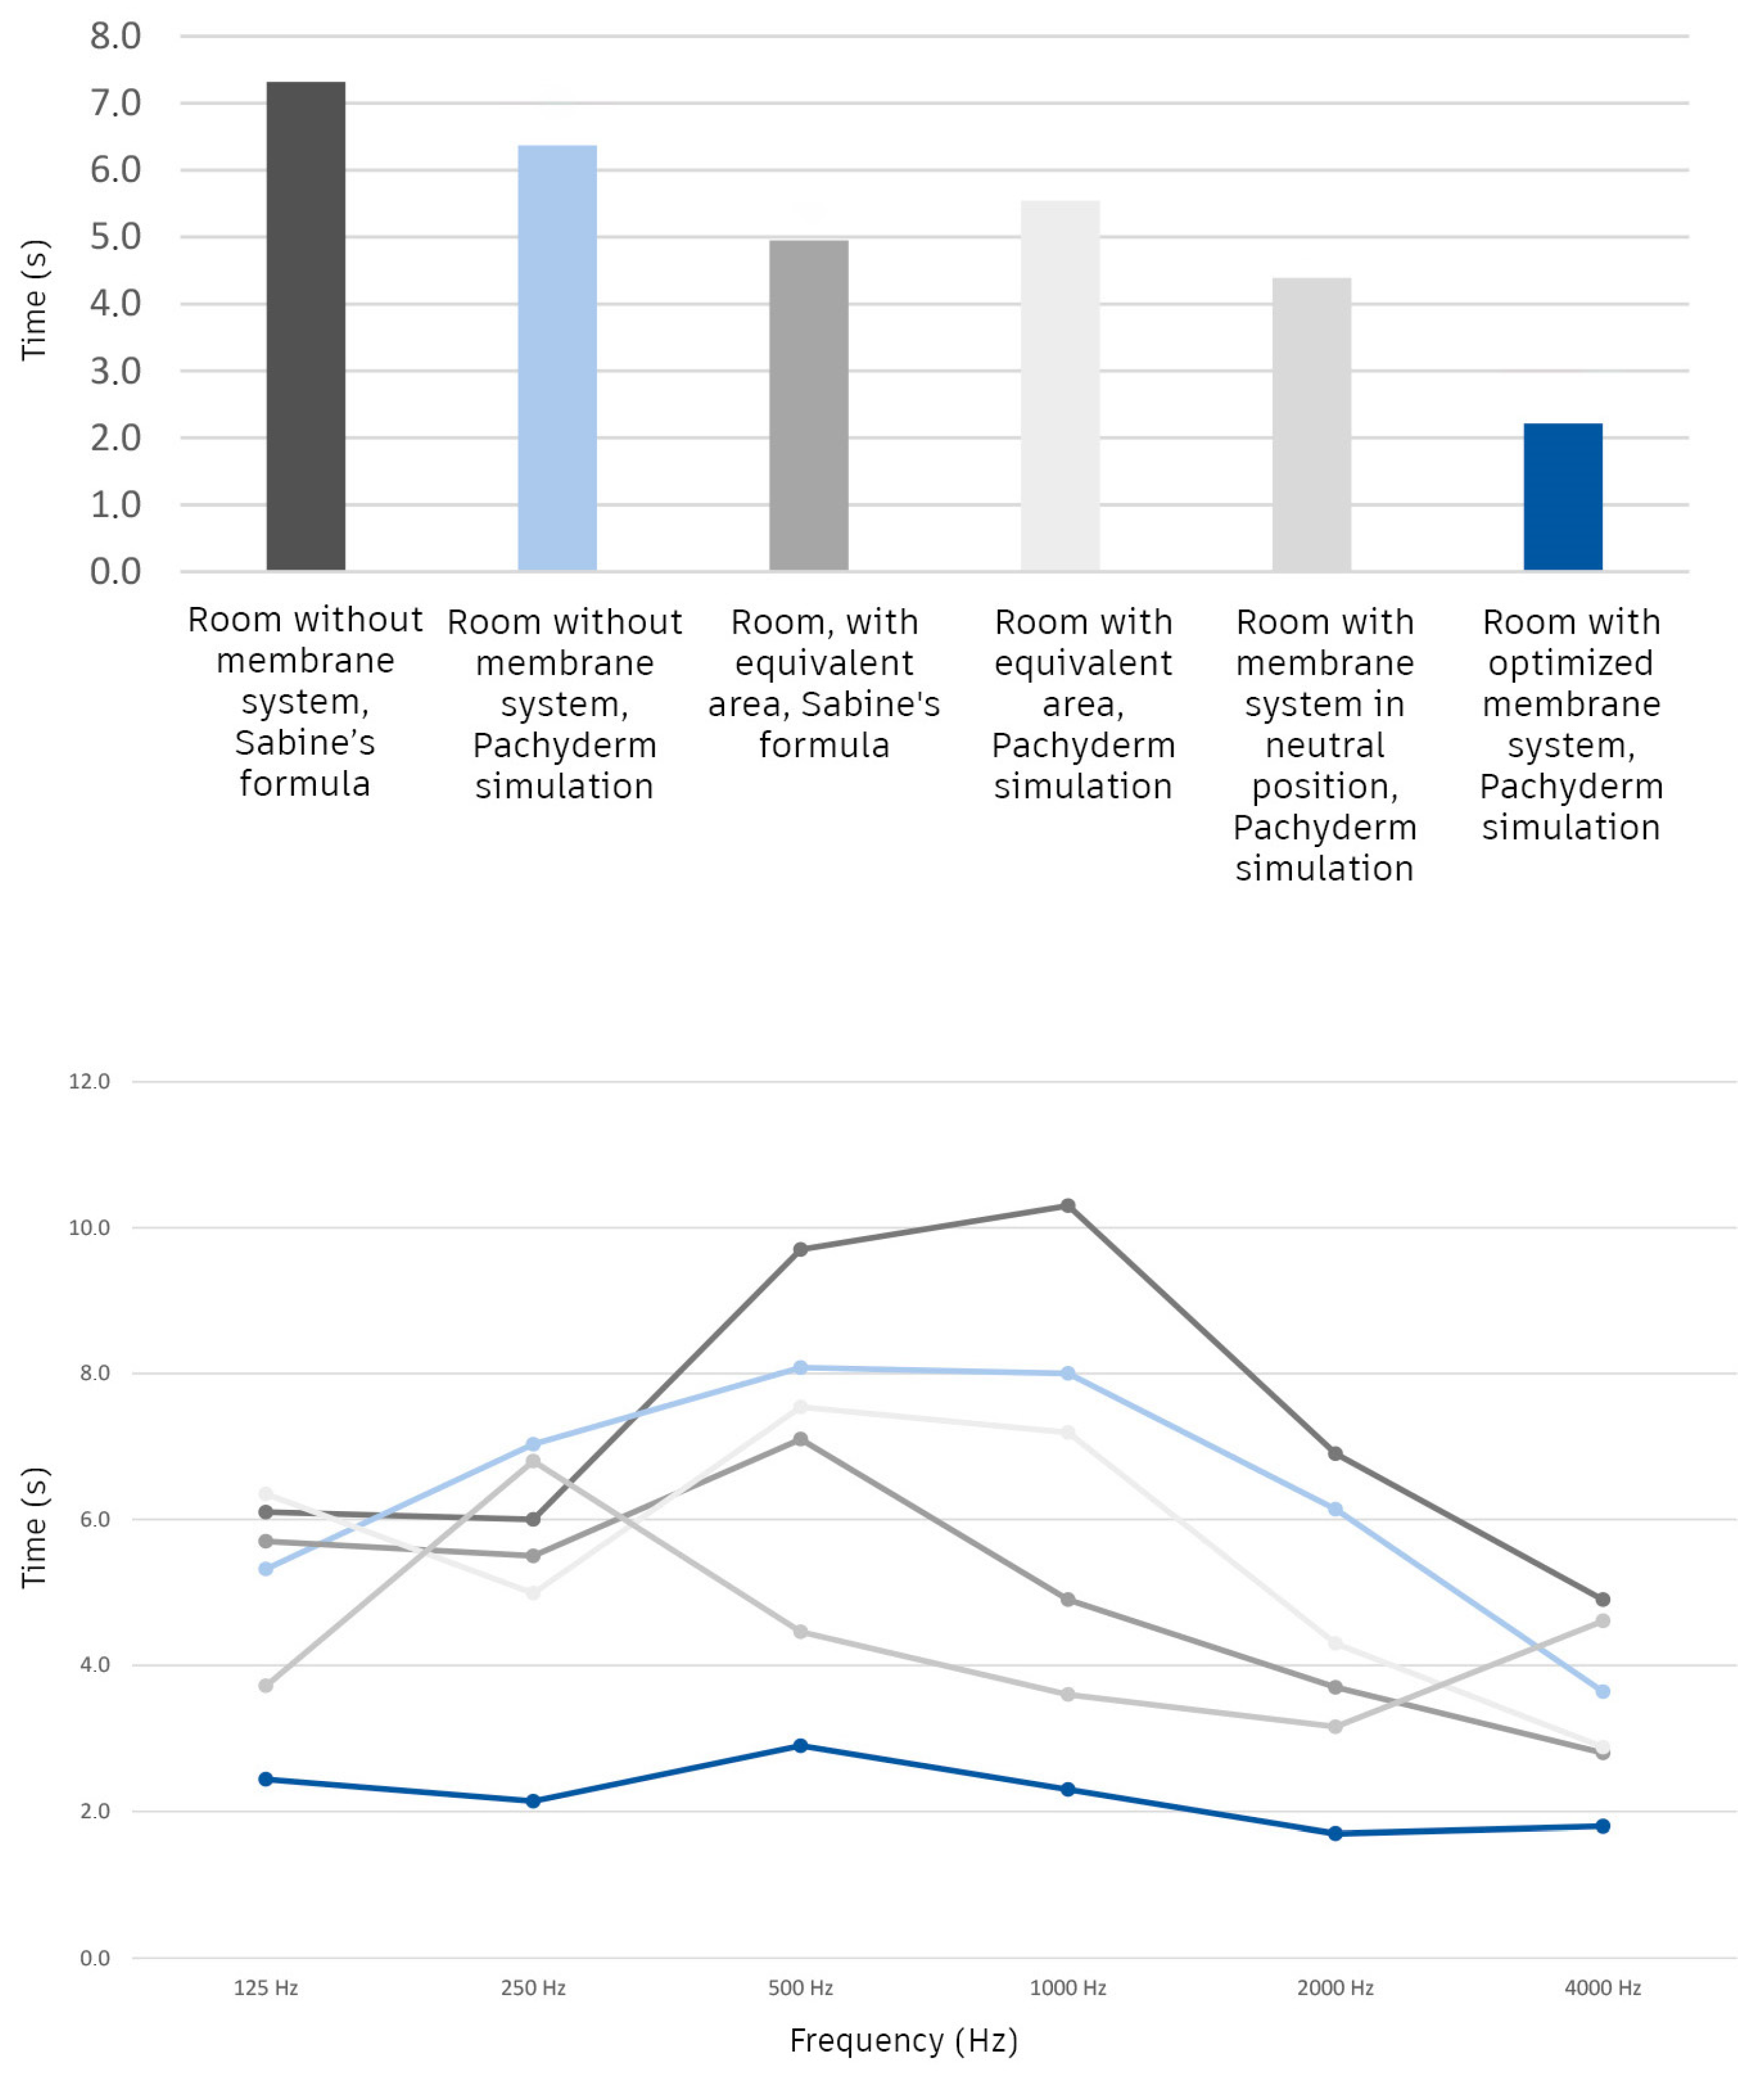
By comparing three cases, corresponding to the three conditions analyzed, there are three different values for the number of intersection points: In the first case, the one in which the room has no membrane inside, this value is 527 points. In the second case, for which the membranes are present in neutral position (without the shape resulting from the analysis via Form-finding), there are 515 points. Lastly, the Form-finding process that is applied returns 280 points. This means that the membranes allowed the receiving areas to be crossed by as many as 247 fewer reflected rays, equal to almost half. This means that, as happens with the physical phenomenon of Reflection Free Zones, the reverberation time at that receiving point is reduced.

3. Experimental Results

To carry out the analyses, especially if the measurements are ante operam, acoustic simulation processes are used for their advantage of carrying out calculations by interacting with the realistic space of the building without the use of the approximate coefficients used for traditional measurements.
The first step, also in this case, is to build the three-dimensional acoustic model. Rhinoceros was used with various Plug-ins capable of simulating the sound behavior in large environments, as already explained in detail in the previous section. A Plug-in called Pachyderm, in addition to simulating the sound field through ray tracing, is also capable of obtaining the reverberation time and the equivalent sound level at each point of an environment. The peculiarity of the system is precisely that of obtaining data referring to points at specific coordinates in the environment while, usually, this does not happen. In fact, both as regards the values obtained with the traditional method and with other acoustic software, being statistical data, the results refer to the entire environment, not to a specific point in it. The Acoustic Plug-in, on the other hand, always provides, as the input value, the receiving point already created in 3D on the Rhinoceros interface, making the results depend on its position.
The simplified three-dimensional model previously created for the Form-finding analysis is used. As already mentioned, the model must not contain surfaces or entities smaller than two meters in order to ensure that the simulation and calculation take place within acceptable times. For this reason, the model is characterized by an environment that is as simplified as possible, made up of the architecture of the room and the goods contained in it; the “Cella 1” is made up of only the internal surfaces of the structure as they are the ones that interact with the sound field. The goods are made up of parallelepipeds, which symbolize the average extension of the storage spaces, offering an equivalent absorbent surface that is acceptable since, in a large environment, small objects are totally negligible. The software allows us to associate the acoustic characteristics of each material, constituting a surface of the environment, and to enter the sound absorption values of each material for each frequency band. The environment is not composed only of surfaces, but, thanks to Pachyderm, it is also possible to consider the air conditions as determining variables. In fact, the temperature and humidity of the air are considered.
Once the three-dimensional environment has been obtained, the sources and receivers are specified. The first are the five points already examined above, located in correspondence with the loading docks on the east side of the room (Figure 19). The sources placed at a height of one meter originate a certain number of rays which are randomly scattered in all directions. The number of rays has a great influence on the performance of the calculation, so it is checked that this is small enough to be able to proceed with the simulation but not too small as to give rise to an inaccurate one. In order to obtain greater calculation precision, the direction of the rays is completely random.
The simulation method makes it possible to independently investigate the result at each point in space, as it is reached by a different number of rays. This means that each point in space has different values for reverberation time and sound intensity level according to its location. Similarly, to what happens for the Form-finding simulation, each point, in order to interact with the rays, is immersed in a sphere of which it is the center. In this simulation, it is the software that creates the sphere with a radius of 1 m, which interacts with the rays that intersect it. Since the rays are not uniform in space, each point of the environment interacts with a different number of sound rays, returning different values. For this reason, Pachyderm reports different results at point number 1 and point number 2.
Pachyderm software, version RC26, is able, by combining ray tracing processes and virtual sources, to investigate each sound ray, tracing it from the source to the end of its path. Each beam can be characterized by different values: number of total beams, direction, number of reflections and simulation time (time in milliseconds which indicates the virtual duration of the measurement of the sound phenomenon). By setting a time of 10,000 milliseconds, the software simulates the behavior of the sound for 10 s, allowing the possibility of the beams spreading and reaching the receivers (Figure 20). Pachyderm also allows us to characterize each source with some inputs such as the level of sound intensity generated in dB(A) and the way in which the sound is diffused in the environment. The simulation is characterized by sources with a sound level of 75 dB(A) and a “Pseudo-random directional distribution”: a random diffusion of the rays originating from the sources.
To carry out the calculations in the best possible way, we rely on the paragraph “Guidelines for use” in the “Acoustic Manual” by Renato Spagnolo, which contains some suggestions for obtaining a reliable simulation. The text refers, for example, to a good knowledge of the program used for the analysis, to the correct elaboration of the three-dimensional environment, to the correct calibration of the spectrum and direction of the sound rays diffused by the sources and to the calibration of the model. This is a crucial phase which allows us to bring the simulation as close as possible to reality. By modifying some parameters, such as power, sound directivity or the acoustic absorption of materials, it is possible to obtain an acceptable simulation. The method by which these values are changed is an empirical process of trial and error. The references for the model calibration are the reverberation times obtained using Sabine’s formula [24]. In this way, by acting on the absorption coefficients of the materials that make up the surfaces of the model, it is possible to bring the reverberation times of the simulation closer to those obtained with the traditional formula, bringing the model to an even higher level of reliability. Sabine’s formula is typically used in a generic way to obtain the reverberation time indoor where the sound is diffused. Current calculation methods, which use simulated environments and much more complex formulas, have adopted different methods, but Sabine’s formula remains a valid reference, even if generic, for obtaining the reverberation time referring to the entire acoustic field of a certain environment. The formula is therefore important for estimating the reverberation times, which were then compared with the simulation tool. In this way, the theoretical analytical method is implemented through the simulation to obtain in-depth results [25,26].
Once the simulation is complete, the program returns an analysis interface in which it summarizes all the results, divided by octaves. The simulation of the acoustic field is then carried out in the absence of the suspended membranes to verify the actual state of the environment and have a value to compare with the system of reused membranes. The simulation then returns the reverberation time at the point of the first and second receiver, which is compared with that obtained using Sabine’s formula (Figure 21).
The same simulation procedure used for the current state is also implemented for the analysis of the effectiveness of the reused textile membranes. The inputs and variables are the same; the only difference is that the membrane system is considered in the environment (Figure 22). To better verify the performance of the system and to make it plausible, the absorption coefficients of the membranes have been obtained from the tabled values for technical fabrics with low acoustic performance (Table 1). It was decided to consider membranes that have a bad sound absorbing behavior to ensure that the performance does not derive from the absorbing capacity of the material. In this way, the results are due more to the shape of the membranes than to the material of which they are made. Similarly, as for the other materials, the absorption values for each octave are entered into the program. The simulation is carried out first for receiving point number 1 and then for number 2, returning the reverberation times in correspondence with the two receivers. The results are shown in Figure 23.
To understand if the results are influenced by the shape of the membranes, a new simulation is performed in which the fabric is perfectly planar, as if it were a suspended ceiling (Figure 24). Obviously, in reality, such an arrangement would not be possible since the membranes would have to be stretched to be perfectly flat but their reduced tensile strength capacity does not make this application possible. However, the experiment is useful to understand if it is the shape of the membranes that influences the acoustic performance of the system or if it is only the result of its acoustic absorption capacity, even if reduced. The model performs the calculation by considering a large surface area equivalent to the sum of the surfaces of the membranes. Its shape is completely flat, as if to simulate a suspended ceiling made up of the textile material of which the membranes are made, with the same absorption coefficients. The results are shown in Figure 25.
Finally, to verify even more the real effectiveness of the membrane system, or rather, the effectiveness of its shape, the same analyses are carried out, but the membranes in the room are inserted in a neutral position without having been subjected to the Form-finding design process (Figure 26 and Figure 27).

4. Discussion

For the first receiver, the average reverberation time drops from 7.3 s to 2.2 s, with a reduction of 5.3 s (Figure 28). The results show the effectiveness of the membrane system, which can reduce the reverberation time to increase the competence of the first receiver. Furthermore, it is also noted that the geometry of the system is the characteristic that most influences its effectiveness. The ability, therefore, to deflect a good fraction of the rays has the effect of reducing the reverberation time at a specific point.
As for receiver number 1, the second receiver also shows a great reduction in the reverberation time (Figure 29). Similarly to the previous case, the result drops from 7.3 to 2.2 s. The similarity of the results of the two receivers, but their difference in decimal digits, highlights the different behavior of the sound field at the two points.
When using the optimized membranes, the two receivers exhibit significantly reduced reverberation times compared to when they are not used. Membranes can be regarded as noise control tools within the Fruit and Vegetable Logistics Platform; they can influence the acoustic field by redirecting a significant portion of the reflected rays away from the two points being analyzed. As a result, they help in reducing the overall reverberation and improve the acoustic conditions in the facility. Clearly, these reverberation times have only been obtained at the points where the receivers have been placed. In fact, the results cannot be generalized for the whole environment.

5. Conclusions

From the analysis emerged the new possibility of reusing the textile membranes as a tool for noise control. The acoustic system made up of reused membranes, in fact, is composed of several elements which, together, make it possible to modify the acoustic field and control the reverberation time at precise points in the space. The analyses highlight the possibility of obtaining reverberation control through a system composed of reused membranes capable of using the characteristics of the fabric to modify the acoustic behavior of an environment by acting only on the geometry of surfaces suspended from the ceiling. To investigate the behavior of the membranes and to verify the functioning of the optimization design process through Form-finding, the system was simulated in the environment of the Fruit and Vegetable Logistics Platform, in the industrial warehouse of the Milanese Market. The reverberation time that characterizes the environment becomes the reference parameter for verifying the effectiveness of the membranes at a theoretical level exclusively through the simulation procedure. Achieving the optimized shape allows sound, simulated through the ray tracing procedure, to be redirected away from receiving areas. An attempt is made to redirect the sound in order to decrease the reverberation time at those specific points. By doing so, the amount of reverberated sound energy reaching the receivers within a certain period decrease, resulting in a drop in the reverberation time.
The Form-finding Optimization Process modifies the height of the anchor points of the membranes to modify their overall shape. By adjusting these parameters, an array of diffusers is created to deflect and redirect sound away from the receivers. Initially, the membranes are replicated and simulated using various software, such as Grasshopper and Kangaroo Physics, plug ins of Rhino 7, capable of generating surfaces affected by gravity and anchored at specific points. This approach ensures a realistic simulation. Once the optimized surfaces for the system and the acoustic space are obtained, the analysis of the reverberation time is conducted at the two receiving points using the Pachyderm software.
It is evident how the optimized shape of the membranes is the variable responsible for the effective reduction in reverberation times. The optimized membranes achieve far better results than the equivalent flat surfaces, the non-optimized system and the environment without the presence of the membranes. It is interesting to note how it is possible to reach an average reverberation time of 2.2 s starting from the initial value of 7.5 s at both points where the receivers are located. The membranes make it possible to decrease the reverberation time by as much as 5.3 s at both points.

6. Further Developments

The present work had some limitations due to the definition of the boundaries of the study and the theoretical stage of waiting for the construction of the building to perform some tests in the real environment. Due to the lack of material specimens at the time, it was not possible to assess the acoustic measurements, and this is the first step for the future optimization of this theoretical work. In the future implementation, the authors are focusing on how architectural membranes, being flexible materials, interact with sound waves differently compared to rigid materials that reflect sound. They recognize the significance of thickness and density variations in these membranes and how they influence their acoustic performance. To ensure an accurate evaluation, the authors plan to conduct comprehensive assessments that consider the effects of the different densities and thicknesses of architectural membranes. Simulating these scenarios beforehand will provide valuable insights into how the membranes will behave in real-world acoustic environments. Once the building site is finalized, conducting actual tests becomes crucial. By measuring the acoustic properties of the membranes in situ, they can verify the simulation results and validate the membrane’s effectiveness in controlling sound reflection, absorption and transmission. These practical tests will help fine-tune the design and ensure that the architectural membranes perform optimally in their intended applications, providing the desired acoustic environment for occupants.

Author Contributions

Conceptualization, A.M. and C.M.; methodology, C.M.; software, A.M.; validation, A.M. and C.M.; formal analysis, A.M.; investigation, A.M.; resources, A.M.; data curation, A.M.; writing—original draft preparation, A.M.; writing—review and editing, C.M.; visualization, A.M.; supervision, A.M. and C.M.; project administration, C.M. All authors have read and agreed to the published version of the manuscript.

Funding

This research received no external funding.

Data Availability Statement

No new data were created or analyzed in this study. Data sharing is not applicable to this article.

Acknowledgments

The authors acknowledge the constructive support of Federica Morandi during the initial acoustic concept phase and the Metropolitane Milanesi Spa, represented by Francesca D’Amico and Luca Benfante, for providing the documentation on the case study building.

Conflicts of Interest

The authors declare no conflict of interest.

References

  1. Monticelli, C.; Zanelli, A. Life Cycle Design and efficiency principles for membrane architecture: Towards a new set of eco-design strategies. In Proceedings of the International Association for Shell and Spatial Structures, Hamburg, Germany, 25–27 September 2017. [Google Scholar]
  2. Cox, T.; D’Antonio, P.J. Acoustic Absorbers and Diffusers: Theory, Design and Application, 3rd ed.; CRC Press: New York, NY, USA, 2017. [Google Scholar]
  3. Tensile Architecture. Available online: www.sergeferrari.com (accessed on 24 August 2022).
  4. Llorens, J. (Ed.) Fabric Structures in Architecture, 1st ed.; Woodhead Publishing: Cambridge, UK, 2015. [Google Scholar]
  5. Sluyts, Y.; Glorieux, C.; Rychtarikova, M. Effective absorption of architectural ETFE membranes in the lab. In Proceedings of the Euroregio/BNAM 2022 Conference, Aalborg, Denmark, 9–11 May 2022; pp. 289–295. [Google Scholar]
  6. Serge Ferrari, Our Products. Available online: https://www.sergeferrari.com/our-productsconsultato (accessed on 24 August 2022).
  7. Foster, B.; Mollaert, M.; Zanelli, A. Progettare con le Membrane; Maggioli Editore: Rimini, Italy, 2007. [Google Scholar]
  8. Rindel, J.H. Attenuation of sound reflection from curved surfaces. In Proceedings of the 24th Conference on Acoustics, The High Tatras, Strbske Pleso, Czechoslovakia, 1–4 October 1985. [Google Scholar]
  9. Shtrepi, L. Advances in diffusive surface design using 3d architectural parametric modelling programs. In Proceedings of the 23rd Interantional Congress on Acoustics, Aachen, Germany, 9–13 September 2019. [Google Scholar]
  10. Lim, J. A Stigmeric Approach to Acoustic Design; ETH Zurich: Zurich, Switzerland, 2011. [Google Scholar]
  11. Astolfi, A.; Shtrepi, L.; Badino, E. Acoustic Performance-Based design: A brief overview of the opportunities and limits in current practice. Acoustics 2020, 2, 246–278. [Google Scholar]
  12. Badino, E. Acoustic Performance-Based Design: Exploration of the Effect of Different Geometries and Acoustical Properties of an Urban Facade on the Mitigation of Chatting Noise in a Street Canyon. Ph.D. Thesis, Polytechnic of Turin, Turin, Italy, 2018. [Google Scholar]
  13. Gupta, T. The Sound Bending Project. Ph.D. Thesis, TU Delft, Delft, The Netherlands, 2020. [Google Scholar]
  14. Multiphysics Cyclopedia, The Finite Element Method. Available online: https://www.comsol.com/multiphysics/finite-element-method (accessed on 4 June 2023).
  15. Costabel, M. Principles of Boundary Element Methods; Technische Hochschule Darmstadt: Lausanne, Switzerland, 1986. [Google Scholar]
  16. About Grasshopper, Algorithmic Modeling for Rhino. Available online: https://www.grasshopper3d.com/ (accessed on 10 August 2022).
  17. Pachyderm Acoustic, Open Research in Acoustical Science and Education. Available online: https://github.com/PachydermAcoustic (accessed on 22 June 2023).
  18. Lazzarin, R.; Strada, M. Elementi di Acustica Tecnica; CLEUP: Padua, Italy, 1989. [Google Scholar]
  19. Galapagos on the Logic and Limitation of Generic Solvers, Parametrichouse. Available online: https://parametrichouse.com/galapagos1/ (accessed on 16 August 2022).
  20. Spagnolo, R. Manuale di Acustica; UTET Libreria: Milan, Italy, 2001. [Google Scholar]
  21. Labia, L. Evaluation of Acoustic Measurements Methods and Design of Meeting Rooms: Solutions for an Optimal Speech Perception. Master’s Thesis, Polytechnic of Turin, Turin, Italy, 2019. [Google Scholar]
  22. Minarelli, U. Relazione Tecnica di Valutazione D’impatto Acustico Ditta Guaraldi Francesco Carpenteria Leggera (Acoustic Impact Assessment Technical Report for the Guaraldi Francesco Light Carpentry Company); Guaraldi: Ferrara, Italy, 2014. [Google Scholar]
  23. Galapagos Optimization, TUDelft. Available online: www.wiki.bk.tudelft.nl (accessed on 28 July 2022).
  24. Armani, A. RT60, Metodi per la Misura del Tempo di Riverberazione; Spectra S.r.l: Arcore, Italy, 2009. [Google Scholar]
  25. Affini, A.; Spagnolo, L.L.; Quatrini, S. Measurements of reverberation times of a multifunctional hall, carried out with the use of two sound level meters with different data processing characteristics and with two different impulsive type noise sources. Comparison results. In Proceedings of the 44th National Conference of the Italian Acoustics Association, Pavia, Italy, 7–9 June 2017. [Google Scholar]
  26. Firas, M.S. An Approach to Improve Acoustic Performance in Multipurpose Halls. J. Am. Sci. 2014, 10, 9–15. [Google Scholar]
Figure 1. Membrane suspended at six anchor points. The fabric shapes itself according to self-weight and to the six bonds.
Buildings 13 02134 g001
Figure 2. Isometric and frontal view of the source point and of the sphere which symbolizes the range of action of the receiver.
Buildings 13 02134 g002
Figure 3. Axonometric and front view of the membrane suspension points.
Buildings 13 02134 g003
Figure 4. Axonometric and frontal view of the receiver and the source together with the membrane suspended at six points.
Buildings 13 02134 g004
Figure 5. Membrane: Interface of Grasshopper software with the string originating 3D geometrical definition of the red-colored membrane in the previous image. Starting from the coordinates of the anchoring points of the membrane, (a) a surface is created (b) interacting with the force of gravity (c). The membrane is converted into an entity capable of interacting with the ray tracing process (d). Ray tracing and Intersection point cloud: Interface of the Grasshopper string simulating the sound field through ray tracing. Starting from the three-dimensional environment (e) which is translated into the acoustic environment (f), then moving on to the consideration of the acoustic source (g), up to the ray tracing process (h). Finally, the receiver is simulated through the sphere (i), which has the task of counting the rays that intersect it (j). The result of the string is a value that corresponds to the intersections between the sphere around the receiver and the rays simulating sound.
Buildings 13 02134 g005
Figure 6. (a) Diagram of the Evolutionary Optimization Process. All contour lines are taken into consideration. (b) Diagram of the Annealing Optimization Process. It highlights how the process proceeds by leaps, the amplitude of which decreases as one approaches the result. Both the successful and failed jumps are present in the image.
Buildings 13 02134 g006
Figure 7. Axonometric and frontal view of the points of intersection between rays and the sphere enveloping the receiver. There are 39 points.
Buildings 13 02134 g007
Figure 8. Axonometric and frontal view of the points of intersection between rays and the sphere enveloping the receiver. The room features the positioning of the membrane. There are 36 points.
Buildings 13 02134 g008
Figure 9. Axonometric and frontal view of the points of intersection between rays and the sphere enveloping the receiver. The room features the membrane that has undergone the Form-finding process. There are 31 points.
Buildings 13 02134 g009
Figure 10. Isometric exploded view of the Logistics Platform.
Buildings 13 02134 g010
Figure 11. (a) Axonometric view of “Cella 1” with internal organization. (b) Axonometric view of “Cella 1”, showing the membranes suspended in a neutral position, all at the same height. Each of the six anchor points is 9.14 m high. The membranes are installed following the modules of the building.
Buildings 13 02134 g011
Figure 12. Planimetric scheme of the sources (red circles) and the receivers (blue circles).
Buildings 13 02134 g012
Figure 13. The axonometric view and cross section of the “Cella 1” room simplified using sources (points) and receiving areas (spheres).
Buildings 13 02134 g013
Figure 14. Axonometry and cross section of the room without the membranes. There are 527 points of intersection.
Buildings 13 02134 g014
Figure 15. Axonometry and cross section of the room with the membranes in neutral position. There are 515 points of intersection.
Buildings 13 02134 g015
Figure 16. Axonometry and cross section of the room with the membrane system optimized after the Form-finding process. There are 280 points of intersection.
Buildings 13 02134 g016
Figure 17. From the membrane made up of a complex surface to the one made up of a simplified surface.
Buildings 13 02134 g017
Figure 18. Galapagos software version 1.0.007 interface [23]. The green graph highlights the degree of improvement achieved by the research. At the bottom right there are the genotypes of the combinations of possible values, while at the bottom left there is a graph regarding the progress of the process.
Buildings 13 02134 g018
Figure 19. Isometric exploded view of the simplified room with the position of the sources 1, 2, 3, 4 and 5, and the receivers 1 and 2 for the Pachyderm analysis.
Buildings 13 02134 g019
Figure 20. Pachyderm software input interface. The order of reflection is set equal to 3, the number of outgoing rays from each source is set equal to 1000 and the simulation time of 10 s is specified.
Buildings 13 02134 g020
Figure 21. Comparison graph of the reverberation time measurements for the various octaves in the room without the membrane system. In light gray, the results obtained with Sabine’s formula. In medium gray, the results obtained with the simulation at receiver number 1. In dark gray, the results obtained with the simulation at receiver number 2.
Buildings 13 02134 g021
Figure 22. Isometric exploded view of the room with sources, receivers and membrane system optimized for Pachyderm simulation.
Buildings 13 02134 g022
Figure 23. Comparison of the reverberation times for each octave resulting from the two analyzes with the optimized membrane system. In light gray, the results obtained with the simulation at receiver 1. In dark gray, the results obtained with the simulation at receiver 2.
Buildings 13 02134 g023
Figure 24. Isometric exploded view of the room with sources, receivers and equivalent flat surface.
Buildings 13 02134 g024
Figure 25. Graph comparing reverberation time measurements for various octaves with the equivalent flat surface. In light gray, the results obtained by Sabine’s formula. In medium gray, the results obtained with the simulation at receiver number 1. In dark gray, the results obtained with the simulation at receiver number 2.
Buildings 13 02134 g025
Figure 26. Comparison of the reverberation times for each octave resulting from the two analyzes with the membrane system in neutral position. In light gray, the results obtained with the simulation at receiver number 1. In dark gray, the results obtained with the simulation at receiver number 2.
Buildings 13 02134 g026
Figure 27. Isometric exploded view of the room with sources, receivers and membrane system in neutral position.
Buildings 13 02134 g027
Figure 28. Comparison graph of the reverberation times for each octave of the various analyses carried out for receiver number 1.
Buildings 13 02134 g028
Figure 29. Comparison graph of the reverberation times for each octave of the various analyses carried out for receiver number 2.
Buildings 13 02134 g029
Table 1. Sound absorption values of the polyvinyl chloride-coated polyester fabrics (PES/PVC).
Membrane125 Hz250 Hz500 Hz1000 Hz2000 Hz4000 Hz
Polyvinyl chloride-coated polyester fabrics 10.020.030.070.200.230.29
1 Average of the main fabrics in [6].
Disclaimer/Publisher’s Note: The statements, opinions and data contained in all publications are solely those of the individual author(s) and contributor(s) and not of MDPI and/or the editor(s). MDPI and/or the editor(s) disclaim responsibility for any injury to people or property resulting from any ideas, methods, instructions or products referred to in the content.

