1. Introduction
The growing urban population has led to a rapid expansion of global cities, with a corresponding increase in construction intensity. This expansion brings convenience to urban dwellers, but also exacerbates environmental issues such as air pollution, heat waves, and urban heat islands. These problems stem from the reduction in natural ventilation in urban areas. The accumulation of pollutants resulting from deficiencies in the wind environment can significantly impact human health, encompassing elevated levels of airborne PM2.5 and the transmission of biological viruses [
1]. Research has shown that optimizing the urban wind environment can address these microclimate challenges. However, the disordered spatial layout of cities makes the urban wind climate increasingly delicate [
2]. This study aims to address this issue by exploring ways to optimize the urban wind environment through adjusting block spatial forms.
The study of the outdoor wind environment can be approached from two perspectives: the urban scale and the neighborhood scale. The focus of wind environment research at the urban scale is on the overall ventilation situation of the city or region, and efforts are made to create urban ventilation corridors to increase wind speed and alleviate the negative impact of the urban heat island effect. Additionally, these corridors can guide the direction of the dominant wind in the city, thereby promoting the circulation of pollutants and reducing their concentration in the urban environment. The concept of urban climate maps, which are divided into urban climate analysis maps and urban climate planning maps, was first proposed by German scholars as early as the 1970s and has since been widely researched in cities around the world [
3,
4].
In the academic community, research on urban microclimates and spatial forms in the Western world gradually started in the 1980s and the importance of improving urban spatial forms on urban microclimates has become increasingly recognized. Currently, optimizing urban spatial forms in urban planning and architectural design has become a hot topic of research [
5,
6,
7]. Scientifically planning the form of architectural spaces in cities is crucial in creating a favorable wind environment. Recognition of the importance of the urban wind environment has been acknowledged globally and is considered a crucial step in the planning and design phase.
Australia has established specific requirements for the urban wind environment since the 1970s. For instance, the City of Sydney has implemented the “City Environment Regulations”, which stipulate that the wind speed in pedestrian alleys must be less than 10 m/s and in areas where people often gather it must be less than 13 m/s. High-rise buildings in cities must submit a simulation report on the wind environment to the government prior to construction to prevent excessive wind velocity and large areas of calm wind.
The United States started researching outdoor wind environments relatively early on. For example, the government of Boston stipulates that the probability of wind speed exceeding 13.5 m/s in a new building block per year should be less than 1%. Tall buildings over 47 m in height must use simulation software to evaluate and simulate the wind environment of the block during the design phase to ensure a comfortable wind environment.
Spain has been actively engaged in the field of microclimate testing, employing significant platforms such as the World Expo to showcase its advancements, for instance, the semi-passive bioclimate building featured at the 1992 Seville World Expo and the microclimate generator pillar exhibited at the Spanish Pavilion during the Zaragoza World Expo [
8,
9,
10,
11,
12].
Japan began researching the outdoor wind environment in neighborhoods in 1970 and established the “Environmental Co-living Housing Recognition Standard” in 1990, which requires buildings to be adapted to their surrounding microclimate. In 2002, Japan introduced its first green building evaluation standard, placing emphasis on the importance of the outdoor wind environment as part of the outdoor thermal environment. The Kyoto Environmental Agency made it clear in 2010 that any new building with an area of over 2000 square meters must have a report on its outdoor wind environment submitted to the government before construction.
Currently, academic research on the block-scale wind environment focuses primarily on street canyons, which are defined as areas bounded by buildings and streets on both sides. Oke was the first to investigate this phenomenon, and subsequent scholars have built upon his findings through numerical simulations that explore the connection between the street height-to-width ratio and wind conditions [
13]. For instance, Maria Grazia Bada and her team evaluated the impact of roof slopes on wind fields in neighborhood canyons through computer simulations and concluded that sloped roofs are beneficial in enhancing ventilation in narrow canyons [
14]. Shashua Bar and Hoffman conducted numerous calculations on street canyon models and discovered the impact of factors such as street height-to-width ratio and building depth on urban microclimate [
15]. A team of researchers from the US, Denmark, and Britain used turbulence models to analyze the effect of roof configuration on street canyon wind environment [
16]. Georgakis and Santamouris analyzed field-measured climate data to outline the laws of variation in street canyon wind and thermal environments [
17]. Yang et al. studied the impact of vegetation morphology on street canyon microclimates through simulations of different street tree planting patterns [
18]. Research on the wind environment of neighborhoods, particularly residential areas, is also a common focus. Scholars from Turkey studied the impact of different urban spatial forms on the ventilation ability of residential areas in Erase, while a team led by Yunlong Peng conducted a study on the ventilation conditions of residential neighborhoods in Nanjing with different orientations and found that the ventilation conditions of residential streets facing north and south are superior to those facing east and west [
19].
The impact of high-rise buildings on the surrounding wind environment is even more pronounced, and their complexity adds to the challenge. For instance, the windward surface of high-rise buildings has corner sides that form areas with a higher wind speed, while the leeward side creates areas with lower wind speed. The wind environment around high-rise buildings has attracted extensive research among relevant scholars, with WD Baines proposing the possibility of studying their impact on wind fields as early as 1965 [
20,
21]. In recent years, research on the wind environment of high-rise buildings has increased, and Priyadarsini Rajagopalan and her team found through their study of the downtown area of Maputo that the location of high-rise buildings can significantly impact their surrounding wind environment [
22].
The correlation between wind environment and various urban spatial indicators has been a focus of academic research in the past decades. One of the earliest studies on this topic was presented during the International Conference on Building Structures and Wind Effects [
21]. Since then, scholars have conducted numerous studies on the impact of individual spatial elements, such as building height [
23], frontal area ratio [
7], the platform of mega-tall buildings [
24], and the spatial characteristics of building groups [
25], on the wind environment. A simulation of over 20 high-density residential areas in Hong Kong revealed a linear relationship between spatial indicators and wind velocity [
26]. Recent studies have investigated the influence of roof wind field parameters [
27], twisted air flows [
28], wind-induced torques on buildings [
29], pollutant dispersion in building arrays [
30], and the importance of considering local wind environment in architectural design [
31]. Scaled outdoor experiments were conducted in street canyons to study ventilation and interunit dispersion in real urban environments [
32]. The significance of wind environment on pedestrian safety and architectural design has been emphasized in recent research [
33].
Despite considerable research on outdoor wind environments in neighborhoods, most studies currently focus on cities in hot climates and overlook high-rise residential neighborhoods in cold regions. It is worth noting that regions experiencing colder climates still encounter several climate challenges concerning the wind environment. These challenges include issues such as pollutant accumulation and inadequate air circulation during the summer season. Furthermore, in the studies of the impact of neighborhood spatial form on outdoor wind environments, researchers tend to reach conclusions by considering only a single spatial form index, without considering various form indices. To overcome the mentioned limitations, this research focuses on Xi’an, a city situated in a cold region according to the “China Building Climate Zone Standard”, as the primary subject of study. Seven spatial form indices associated with architectural design were carefully chosen for analysis. Notably, Xi’an falls within the cold area of the Köppen climate zone classification. The study extensively examined and consolidated the effects of various spatial indices on outdoor wind environments in neighborhoods through a combination of field measurements and simulations.
The wind environment in high-rise residential neighborhoods in cold regions such as Xi’an is under-researched, which is a significant shortcoming, as the wind environment directly affects the comfort and well-being of residents. The limited research on the wind environment in these areas makes it challenging to address the wind-related issues and improve living conditions for the residents. This research aims to specifically examine the influence of various spatial indices on the outdoor wind patterns in high-rise residential neighborhoods located in Xi’an during the winter season. By analyzing these spatial indices, the study intends to offer crucial insights into optimizing the wind environment in cold regions, particularly in high-rise residential areas. The findings will contribute to the development of effective strategies for enhancing the overall wind conditions in such neighborhoods, thereby fostering better living conditions and energy efficiency.
2. Materials and Methods
2.1. Research Object
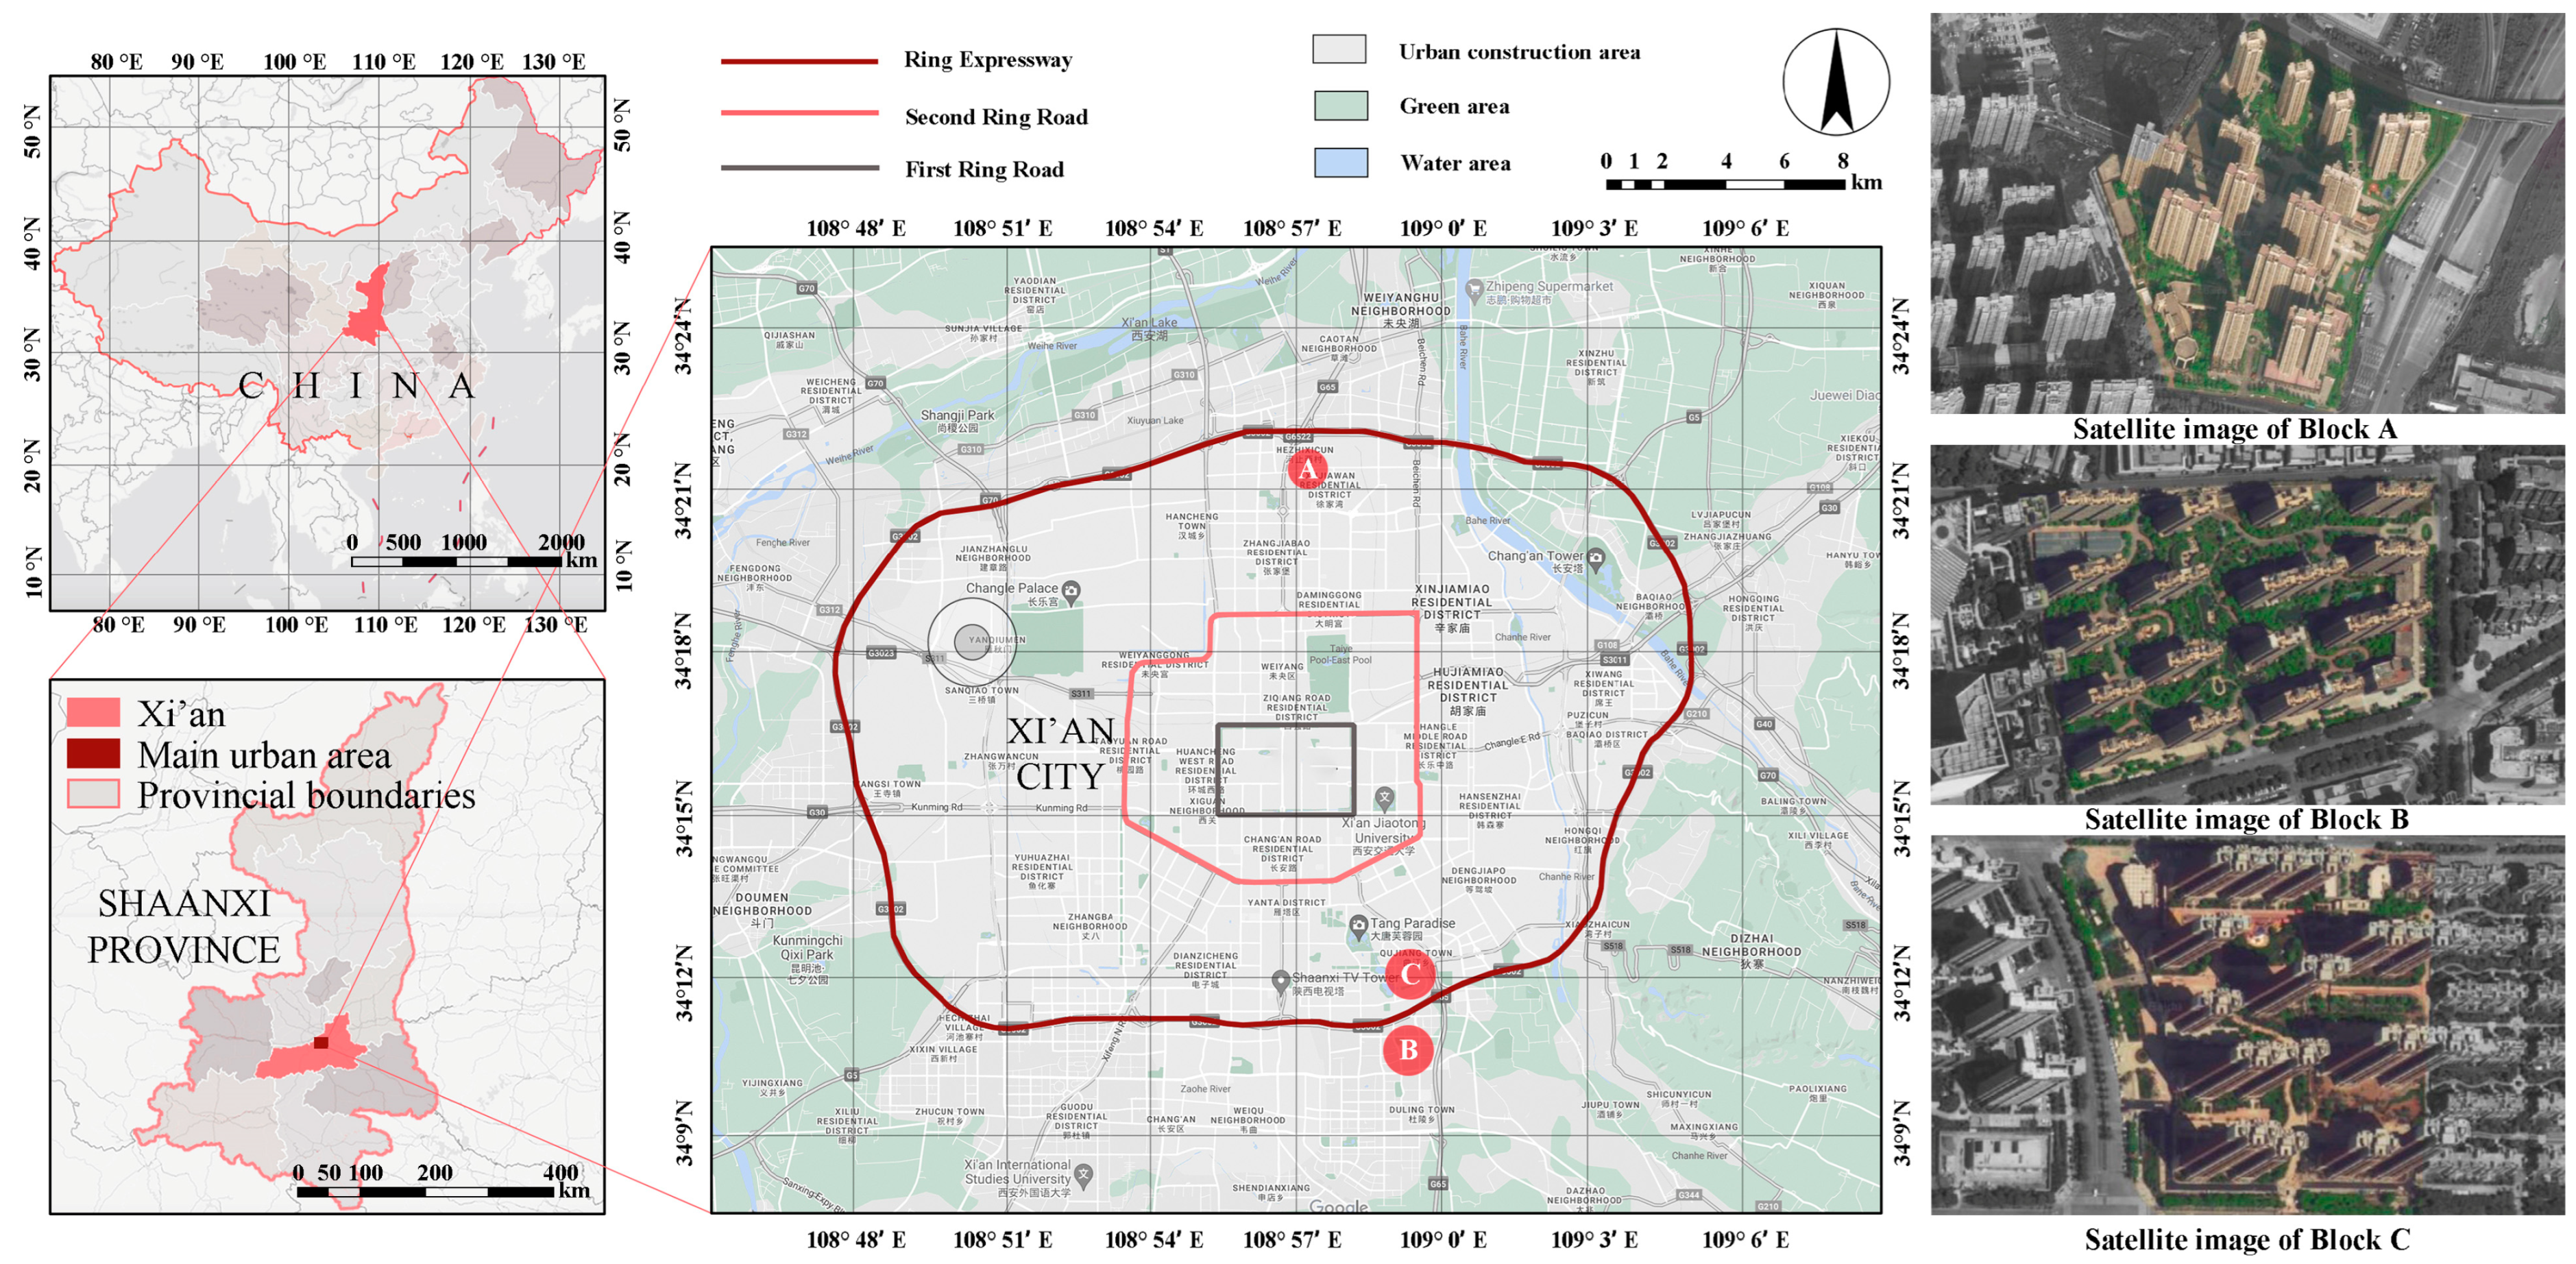
Xi’an (
Figure 1), the capital city of Shaanxi Province in central China, has a total area of approximately 10,000 square kilometers. It has a rich history dating back over 3000 years and was one of the ancient capitals of China, playing a key role in the country’s politics, economy, and culture. The city is known for its famous Terracotta Warriors and Horses Museum, the City Wall of Xi’an, and the Great Mosque, which are popular tourist attractions that attract millions of visitors from around the world each year.
The topography of Xi’an is characterized by the flat Guan Zhong Plain to the north and the Qinling Mountains to the south. The urban landscape of Xi’an encompasses a mixture of plains, hills, and mountains, with a primarily plain terrain. The city experiences a continental monsoon climate, with an average annual temperature ranging from 13.0 to 13.7 °C based on data collected by the Xi’an Meteorological Bureau from 1971 to 2021. The lowest average temperature occurs in January, which ranges from −1.2 to 0 °C, while the highest average temperature occurs in July, with temperatures ranging from 26.3 to 26.6 °C. The annual average wind speed is 1.8 m/s, and the prevailing wind direction throughout the year is northeast by north.
2.2. Field Investigation
This study adopts a combination of field measurement and numerical simulation analysis to comprehensively assess the wind environment quality of high-rise residential blocks in Xi’an. By employing two methods, we aim to achieve a comprehensive understanding of the wind conditions in the study area. Firstly, we conducted on-the-spot measurements on three selected typical high-rise residential blocks to analyze their wind environment characteristics. This not only allowed us to evaluate the current wind environment quality but also served as a means to validate the accuracy and performance of the simulation software used. The software employed for the simulation is the Computational Fluid Dynamics (CFD) simulation analysis tool PHOENICS. Using the CFD simulation analysis software, PHOENICS, we further simulated the wind field at the pedestrian height for different spatial form indicators and layout patterns in Xi’an City. Subsequently, we extracted simulation data for each block and computed relevant parameters to evaluate the wind conditions inside and around the blocks. Specifically, the parameters assessed include the average wind speed within the block, the area ratio of the comfort zone, the wind speed unevenness, and the area ratio of the tranquil wind area in the downwind direction of the block. This study’s high-rise residential block model is based on field investigation data from 205 high-rise residential blocks within the Third Ring Road in Xi’an. The field investigation involved collecting data on the size of high-rise residential blocks and internal residential buildings, as well as the layout characteristics of residential buildings in these blocks. In addition to the field survey, the spatial characteristics data of high-rise residential blocks was sourced from the Xi’an urban planning map and satellite map.
The results of the spatial data analysis of 205 high-rise residential blocks reveal that the average east–west length of the block plane in Xi’an ranges between 220 and 285 m, with the longest being 720 m, the shortest being 90 m, an average of 280 m, and a median of 260 m. The average length of point-type high-rise residential buildings in the east–west direction is 32 m, and 21 m in the north–south direction. The average length of slab-type high-rise residential buildings in the east–west direction is 64 m and 18 m in the north–south direction.
The results of the layout analysis of high-rise residential blocks in Xi’an show that the mixed layout of point-type and slab-type accounts for 72%, all plate-type high-rise residential buildings account for 20%, all point-type high-rise residential buildings account for 6%, and the enclosed layout mode accounts for the least, only 2%.
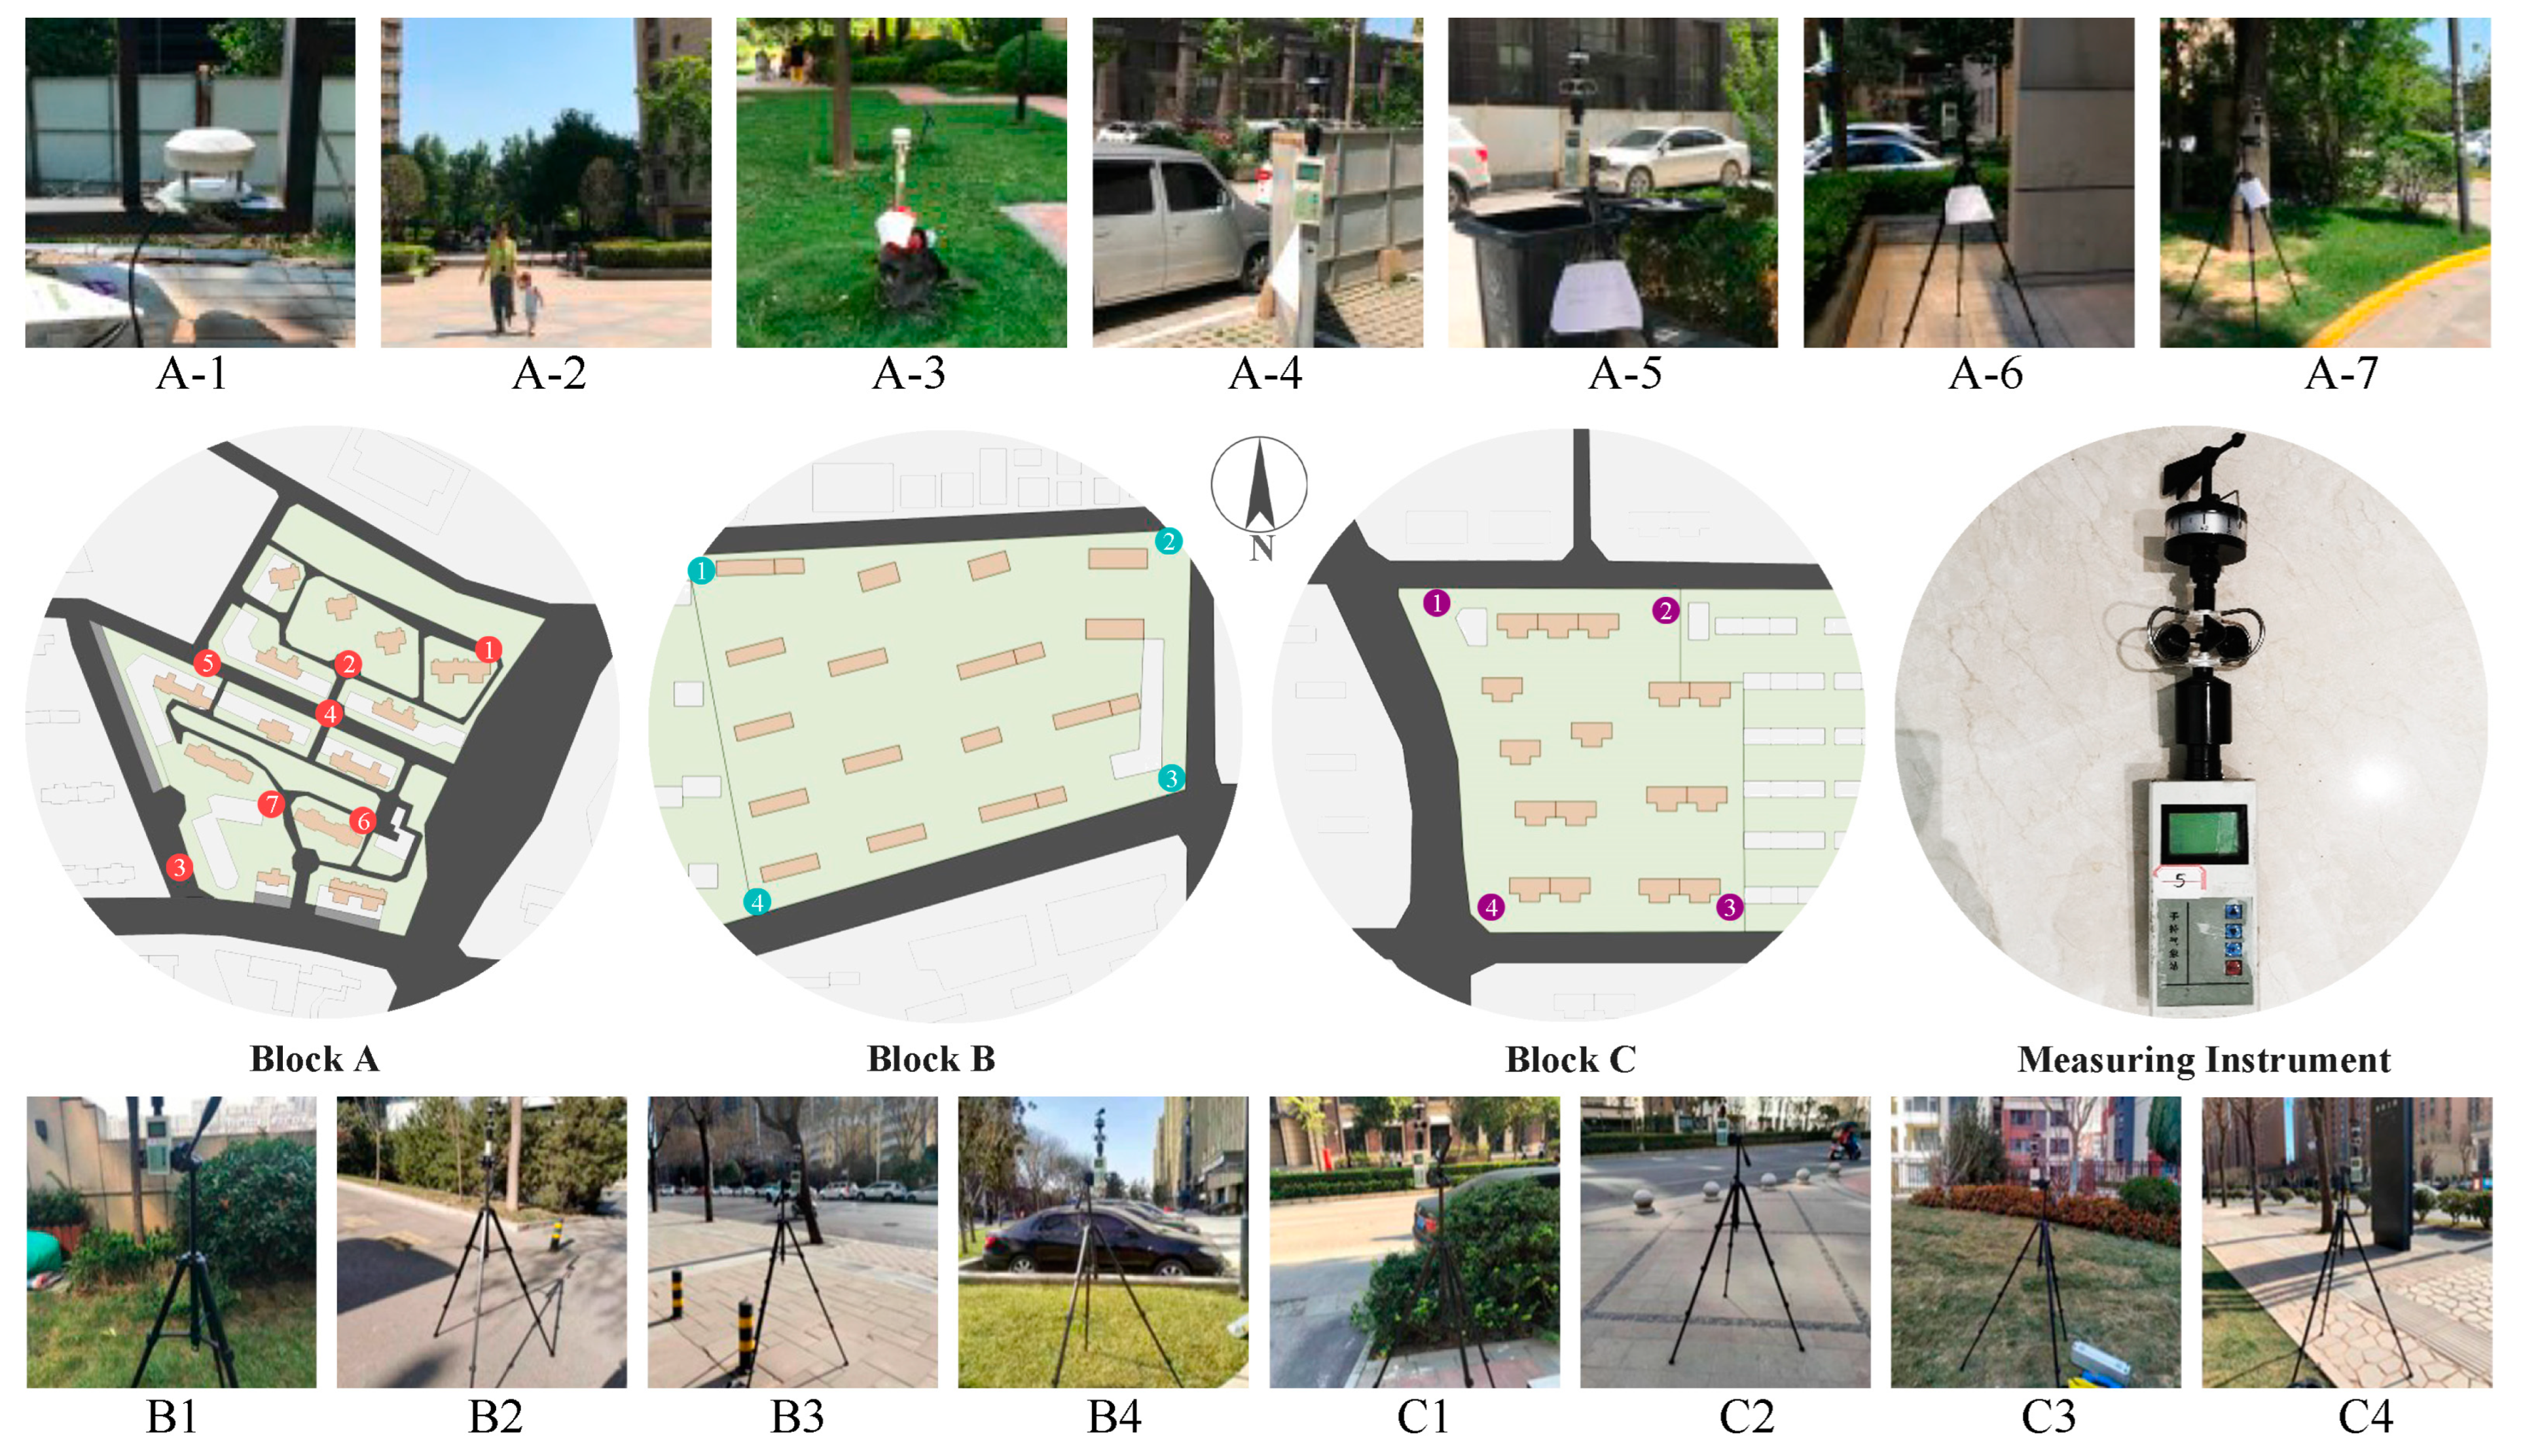
2.3. Field Measurement of Wind Environment inside Typical High-Rise Residential Blocks
As mentioned before, three residential blocks were selected for the measurement of outdoor wind environment data. The criteria for selection were proximity to the median scale of high-rise residential areas in Xi’an and representation of various plane layouts. The field measurement was conducted on two clear, cloudless days after the summer solstice in 2022, from 6:00 a.m. to 10:00 p.m. Block A had seven measuring points, while Blocks B and C each had four measuring points to measure wind environment data 1.5 m above the ground. The measuring points were located in the air inlet of the block, the square and green areas between the residential buildings, and the street between the two residential blocks. The distribution of measuring points is depicted in
Figure 2. The measuring instrument used was a handheld weather station produced by Beijing Shunxiang Kaixin Company.
A part of the measurement results is presented in
Table 1. The results show that the average wind speed at each measuring point in Block A was less than 1 m/s. Points 1 and 3 recorded the highest wind speeds, as they were located in the northeast and southwest of the block, respectively, which were the main wind directions on the measurement days. Points 2, 6, and 7 inside the block recorded low wind speeds throughout the day, due to the obstruction of the internal high-rise buildings to the wind. The average wind speed on the east side of Block B was generally higher than that on the west side, with lower average wind speeds in the morning and evening, and higher average wind speeds at noon.
Based on the results of the field measurements, the following issues with the wind environment in high-rise residential areas in Xi’an can be summarized as:
Low initial wind speed outside the block: This is due to the terrain being similar to a basin, which reduces the speed of airflow when it reaches the main urban area. Additionally, there is an absence of consideration for ventilation corridors in the initial urban planning obstructing air circulation in the city.
Low wind speed inside the block: The results indicate that the wind speed at all measuring points was lower than 1 m/s, which is due to both the low external initial wind speed and the complex spatial characteristics in the residential area.
Uneven wind environment inside the block: Inadequate consideration of the wind environment factors in the planning and design of residential areas leads to an uneven distribution of the wind environment inside the block, resulting in many corner flow areas and vortex areas. The wind speed in corner flow areas exceeds the range of the wind speed comfort area, while the wind speed in vortex areas is not conducive to air circulation.
2.4. Simulation and Verification of Measured Results
This study utilizes PHOENICS software for simulation research. PHOENICS is a widely used wind environment simulation software, which incorporates a special FLAIR module for architectural design, and is commonly applied in the simulation of indoor and outdoor building wind and thermal environments. Its accuracy in simulating block-scale outdoor wind environments has been well established in previous studies. In this study, the composite grid method is employed in the simulation setup to improve calculation efficiency while preserving the accuracy of the results. The simulated initial wind environment conditions are based on the typical meteorological annual wind environment data of Xi’an, characterized by an average wind speed of 2.2 m/s, and a northeast wind direction. The simulation is performed over 2000 iterations, and a roughness coefficient of 0.25 is used as the correction factor. The standard k-ε Model, which balances accuracy and computational time, is selected, similar to previous studies.
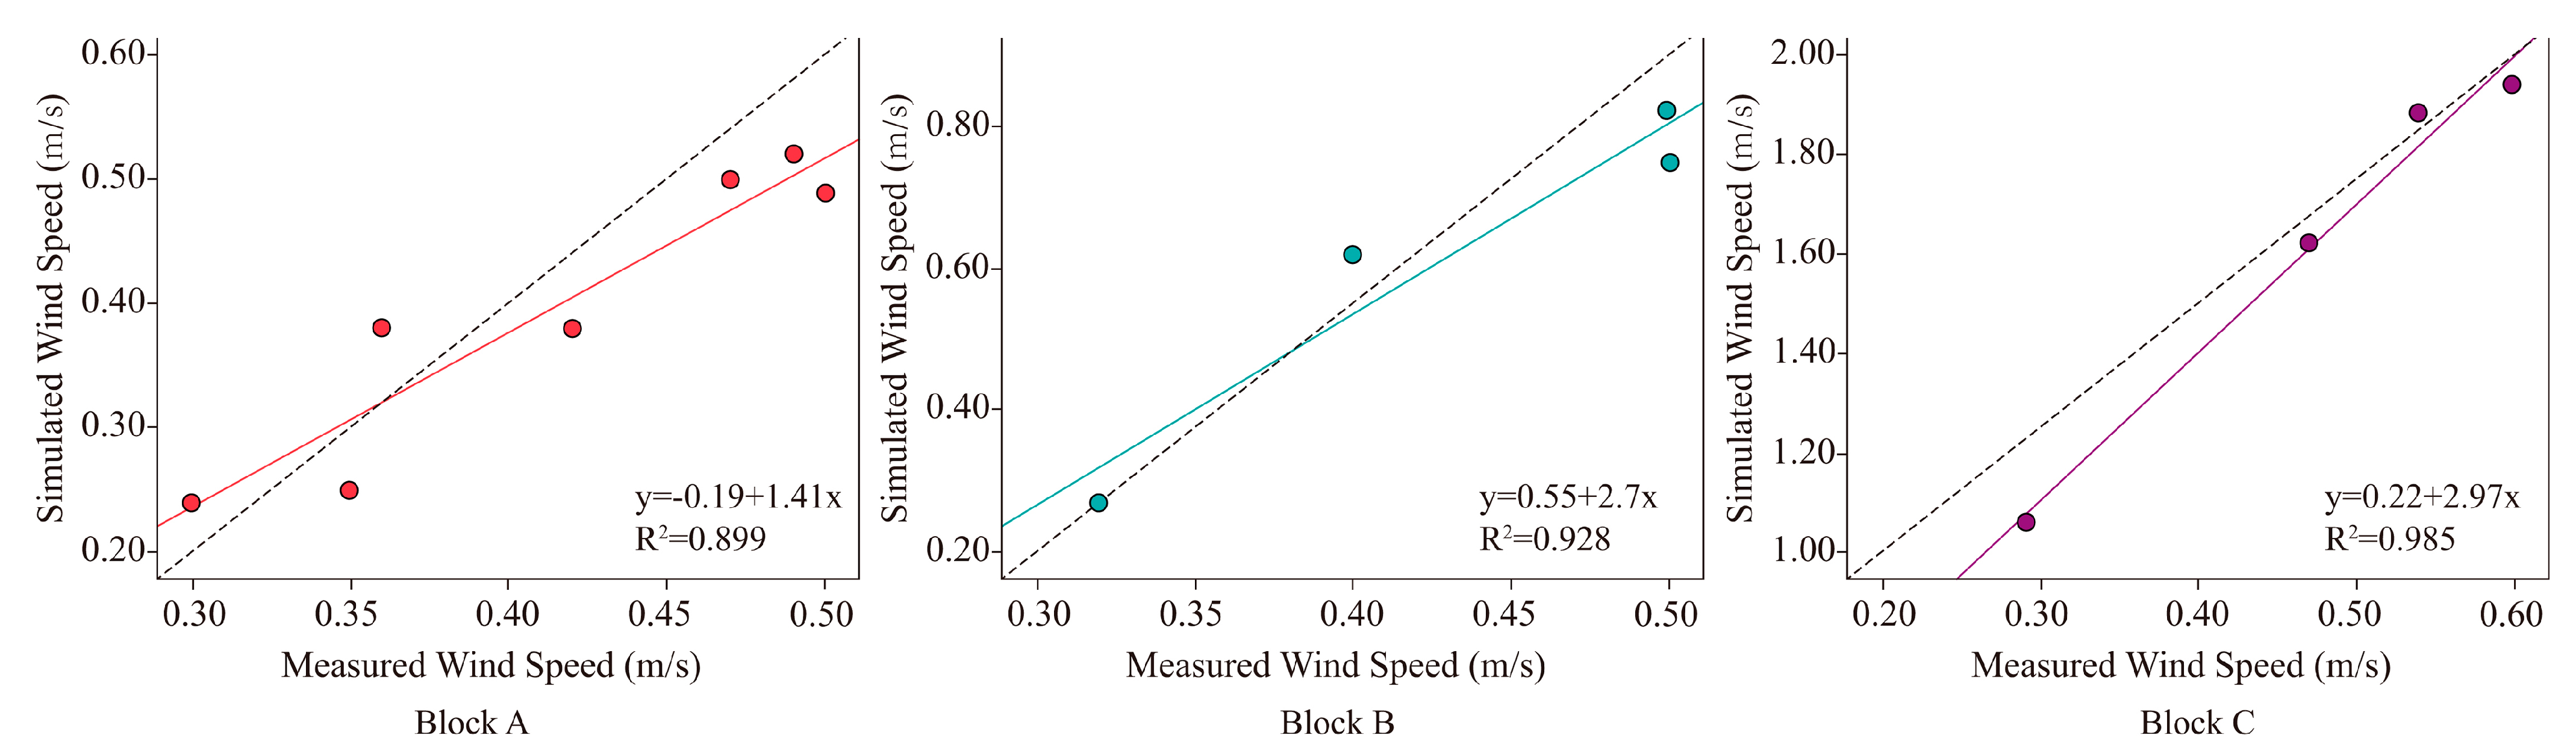
Table 2 displays the measured and simulated wind speeds at all measurement points, and the results of the linear regression analysis between the two datasets are illustrated in
Figure 3 [
34].
The regression verification results for residential blocks A, B, and C yield R2 values of 0.89 (p < 0.01), 0.93 (p < 0.05), and 0.99 (p < 0.01), respectively. These results indicate a strong linear correlation between the measured data and the PHOENICS simulated wind speeds in the three residential areas, demonstrating the ability of the software to accurately depict the wind environment in high-rise residential blocks in Xi’an.
It is important to highlight that there are discrepancies observed between certain measured wind speed values and the simulation results, particularly at the measurement points of Block C. This discrepancy is primarily attributed to the location of Block C, which is situated near the South Third Ring Road in Xi’an. The presence of nearby high-rise buildings obstructs the airflow in the dominant wind direction (northeast), leading to variations between the simulated and measured wind speeds in this area. Nonetheless, despite these localized discrepancies, it is crucial to acknowledge that the wind field simulation results obtained using PHOENICS effectively capture the overall trend of wind speed changes for all three high-rise blocks.
3. Results and Discussion
3.1. Establishment of Models Based on a Single Spatial Index Change
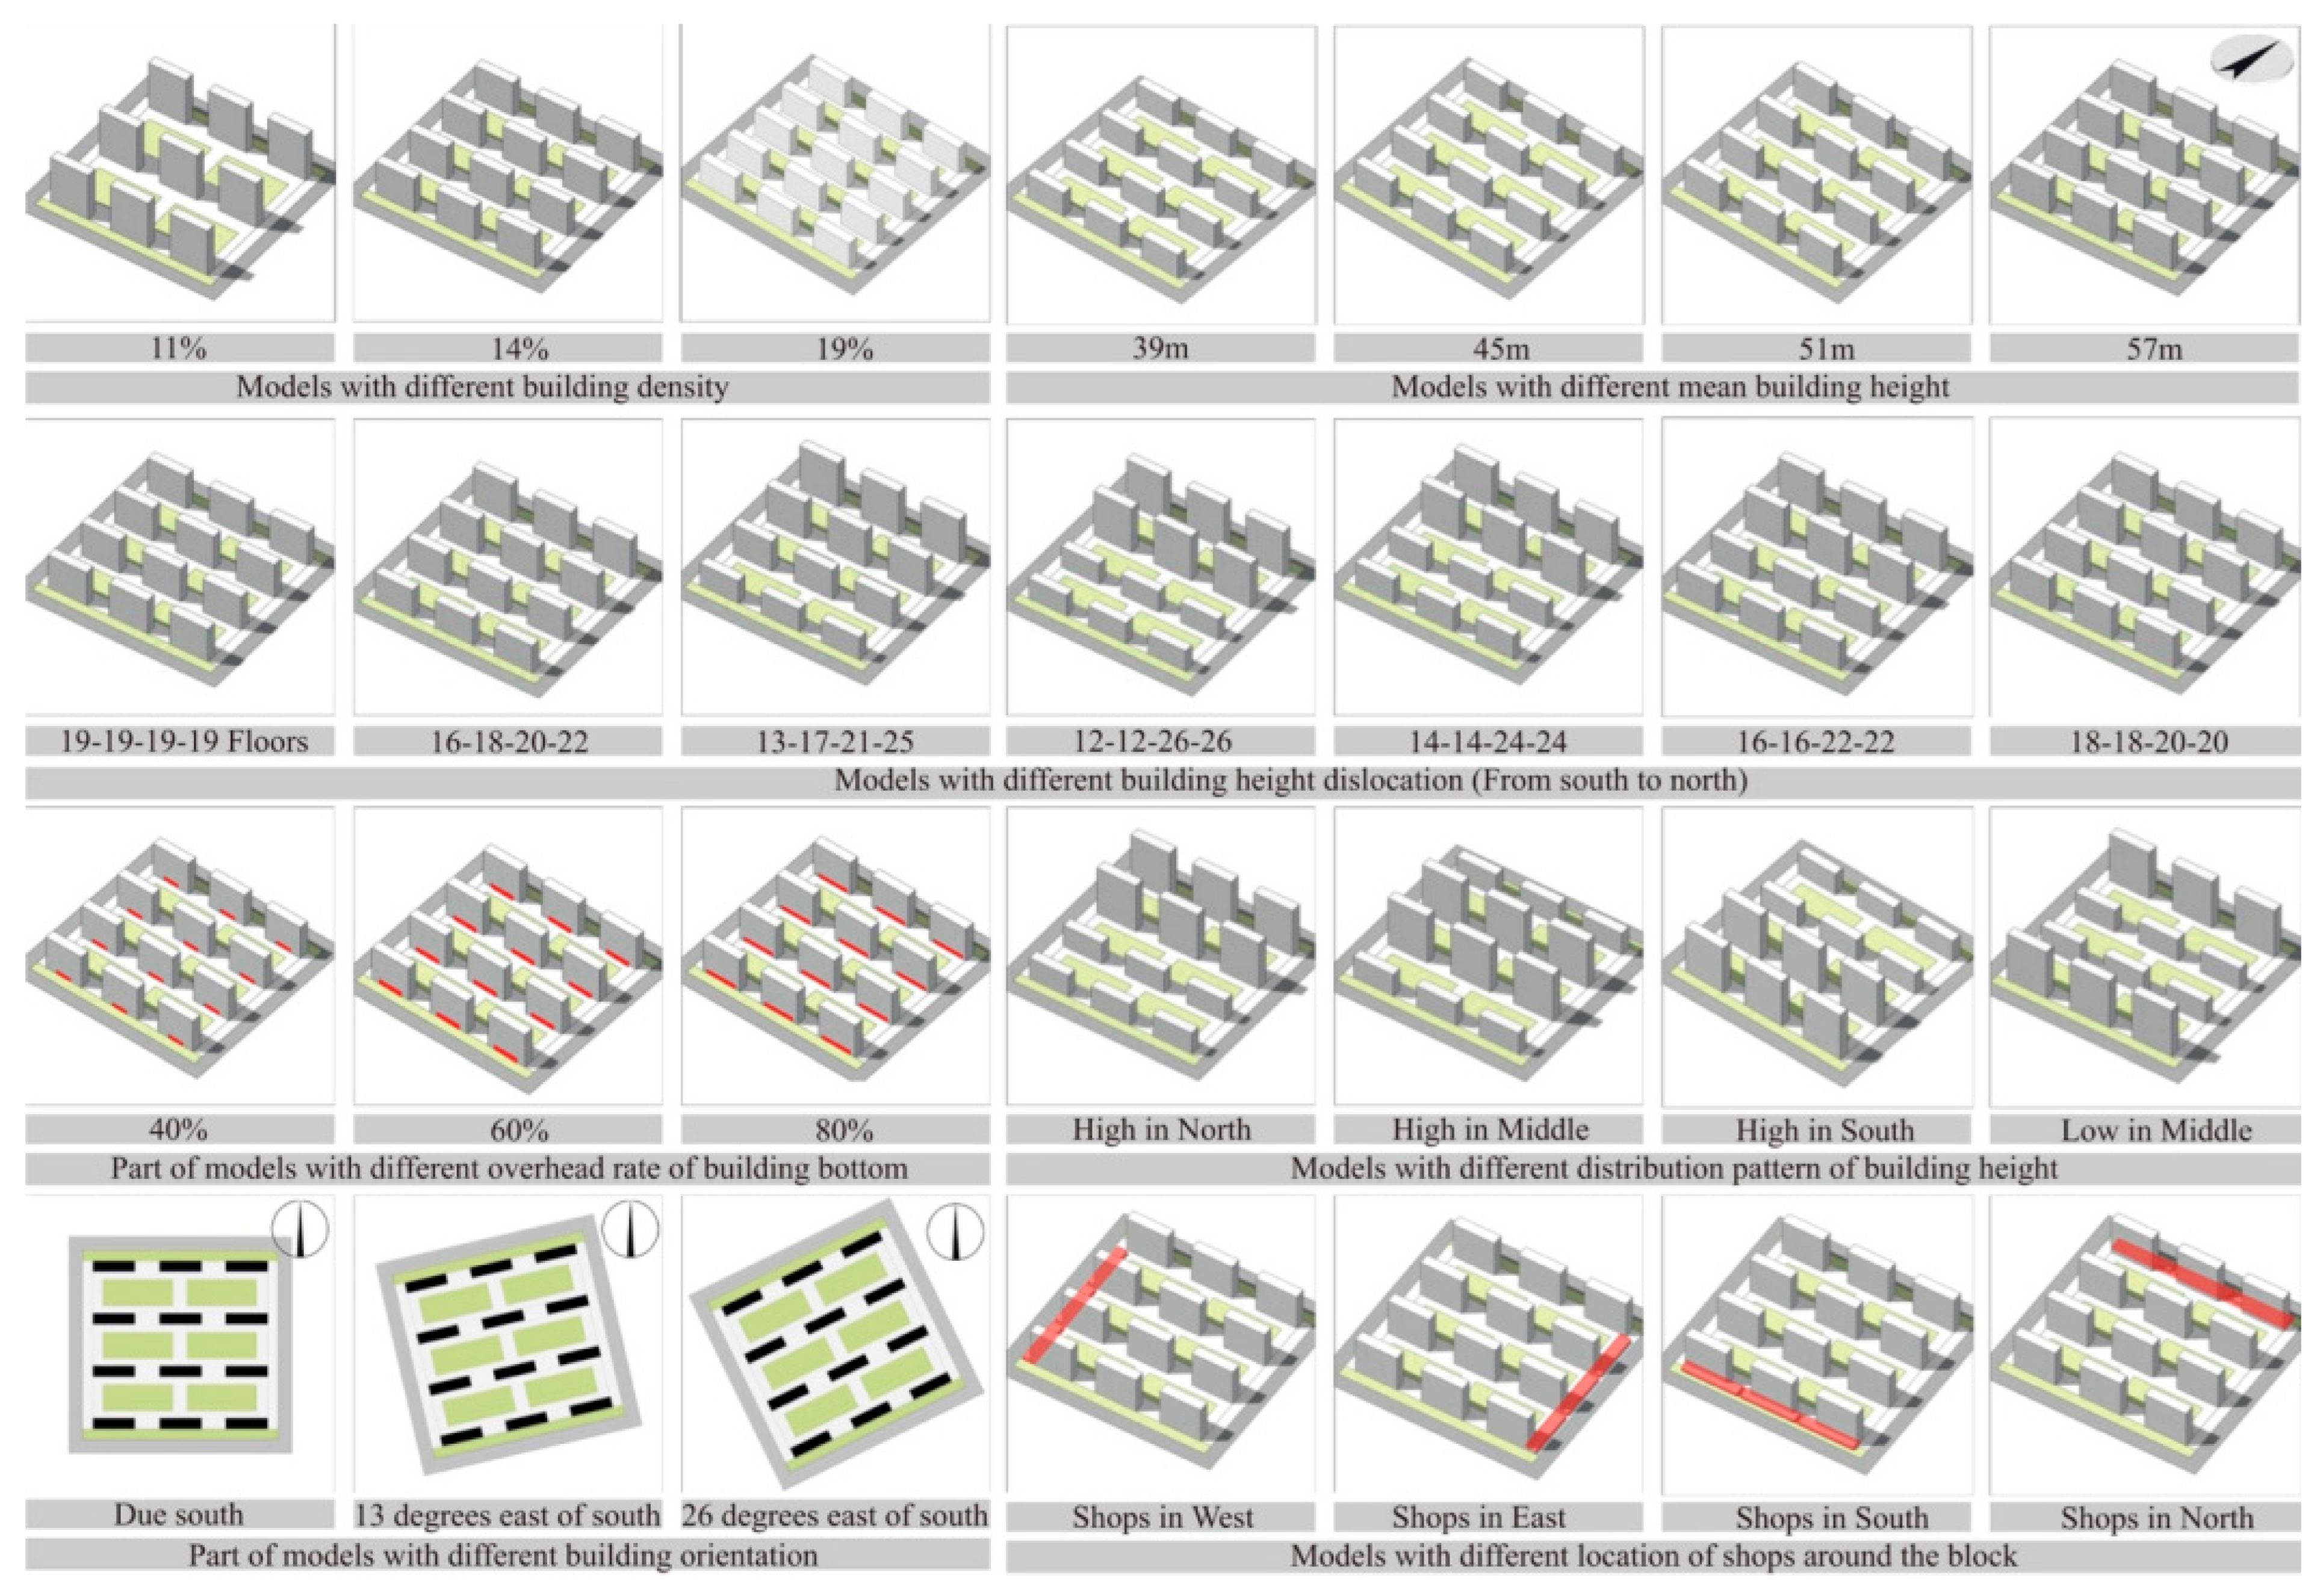
According to the results of a field survey on the spatial form of residential blocks in Xi’an, a simulation block with the dimensions of 280 m in length and 270 m in width was established in the simulation software. The model plane size of a point-type high-rise residential building was set at 30 m by 20 m, while that of a plate-type high-rise residential building was set at 60 m by 15 m. By varying the values of various spatial form indices, seven groups of high-rise residential block models were created, as illustrated in
Figure 4.
The first four rows of models depict blocks with varying building densities, building heights, building height disparities, and ground floor overhead ratios, with the specific values displayed at the bottom of each model. The fifth-row model shows five different building height distribution modes, including uniform building heights, increasing heights from south to north, decreasing heights from south to north, higher heights in the middle compared to the north and south sides, and lower heights in the middle compared to the north and south sides. Residential blocks in Xi’an generally have a south–north orientation, with only some areas in the southeast and southwest directions of the Second Ring Road having a deviation of 13 to 26 degrees. Based on these observations, five block models with different orientations were established in the sixth row, including north–south orientation, 26° south by east, 13° south by east, 26° south by west, and 13° south by west. The final row of models depicts four blocks with varying street-side shop layouts, with shops having a height of 5 m and a depth of 15 m, located in the east, south, west, and north directions of the block, with a continuous width ranging from 27 m to 80 m.
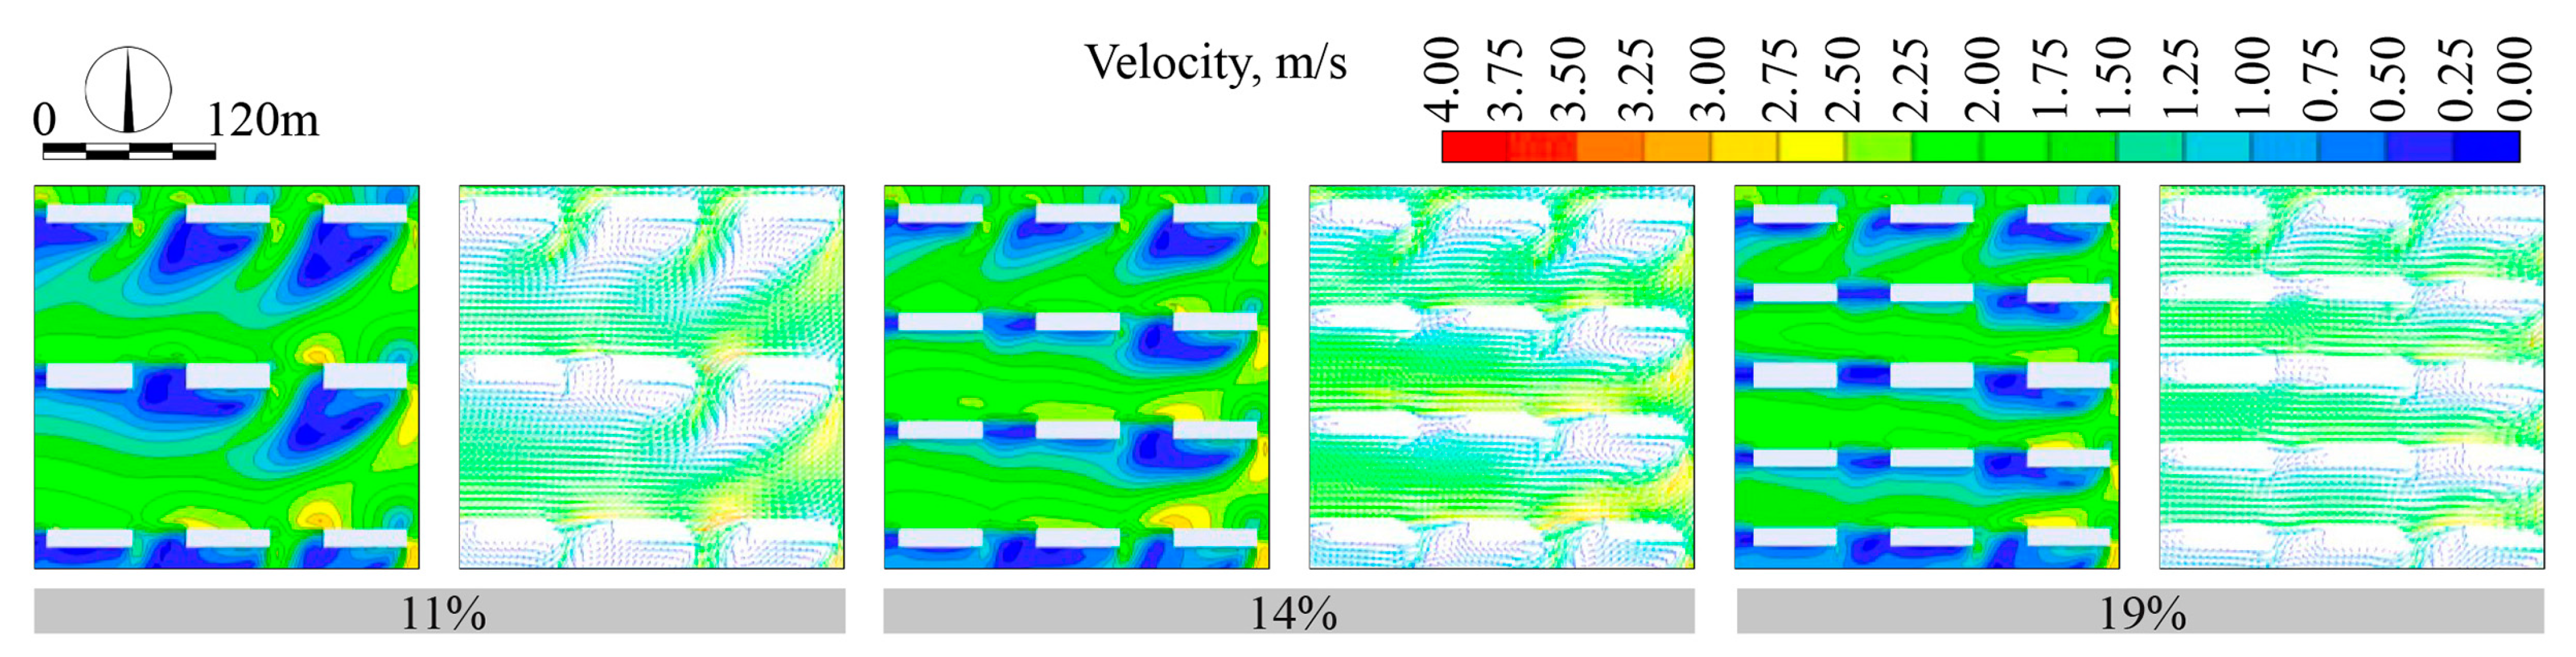
3.2. Influence of Building Density on the Wind Environment in the Block
Figure 5 presents the wind velocity cloud and wind velocity vector maps of high-rise residential neighborhoods with varying building densities.
Table 3 displays the average wind velocity, the proportion of wind comfort areas within the neighborhood, and the wind velocity non-uniformity coefficient.
It is observed from the wind velocity cloud and
Table 3 that the average wind velocity within the neighborhood decreases with an increase in building density. For instance, when the building density of the neighborhood decreases from 19% to 11%, the average wind velocity increases from 1.47 m/s to 2.02 m/s, a 27.2% increase. Furthermore, the proportion of wind comfort areas within the neighborhood decreases with an increase in building density. For example, when the building density of the neighborhood increases from 11% to 19%, the proportion of the wind comfort area within the neighborhood decreases from 74.3% to 66.1%. The building density has a significant impact on the wind velocity non-uniformity
within the neighborhood. The wind velocity non-uniformity coefficient decreases from 0.92 to 0.58, a 40.0% decrease, when the building density increases from 11% to 19%.
The results indicate that, under the same conditions, reducing the building density within the neighborhood can increase both the average wind velocity and the proportion of wind comfort areas. However, this also leads to an increase in wind velocity non-uniformity within the neighborhood. To maintain the floor area ratio of these three models, building height must increase with a decrease in building density, thereby making air flow in the angle flow area stronger and expanding the wind shadow area in the downwind direction. However, the augmented wind speed within the angular flow area ranges between 1.3 m/s and 5 m/s, encompassing the wind speed comfort zone as defined by the Beaufort wind scale [
35]. Therefore, reducing the building density can improve the wind environment within residential neighborhoods.
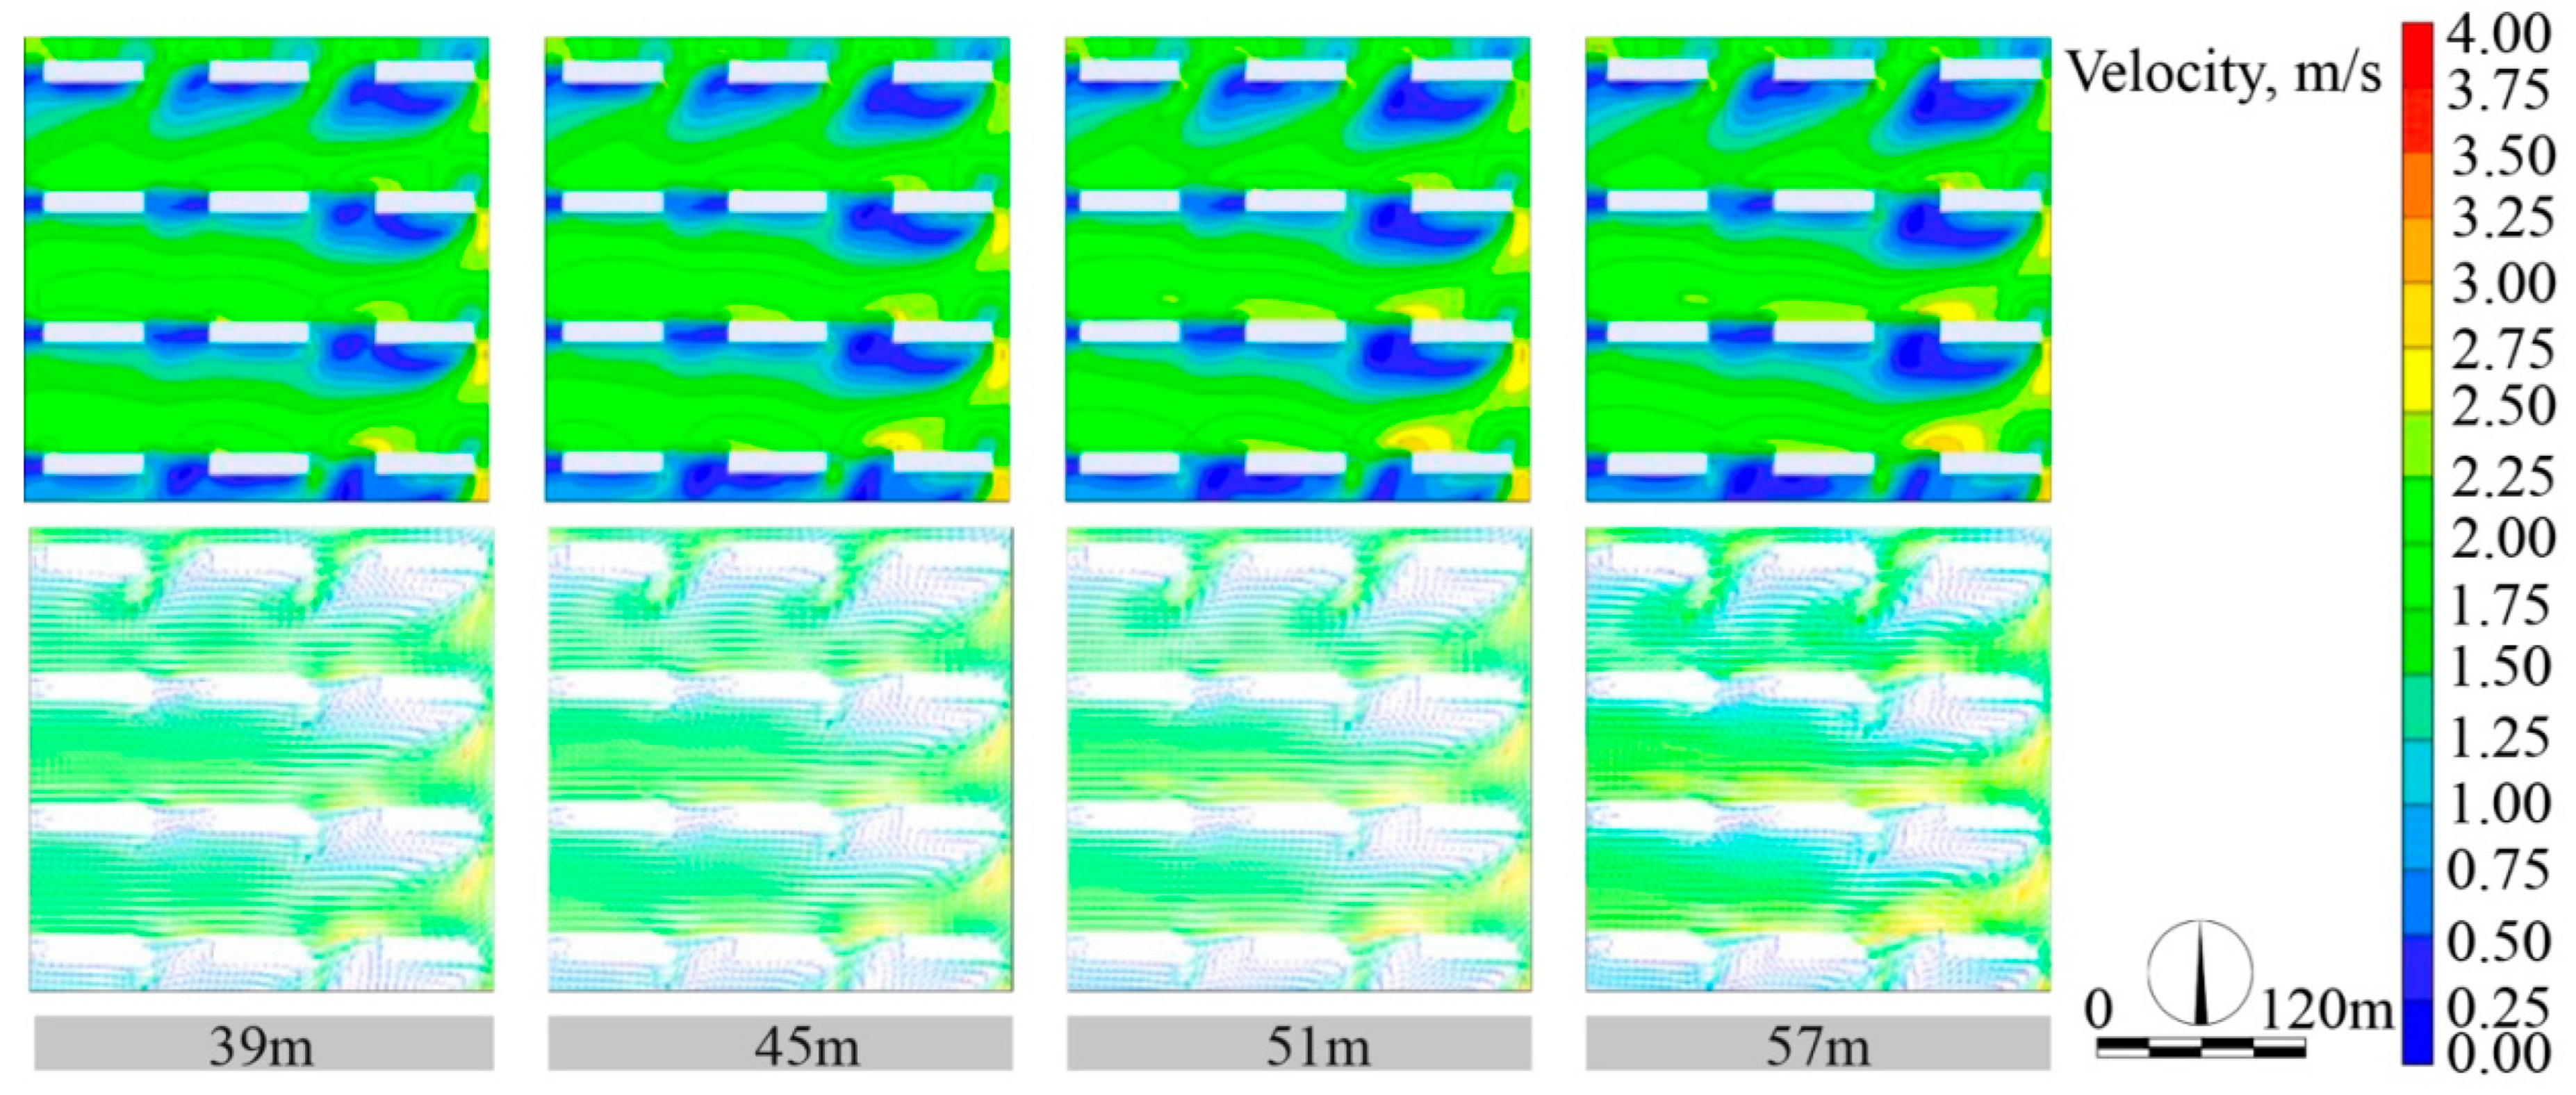
3.3. Influence of Average Building Height on the Wind Environment in the Block
The wind velocity cloud and wind velocity vector maps of high-rise residential neighborhoods with different average building heights are depicted in
Figure 6. The average wind velocity, the proportion of wind comfort areas within the neighborhood, and the wind velocity non-uniformity coefficient are displayed in
Table 4.
As can be seen from the wind velocity cloud and
Table 4, the average wind velocity within the neighborhood is relatively unaffected by the average building height, with the average wind velocity of all four models’ neighborhoods being around 1.55 m/s. The proportion of the wind comfort area within the neighborhood decreases with an increase in average building height, but the decrease is limited. As the average building height increases from 39 m to 57 m, the proportion of the wind comfort area decreases from 71% to 68%. The wind velocity non-uniformity increases from 0.56 to 0.63, an increase of 12.5%. Considering these three indicators, the average building height has a limited impact on the wind environment within the neighborhood, but the wind comfort area can still be increased by reducing the average building height, leading to a more uniform distribution of wind velocity within the neighborhood.
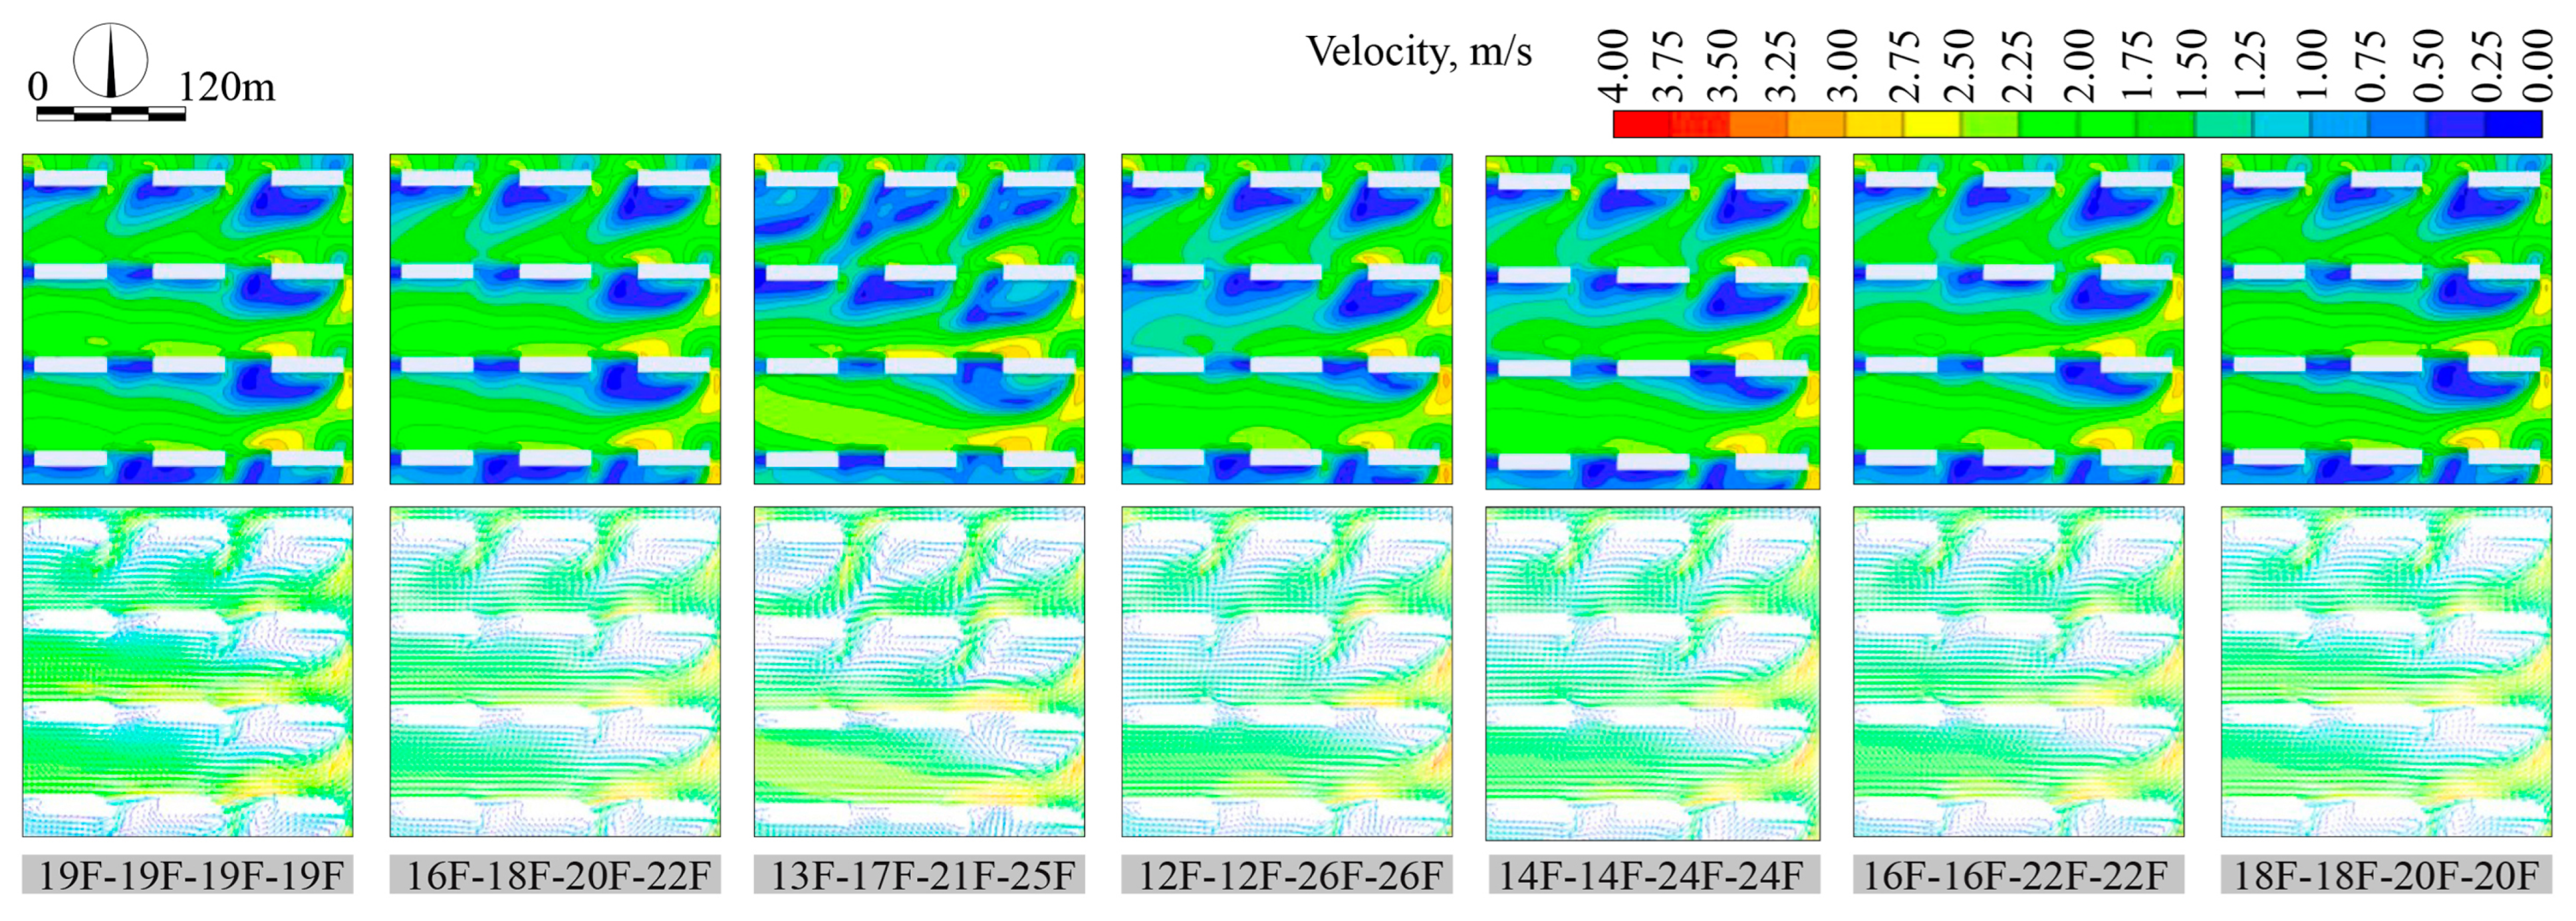
3.4. Influence of Building Height Dislocation on the Wind Environment in the Block
Figure 7 demonstrates the wind velocity cloud and wind velocity vector maps for high-rise residential neighborhoods of varying building heights.
Table 5 provides insights into the average wind velocity, the extent of the wind comfort areas within the neighborhood, and the wind velocity non-uniformity coefficient.
An analysis of the wind velocity cloud and
Table 5 reveals that the building height has a limited impact on the average wind velocity within the neighborhood, with the average wind velocity being approximately 1.55 m/s across all four neighborhoods. Although the proportion of the wind comfort area within the neighborhood decreases as the building height increases, the decrease is not substantial. As the building height increases from 0 to 0.368, the proportion of the wind comfort area decreases from 67.98% to 60.78%. The wind velocity non-uniformity shows only a marginal increase from 0 to 0.06 as the building height increases from 0 to 0.235.
Given these three indicators, it can be deduced that the building height has a modest effect on the wind environment within the neighborhood. Nevertheless, reducing the building height may still improve the wind comfort area and lead to a more evenly distributed wind velocity within the neighborhood.
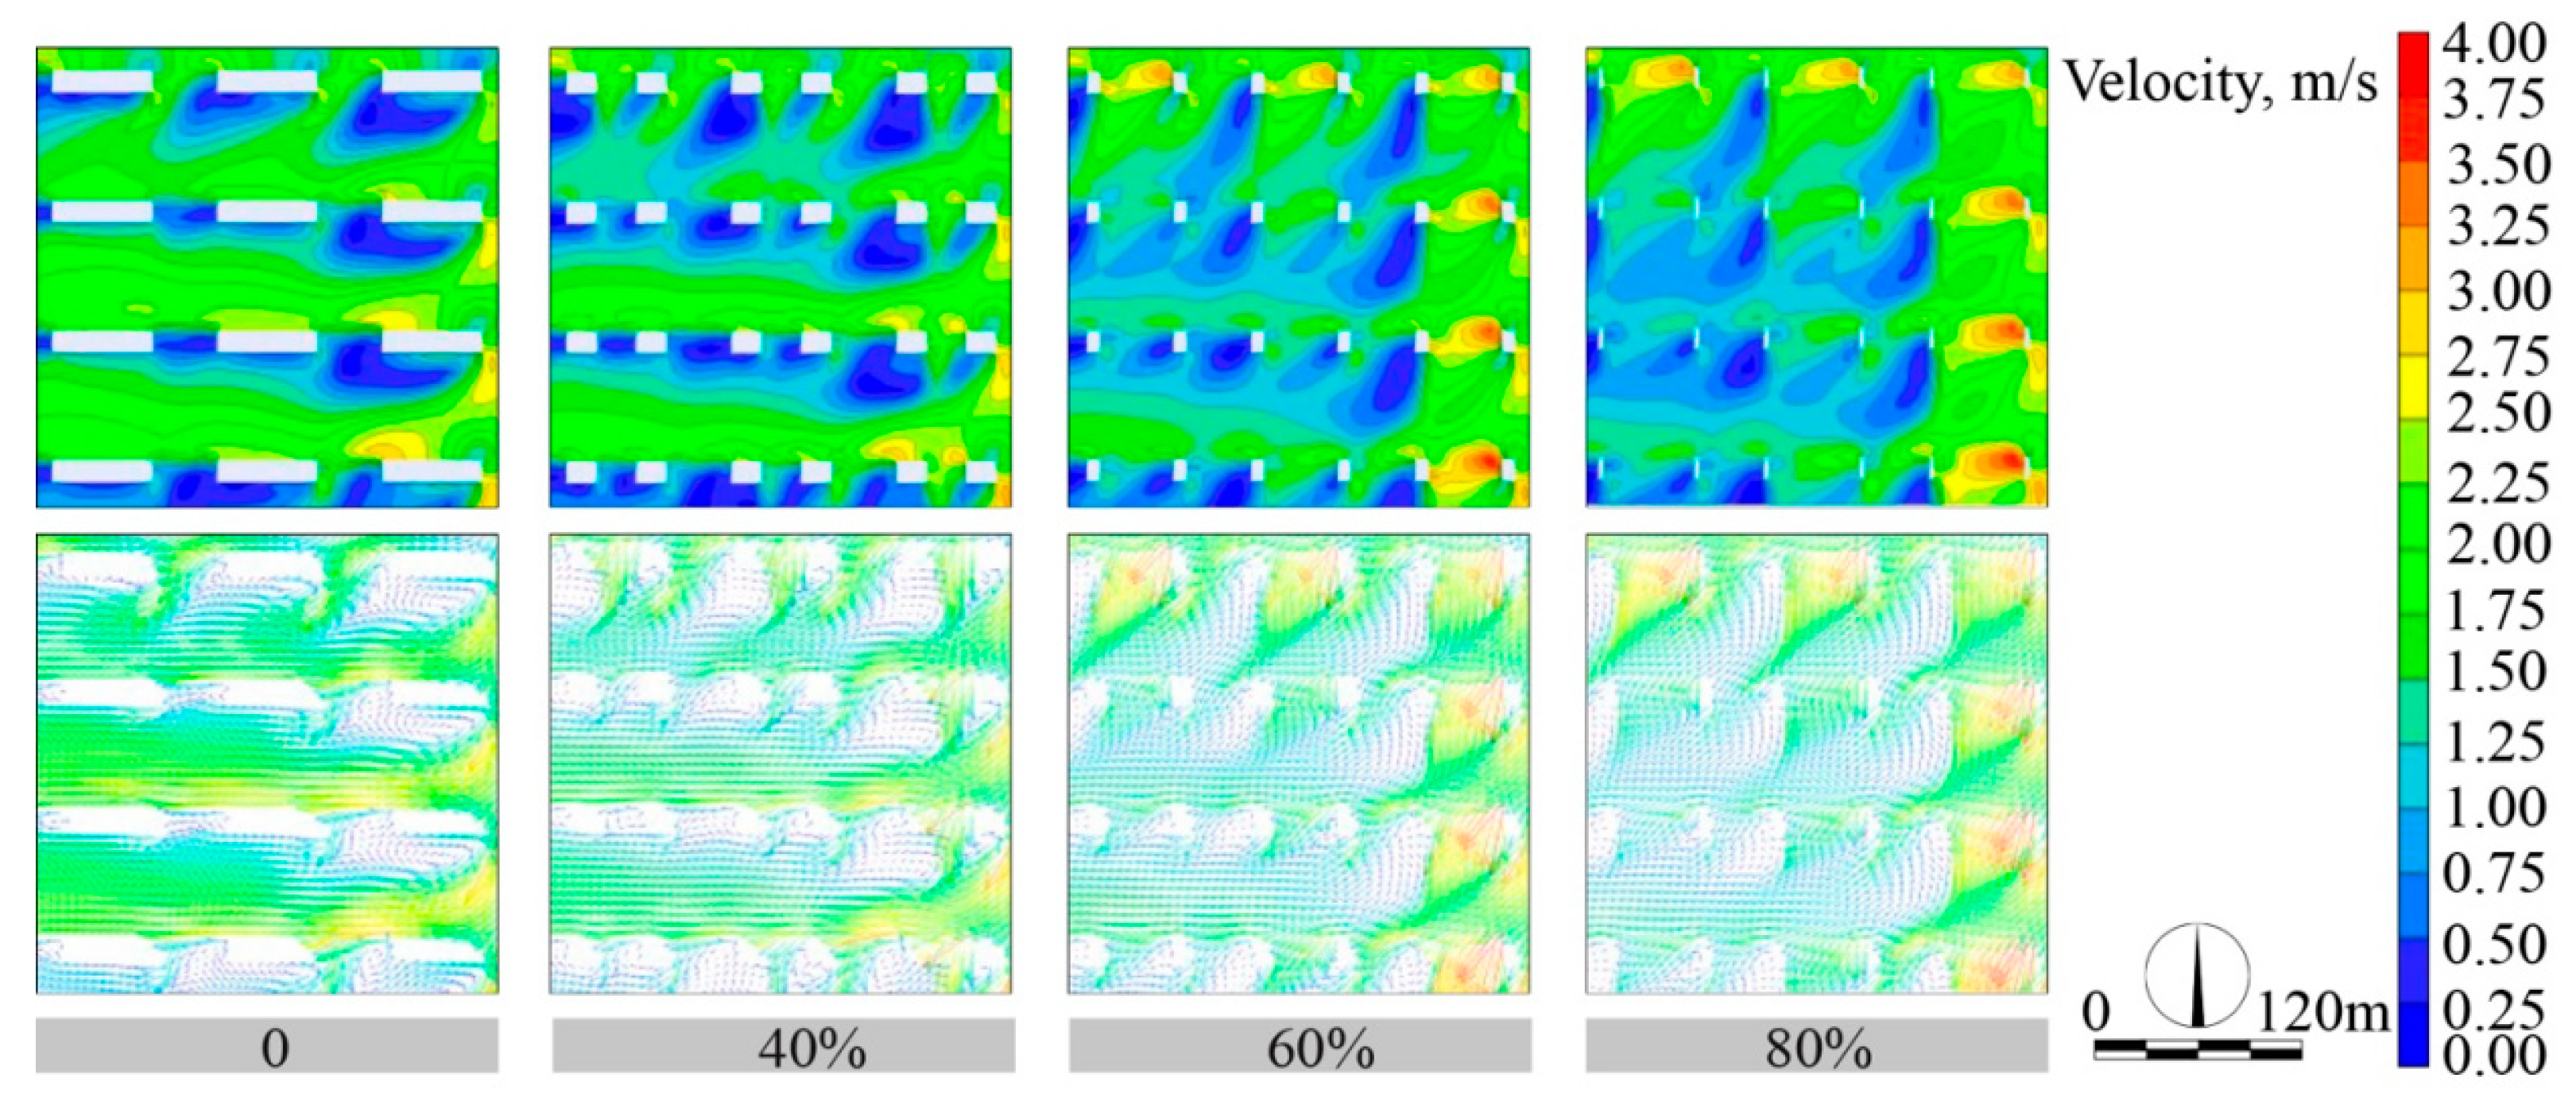
3.5. Influence of Overhead Rate of Building Bottom on the Wind Environment in the Block
The wind velocity cloud and wind velocity vector maps of high-rise residential neighborhoods with varying degrees of overhead first floor area are presented in
Figure 8. The data regarding the average wind velocity, the proportion of wind comfort areas within the neighborhood, and the wind velocity non-uniformity coefficient are displayed in
Table 6.
As indicated by the statistical data in
Table 6, when the overhead first floor area is at 0%, the average wind velocity within the neighborhood is recorded as 1.55 m/s. Upon increasing the overhead first floor area to 40%, the average wind velocity reaches its minimum value of 1.42 m/s. As the overhead first floor area increases from 40% to 80%, the average wind velocity increases by a mere 0.05 m/s, which constitutes a mere 3.5% increase. Despite this minimal increase, the overhead first floor area has a substantial impact on the proportion of wind comfort areas within the neighborhood, leading to a marked decrease as the overhead first floor area increases. In contrast, the wind velocity non-uniformity remains largely unchanged. As a result, it can be deduced that variations in the overhead first floor area do not effectively enhance the wind environment within the high-rise residential neighborhood.
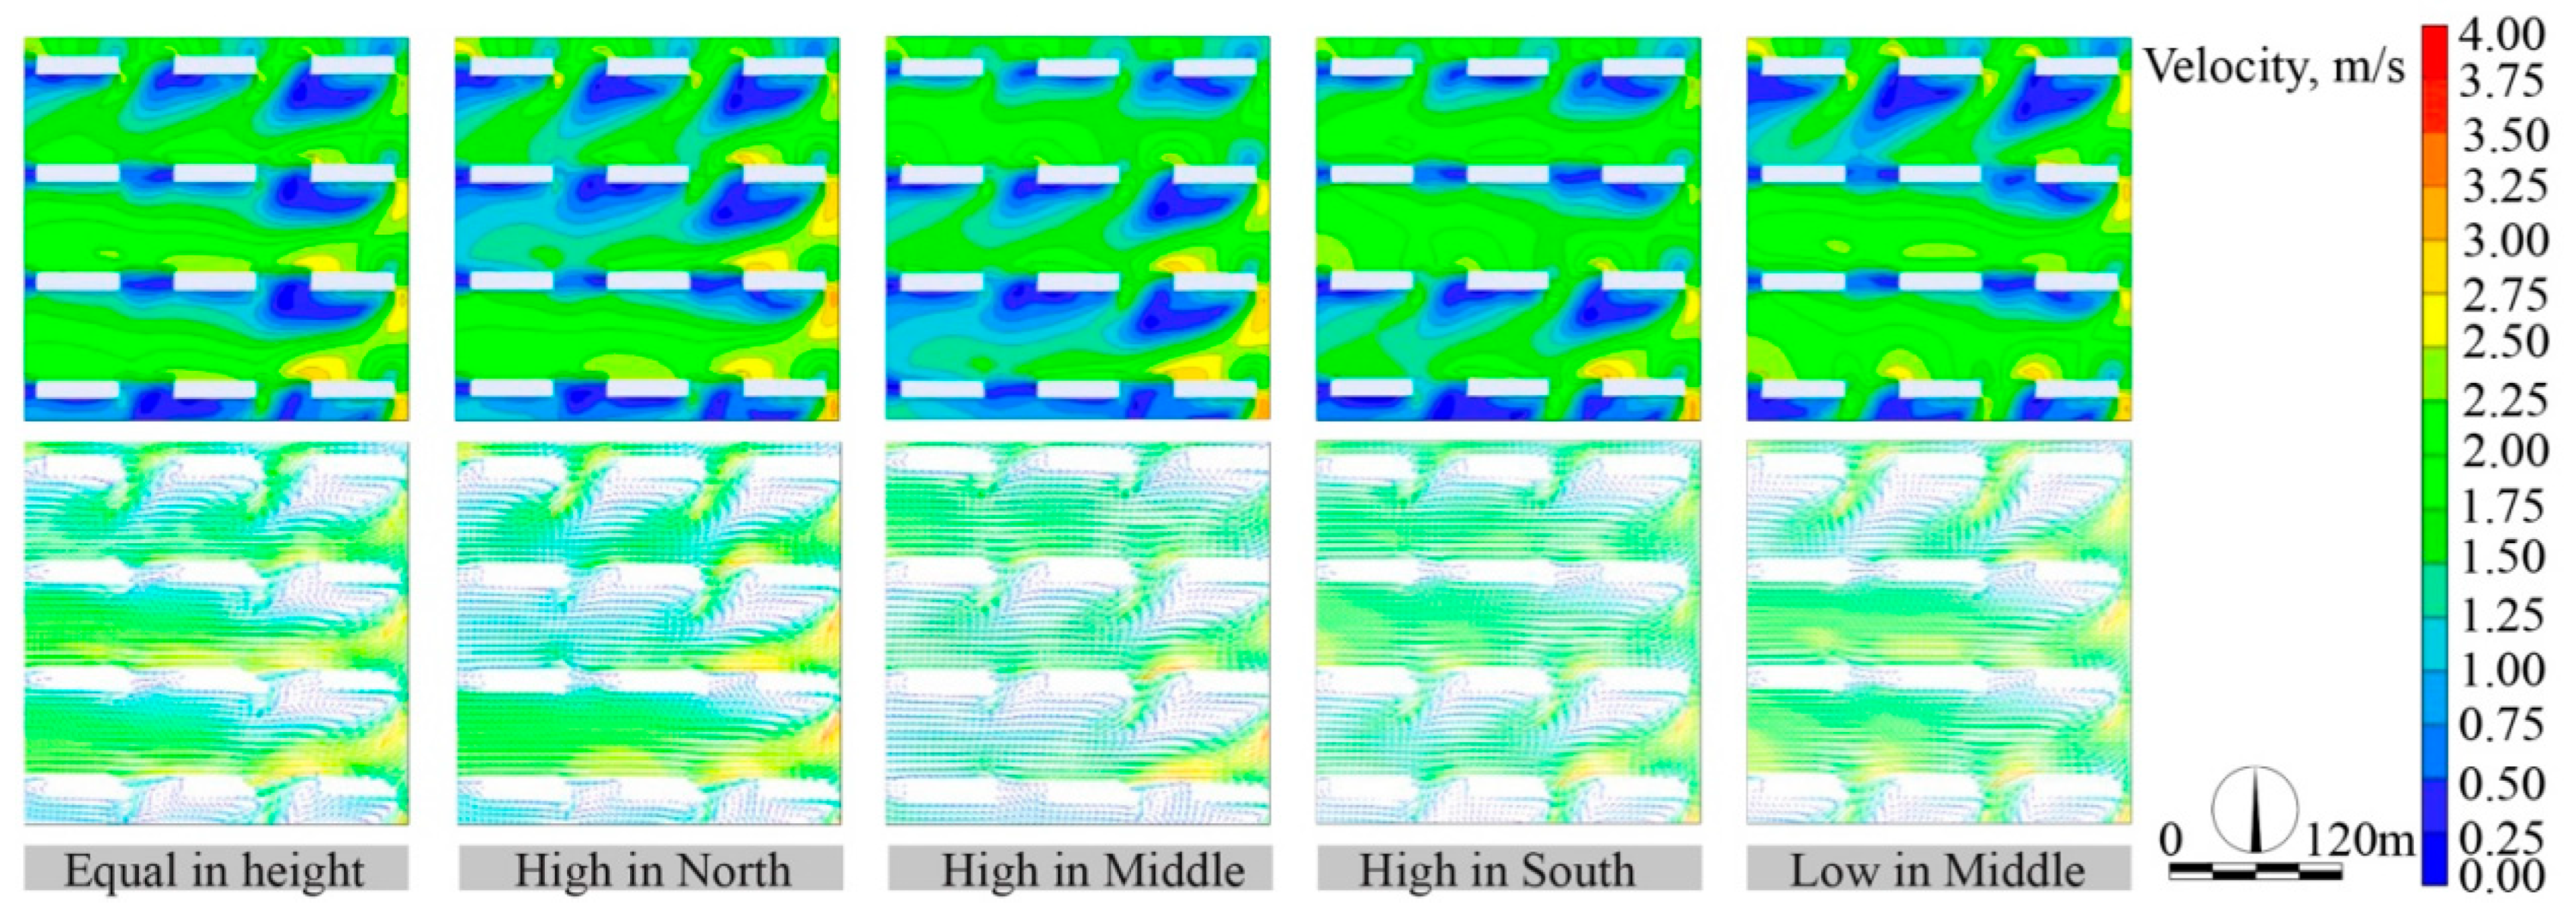
3.6. Influence of Distribution Pattern of Building Height on the Wind Environment in the Block
The wind velocity cloud and vector charts of high-rise residential neighborhoods with different building height layout forms are presented in
Figure 9. The statistics, including the average wind velocity, the ratio of the wind velocity comfort zone to the total area, and the wind velocity non-uniform coefficient, are displayed in
Table 7.
As shown in
Figure 9, neighborhoods with buildings of equal height or with a north-to-south height increase have a more uniform wind velocity distribution. Furthermore, high-rise buildings create large wind shadow areas on the southwest side, whereas the relative position of high and low-rise buildings has limited impact on the wind velocity distribution.
Table 7 highlights the effects of building height layout forms on the wind velocity characteristics of the neighborhood. The neighborhood with a low-in-the-middle, high-in-the-north-and-south building height layout form has the highest average wind velocity, 1.60 m/s, at the pedestrian height, and the lowest average wind velocity, 1.43 m/s, is observed in the neighborhood with a low-in-the-north-and-south, high-in-the-middle form. The largest wind velocity comfort zone, 71.08%, is found in the low-in-the-middle, high-in-the-north-and-south neighborhood, whereas the ratio of the wind velocity comfort zone in neighborhoods with a south-to-north or north-to-south height increase is relatively low, 60.17% and 60.79%, respectively. Additionally, the lowest wind velocity non-uniformity, 0.57, is observed in the low-in-the-middle, high-in-the-north-and-south neighborhood, whereas the highest wind velocity non-uniformity, 0.66, is found in the neighborhood with a south-to-north height increase. Based on these results, it can be concluded that the low-in-the-middle, high-in-the-north-and-south building height layout form is most favorable for enhancing the wind environment in high-rise residential neighborhoods.
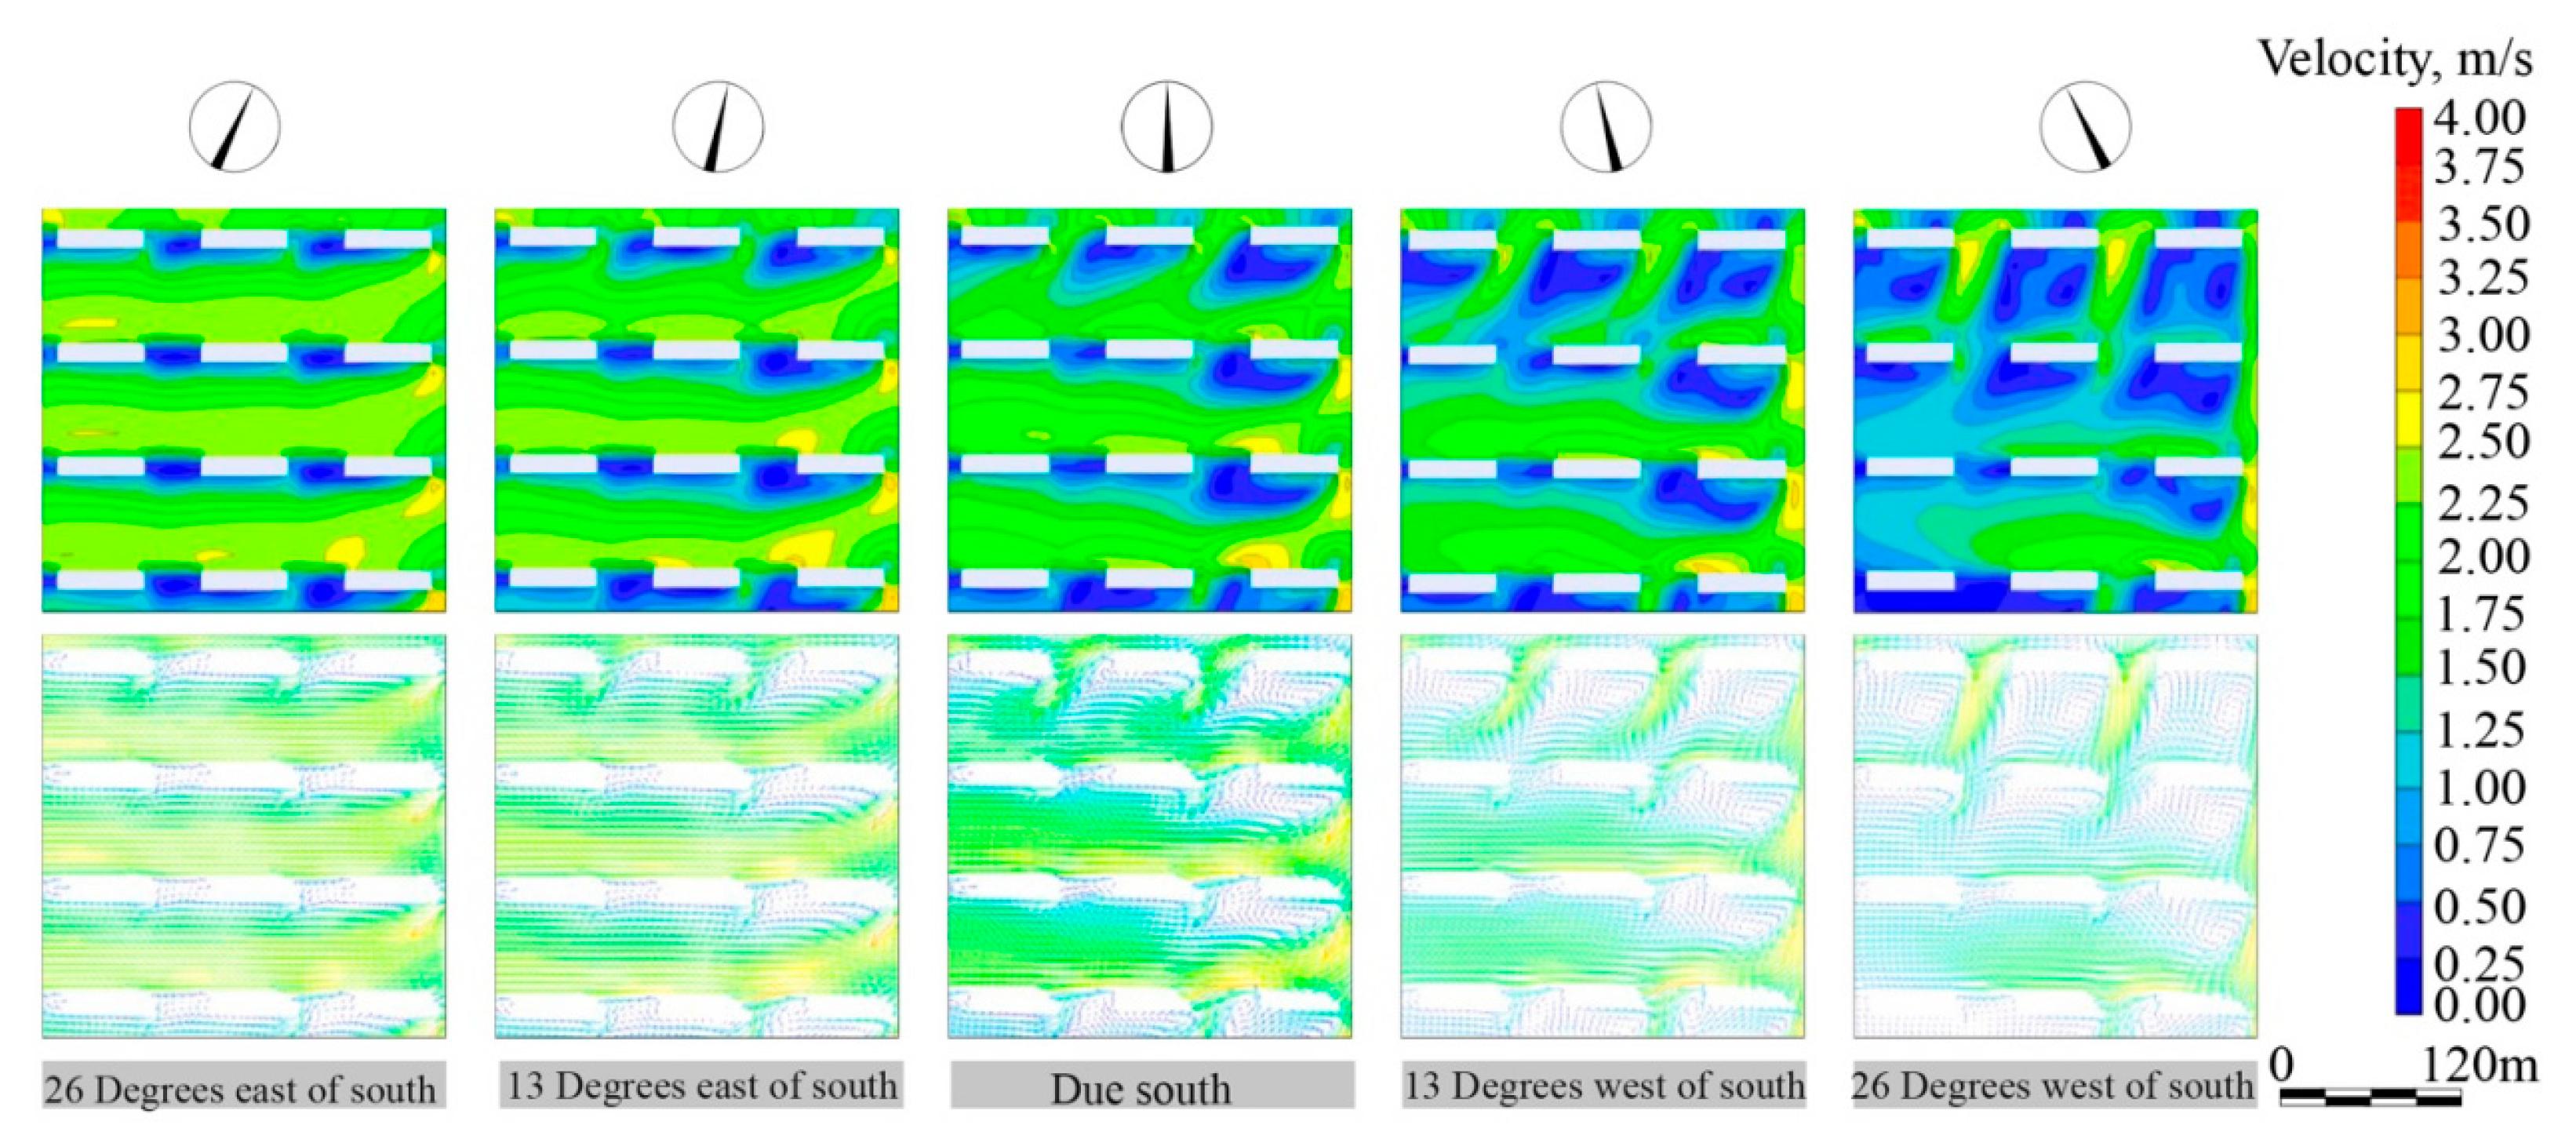
3.7. Influence of Building Orientation on the Wind Environment in the Block
The wind speed cloud maps and wind speed vector maps of high-rise residential neighborhoods with different orientations are shown in
Figure 10, while the average wind speed, the area ratio of the wind speed comfort zone, and the wind speed non-uniform coefficient within the neighborhood are shown in
Table 8.
From the wind speed cloud maps and wind speed vector maps, it is evident that the orientation of a building has a significant impact on the outdoor wind environment in the neighborhood. The wind environment within the neighborhood deteriorates gradually when the orientation of the building changes from 26° southeast to 26° southwest. This deterioration is characterized by a decrease in average wind speed, and an increase in the area of wind shadow zones and vortex zones. The average wind speed decreases from 1.88 m/s to 1.14 m/s, the area ratio of the wind speed comfort zone decreases from 80% to 36%, while the wind speed non-uniformity only shows a slight change.
Based on the above analysis, it can be concluded that reducing the angle between the main facade of the building and the prevailing wind direction improves the wind environment within the neighborhood. Adopting a 26° southeast layout, which is a common residential building orientation in Xi’an, can achieve the goal of improving the internal wind environment.
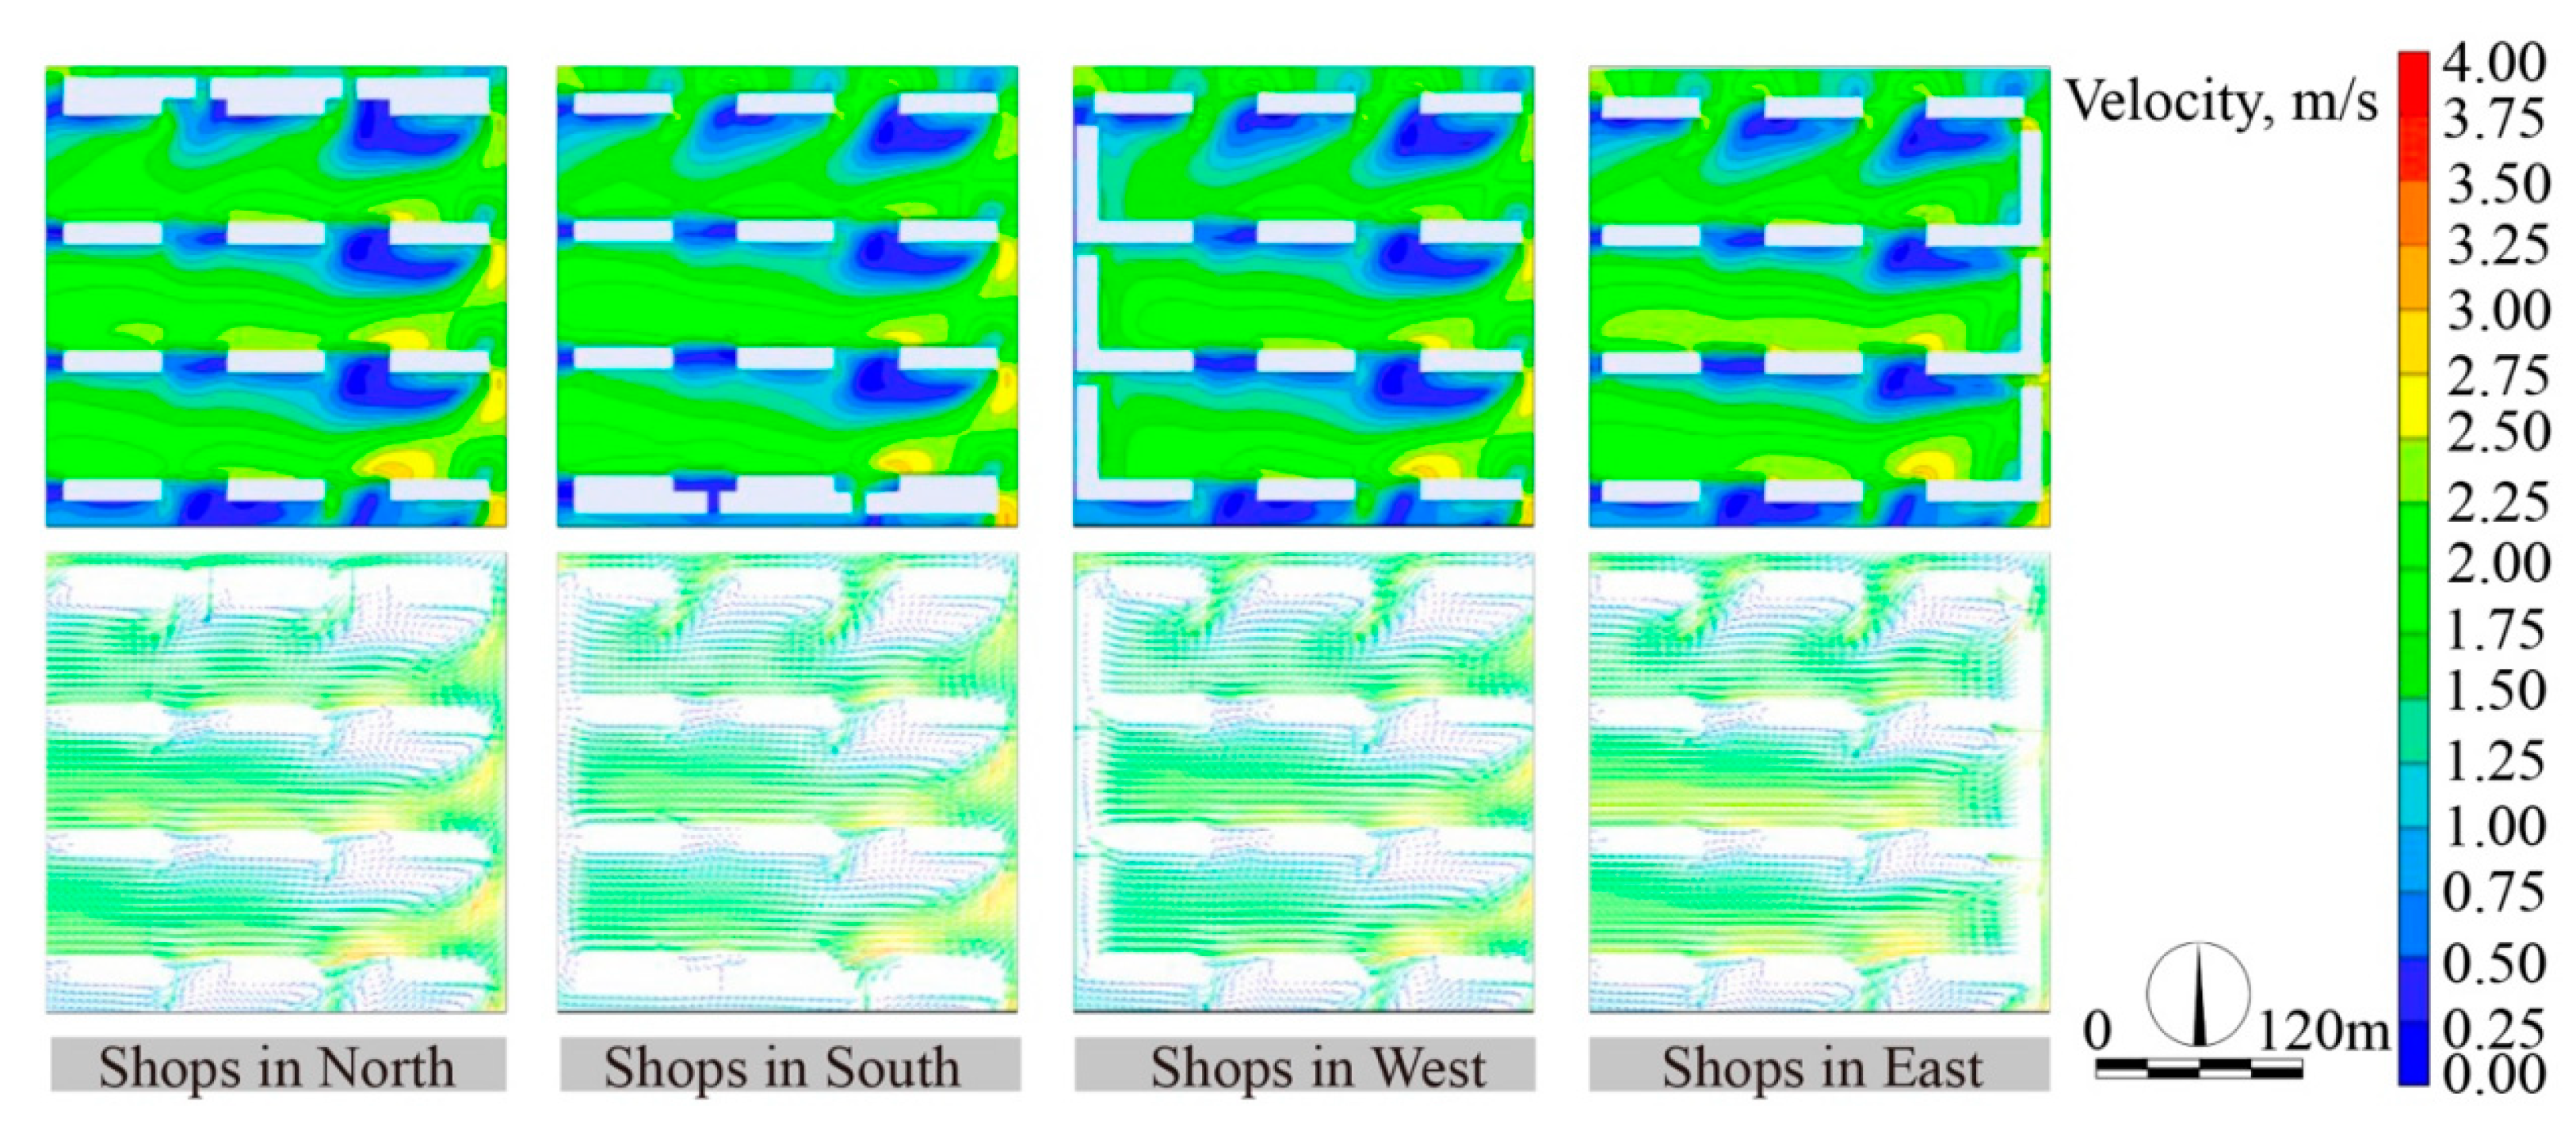
3.8. Influence of Location of Shops around the Block on the Wind Environment in the Block
The wind speed cloud maps and vector maps for street-side shops in neighborhoods with different orientations are presented in
Figure 11, with results for the average wind speed, the area ratio of the wind speed comfort zone, and wind speed non-uniformity shown in
Table 9.
The average wind speed was similar for street-side shops located on the northern, southern, and eastern sides of the neighborhood, with the highest average wind speed of approximately 1.57 m/s occurring when the street-side shops were located on the eastern side. The lowest average wind speed, at 1.48 m/s, was observed when the street-side shops were located on the western side. The area ratio of the wind speed comfort zone was 68%, 70%, and 69% for street-side shops located on the northern, southern, and eastern sides, respectively, and was smallest (65%) when the street-side shops were located on the western side. The wind speed non-uniformity was lowest, at 0.58, for street-side shops located on the southern side, indicating the most uniform wind speed distribution. Conversely, the highest wind speed non-uniformity, at 0.63, was observed when the street-side shops were located on the northern side.
In conclusion, when establishing commercial facilities along the street, it is recommended to prioritize placement on the southern and eastern sides of the neighborhood to enhance the indoor wind environment.
4. Conclusions
The study undertook a comprehensive investigation of 205 high-rise residential blocks in Xi’an and established a research model specific to high-rise residential blocks in this city. Through measuring and analyzing the outdoor wind environment of three typical high-rise residential blocks, the existing wind-related challenges were identified and summarized. Building upon a review of wind environment evaluation indicators from both domestic and international sources, a novel wind environment evaluation method was formulated, considering both the internal wind conditions within the block and the impact of the block on the wind environment of its surrounding areas. By utilizing the PHOENICS software simulation and validating the results against measured data, the study explored the relationship between the spatial form of urban high-rise residential blocks and the pedestrian-level wind environment. This exploration focused on both the internal wind conditions within the residential block and the block’s influence on wind speeds in downwind areas and surrounding blocks.
The main findings of this research can be summarized as follows: lowering the building density of high-rise residential blocks, while maintaining the plot ratio, improves the internal wind environment. Although this may result in slightly uneven wind speeds, the wind speeds in the enhanced angular flow areas remain within the comfortable range of 1.3–5 m/s. Consequently, the overall impact of building density on the ability to affect the static wind range is negligible. Therefore, reducing the building density is recommended to enhance the wind environment comfort within the block. Reducing the average height of high-rise residential blocks increases the area of wind speed comfort zones, resulting in a more uniform wind environment. Considering the impact on the internal wind conditions within the block and the downwind direction, reducing the average building height is advised to improve the overall wind environment comfort.
The overhead rate of the ground floor significantly affects the wind speed ratio in the comfortable area of the block, reducing the block’s influence on the downwind static wind. However, it also leads to a decrease in the area ratio of comfortable zones within the block. A comprehensive consideration of the impact of the ground floor overhead rate on the internal and downwind wind conditions suggests that increasing the overhead rate of the building ground floor can reduce its influence on the downwind direction’s static wind, but this needs to be balanced with the comfort of the wind environment within the block.
The study emphasizes the importance of building density in shaping the wind environment in residential neighborhoods. The findings have implications for the design and planning of high-rise residential neighborhoods in Xi’an, providing architects and planners with valuable insights for creating more comfortable and sustainable living environments for residents. The results of the study can also inform similar studies in other urban areas, by providing a deeper understanding of the relationship between different spatial form indices and the wind environment.
In future research, the coupling relationship between the wind environment and spatial form in different types of blocks warrants further exploration. The impact of the spatial form on outdoor comfort could be assessed by considering relevant indicators related to thermal and humid environments. Additionally, a more in-depth analysis of individual factors affecting the wind environment of blocks, such as the form of ground floor overhead ratios, could be pursued. Ultimately, by considering various factors, including the city’s history, culture, and overall planning, specific designs can be developed to create comfortable and livable high-rise residential blocks, providing valuable guidance for urban development and fostering healthier and more sustainable communities.


