Article

A Novel Response Factor-Based Method for In Situ Measurement of Wall Thermal Resistance

School of Environment and Energy Engineering, Beijing University of Civil Engineering and Architecture, Beijing 100044, China
*
Authors to whom correspondence should be addressed.
Buildings 2023, 13(8), 1986; https://doi.org/10.3390/buildings13081986
Submission received: 28 June 2023 / Revised: 30 July 2023 / Accepted: 31 July 2023 / Published: 3 August 2023

Abstract

:
The heat flow meter method (HFM) is one of the most-used methods for the in situ measurement of wall thermal resistance. However, the standard HFM method has some issues: it is challenging to balance simplicity and accuracy in data analysis and the measurement period needs to be shorter. In this paper, a new dynamic data analysis method for the in situ measurement of wall thermal resistance is introduced, which is based on a truncated form of the infinite response factors for a wall heat conduction process and has a theoretically deducted convergence criteria for the automatic termination of an in situ measurement. The efficacy of the proposed method is validated by a theoretical analysis and by experiments from one simulation dataset and one measurement dataset. Preliminary experimental results show that the proposed method can reduce the measurement time by about one-third on average while maintaining the same accuracy as the standard average method. Due to the advantages of a clear physical meaning, a simple principle, and a short measurement period, the proposed method contributes to the quick and accurate estimation of the wall thermal resistance in buildings.

1. Introduction

The heat loss by exterior walls plays a significant role in buildings’ heating and cooling energy consumption [1,2]. Wall thermal resistance is a primary indicator to measure the wall heat transfer performance, and mandatory regulations are made for it in the standards and codes for building energy-saving design, renovation, and green rating [3]. Due to construction issues and envelope aging, the thermal resistances of the exterior walls of existing buildings may differ from or get worse than their design values, meaning they do not meet the building energy efficiency regulations. To find the issues, the in situ measuring of the thermal resistance of exterior walls and checking whether it meets the regulations have been essential in building energy diagnostics.
The heat flow meter (HFM) method is a commonly used in situ measurement method for wall thermal resistance due to its advantages of simple installation, easy portability, and convenient use [4]. Its principle is to continuously measure the surface temperature and heat flux of the internal and external sides of the wall through temperature and heat flux sensors, then calculate the wall thermal resistance according to a specific mathematical model [5,6], as shown in Figure 1.
The international and Chinese standards [5,6] introduced the HFM method to detect the wall thermal resistance in detail. According to the principle of in situ data analysis, it can be divided into average and dynamic analysis methods. The average method, as a standard HFM method recommended by most standards and codes, is based on a one-dimensional steady-state heat conduction model. It uses the quotient of the historical average temperature difference and the historical average heat flux as the estimated value of wall thermal resistance. The dynamic analysis method is based on a one-dimensional wall heat conduction differential equation, in which the wall thermal resistance is expressed as one of the undetermined coefficients and can be determined by the time series of surface temperature and heat flux through linear regression. Moreover, most of the undermined coefficients in the dynamic analysis method have no apparent physical meaning. By contrast, the average method is easier to implement and has a more straightforward mathematical principle but poorer accuracy, while the dynamic analysis method has a more complex principle but higher accuracy and allows for greater temperature fluctuations. However, both methods require that the internal and external surfaces maintain a significant temperature difference (generally above 10 °C) and a long measurement time (at least four days in Chinese standard [5] and three days in ISO 9869-1 [6]) to obtain an accurate measurement result. When these requirements are not met, there is a significant error in wall thermal resistance estimations.
For decades, many researchers have tried to address the issues of too long a measurement time or poor accuracy in the HFM method. One way is to add auxiliary heating devices based on the HFM method, heating the wall to increase the temperature difference and heat flux on the internal and external sides in order to shorten measurement time and improve accuracy [7,8,9,10,11,12,13]. Such approaches, however, need additional heating devices with larger volumes and electric power, weakening the advantages of the simplicity and convenience of the HFM method for an in situ measurement. Another way is to keep the HFM’s simplicity and to propose new data analysis methods for calculating wall thermal resistance. The mathematical formulas of the standard HFM method (i.e., average method) and a few modified data analysis methods in the literature are summarized in Table 1. Due to limited space, please refer to the corresponding literature source for specific formulas’ meanings and symbols. The test conditions and performance (including convergence time and estimation error) of the modified methods in previous studies are summarized in Table 2. It can be seen that the performance of the modified methods varies under different conditions.
Some modified methods in Table 1 are like the average method and are based on a steady-state heat conduction model. Shi et al. [14] and Rasooli et al. [15,16] replaced the terms of average temperature difference and average heat flux with new terms of temperature and heat flux on both wall surfaces. Park et al. [17] replaced the wall surface temperature and heat flux with indoor and outdoor air temperature to calculate wall thermal resistance. It can be seen from Table 2 that, compared with the average method, these methods have not significantly decreased the measurement errors and measurement periods.
Other studies are similar to the dynamic analysis method and based on a dynamic heat conduction model. Shen et al. [18] proposed a structured least squares method based on the dynamic analysis method [5], considering the temperature and heat flux measurement errors, resulting in higher stability and accuracy [12]. Laurenti et al. [19] used a linear correlation with constant parameters to describe the transient thermal response of a wall and to estimate wall thermal resistance, yet it usually took a longer time than the conventional methods. Flores Larsen et al. [20] compared four in situ methods for determining wall thermal resistance and reported that the Pentaur dynamic method produced the most accurate results in all cases. Iglesias et al. [21], Beñat et al. [22], and Bienvenido-Huertas et al. [23] used machine learning methods for wall thermal resistance estimation, but the models are black box, and the required measurement periods are similar to conventional methods. Petojević et al. [24] validated the feasibility of estimating the dynamic thermal characteristics of a wall by determining the wall response factors; however, there was no in-depth discussion on how to apply this method to estimate wall thermal resistance in practice. In general, compared with the average method, most of the dynamic methods are quite complicated. However, although they can improve the wall thermal resistance estimation accuracy, they still fail to significantly shorten the measurement time.
Table 1. Calculation formulas for standard and modified heat flow meter methods.
Measurement MethodsThe Calculation Formula for Wall Thermal Resistance
Average method [5]
(Standard HFM method)
R = j = 1 n ( t i n ,   j t o u t ,   j ) j = 1 n q j
Dynamic analysis
method [5,19]
q i = 1 R ( θ Ii - θ Ei ) + K 1 θ Ii ˙ - K 2 θ Ei ˙ + n p n j = i - p i = 1 θ Ij ˙ ( 1 - β n ) β n ( i - j ) + n Q n j = i - p i = 1 θ Ej ˙ ( 1 - β n ) β n ( i - j )
Shi et al. [14] R = i = 1 n ( | T s i , max T s e , max | + | T s i , min T s e , min | 2 ) / n i = 1 n ( | q s i | + | q s e | 2 ) / n
Rasooli et al. [15] R c ave = ( R c in + R c out ) 2 = ( t = 0 m Δ T t / t = 0 m ( q t ) 1 + t = 0 m Δ T t / t = 0 m ( q t ) 2 ) / 2
Park et al. [17] U HMF , ave =   q   ( T in T out ) ,   U TBM , ave = α i n   ( T s , in T s , out )   ( T i n T o u t ) ,
  U TBM _ abs , ave = α in   | T s , in T s , out |   | T in T out |
Shen et al. [18] [ Q , Δ T 1 , Δ T 2 , d T ] [ R X Y 1 ] + [ E t , E q ] [ R X Y 1 ] = 0
Laurenti et al. [19] q n + 1 = 1 R ( T o s , n + 1 T i s , n + 1 ) + j = 0 2 - p β 1 , j ( q n + j q n + 1 ) + j = 0 2 - p β 2 , j ( T i s , n + j T i s , n + 1 ) + j = 0 2 - p β 3 , j ( T o s ,   n + j T o s ,   n + 1 )
Pentaur method from Flores Larsen et al. [20] q p = T int , p T out , p R + n = 1 k d T int , n A n + n = 1 k d T out , n B n + n = 1 k d Q n C n + d E r r
Table 2. Test conditions and performance of modified HFM methods in the literature.
Ref. No.MethodEstimation
Errors (%)
Convergence
Time (Days)
Test Condition
PeriodLocationWall TypeData Source
[14]Average method with storage corrections (RHS-HFM)3.8621/27–1/29 (2 days)Hot
summer and cold winter areas in China
Clay hollow brick with cement mortar and insulation.In situ measurement
Double-side heat flow meter method (D-HFM)10.49>2
Average method (use inside heat flux)3.132
Average method (use outside heat flux)16.58>2
[15]Double-side heat flux methods1.452018/04
 (16 days)
NetherlandsUnknown but insulation inside the construction.In situ measurement
Average method (use inside heat flux)<5>16
Average method (use outside heat flux)<5>16
[17]Temperature based method (TBM)0.21–1.79NA2021/02–2021/04KoreaConcrete wall;
insulated curtain wall structure with panel finishing.
In situ measurement
Average method0.20–1.82NA
[19]Proposed dynamic method0.1–41–12.5An entire year (24 datasets with 15 days for each set)NALight, well-insulated wall;
massive wall with insulation layers on both sides;
moderately massive homogeneous wall.
Simulation
[20]Average method15.020Four seasons with 30 days for each seasonSalta, ArgentinaCompound wall (solid brick and hollow brick wall with insulation).Simulation
Average method with storage corrections5.06–18
Fourier method>17.08–24
Pentaur method<5.02
This study proposed a novel method for the in situ measurement of wall thermal resistance in existing buildings, aiming to be simple in principle and accurate and fast in practice. It utilizes the same measurement devices as the standard heat flow meter (HFM) method, with no additional heating device. It develops a new response factor-based method for the dynamic analysis of in situ data. In this paper, we establish the entire data analysis method, including the derivation of the response factor truncation model for the calculation of wall thermal resistance, the convergence criteria and the implementation process for applying the truncation model into an in situ measurement, and the validation of the method through theoretical and experimental data. The rest of the article is organized as follows. Section 2 introduces the principle of the proposed measurement method and describes a detailed implementation process. Section 3 theoretically validates the model’s effectiveness from the perspectives of the truncation error of response factors and the residual error of least squares. In Section 4, we present and discuss the result of the proposed method and the standard average method on one simulation dataset and one measurement dataset, which validate the efficacy of the proposed method in estimating wall thermal resistance. We conclude and outlook in Section 5.

2. Methods

This section introduces the principle of the proposed measurement method. It begins with the response factors-based formula for calculating wall thermal resistance. It then analyzes the theoretical error of thermal resistance estimation by the formula and determines the convergence criteria for automatic termination of in situ measurement. Finally, we describe a detailed implementation process of data analysis for the proposed method.

2.1. Fundamentals of Wall Heat Conduction Process

The heat conduction of multi-layer building walls, especially in their main body, is usually regarded as a one-dimensional plate thermal conduction process, which the following partial differential equations can govern [25]:
{ ρ ( x ) c ( x ) t ( x ,   τ ) τ = x ( λ ( x ) · t ( x ,   τ ) x ) ,   q ( x ,   τ ) = λ ( x ) · t ( x ,   τ ) x ,   ( 0 < x < l ,   τ > 0 )
where t is temperature in °C; q is heat flux in W / m 2 ; c, ρ , λ are specific heat capacity, density, and thermal conductivity of wall materials, respectively in kJ/kg·°C, kg/m3, W/m·K; l is wall thickness in m; x is spatial variable; and τ is time variable.
With the assumption of constant wall thermal properties, Equation (1) can be solved by a Laplace transform to obtain the relationship between the surface temperatures and surface heat fluxes. The Laplace transform for the multi-layered slab yields an algebraic relation shown as Equation (2) [25,26,27]:
[ t o ( s ) q o ( s ) ] = n = 1 N H n ( s ) = [ A ( s ) B ( s ) C ( s ) D ( s ) ] [ t i ( s ) q i ( s ) ]
where t(s) and q(s) are the Laplace transforms of surface temperature and surface heat flux, respectively. Subscripts i and o indicate the inside and outside surfaces of the wall, respectively. The matrix n = 1 N H n ( s ) is the total transmission matrix, which is the product of the transmission matrices of all layers.
Because A D B C = 1 , Equation (2) can be rearranged in the form of Equation (3), with the surface heat fluxes as response (i.e., outputs) and the surface temperatures as excitation (i.e., inputs) [25,26,27]:
[ q i ( s ) q o ( s ) ] = 1 B ( s ) [ A ( s ) 1 1 D ( s ) ] [ t i ( s ) t o ( s ) ]
As a numerical solution in the real-time domain, the output functions of q are finally calculated for the input functions of t, using the convolution theorem of z-transforms [25,26,27].
q i n ( τ ) = j = 0 A j t o u t ( τ j Δ τ ) j = 0 B j t i n ( τ j Δ τ )
where q i n is the internal surface heat flux of the wall ( W / m 2 ); t i n and t o u t are the internal and external surface temperatures of the wall (°C); A j and B j are the response factors of the wall, which are constants; τ is the measuring time, and Δ τ is the sampling interval of measurement.
The theoretical value of wall thermal resistance, R 0 , can be expressed as the sum of response factors A j , B j [25,28]:
j = 0 A j = j = 0 B j = 1 R 0
It has been proven that the response factors A j , B j decay rapidly with time [29].

2.2. A Truncation Model for Wall Thermal Resistance Calculation

In this paper, we use a synchronous truncation form (i.e., finite length) as shown in Equation (6) to approximate the infinite series form in Equation (4):
q i n ( τ ) = j = 0 n A j t o u t ( τ j Δ τ ) j = 0 n B j t i n ( τ j Δ τ )
where n represents the truncation length, which is an integer.
The measured value of wall thermal resistance, R , is calculated as:
j = 0 n A j = j = 0 n B j = 1 R
Since the surface temperature and heat flux of the indoor side of the wall are usually less affected by the environment, the response factors for the indoor side,   B j , are selected as the final calculation result of wall thermal resistance:
R = 1 j = 0 n B j
Denote the cumulative time steps of in situ measurement as T and denote the number of equations as L ; the truncation equation Equation (6) can be applied from the ( T L + 1 ) -th time step to the T -th time step:
q i n ( T ) = A 0 t o u t ( T ) + A 1 t o u t ( T 1 ) + + A n t o u t ( T n ) B 0 t i n ( T ) B 1 t i n ( T 1 ) B n t i n ( T n )  
q i n ( T 1 ) = A 0 t o u t ( T 1 ) + A 1 t o u t ( T 2 ) + + A n t o u t ( T 1 n ) B 0 t i n ( T 1 ) B 1 t i n ( T 2 ) B n t i n ( T 1 n )
q i n ( T L + 2 ) = A 0 t o u t ( T L + 2 ) + A 1 t o u t ( T L + 1 ) + + A n t o u t ( T L + 2 n ) B 0 t i n ( T L + 2 ) B 1 t i n ( T L + 1 ) B n t i n ( T L + 2 n )
q i n ( T L + 1 ) = A 0 t o u t ( T L + 1 ) + A 1 t o u t ( T L ) + + A n t o u t ( T L + 1 n ) B 0 t i n ( T L + 1 ) B 1 t i n ( T L ) B n t i n ( T L + 1 n )
Representing the above equations in matrix form:
Q = K X
where
X ( 2 n + 2 ) × 1 = [ A 0 A n B 0 B n ] ,   Q L × 1 = [ q i n ( T ) q i n ( T 1 ) q i n ( T L + 1 ) ] ,
K L × ( 2 n + 2 ) = [ t o u t ( T ) t o u t ( T n ) t o u t ( T n ) t o u t ( T 1 n )   t i n ( T ) t i n ( T n ) t i n ( T 1 ) t i n ( T 1 n )   t o u t ( T L + 1 ) t o u t ( T L n + 1 ) t i n ( T L + 1 ) t i n ( T L n + 1 ) ] .
X can be determined by the least squares method [30]:
X = ( K T K ) 1 K T Q
According to Equation (6) and the least squares method, at least 2 n + 2 equations are required to determine the response factors A j and B j , and n sets of historical temperature values are also needed to form the equation at the ( T L + 1 ) -th time step, so at least 3 n + 2 sets of data are required. The larger the n value, the more measurement data and the longer the measurement period are needed. The quantity of L , n , and T to meet the requirements of the least squares method satisfies the following equations:
2 n + 2 L T n
T 3 n + 2
Therefore, given a value of n , construct a set of equations according to Equation (6) using the continuous measurement data of internal and external surface temperatures and internal surface heat flux, determine the corresponding 2 ( n + 1 ) response factors A j and B j using the least square method, then the value of wall thermal resistance can be estimated through Equation (9).

2.3. Convergence Criteria of In Situ Measurement

From the above equations, the key to accurately and quickly detecting the wall thermal resistance is selecting appropriate n and L values. The optimal values of n and L are related to the specific type and structure of the wall and the environmental conditions of measurement, and thus cannot be determined in advance. In this paper, we propose a dynamic process to find the optimal n and L along with accumulated in situ data. Once found, the in situ measurement can be terminated, and the best estimation of wall thermal resistance R can be obtained; we call the whole process “converged”.
Let us analyze how the theoretical error of the method relates to the values of n and L before introducing the convergence criteria.
Theoretically, the larger the value of n , the smaller the model truncation error and the more accurate the wall thermal resistance estimation, but the longer the required measurement time. The smaller the value of n , the greater the model truncation error and the more inaccurate the thermal resistance calculation results, but the shorter measurement time required. Therefore, a suitable value of n should be large enough to ensure the accuracy of thermal resistance results but not too large to cause an excessive measurement time [25,30].
With the increase in the measurement period, the time series data of surface temperature and heat flux will increase, and the maximum number of equations in Equation (6) will also rise. According to the principle of the least square method [30] and assuming that the temperature and heat flux sensors have only white noise and no drift, when L increases, the response factors A j and B j determined by the least squares of L equations will be more accurate, and the estimation error of wall thermal resistance will be smaller.
Let us define the measurement error, r , as the difference between the calculated value of wall thermal resistance R and the true value R 0 and express it as a function of the truncation length n and the number of equations L :
r = R ( n ,   L ) R 0 = f ( n ,   L )
where R ( n ,   L ) is the calculated value of wall thermal resistance using Equation (8) with a truncation length n and the number of equations L , ( m 2 · K ) / W .
According to the above analysis, the error function r = f ( n ,   L ) should have the following properties:
  • Monotonicity: r decreases with the increase of n and L , i.e., r n < 0 ,   r L < 0 ;
  • Tropism: the calculated value R approaches the true value R 0 when n and L tend to infinity, i.e., r 0 when n and L .
Combined with monotonicity, the corresponding partial derivatives, r n ,     r L , also approach zero when n and L tend to infinity. Using this property, although the value of r cannot be calculated directly, we can use the partial derivative of r to determine whether it is close enough to zero. In fact, r n and r L can be represented by the dynamically calculated value R ( n ,   L ) of wall thermal resistance:
r n = [ R ( n ,   L ) R 0 ] [ R ( n 1 ,   L ) R 0 ] n ( n 1 ) = R ( n ,   L ) R ( n 1 ,   L )
r L = [ R ( n ,   L ) R 0 ] [ R ( n ,   L 1 ) R 0 ] L ( L 1 ) = R ( n ,   L ) R ( n ,   L 1 )
In this paper, we use the following Equations (16)–(18) and a threshold value of 2 × 10⁻³ to determine that the partial derivatives are close to zero. It should be pointed out that the threshold value of 2 × 10⁻³ is an empirical value obtained after many trials, and it is a trade-off between the convergence time and the accuracy of wall thermal resistance estimations. When the three equations are met, the measurement error of wall thermal resistance r is small enough, and consequently, a set of optimal values n , L , and R are found.
| r n | R ( n ,   L ) = | R ( n ,   L ) R ( n 1 ,   L ) | R ( n ,   L ) 2 × 10 3
| r L | R ( n ,   L ) = | R ( n ,   L ) R ( n ,   L 1 ) | R ( n ,   L ) 2 × 10 3
| R ( n ,   L ) R ( n 1 ,   L 1 ) | R ( n ,   L ) 2 × 10 3
Finally, we make a unified strategy for dynamically determining the optimal n , L , and R values and whether the whole process is converged: after starting the in situ measurement of surface temperatures and heat flux, along with the accumulation of temperature and heat flux data, gradually increase the n and L values from a small number (initial guess) and calculate the corresponding wall thermal resistance R ( n ,   L ) and its derivatives until the convergence criteria in Equations (16)–(18) are met; at that time, the thermal resistance result can be regarded as accurate enough, and the whole measurement and calculation process can be terminated.

2.4. Implementation Process

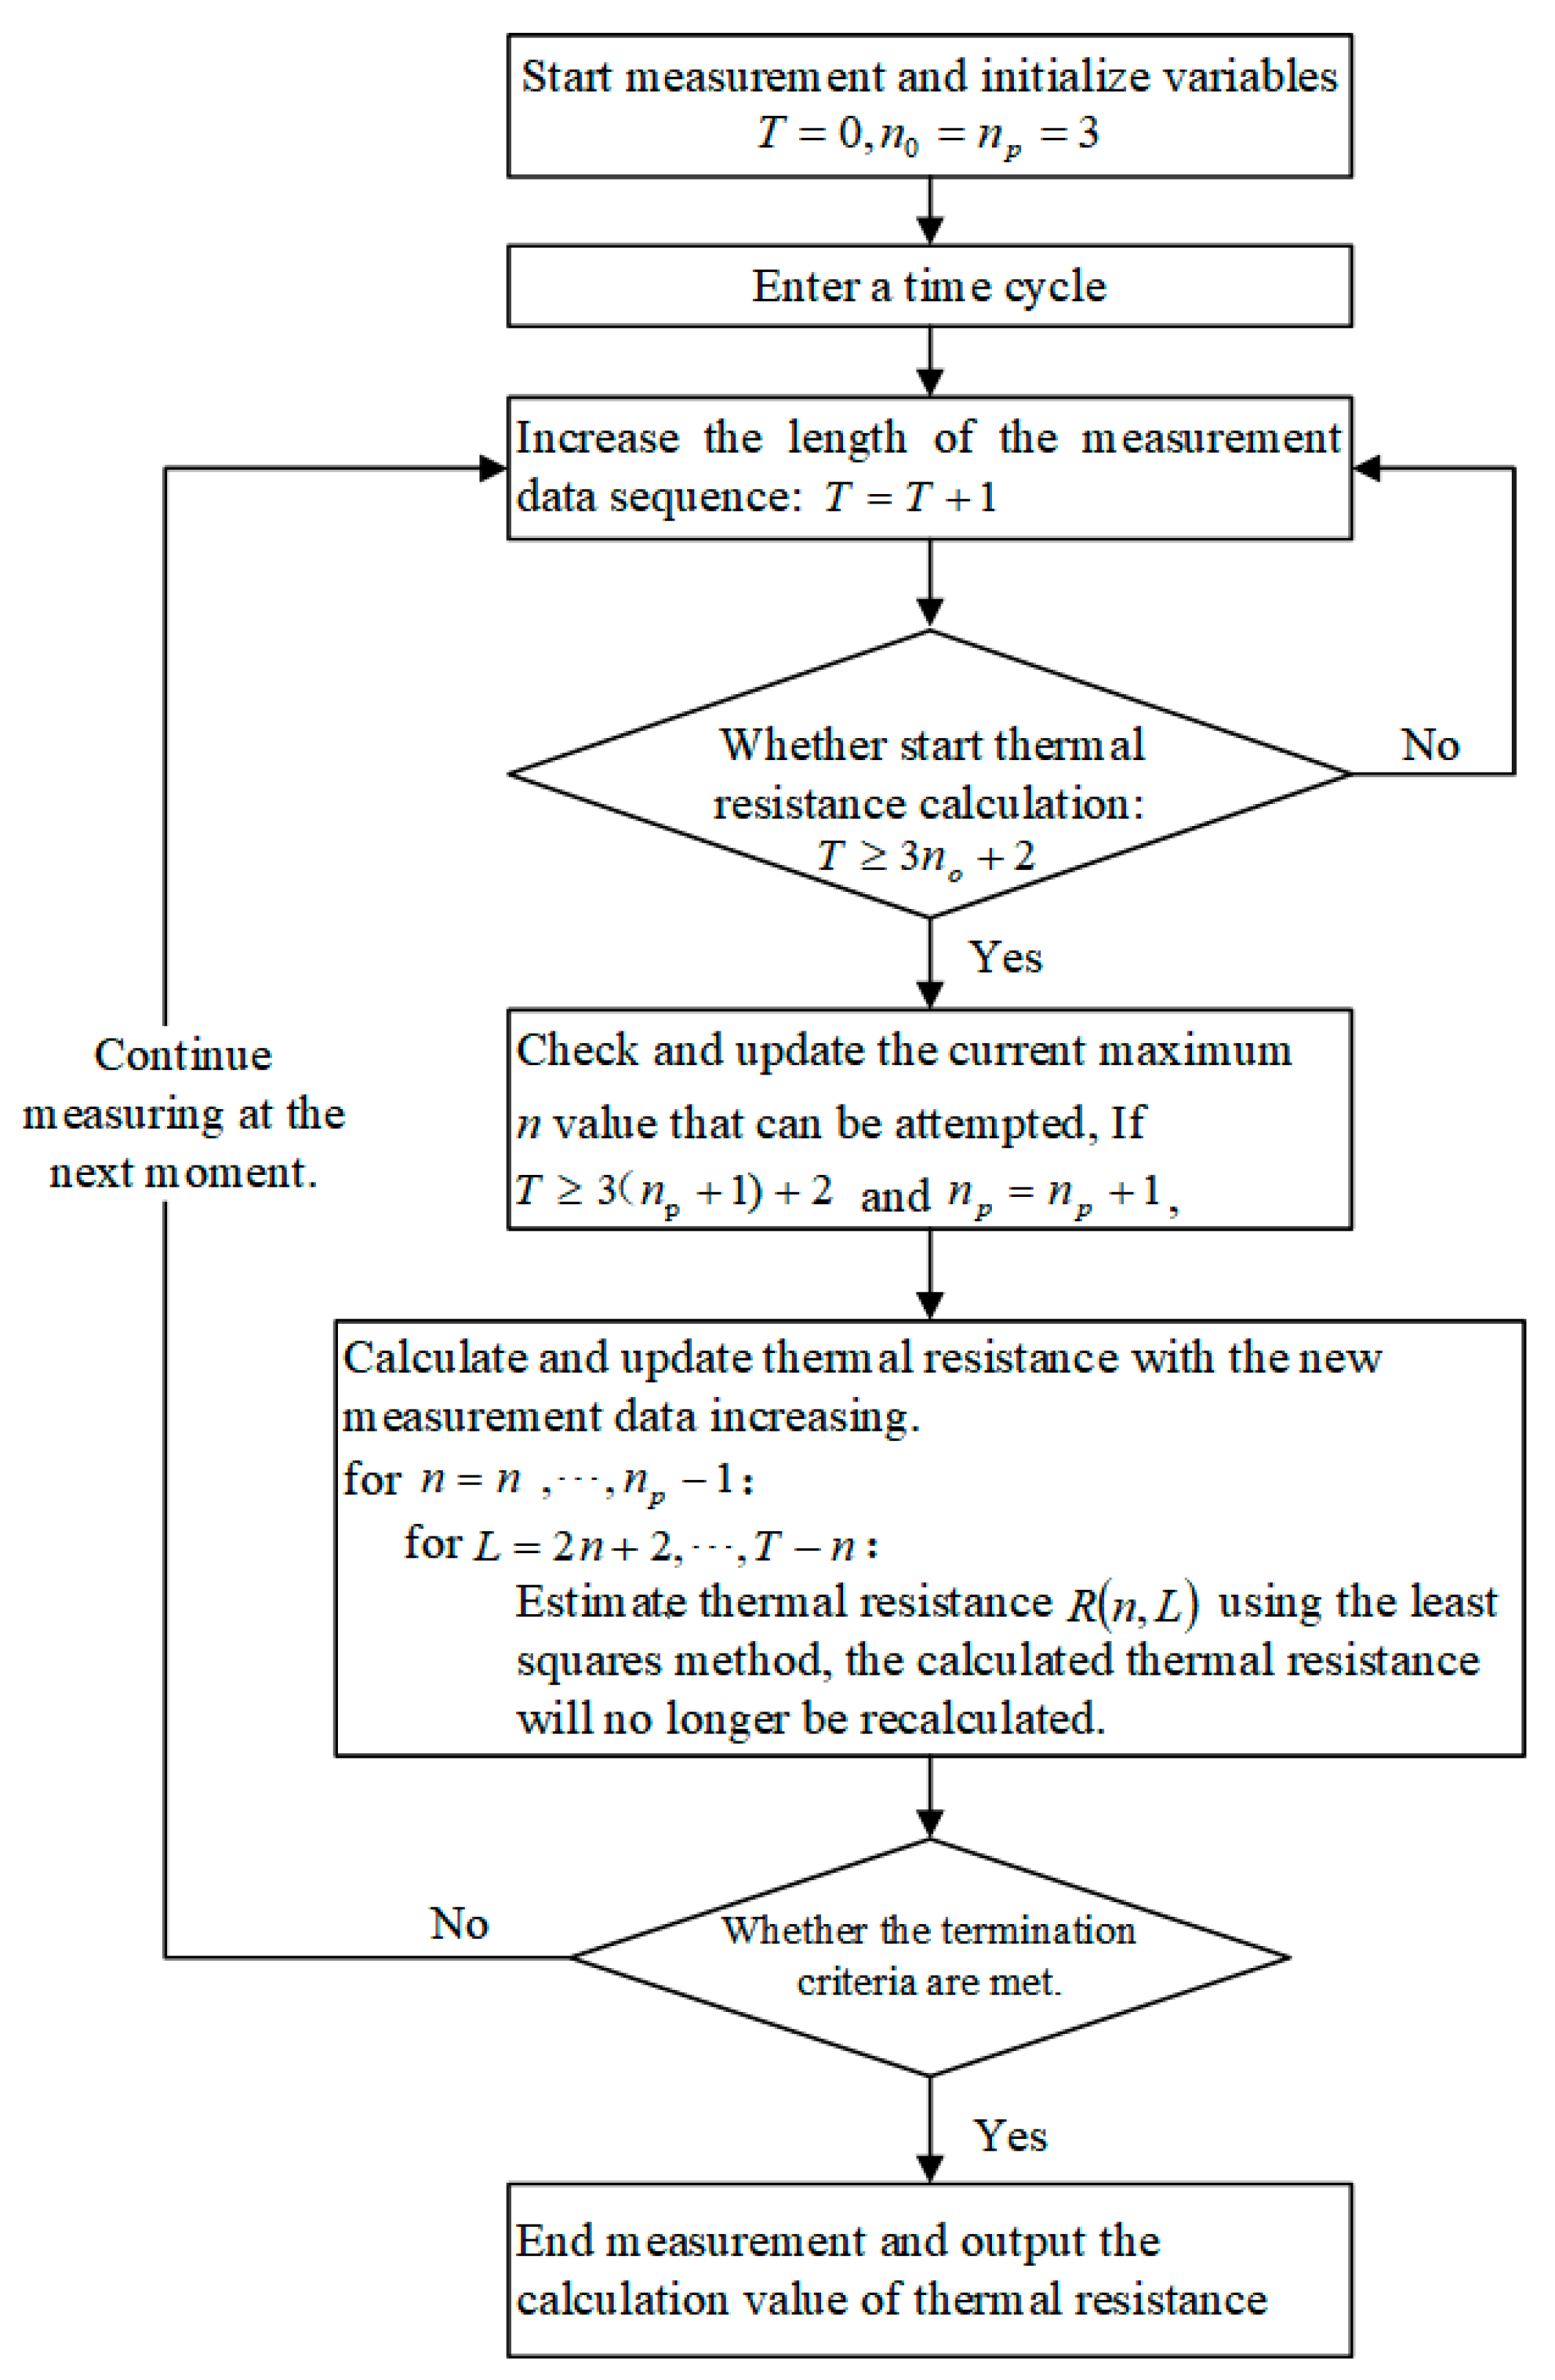
The measurement device of the proposed method is shown in Figure 1 and is the same as the standard HFM method. Installing temperature and heat flux sensors on the measured wall also follows the exact requirements of the HFM method. After starting the in situ measurement, the detailed steps of calculating the wall thermal resistance using this method is as follows and illustrated in Figure 2:
(1)
Take the initial n value as 3 and the initial L value as 8.
(2)
Start the initial estimation of wall thermal resistance when obtaining the length of the data T 3 n 0 + 2 = 11 .
(3)
With the increase in measurement time and data accumulation, try to increase the values of n and L , and update the corresponding estimation of wall thermal resistance R ( n ,   L ) according to Equation (8).
(4)
When the criteria in the form of Equations (16)–(18) is met, output the estimated thermal resistance value R ( n ,   L ) at that time and end the measurement.

3. Theoretical Validation

This method approximates the wall thermal resistance through a truncation form of response factors, which has a specific truncation error compared to the original infinite form. For validating the effectiveness of the truncation model, this section calculates wall response factors A j and B j theoretically and confirms that as n increases, the value of j = 0 n A j and j = 0 n B j eventually converge to the inverse of theoretical thermal resistance 1 R 0 when the residual errors of least squares are small enough.

3.1. Selection of Walls

Seven typical types of walls were selected for calculating the response factors. The seven types of wall construction are based on those with or without a thermal insulation layer, the position of the insulation layer (interior or exterior insulation), and different insulation thicknesses (thin, standard, or thick insulation standing for the thermal resistance of wall worse than, equal to, or better than the required thermal resistance of the exterior wall for Beijing city in the Chinese building energy-saving standard JGJ26-2018 [31]).
The constructions and thermal resistance of seven wall types and the thermophysical parameters of wall materials are listed in Table 3 and Table 4. Wall 2, Wall 3, and Wall 4 are concrete walls with interior thermal insulation (20 mm, 84 mm, 180 mm XPS); Wall 5, Wall 6, and Wall 7 are concrete walls with exterior thermal insulation which are only altered in the insulation layer position from Wall 2, 3, and 4. Wall 1 is a brick wall without thermal insulation but with the same resistance as Wall 2 and Wall 5.

3.2. Validation of Truncated Models

The theoretical values of wall response factors A j and B j can be numerically solved using various methods, such as the state space method [32], the Laplace transform method [25] and others [26]. This paper used the state space method to calculate the wall response factors. The numerical solution of wall response factors depends on an adequate, temporal, and spatial discretization of the wall meeting the Fourier condition. Only the results of Δ τ = 1   h and F o = a Δ τ ( Δ x ) 2 = 1 are shown here. The laws obtained from other discrete intervals are consistent with this.
The theoretical effectiveness of the truncated model is validated by two aspects: (1) whether the truncated sum of the first n factors approaches the wall’s theoretical thermal resistance; (2) whether the residual error of the truncated model is small enough when substituting the measured heat flux and temperature data into the model.

3.2.1. Truncation Error of Response Factors

For the first aspect, we can observe how the sums of the first n terms, j = 0 n A j   and   j = 0 n B j , change with the truncation number, n. The truncation error of response factors is defined as:
E r r   = | j = 0 n A j j = 0 n B j R 0 |
where E r r   is the deviation of both sums of the first n factors, and the subscript j is the j-th term in the infinite series of wall response factors.
Figure 3 shows the theoretical values, sum, and truncation error of the first 50 response factors of Wall 1 in Table 3, and the laws obtained from other walls are consistent with this. Since the magnitudes of the response factors A j and B j differ significantly, the vertical axis of Figure 3 adopted a logarithmic coordinate to observe the changes of   A j ,   B j , and E r r easily. It can be seen from Figure 3 that the response factors conform to the following characteristics: (1) the response factors A j and B j gradually tend to zero and (2) as n increases, the sum A j increases and B j decreases, and both eventually converge to a constant (i.e., the inverse of theoretical thermal resistance 1 R 0 . For Wall 1, 1 R 0 = 1 0.764 = 1.31 ).
Figure 4 shows the sum of response factors for the seven walls in Table 3. It can be seen from Figure 4 that with n increased, although different types of walls have different convergent rates, the trend of A j and B j are the same, and they all eventually converge to a constant of 1 R 0 .

3.2.2. Residual Error of Least Squares

For the second aspect, the temperature and heat flux of wall surfaces were substituted to calculate the residual error of the truncation model.
The residual error of the truncation model can be represented by the coefficient of determination or goodness-of-fit (R2), which indicates the whole deviation degree of the estimated values relative to the observed values. The closer R2 is to 1, the smaller the deviation degree is. The calculation formula of R2 is as follows:
R 2 = 1 k = 0 T ( q i n ( k ) ( j = 0 n A j t o u t ( k j ) j = 0 n B j t i n ( k j ) ) ) 2 k = 0 T ( q i n ( k ) q ¯ ) 2
where R 2 is the goodness-of-fit, q in ( k ) is the measured heat flux at the k-th moment ( W / m 2 ), q ¯ is the average value of heat flux, q ¯ = 1 T k = 0 T q in ( k ) ( W / m 2 ).
For this purpose, we used the simulated data (i.e., the internal and external surface temperatures and internal surface heat flux) from a building energy simulation software, DeST-h [33].
Figure 5 illustrates the goodness-of-fit R 2 at different truncation numbers from 20 to 50 for the seven types of walls. As shown in Figure 5, although the R2 of all walls varies significantly when n = 20, the R2 of all walls increases with n and eventually approaches 1. When n = 40, the R 2 value of all walls except for Walls 3 and 4 is greater than 0.99. When n = 50, all wall R 2 values are greater than 0.99, and the model fitting effect is good. The heat flux calculated by the truncated model is consistent with the measured value. This result may be explained by the fact that when n = 20, the calculation has not fully converged, resulting in a significant residual error. When n increases to 50, the calculation converges, and the sum of coefficients is close to the wall heat transfer coefficient so the error approaches zero.
In summary, when the truncation number n is adequate, the truncation error of response factors and the residual error of least squares are small; the truncation model is a good approximation for the wall thermal resistance calculation.

4. Experiment Validation

In this section, one simulation dataset and one measurement dataset are used to validate the efficacy of the proposed method in estimating wall thermal resistance. Because the standard HFM average method is the simplest and most widely adopted, and it is usually used as a benchmark by most of the literature for evaluating their methods, we choose the average method as the baseline in the paper and compare the results to demonstrate the advantages of the proposed method. However, it should be pointed out that the main purpose of the paper is to introduce the new method and evaluate its feasibility, while the comparison between the two methods is just a reference for the evaluation.

4.1. Performance Indicators

The efficacy of the two methods is evaluated through the following indicators: (1) the relative error of wall thermal resistance estimation ( δ ) and (2) the convergence time, i.e., the measurement period for achieving a good estimation with the required accuracy (T).
The relative error of wall thermal resistance estimation is defined as:
δ = | R R 0 R 0 | × 100 %
The smaller δ is, the more accurate the method is.
The measurement period T for achieving a good estimation with required accuracy is defined as the time length needed to meet the termination criteria listed in Table 5. The smaller T is, the faster the method converges.

4.2. Simulation and Measurement Datasets

The simulation dataset resulted from DeST-h, with typical annual outdoor meteorological data from January 1 to January 21 in Beijing. The room is a bedroom with a size of 14 square meters, and the test wall faces north. The wall structure is a standard external insulation wall, the same as Wall 6 in Table 3. The theoretical thermal resistance of the wall is 2.703 ( m 2 · K ) / W .
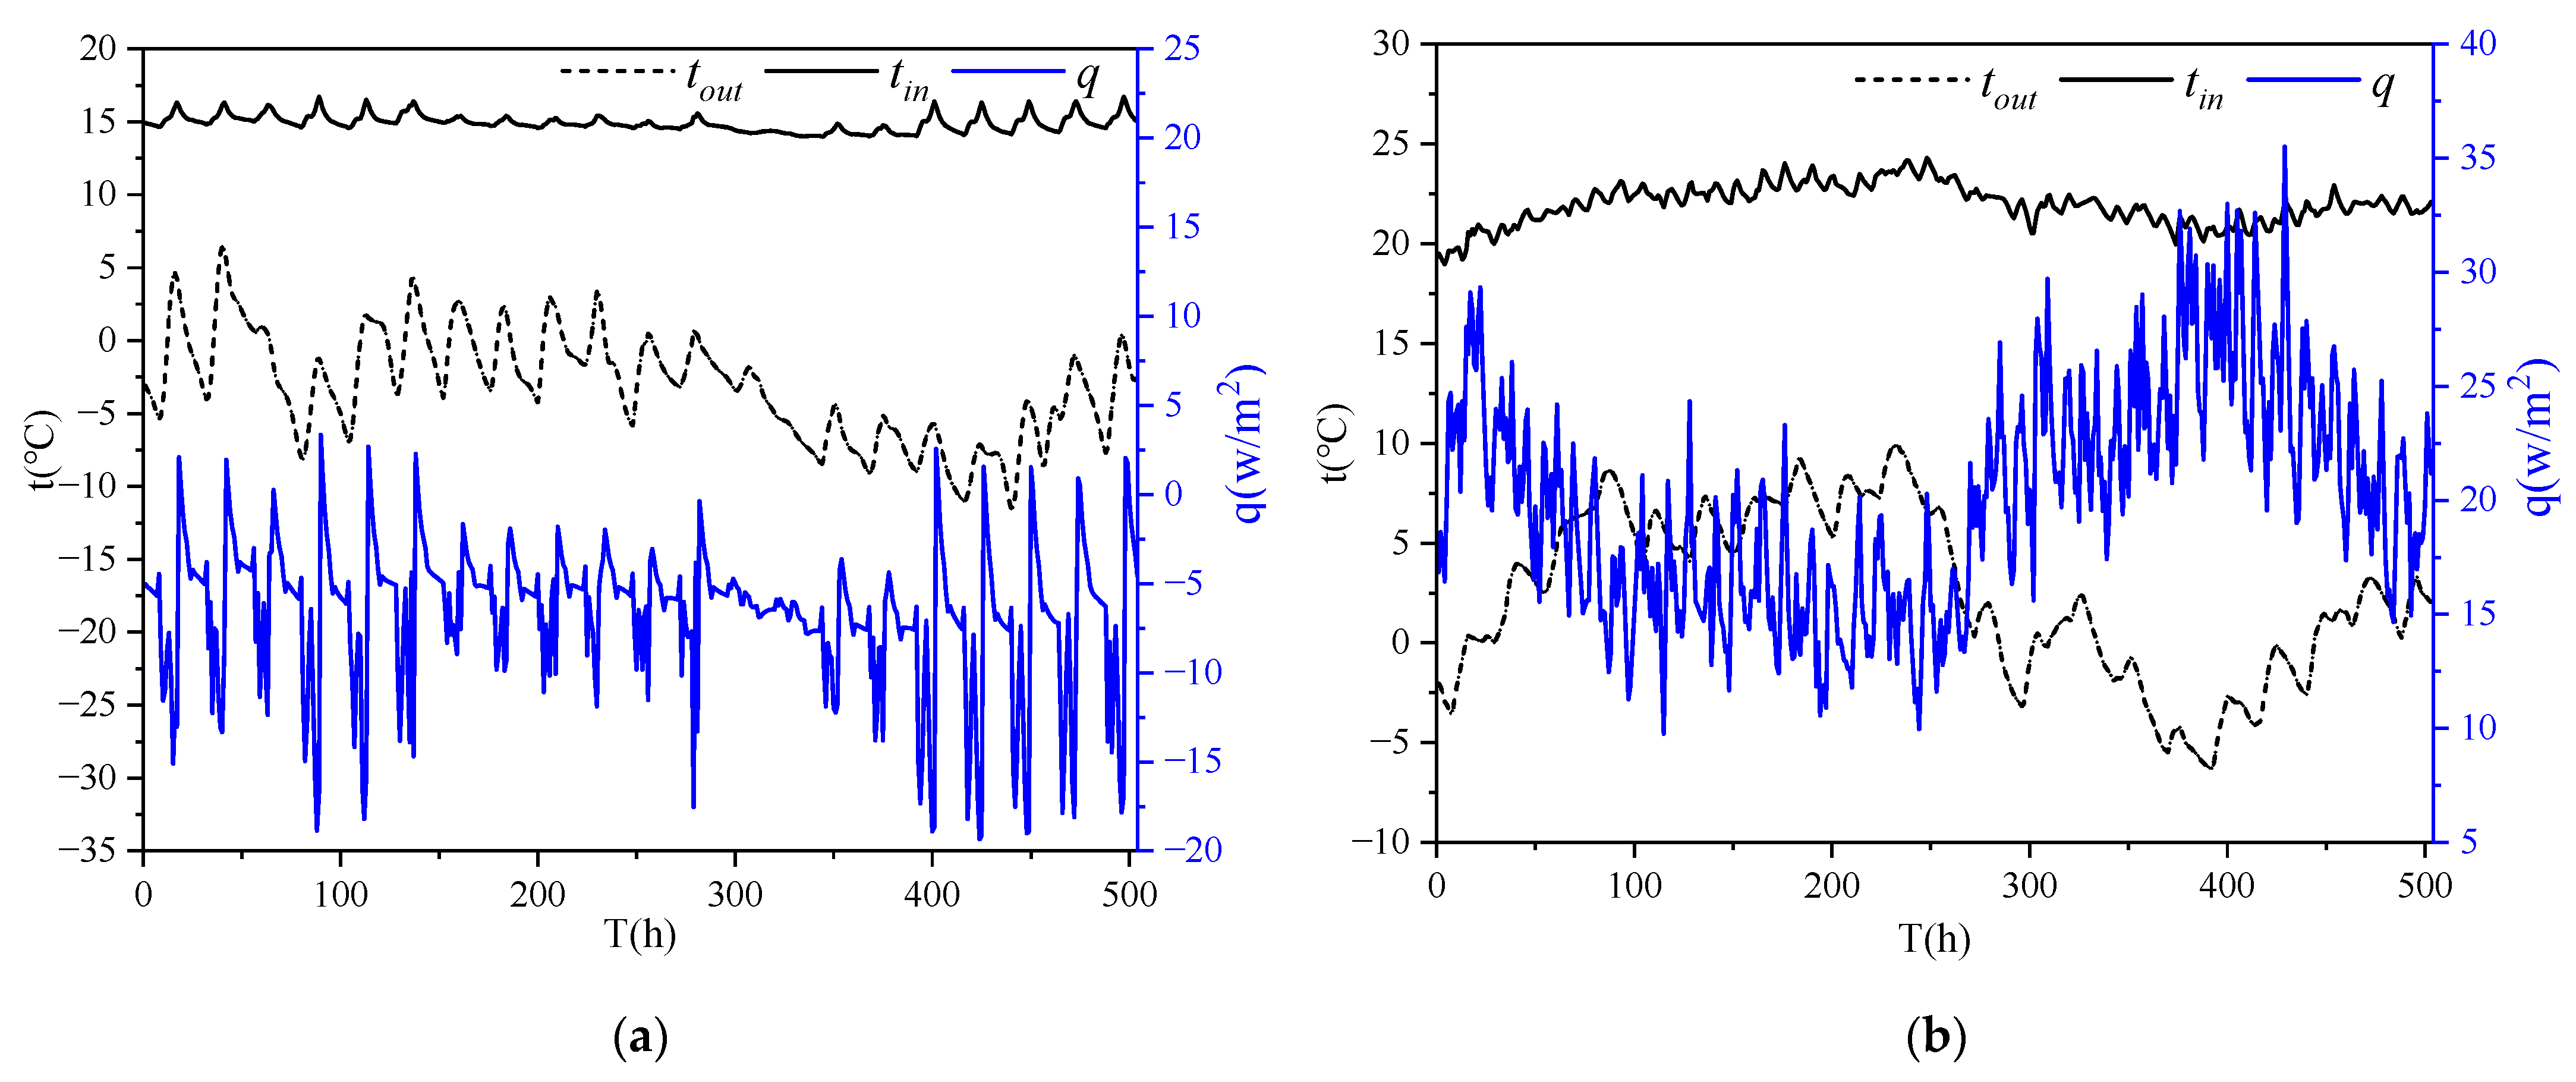
The measurement dataset comes from the literature [34]. The building is a 52 square-meter private residence built in 1990, located in the city of Gwangmyeong in the central region of Korea. The exterior wall facing northwest, a cement brick wall with exterior insulation, was tested from 30 December 2016, to 19 January 2017. After 21 days of measurement, the thermal resistance of the measured wall was determined to be 4.571 ( m 2 · K ) / W . Figure 6 presents the variation of surface temperatures and heat flux over time in the simulation and measurement datasets.
Referring to the literature [34], for a single measurement campaign of 21 days, we reviewed the convergence characteristics of the in situ R-value under the assumption that many measurements are conducted on the same test wall by shifting the measurement start date by one day and setting the measurement period as seven days (i.e., 168 h). So there are 15 sub-datasets, each containing the wall’s internal and external surface temperatures and the internal surface heat flux for seven days.

4.3. Results

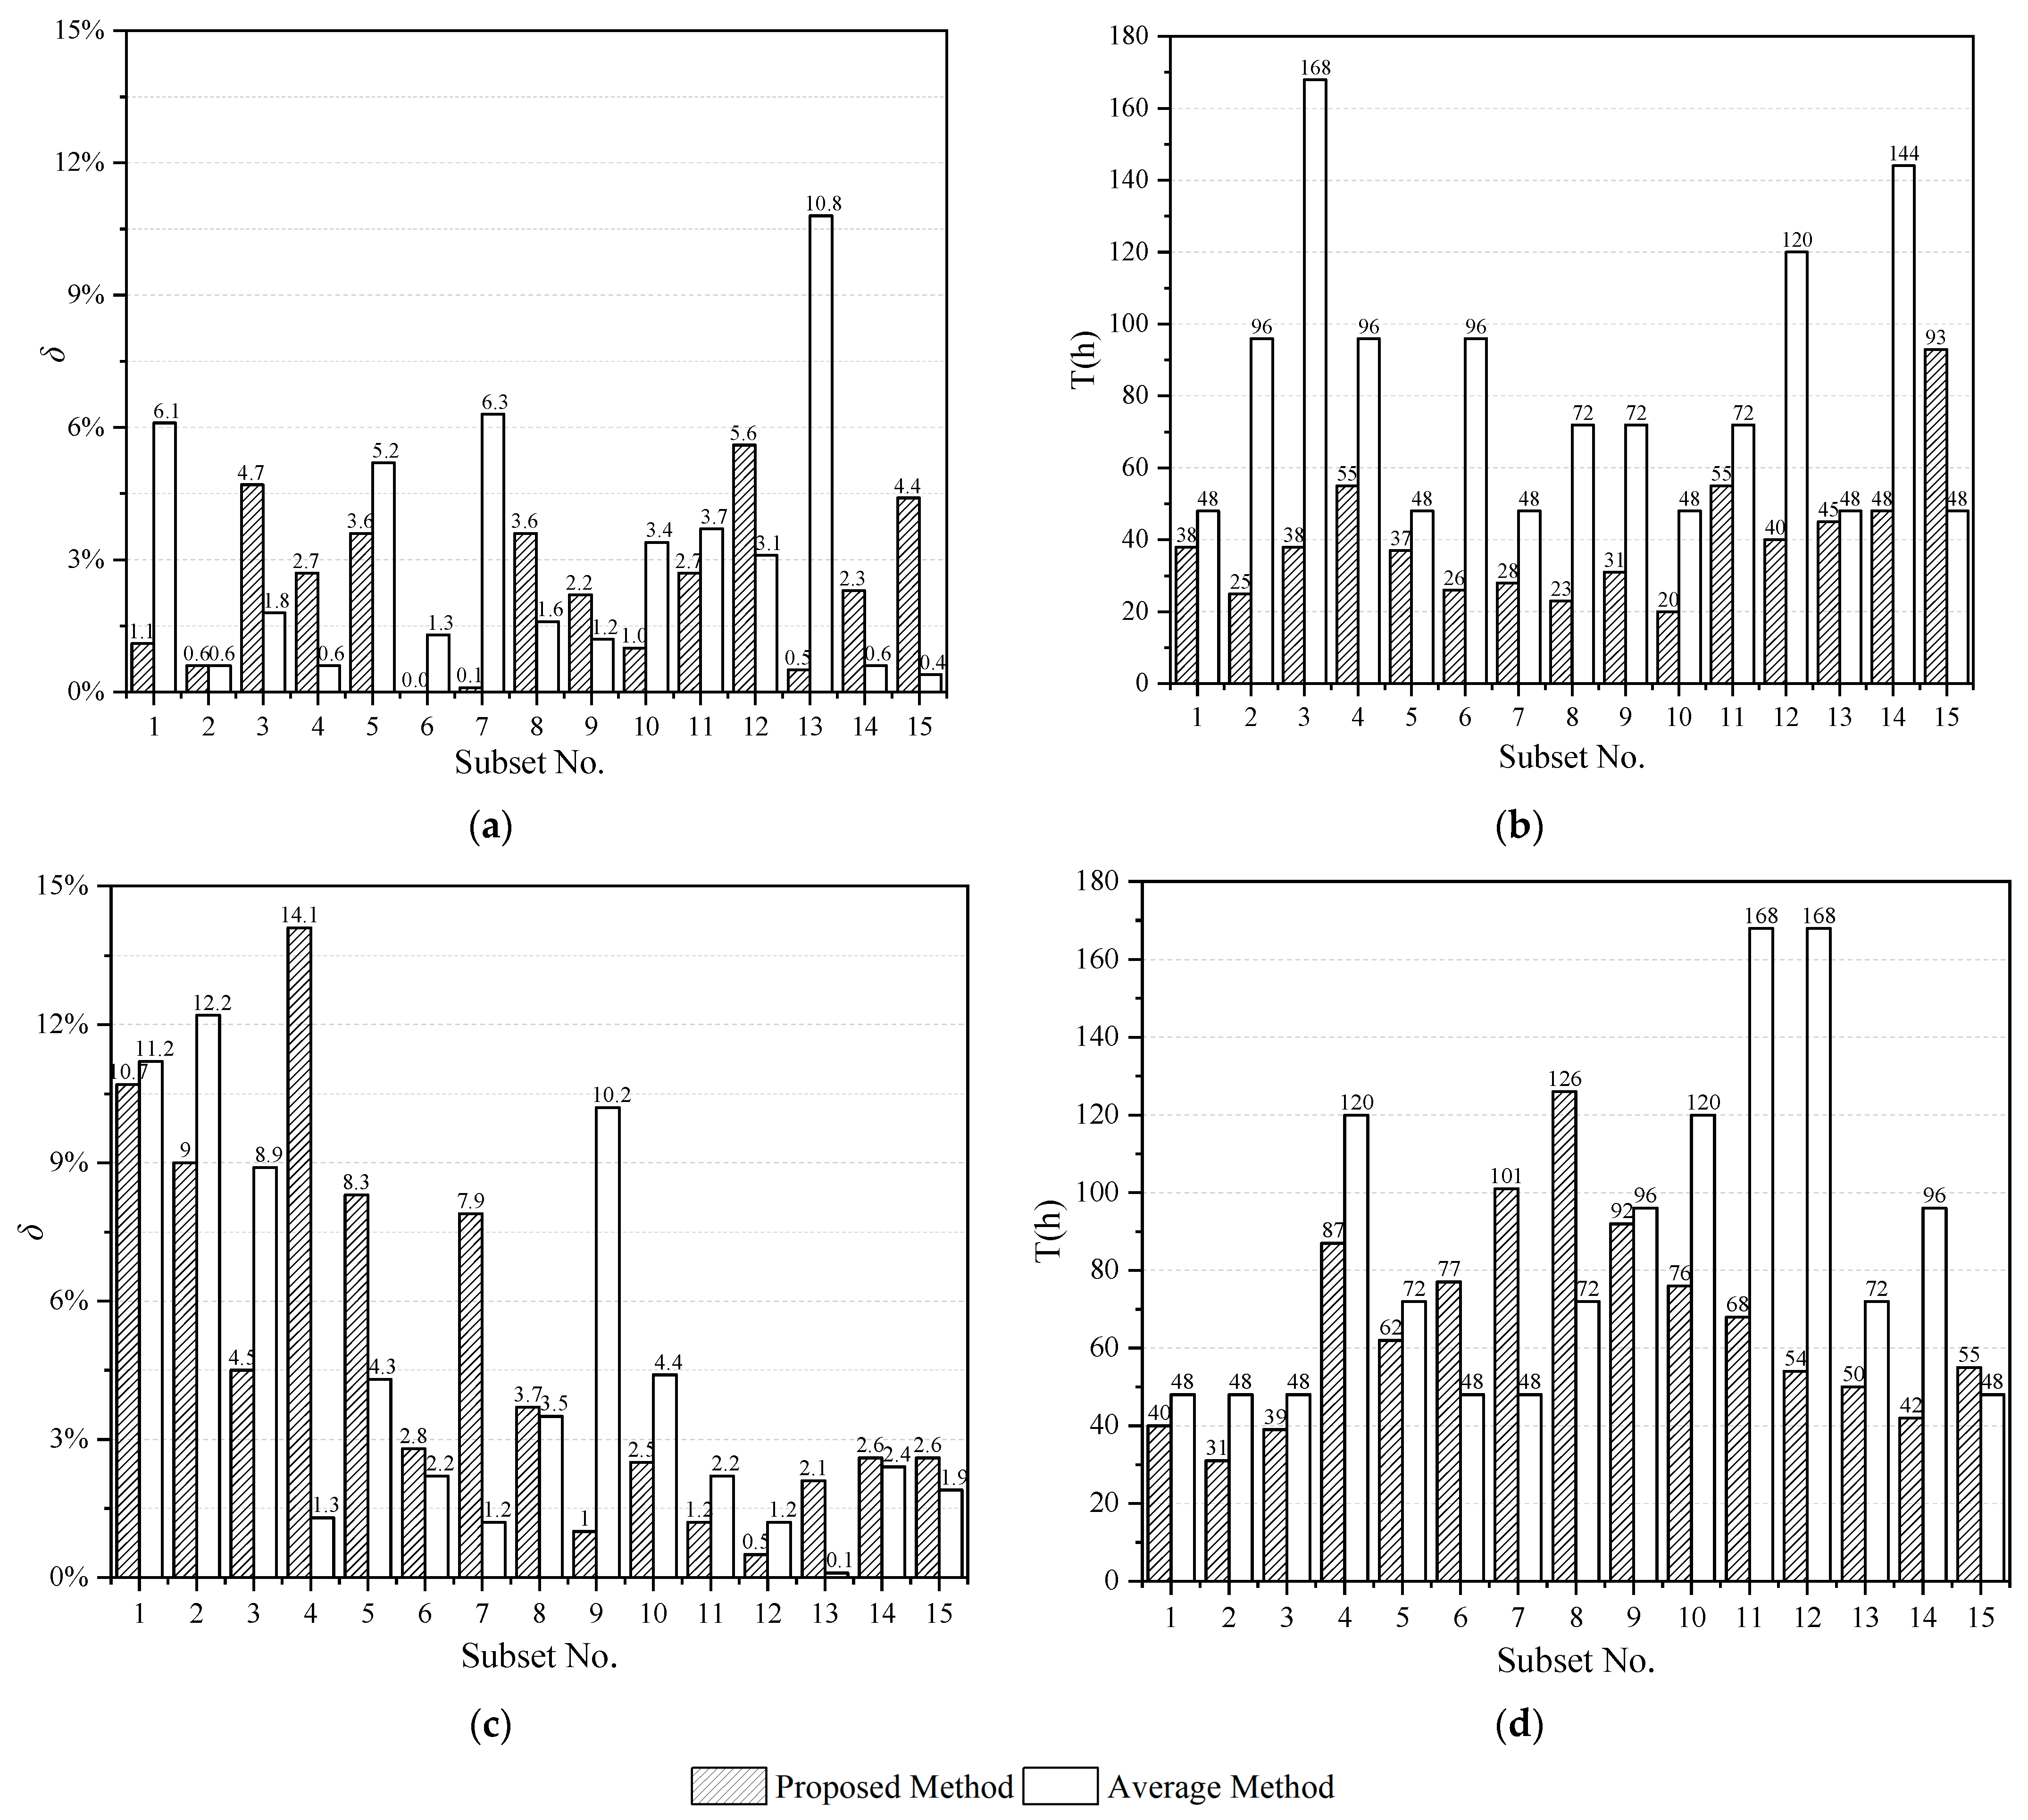
The performance indicators of the proposed method and the average method for each set of the simulation data and measurement data are shown in Figure 7, respectively. Similar to the average method, different datasets have different estimation errors and convergence times due to the different temperature and heat flux data. As the measurement time increases, until the 168th hour, the third subset in Figure 7b and the eleventh and twelfth subsets in Figure 7d only meet the first criterion but do not meet the second criterion. Because the measurement period is set to 168 h, measurements are terminated, and the results are outputted at the last hour.
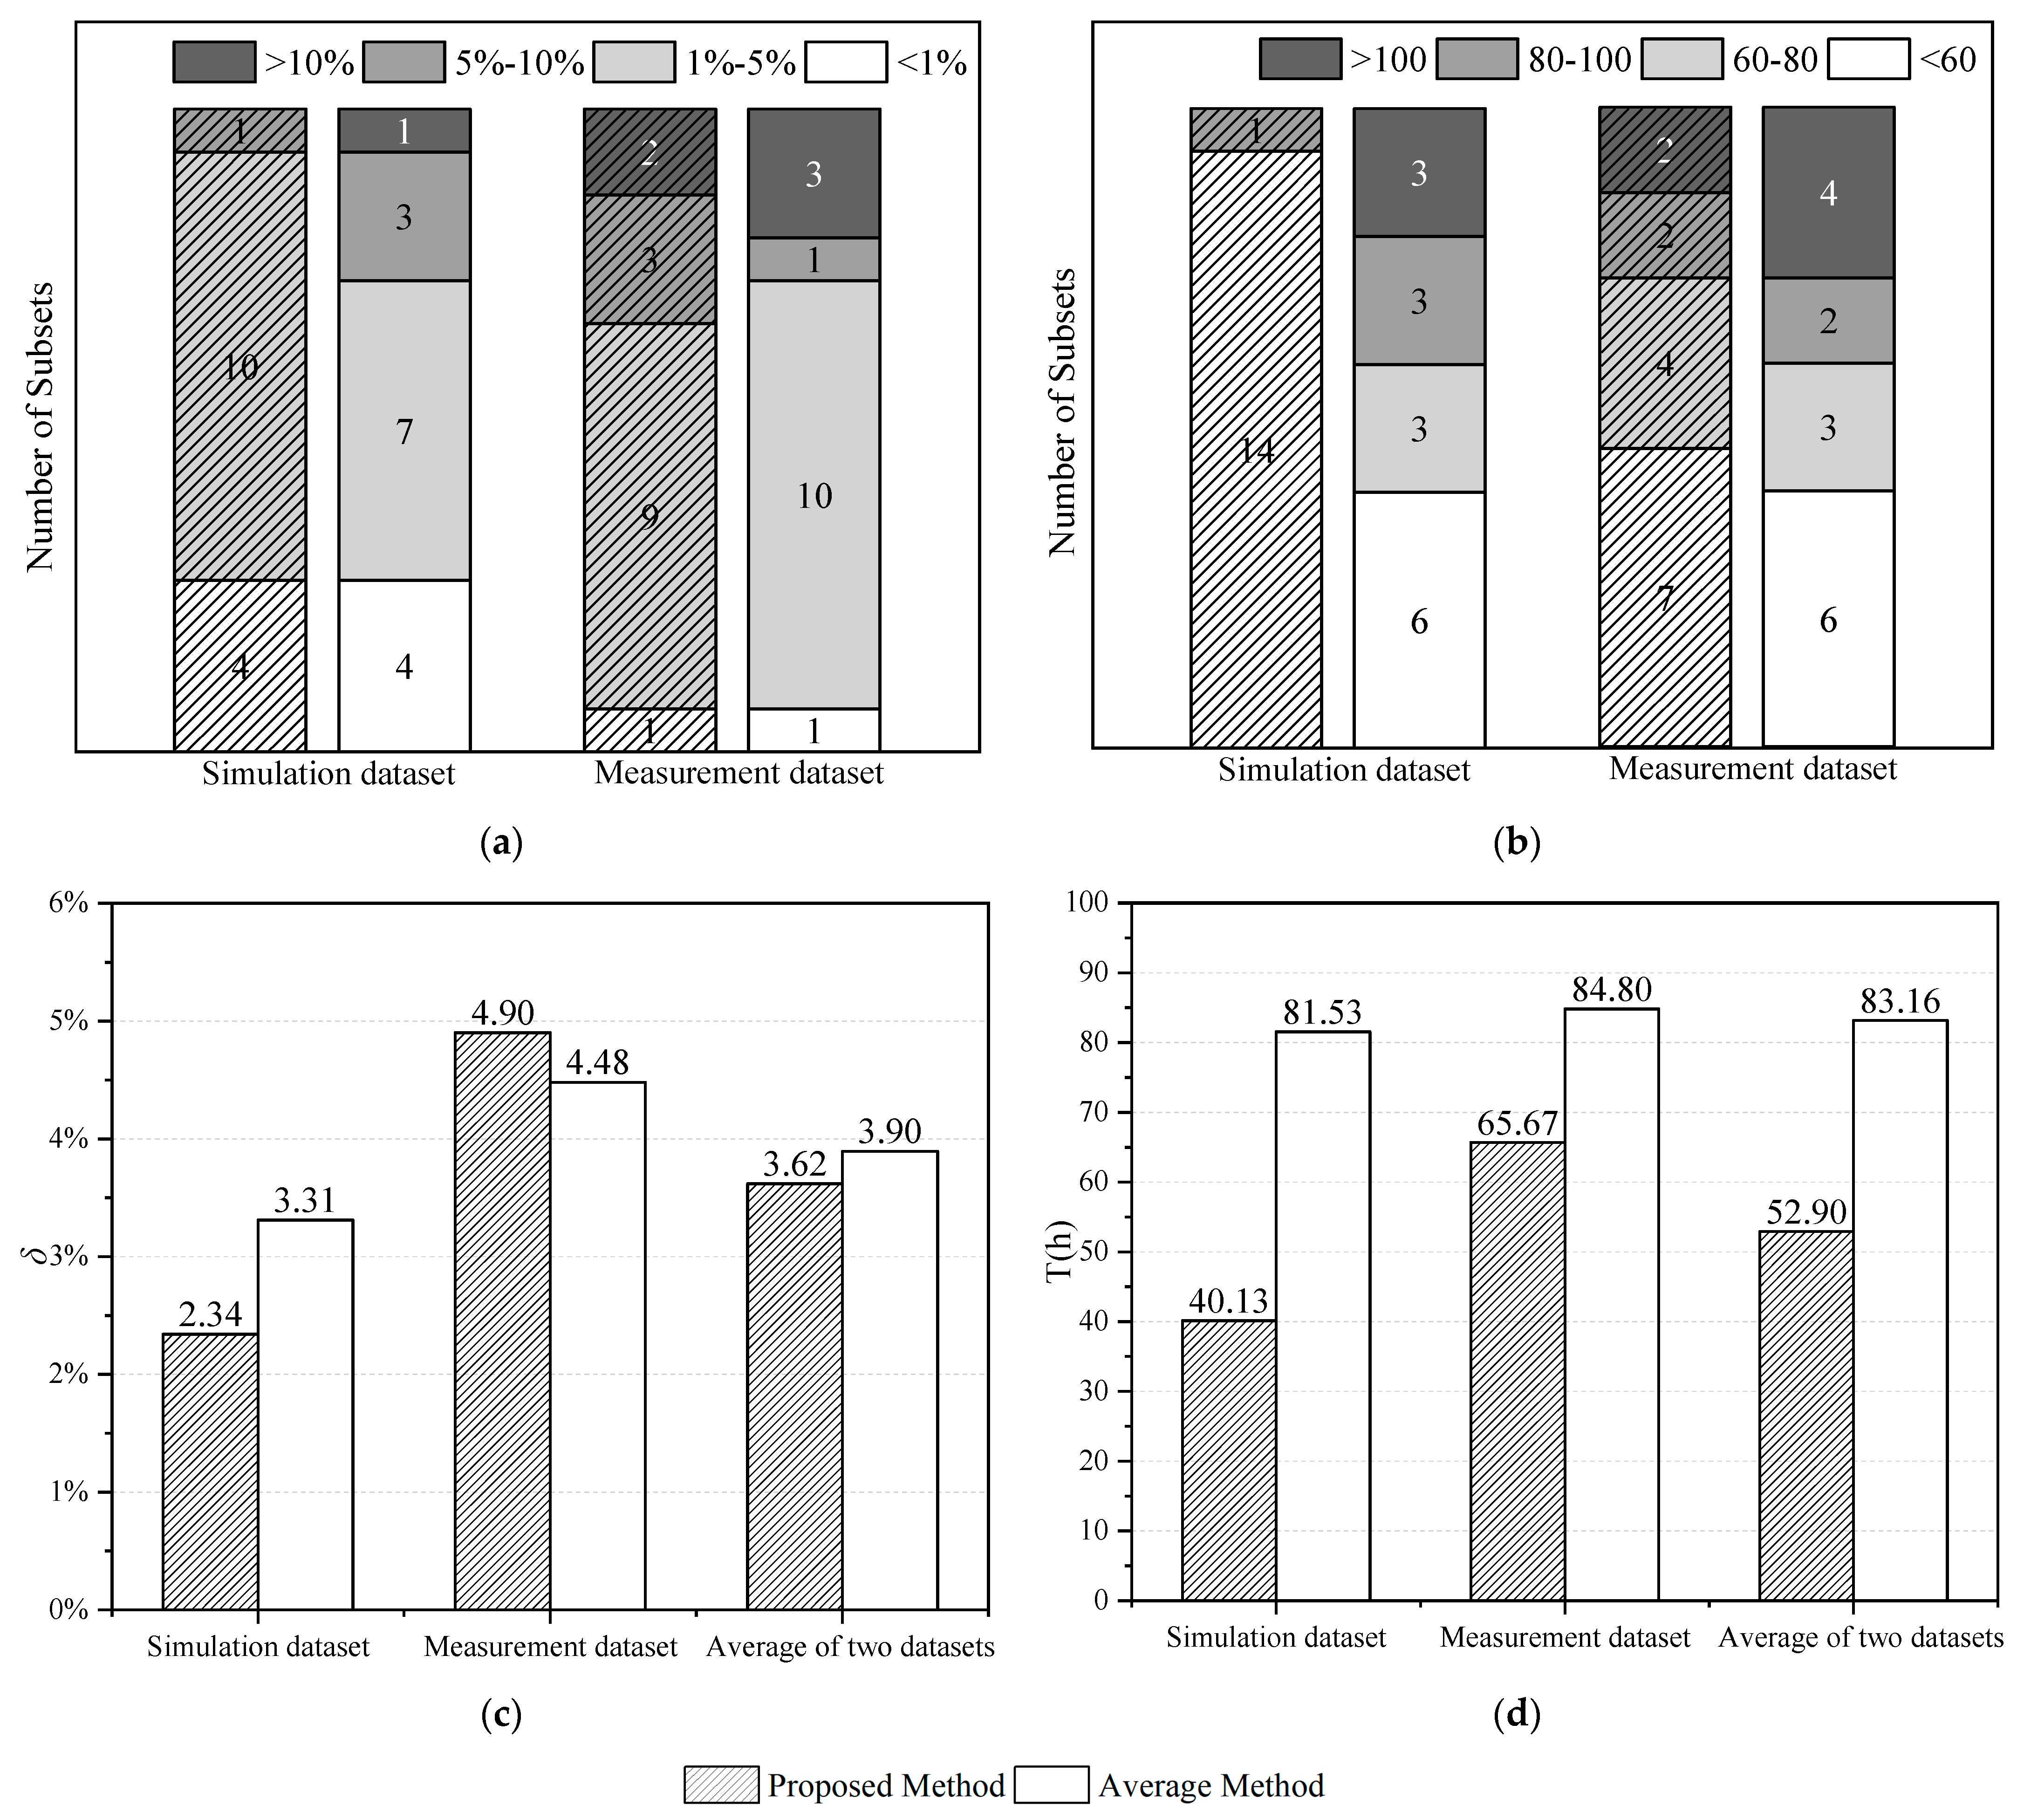
Figure 8 compares the distribution and average of estimation errors and the convergence time of the proposed method and the average method for the simulation and measurement datasets. Looking at Figure 8a, it is apparent that the estimation accuracy of the proposed method is equivalent to that of the average method. It can be seen from Figure 8b that for the simulation dataset, all the convergence time of the proposed method were less than 80 h, of which 14 groups of sub-datasets were less than 60 h, significantly better than the performance of the average method; for the measurement dataset, the overall performance of the proposed method is also slightly better than that of the average method.
Figure 8c,d show that the accuracy of the proposed method is similar to the average method for the simulation and measurement datasets and has a deviation of 3.86% on average. In terms of the convergence time, compared to the average method, the proposed method can effectively shorten it to about half the time taken for the simulation dataset and about one-fourth of the time taken for the measurement dataset, the measurement period is shorterned by about 36.4% on average.
By analyzing the calculation results, it can be seen that by using the proposed method, the measurement can automatically terminate and output a reasonable estimation of wall thermal resistance. Compared with the average method, the proposed method can obtain the same accuracy but use less time for different datasets.

5. Conclusions

This study proposes a new response factor-based method for the in situ measurement of wall thermal resistance in existing buildings, aiming to be simple in principle and accurate and fast in practice. It utilizes the same measurement devices as the standard heat flow meter method, with no additional heating device, and develops a response factor-based method for wall thermal resistance calculation based on the classical one-dimensional plate heat conduction theory, which suits the dynamic analysis of the in situ temperature and heat flux data. The feasibility and accuracy of the proposed method were validated through theoretical analysis, simulation, and measurement cases.
The main highlights and findings of the paper are as follows:
  • The data analysis method was established, including the truncation model for the wall thermal resistance calculation derived from the classical theory of wall thermal response factors, the convergence criteria based on theoretical and empirical analysis, and the implementation process for applying the method to the in situ measurement.
  • The threshold value of 2 × 10⁻³ in the convergence criteria for determining if the measurement and calculation process converges is an empirical value obtained after many trials. It is a trade-off between the convergence time and the accuracy of wall thermal resistance estimations.
  • The truncation model is theoretically validated from the perspectives of the truncation error of response factors and the residual error of least squares. Seven typical types of walls were selected based on Chinese building energy-saving standards. The results show that when the number of truncation terms, n , is sufficient for different types of walls, a truncated form of wall response factors can replace the infinite form for wall thermal resistance calculation, and the truncation and residual errors can be ignored.
  • The feasibility and accuracy of the proposed method are validated by one simulation dataset and one measurement dataset. The results show that the accuracy of the proposed method is similar to the standard average method and has a deviation of 3.86% on average. In terms of the convergence time, compared to the average method, the proposed method can effectively shorten the measurement period by about 36.4% on average.
  • The preliminary validation results indicate that the proposed method and its convergence criteria apply to actual measurements while achieving a fast but accurate estimation result. Compared with other dynamic HFM methods, the proposed method has the significant advantages of simple principle and clear physical meaning.
For the sake of time and space, there are no performance comparisons between the proposed method and other dynamic methods at present. Another drawback of this study is that the data sources for method validation are not as much as in other previous studies. In the future, we will validate the applicability of this method with more conditions since the estimation results of wall thermal resistance are influenced by various environmental factors such as season, wall orientation, and climate zone. More comparisons between this method and other dynamic methods will be carried out to show their advantages and disadvantages. To make the method more practical, we will undertake more work for the uncertainty analysis of estimation results, filtering the in situ measured data, and optimizing the online algorithm to improve the computational efficiency.

Author Contributions

Conceptualization, C.W. and J.A.; methodology, C.W., X.F., X.T. and J.A.; validation, X.F.; resources, X.L.; writing—original draft preparation, C.W., X.F. and X.T.; writing—review and editing, C.W.; visualization, X.F. and X.T. All authors have read and agreed to the published version of the manuscript.

Funding

This work was supported by the National Natural Science Foundation of China (No. 51608297 and No. 52108068), Beijing Municipal Natural Science Foundation (No. 8222016), Scientific Research Project of Beijing Municipal Education Commission (No. KM201910016009 and No. KZ202110016022), Pyramid Talent Training Project (No. JDYC20220815) and Post-Graduate Innovation Project (No. PG2023079) of Beijing University of Civil Engineering and Architecture.

Data Availability Statement

Data will be made available on request.

Conflicts of Interest

The authors declare no conflict of interest.

References

  1. Tsinghua BERC. 2020 Annual Development Research Report on Building Energy Efficiency in China; China Architecture & Building Press: Beijing, China, 2020. (In Chinese) [Google Scholar]
  2. Hu, S.; Zhang, Y.; Yang, Z.; Yan, D.; Jiang, Y. Challenges and Opportunities for Carbon Neutrality in China’s Building Sector—Modelling and Data. Build. Simul. 2022, 15, 1899–1921. [Google Scholar] [CrossRef]
  3. GB 55015-2021; General Code for Energy Efficiency and Renewable Energy Application in Buildings. China Architecture & Building Press: Beijing, China, 2021. (In Chinese)
  4. Teni, M.; Krstić, H.; Kosiński, P. Review and Comparison of Current Experimental Approaches for In-Situ Measurements of Building Walls Thermal Transmittance. Energy Build. 2019, 203, 109417. [Google Scholar] [CrossRef]
  5. JGJT132-2009; Energy Efficiency Test Standard for Residential Buildings. Ministry of Housing and Urban-Rural Development of the People’s Republic of China: Beijing, China, 2010. (In Chinese)
  6. ISO 9869-1:2014; Thermal Insulation Building Elements In-Situ Measurement of Thermal Resistance and Thermal Transmittance—Part 1: Heat Flow Meter Method. ISO: Geneva, Switzerland, 2014.
  7. An-Heleen, D.; Staf, R. Comparison of Characterisation Methods Determining the Thermal Resistance of Building Components from Onsite Measurements. Energy Build. 2016, 130, 309–320. [Google Scholar] [CrossRef] [Green Version]
  8. Naveros, I.; Ghiaus, C.; Ruíz, D.P.; Castaño, S. Physical Parameters Identification of Walls Using ARX Models Obtained by Deduction. Energy Build. 2015, 108, 317–329. [Google Scholar] [CrossRef]
  9. François, A.; Ibos, L.; Feuillet, V.; Meulemans, J. Novel Active Method for the Estimation of a Building Wall Thermal Resistance. E3S Web Conf. 2020, 172, 14008. [Google Scholar] [CrossRef]
  10. Ke, R. Development of In-Situ Wall Thermal Resistance Test Instrument and Application of Double-Heat Flow Meter. Master’s Thesis, Donghua University, Shanghai, China, 2017. (In Chinese). [Google Scholar]
  11. Kou, F.; Wang, X.; Zou, Y.; Mo, J.; Wang, X.; Zuo, Y.; Mo, J. Simulation Study of Three-Dimensional Heat Transfer in the Wall Thermal Resistance Test. Build. Energy Effic. 2020, 48, 6–11+79. (In Chinese) [Google Scholar] [CrossRef]
  12. François, A.; Ibos, L.; Feuillet, V.; Meulemans, J. Estimation of the Thermal Resistance of a Building Wall with Inverse Techniques Based on Rapid Active in Situ Measurements and White-Box or ARX Black-Box Models. Energy Build. 2020, 226, 110346. [Google Scholar] [CrossRef]
  13. Rasooli, A.; Itard, L.; Ferreira, C.I. A Response Factor-Based Method for the Rapid in-Situ Determination of Wall’s Thermal Resistance in Existing Buildings. Energy Build. 2016, 119, 51–61. [Google Scholar] [CrossRef] [Green Version]
  14. Shi, X.; Gong, G.; Peng, P.; Liu, Y. Investigation of a New Kind of In-Situ Measurement Method of Thermal Resistance of Building Envelope. Energy Build. 2022, 258, 111803. [Google Scholar] [CrossRef]
  15. Rasooli, A.; Itard, L. In-Situ Characterization of Walls’thermal Resistance: An Extension to the ISO 9869 Standard Method. Energy Build. 2018, 179, 374–383. [Google Scholar] [CrossRef]
  16. Rasooli, A.; Itard, L. In-Situ Rapid Determination of Walls’ Thermal Conductivity, Volumetric Heat Capacity, and Thermal Resistance, Using Response Factors. Appl. Energy 2019, 253, 113539. [Google Scholar] [CrossRef]
  17. Park, S.; Song, D. In Situ Measurement Method of Thermal Transmittance of Opaque Building Elements under Small Indoor and Outdoor Temperature Differences. In Proceedings of the 12th International Symposium on Heating, Ventilation and Air Conditioning (ISHVAC 2021), Seoul, Republic of Korea, 24–26 November 2021; pp. 654–659. [Google Scholar]
  18. Shen, Q.; Liang, L.; Xia, J.; Liang, L.; Xia, J. On-Site Measuring Method of Heat Resistance of Wall by STLS. Build. Sci. 2015, 31, 47–53. (In Chinese) [Google Scholar] [CrossRef]
  19. Laurenti, L.; Marcotullio, F.; Monte, F. Determination of the Thermal Resistance of Walls through a Dynamic Analysis of In-Situ Data. Int. J. Therm. Sci. 2004, 43, 297–306. [Google Scholar] [CrossRef]
  20. Flores Larsen, S.; Silvana, M.; Castro, N.; González, S. Comparison of Four In-Situ Methods for the Determination of Walls Thermal Resistance in Free-Running Buildings with Alternating Heat Flux in Different Seasons. Constr. Build. Mater. 2019, 224, 455–473. [Google Scholar] [CrossRef]
  21. Iglesias, M.; Sawlan, Z.; Scavino, M.; Tempone, R.; Wood, C. Bayesian Inferences of the Thermal Properties of a Wall Using Temperature and Heat Flux Measurements. Int. J. Heat Mass Transf. 2018, 116, 417–431. [Google Scholar] [CrossRef] [Green Version]
  22. Beñat, A.; Roberto, G.-M.; Julen, A.; Juan, C.R. Monitoring and Thermal Performance Evaluation of Two Building Envelope Solutions in an Apartment Building. E3S Web Conf. 2020, 172, 25002. [Google Scholar] [CrossRef]
  23. Bienvenido-Huertas, D.; Pérez-Ordóñez, J.L.; Moyano, J.; Seara-Paz, S. Towards an In-Situ Evaluation Methodology of Thermal Resistance of Basement Walls in Buildings. Energy Build. 2020, 208, 109643. [Google Scholar] [CrossRef]
  24. Petojević, Z.; Gospavić, R.; Todorović, G. Estimation of Thermal Impulse Response of a Multi-Layer Building Wall through in-Situ Experimental Measurements in a Dynamic Regime with Applications. Appl. Energy 2018, 228, 468–486. [Google Scholar] [CrossRef]
  25. Yan, Q.; Zhao, Q. Building Thermal Process; China Architecture & Building Press: Beijing, China, 1986. [Google Scholar]
  26. Chen, Y.; Wang, S. A New Procedure for Calculating Periodic Response Factors Based on Frequency Domain Regression Method. Int. J. Therm. Sci. 2005, 44, 382–392. [Google Scholar] [CrossRef]
  27. Eunilkim, D.H. Wall-Response Factors to Estimate the Conduction Heat Gains with Time-Varying Thermal Coefficients. Energy 1991, 16, 933–939. [Google Scholar] [CrossRef]
  28. U.S. Department of Energy. EnergyPlusTM Version 9.0.1 Documentation; DOE: Washington, DC, USA, 2018. [Google Scholar]
  29. Cao, K.; Lesnic, D. Simultaneous Reconstruction of the Spatially-Distributed Reaction Coefficient, Initial Temperature and Heat Source from Temperature Measurements at Different Times. Comput. Math. Appl. 2019, 78, 3237–3249. [Google Scholar] [CrossRef]
  30. Boyd, S.; Vandenberghe, L. Introduction to Applied Linear Algebra; Cambridge University Press & Assessment: Cambridge, UK, 2018. [Google Scholar]
  31. JGJ26-2018; Design Standard for Energy Efficiency of Residential Buildings in Severe Cold and Cold Zones. Ministry of Housing and Urban-Rural Development of the People’s Republic of China: Beijing, China, 2018. (In Chinese)
  32. Kunze, O.; Fariborz, H. A Procedure for Calculating Thermal Response Factors of Multi-Layer Walls State Space Method. Build. Environ. 1991, 26, 173–177. [Google Scholar]
  33. Yan, D.; Xia, J.; Tang, W.; Song, F.; Zhang, X.; Jiang, Y. DeST—An Integrated Building Simulation Toolkit Part I: Fundamentals. Build. Simul. 2008, 1, 95–110. [Google Scholar] [CrossRef]
  34. Choi, D.S.; Ko, M.J. Analysis of Convergence Characteristics of Average Method Regulated by ISO 9869-1 for Evaluating In Situ Thermal Resistance and Thermal Transmittance of Opaque Exterior Walls. Energies 2019, 12, 1989. [Google Scholar] [CrossRef] [Green Version]
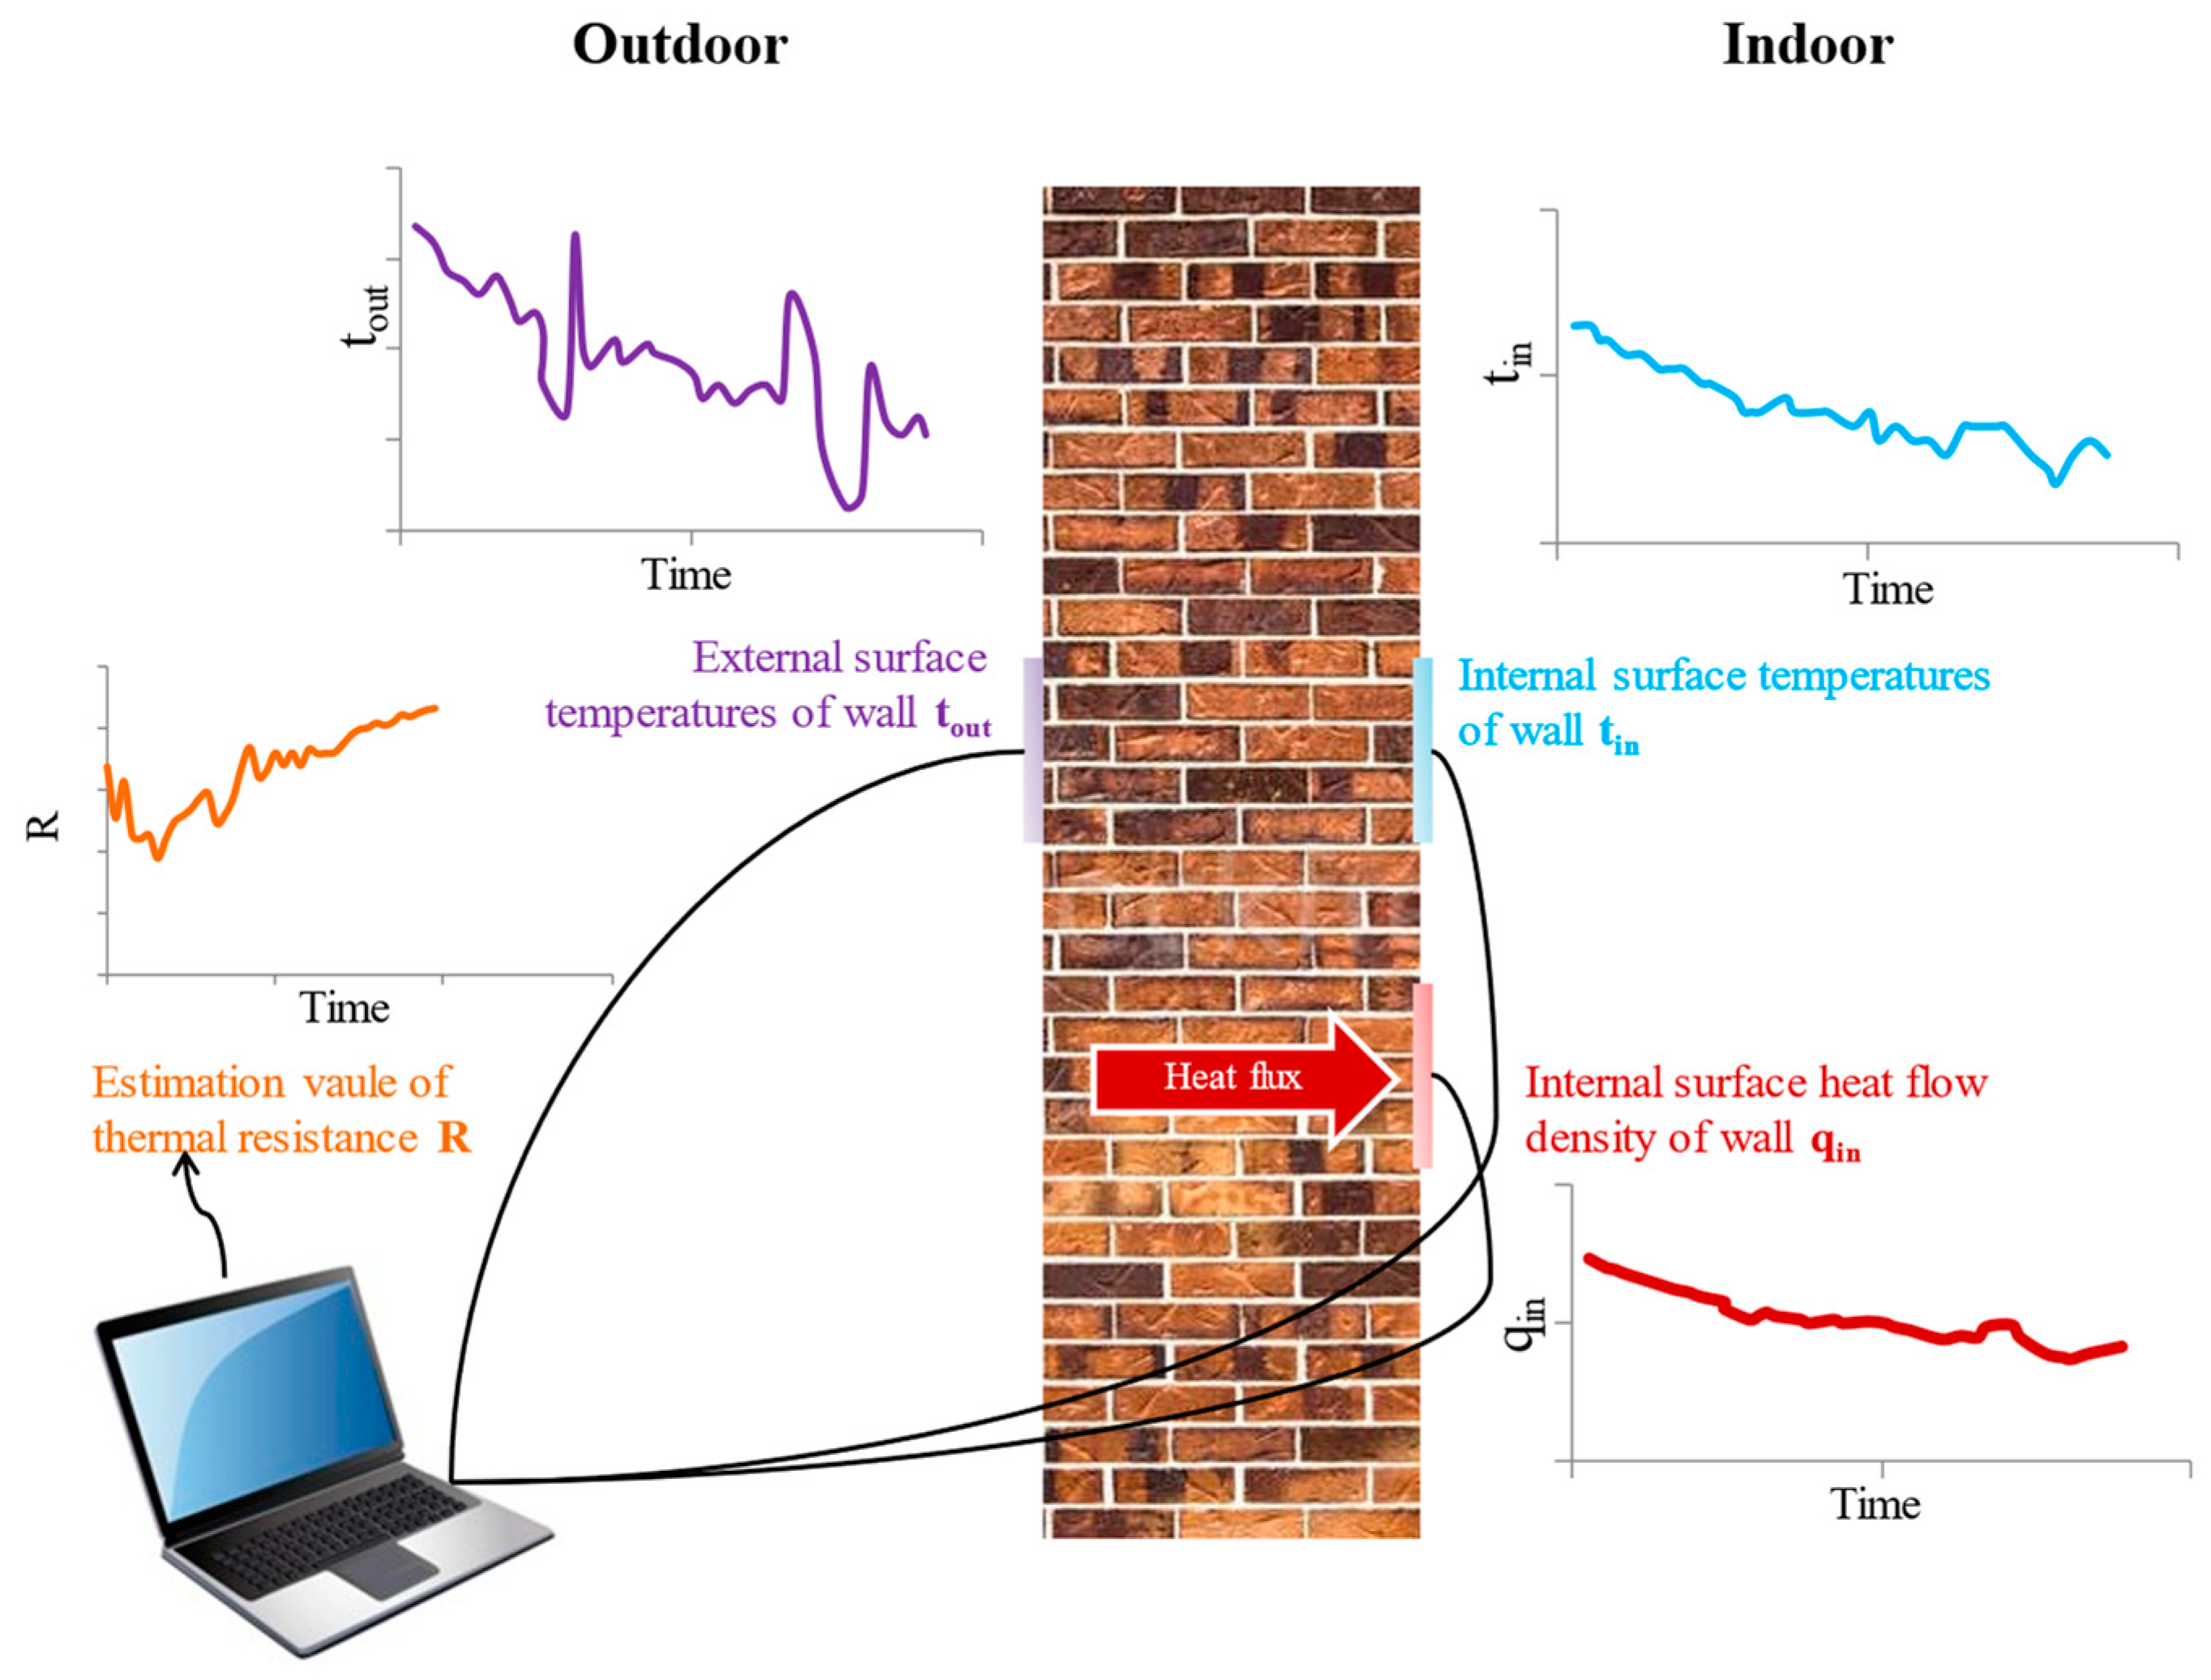
Figure 1. Measurement devices for the heat flow meter method.
Buildings 13 01986 g001
Figure 2. Workflow of the proposed method.
Buildings 13 01986 g002
Figure 3. The first 50 response factors of Wall 1. (a) Theoretical values of each response factor. (b) The sum and truncation error.
Buildings 13 01986 g003
Figure 4. Variation tendency of the sum of different wall coefficients with the truncation number n. (a) A j . (b) B j .
Buildings 13 01986 g004
Figure 5. R 2 under different walls with different truncation numbers.
Buildings 13 01986 g005
Figure 6. Variation of surface temperatures and heat flux over time. (a) Simulation dataset. (b) Measurement dataset.
Buildings 13 01986 g006
Figure 7. The performance indicators of the proposed method and the average method. (a) Estimation errors for the simulation dataset. (b) Convergence time for the simulation dataset. (c) Estimation errors for the measurement dataset. (d) Convergence time for the measurement dataset.
Buildings 13 01986 g007
Figure 8. The performance statistics of the proposed method and the average method. (a) Distribution of estimation errors. (b) Distribution of convergence time. (c) Average values of estimation errors. (d) Average values of convergence time.
Buildings 13 01986 g008
Table 3. Constructions and theoretical thermal resistance of selected walls.
No.Wall TypeMaterial
(From Inside to Outside)
Thickness
[mm]
Theoretical Thermal Resistance
[m2/(K·W)]
1Brick wallCement mortar200.764
Red clay brick310
Cement mortar20
2Concrete wall with thin interior insulationCement mortar200.764
Extruded polystyrene board (XPS)20
Steel reinforced concrete200
Cement mortar20
3Concrete wall with standard interior insulationCement mortar202.703
XPS84
Steel reinforced concrete200
Cement mortar20
4Concrete wall with thick interior insulationCement mortar205.612
XPS180
Steel reinforced concrete200
Cement mortar20
5Concrete wall with thin exterior insulationCement mortar200.764
Steel reinforced concrete200
XPS20
Cement mortar20
6Concrete wall with standard exterior insulationCement mortar202.703
Steel reinforced concrete200
XPS84
Cement mortar20
7Concrete wall with thick exterior insulationCement mortar205.612
Steel reinforced concrete200
XPS180
Cement mortar20
Table 4. Thermophysical parameters of wall materials.
MaterialThermal Conductivity
[w/(m·K)]
Density
[kg/m3]
Specific Heat
[J/(kg·k)]
Cement mortar0.9318001050
Red clay brick0.431668754
Extruded polystyrene board (XPS)0.033291791.06
Steel reinforced concrete1.742500920
Table 5. Calculation formula and termination criteria of the proposed and average methods.
MethodThe Calculation Formula for Wall Thermal ResistanceTermination Criteria
Proposed methodEquations (6) and (8)Equations (16)–(18).
As the measurement period gradually increases, try increasing n and L to estimate the thermal resistance R ( n ,   L ) . The calculation stops at the first occurrence of R ( n ,   L )  that meets the above conditions.
Average method [6] R = j = 1 n ( t i n ,   j t o u t ,   j ) j = 1 n q j (1) The thermal resistance obtained at the time does not deviate by more than ±5% from the value obtained 24 h prior to it:
| R D T R D T 24 h R D T 24 h | 5 %
(2) The thermal resistance obtained from the first INT(2 × DT/3) days does not deviate by more than ±5% from the values obtained from the last period of the same days, where DT is the measurement duration (in days) from the start, and INT is a rounding function for the integer part:
| R I N T ( 2 × D T 3 ) , f i r s t R I N T ( 2 × D T 3 ) , l a s t R I N T ( 2 × D T 3 ) , l a s t | 5 %
Disclaimer/Publisher’s Note: The statements, opinions and data contained in all publications are solely those of the individual author(s) and contributor(s) and not of MDPI and/or the editor(s). MDPI and/or the editor(s) disclaim responsibility for any injury to people or property resulting from any ideas, methods, instructions or products referred to in the content.