1. Introduction
During the past several decades, the increasing energy consumption in the building industry has reached approximately 40% of the global energy consumption [
1]. This figure is expected to further increase due to demands for improved quality of life and population growth, which will require larger areas for urbanization [
2]. This growth model in the building industry has contributed to the depletion of energy resources and the exacerbation of global warming [
3]. However, over the last decade, the industry has undergone a paradigm shift, with growing environmental awareness and recognition of the issues related to energy efficiency and environmental impacts [
4]. Therefore, buildings play a key role as their passive design, which adapts to local climatic conditions and minimizes the use of mechanical systems for climate control, is crucial in reducing the energy demands of buildings without compromising the comfort of their indoor environments [
5,
6].
Vernacular buildings are constructed using local materials and designed with passive strategies, allowing them to adapt to the local climate. Due to the economic limitations of their owners and the thermal adaptability of their spaces, residents rely on the building’s passive capacity for thermal comfort [
7]. There are various typologies of vernacular buildings according to the climate and region of implementation, which serve as useful examples for the achievement of sustainability through architectural design and reducing the reliance on artificial climate control and its subsequent energy [
5,
8,
9,
10]. Currently, some scholars and researchers are investigating how vernacular techniques and materials can play a decisive role in creating more sustainable and energy-efficient buildings [
11,
12]. Therefore, knowledge of vernacular construction could be relevant not only for the conservation and restoration of existing heritage buildings but also for the construction of new sustainable and resilient buildings in the future [
9].
Despite the growing interest in energy simulations and quantitative results, few studies have focused on this area. One such study focused on vernacular housing in the village of Xinye, China, conducted by Gou et al. [
8]. The study demonstrated that annual thermal comfort simulations could be obtained with the support of the EnergyPlus simulation engine, using on-site monitoring and data collection over short periods of time. Additionally, the study identified passive strategies implemented in the building that improved the thermal comfort during hot summers, although they were less effective during cold winters. Similarly, the study by Cardinale et al. [
11], focused on the energy and indoor comfort of vernacular architecture in Sassi and Trulli (Southern Italy), experimentally analyzed a dwelling in each site through the interior and exterior monitoring of environmental parameters, the in situ measurement of material properties, and simulation using EnergyPlus. This analytical methodology demonstrated that the experimental phases and subsequent simulation are crucial for buildings characterized by uncertainty and complexity. Numerical simulations of the annual thermal performance of the dwellings were obtained, indicating that the buildings did not require air conditioning during summer and that simple heating systems could ensure comfort levels during winter.
Another study aimed to analyze the site-specific strategies, thermal performance, and comfort conditions of a vernacular building in Southern Portugal. This was achieved through both objective and subjective indoor measurements taken for one day per season and long-term outdoor measurements. This study demonstrated the effective thermal performance achieved solely through passive strategies during periods of heat waves [
4].
This research focuses on an existing vernacular dwelling in the city of Azogues, Ecuador. It involves environmental monitoring, in situ measurements, and dynamic simulations to collect data on the house’s indoor thermal performance. Using the EnergyPlus engine, simulation results are obtained and used to evaluate the effectiveness of the passive design strategies inherent in this type of building, which can be applied to new buildings in order to achieve sustainability [
13,
14].
1.1. Research Site
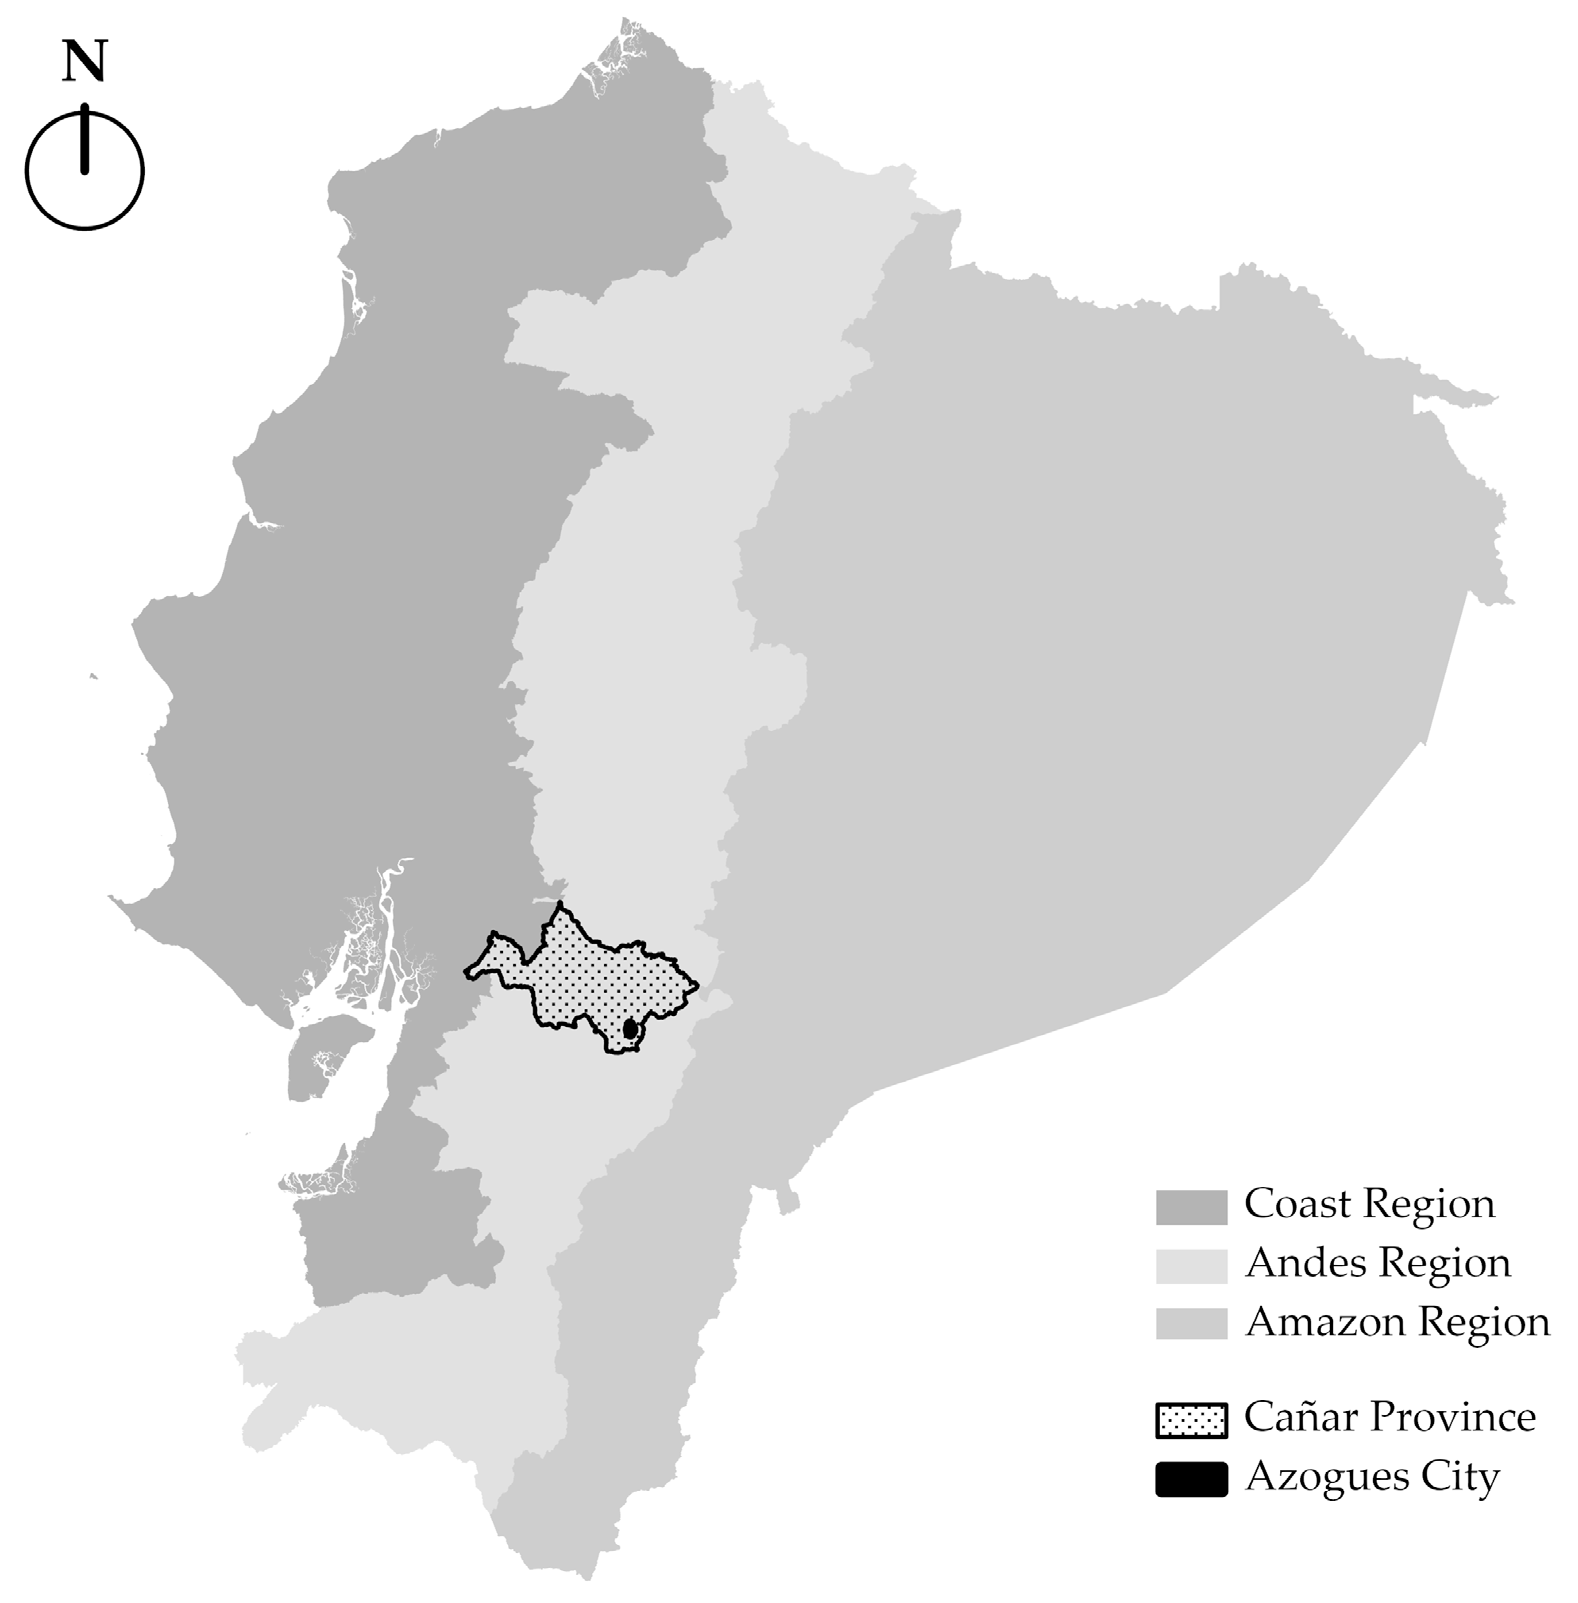
The case study of this investigation is a vernacular house located in the Historic Center of the city of Azogues (
Figure 1), in the southern inter-Andean region of Ecuador (−2.73969, −78.8486), with an altitude of 2518 masl (meters above sea level). Azogues has been recognized as a cultural and urban heritage site in Ecuador since 31 October 2000. The city is bounded to the north by the provinces of Chimborazo and Morona Santiago, to the east and south by the province of Azuay, and to the west by the cantons of Déleg and Biblián. The area of study was selected due the historical and cultural importance of the city, as well as the potential for this vernacular architecture to guide sustainable design strategies for new buildings.
The central subject of this research is a vernacular house with a central courtyard typology. The courtyard is used as a central axis upon which other spaces of the building are distributed. The adjacent orchard provides a space for outdoor activities throughout the different seasons of the year. Factors such as air temperature, relative humidity, and wind speed significantly impact the comfort and well-being of its residents; therefore, this research examines the correlation between the passive design strategies utilized during the building’s construction and its response to weather conditions. This house, along with others, has played a significant role in the declaration of the area as a cultural heritage site. Consequently, it is crucial to examine this traditional model from the perspective of passive design strategies. Previous research has shown that incorporating vernacular architecture is vital in achieving sustainability in contemporary architectural practices. Furthermore, studying and analyzing such architectural styles can provide a viable approach for the upcoming generation of architects to promote sustainable design [
15].
1.1.1. Weather
The city of Azogues is surrounded by several hills, such as Blanca, Chavay, Toray, San Pedro, Shigshiquin, Guabzhumbuil, and the Cojitambo and Abuga hills. The Burgay River forms a natural semicircle, creating a highly scenic backdrop that defines the silhouette and physiognomy of Azogues. Additionally, the group of ravines, such as the Shirincay and the banks of the Tabacay River, located within the urban area, hold significant potential as tourist attractions. These natural features contribute to an environmental framework that ensures the future quality of life of the population in a sustainable and high-quality environment. It is worth noting that these natural elements possess extraordinary historical, cosmogonical, and totemic value, as each of them serves as a religious and worship center, which are fundamental to the Cañari cosmogony and the city’s cultural identity.
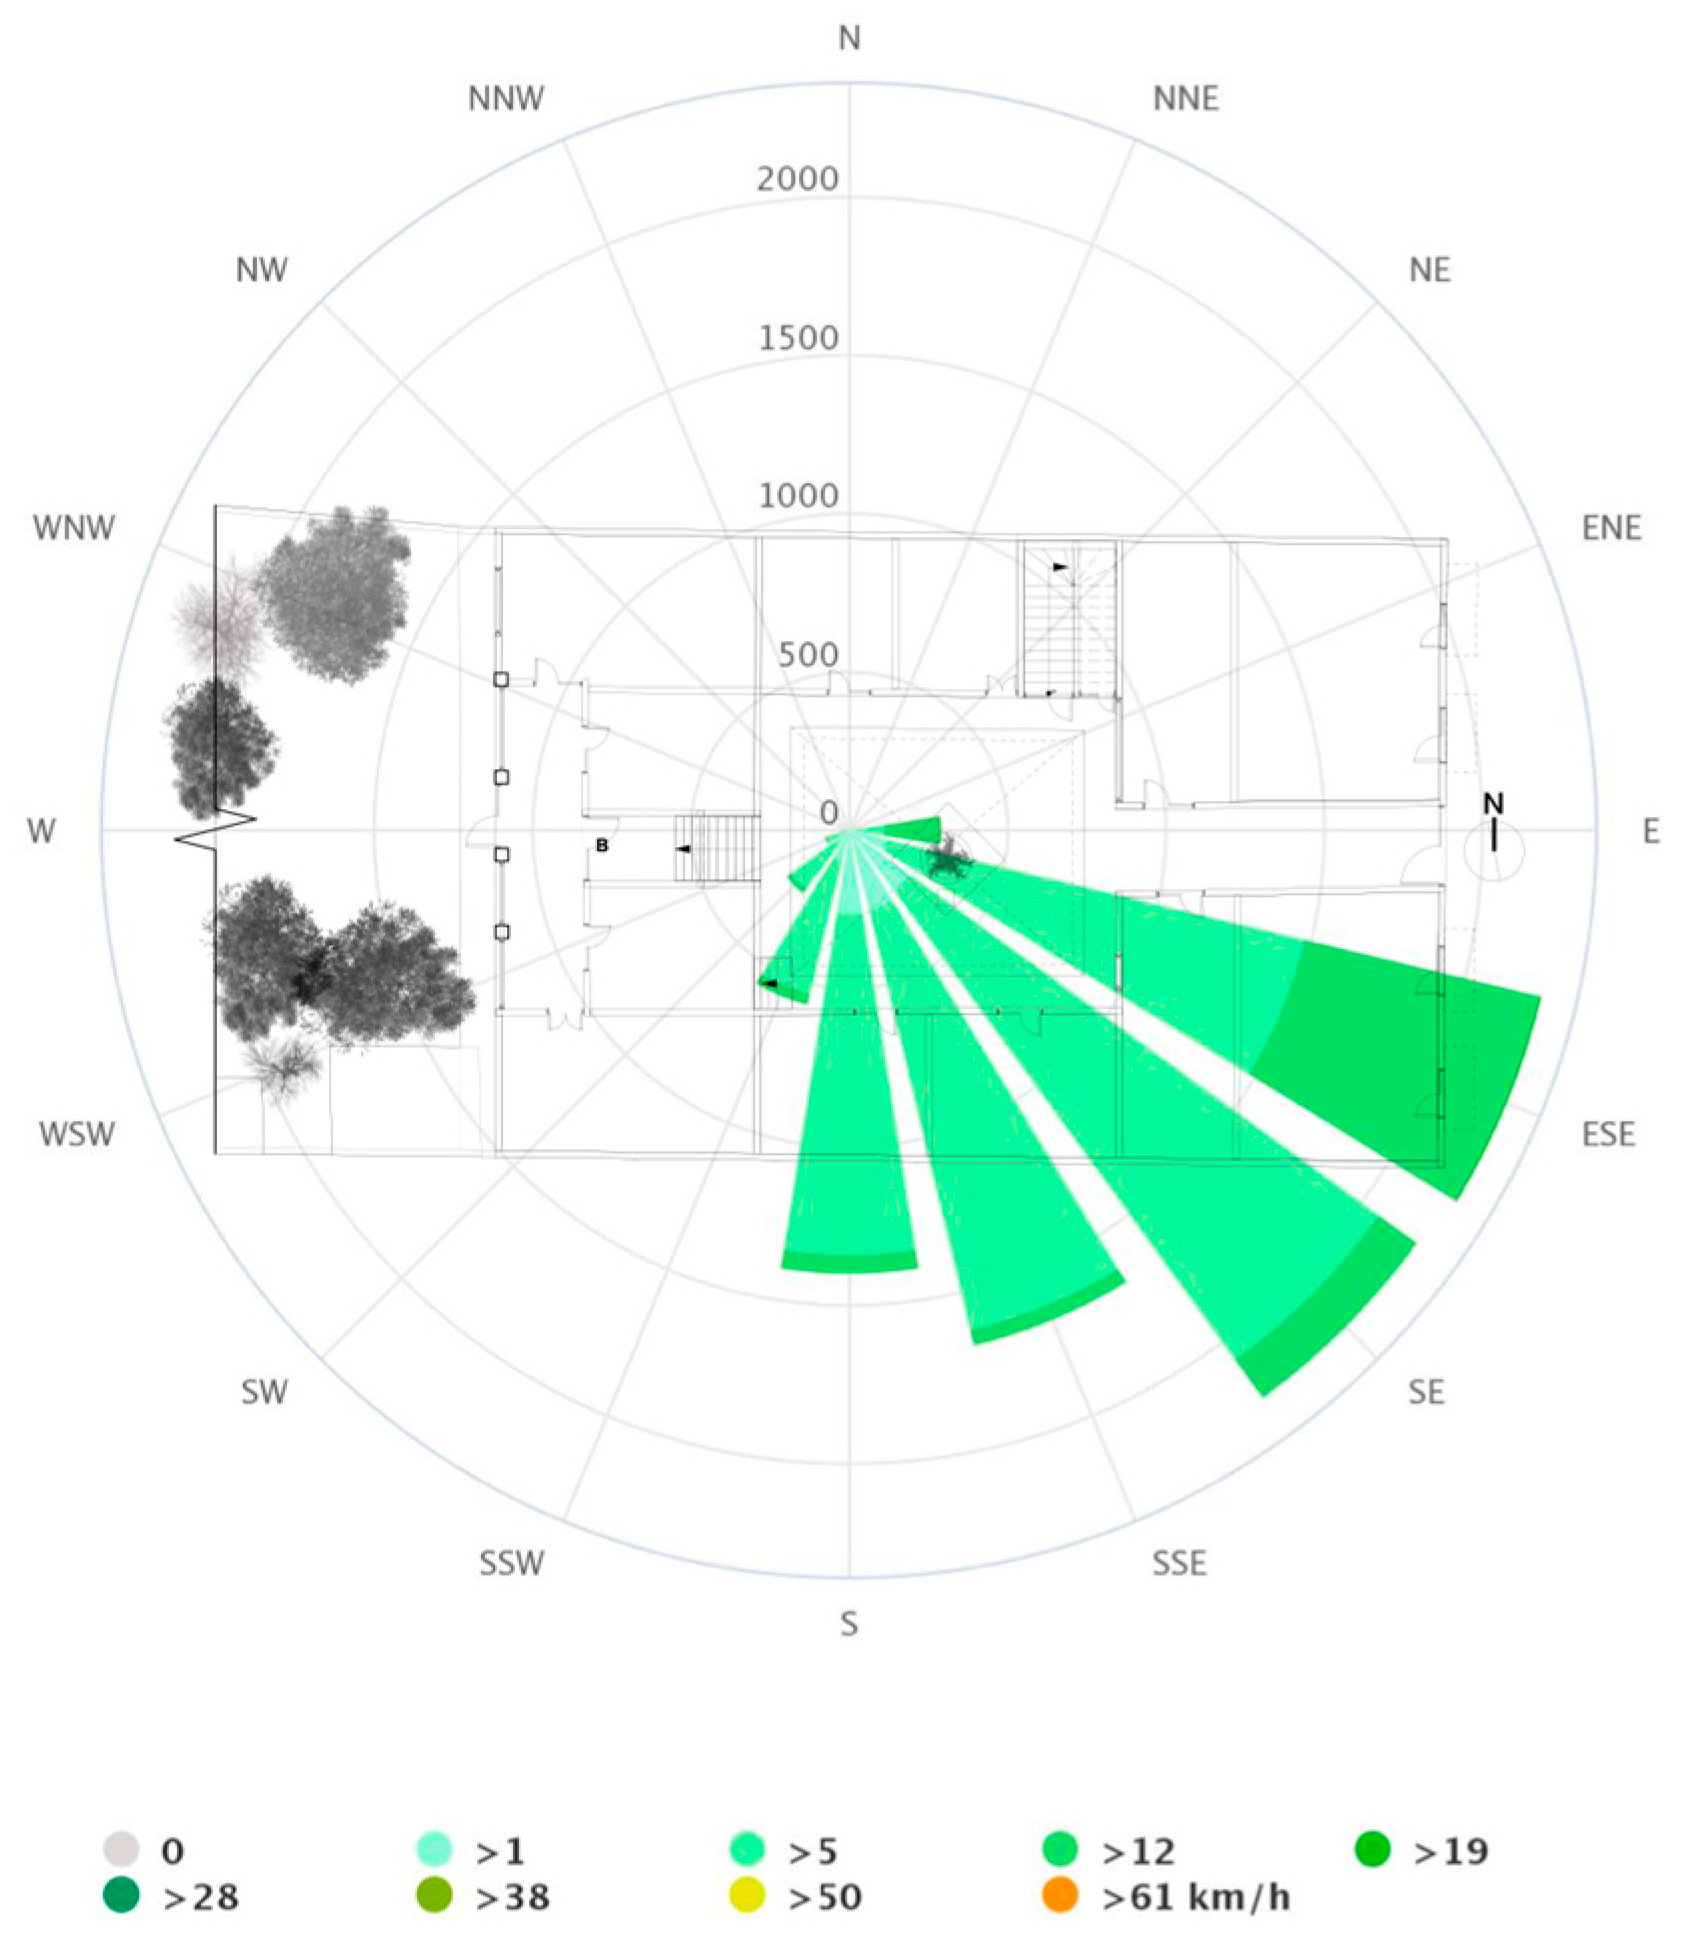
The climate of Azogues is strongly influenced by its natural surroundings. The prevailing wind blows from the east year-round (
Figure 2). The windiest month in Azogues is July, with an average wind speed of 15.3 km per hour, while the calmest month is November, with an average wind speed of 6.8 km per hour [
16]. The city’s northward orientation can benefit from natural ventilation.
Table 1 presents the climatic data for Azogues. The monthly average temperature peaks at 13 °C in March and April and drops to 8 °C in July and August. The month with the highest rainfall is March, with average precipitation of 94.8 mm, while the month with the lowest rainfall is August, with an average of 23.10 mm.
In terms of the duration of the day, there is no significant variation throughout the year, with an only 17-min variation in 12 h. For the year 2022, it was found that the shortest day was June 21st, with 11 h and 58 min of natural light, while the longest day was December 21st, with 12 h and 17 min of natural light.
1.1.2. Description of the Traditional Dwelling
On 31 October 2000, Azogues was designated as one of Ecuador’s 38 cities recognized as heritage sites due to its remarkable architectural, urban, and scenic qualities. In order to achieve this distinction, a total of 135 real estate assets that contributed to the region’s religious and civic architectural heritage, as well as eight urban architectural complexes that possessed notable formal, constructive, and typological features, were inventoried.
The Ministry of Education and Culture’s 2000 report on the declaration of Azogues as a heritage site reveals that the buildings date back to the late 19th and early 20th centuries [
18].
1.1.3. Typologies of Traditional Houses
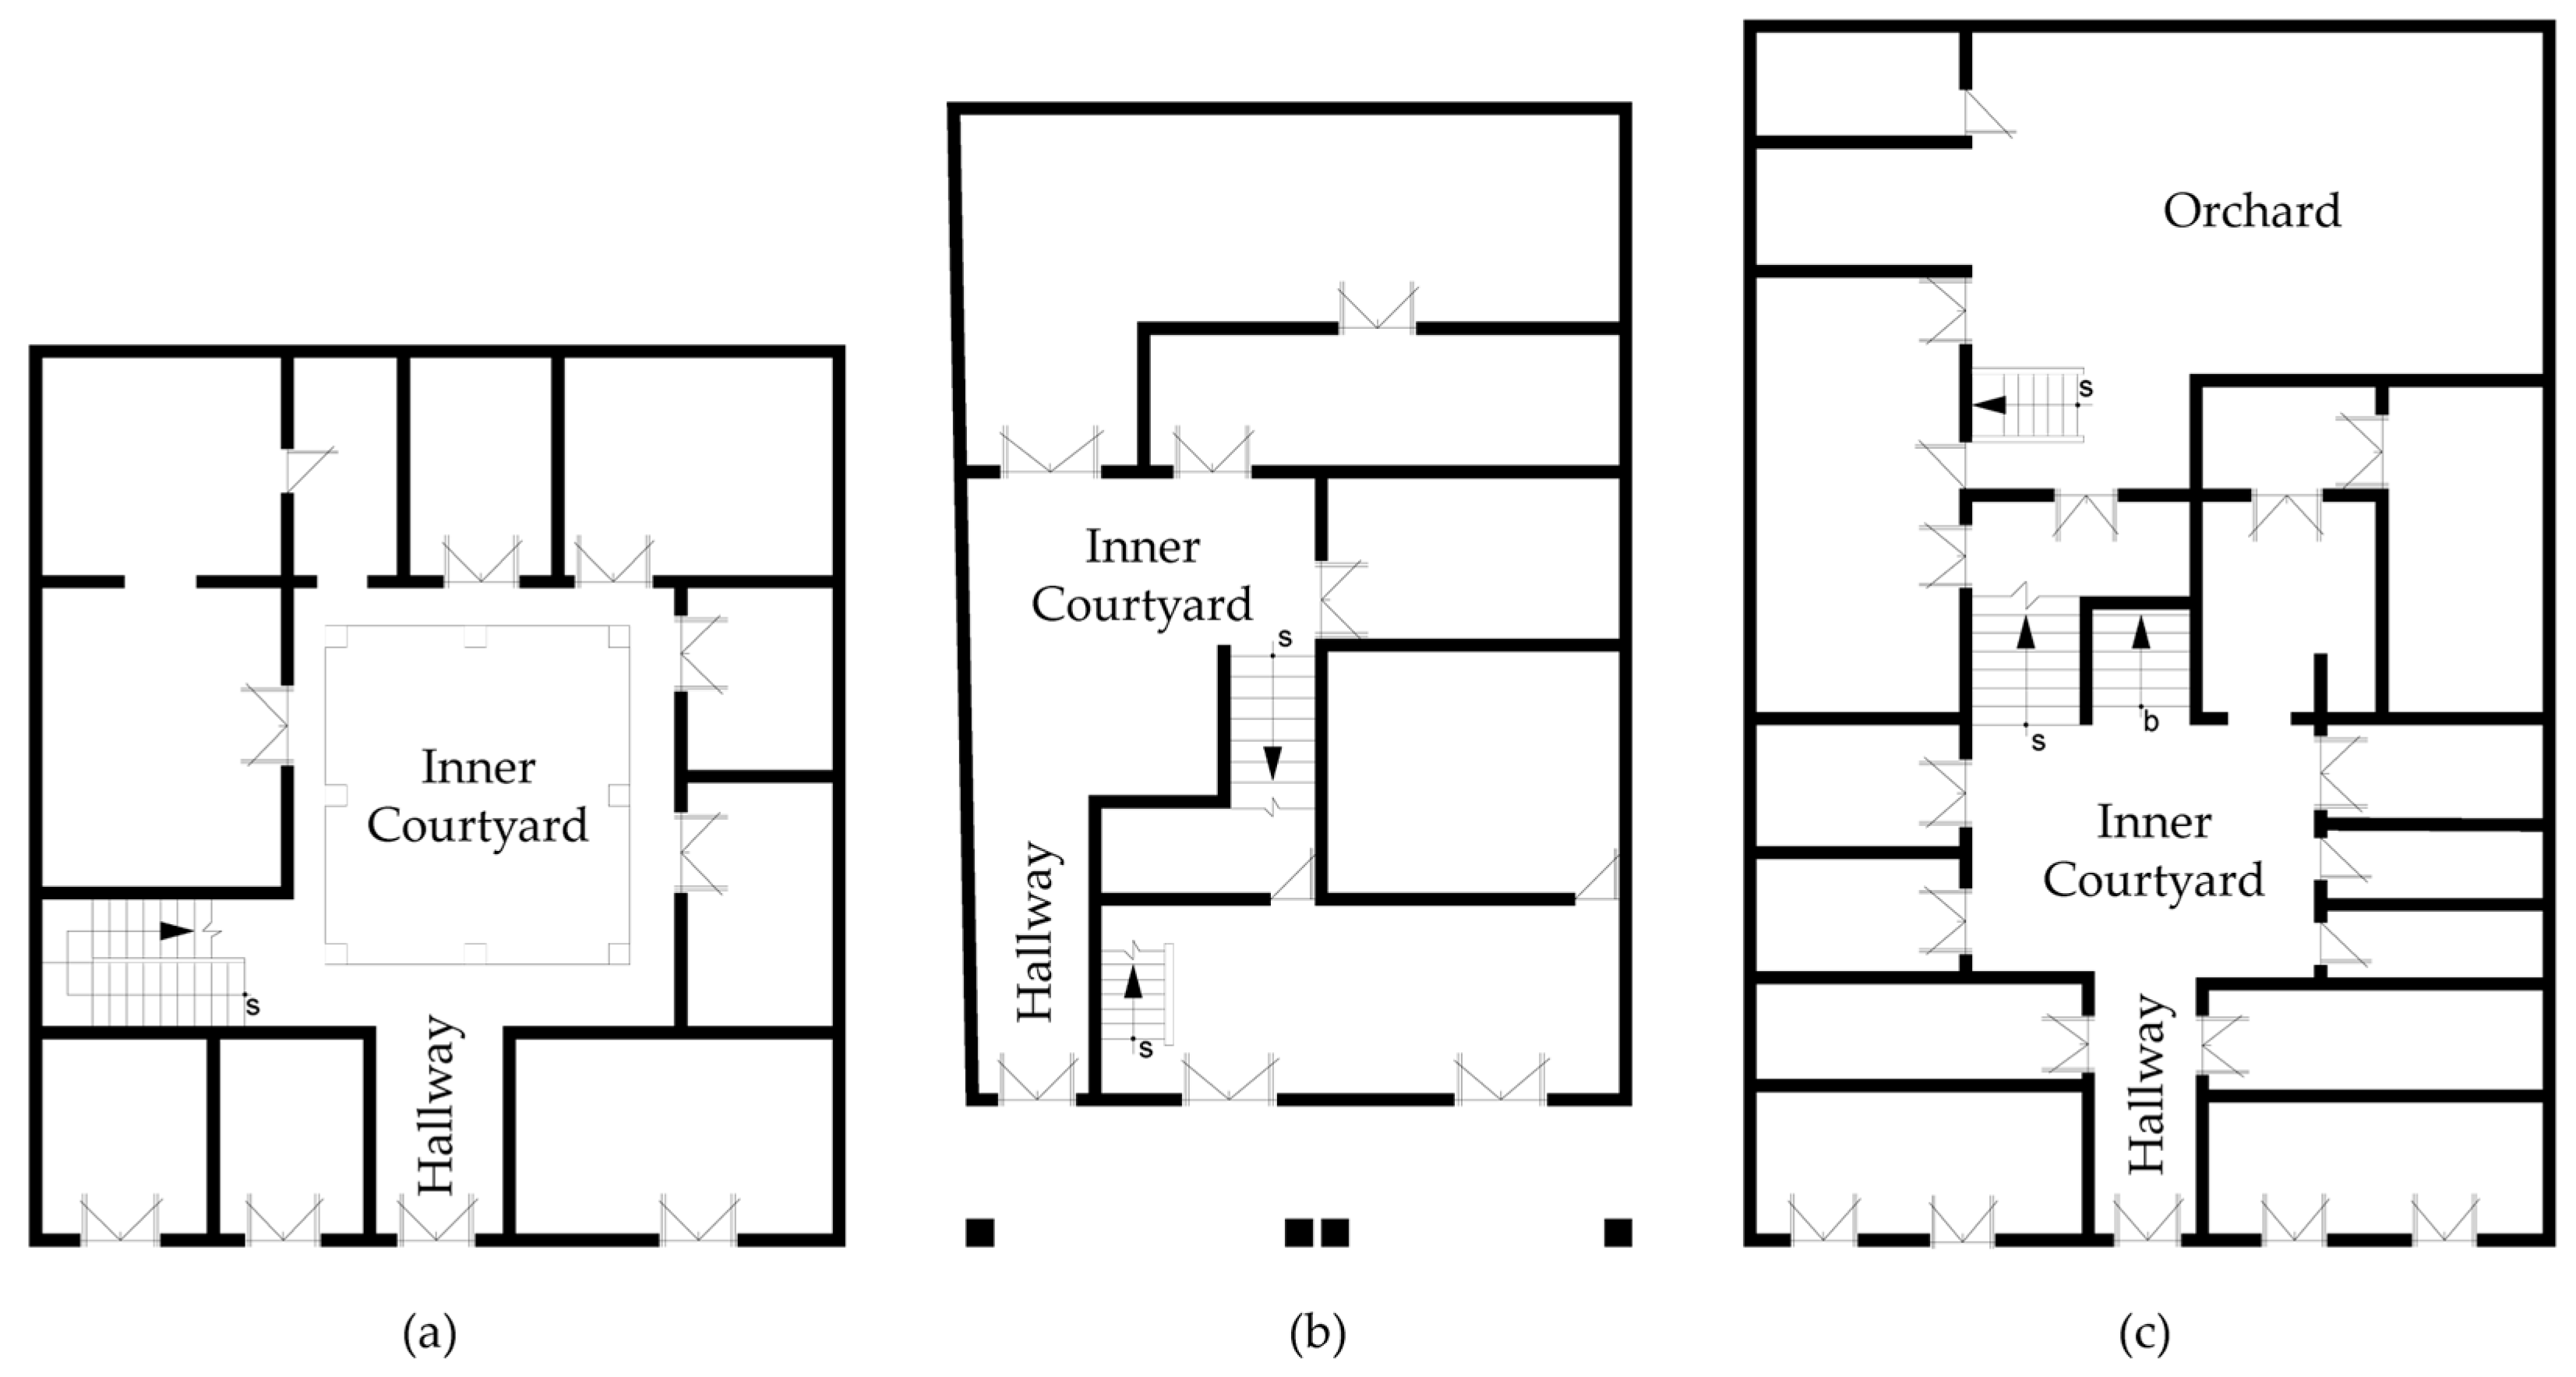
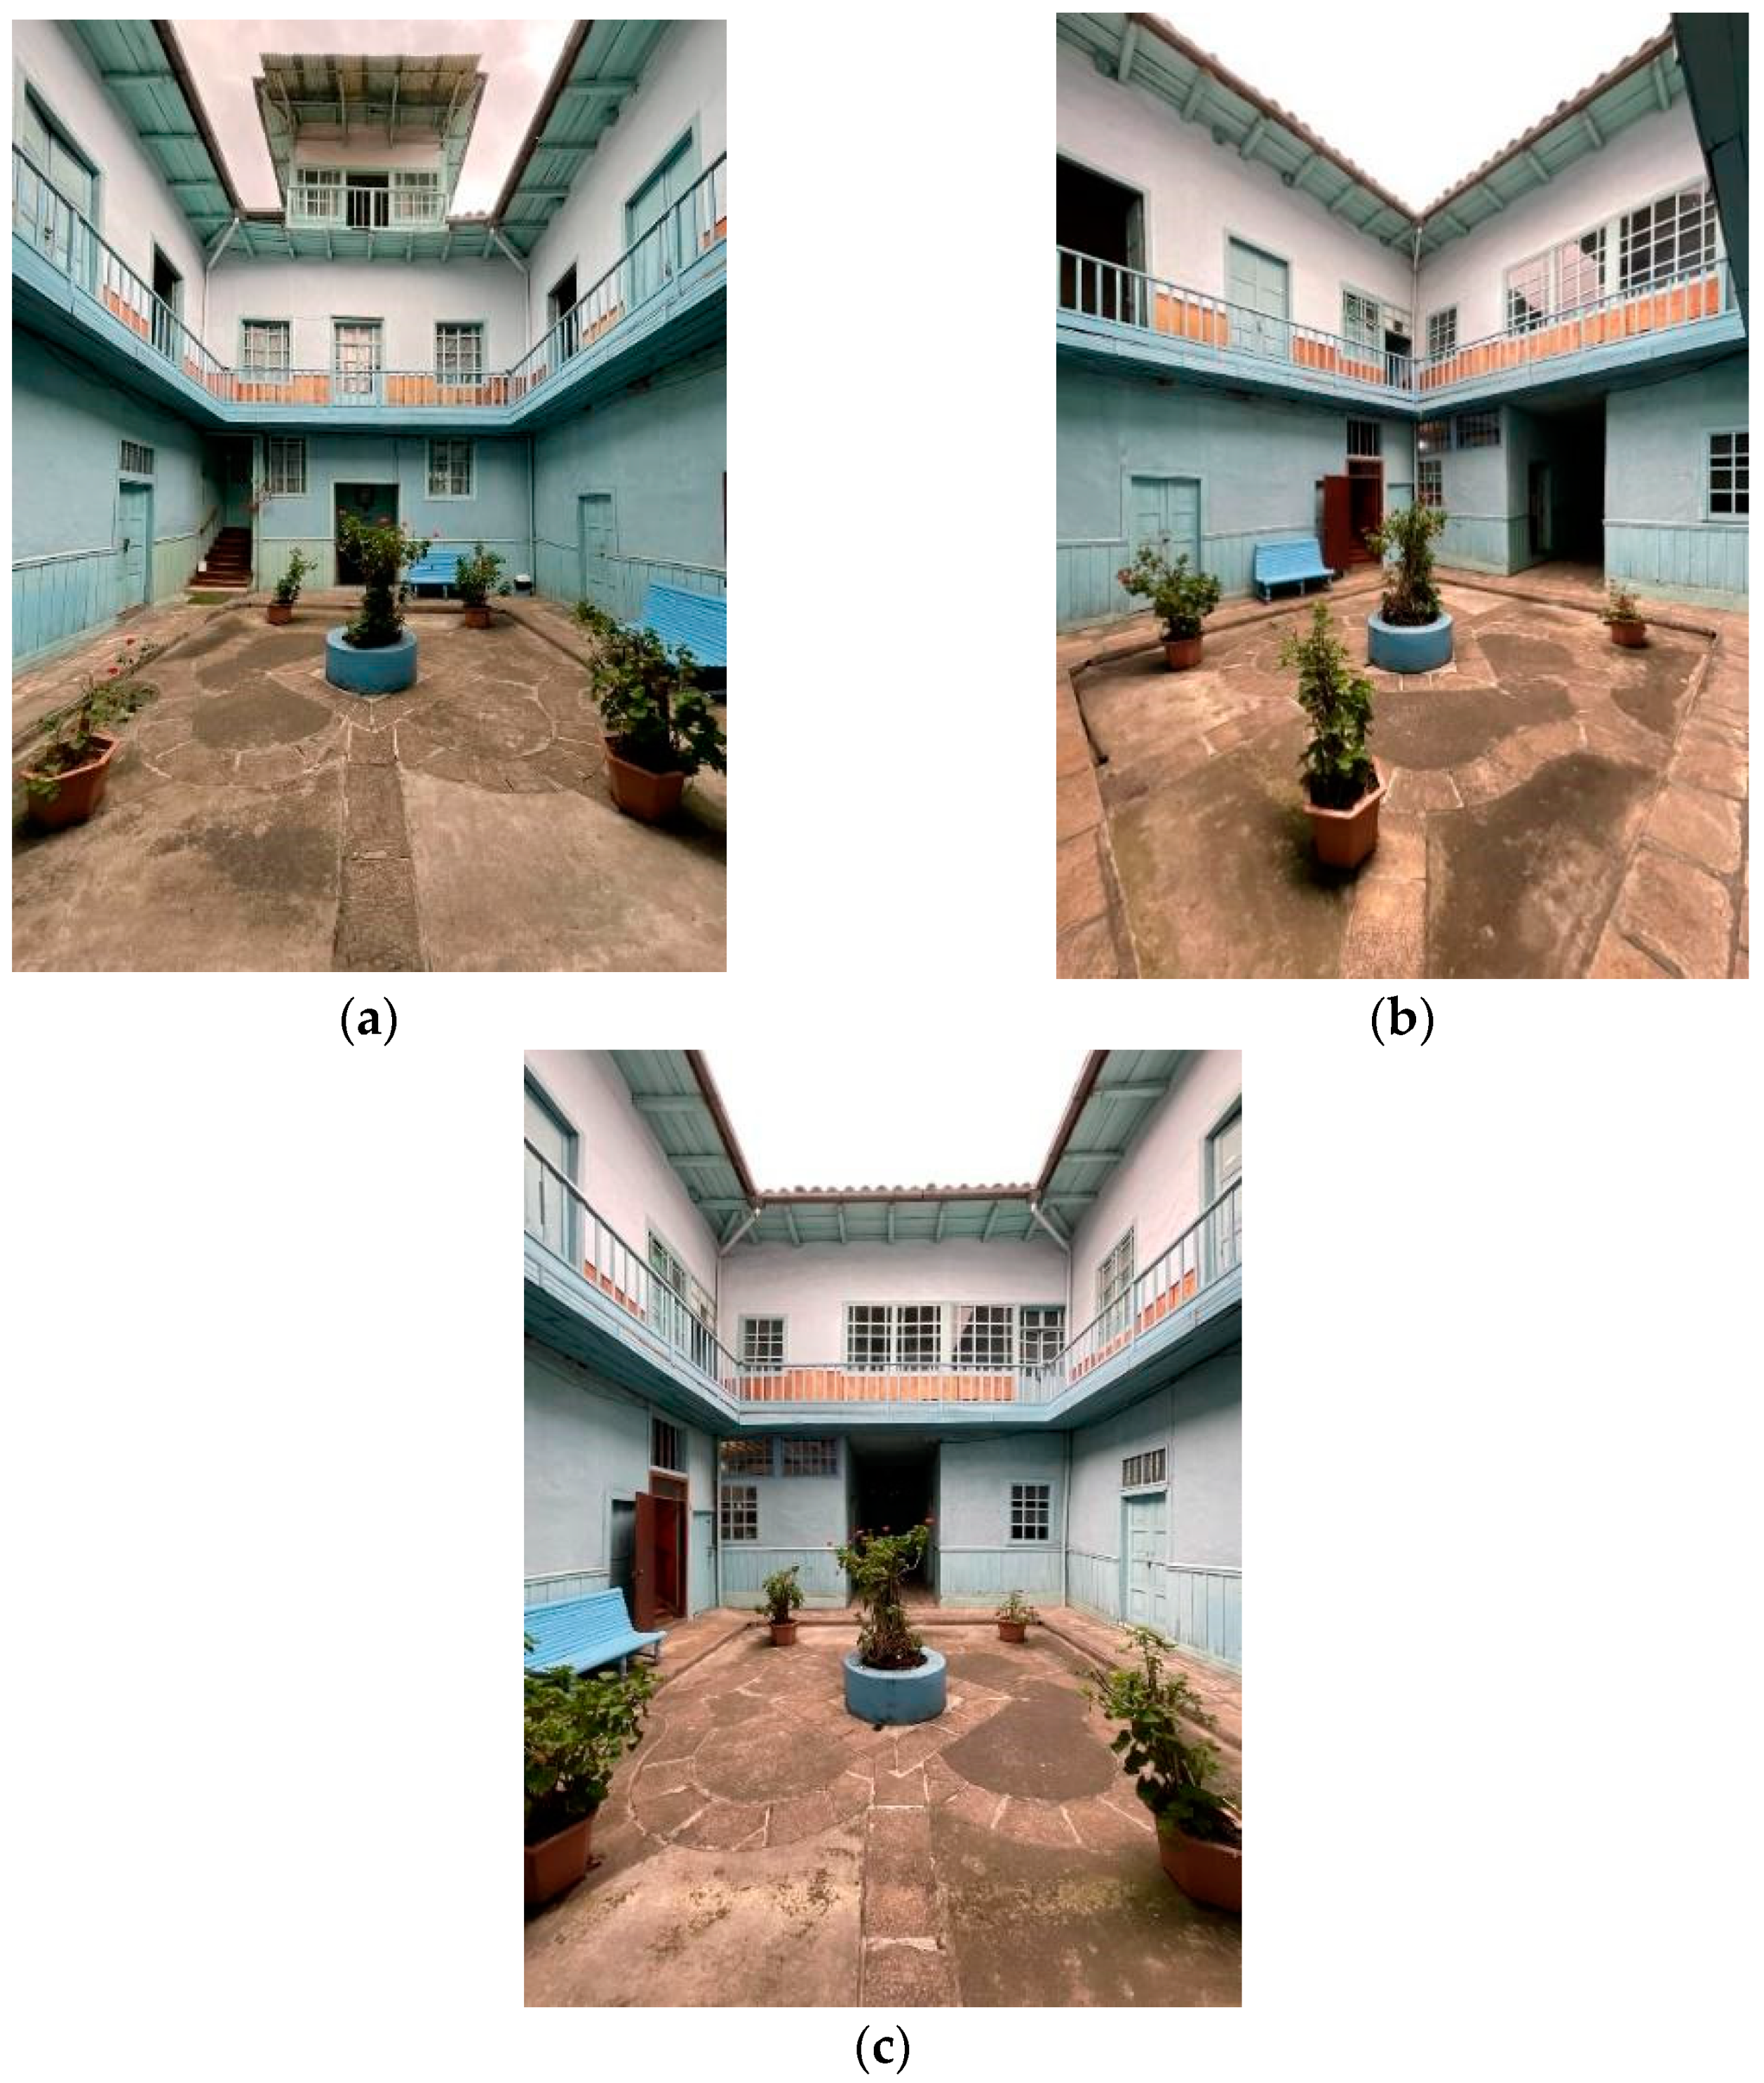
One of the architectural forms of the traditional buildings existing in the city of Azogues, as shown in
Figure 3a,c, is the house with a “central courtyard,” which recalls or commemorates the cities conquered by the Spanish since their urban organization was based on the “Plaza Mayor.” Other typologies of traditional houses are in the shape of an “L,” since the courtyard is displaced to one side of the land, thus providing access to the house through a corridor (
Figure 3b). All spaces around the courtyard are generally composed of two floors.
Ground floors are typically dedicated to commercial activities and have a direct connection to the street and interior courtyard. However, there are also completely independent commercial spaces that suggest that they were intended for rent. The living and dining rooms are the main spaces where people socialize and gather. They are also used for special events at different times of the year.
Most buildings with “courtyards” function as “light wells”—a central or lateral area connecting the main entrance to the courtyard. Due to the city’s topography, subsurface areas are often generated, which require strong retaining walls composed of river stones and structural solutions using wood [
18].
Buildings with a “central courtyard” were typically owned by affluent families. It was common for such houses to have monoculture gardens and fruit trees at the rear of the property, similar to the case study for this research (
Figure 3c). These areas provide an opportunity for inhabitants to switch their outdoor activities to different locations throughout the various seasons of the year.
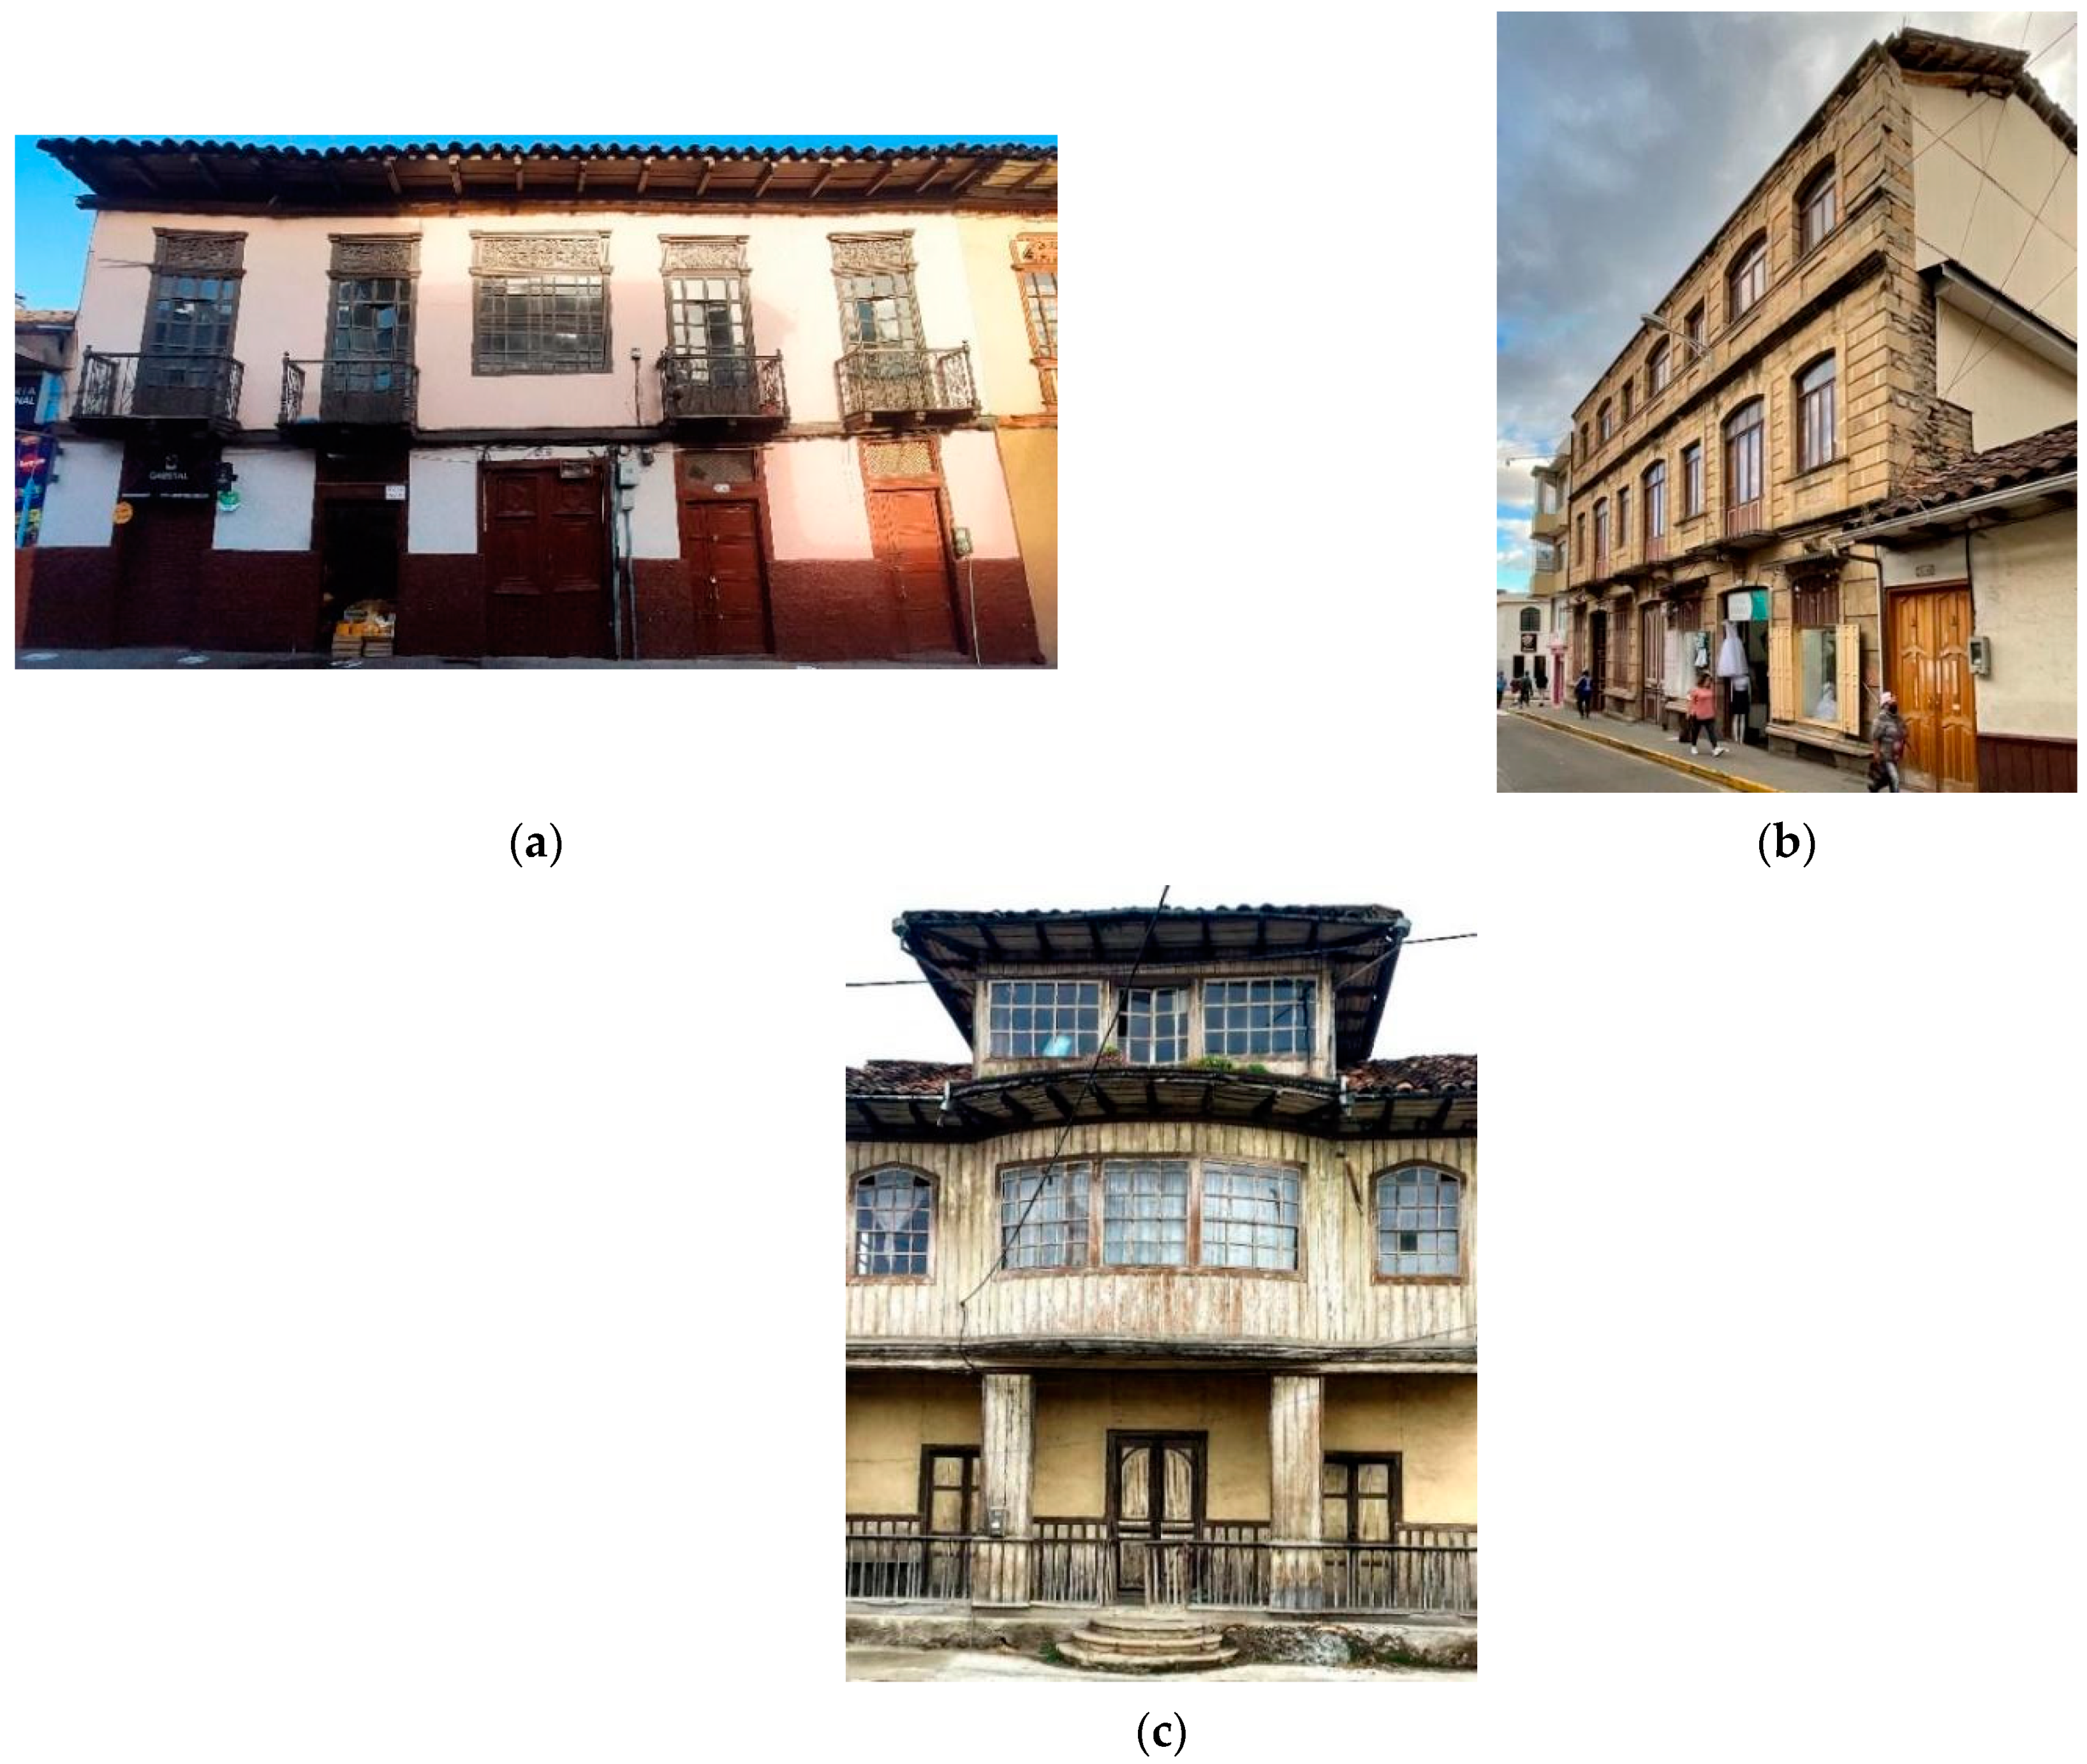
Residential buildings in Azogues commonly use bahareque walls, a building system that protects the interior environment from climatic variations throughout the year (as shown in
Figure 4a). The external walls also utilize this technology, with some facades constructed with stone (as shown in
Figure 4b) and wood (as shown in
Figure 4c). The combination of envelope systems and a tilted roof constructed with wood and clay tiles enhances the building’s thermal insulation properties. The traditional dwelling depicted in
Figure 4a, which is the focus of this study, has an external envelope with a thickness of 17 cm and internal walls of equal thickness. As detailed in
Section 4, on-site measurements were conducted to assess the thermal performance of the building envelope. The analysis of the collected data revealed that this particular envelope system effectively reduces the effects of severe weather conditions on the interior thermal comfort.
The main facade’s wall is composed of “bahareque.” Bahareque is the name of a construction system for houses, in which sticks, canes, reeds, “cabuya,” and mud are used. The main wall plays a very important role as the closure of the building, which is commonly decorated with wooden slats that highlight the plinth but are also used in other parts of the façade, such as the window sills. The levels of the building are differentiated with the use of very simple borders, and the window openings are framed with wood moldings topped with perforated wooden or brass plates.
Most of the houses’ interior walls are also built of bahareque, resting on a foundation composed of rounded stones that transmit the load of the construction to the ground. Mud mortar is commonly used as a coating, and a refined layer is applied to both the outer and inner surfaces of the wall, enhancing its aesthetic appeal. The tilted roofs of the houses are usually composed of wood and are generally covered with handmade burnt clay tiles.
1.1.4. Openings’ Design
In Azogues, the placement of building openings such as windows and doors disregards the local climatic conditions, specifically the dominant wind directions. The majority of dwellings in the area feature windows positioned on the primary facades, typically spanning from floor to ceiling and divided into multiple sections, which are complemented by balconies lacking corbels and bearing wrought iron or wooden balusters. As the local wind predominantly comes from the east, windows improve the natural ventilation, particularly in buildings oriented towards the windward side. Furthermore, a notable window-to-wall ratio is another feature of passive building design that can enhance the thermal performance of the structure.
Figure 5a illustrates that the bedrooms and commercial spaces located towards the main street lack windows. It can be noted that the main entrance door of the dwelling has significant height in comparison to the other doors of the building and is located in the center of the main facade, which also helps to improve the natural ventilation conditions within the dwelling.
1.1.5. The Buffer Space
The traditional homes in Azogues are characterized by an inner courtyard, a space that is connected to the exterior through an alleyway (zaguán) and to the other internal spaces, providing a feeling of comfort. The courtyard is designed with the intention of facilitating movement and promoting air circulation within the building. The presence of a fountain further aids in cooling the air, contributing to an improved climatic environment in this specific area of the residence. The courtyard can also be considered an open buffering space that directly influences the natural ventilation and lighting in the building, contributing to protecting the interior spaces from strong solar radiation [
19]. Semi-open spaces such as galleries and “zaguáns,” which connect the interior and exterior areas of the home, can be crucial to the effectiveness of natural ventilation.
2. Materials and Methods
The research’s methodological design was based on Gou et al. [
8], who proposed an experimental investigation grounded in the case study approach. This approach involved analyzing the construction technique of the building within the context of its normal use and occupancy. Direct observations were performed of the object of study in its context, with the aim of obtaining the maximum amount of information in situ. In this study, equipment was used to record data on the wind speed, relative humidity, wind direction, and the envelope’s temperature. The measurements of the outdoor environmental parameters were correlated with the indoor comfort parameters, considering the following comfort ranges: air temperature 17–22 °C, relative humidity 40–65%, and air velocity <0.2 m/s [
20].
For the research’s development, electronic measuring instruments that met the requirements of objectivity, validity, and reliability were used, such as HOBO for data collection on temperature and relative humidity, Testo 435 to obtain data on the surface temperature of the building envelope, and Anemometer Testo 435 to measure the wind speed. Templates were developed for data tabulation and figure creation for data processing.
Based on previous studies on this topic, the following four-stage methodological design was proposed for the case study.
Stage 1—Selection and Planimetric Survey of the House: The research began with the selection of a house through the review of existing documentation on the inventory of heritage properties in the city of Azogues, based on the following criteria.
A habitable house with traditional vernacular characteristics and a spatial organization typology consisting of a central courtyard and garden.
The house should not have been renovated and should maintain its original spatial characteristics and construction systems.
To assess the interior thermal environment, on-site monitoring provides accessibility, while energy simulations enable the evaluation of the building’s performance.
Once the house was selected, a visit was made to verify its physical–spatial characteristics, to validate the reasons that it was included in the inventory as a heritage property. Subsequently, the owners of the property were approached to request their authorization for the planimetric survey of the house and the placement of the registration equipment inside it.
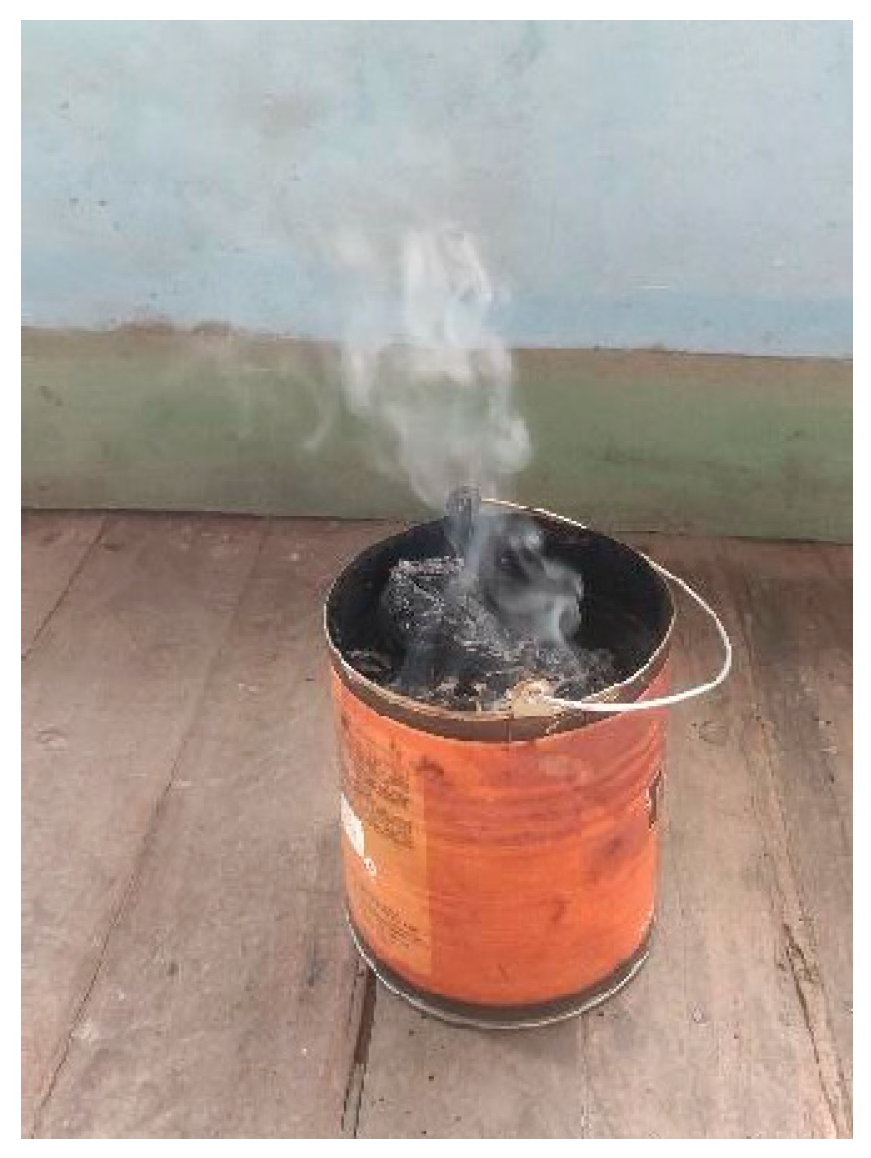
Stage 2—Data Collection In Situ: Data collection was performed by installing equipment in different areas of the building, such as the HOBO U12 Temp/RH. Data loggers were utilized to measure and record the temperature and relative humidity, wind speed (Testo anemometer), surface temperature of envelope materials (Testo 635 surface thermometer), and wind direction (smoke tracers).
Stage 3—Data Processing: The data from Stage 2 were used to generate tables and figures for the analysis and comparison of the different monitored environments and their behaviors in response to local climate phenomena.
Stage 4—Evaluation of the Thermal Performance of the Building: The thermal performance was evaluated using the software SketchUp for modeling and the open-source software Open Studio with EnergyPlus for simulation. The model was validated with the monitored data collected from different points within the building to determine its annual thermal performance.
2.1. Description of the Studied Dwelling
The building was constructed in 1910 and it has preserved its original form, and no alterations or modifications have been observed throughout the years. The house inherited construction techniques and design methods that were passed down from generation to generation. It is one of the most typical house designs in Azogues, consisting of a central courtyard and garden oriented towards the east, with four galleries in which the different spaces are distributed. The areas designated for the living and dining rooms are located on the upper floor of the building, in the gallery that faces the main street (
Figure 5c). The monitoring of the thermal comfort data primarily focused on the various galleries present within the dwelling, as they exhibit climate-sensitive characteristics.
The gallery facing west (
Figure 5a) is topped by a lookout that is accessed through a staircase located on the rear facade of the building.
The selected house (
Figure 6) includes surrounding corridors to the central courtyard on both the ground and upper floors, in such a way that the interior spaces benefit from natural lighting. Resting areas such as bedrooms are arranged on the north and south sides of the building. The basic idea of the courtyard consists of forming an enclosed space protected from the outside, where it is possible to control the climate, creating a differentiated, regular, and daily cyclic microclimate that benefits the house [
21], providing the bedrooms with optimal cross-ventilation. Furthermore, the strategic placement of rooms on the north and south sides of the building adds an additional benefit from the shade, effectively reducing the direct solar heat gain during hot periods.
2.2. Experimental Setup
The experimental setup was based on the methodology introduced by Gou et al. (2015) [
8]. The thermal comfort monitoring was conducted from 2nd July 2022 to 3 July 2022, which is the month in which Azogues city experiences the lowest temperatures of the year, ranging from 6 °C to 10 °C. The monitored data encompassed the air temperature, relative humidity, wall surface temperature, and wind speed. A HOBO data logger was employed to automatically capture air temperature and relative humidity data at 10-min intervals. Wall surface temperature and wind speed data, on the other hand, were manually collected once per hour throughout the evaluation period. The technical specifications of the data collection instruments utilized are provided in
Table 2. It is worth mentioning that the equipment employed was certified by the manufacturer.
2.3. Measurement Areas
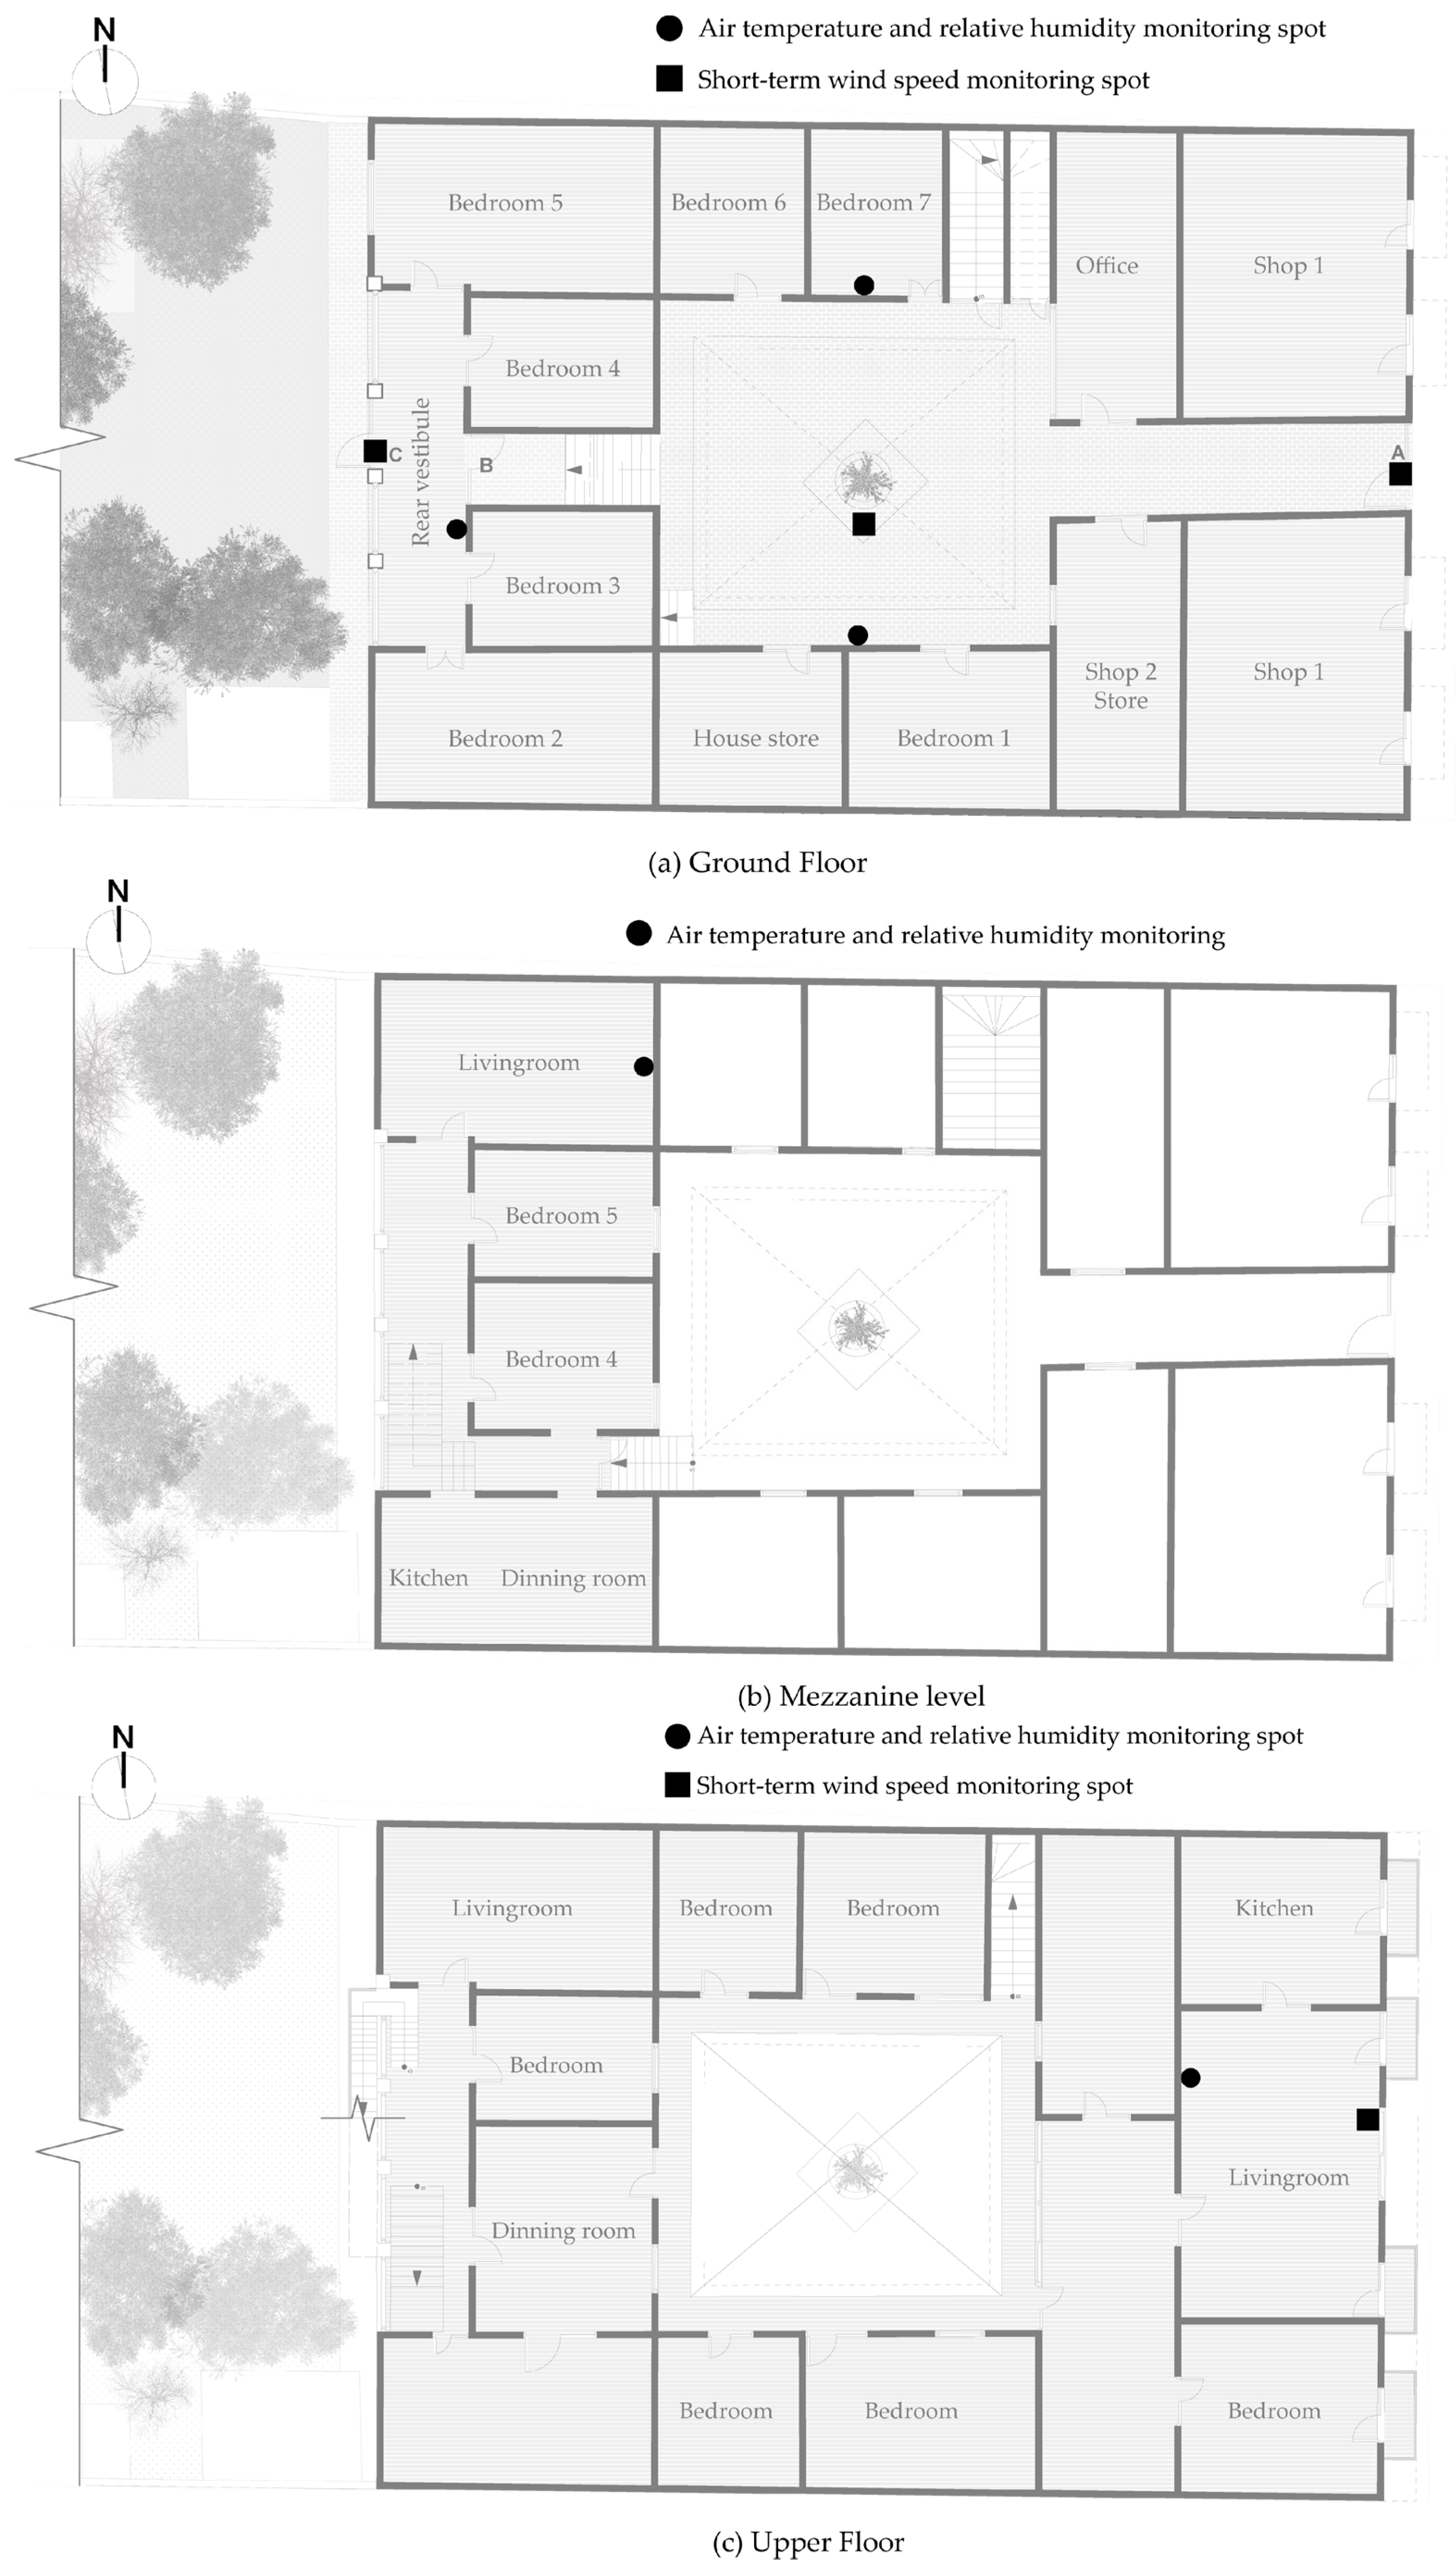
Figure 6 shows the five locations within the house that were selected for the monitoring of the air temperature and relative humidity: bedroom 7, the central courtyard, the rear vestibule facing the garden, the mezzanine room, and the main living room. All measurement points were established at a height of 1.5 m above ground level. Suitable devices were employed to record exterior data throughout the measurement period. The surface temperatures of the monitored building envelope in bedroom 7 of the north gallery are not identified in
Figure 6. Data collection points were positioned 1.5 m above ground level at the center of both the external and internal surfaces of the walls.
Two methods were employed to measure the wind speed. The first one involved placing a recorder in the gallery situated in the eastern part of the building, near the window of the living room. Data were manually recorded every hour to determine the wind direction using smoke tracers simultaneously. The second method comprised conducting short-term measurements at three distinct points, as illustrated in
Figure 6 (central courtyard, doors A and C), to understand the natural ventilation behavior of the house.
A summary of the experimental conditions for short-term data monitoring is presented in
Table 3. Wind speeds were manually measured and recorded at consistent intervals of 30 s, while smoke tracers were synchronously employed to determine the wind direction.
3. Results and Discussion
3.1. Indoor Environment Monitoring
Measurements of speed were taken three times during the day at short intervals, with the purpose of evaluating the building’s natural airflow and ventilation. The wind direction was recorded using smoke tracers located at the points indicated in
Figure 6, simultaneously. The experiments, their conditions, and the locations of the sensors for wind speed data collection are described as follows.
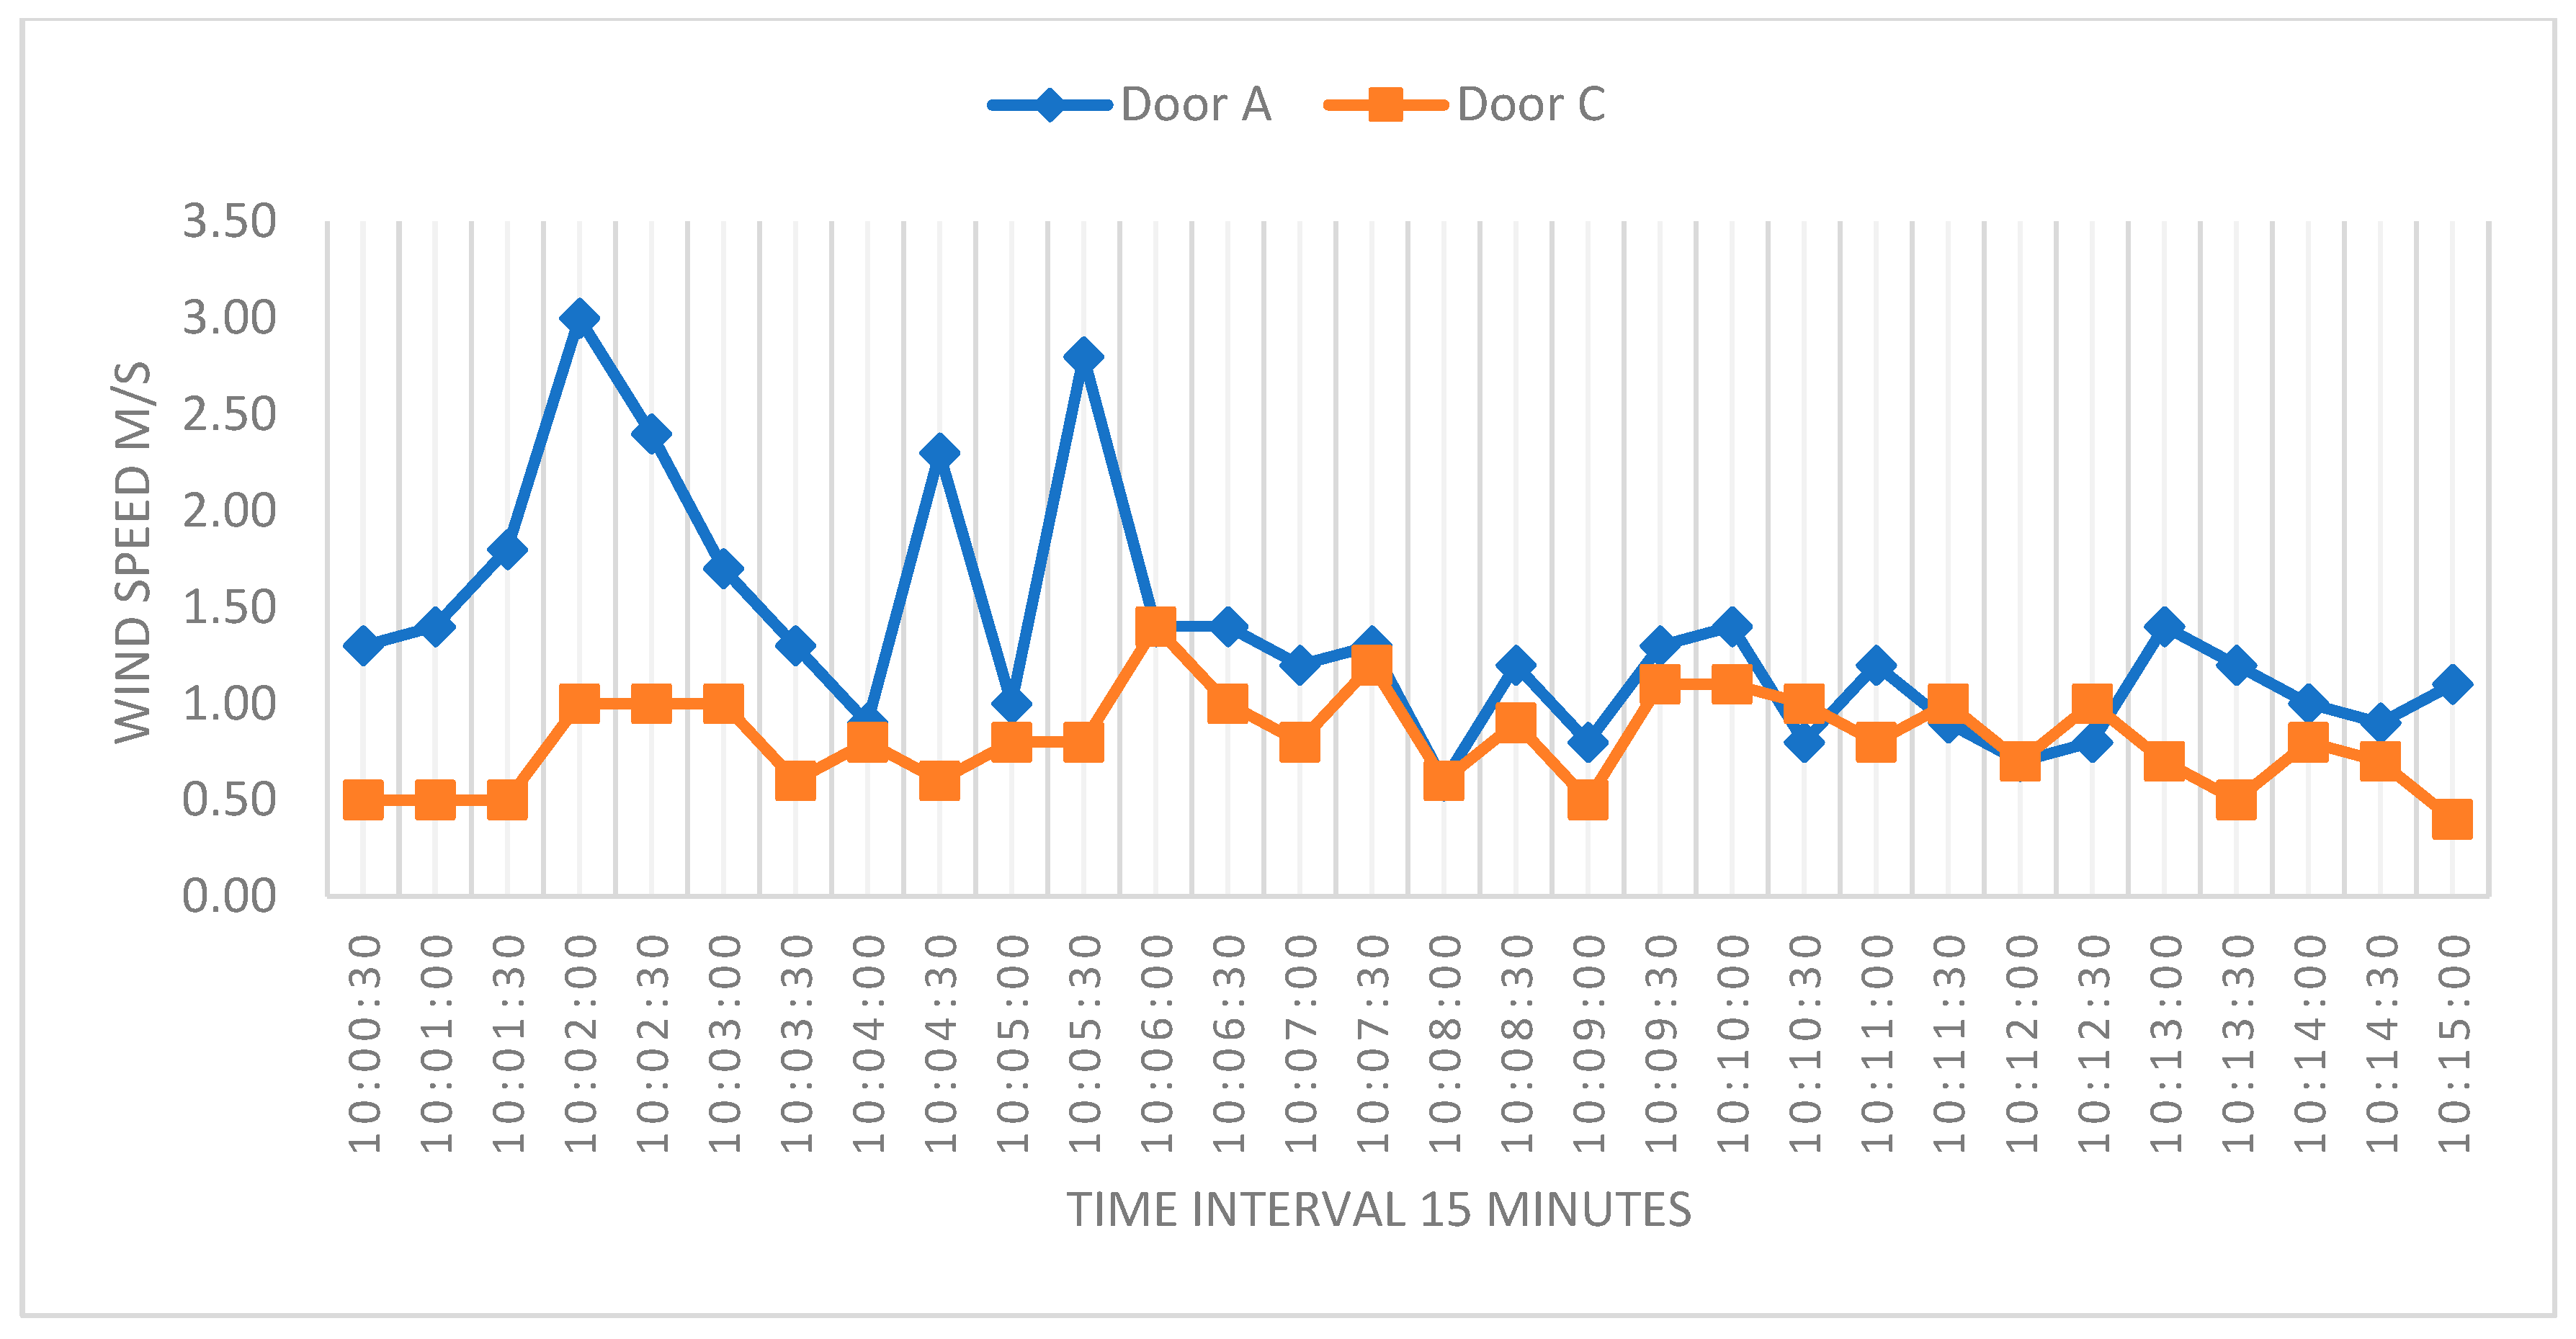
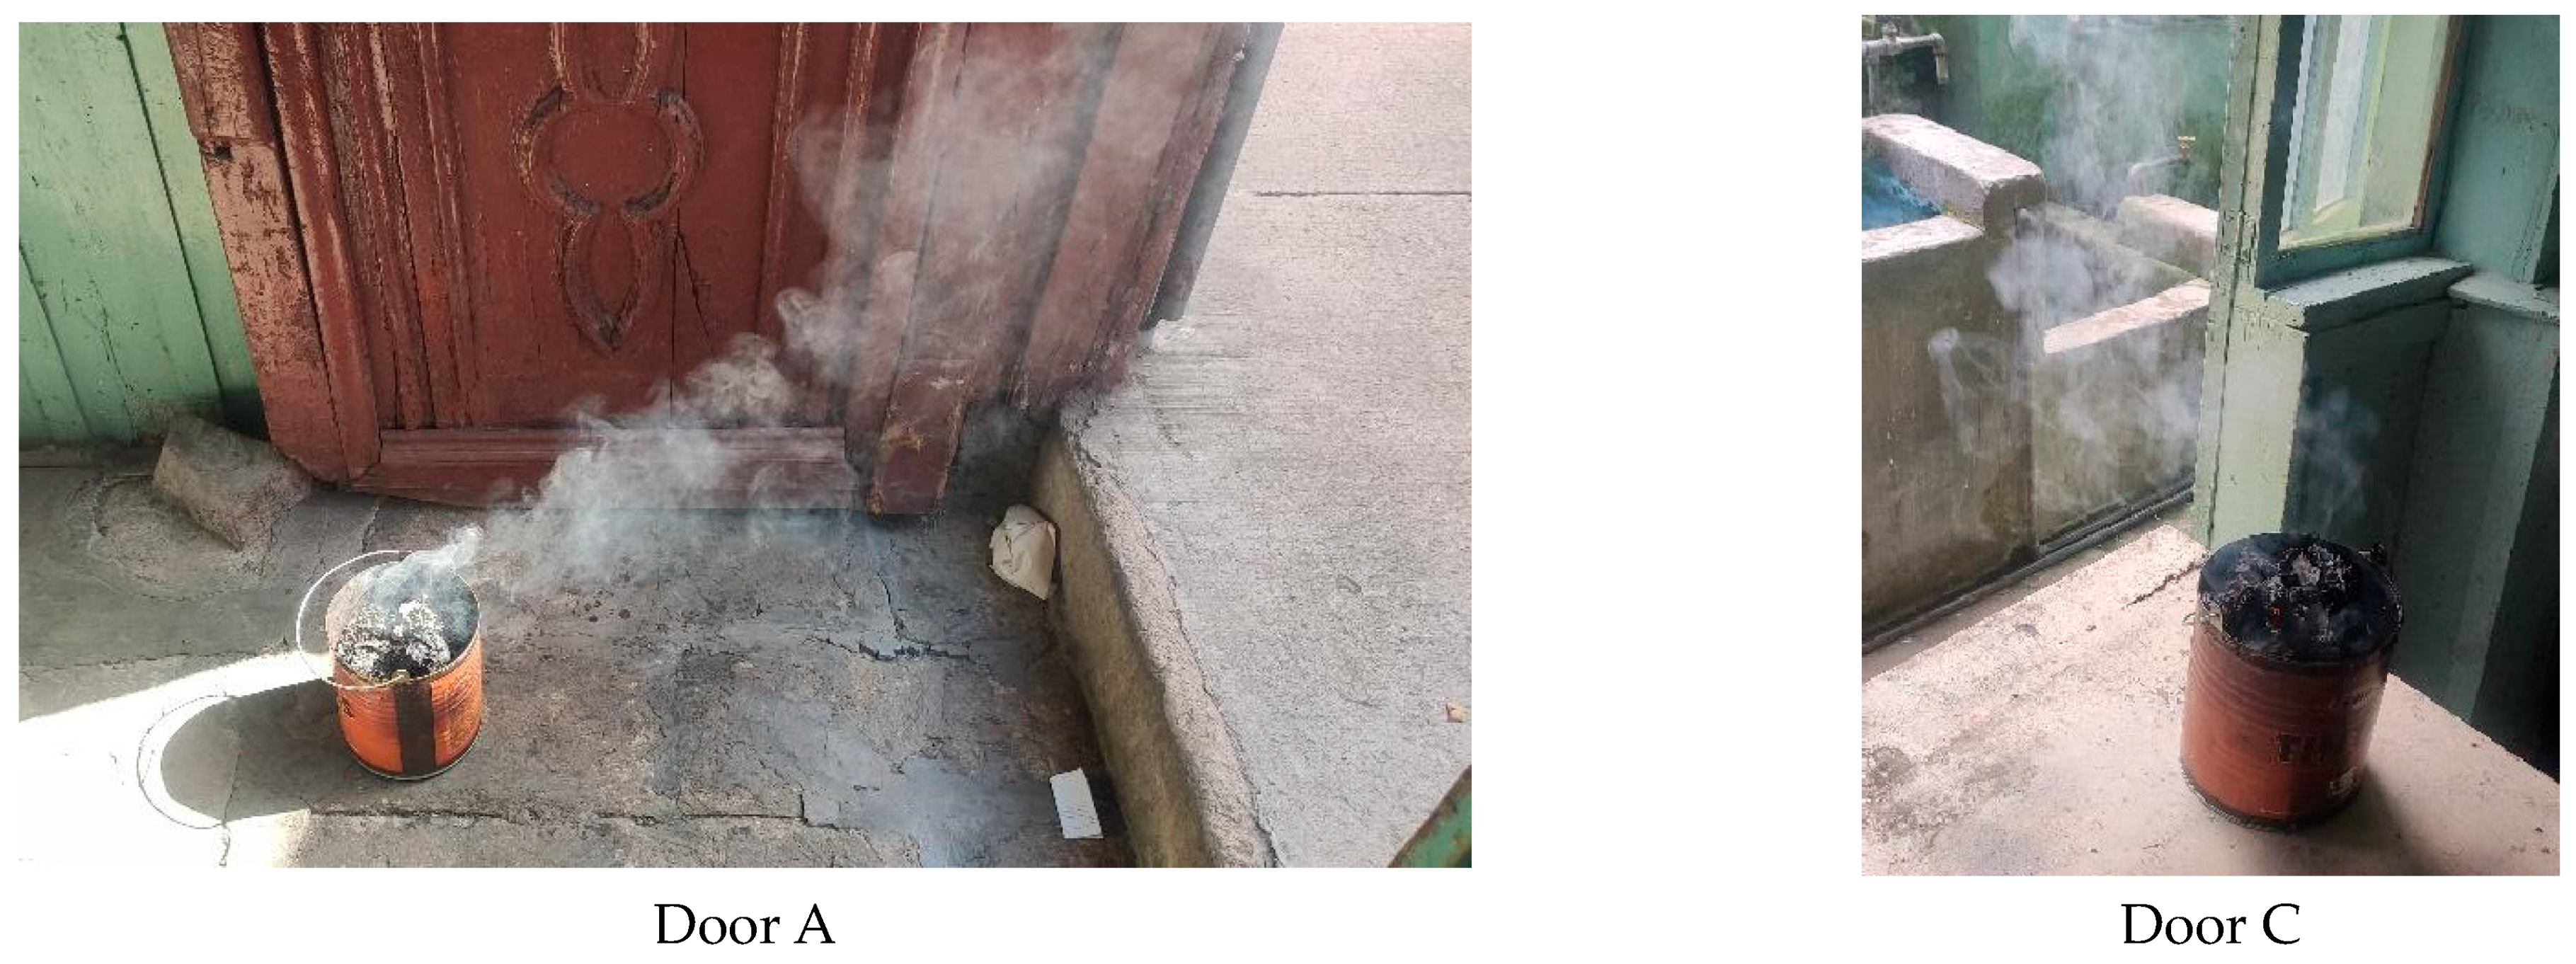
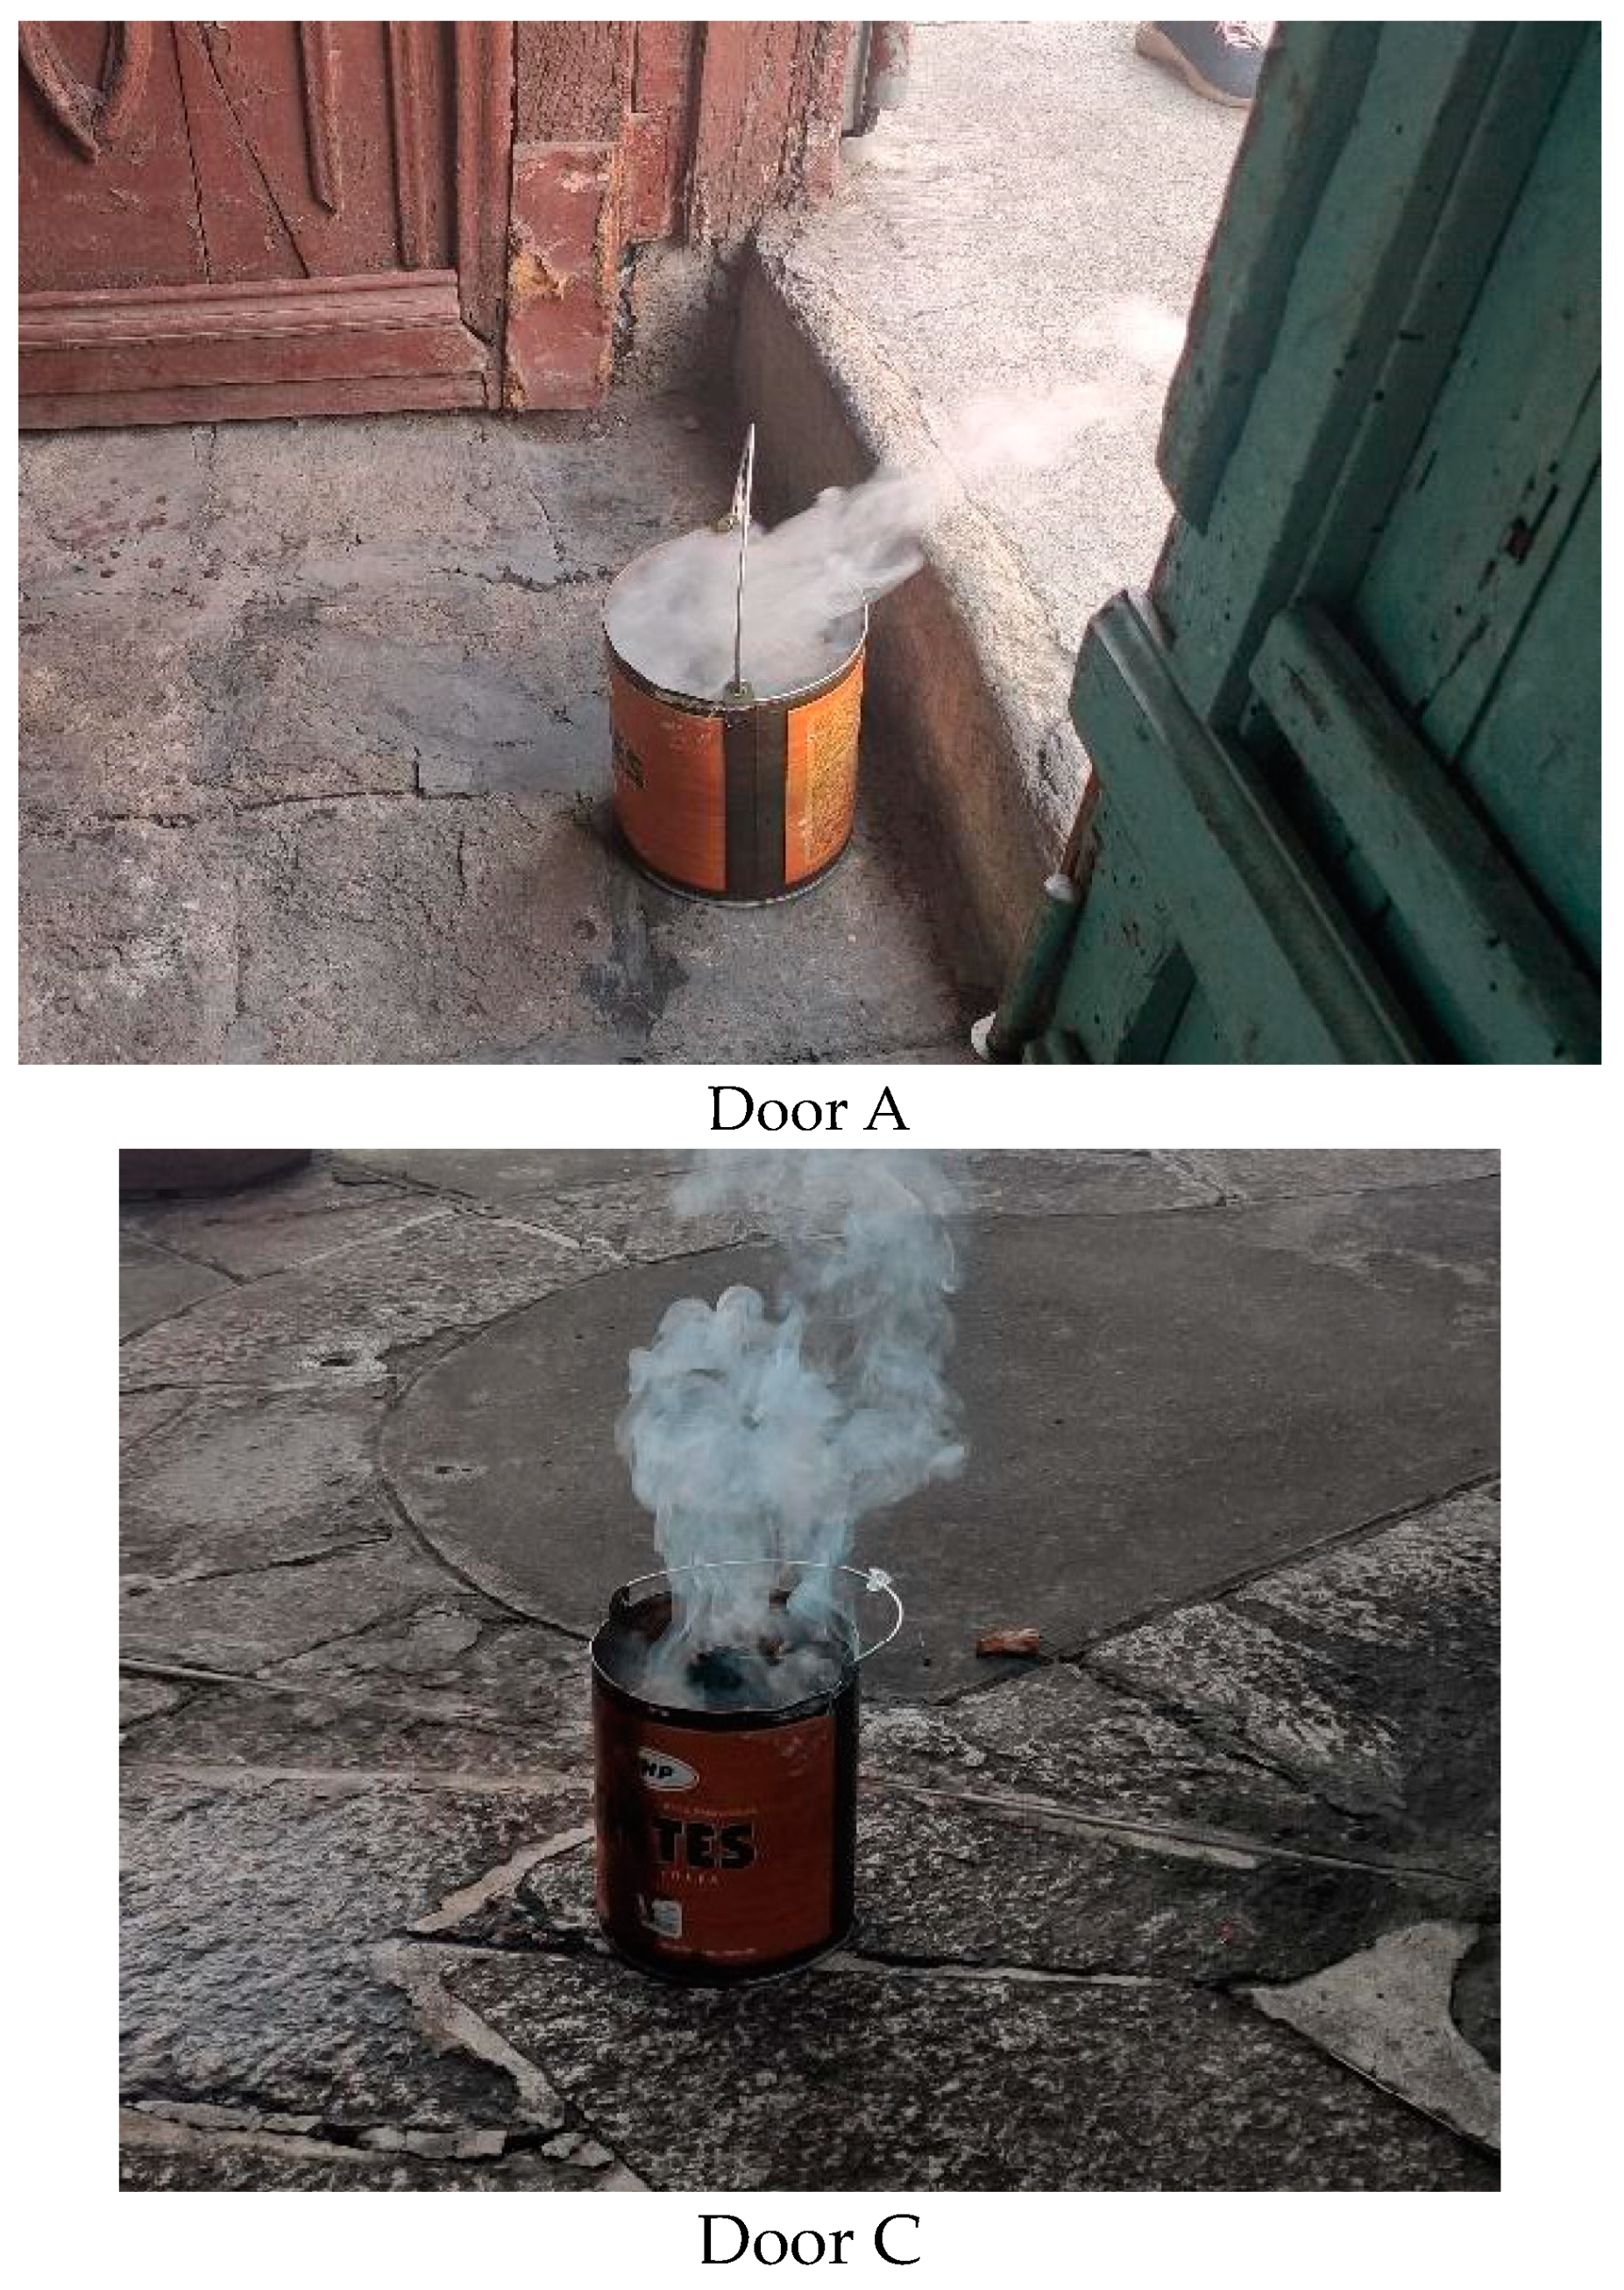
Experiment 1 involved measuring data at doors A and C, while doors A, B, and C remained open, and all other doors were closed. This experiment revealed that during the 15-min sampling period in the morning, the wind at door A originated from the west, while, at door C, it changed direction to the east. The wind speed at door A exhibited significant strength, averaging 1.35 m/s, whereas, at door C, it was approximately 0.81 m/s (
Figure 7 and
Figure 8).
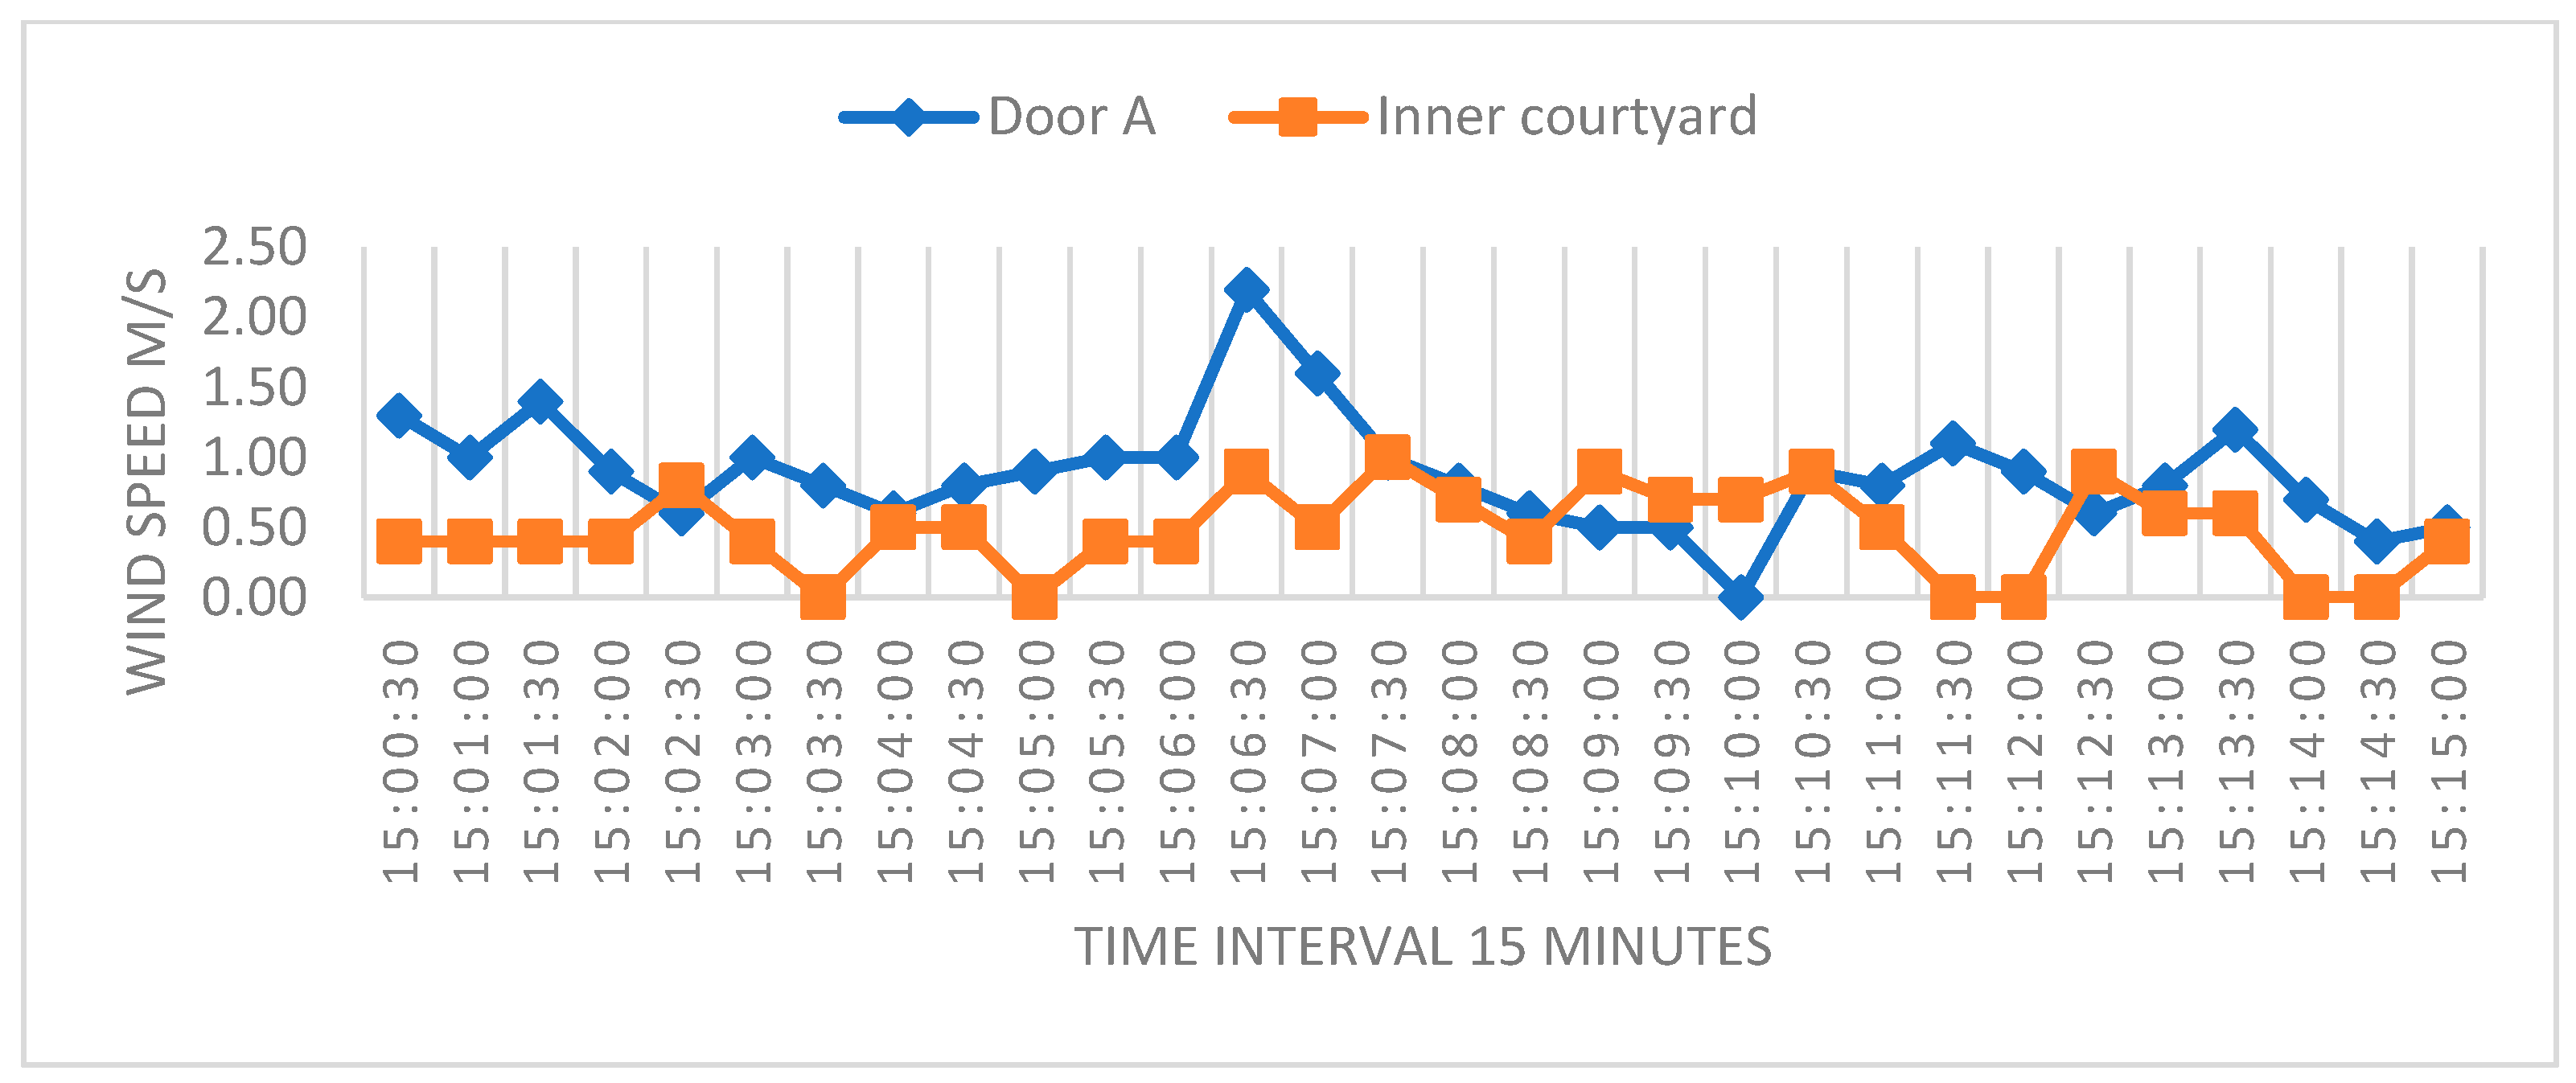
During the second experiment, data were recorded in the afternoon for a sampling period of 15 min. The test involved closing all doors except for door “A”, and measurements were taken at door “A” and in the central courtyard. The recordings revealed that the wind in the central courtyard had an upward direction, while, at door “A”, the wind had a west–east direction. Additionally, in this experiment, it was found that the wind at door “A” had an average velocity of 0.88 m/s, with a recorded maximum of 2.20 m/s during the sampling period. The wind speed in the central courtyard was much lower, with an average of 0.48 m/s (
Figure 9 and
Figure 10).
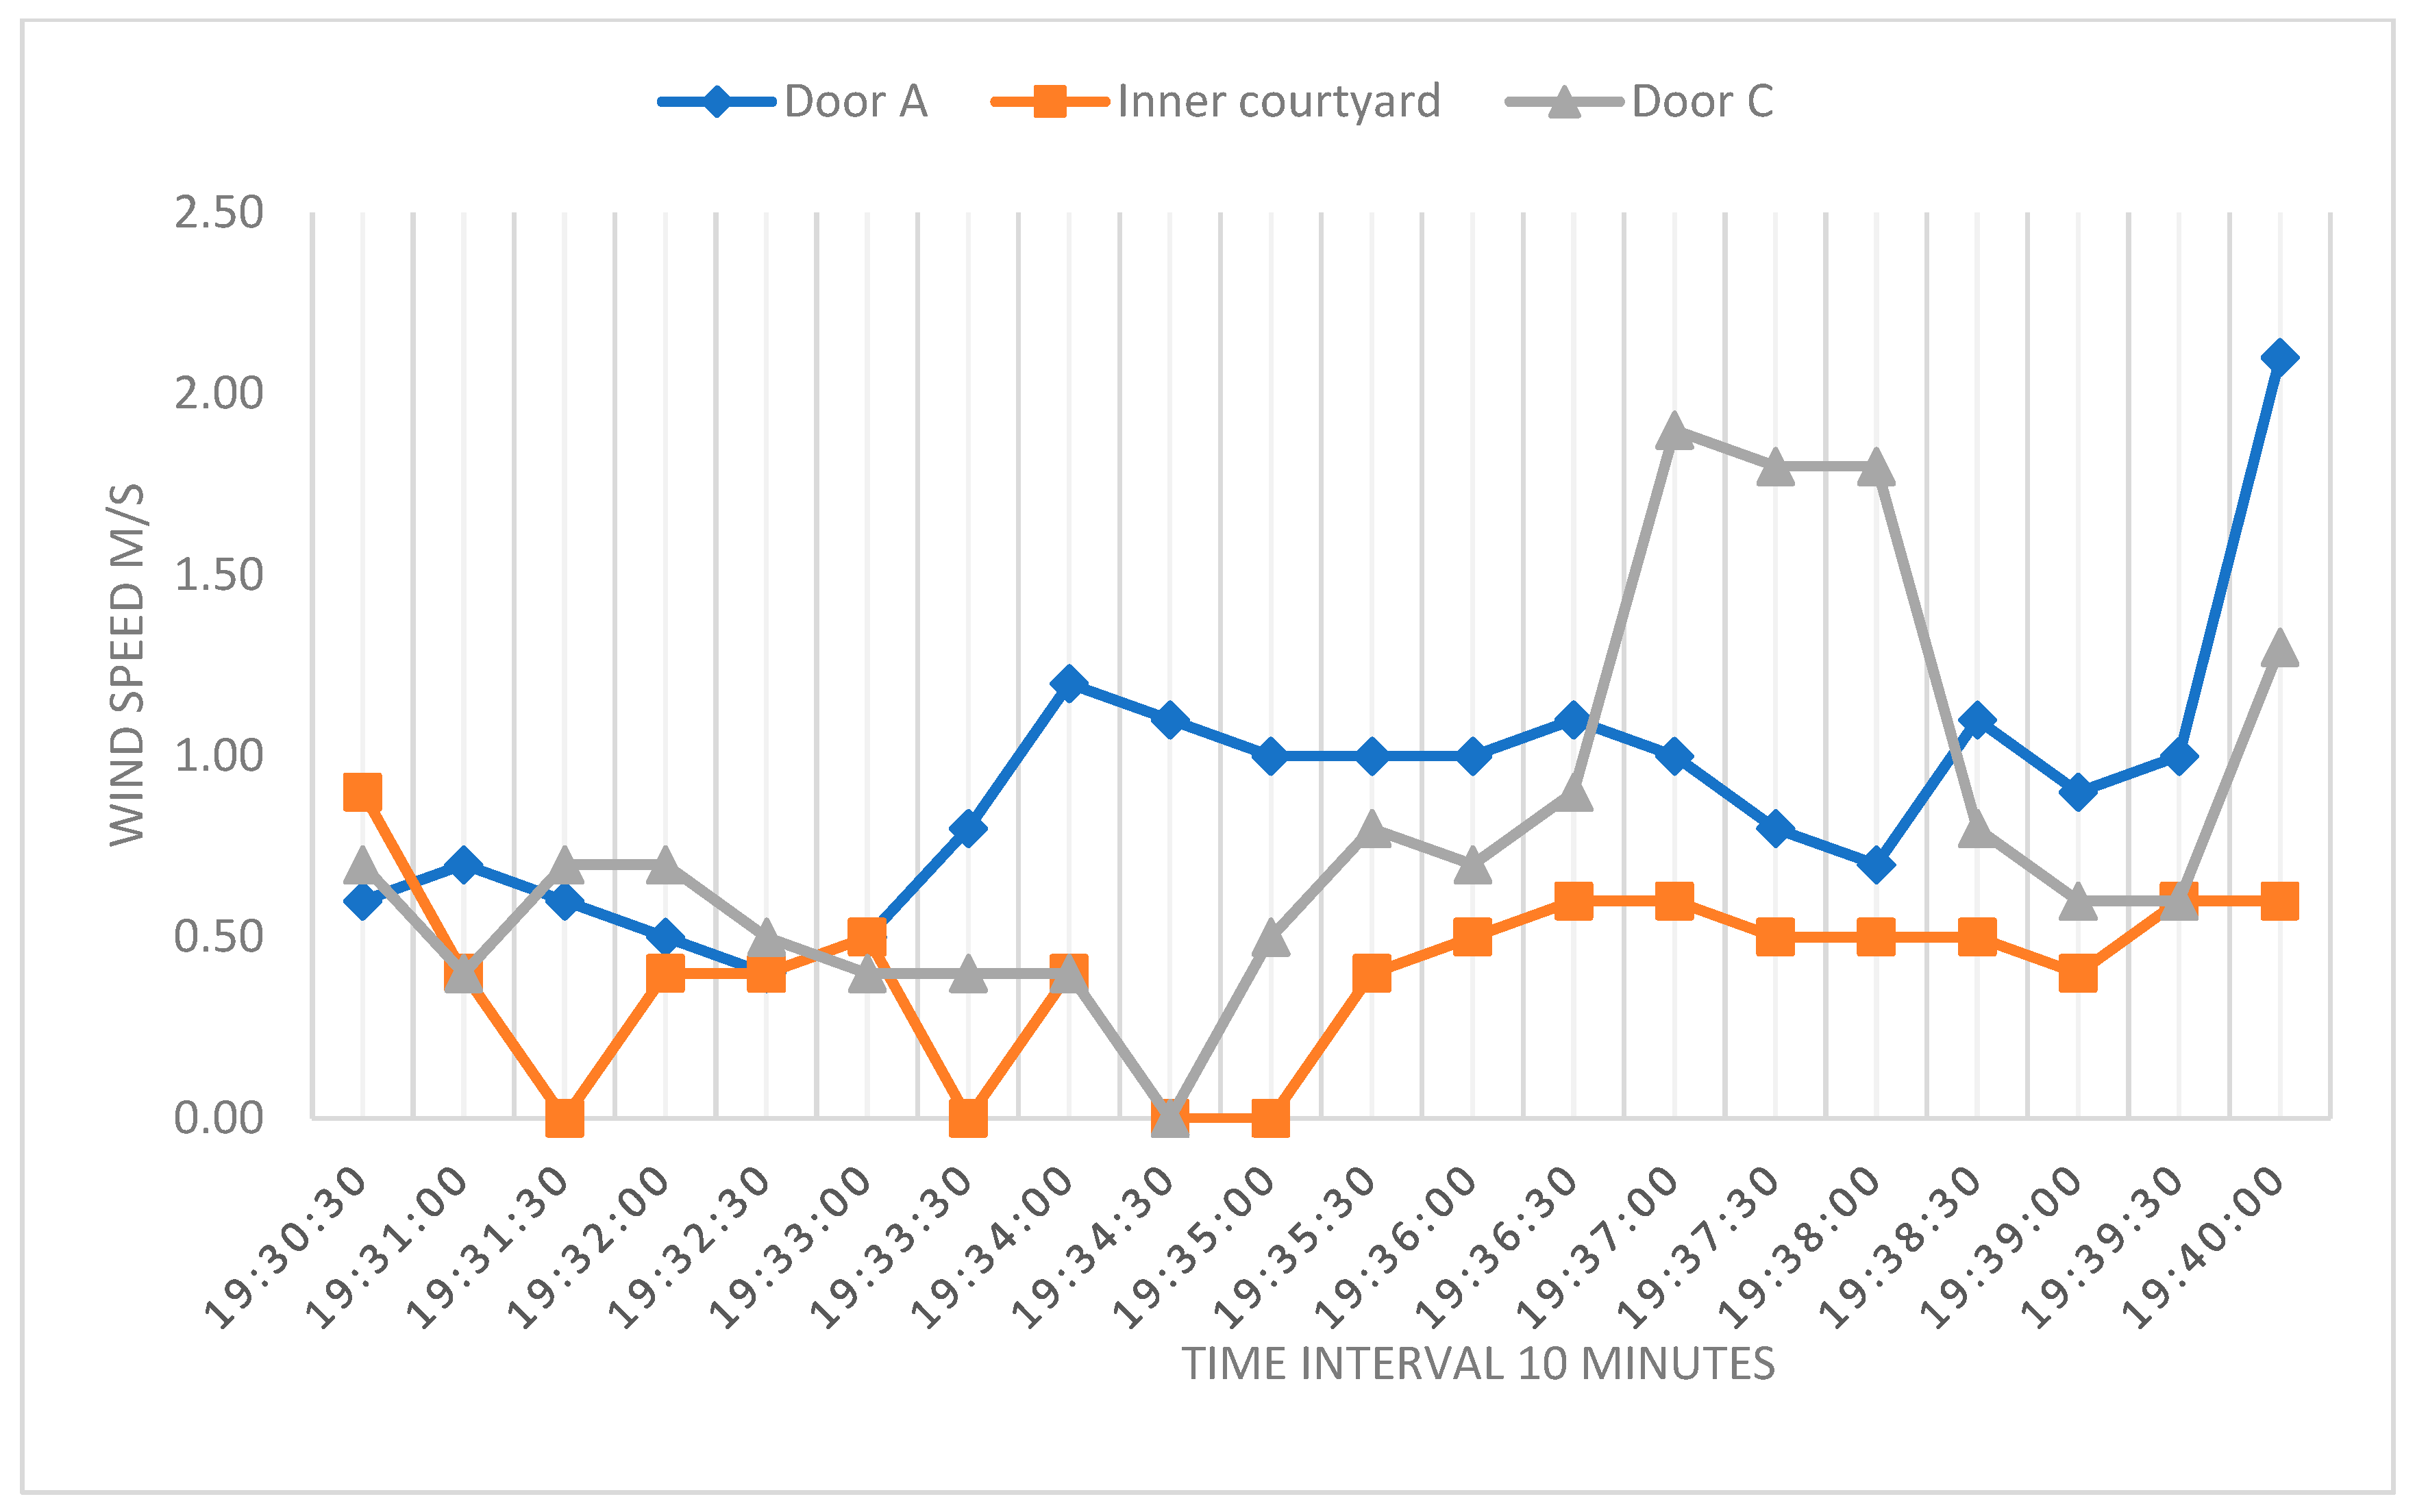
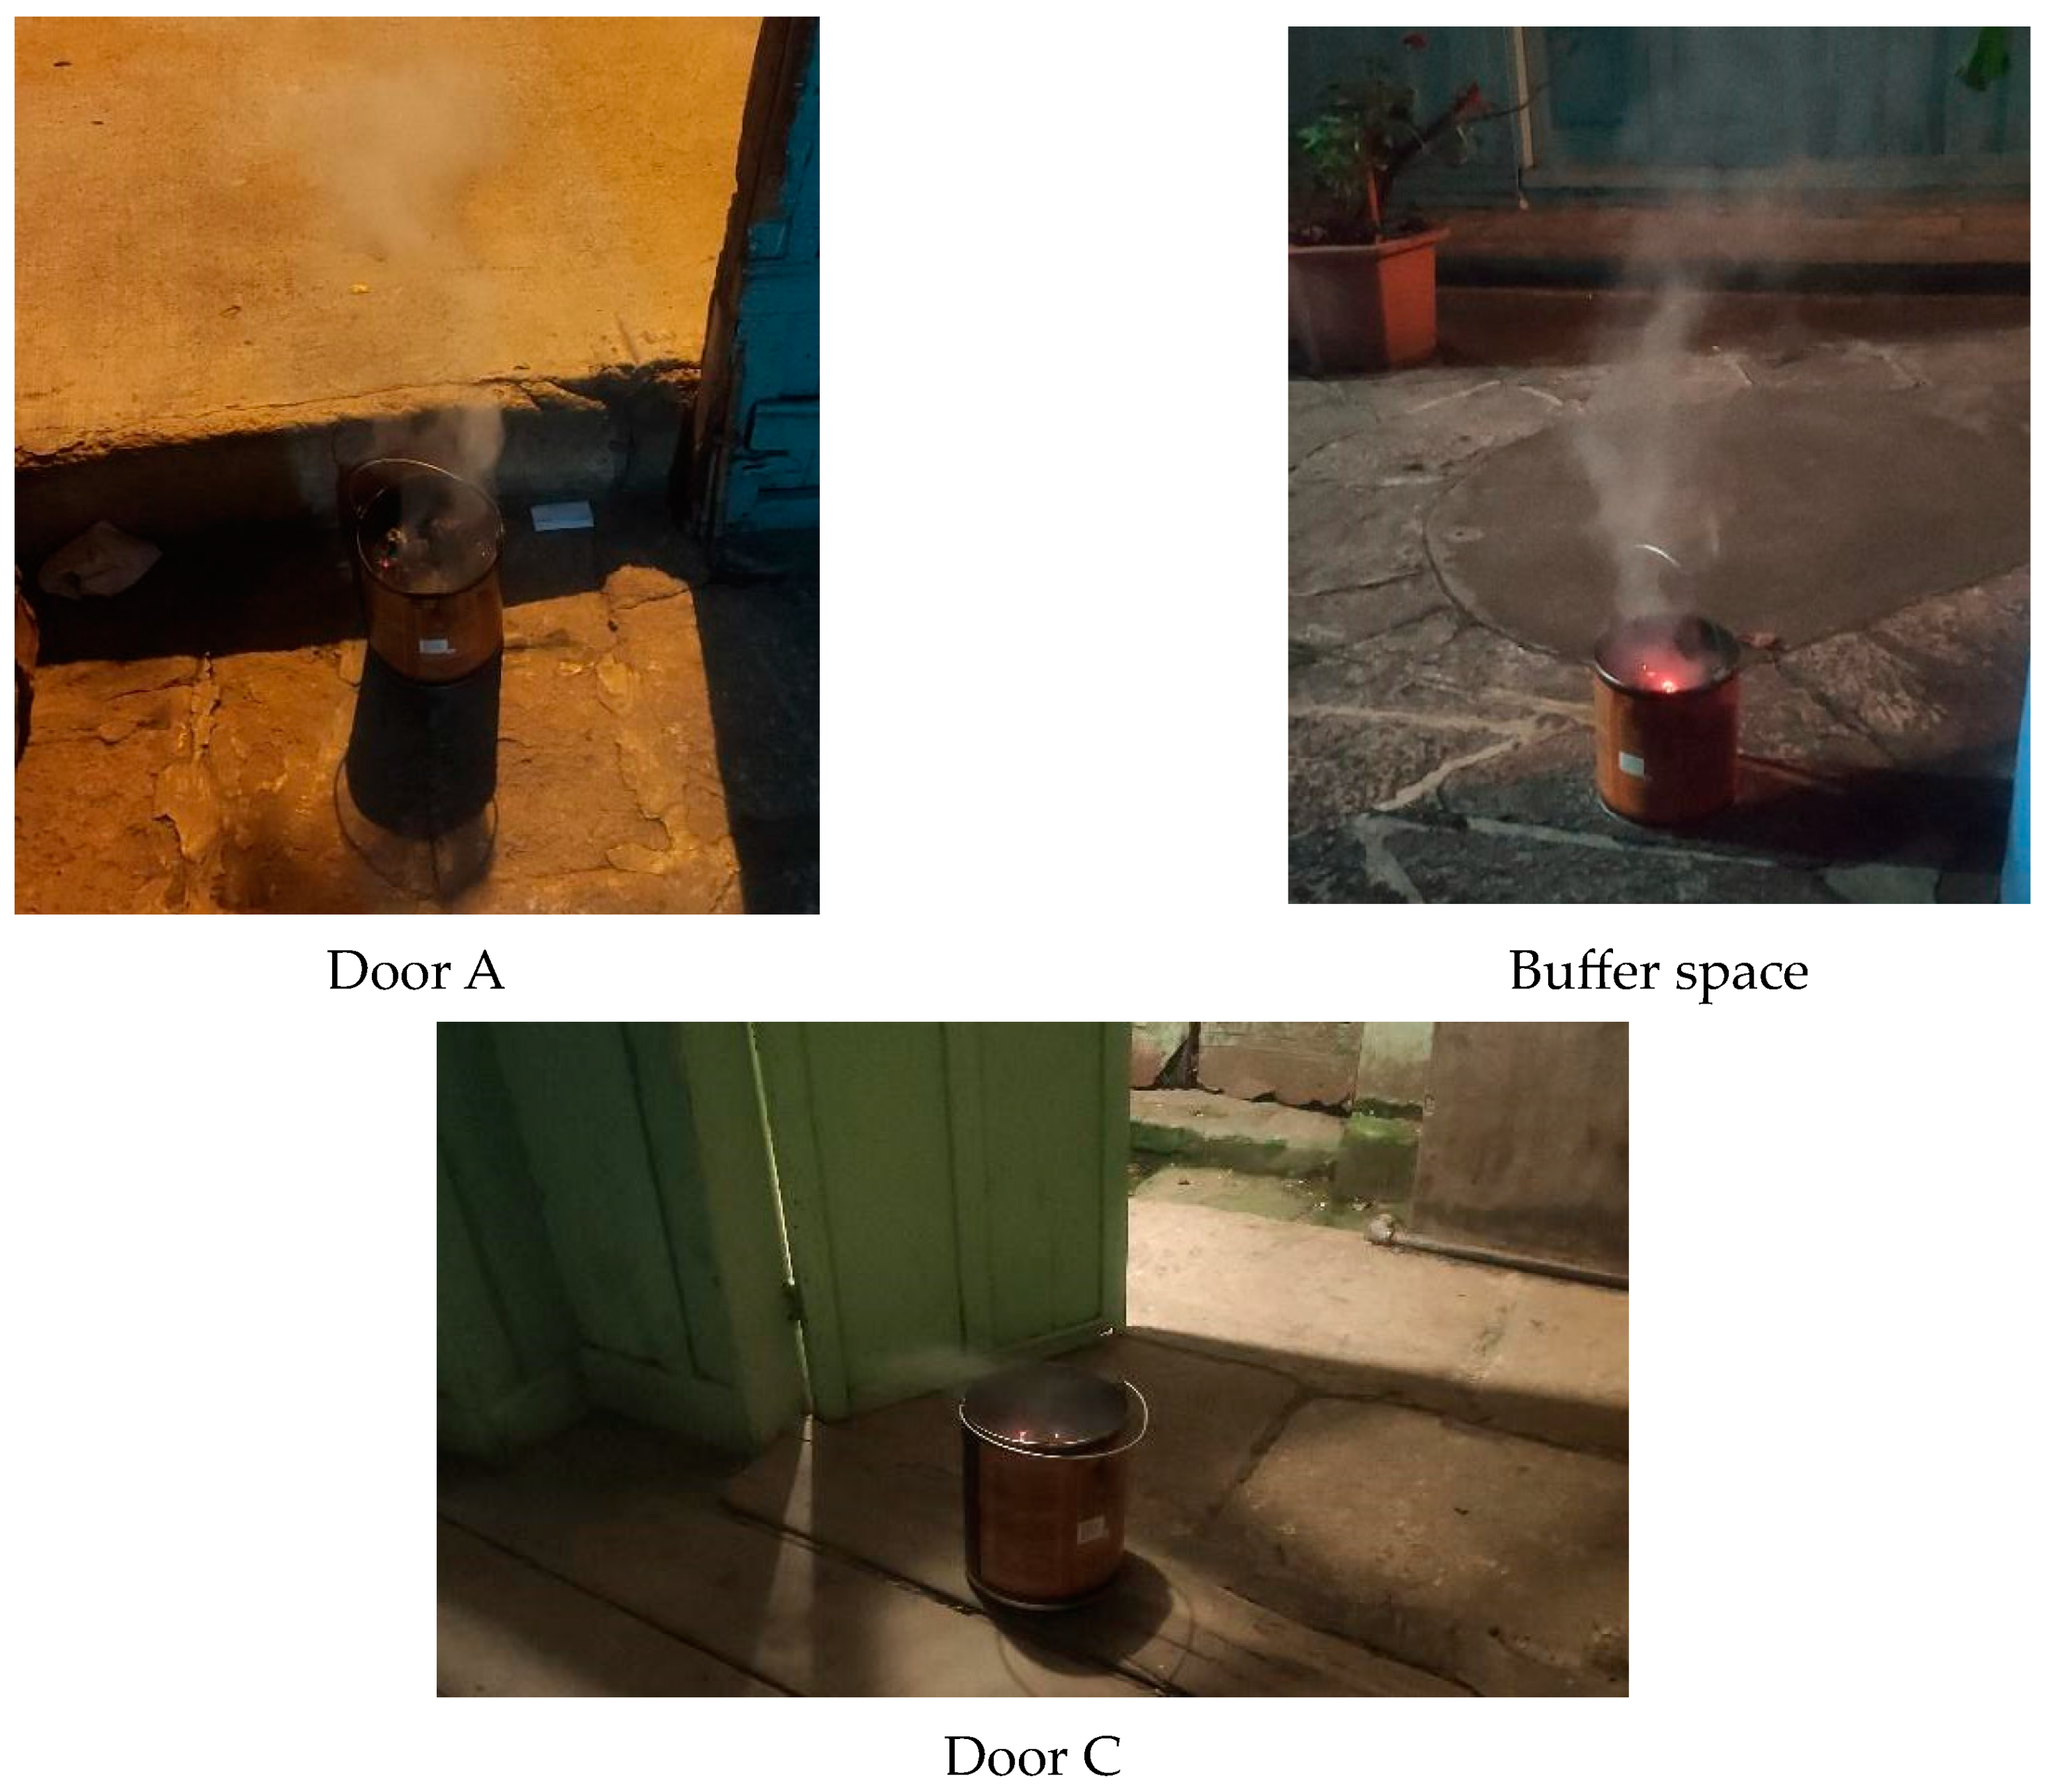
Experiment 3 was conducted at night for 10 min to evaluate the natural ventilation of the building. The experimental conditions were the same as in experiment 1, with measurements taken at door A, the central courtyard, and door C. The wind direction was found to be west–east at both door A and door C, while an upward direction was observed in the central courtyard. The average wind speed at door A was recorded as 0.91 m/s, while, at door C, it was measured to be 0.80 m/s., while the average speed in the central courtyard was 0.41 m/s (
Figure 11 and
Figure 12). These findings provide insight pertaining to the natural airflow and ventilation within the building during nighttime.
The experimental tests (2 and 3) show that the predominant local wind comes from the west–east direction, and this wind stream can be regarded as the main source of natural ventilation within the house. However, according to test 1, the predominant local wind takes two directions, west to east (door A) and east to west (door C), during the morning. The courtyard functions as an outlet for air circulation, while the windows and doors serve as inlet openings for fresh air intake; the smoke tracers placed in the central courtyard showed that the natural ventilation during the morning, afternoon, and night was upward, producing a chimney effect. Nevertheless, it is noteworthy that the main room of the building, where a wind speed recorder was placed despite being oriented in the predominant wind direction, recorded an average speed of 0.39 m/s, which can be considered imperceptible. This observation is supported by the smoke tracer images placed in the main room (
Figure 13).
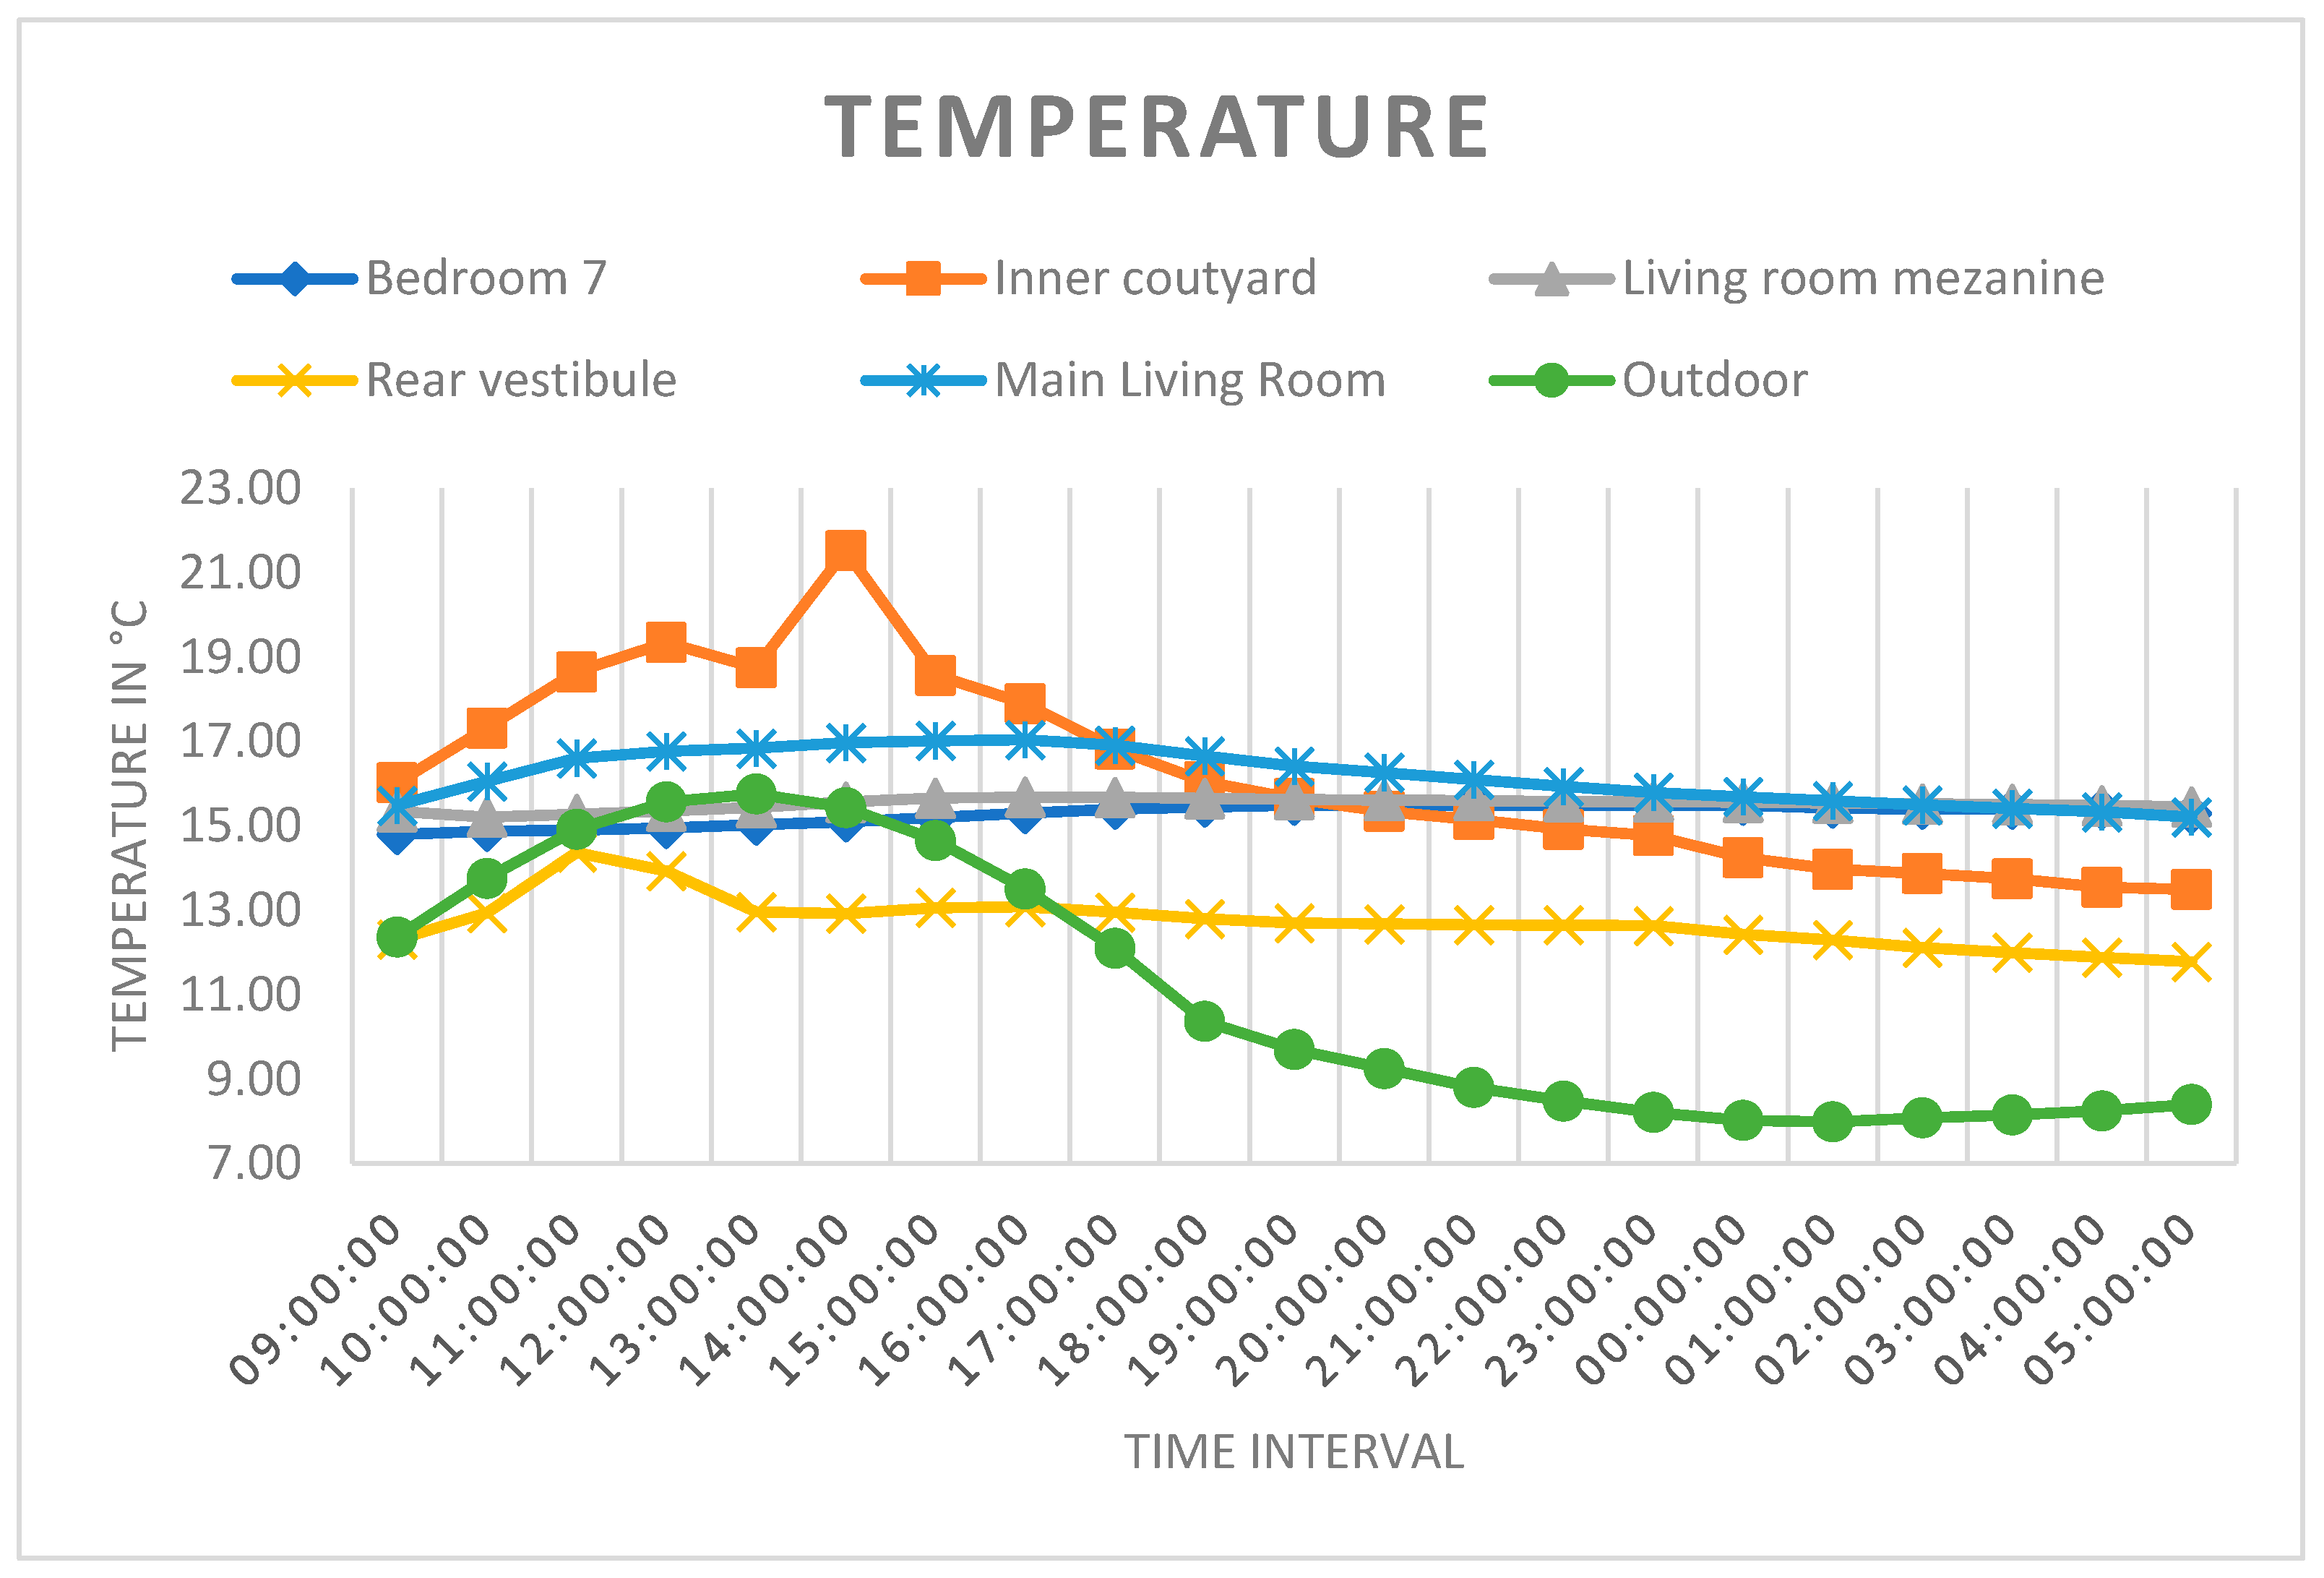
The air temperature profiles shown in
Figure 14 demonstrate that the outdoor temperature exhibited a diurnal variation of 6.96 °C (i.e., ranging from 8.80 °C to 15.16 °C), while the temperature recorded in the main room fluctuated between 15.11 °C and 17.05 °C, displaying a diurnal variation of 1.94 °C over the same time period. The central courtyard had an average temperature of 14.92 °C, and the temperature inside the building was higher than the outdoor temperature, whereas the outdoor temperature was 1.67 °C lower than that of the rear vestibule. It is evident that the temperature variations in the mezzanine room and bedroom 7 coincided throughout the monitoring period. The mezzanine room was approximately 0.23 °C warmer than bedroom 7, while the main room was 1.26 °C hotter than bedroom 7 during the day. At night, bedroom 7 was slightly cooler than the main room, with a difference of 0.30 °C.
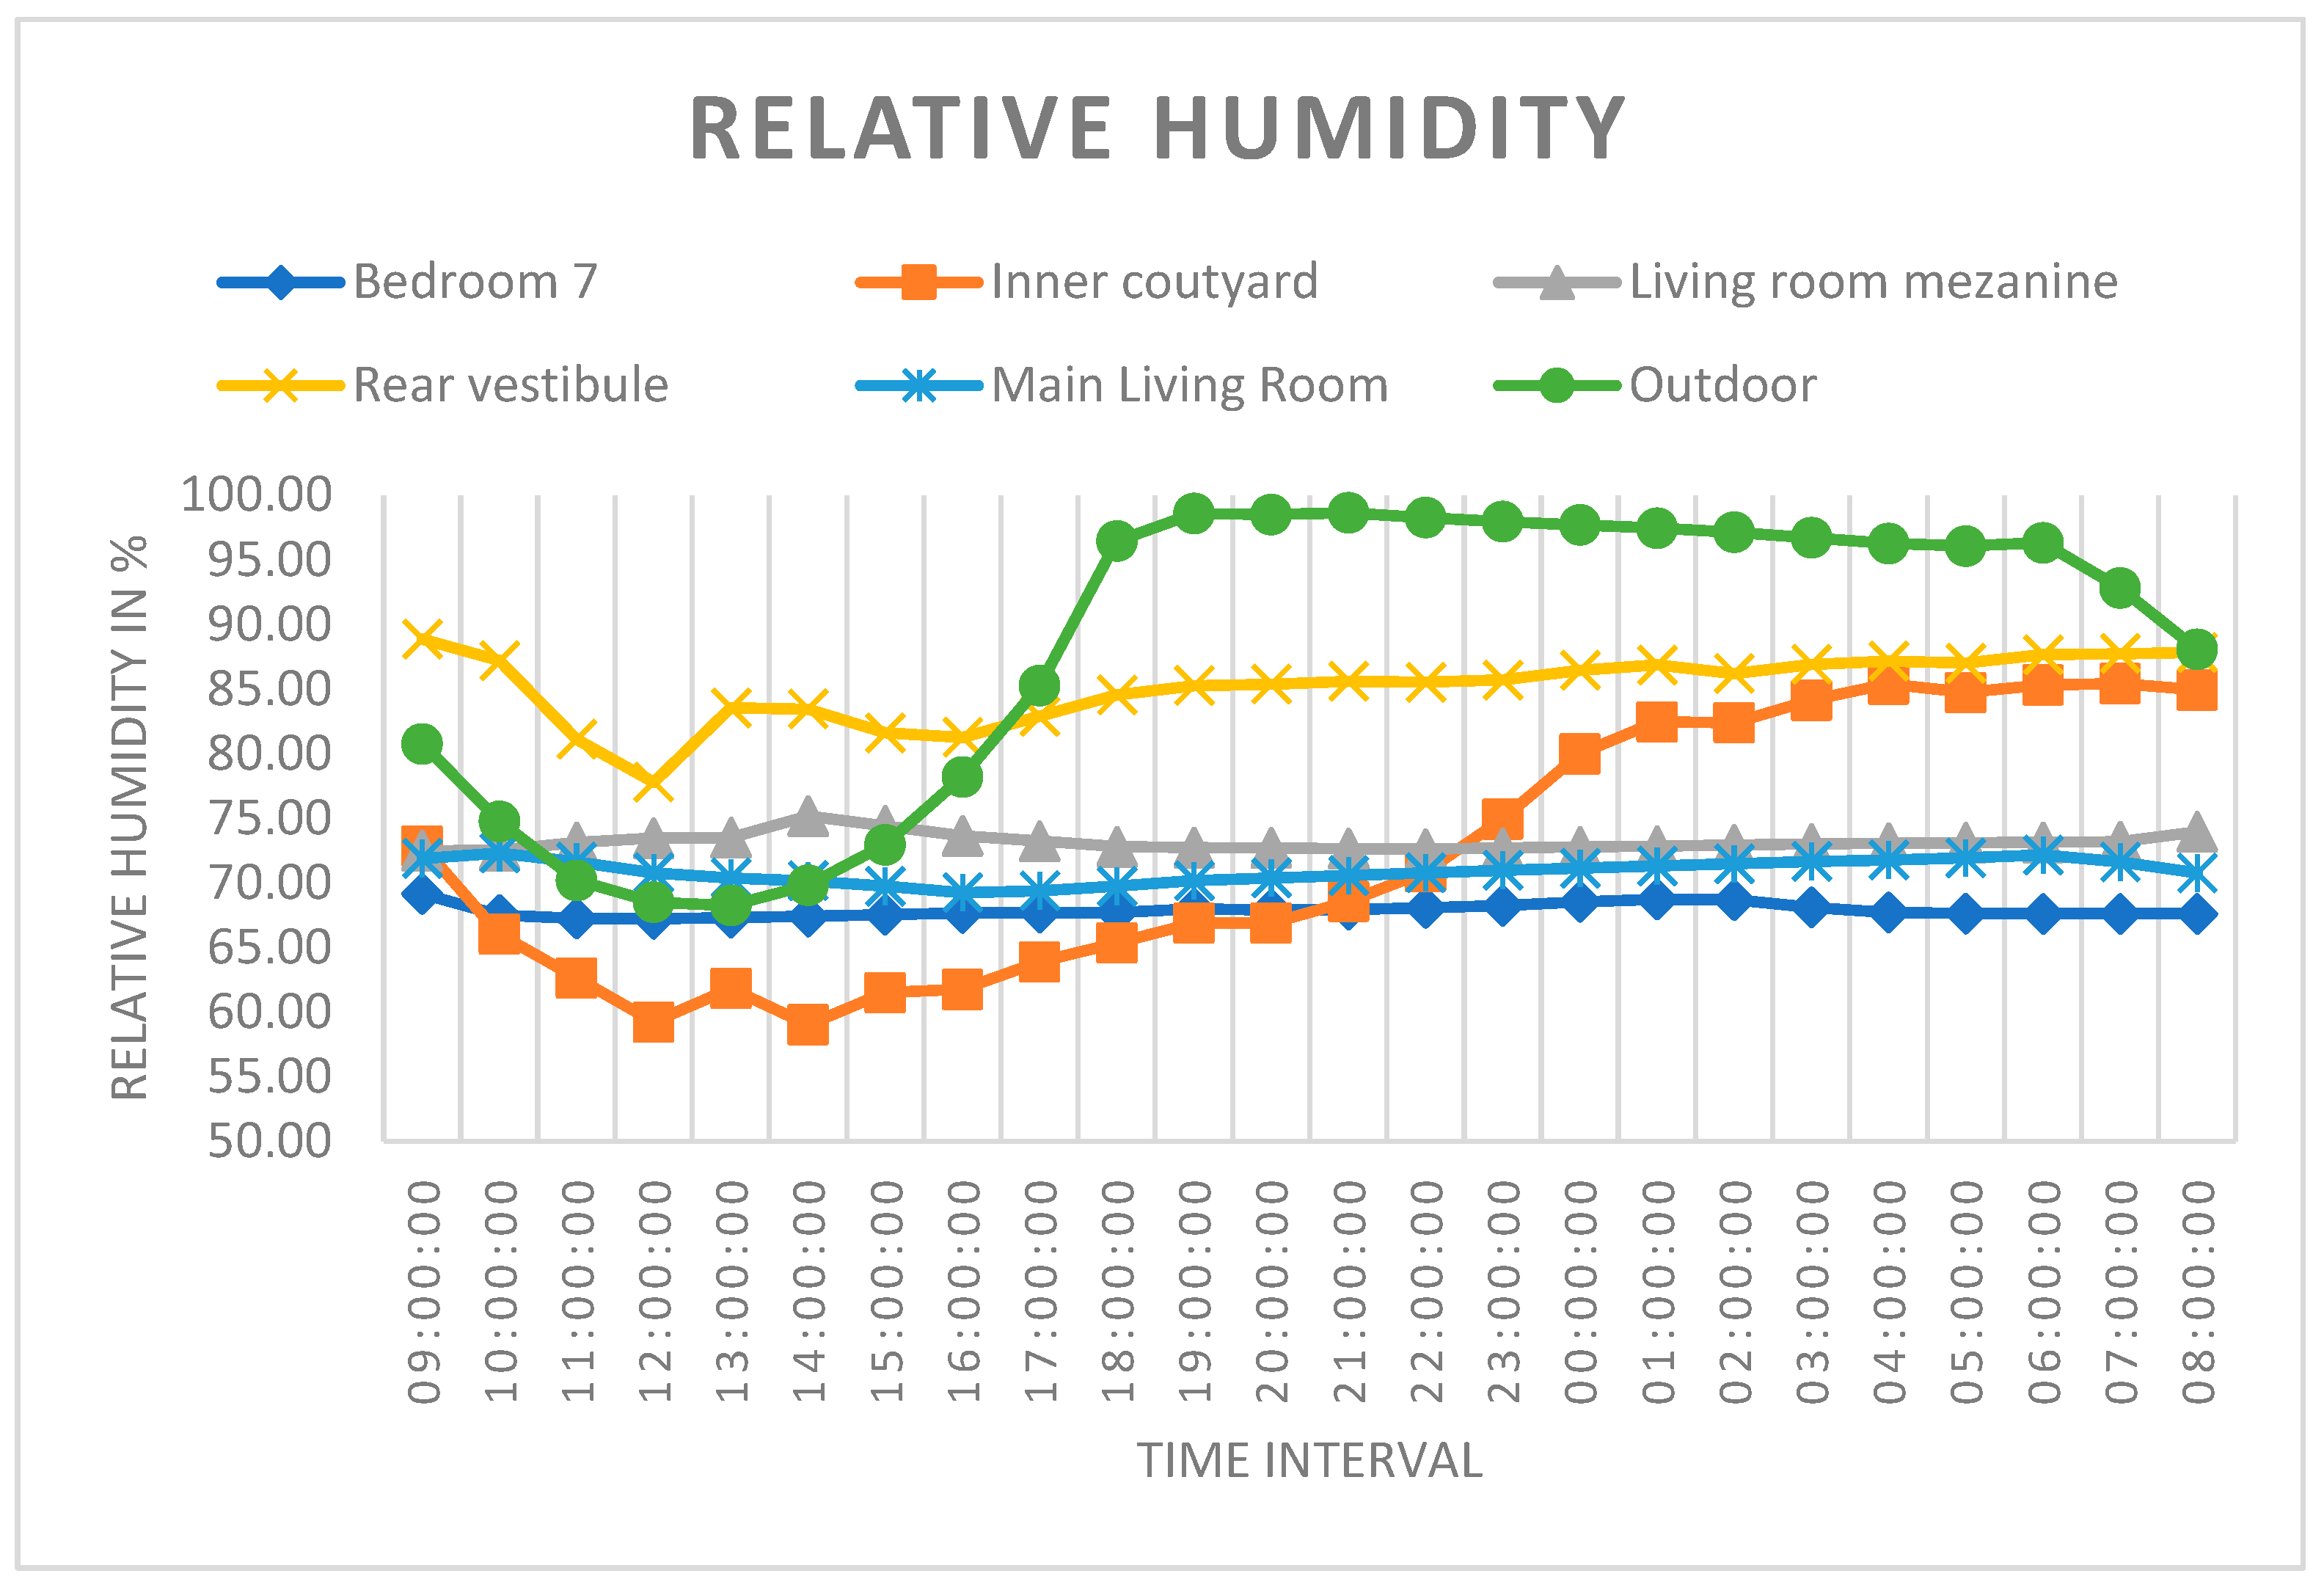
The relative humidity (RH) levels in the central courtyard, as depicted in
Figure 15, exhibited the most fluctuation among the interior values (i.e., varying from 59.03% to 85.43%). The relative humidity in bedroom 7 was the most stable (i.e., varying by only 1.93%, from 67.23% to 69.15%), while the highest value (around 88.86%) was observed in the rear vestibule during the monitoring period. It is important to note that while the temperature in bedroom 7 was lower than in the main room during nighttime, the former exhibited lower relative humidity values, indicating a drier environment compared to the latter. Based on the monitoring results, bedroom 7 was the coolest place in the house. This phenomenon can be attributed to the fact that bedroom 7 was enclosed by three solid walls and had only one connection to the exterior (central courtyard) through a door. As a result, natural ventilation in this area was restricted. However, the room benefitted from effective shading, reducing the influence of the outdoor air temperature and solar radiation.
The air temperature in the rear vestibule was the coldest in the house. Moreover, this space was the most humid, despite having good natural ventilation. This behavior can be attributed to the fact that this environment is located at a lower level with respect to the street level, and its enclosing structure is composed of wooden partitioning. According to the monitoring results, the relative humidity in the mezzanine room was the most constant among all the rooms in the house. However, it was cooler than the main room.
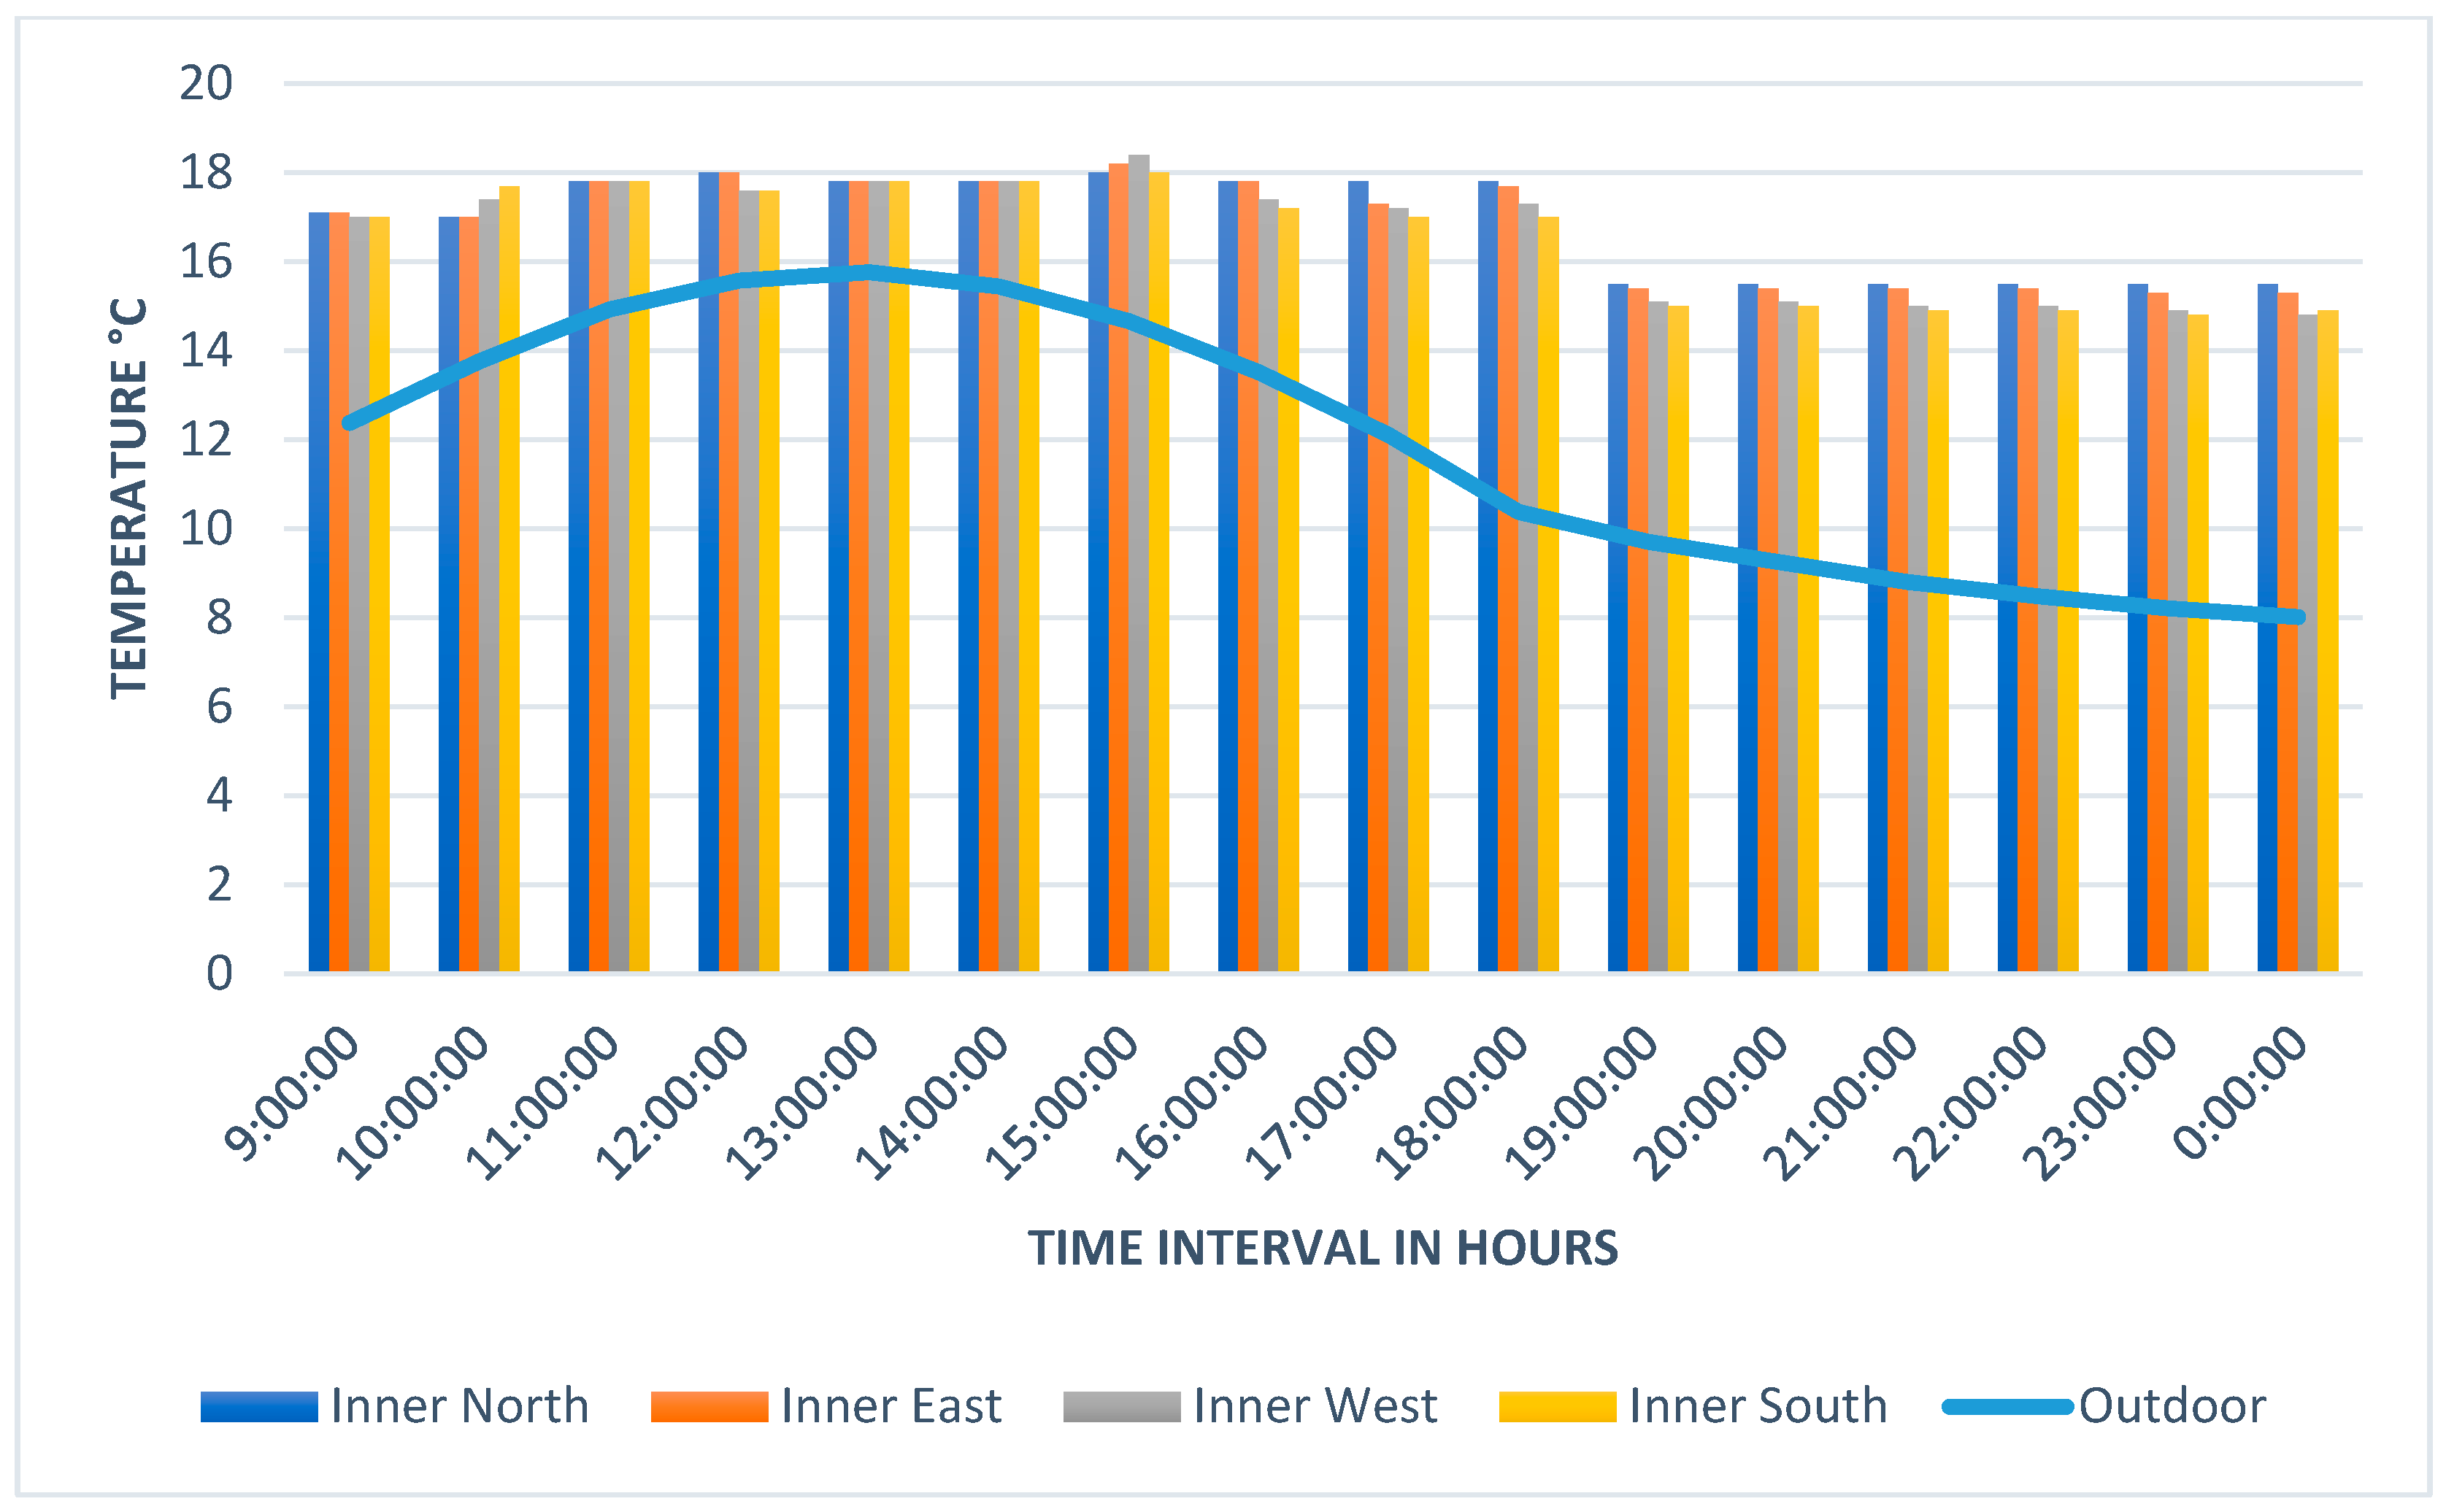
The temperature profiles of the internal wall surfaces in bedroom 7 are presented in
Figure 16. The results show that the west wall surface has the largest diurnal variation of 1.4 °C (i.e., from 17.00 °C to 18.40 °C), while the east wall surface has the lowest variation at night (i.e., 0.10 °C from 15.30 °C to 15.40 °C). The north wall surface maintains a stable temperature at 15.50 °C during the night. The internal south wall surface records the lowest average temperature during the night at 14.92 °C, while the external surface records 15.00 °C, with a variation of 0.08 °C. The temperature of the internal wall surfaces in bedroom 7 is higher than the external temperature; this can be attributed to the thermal insulation and thermal mass properties of the walls, which contribute to the observed effects.
3.2. Thermal Performance Simulation
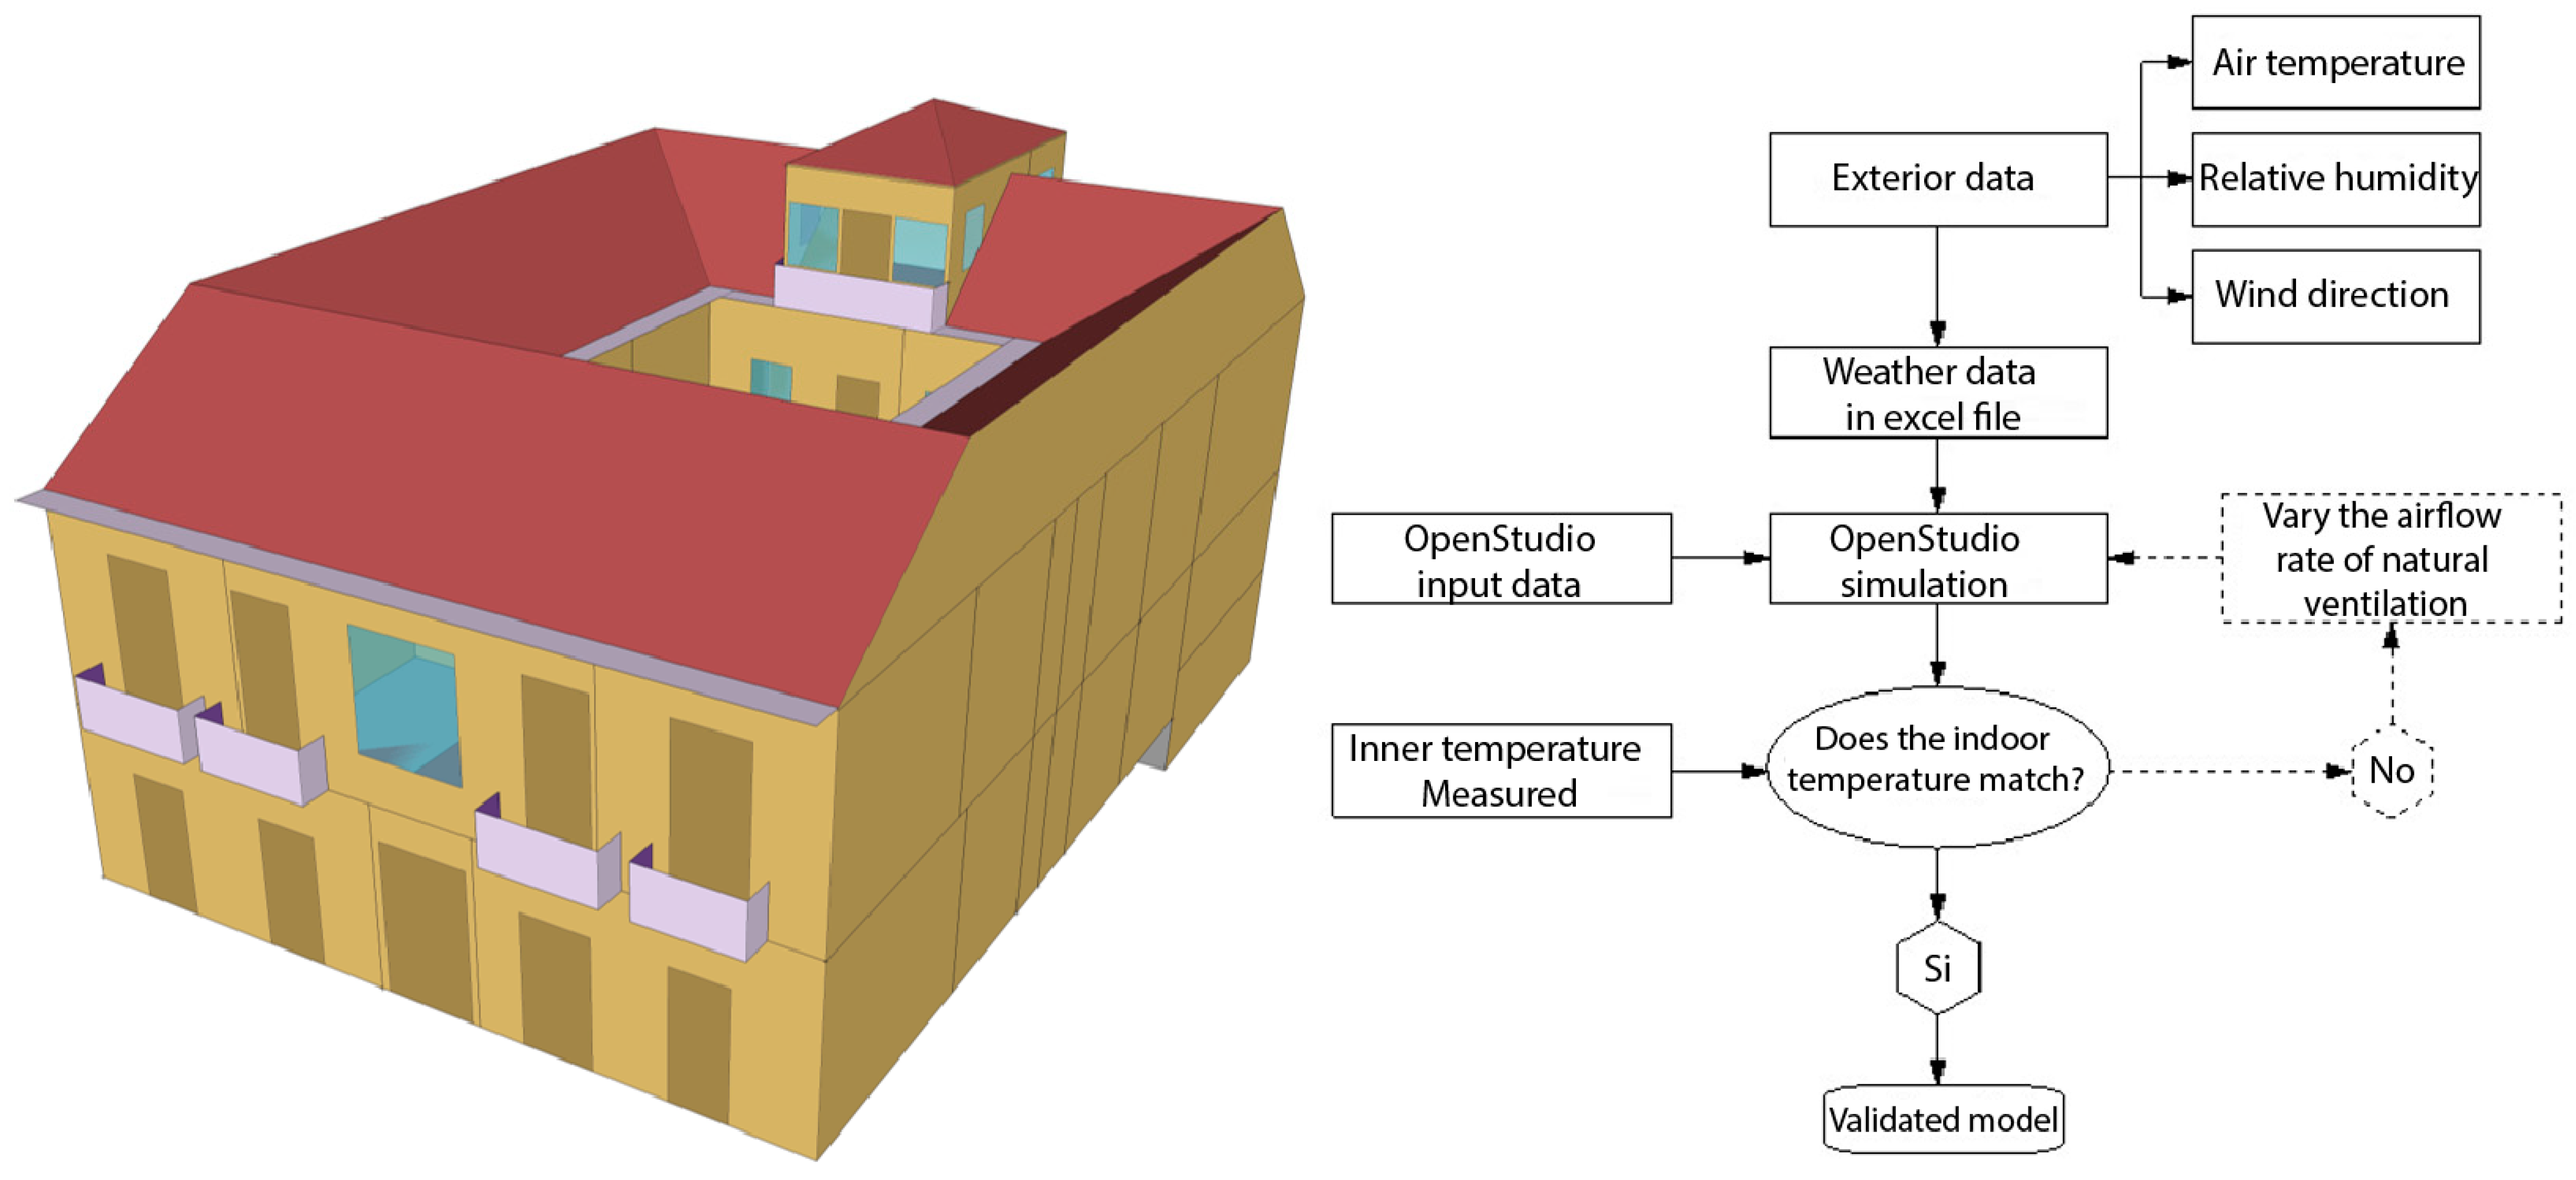
In order to identify whether there were environmental improvements in the case study, a thermodynamic performance analysis was performed. Firstly, a model of the current state of the building was obtained through the EnergyPlus/Open Studio graphic interface [
22]. The data were collected through planimetric measurements of the building, as there were no existing records due to its age. In the model, all thermophysical properties of the building’s envelope were defined (
Table 4). The values of the opaque envelope were taken in situ using the Testo 635 Surface Thermometer tool, and for the transparent envelope (and other materials that could not be measured), the values were taken from the Ecuadorian Construction Standard [
23]. Additionally, usage schedules and profiles were defined for a home with an average occupancy of three people (current number of occupants), an internal load with lighting power of 11.62 W/m
2, and electrical equipment of 48 W/m
2. The analysis was conducted in the absence of an air conditioning system, which is typical for residential buildings in the studied area. Consequently, the behavior of the building under external climatic conditions was the focus of the study. Finally, we inputted meteorological data for an entire year from the weather station located 3 km from the building (identified as DX300 HOBO). EnergyPlus was then used for energy calculations and Radiance was used to simulate the thermodynamic performance. To ensure the reliability of the simulation results, the model was validated (
Figure 17) through the calibration of the model with a comparison process between experimental data taken during the monitoring of the interior environment of the living room and the simulation results.
Model Validation
The validation was based on the model calibration process through the comparison of monitored and simulated data from the living room. Nowadays, this is frequently used in research as a means of validating results by calibrating the model through the comparison of monitored data in short periods of time and building simulations to identify thermal comfort and energy benefits [
8,
24,
25,
26]. Monitored data at various points in the building were used for model calibration (
Figure 6). The indoor air temperature of the main room was used as the parameter for model validation, given its strong connection to the thermal environment of the entire building. The simulated temperature in the main room was compared to the values recorded during observation periods (
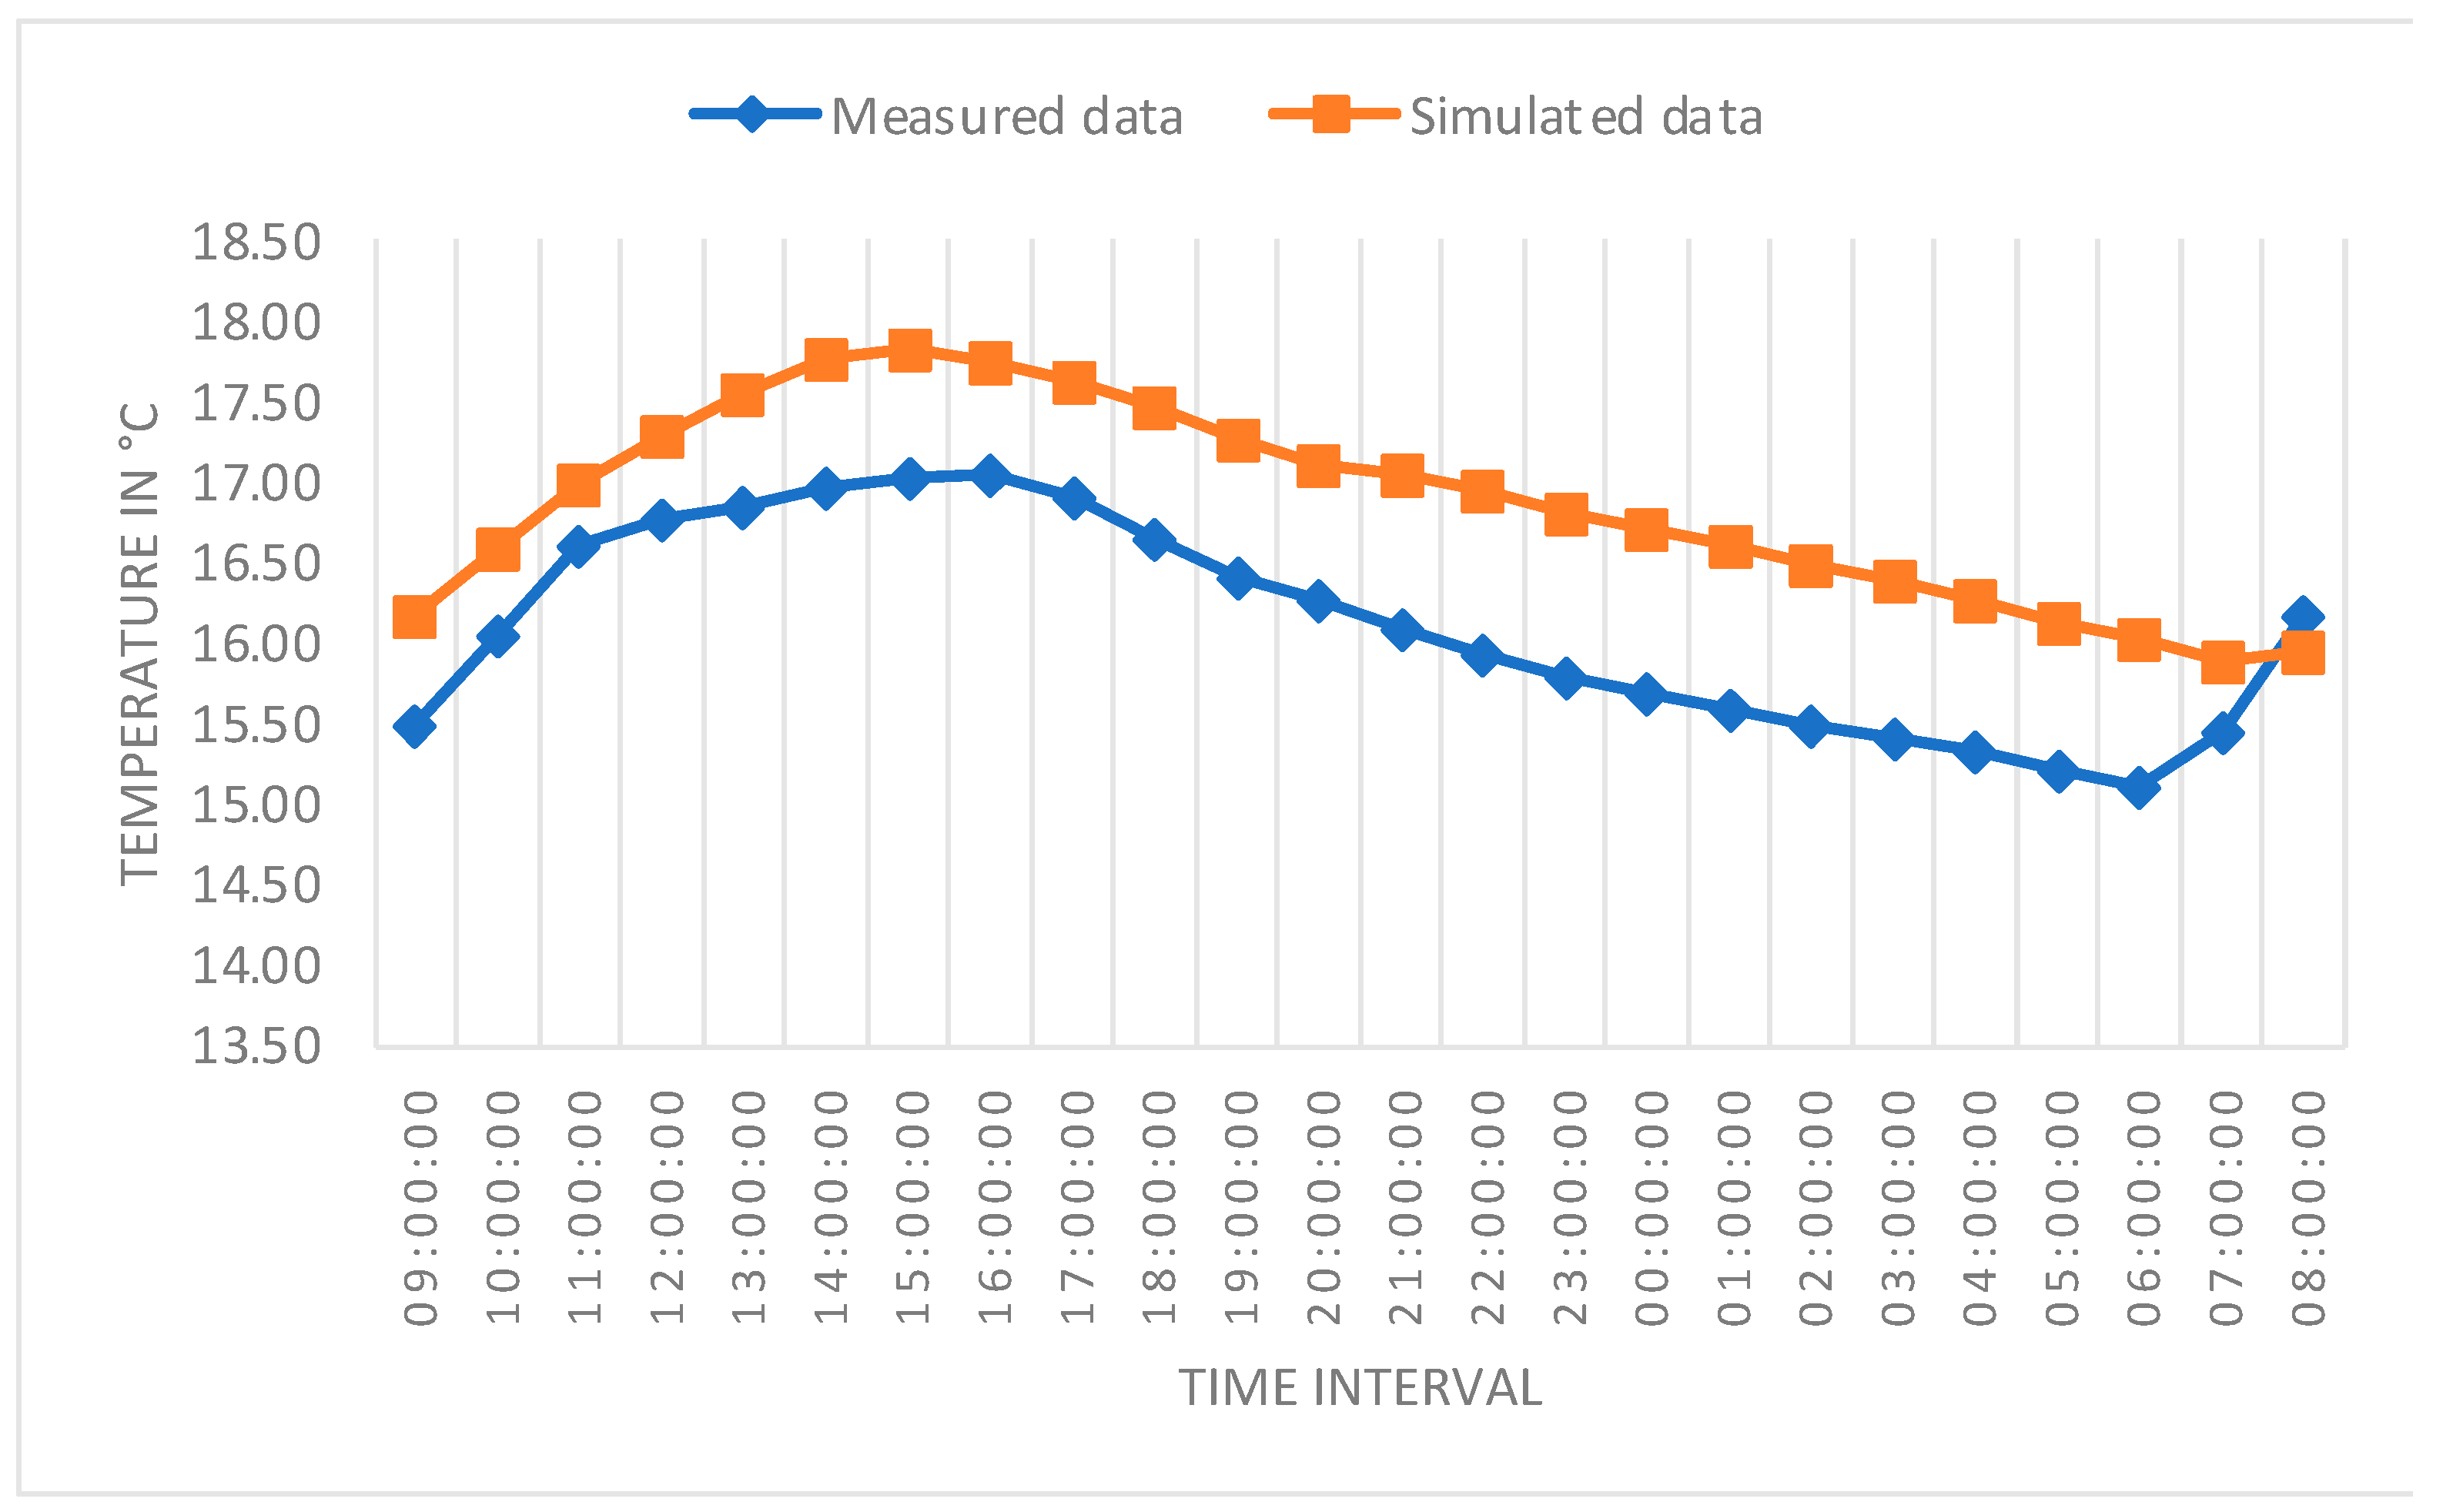
Figure 18). The comparison evaluated indicators used by the scientific community and defined by international organizations such as the American Society of Heating, Refrigerating and Air Conditioning (ASHRAE) and the National Renewable Energy Laboratory (NREL) [
27], which establish acceptable ranges for statistical calibration rates. After calibration, hourly and monthly simulation data for an entire year could be obtained. A model is considered valid if the difference between the simulated and monitored values falls within the acceptable range defined by international standards (RMSE 10% and NBME 25%) [
28,
29]. Two well-accepted statistical indicators for model validation are the normalized mean bias error (NBME) and the root mean square error of the bias (RMSE). To assess the correlation between the simulation and monitoring results, specific criteria were adopted. These criteria are formally defined as follows:
In this study, the simulated temperature values (tip) of node i were compared to the monitored temperature values (tmi) of node i, where the arithmetic means of a sample of n measured temperature data (tm) were calculated, and n was the number of monitored temperature data during the monitoring period. The normalized mean bias error (NMBE) indicator provided information on the difference between the simulated and measured temperatures. A positive NMBE value indicated that the simulated temperatures were higher than the monitored data, whereas a negative value indicated that the simulated temperatures were lower than the monitored temperatures. The ideal NMBE value was zero.
The coefficient of variation of the root mean square error (CV(RMSE)) indicator quantifies the relative correlation, expressed as a percentage, between the differences (simulated temperatures minus monitored temperatures) and the average of all the monitored temperatures [
24,
26]. The CV(RMSE) value is always positive, and an ideal value would be zero, indicating optimal accuracy. NMBE values, on the other hand, indicate the presence of systematic error or bias in the simulation. In contrast, CV(RMSE) serves as an indicator of precision, reflecting how closely the simulated results align with the monitored data. The temperature differences between the monitored and simulated temperatures in the main room are presented in
Table 5. Additionally, the coefficient of variation of the root mean square error (CV(RMSE)) was calculated, which was 4.46%, and the normalized mean bias error (NMBE) was found to be 4.28%. Both values were below the maximum validation threshold of 25% recommended by the ASHRAE [
28].
3.3. Assessment of Annual Thermal Performance
A comprehensive one-year simulation of the building was conducted using the validated model and its corresponding input parameters for annual simulations. In order to examine the dynamic free-running thermal behavior of the living room environment, the impact of free gains was deliberately disregarded.
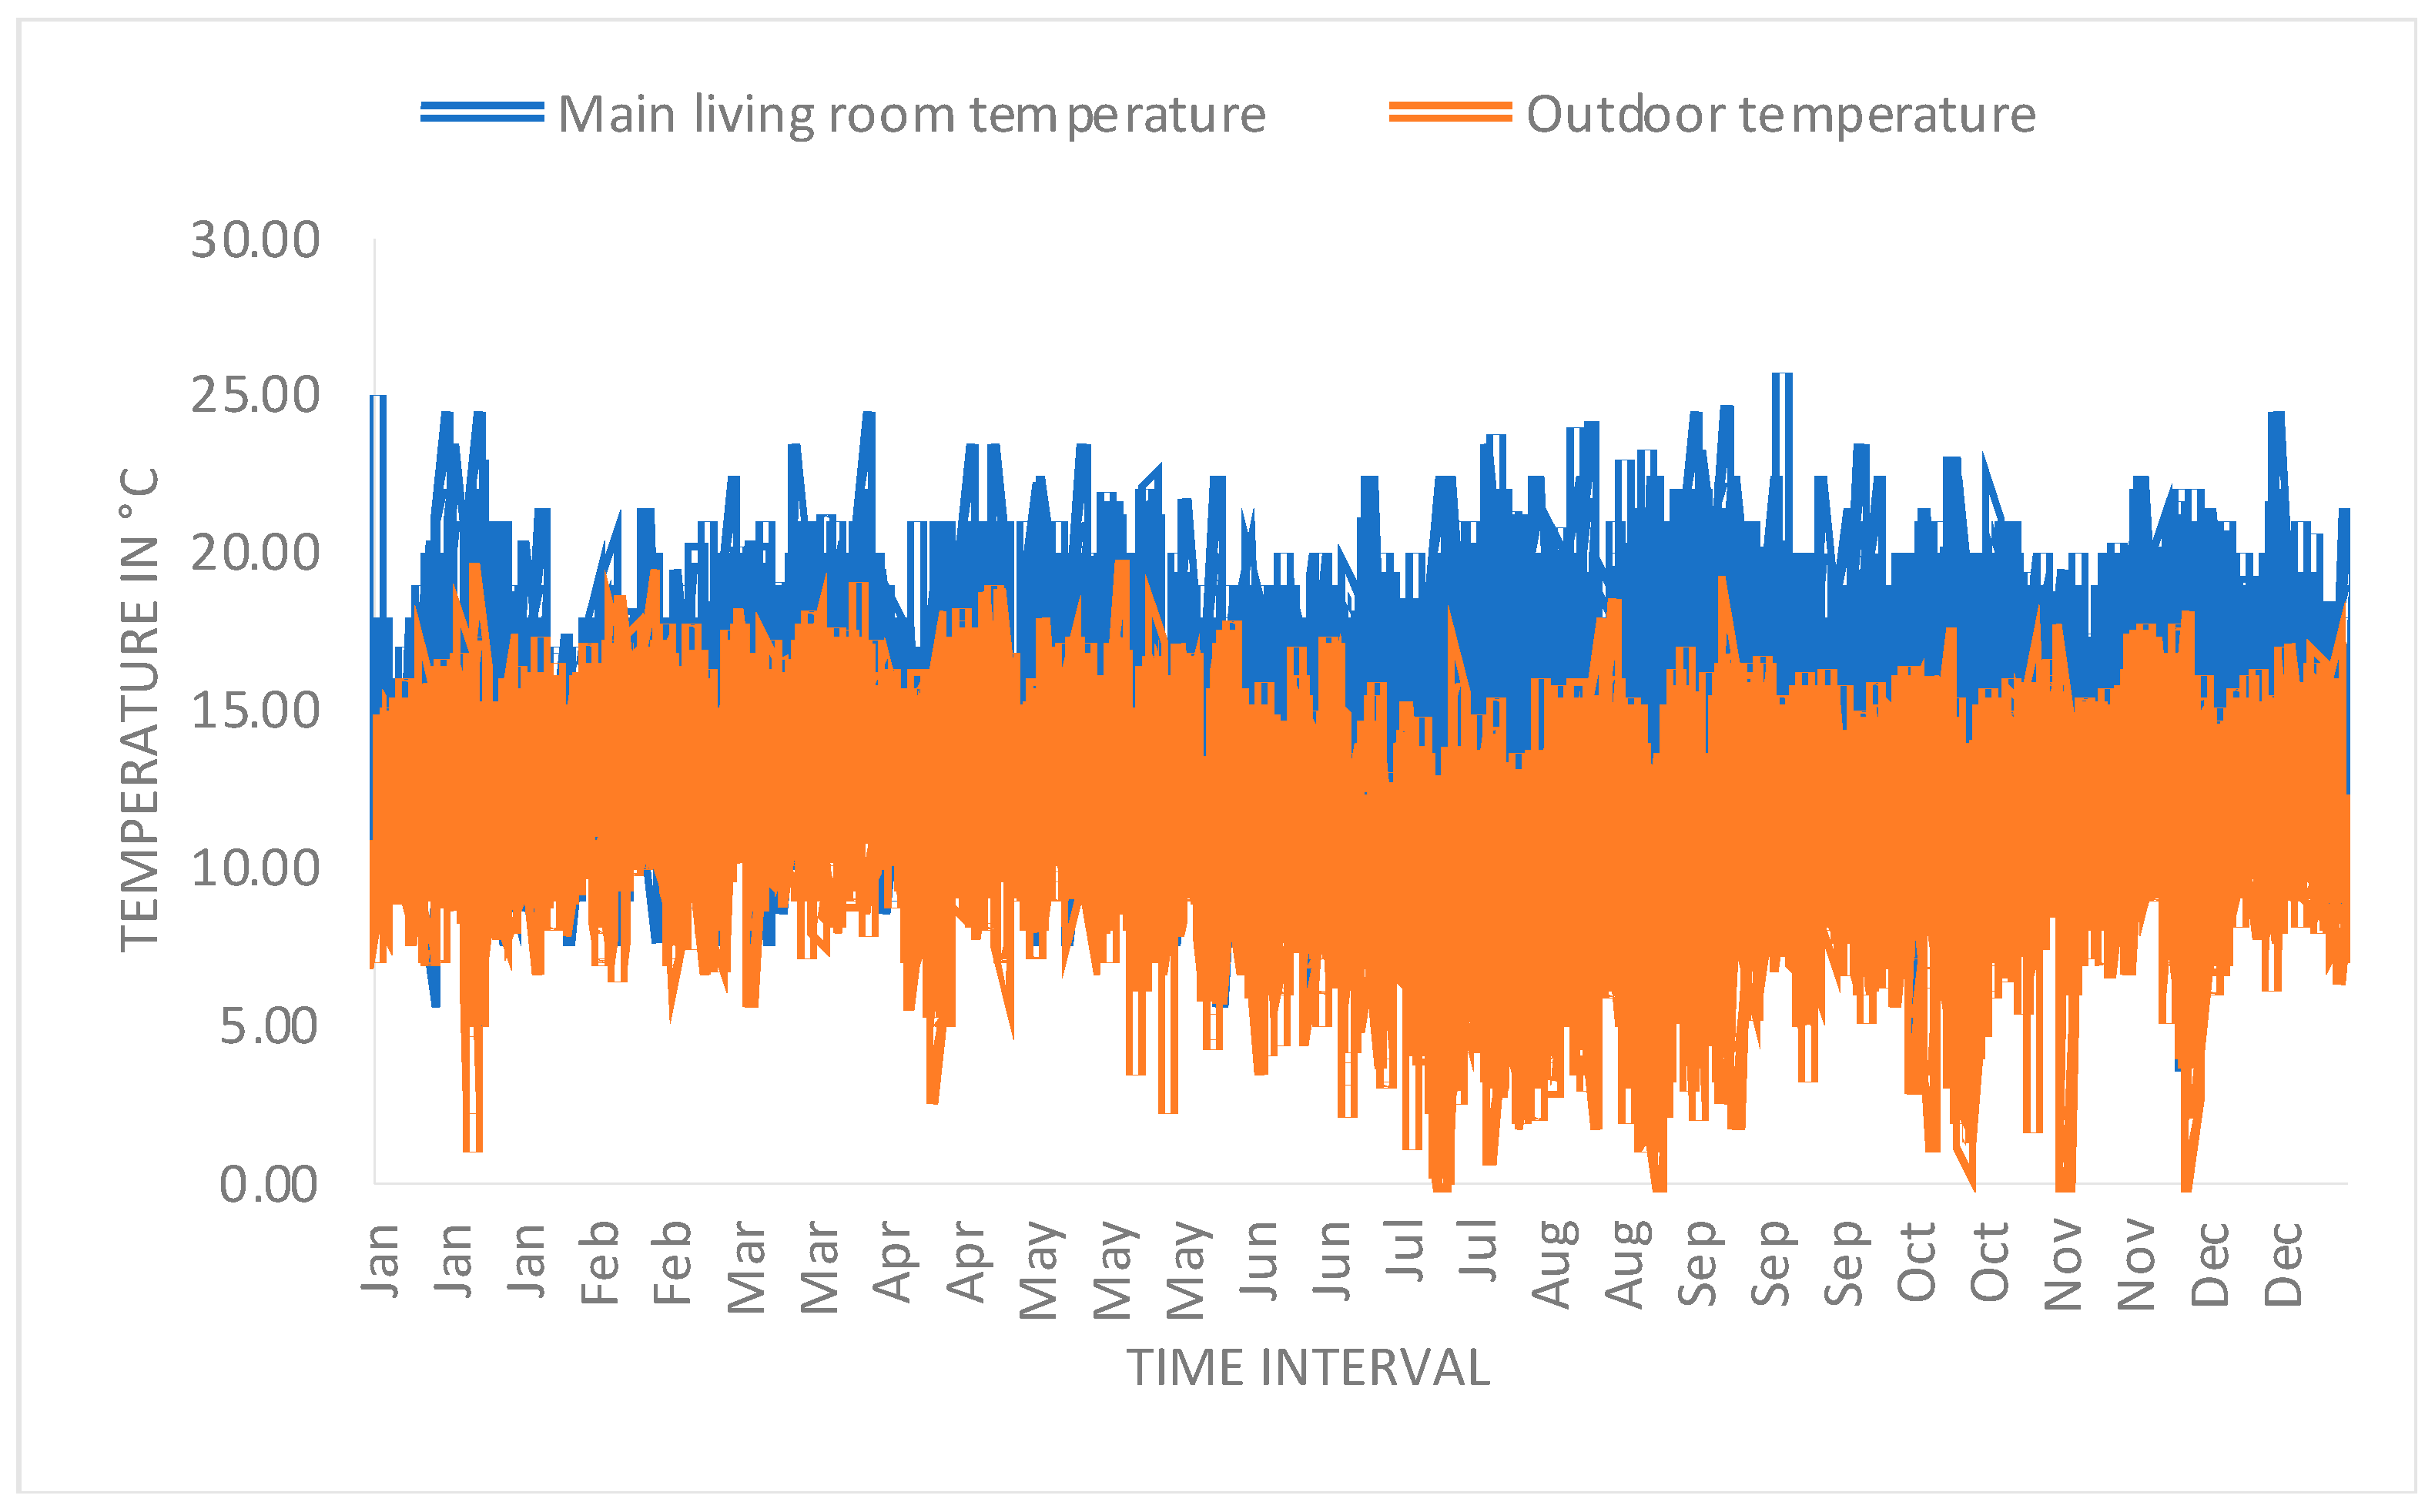
Figure 19 presents the annual differences in the temperature of the simulated main living room and the outside temperature. It can be observed that the outdoor temperatures are representative of cities located at altitudes between 2000 and 3000 m above sea level in the Andean Mountain region on the Equatorial Line (such as the city of Azogues), which have a cold climate that affects the indoor temperatures of buildings. Regarding the indoor thermal comfort range between 18 °C and 22 °C, it can be observed that the simulated temperatures are mostly below the range. The number of hours per year that the building is below 18 °C is 7.338 h, that below 16 °C is 6.207 h, and that below 10 °C is 538 h. These values show that the indoor environment of the building, despite having temperatures below the comfort range, never reaches extreme cold temperatures or below 0 °C, which is a characteristic of buildings that do not have active heating systems. This has caused the residents to adapt to lower temperatures and compensate for them with clothing [
20].
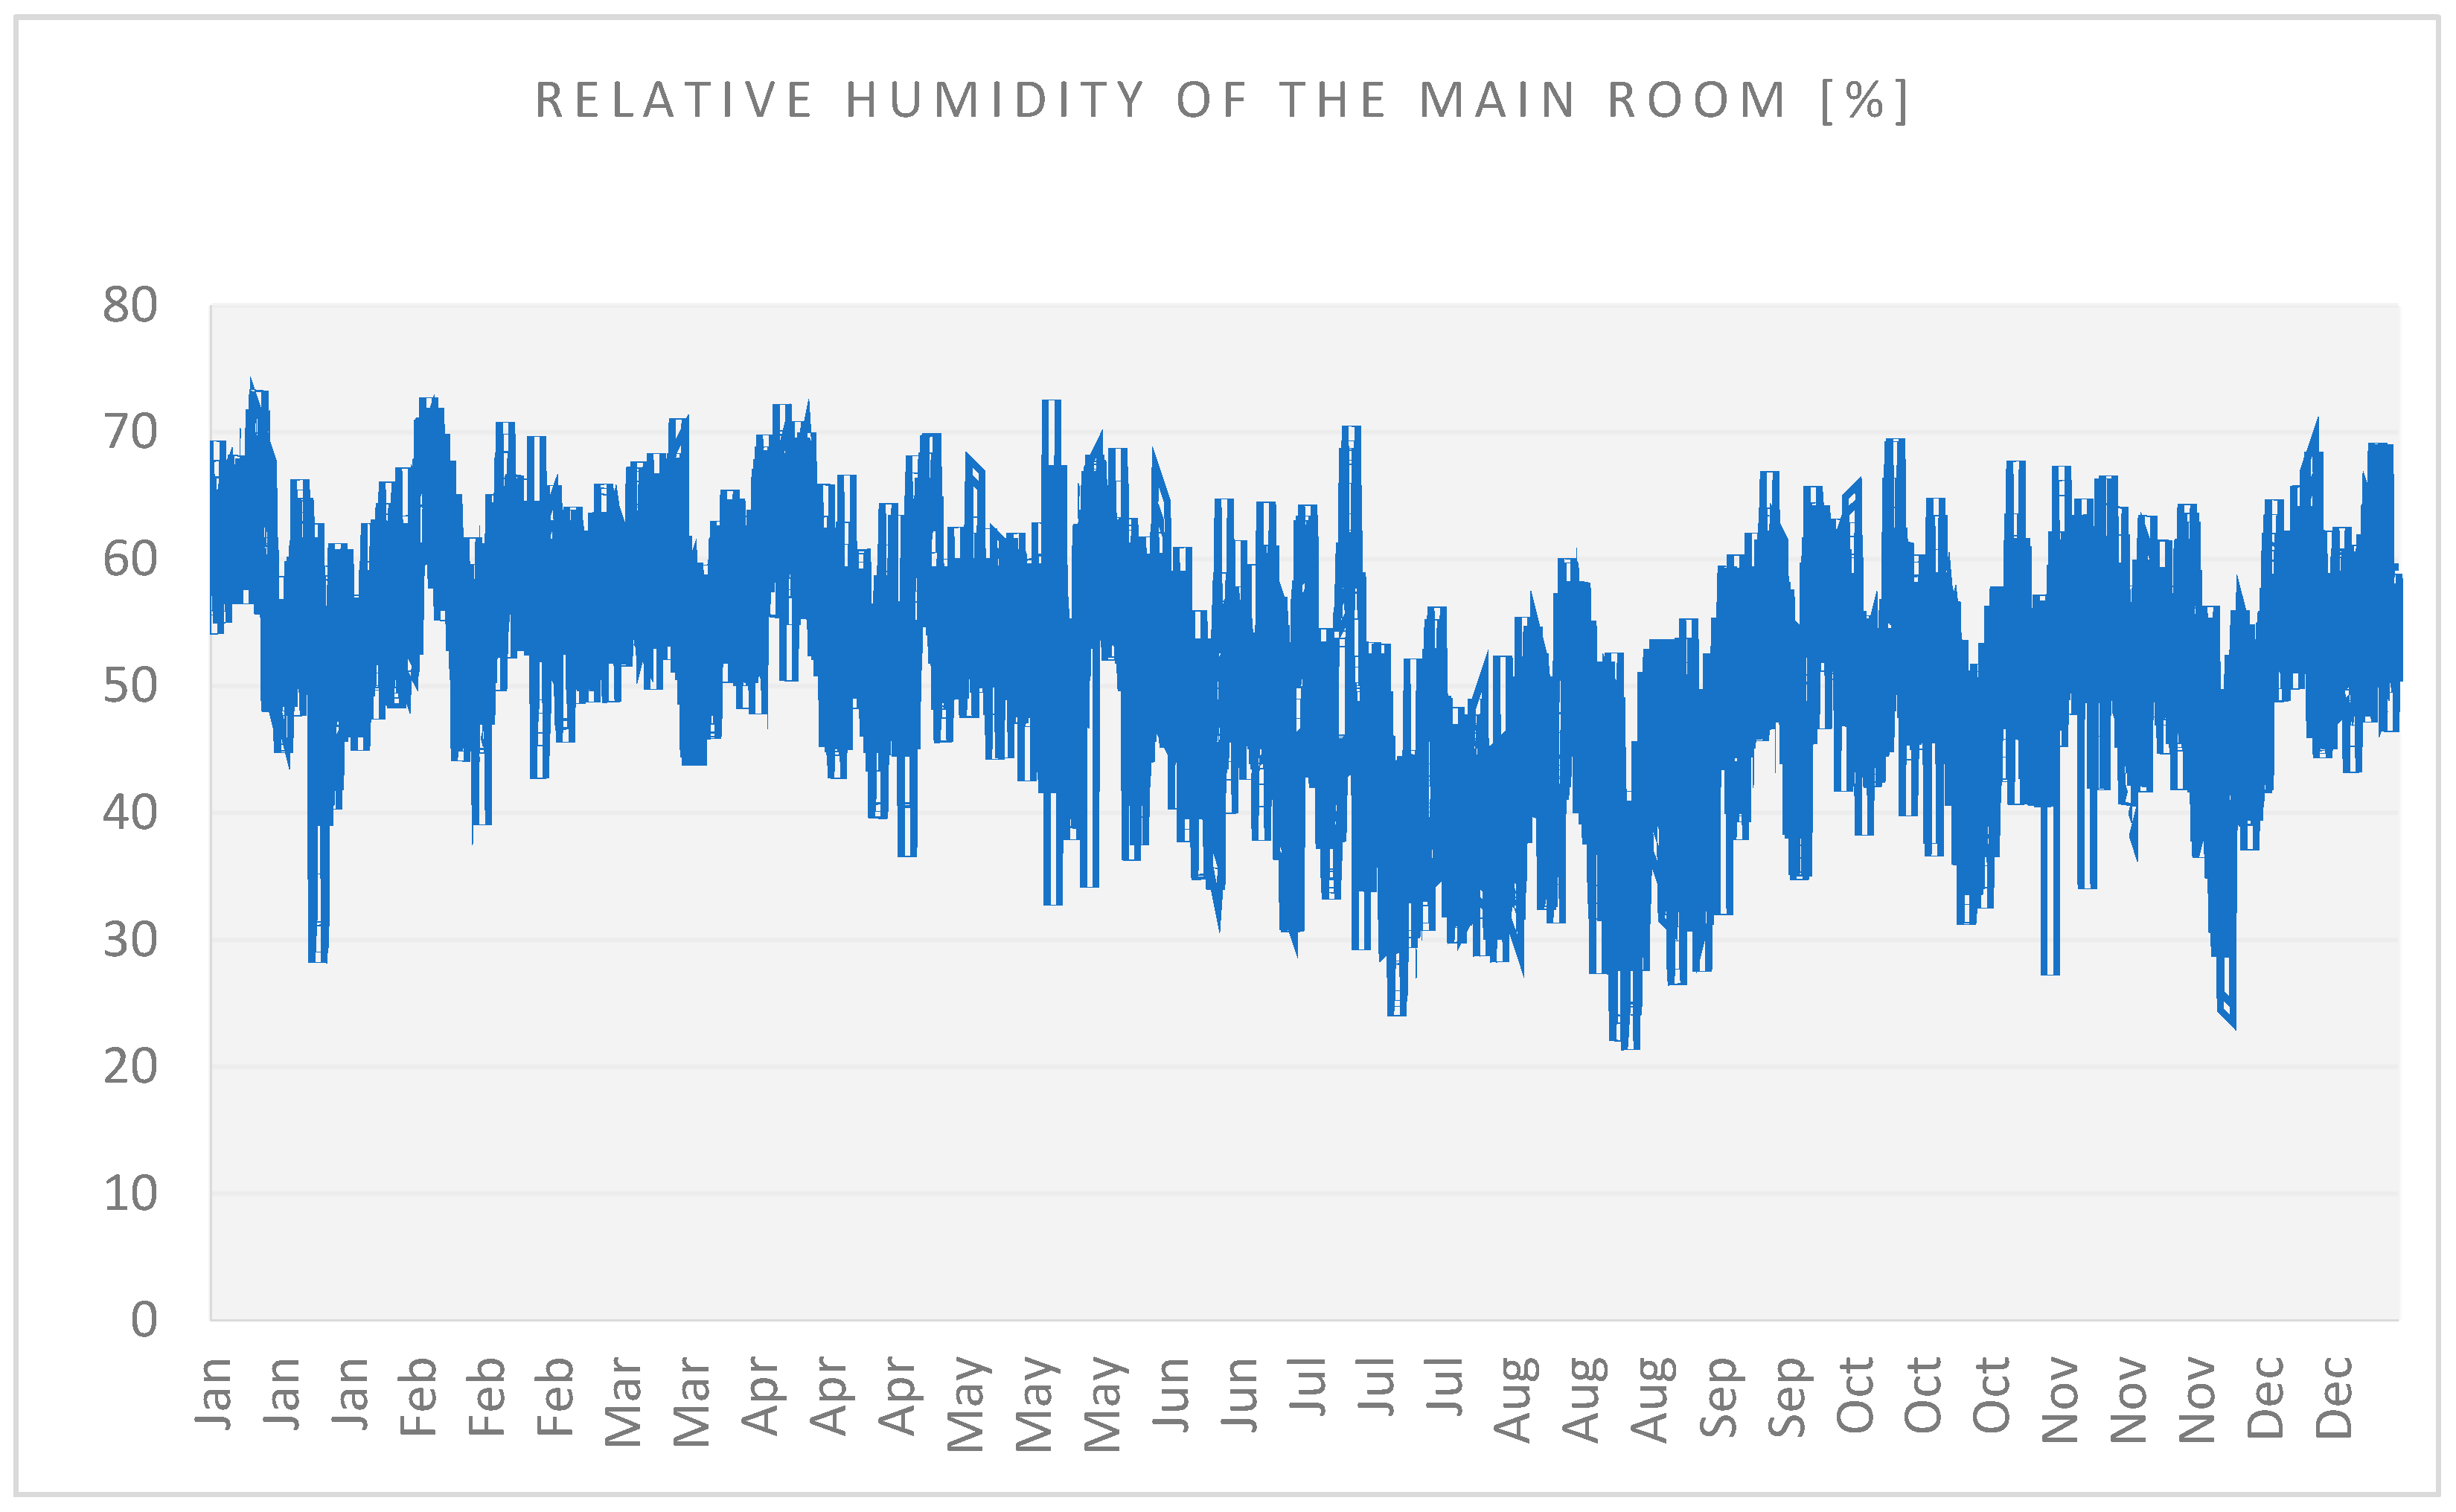
Figure 20 presents data on the relative humidity throughout one year at an hourly resolution. The humidity ratio in the main living room ranged from 4 to 11.7 g of water vapor per kilogram of dry air. The upper limit of relative humidity was set at 70%, indicating that the relative humidity values did not exceed this threshold throughout the evaluation period.
In
Figure 19, the dashed line of simulated temperatures for one year in the living room shows the range obtained, with indoor temperatures ranging from 15 °C to 18 °C and relative humidity between 2 and 9 g of water vapor per kg of dry air, with an acceptable upper limit of 19 g of water vapor per kg of dry air and maximum acceptable relative humidity of 70%. This indicates that the traditional courtyard houses in the city of Azogues adapt well to the local climatic conditions, primarily due to their thermal masses. Additionally, the higher simulated temperatures in the living room compared to the exterior, even at night, demonstrate that the case study has passive design strategies that improve the indoor temperatures. This temperature value could potentially improve if the U-value of the thermal transmittance of the building’s envelope decreases to 2.35, as stipulated by local regulations. In this way, the internal thermal gains would be retained, and more appropriate thermal comfort standards could be achieved.
If we analyze the annual thermal performance of the building with the temperature and relative humidity data from the living room, we can verify that the simulated temperature in the main room exceeds the 16 °C recorded during the monitoring period. Additionally, the annual relative humidity of the simulated main room matches the relative humidity recorded in the same space at 70%, allowing the building’s occupants to adapt to the indoor environment despite having slightly lower temperatures than those recognized as the comfort range.
4. Conclusions
The traditional vernacular architecture of Azogues represents a rich source of knowledge and ancestral wisdom that contributes to sustainable development. However, studies on vernacular architecture remain limited.
The qualitative analysis conducted on the dwelling in the present study reveals that the strategies employed in the passive design of existing vernacular houses in Azogues are effective in coping with the local climatic conditions. This response is primarily supported by the thermal insulation of the building envelope, the buffering space (central courtyard), and the shape and orientation of the house in relation to the prevailing wind direction.
The placement of the main spaces that enclose the building around the central courtyard, as well as the surrounding corridors, also contributes to generating shade for the interior spaces located on the ground floor and to protecting the indoor thermal environment from solar radiation.
The passive features also contribute to improving the thermal insulation of the building, such as the use of locally sustainable materials in the construction of the building envelope, which is composed of bahareque. The relationship between the filled openings and the central courtyard allows natural light to enter the interior spaces, enhancing the thermal comfort of the dwelling. The in situ measurements conducted in the building align closely with the findings derived from the qualitative analysis. The experimental monitoring revealed that the traditional house benefits from natural ventilation. However, to avoid high air velocities within the spaces, it is advisable to avoid simultaneously opening a door and window in the direction of the prevailing external wind.
The experimental stages of monitoring and in situ measurements, followed by validation through dynamic simulation in EnergyPlus/Open Studio, were crucial for the studied building typology, which involved a higher degree of uncertainty and complexity. Only through this approach was it possible to quantify the thermal behavior of the building. However, there were limitations in the monitoring time for indoor environmental parameters, and it is recommended to extend the monitoring period for as long as possible to obtain more comprehensive data.
This study concludes that the climate-responsive strategies of traditional houses inspired by vernacular architecture, primarily based on natural ventilation, solar protection, thermal buffering, and heavy thermal mass, are effective in providing improved thermal comfort on hot days and cold nights.
The optimal use of local resources, a good location and geographic orientation, and an optimal building layout, along with a reasonable interior environment and the design of window openings can contribute to improving the thermal comfort of a building, even without the consumption of fossil fuels. Based on these findings, it is important to suggest that the passive design strategies used in traditional houses be employed, as much as possible, by new generations of architects and construction engineers in modern buildings located in climatic zones similar to those of the city of Azogues.
Author Contributions
Conceptualization, F.Q.-M.; Methodology, P.M.-G. and F.Q.-M.; Investigation, P.M.-G.; Writing—original draft, P.M.-G. and F.Q.-M.; Writing—review and editing, F.Q.-M.; Project administration, F.Q.-M. All authors have read and agreed to the published version of the manuscript.
Funding
The project “Urban sustainability indicators for the city of Cuenca, Ecuador” was funded by the Catholic University of Cuenca. Grant number PICVII19-81.
Data Availability Statement
Data are contained within the article.
Acknowledgments
The authors wish to express their gratitude to the Catholic University of Cuenca and its Research Vice-Rectorate for providing the necessary funds for the research project “Urban sustainability indicators for the city of Cuenca, Ecuador”.
Conflicts of Interest
The authors declare no conflict of interest.
References
- Li, Y.; Kubicki, S.; Guerriero, A.; Rezgui, Y. Review of building energy performance certification schemes towards future improvement. Renew. Sustain. Energy Rev. 2019, 113, 109244. [Google Scholar] [CrossRef]
- United Nations. World Population Prospects 2019: Highlights; United Nations: New York, NY, USA, 2019. [Google Scholar]
- Hennicke, P.; Bodach, S. Energierevolution: Effizienzsteigerung und Erneuerbare Energien als neue Globale Herausforderung; Oekom Verlag GmbH: Munich, Germany, 2010. [Google Scholar]
- Fernandes, J.; Mateus, R.; Gervásio, H.; Silva, S.M.; Bragança, L. Passive strategies used in Southern Portugal vernacular rammed earth buildings and their influence in thermal performance. Renew. Energy 2019, 142, 345–363. [Google Scholar] [CrossRef]
- Bodach, S.; Lang, W.; Hamhaber, J. Climate responsive building design strategies of vernacular architecture in Nepal. Energy Build. 2014, 81, 227–242. [Google Scholar] [CrossRef]
- Holmes, M.; Hacker, J. Climate change, thermal comfort and energy: Meeting the design challenges of the 21st century. Energy Build. 2007, 39, 802–814. [Google Scholar] [CrossRef]
- Zou, Y.; Guo, J.; Xia, D.; Lou, S.; Huang, Y.; Yang, X.; Zhong, Z. Quantitative analysis and enhancement on passive survivability of vernacular houses in the hot and humid region of China. J. Build. Eng. 2022, 71, 106431. [Google Scholar] [CrossRef]
- Gou, S.; Li, Z.; Zhao, Q.; Nik, V.M.; Scartezzini, J.-L. Climate responsive strategies of traditional dwellings located in an ancient village in hot summer and cold winter region of China. Build. Environ. 2015, 86, 151–165. [Google Scholar] [CrossRef]
- Mohamed, M.; Klingmann, A.; Samir, H. Examining the Thermal Performance of Vernacular Houses in Asir Region of Saudi Arabia. Alex. Eng. J. 2019, 58, 419–428. [Google Scholar] [CrossRef]
- Sun, F. Chinese Climate and Vernacular Dwellings. Buildings 2013, 3, 143–172. [Google Scholar] [CrossRef]
- Cardinale, N.; Rospi, G.; Stefanizzi, P. Energy and microclimatic performance of Mediterranean vernacular buildings: The Sassi district of Matera and the Trulli district of Alberobello. Build. Environ. 2013, 59, 590–598. [Google Scholar] [CrossRef]
- He, W.; Wu, Z.; Jin, R.; Liu, J. Organization and evolution of climate responsive strategies, used in Turpan vernacular buildings in arid region of China. Front. Archit. Res. 2023, 12, 556–574. [Google Scholar] [CrossRef]
- Abbaas, E.a.S.; Saif, A.e.A.; Munaaim, M.; Othuman Mydin, M.A. Influence of Courtyard Ventilation on Thermal Performance of Office Building in Hot-Humid Climate: A Case Study. E3S Web Conf. 2018, 34, 02053. [Google Scholar] [CrossRef]
- Dili, A.S.; Naseer, M.A.; Varghese, T.Z. Passive environment control system of Kerala vernacular residential architecture for a comfortable indoor environment: A qualitative and quantitative analyses. Energy Build. 2010, 42, 917–927. [Google Scholar] [CrossRef]
- Sharifi, A.; Murayama, A. Changes in the traditional urban form and the social sustainability of contemporary cities: A case study of Iranian cities. Habitat Int. 2013, 38, 126–134. [Google Scholar] [CrossRef]
- Weather Spark. Climate and Average Weather Year Round in Azogues Ecuador. Available online: https://weatherspark.com/y/20017/Average-Weather-in-Azogues-Ecuador-Year-Round (accessed on 24 July 2023).
- Meteoblue. Observed Historical Climate & Weather Data for Azogues. Available online: https://www.meteoblue.com/en/weather/historyclimate/climateobserved/azogues_ecuador_3660434 (accessed on 24 July 2023).
- INPC. Urban Architectural Inventory from the City of Azogues—Cañar; INPC: Azogues, Ecuador, 2000. [Google Scholar]
- Jasim, I.A.; Farhan, S.L.; Al-Maliki, L.A.; Al-Mamoori, S.K. Climatic Treatments for Housing in the Traditional Holy Cities: A Comparison between Najaf and Yazd Cities. IOP Conf. Ser. Earth Environ. Sci. 2021, 754, 012017. [Google Scholar] [CrossRef]
- Quesada, F.; Bustillos, D. Indoor Environmental Quality of Urban Residential Buildings in Cuenca—Ecuador: Comfort Standard. Buildings 2018, 8, 90. [Google Scholar] [CrossRef]
- Hao, S.; Yu, C.; Xu, Y.; Song, Y. The Effects of Courtyards on the Thermal Performance of a Vernacular House in a Hot-Summer and Cold-Winter Climate. Energies 2019, 12, 1042. [Google Scholar] [CrossRef]
- National Laboratory of the U.S. Department of Energy. OpenStudio. Available online: https://openstudio.net/ (accessed on 24 July 2023).
- MIDUVI. Ecuadorian Construction Standard: Energy Efficiency in Residential Buildings; MIDUVI: Quito, Ecuador, 2018; Available online: https://www.habitatyvivienda.gob.ec/wp-content/uploads/downloads/2019/03/NEC-HS-EE-Final.pdf (accessed on 24 July 2023).
- Aruta, G.; Ascione, F.; Bianco, N.; Iovane, T.; Mauro, G.M. A responsive double-skin façade for the retrofit of existing buildings: Analysis on an office building in a Mediterranean climate. Energy Build. 2023, 284, 112850. [Google Scholar] [CrossRef]
- Ascione, F.; Bianco, N.; Iovane, T.; Mauro, G.M.; Napolitano, D.F.; Ruggiano, A.; Viscido, L. A real industrial building: Modeling, calibration and Pareto optimization of energy retrofit. J. Build. Eng. 2020, 29, 101186. [Google Scholar] [CrossRef]
- Nguyen, A.T.; Reiter, S. An investigation on thermal performance of a low cost apartment in hot humid climate of Danang. Energy Build. 2012, 47, 237–246. [Google Scholar] [CrossRef]
- U.S. Department of Energy. M&V Guidelines: Measurement and Verification for Performance-Based Contracts Version 4.0.; Federal Energy Management Program. 2015. Available online: https://www.energy.gov/node/1413841 (accessed on 24 July 2023).
- ASHRAE. ASHRAE Handbook—Fundamentals; ASHRAE: Atlanta, GA, USA, 2021. [Google Scholar]
- ASHRAE. ASHRAE Guideline 14-2002, Measurement of Energy and Demand Savings; ASHRAE: Atlanta, GA, USA, 2002. [Google Scholar]
Figure 1.
Azogues city location.
Figure 1.
Azogues city location.
Figure 2.
Wind rose for the city of Azogues [
17].
Figure 2.
Wind rose for the city of Azogues [
17].
Figure 3.
Typologies of traditional houses. (a) house with a “central courtyard”, (b) an “L” shaped house, (c) a house with a “central courtyard” and orchard at the back.
Figure 3.
Typologies of traditional houses. (a) house with a “central courtyard”, (b) an “L” shaped house, (c) a house with a “central courtyard” and orchard at the back.
Figure 4.
Types of building envelopes found in the facades of heritage houses in the city of Azogues. (a) house with bahareque walls, (b) house with stone facade, (c) house with wooden facade.
Figure 4.
Types of building envelopes found in the facades of heritage houses in the city of Azogues. (a) house with bahareque walls, (b) house with stone facade, (c) house with wooden facade.
Figure 5.
Internal images of the selected building for the study. (a) west facing gallery, (b) galleries facing the main street and north, (c) gallery facing the main street.
Figure 5.
Internal images of the selected building for the study. (a) west facing gallery, (b) galleries facing the main street and north, (c) gallery facing the main street.
Figure 6.
Plan views of the chosen representative residence, displaying the positions where data monitoring took place.
Figure 6.
Plan views of the chosen representative residence, displaying the positions where data monitoring took place.
Figure 7.
Short-term variation in wind speed monitored during the morning.
Figure 7.
Short-term variation in wind speed monitored during the morning.
Figure 8.
Smoke tracer for determination of wind direction during the morning.
Figure 8.
Smoke tracer for determination of wind direction during the morning.
Figure 9.
Short-term variation in wind speed monitored during the afternoon.
Figure 9.
Short-term variation in wind speed monitored during the afternoon.
Figure 10.
Smoke tracer for determination of wind direction during the afternoon.
Figure 10.
Smoke tracer for determination of wind direction during the afternoon.
Figure 11.
Short-term variation in wind speed monitored during the night.
Figure 11.
Short-term variation in wind speed monitored during the night.
Figure 12.
Smoke tracer used to determine wind direction during the night.
Figure 12.
Smoke tracer used to determine wind direction during the night.
Figure 13.
Smoke tracer for determination of wind direction in the main hall.
Figure 13.
Smoke tracer for determination of wind direction in the main hall.
Figure 14.
Variation in air temperature at diverse monitoring points.
Figure 14.
Variation in air temperature at diverse monitoring points.
Figure 15.
Variation in relative humidity at diverse monitoring points.
Figure 15.
Variation in relative humidity at diverse monitoring points.
Figure 16.
Variation in surface temperature of envelopes in bedroom 7.
Figure 16.
Variation in surface temperature of envelopes in bedroom 7.
Figure 17.
Constructed simulation model and model validation procedure.
Figure 17.
Constructed simulation model and model validation procedure.
Figure 18.
Temperature difference between monitored and simulated values in the main room.
Figure 18.
Temperature difference between monitored and simulated values in the main room.
Figure 19.
Variations in air temperature of the main room over one year.
Figure 19.
Variations in air temperature of the main room over one year.
Figure 20.
Variations in relative humidity of the main room over one year.
Figure 20.
Variations in relative humidity of the main room over one year.
Table 1.
The climatic data for the city of Azogues [
16].
Table 1.
The climatic data for the city of Azogues [
16].
| Month | January | February | March | April | May | June | July | August | September | October | November | December |
| Average temperature °C | 12 | 12 | 13 | 13 | 11 | 9 | 8 | 8 | 9 | 10 | 11 | 11 |
| Maximum temperature °C | 15 | 15 | 16 | 16 | 14 | 11 | 10 | 10 | 12 | 12 | 13 | 14 |
| Minimum temperature °C | 9 | 10 | 10 | 10 | 9 | 7 | 6 | 6 | 7 | 8 | 8 | 9 |
| Rain (mm) | 53.1 | 80.8 | 94.8 | 78.2 | 56.4 | 43.3 | 28.3 | 23.1 | 31.1 | 51.1 | 50.8 | 52.9 |
| Rainy days | 11.7 | 14.6 | 17.5. | 15.5 | 12.1 | 9.6 | 7.5 | 6.3 | 8.1 | 11.6 | 10.9 | 11.3 |
| Hours of sun | 12.3 | 12.2 | 12.1 | 12.0 | 12.0 | 12.0 | 12.0 | 12.0 | 12.1 | 12.2 | 12.2 | 12.3 |
Table 2.
Technical specifications of measurement instruments.
Table 2.
Technical specifications of measurement instruments.
| Parameters | Instrument | Measurement Range | Accuracy | Resolution |
|---|
| Air Temperature/Relative Humidity | HOBO MX1101 Temperature/Relative Humidity Data Logger | −20 °C to 70 °C | ±0.2 °C and ±2%RH | 0.024 °C at 25 °C
0.01%RH |
| Wall U-Value | Testo 635-1 and temperature probe to determine
U-value | −20 °C to +70 °C | ±(0.1 °C + 0.2% of mv) | 0.01 W/m2 K |
| Wind Speed | Testo 410-2 Vane anemometer | 0.4 m/s to 20 m/s | ±(0.2 m/s + 2% of mv) | 0.1 m/s |
Table 3.
Short-term experimental tests of natural ventilation in the building.
Table 3.
Short-term experimental tests of natural ventilation in the building.
| Experiment | Experimental Conditions | Location of Experimental Points | Experiment Duration |
|---|
| 1 | Doors A, B, and C were opened, while all other doors were closed. | Door A and C | 10:00:00–10:15:00 |
| 2 | All doors were closed except for Door A. | Door A and central courtyard | 15:00:00–15:15:00 |
| 3 | Doors A, B, and C were opened, while all other doors were closed. | Door A, central courtyard, and Door C | 19:30:00–19:40:00 |
Table 4.
Thermophysical parameters of the simulated building.
Table 4.
Thermophysical parameters of the simulated building.
| Building Envelope Component | Thickness (m) | Thermal Conductivity (W/Km) | Density (kg/m3) | Specific Heat (J/kgK) | U Factor (W/m2K) |
|---|
| Interior Bahareque Wall | 0.17 | 1.28 | 1460 | 880 | 3.48 |
| Exterior Bahareque Wall | 0.17 | 1.28 | 1460 | 880 | 3.48 |
| Upper Wood Floor | 0.21 | 0.13 | 840 | 1381 | 0.02 |
| Ground Wood Floor | 0.21 | 0.13 | 840 | 1381 | 0.3 |
| Interior Wood Ceiling | 0.015 | 0.13 | 840 | 1381 | 0.02 |
| Clay Tile | 0.015 | 1.00 | 2000 | 800 | 3.22 |
| Wood Door | 0.06 | 0.19 | 700 | 2390 | 1.59 |
| Exterior Wood Window | 0.06 | 0.19 | 700 | 2390 | 1.59 |
| Interior Glass Window | Thickness (m) | U-Factor | Glass SHGC | Clear glass |
| | (W/m2 K) | Transmitance |
| Interior Glass Window | 0.004 | 5.781 | 0.862 | 0.898 |
Table 5.
Temperature differences between monitored and simulated data in the main room. NMBE and CV (RMSE) values.
Table 5.
Temperature differences between monitored and simulated data in the main room. NMBE and CV (RMSE) values.
| Time | Measured Data | Simulated Data | NMBE (%) | CV (RMSE) (%) |
|---|
| 09:00:00 | 15.49 | 16,17 | 4.28 | 4.46 |
| 10:00:00 | 16.06 | 16.59 |
| 11:00:00 | 16.61 | 16.99 |
| 12:00:00 | 16.77 | 17.28 |
| 13:00:00 | 16.84 | 17.56 |
| 14:00:00 | 16.97 | 17.76 |
| 15:00:00 | 17.02 | 17.83 |
| 16:00:00 | 17.05 | 17.75 |
| 17:00:00 | 16.91 | 17.63 |
| 18:00:00 | 16.66 | 17.46 |
| 19:00:00 | 16.42 | 17.27 |
| 20:00:00 | 16.26 | 17.10 |
| 21:00:00 | 16.10 | 17.05 |
| 22:00:00 | 15.93 | 16.95 |
| 23:00:00 | 15.80 | 16.82 |
| 00:00:00 | 15.69 | 16.71 |
| 01:00:00 | 15.60 | 16.60 |
| 02:00:00 | 15.50 | 16.49 |
| 03:00:00 | 15.42 | 16.39 |
| 04:00:00 | 15.33 | 16.28 |
| 05:00:00 | 15.21 | 16.13 |
| 06:00:00 | 15.11 | 16.03 |
| 07:00:00 | 15.45 | 15.89 |
| 08:00:00 | 16.16 | 15.94 |
| Disclaimer/Publisher’s Note: The statements, opinions and data contained in all publications are solely those of the individual author(s) and contributor(s) and not of MDPI and/or the editor(s). MDPI and/or the editor(s) disclaim responsibility for any injury to people or property resulting from any ideas, methods, instructions or products referred to in the content. |
© 2023 by the authors. Licensee MDPI, Basel, Switzerland. This article is an open access article distributed under the terms and conditions of the Creative Commons Attribution (CC BY) license (https://creativecommons.org/licenses/by/4.0/).


