1. Introduction
In steel construction, the structural elements (e.g., beams and columns) are manufactured mainly in an I-shaped form. However, there has been an increase in the demand for profiles with openings on the web, among which the castellated and cellular profiles stand out. Castellated or cellular profiles are manufactured from a laminated profile of type I or H. A longitudinal cut divides the profile into two parts [
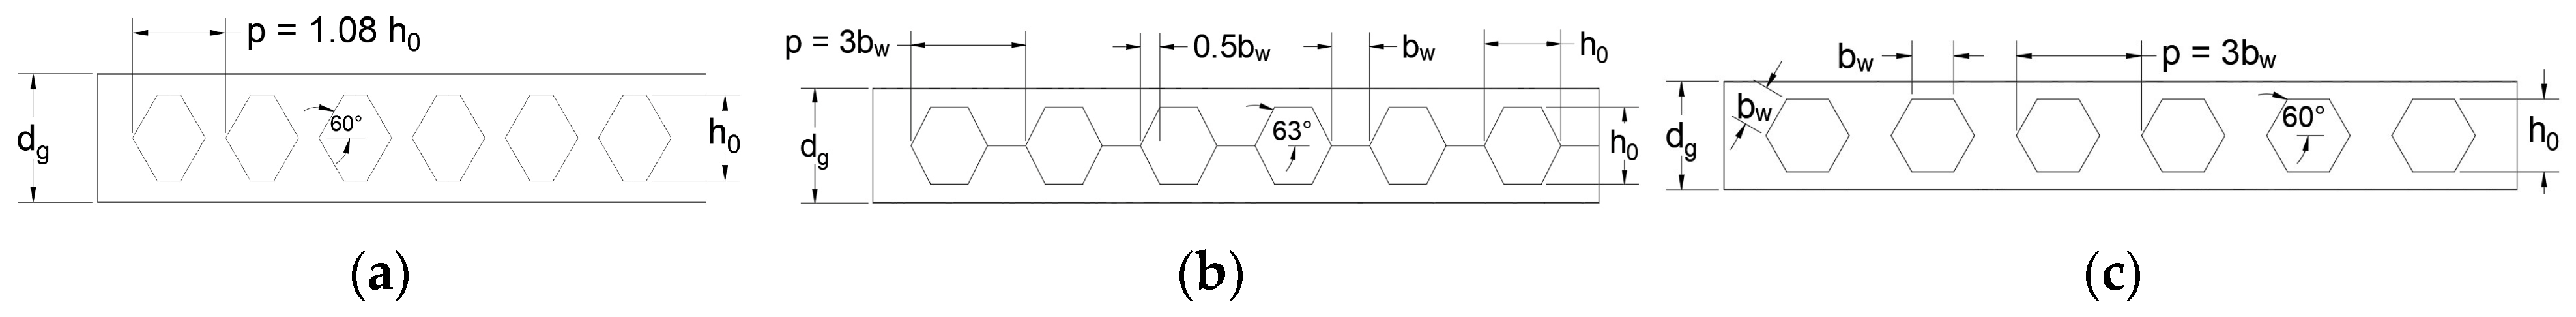
1]. Subsequently, these parts are realigned and welded. Variations in the cut pattern allow for a wide variety of geometries. According to Vieira et al. [
2] the Anglo-Saxon (
Figure 1a), Peiner (
Figure 1b) and Litzka (
Figure 1c) types are the most used.
The main advantage of castellated elements is the increase in flexural stiffness with a lightweight structure. In addition, the service ducts can be positioned through the web openings, reducing the overall height required between floors [
3]. In addition, it can perform better when subjected to explosions and seismic shocks because these elements present a combination of high strength and ductile response [
4,
5,
6]. In contrast, due to the openings, castellated elements have less shear stiffness and this can affect the bending and/or buckling behavior [
7]. As the web panel is responsible for resisting shear forces, at first, it is reasonable to think that this new profile would have greater resistance. However, due to the openings, the behavior of a solid plate (that remains connected on all four sides) no longer exists and consequently the shear stiffness decreases. As a result, new failure modes (formation of Vierendeel mechanism, lateral–torsional buckling of web post and tee local buckling) can occur, potentially reducing the profile’s resistance to bending and/or buckling. Furthermore, the structural behavior of cellular beams in bending is significantly more complex than regular I-shaped beams [
8,
9].
Due to the increase in inertia, these elements are used mainly when subjected to bending on the major axis [
10]. This allows the same amount of material to withstand higher internal stresses, saving material. However, cellular elements and castellated ones can be used when subjected to a combination of bending moment and compressive forces, or even cases in which only one compressive force is present [
10], in addition to presenting a phenomenon defined as instability which can be described as a structural bending under axial compressive load [
11]. El-Sawy et al. [
12] reported that the main reason for using castellated columns is to increase their strength to buckling on the major axis. However, there are still few studies on the structural behavior of castellated and cellular columns.
The influence of shear strains on the elastic buckling behavior by flexion in the axis of greatest inertia of these columns has been investigated by Sweedan et al. [
13] and El-Sawy et al. [
12]. The two works present similar approaches considering that they were carried out by the same researchers. In the articles, reduction factors are proposed for the critical buckling load in the axis of greatest inertia of cellular and castellated columns, and an equivalent bending stiffness is proposed. It was observed that the influence of shear decreases with increasing column length and web width, as well as decreasing opening heights.
Verweij [
14] evaluated the overall buckling behavior of axially loaded cell profiles through a numerical study. When comparing the resistances obtained from finite element simulations with the values proposed, this method proved to be very conservative in several cases. It was not possible to establish an adequate buckling curve but it was observed that the buckling behavior was qualitatively similar to columns without openings.
Subsequently, Yuan et al. [
15] used an analytical analysis to estimate the critical buckling load of axially loaded castellated columns, including the shear effect. The inclusion of shear stress significantly reduced the elements’ resistance, overestimating the critical load by up to 25%, even using a reduced area static moment.
Subsequently, Sonck et al. [
3] experimentally analyzed residual stress on cellular and castellated elements. The manufacturing process led to increased residual compressive stress of the flanges, which caused a decrease in buckling strength capacity. The effect of residual stresses on global buckling resistance of castellated members is more damaging than it is for members without openings.
Subsequently, Sonck and Belis [
10] analyzed the buckling of castellated columns around the minor axis, considering different residual stress distributions. The simulation results showed a significant influence on the modification of the residual stress pattern, reducing the elements’ load capacity. The buckling curves were well adjusted to Eurocode 3 [
16], showing its applicability in profiles with openings.
Gu and Cheng [
17] studied the critical buckling load of cellular pillars. They concentrated on the axis of greatest buckling inertia. It was concluded that the effect of shear strains on the cellular element increased with increasing cross-sectional area of the T-section above the openings and the diameter of the web opening. However, this effect decreased with the thickness of the web and the increase in the length of the cellular element.
Panedpojaman et al. [
18] proposed a method for calculating the elastic buckling frame of pinned support alveolar columns. The study was validated by comparisons with finite element analysis. A parametric study on the section type effect, the ratio and the spacing of the openings, as well as the slimness were evaluated, using numerical methodology. It was observed that the opening spacing affects the buckling load more than the opening ratio does. Furthermore, shear effects decrease the buckling load by less than 10% for cases with slenderness greater than 75.
Panedpojaman et al. [
19] numerically evaluated the behavior of cell pillars subjected to eccentric axial loading. This study aimed to examine the efficiency of using EN 1993-1-1 [
16] and ANSI/AISC-360-16 [
20] standards to design the load capacity of cellular columns around the axis of greatest inertia. For columns with openings, the design buckling strengths are less conservative than with regular columns. It has been observed that design buckling strengths of cell members tend to be overestimated for reduced slenderness less than 1.0.
Lastly, El-Tobgy et al. [
21] numerically and experimentally evaluated cellular pillars subjected to centralized and eccentric axial compression around the axis of least inertia for different expansion factors. It can be concluded that the effect of local buckling increases with the increase in the expansion ratio (K), being more influential in short columns, decreasing their resistance capacity.
This literature review showed that studies of castellated columns are limited, as are studies of the design methods. In addition, several studies performed simplified analysis, without considering geometric and physical imperfections and, in some cases, adopting linear approaches for the load capacity. Thus, the present work evaluates the structural behavior of castellated columns made of three steel profiles (W150 × 37.1, W250 × 73.0 and W360 × 122.0) subjected to axial compression using FEA. The opening types of Anglo-Saxon, Peiner and Litzka with three different expansion factors (k—1.33, 1.50 and 1.67) and eight slenderness ratios (λ—25, 50, 75, 100, 125, 150, 175 and 200) are assessed through 792 numerical models. In this way, this study aims to contribute to the development of design methodologies for castellated elements.
2. Materials and Methods
In order to study the structural behavior of axially loaded castellated columns, finite element models were designed using Abaqus software [
22]. Columns without openings were modeled to validate models. This same methodology was used by other authors [
3,
10,
18], in which they validated their model with columns without openings and, later, inserted the openings.
The steps for the adopted modeling and the two types of analyses performed for each numerical model are presented in the first and second subsections, respectively. The model validation methodology (Phase 1) and the parametric study (Phase 2) are presented below, as well as the statistical treatment of the data.
The results obtained in the linear and nonlinear elastic buckling tests are compared with Euler’s equation and the compressive curve proposed by the Brazilian standard ABNT NBR 8800 [
23], respectively. Based on the methodology considered for columns without openings, a nonlinear buckling analysis of castellated columns with three opening patterns (i.e., Anglo-Saxon, Peiner and Litzka) was performed. Its load capacity was compared to columns without openings. The results adjustment for castellated columns with the curve
λ0 (reduced slenderness ratio) ×
χ (reduction factor associated with compression), proposed by this standard, was verified statistically. It is worth noting that the openings were defined according to the experimental tests, since the numerical model needs to be validated.
2.1. Modeling Calibration—Phase 1
The FEA model validation was carried out in two stages:
First, the numerical model developed was validated with the experiment developed by Hu et al. [
24], in which an I200 section column subjected to compression was used. The force x displacement curve in the midspan was compared with the simulated model.
Second, based on a geometric and physical nonlinear analysis, the load capacity of the solid web column was compared with the load proposed by ABNT NBR 8800 [
23], considering safety factors.
In order to evaluate the most efficient element for the research proposal, a preliminary study was carried out, which consisted of comparing the maximum load obtained by the nonlinear analysis and the model processing time. This comparison is presented in
Section 3. Shell elements of type S4R were used to model structures (steel profile) in which one dimension (i.e., the thickness) was significantly smaller than the other dimensions and the stresses in the thickness direction were negligible. Furthermore, a sensitivity analysis was carried out to select the mesh, opting for a maximum size of 15 mm in the whole model. The mesh was generated automatically by Abaqus (
Figure 2a).
The flanges and the web were modeled by planar shell elements, neglecting the presence of the fillets between the flanges and the web. This modeling option was expected to have an insignificant influence on buckling curves. The models were pinned with support at both ends. Two rigid plates were used at each end to obtain a uniform load distribution in the profile. The plates were connected to the column by means of a “tie” restriction (Constrain), restricting any relative displacement between the plate and the column (
Figure 2b). In order to evaluate the buckling around the major axis, the web translation was restricted in the Z direction (
Figure 2c). In all the models, the load was applied by means of a distributed force on the upper rigid plate in the Y direction (
Figure 2d). The boundary conditions are also illustrated (
Figure 2e,f).
The elastic buckling load was obtained as the first eigenvalue from a linear buckling analysis. In this analysis, the material was modeled as linear elastic with a modulus of elasticity of 200 GPa and a Poisson’s ratio of 0.3. The member was assumed to be perfectly straight and without imperfections, using the same methodology adopted in the literature [
3,
10,
18]. Then, the load capacity was obtained from a geometric and material nonlinear analysis with imperfections, by performing an arc length (i.e., Static Riks) analysis.
The steel used was type ASTM A572 (class 50) with yield stress (
fy) of 345 MPa and ultimate stress of 490 MPa. Residual stress, which reduces the load capacity of columns and influences the structural behavior, was added [
25,
26]. It has been shown that thermal influences during the manufacturing process modify the residual stresses already present in the profile [
3]. Therefore, numerical simulations that do not consider residual stress may lead to unsafe results. It was decided to implement the residual stresses by changing the tension–deformation curve of steel, as proposed by some authors [
27,
28,
29], as shown in
Figure 3. This methodology presents a lower computational cost compared to the implementation of residual stresses using subroutines.
Once the implementation of residual stresses had been defined, the use of the following values was evaluated. To define the amount to be used, a sensitivity study was carried out based on the following values: 0%, 15%, 30% and 45% of the initial steel´s yield strength. After analysis, it was observed that 15% of the steel´s yield strength obtained better results, which was also observed by other authors [
30].
Another factor to be considered in structural behavior is geometric imperfections. According to Madah and Amir [
31], the real buckling mode to be considered in a given structure depends strongly on the initial imperfection. When performing the elastic buckling analysis, the Abaqus software presents the deformed column configurations (eigenvectors), with the maximum horizontal displacement equal to 1. Thus, geometric imperfections were introduced into the computational model considering the horizontal displacement of the first eigenvector (first buckling mode) multiplied by a factor representing imperfection, e.g., L/1500. Therefore, when performing the nonlinear analysis, the computational model had an initial curvature similar to the first eigenvector, whose maximum horizontal displacement was equal to the imperfection value. A comparison was made between the following geometric imperfection values: 0.1 (millimeter), L/3000, L/2500, L/2000 and L/1500. It was noted that the models with imperfections of L/1500 presented the closest values to those prescribed by ABNT NBR 8800 [
23], which is consistent with previous studies [
30,
32,
33,
34]. Therefore, L/1500 was implemented as maximum horizontal displacement in all numerical models.
It is well known that residual stresses and geometric imperfections in the formulation hypotheses are not considered by Euler’s hypothesis. Thus, the Brazilian standard ABNT NBR 8800 [
23] proposes the use of an empirical buckling curve defined by dimensionless factors
, which is the reduction factor associated with compressive strength, and
defined as a reduced slenderness ratio (Equations (1) and (2)).
where
λ0 = √((QA_g f_y)/N_e), Q is the reduction factor associated with local buckling, Ag is the cross-sectional area, fy the yield stress and Ne is the elastic buckling axial force.
The developed FE models were analyzed in two steps: first, an elastic buckling analysis (i.e., Buckle) and its value compared to the Euler equation; and second, a nonlinear plastic analysis (i.e., Static Riks) comparing the value obtained with the buckling curve from ABNT NBR 8800 [
23]. The parameters used in Step 1 were: W150 × 37.1, W250 × 73.0 and W360 × 122.0 profile; 25, 50, 75, 100, 125, 150, 175 and 200 value of
λ; 0%, 15%, 30% and 45% of residual stress; and 0.10, L/3000, L/2500, L/2000 and L/1500 of initial imperfection. In this stage, buckling analysis was performed in relation to the minor axis, totaling 360 models.
2.2. Comparison Study: Castellated Profiles and Full Web—Phase 2
Three types of laminate profile (mm × kg/m) produced by company Gerdau (Porto Alegre, Brazil) were analyzed: W150 × 37.1, W250 × 73.0 and W360 × 122.0, all free from issues of local instability. As mentioned, three types of castellated elements were evaluated: Anglo-Saxon, Peiner and Litzka.
Due to the openings, several parameters were needed to define the dimensions of the cross-section, as well as different expressions for calculating the properties of the cross-section. In
Figure 4, these elements are presented, as well as the main geometric properties of the cross-section of an alveolar profile. The properties were obtained from the cross-section of the center of the alveolus as it is the most critical section [
13,
14,
19,
26,
35,
36,
37,
38].
Where d is the total height of the original section, tw is the web thickness of the original profile, tf is the thickness of the original profile table, bf is the width of the original profile table and dg is the total height of the expanded section [dg = k (expansion factor) × d].
Among the castellated profile parameters, there is the expansion ratio (
k), which is defined by the ratio between the height profile and the expanded height of the original profile. The expansion ratio can vary from 1 to 2, technically. However, several studies have been conducted to determine the optimal expansion ratio in castellated elements, resulting in values ranging from 1.33 to 1.67 [
38,
39,
40,
41,
42]. In stage two, the parameters were: W150 × 37.1, W250 × 73.0 and W360 × 122.0 profile; Litzka, Peiner and Anglo-Saxon cutting pattern; 1.33, 1.50 and 1.67 of parameter k; 25, 50, 75, 100, 125, 150, 175 and 200 value of
λ; 15% of residual stress; L/1500 of initial imperfection. At this stage, buckling analysis was performed in relation to the minor axis and major axis, resulting in 432 models.
Based on the results obtained for the profiles analyzed (W150 × 37.1; W250 × 73 and W360 × 122) and for the castellated profiles (Litzka [LT], Peiner [PN] and Anglo-Saxon [AS]), quadratic (Equation (3)), cubic (Equation (4)), exponential (Equation (5)), logarithmic (Equation (6)) and geometric (Equation (7)) regression models were performed considering an analysis of variance (ANOVA) with 5% significance. The curves generated by the regression models were compared to the curve proposed by the Brazilian standard ABNT NBR 8800 [
23] to determine the best fit curve involving the reduction factor
χ (dependent variable) and the slenderness index
λ0 (independent variable).
In Equations (3)–(7), the coefficient αi is obtained by the least square method and ε is the random error, i.e., the product of variations in measurements that do not follow a fixed trend but that can be analyzed statistically by their dispersion. Further, the quality of the adjustment is determined based on the values of the coefficients of determination R2. The ANOVA of the regression models is performed to assess whether the models and the terms of these models are considered significant (at the 5% significance level), which implies that variations in λ0 values imply variations in the χ values. For the accepted hypotheses (H0 and H1), a p-value (probability P) greater than or equal to 0.05 implies that the coefficients of these models are not significant and, otherwise, significant (p-value ≤ 0.05).
Since the values of λ0 are not the same in numerical simulations based on the best fit [χ = f (λ0)] for the type estimate and χ for each standard profile, the values of λ0 [0; 3.31] from the curve χ × λ0 (NBR 8800, 2008) were used to estimate χ by the aforementioned models. Once the set of λ0 values was the same for all settings, the verification of the model that best approximates χ × λ0, proposed by the Brazilian standard (NBR 8800, 2008), was based on the Tukey multiple comparison test (at 5% significance). In the Tukey test, A denotes the group with the highest mean χ value, group B has a different but lower mean value and so on. Same letters mean statistically equivalent groups.
As the numerical simulations were made considering the direction [
d] of the two axes (x and z), the expansion ratios
k (1.33; 1.5; 1.67) and the slenderness ratios
λ0 [0.07; 2.52] to obtain the values of
χ reduction factor, the regression model (Equation (8)) and the dependent parameters
d,
k and
λ0 were used to verify the significance of each of the main factors and/or their interaction with these
χ values.
In Equation (8), the coefficient αi is obtained by the least square method, and ε is the random error, noting that the quality of adjustment is determined based on the values of the coefficients of determination R2. In the simulations, it is worth mentioning that the categorical direction variable (d) is treated as x = 0 and y = 1. Only in simulations involving the Anglo-Saxon pattern is the expansion ratio k kept constant (invariant) and equal to 1.5, resulting in the reduction of Equation (8) to four terms for all.
A sensitivity analysis of the coefficients in Equation (8) was evaluated based on ANOVA, also at a 5% significance level. For hypotheses of formulations (H0 and H1), a p-value greater than or equal to the level of significance (0.05) implies that the models are not significant, and, otherwise, significant for a p-value less than 0.05.
3. Results
Shell-type elements are indicated for modeling structures (steel profile) in which one dimension is significantly smaller than the other dimensions and the stresses in the thickness direction are negligible. The elements evaluated were S4R and S8R, the types also evaluated by Sonck [
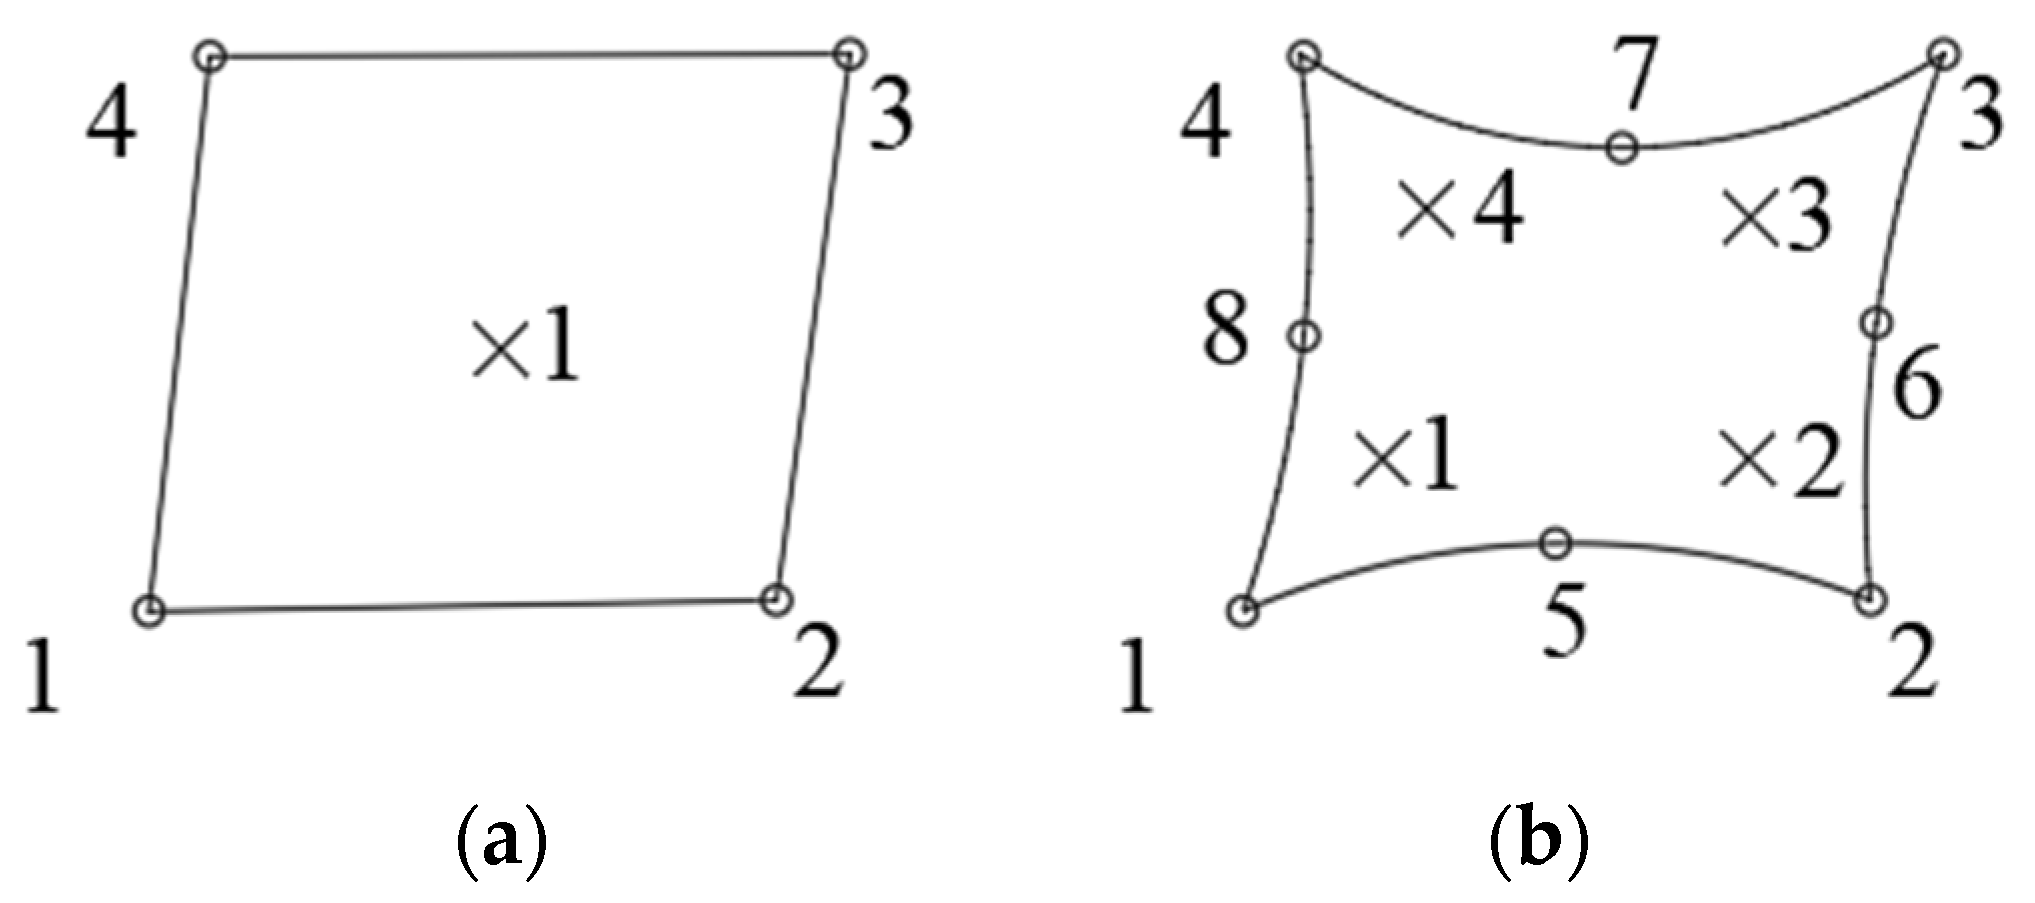
36]. S4R is a linear, quadrilateral shell element with reduced integration and S8R is a curved, quadrilateral shell element with reduced integration. Reduced integration elements use one less integration point in each direction than fully integrated elements. Linear elements of reduced integration have only a single point of integration located at the centroid of the element while the second-order element has four points of integration, as shown in
Figure 5. The dots on the lines are nodes and the interior xs are the integration points.
A preliminary study was carried out to choose the finite element to discretize the models. At this stage, profile W 250 × 73.0 (H) and Peiner-type opening pattern were adopted. In this step, 16 numerical models were evaluated, resulting in a total of 64 analyses. The description of the models is presented in
Table 1.
Figure 6 presents the loads of each model, as well as the additional time required to complete the numerical analysis when the S8R element is adopted. As can be seen, the models showed similar load, with a mean difference of 0.4%. However, the additional processing time was considerably higher in models discretized by the S8R element, with an average value 245% higher than the time required for the analyses with the S4R element. The mesh in both cases was adopted with a maximum size of 15 mm.
Initially, a mesh test was performed and the proposed model was validated. As can be seen in
Figure 7, the difference in results between the 10 mm and 15 mm mesh are close, so the 15 mm mesh was adopted throughout the model, as it has a shorter processing time. Furthermore, the force × displacement curve in the midspan was close to the experimental test developed by Hu et al. [
24].
Subsequently, the elastic buckling load obtained in the numerical model was compared to the load proposed by Euler to validate the model. In order to implement the geometric imperfections in the castellated models, it was necessary to obtain the first column buckling mode, as shown in
Figure 8a–c. Then, the load capacities of castellated members were compared, considering imperfections, residual stresses and a nonlinear analysis, with the values proposed by the Brazilian standard ABNT NBR 8800 [
23].
Figure 8d,e also show the results for profiles W250 × 73.0. It is noteworthy that the results of the other profiles demonstrated the same behavior. The magnitude illustrated in
Figure 8e shows dimensionless values as they are relative displacements in buckling modes.
As shown in
Figure 9a,b, the methodology proved to be effective both in determining the critical load of elastic buckling and in estimating the bearing load capacity using a nonlinear analysis. In addition, it can be noted that, as the column´s slenderness increases, collapse by elastic buckling tends to occur.
In addition,
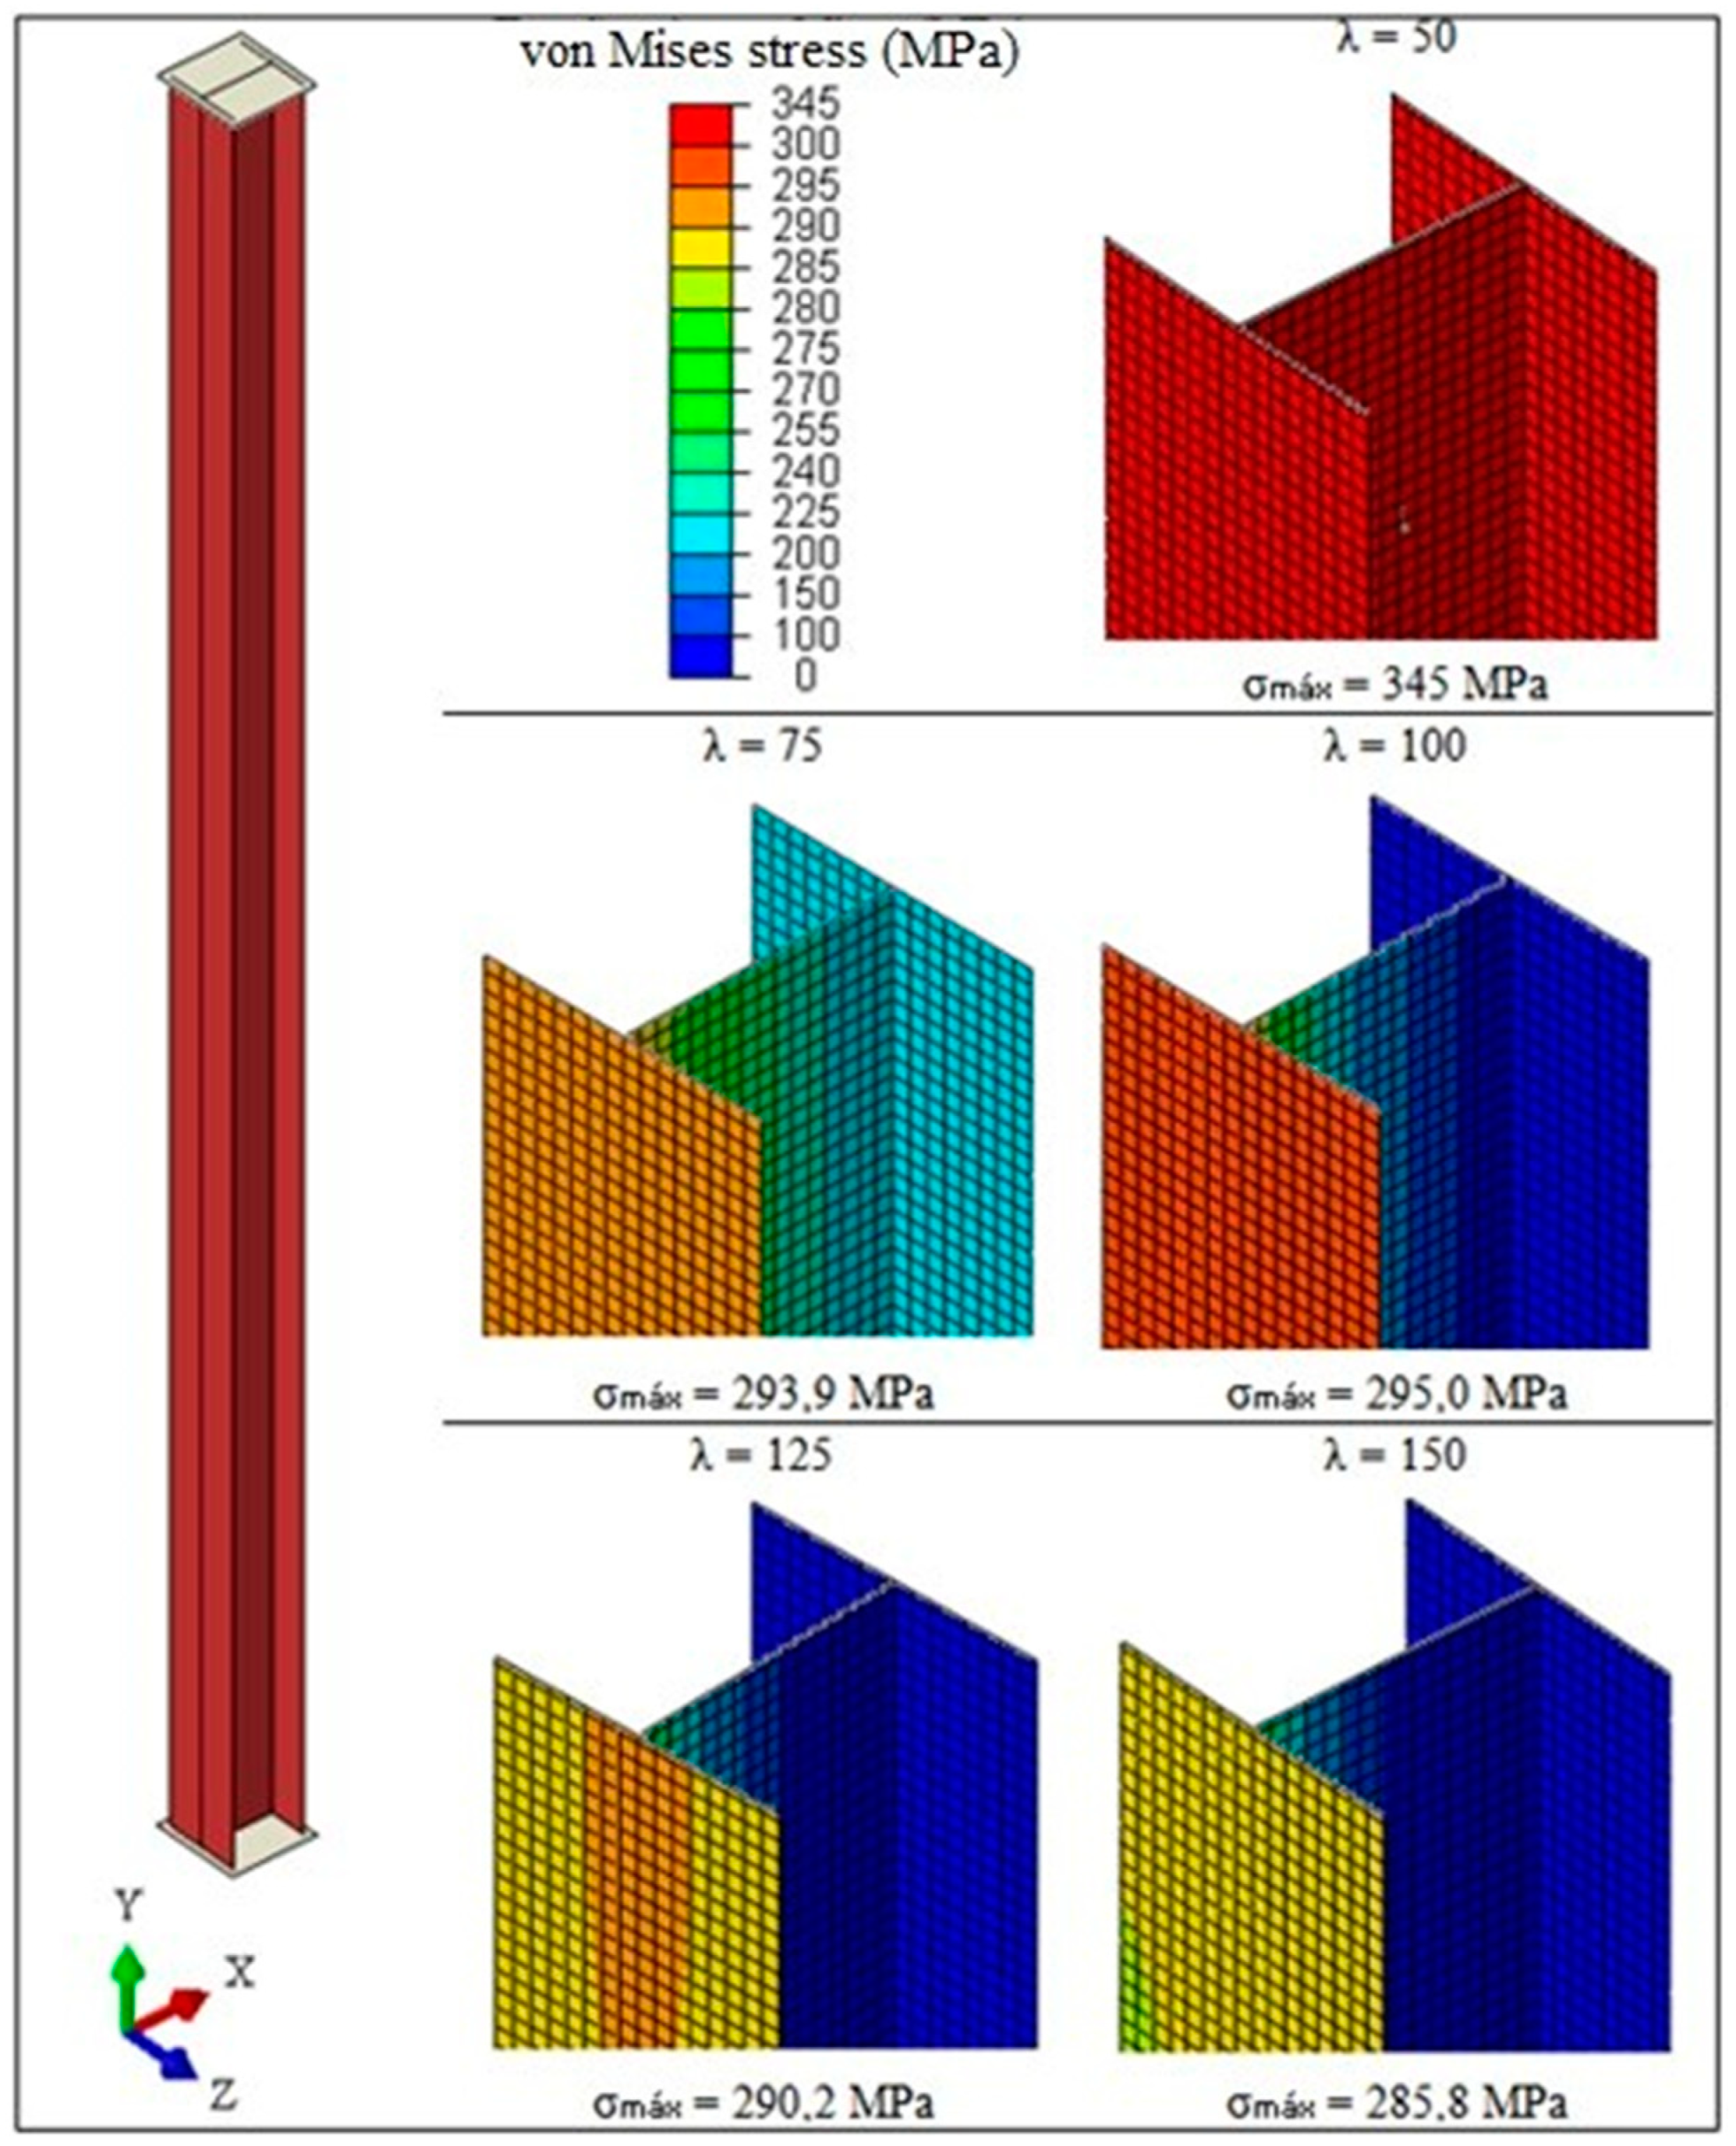
Figure 10 reveals that, as the slenderness ratio increases, the horizontal displacements of the central section become larger with lower load increments. Due to these displacements, greater bending moments appear in the element, causing compression on one face and tension on the other, which makes the compressed region reach the yield stress more easily. Considering
λ of 50, 125 and 150, and W250 × 73.0 profile, the maximum stress distributions were 345 MPa, 290.20 MPa and 285.80 MPa, respectively (
Figure 11).
Subsequently, the openings were attributed to the calibrated model presented in the previous section. This methodology was also adopted by several other authors [
3,
10,
18]. The results are presented for the profiles—W150 × 37.0 (
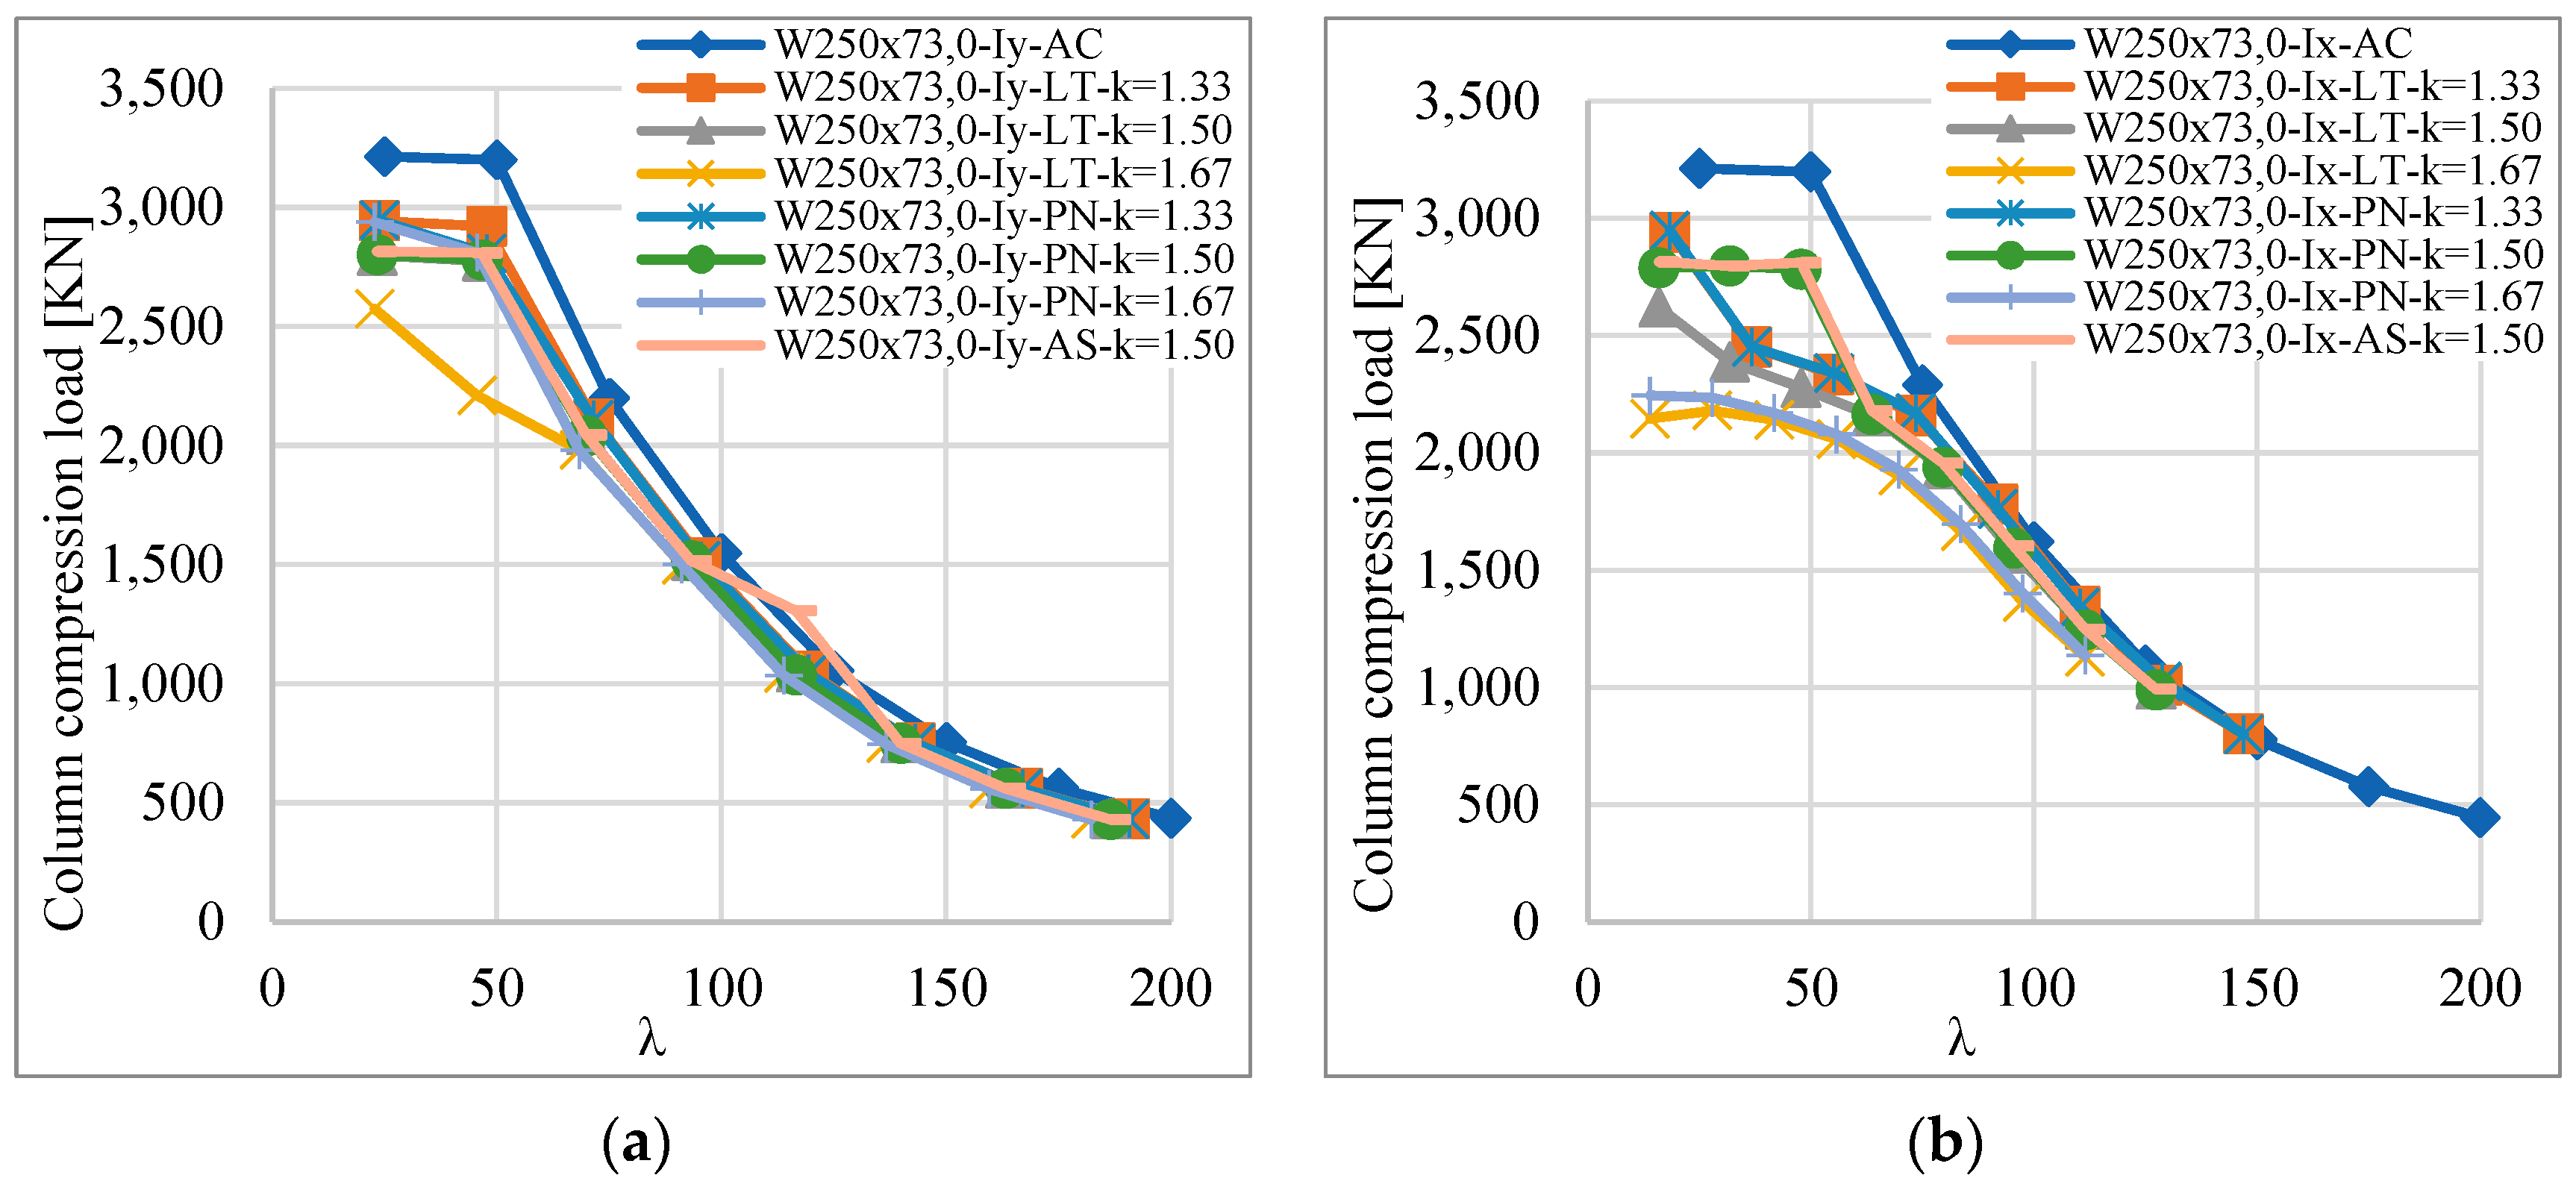
Figure 12a,b), W250 × 73.0 (
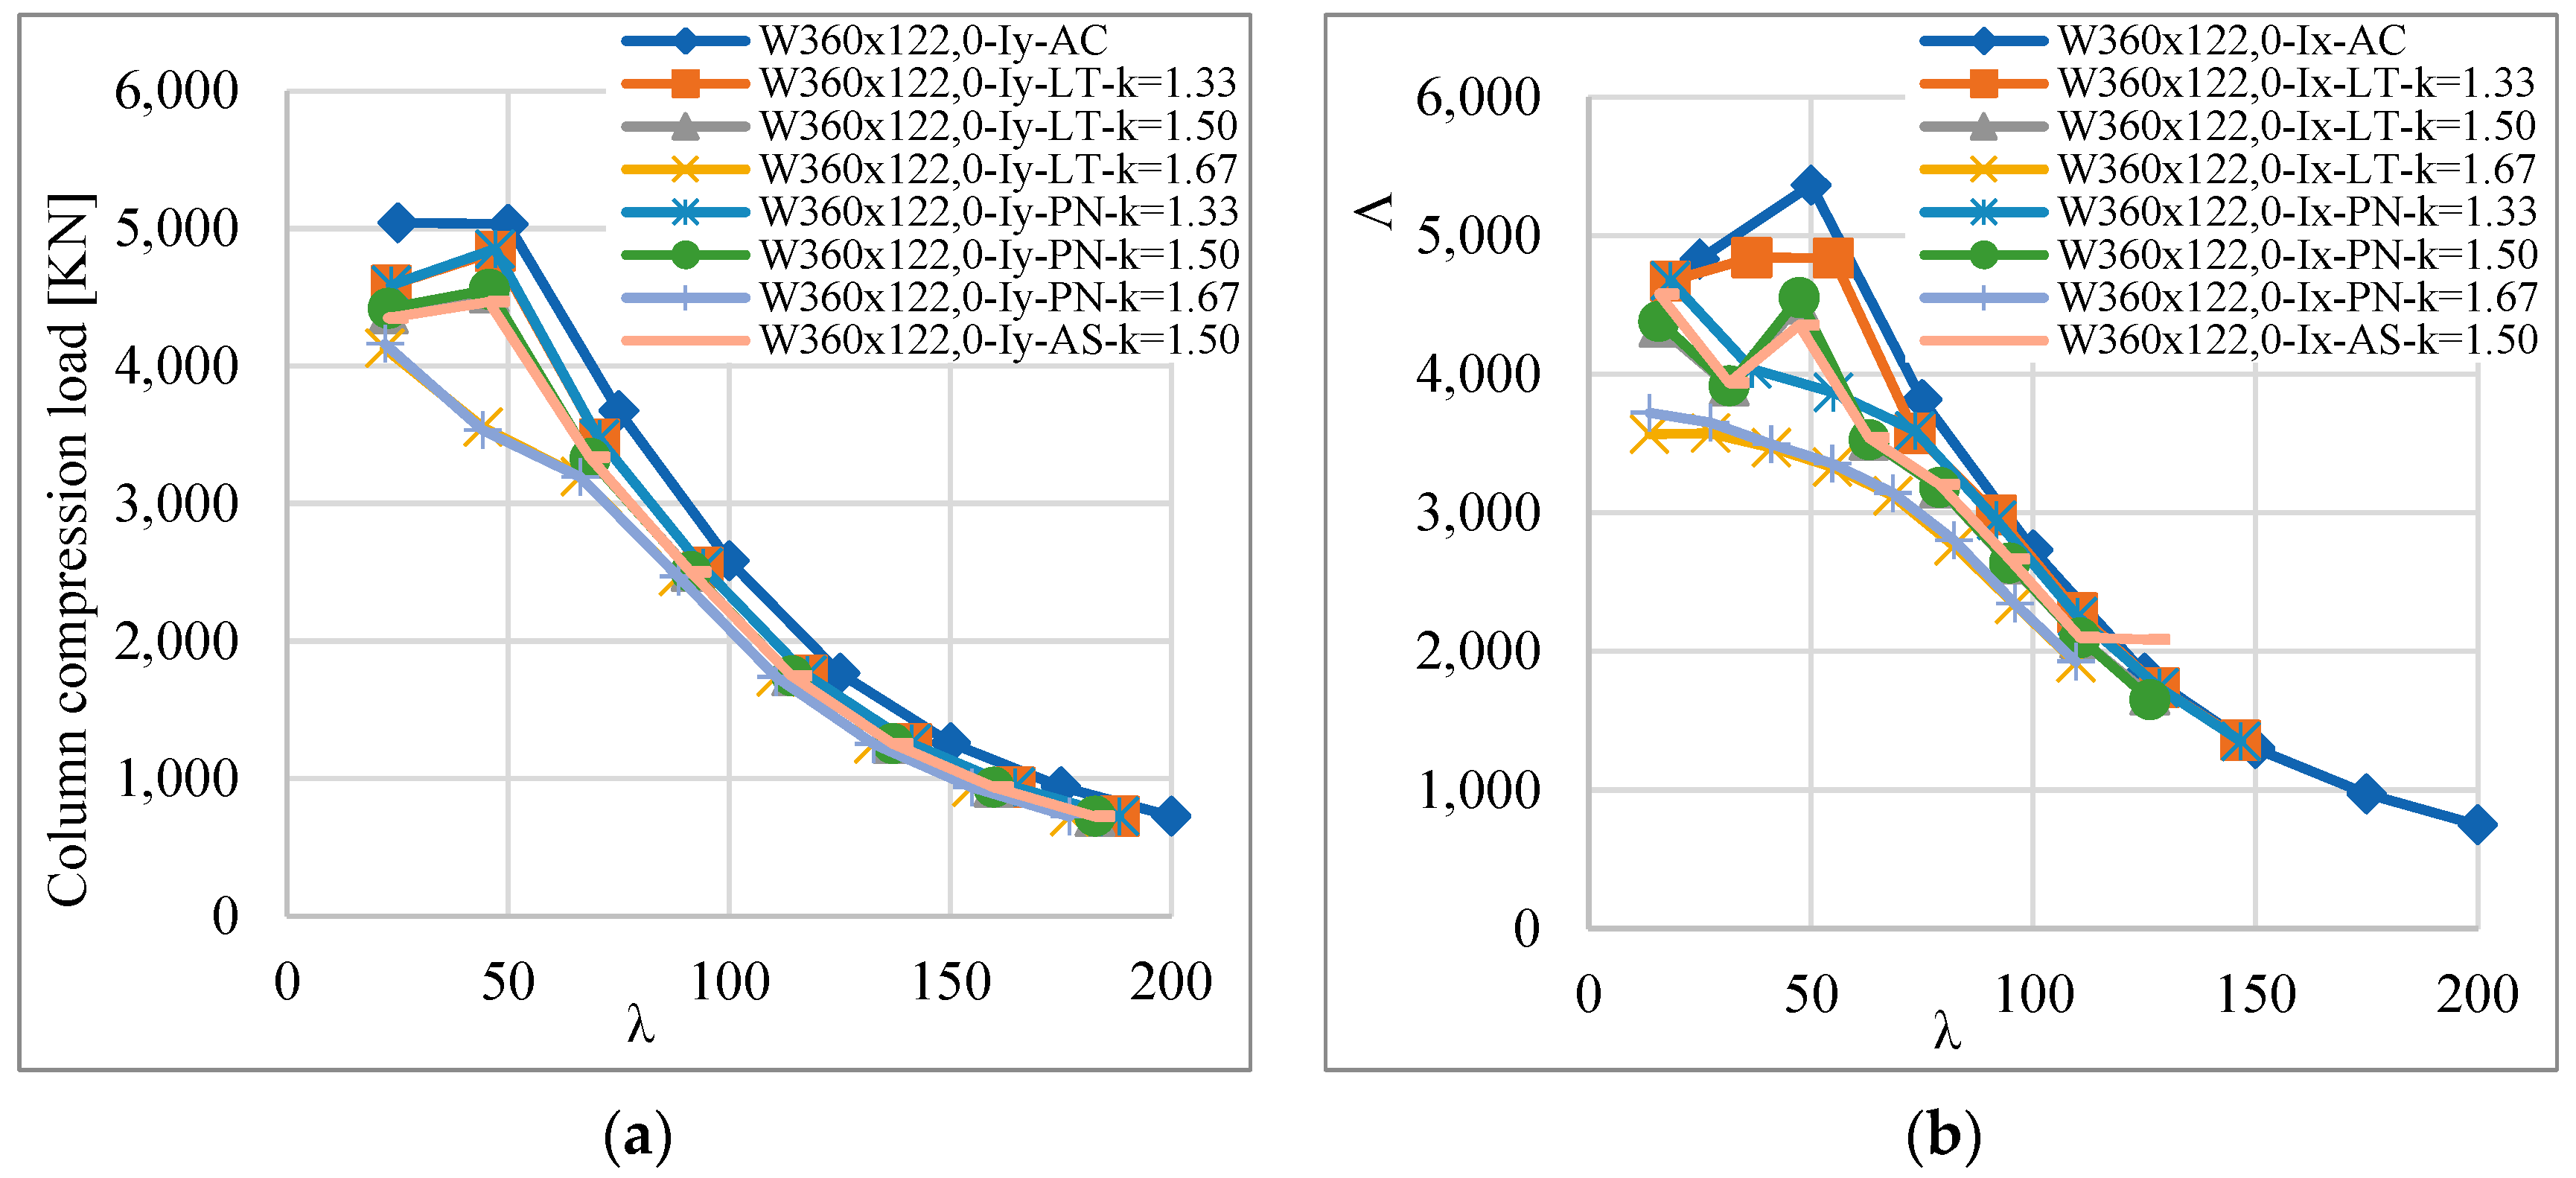
Figure 13a,b) and W360 × 122.0 (
Figure 14a,b). The models refer to buckling around the minor axis (Iy) and the major axis (Ix), with opening patterns Litzka (LT), Peiner (PN), AS (Anglo-Saxon), without openings (AC—Full Web) and expansion factor (k).
As shown in
Figure 10,
Figure 12,
Figure 13 and
Figure 14, the mechanical behavior of the columns can be divided into two phases. In the first phase, which corresponds to inelastic buckling, the column strength is determined by the yield strength of the steel, and the structural collapse occurs after the formation of a plastic hinge or crushing of the column. In the second phase, which corresponds to elastic buckling, the column strength is controlled by the geometric (moment of inertia and area) and mechanical (Young’s modulus) parameters, and structural collapse occurs due to excessive displacements, as shown in
Figure 10. In this context, the stress concentrations that occur at the angular points of the openings (honeycombs) of the castellated column cause the early yielding of the steel and contribute to the development of preferential paths that will result in the formation of plastic hinges.
As can be seen, castellated columns have lower resistance capacity subjected to axial loads compared to solid web profiles. Stress concentrations that cause additional deformations around the openings were verified, such as shear deformations, which result in a lower load capacity around the major axis. In columns with a low slenderness index, the differences were more visible. Profiles without openings performed better in columns with lower slenderness, as can be seen in
Figure 15,
Figure 16 and
Figure 17. Compared to the same member without openings in the web, the plastic strength of the cross-section of castellated profiles is reduced due to the presence of openings. Thus, the collapse of less slender structures occurs by plastification of the section and not by lateral instability as in more slender columns, with the steel area being a preponderant factor.
It is known that the behavior of compressed columns with initial curvature differs substantially from columns with no initial curvature. Members with initial curvature have their lateral displacement continuously increased until they collapse. As mentioned, geometric imperfections were implemented based on the first elastic buckling mode of the column.
Figure 15 shows that the horizontal displacement of the model W250 × 73.0 (Peiner) increased considerably after the element reached its load capacity. Due to this increase, the load distribution in the cross-section was modified. This behavior can be seen in
Figure 16, where the plastic deformations in the column are shown.
It is noteworthy that, although the original pillars do not present local instability, castellated columns are not necessarily free of these effects. Instability in castellated columns occurs due to the transfer of stress from the solid web section to the open web section, which may cause stress concentrations. Stress analysis makes it possible to identify the possible points of local failures.
Figure 17 refers to the central region of the castellated column. It is worth noting that, for the load presented (2118 kN), there is an instability of the left flange. Therefore, it can be concluded that the central opening may reduce the column resistance.
Additionally, the curves obtained through numerical models (NMs) are compared with the curve presented by the Brazilian standard ABNT NBR 8800 [
23] used for the design of columns without openings in
Figure 18. Due to the extensive data, the results of profile W250 × 73.0, which is representative of the others, are presented.
Table 2 presents the best regression models (
χ—reduction factor estimative) for each type and pattern profile, along with the respective values of the coefficients of determination (R
2). It should be noted that all
p-values are less than 5%, revealing the significance of the models. In addition, the determination coefficients are greater than 94%, showing a high predictability of the models. Third-order polynomial regression models provided the best configurations in all cases, showing an adequate quality of the obtained adjustments, since the determination coefficients (R
2) vary from 94.11% to 98.04%.
Table 3 shows the Tukey test (at 5% of significance) results in order to verify which of the estimated models is closer to the curve
χ ×
λ0 proposed by the Brazilian standard ABNT NBR 8800 [
23]. In other words, the estimated values for the reduction factors are lower than the values proposed by the Brazilian standard, but they are considered statistically equivalent (5% level of significance) with the similar letter group B.
As shown in
Section 2.2, five regression models were considered to estimate the
χ factor, three polynomials (first, second and third), one exponential and one logarithmic. In all models, their significance was verified in estimating the
χ factor using ANOVA (5% significance). In
Table 2, only the models associated with the highest values of the coefficient of determination (R2) are presented. As there are three polynomial models, to establish the effective relevance (model significance) of the inclusion of the quadratic term on the first-degree polynomial and also the inclusion of the third-degree term on the second-degree polynomial,
Figure 19 shows the graphs of the relative percentage errors of these three models for the W150 × 37.1 (LT) profile.
Figure 19 also shows the graph of the ratio between the values of the
χ factor determined based on the values obtained from numerical simulations (
χnum) and the values of this property determined by the polynomials of the first (
χ1), second (
χ2) and third (
χ3) degrees.
In
Figure 19a, the gradual reduction of the percentage error can be observed with the increase in the order of the polynomial. This effect can be noted by the visible difference in the graphs of normal frequency distribution, which reinforces the results obtained from the analysis of variance. For degree 1, 2 and 3 polynomials, the largest errors found were equal to 67.5, 38.5 and 6.77%, respectively, and it should be noted that such errors came from the coefficient
λ0 = 2.4932. The significant result of the error reduction with the increase in the order of the polynomial is also noticeable in
Figure 19b. It is worth mentioning that 44.44% of the values of the ratios between the
χ factors were lower than 1 and 55.56% presented higher ratios.
Table 4 shows the multivariate regression models used to estimate the
χ reduction factor, finding the terms considered significant by ANOVA (5% significance), that are those underlined in the Equations (see
Table 4). Based on the three patterns and three profiles, only the slenderness ratio
λ0 is considered significant by ANOVA (at the 5% level of significance), implying that other main factors and their interactions do not significantly affect the estimate
χ of the reduction factors.
When calculating all cross-sectional properties at the center of the web opening, the reduction factors are statistically equivalent to the Brazilian standard ABNT NBR 8800 [
23] for solid web profiles. Due to the openings, the steel area can decrease considerably, not being able to support compression efforts. Furthermore, the results show a noticeably higher dispersion (i.e., values close to
χ = 1). Such models were columns with lower slenderness indices, which suggests that buckling failure is not predominant in these models. Therefore, the collapse of such elements occurs by crushing the cross-section due to the considerable decrease in the steel area. Therefore, the values estimated by the presented formulations (
Table 3 and
Table 4) to estimate
χ must be limited to 1. The results indicate that castellated columns can be designed using the curve proposed by the Brazilian standard.
4. Discussion
Due to the results in
Figure 6, the S4R element was adopted for the research models. The analysis performed by Sonck [
36] showed better results with the S8R element. This can be explained by the difference in mesh refinement adopted in the studies, with the maximum value being 30 mm in Sonck [
36] and 15 mm in this work. Such refinement promotes a high level of model detail, promoting satisfactory results. In addition, loads were applied to the metal profile by plates fixed at the ends, which improves the distribution of load and increases the possibility of model convergence. According to the Abaqus documentation, linear elements of reduced integration can give acceptable results as long as a reasonably fine mesh is adopted.
First, in the validation of the model shown in
Figure 7, the same result was found as in the research conducted by Massaroppi Jr et al. [
43], in which the smaller meshes ended up coinciding with a close maximum force. Then, the methodology proved to be effective both in determining the critical load of elastic buckling and in estimating the bearing load capacity (
Figure 9). The methodology (the openings that were inserted in the calibrated model) is similar to several other works [
3,
10,
18]. However, the analyses carried out in this study are more complex than similar works, addressing physical and geometric imperfections, and nonlinear analyses.
As can be seen
Figure 12,
Figure 13 and
Figure 14, castellated columns have a lower resistance capacity subjected to axial loads compared to solid web profiles. Around the web openings, stress concentrations (see
Figure 15,
Figure 16 and
Figure 17) that cause additional deformations around the openings were identified, such as shear deformations, which result in a lower load capacity around the axis of greater inertia. Some researchers have found similar results for the critical buckling load [
12,
13,
15,
17].
Moreover, it was found for smaller columns that the higher the expansion factor (k), the lower the column load capacity. As the thickness increases, the difference between the curves decreases, which suggests that the influence of openings also decreases results. Such findings can be explained by the greater influence of shear strains on less slender columns, which was also observed by some authors [
17,
44].
Furthermore, the curves obtained through numerical models were compared with the curve presented by NBR 8800 [
23] (
Figure 18). The third-order polynomial regression models provide the best settings in all cases, showing an adequate quality of the adjustments obtained, since the coefficients of determination (R
2) are up to 98.04%. Its applicability to castellated columns was verified for most lengths. Since larger openings induce more local failures around the opening, cases with such opening geometries tend to provide the least conservative buckling resistance, as these local instabilities are not considered by this coefficient. The design buckling strengths of castellated members tend to be overestimated for reduced slenderness less than 0.75. For values greater than 0.75, it is noted that the reduction factor (
χ) in castellated elements is higher than the value recommended by the norm, making the dimensioning safer, since the resistance adopted in the dimensioning would be lower than the actual resistance of the element. These conclusions are similar to those of other authors [
10,
17,
19]. It is worth mentioning that all safety coefficients were considered.
The results in this study indicate that castellated columns can be designed using the curve proposed by the Brazilian standard. Furthermore, by calculating all cross-section properties in the web opening center, the reduction factors are statically equivalent to the Brazilian standard ABNT NBR 8800 [
23] for full web shapes. Some numerical models presented
χ > 1. Due to the openings, the steel area can decrease considerably, not being able to withstand compression stress. In addition,
Figure 18 showed results with a noticeably greater dispersion (i.e., values close to
χ = 1). Such models were columns with lower slenderness ratios, which suggests that buckling collapse is not prevalent in these models. Therefore, the collapse of such elements occurs by crushing of the cross-section due to the considerable decrease in the steel area. Thus, the values estimated by the formulations presented (
Table 2 and
Table 4) to estimate
χ should be limited to 1.


 ,
, 


