Abstract
The quality of residential buildings in old urban areas of Beijing is known to be inconsistent, prompting numerous urban renewal projects in the city. This research investigates how building space impacts energy usage and daylighting in courtyard areas of old urban regions in northern China. It also proposes a quick evaluation method for building performance in courtyard spaces, utilizing multi-objective optimization and machine learning classification prediction as a theoretical framework. A study was conducted to gather and organize building space parameters and their corresponding performances using a genetic algorithm. The dataset was then pre-processed and trained using the LightGBM algorithm. The model validation results revealed a recall of 0.9 and an F1-score of 0.8. These scores indicate that the design scheme’s performance level can be accurately identified in practical use. The goal of this study is to propose a set of rapid assessment methods for building performance levels in courtyard spaces. These methods can significantly improve the feedback efficiency between design decision and performance assessment, reduce the time wasted in building performance simulation during the architectural design process, and avoid unreasonable renovation and addition in urban renewal. Furthermore, the research method has universality and can be applied to courtyard-shaped buildings in other regions.
1. Introduction
With the rapid development of cities, China is now facing an environmental energy crisis, and the construction field is an essential part of achieving the double carbon goal.
Facing these challenges, simulating, and predicting building performance through digital technology becomes especially important. Building performance simulation software, Ladybug and Honeybee, have been widely used in building performance assessment, and the algorithms for multi-objective optimization of building performance are relatively mature. However, the traditional multi-objective optimization methods for building performance often have long computation times and require repeated adjustment of each physical building parameter.
With the popularity of machine learning, many studies have used machine learning or deep learning to predict building performance. Domestic and international research on machine learning in the building field covers various aspects such as wind environment, thermal environment, energy consumption, sunlight, pollutants, etc. Most of them train prediction models by inputting large amounts of data, and then use an error evaluation index to assess the accuracy of each prediction model. For example, Qiushi. H. et al. [1] used convolutional neural network (CNN) and artificial neural network (ANN) algorithms to build a set of prediction models that can predict the daylighting performance of buildings based on general floorplans. Alawadi, Sadi et al. [2] introduced four ANN-based machine learning methods that were used to model HVAC (heating, ventilation, and air conditioning) systems to predict indoor temperatures in public research buildings. All the above studies were conducted by inputting a large amount of existing building performance data for machine learning model training, which were often obtained through performance testing by government departments or extensive real-world research. In contrast, Hanan. Yan. et al. [3] obtained a building performance dataset of 6000 design scenarios for an office complex by iterative multi-objective optimization based on a genetic algorithm and used this dataset to train a machine learning model. Multi-objective optimization can balance different building performance objectives and iterate toward optimality. This study combines the advantages of the previous studies and proposes a method for the rapid prediction of building performance, combining machine learning and multi-objective optimization with a genetic algorithm which can facilitate architects to make rapid decisions on design solutions in the renovation of residential buildings and urban renewal in old cities.
2. Research Background and Methodology
2.1. The Current Situation of Residential Houses in the Old City of Beijing
According to prior research, 8.08 million square meters of traditional courtyards in Beijing were demolished between the 1950s and 1990s due to a lack of repair and protection. Most of the existing courtyard buildings have been repaired, remodeled, or renovated, but still maintain the traditional architectural form [4].
After field research, it was found that the quality of the existing courtyards is mixed, and the existing courtyard buildings generally suffer from structural aging and deterioration. In addition, some courtyard buildings have been affected by natural disasters, human damage, or overuse. Traditional Beijing courtyards are mainly wooden structures, and most of the original wooden designs are aging, damp, cracked, and decayed, and the walls and masonry are badly worn. The roofs of the individual buildings also have loose tiles, falling soil, and water leakage. The continuous poor-quality additions and renovations have caused a certain degree of impact on the traditional style and building performance.
In this study, an outdoor year-round radiation simulation was conducted for the courtyard of No. 23 Qijing Hutong in the Fayuansi neighborhood, as an example. No. 23 is affected by poor quality additions, and the courtyard space is small, making it difficult for daylighting and natural ventilation to penetrate the interior of the rooms. This results in poor building performance and comfort of use, as shown in Figure 1 and Figure 2. This study proposes a new method to quickly evaluate the performance of buildings in the courtyard area of the historical city. This method aims to minimize the negative impact of substandard renovation and renewal on the city, while also considering low carbon emissions.
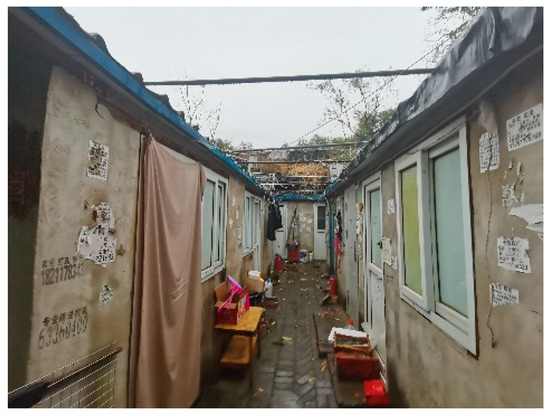
Figure 1.
Photo of the 23rd courtyard.
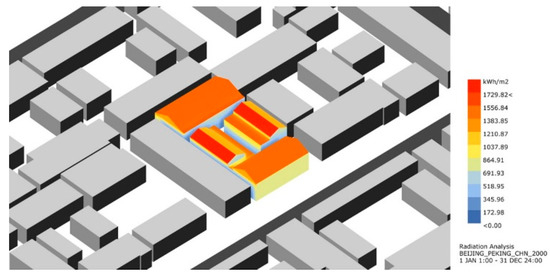
Figure 2.
Analysis of sunlight radiation in No. 23, Qijing Hutong.
2.2. Overview of Research Methods
The main objectives of this study are: (1) to make a machine learning-based model that can efficiently predict the building performance of northern China urban courtyard houses, that focuses on the impact of courtyard spaces on building energy consumption and daylighting, and (2) to propose a set of rapid assessment methods for building performance in courtyard spaces with universal applicability using multi-objective optimization and machine learning classification prediction as theoretical guidance. The research process can be divided into three phases, as shown in Figure 3.
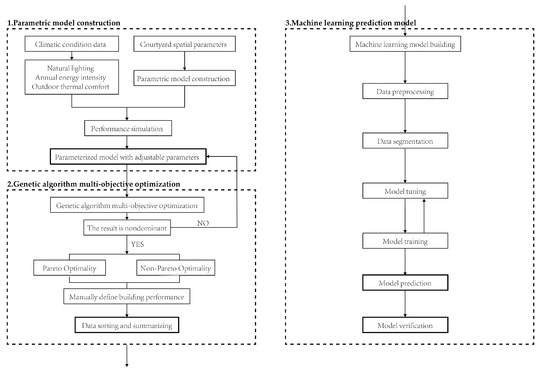
Figure 3.
Research Methodology Flow.
The main goal of the first phase is to build a parametric model for a building performance simulation. A parametric model of the courtyard space was developed based on the climatic conditions of the Beijing area. A building performance simulation of the typical courtyard space model was conducted to evaluate the building performance of the courtyard space by three aspects: annual energy consumption, natural daylighting, and outdoor thermal comfort. Finally, a parametric model for multi-objective optimization was generated.
The main goal of the second phase is to aggregate and organize the dataset containing the parameters of the building solutions based on a genetic algorithm. Different building design solutions were generated and integrated using a multi-objective genetic algorithm optimization. The solution sets generated after the multi-objective optimization iterations include Pareto frontier and non-frontier solutions. Manual classification and the definition of different performance levels based on building performance were integrated to serve as raw data for the third phase.
The main goal of the third phase is to construct and validate the accuracy of a machine learning model for predicting the architectural performance of courtyard spaces. Pre-processing and dataset segmentation were performed on the dataset of the second phase. To make predictions, the machine learning algorithm was used to analyze the data in the training set. These predictions were then verified by comparing the results with a separate test set. To assess the accuracy of the prediction model, we used a confusion matrix to compare its predicted values with the actual values in the dataset [5]. With this machine learning model, it is possible to quickly evaluate the performance of courtyard houses influenced by spatial design. It can also provide a fast prediction of how design solutions will impact energy consumption, daylighting, and outdoor thermal comfort during the pre-design phase of building renewal.
3. Research Process
The research subject is in the Fayuansi neighborhood of Xicheng District, Beijing, in Qijing Hutong. Beijing has a warm-temperate, semi-humid, and semi-arid monsoon climate, with solar radiation averaging 112–136 kcal/cm2 throughout the year [6], as shown in Figure 4 and Figure 5.
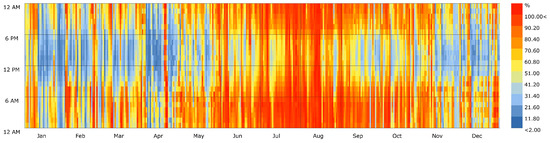
Figure 4.
Relative Humidity-Hourly BEIJING/PEKING January 1:00—31 December 24:00.
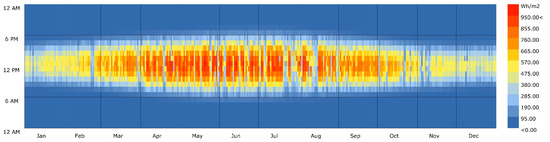
Figure 5.
Global Horizontal Radiation-Hourly BEIJING/PEKING January 1:00–31 December 24:00.
For this study, a courtyard house in need of renovation and renewal, specifically No. 23 Qijing Hutong, was chosen as the reference object. The retrofitting addition to Courtyard 23 of Qijing Hutong has impacted its building performance, daylighting, and thermal comfort. In order to perform the simulation, a digital twin of Courtyard 23 was built in Rhino [5], a 3D software, and the weather data used for this simulation was retrieved from Energy Plus [4].
3.1. Performance Simulation
- (1)
- Optimize target selection
The focus of this study is to improve the building energy consumption, lighting performance, and thermal comfort of the space. To evaluate performance, we chose Total Loads Intensity (TLI), Daylight Factor (DF), and Universal Thermal Climate Index (UTCI) as performance evaluation indexes.
The Total Loads Intensity (TLI) is a useful measure for assessing a building’s energy efficiency over the course of a year [7]. It is determined by dividing the total energy consumed by the building in a year by the area of the building. A lower TLI indicates better energy efficiency and lower carbon emissions. This metric is commonly used to evaluate a building’s energy performance and can also be used to compare different buildings and provide guidance for architects.
The Daylight Factor (DF) is a metric that measures the amount of natural light present inside a building [8]. It is determined by calculating the ratio of indoor and outdoor sunlight intensity. While it might not be as comprehensive as the other lighting metrics, such as useful daylight illuminance (UDI) and daylight autonomy (DA), its ease of calculation has made it a prevalent tool in building lighting design [9]. The DF is a useful metric for architects to evaluate the quality of a building’s interior lighting. It can aid in comparing and optimizing lighting conditions during the design process. The DF is also linked to various design parameters, such as building orientation and window size, providing a foundation for multi-objective optimization [8].
The thermal environment of the courtyard space is calculated using the Universal Thermal Climate Index (UTCI), which is an index that is used to describe the human body’s perception of ambient temperature and humidity. It is a more comprehensive and accurate measure of human comfort than the traditional temperature index and responds to the human body’s ability to adapt to the environment [10]. The universal thermal climate index can assess the comfort level of the external environment of building construction and the impact of the environment on the building. The universal thermal climate index can respond to changes in the outdoor thermal environment of a building due to changes in courtyard space and building form. In this study, only the thermal environment of the outdoor courtyard space is used as the optimization object. The reason is that the DF can reflect the indoor light and heat environment to some extent in the multi-objective optimization process.
- (2)
- Parameter adjustment
With the collaboration of the Rhino and Ladybug Tools suite, the digital model has the capability to simulate a building’s performance based on its local climate and site environment. Ladybug was responsible for importing climate files that contain Beijing’s climate characteristics, while HB-Radiance was used to evaluate the building’s performance related to daylighting.
The parameters set for the energy consumption simulation were as follows: period of simulation was year-round, the building construction was a wood frame (2010: ClimateZone4: WoodFramed), the building type was residential, and the activity, occupancy, lighting, electrical equipment, heating, and cooling were set according to national and local standards.
The parameters set for the daylighting simulation and outdoor thermal environment simulation were as follows: the period of the simulation was year-round, the detector grid size was 1.0, and the height of the detection surface from the ground was 0.75 m. The parameters were input to the HB Daylight Factor and HB UTCI Comfort Map operators.
- (3)
- Parametric model construction
A genetic algorithm [11] is a computational model of biological evolution that simulates the natural selection and genetic mechanism of Darwinian biological evolution [10]. It is a method to search for optimal solutions by mathematically simulating the natural evolutionary process. Pareto Optimality Theory means making at least one goal better without making either goal worse.
To generate and integrate more data on design solutions for the applicability and accuracy of machine learning models, this study used a multi-objective genetic algorithm optimization iteration to obtain a dataset containing spatial design variables and optimized target values and derive Pareto frontier and non-frontier solutions. Before enhancing the design solution sample, it was important to establish a practical set of values for the parameters that dictate the building space. These parameters were determined based on the research data of the Fayuansi neighborhood, which is presented in Table 1 and Figure 6. The parametric model battery is depicted in Figure 7, while the model utilized for performance simulation is displayed in Figure 8.

Table 1.
Range of values for building parameter variables.
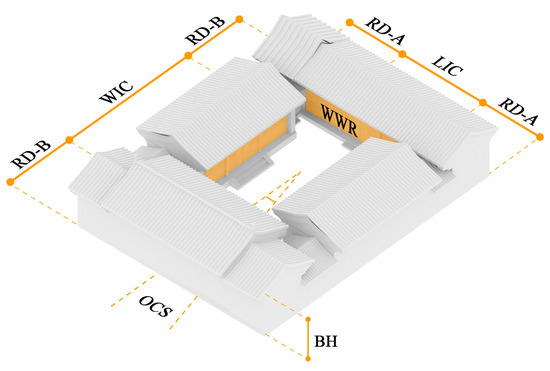
Figure 6.
Schematic diagram of building space parameter variables.

Figure 7.
Honeybee parameterized model.
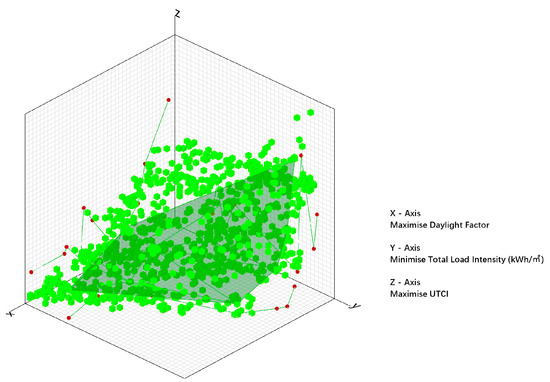
Figure 8.
Scatter plot of optimization results.
3.2. Multi-Objective Genetic Algorithm Optimization
3.2.1. Multi-Objective Optimization
For this study, Wallacei [12] was selected as the multi-objective optimization tool. It utilizes a genetic algorithm and Pareto frontier theory to run evolutionary simulation iterations in Grasshopper. This helps designers understand their evolutionary selection process by providing highly detailed analysis tools and an integrated selection approach. Throughout the evolutionary simulation, merit-seeking is emphasized at all stages.
The total loads intensity (TLI), daylight factor (DF), and universal thermal climate index (UTCI) were entered into the objectives port as optimization objectives, where the smaller the total annual energy intensity, the better. DF and UTCI were optimized by taking the average value. Although there may be a slight deviation in the evaluation results, they have little impact on the optimization results. The variables controlling the building parameters in Table 1 were then inputted into the genes port. The number of generations was 40, the subset per generation was 80, and the population size was 3200. The genetic algorithm parameters were set as shown in Table 2.
Table 2.
Genetic algorithm parameters.
Figure 8 displays the solution set for multi-objective optimization in a scatter plot on WallaceiX’s coordinate system. The TLI, DF, and UTCI correspond to the x, y, and z axes, respectively. Figure 9 displays the analysis of the optimization process for achieving the minimum TLI, maximum DF, and maximum UTCI. The red signifies the first generation, while the blue depicts the final generation [8].
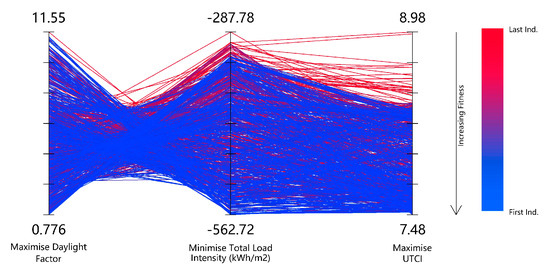
Figure 9.
Iterative process diagram.
The normal distribution graph, fitness value distribution graph, and mean trend graph of the three objectives are shown in Table 3. The red line represents the initial generation of the optimization process, while the blue line represents the last generation. As can be seen from the normal distribution plots of the three target values, the blue lines gradually stabilize in comparison with the previous generations, indicating that the optimization process for all three target values is meaningful.
Table 3.
Multi-objective optimization results analysis.
The analysis of the results shows that the evolutionary direction tends to be stable, and that they all converge to the optimal trend. Among the 397 Pareto frontier solutions, the target range for the DF was 2.8% to 7.5%, the target range for the TLI was 273 kWh/m2 to 503 kWh/m2, and the mean value of the UTCI was between 7.3 °C and 9.8 °C.
3.2.2. Building Performance Level Classification
When evaluating building performance, three indicators are considered: TLI, DF, and UTCI. It is important to note that a lower TLI indicates better building energy performance. DF is a measure of how well a building utilizes natural light, and it can give insight into indoor lighting conditions and overall living comfort. UTCI can indicate the thermal comfort of the courtyard area, considering factors such as lighting, ventilation, and human perception.
The datasets have been divided into five categories (A to E) based on energy consumption and comfort levels, as indicated in Table 4. The solutions that fall under A and B levels have exceptional building performance, with a TLI lower than 570 kWh/m2, a DF between 3% and 9%, and a UTCI between 8 °C and 9 °C on the Pareto frontier solution.
Table 4.
Building performance classification grading system.
This indicates that they can be used in the design or renovation projects while still providing good living conditions. The level A solutions were from the 20th to the 40th generations, while the level B solutions were from the 1st to the 19th generations. The solutions that do not meet the above criteria were classified as grade C, which represents an average building performance and good living conditions.
Buildings that meet the target conditions for TLI, DF, and UTCI were considered as level D in the non-Pareto frontier solution. However, level D indicates poor performance, and those solutions require optimization and correction. The buildings that fail to fulfill the three target conditions were classified as level E, which is the worst building performance level. Living in such buildings can be uncomfortable, and the building solution requires extensive optimization.
After collating the dataset, the data were exported from Grasshopper [7] to an Excel sheet via the TT Toolbox tool to facilitate subsequent machine learning training.
3.3. Machine Learning Classification Prediction
3.3.1. Data Pre-Processing
This study used the algorithms from scikit-learn [13]. Scikit-learn is the most widely used machine learning library in Python, built based on data science packages such as numpy and matplotlib, covering almost all aspects of machine learning, such as sample data, data preprocessing, model validation, classification, and regression. This study is classification prediction and will use the LightGBM classification algorithm as shown in Figure 10.
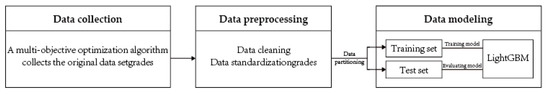
Figure 10.
LightGBM Classification Prediction Model Construction Process.
- (1)
- Data collection and collation
When using WallaceiX, it is common to encounter outliers, duplicates, or extremes in the dataset [8]. Since machine learning assumes that all data is meaningful, it is important to eliminate any data that could interfere with the process. To do this, the datasets were classified and labeled from A to E in Table 4, with each label corresponding to a number from 1 to 5. The resulting dataset was then exported to Excel and imported into scikit-learn.
- (2)
- Data standardization
Data normalization is a fundamental requirement for performing machine learning in scikit-learn. If there is a significant difference in the size of the features within a dataset, it can hinder the objective function’s ability to learn from the data accurately. To address this issue, we employed the z-score normalization method in our study. This technique processed the data to fit the standard normal distribution, where the mean is 0, and the standard deviation is 1. By normalizing the data, we were able to reduce the impact of outliers on machine learning, enhance accuracy, and speed up the algorithm’s convergence rate. These benefits are demonstrated in Figure 11 and Figure 12.
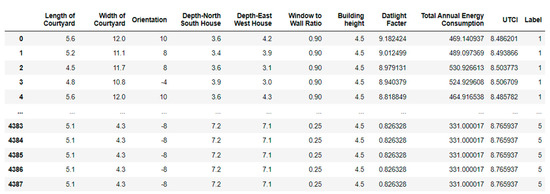
Figure 11.
Data before standardization.
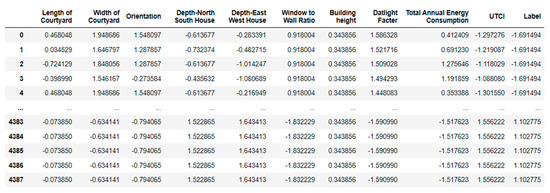
Figure 12.
Normalized data.
- (3)
- Factor correlation analysis
According to the factor correlation analysis in Figure 13, it can be concluded that the window-to-wall ratio has the most significant influence on the DF, with a correlation of 0.92. The window retrofit design can directly optimize the building’s indoor light environment. However, it should be noted that the correlation between the TLI and the window-to-wall ratio is also vital. It is necessary to balance the indoor light environment and building energy consumption in the window design process. Either extremely large or extremely small window-wall ratios can increase the building energy consumption. From the analysis, it can be seen that the window-to-wall ratio has a low correlation with the UTCI of the courtyard space, and the window design has little effect on the thermal comfort of the courtyard space.
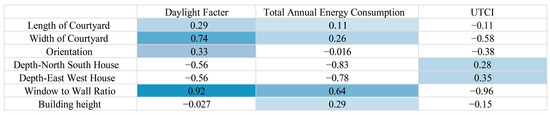
Figure 13.
Factor correlation analysis.
The courtyard’s width and length also significantly impact the DF, with the courtyard’s width weighing more, because the overall width of the courtyard can affect the lighting effect of the building at the south-facing windows. For courtyard spaces, the courtyard size is more relevant than the orientation of the overall structure because all the buildings surrounding the courtyard space have openings facing the courtyard. The courtyard size has a greater impact on the DF than on the TLI, which indicates that the building courtyard size predominantly affects the indoor light environment and the building energy consumption.
The factor correlation analysis of the UTCI shows that the overall dimensions of the courtyard have little influence on the outdoor thermal environment of the courtyard space. The primary impact on the outdoor thermal environment is the depth of the building along the north-south and east-west directions, the depth of the rooms along the east-west directions having a greater impact on the building. When the building room is too deep along the east-west direction, the sun radiation to the courtyard is too low, because part of the beam sunlight cast into the courtyard is blocked by the building. When the room is too shallow, it exposes too much of the courtyard space to the cold winter environment, resulting in lower thermal comfort.
3.3.2. Model Training
The goal of building the machine learning model in this study is to efficiently predict and provide feedback on the building performance level of courtyard spaces using the parameters of existing design solutions. LightGBM [14], a supervised learning algorithm, is a distributed, gradient boosting tree framework based on the decision tree algorithm, which uses a leaf-by-leaf growth strategy to continuously iterate training to obtain the optimal model. LightGBM mainly involves classification, regression, sorting, and others. This study uses a classification prediction model, which is used to classify the input data into different categories, i.e., to determine which known sample type a new sample belongs to based on the characteristics of the known samples. This model usually performs the classification by the learning patterns from the known data. In multiclassification problems, the classification prediction models can classify the input data into different categories [15].
- (1)
- Data segmentation
The dataset was partitioned into a training set, used to train the machine learning model, and a test set, used to validate the model. 70% of the data was randomly selected as the training set, and the remaining 30% was used as the test set.
- (2)
- Hyperparameter setting
The setting of hyperparameters can improve the prediction accuracy and convergence speed of the LightGBM model to better adapt to scenarios. The parameters set are shown in Table 5.
Table 5.
Super parameter setting.
- (3)
- Training process
Figure 14 shows the training process of the machine learning model, which shows the relationship between the training sample values and the model performance. The learning curve shows that the LightGBM performance tends to be stable if the training data provided exceeds 1200 samples.
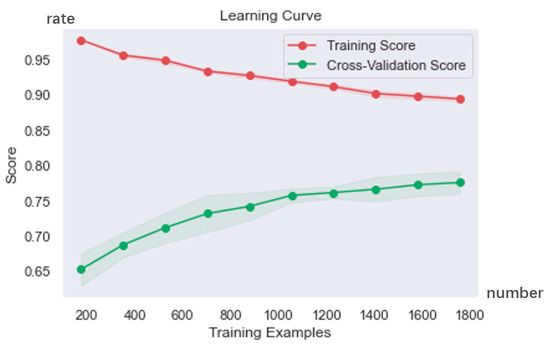
Figure 14.
Learning curve.
3.3.3. Model Performance Evaluation
In machine learning, a confusion matrix [16] is a specific matrix used to present a visualization of an algorithm’s performance. Each column represents the predicted value, and each row represents the actual category. It is mainly used to compare the classification results with the actual measured values, and the accuracy of the classification results can be displayed inside a confusion matrix that combines the predicted and observed results into True Positive, False Negative, False Positive, and True Negative categories. Figure 15 shows the confusion matrix of the classification model for this study.
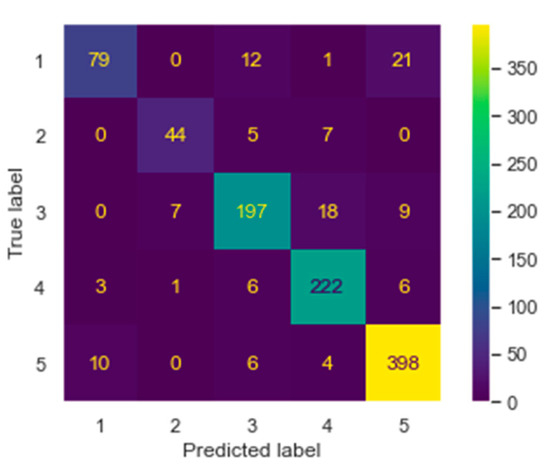
Figure 15.
Confusion Matrix.
Classification performance can be evaluated by four key metrics: accuracy, precision, recall, and the F1-score [17]. Accuracy is usually used to evaluate the precision of results, precision is usually used to evaluate the quality of results, and recall is used to evaluate the completeness of results. Precision and recall are conflicting metrics, and the F1-score is a weighted average of precision and recall. The precision of the machine learning training model is 0.902, the accuracy is 0.862, the recall is 0.902, and the F1-score is 0.877.
After the model training was completed, the trained model was saved as shown in Figure 16. To predict the model’s accuracy, the saved classification prediction model was imported to make predictions for eight random cases, and the differences between the predicted and actual performance levels were compared. The building performance evaluation criteria are shown in Table 4. The comparison results are shown in Table 6.The actual levels were evaluated according to the building performance simulation, as shown in Table 7.
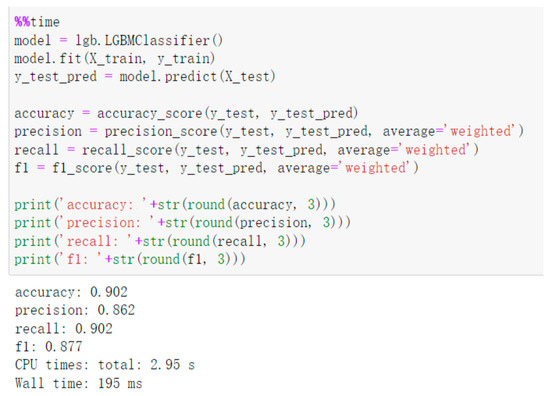
Figure 16.
Classification Prediction Model.
Table 6.
Random case-level prediction.
Table 7.
Random Case Building Performance Simulation.
As shown in Table 6, samples 1, 4, and 5 were classified as level A which has the best building performance, considering energy consumption, daylighting, and outdoor thermal comfort. The overall prediction of the algorithm is accurate, but the prediction for sample 5 was different from the expected result, where the level A sample was mistakenly classified as a level B sample. The reason behind this is that the training set did not have sufficient data samples that can be classified into level A or level B. In addition, the sensitivity of the algorithm to the depth and the width of the courtyard was relatively low. The second reason is that the TLI in sample 5 was higher than that of samples 1 and 4. The outdoor thermal comfort in sample 4 performed poorly compared with the other samples. If more samples were provided in the multi-objective optimization phase, and more Pareto optimal solutions were generated, a higher prediction accuracy should have been seen. For the samples that the model cannot predict well, in this case, sample 5, increasing the number of training samples can improve the prediction accuracy, because the model can better capture those samples’ features and patterns of variation.
Sample 7 was classified as level C, indicating good building performance. The energy consumption, daylighting, and outdoor thermal comfort were at an average level. The sample size for level C in the training set was relatively large, resulting in a high prediction accuracy.
Samples 2, 3, and 6 were classified as level D, which indicates poor building performance. Sample 6 shows that the schematic design was problematic due to the large window-to-wall ratio, which results in a high DF and high energy consumption throughout the year. The number of samples of level D accounted for a large proportion of the training set, and the prediction results for this type of sample were relatively more accurate.
Sample 8 was classified as level E, which represents the worst building performance, meaning this sample needs to be thoroughly modified and optimized. The simulated result of sample 8 shows that although the outdoor thermal comfort and energy consumption meet the standards, the window-to-wall ratio was too small, resulting in poor performance of daylighting, such as a low DF value and unevenly distributed illuminance. Level E accounts for the largest proportion in the training set, so the prediction accuracy for this type is the highest.
In conclusion, the machine learning model is highly accurate in predicting and evaluating building performance of courtyard buildings. However, when the dataset was not big enough for certain classification types, the prediction accuracy was relatively low, which indicates that further improvements are needed, such as better model training and a more intensive data collection process.
4. Results
This study focused on energy consumption and daylighting in the courtyard buildings in northern China, and developed a machine learning model that can accurately predict the performance of urban courtyard buildings using building examples in Beijing historical district. Also, this research presents a collection of efficient evaluation methods for appraising the performance of courtyard buildings. These techniques were developed based on the principles of multi-objective optimization and machine learning classification, and they will have broad applicability.
The research method can be applied to urban renewal, urban planning, and urban planning policy making. Given the uneven state of urban renewal, the machine learning model in this research method can facilitate architects to make quick decisions on design solutions in those renewal projects within the historical districts, avoiding unreasonable renovation and additions, and maximizing the achievement of low-carbon urban renewal.
Based on the investigation of the current condition of courtyard buildings in the Fayuansi neighborhood, this study established a parametric model for performance simulation. Using genetic algorithms for multi-objective optimization, 3200 datasets containing spatial parameters and target performance were generated and processed. The datasets were then manually divided into a grading system and used to train the machine learning models to evaluate and predict the changes in energy consumption, daylighting, and outdoor thermal comfort resulting from the variations in the courtyard space parameters. According to the model verification results, the recall rate was 0.9, and the F1-score was 0.8, indicating that the actual performance levels of design proposals can be correctly predicted.
The innovation of this study is the application of machine learning techniques, which significantly reduces the simulation time compared to the traditional simulation method of using building performance simulation software. Such a method is also capable of making a rapid evaluation of all buildings of the same type in the entire neighborhood. The research method is also universally and widely applicable. The machine learning model in this study is based on the example of the Beijing area, and theoretically, this method can be applied to courtyard buildings around the world. However, it should be noted that the training set for the machine learning model should be regenerated based on the form of the local courtyard buildings and the local weather data. Once the local machine learning model is built, it can be used in the building performance assessment of courtyard buildings within the region.
In order to make the prediction results of the machine learning model more accurate and easier to operate, the prediction objectives of the model are simplified in this study, as the building performance optimization objectives only consider DF, TLI, and UTCI, making the entire study more focused. This study provides a theoretical foundation and research methodology for subsequent research development. More performance objectives can be incorporated into the machine learning model, such as natural ventilation, photovoltaic equipment, and so on. As more building performance objectives are introduced, it becomes possible to expand research objectives to encompass the entire life cycle of a building. This study focuses solely on the impact of the design variables listed in Table 1 on building performance. Future research could explore the adaptation of machine learning models to buildings with varying shapes and sizes, or the utilization of advanced techniques in machine learning and deep learning to achieve more precise and efficient prediction methods.
Author Contributions
Conceptualization, X.Z. and T.Y.; methodology, T.Y. and X.Z.; software, X.Z.; validation, X.Z. and Z.T.; formal analysis, X.Z.; investigation, X.Z. and Y.T; resources, T.Y. and X.Z.; data curation, X.Z.; writing—original draft preparation, X.Z.; writing—review and editing, T.Y., X.Z. and D.W.; visualization, X.Z. and Z.T.; supervision, T.Y.; project administration, X.Z.; funding acquisition, T.Y. All authors have read and agreed to the published version of the manuscript.
Funding
This research was funded by [Beijing Municipal Education Commission Scientific Research Program] grant number [KM201410016011] and [Beijing Advanced Innovation Center for Future Urban Design] grant number [UDC2019032124]. And the APC was funded by [Beijing Municipal Education Commission Scientific Research Program] and [Beijing Advanced Innovation Center for Future Urban Design].
Data Availability Statement
At this time, the data and source code for the machine learning models produced in this study are not available as they are required for the subsequent phase of the research.
Conflicts of Interest
The authors declare no conflict of interest.
References
- He, Q.; Li, Z.; Gao, W.; Chen, H.; Wu, X.; Cheng, X.; Lin, B. Predictive models for daylight performance of general floorplans based on CNN and GAN: A proof-of-concept study. Build. Environ. 2021, 206, 108346. [Google Scholar] [CrossRef]
- Alawadi, S.; Mera, D.; Fernández-Delgado, M.; Alkhabbas, F.; Olsson, C.M.; Davidsson, P. A comparison of machine learning algorithms for forecasting indoor temperature in smart buildings. Energy Syst. 2020, 13, 689–705. [Google Scholar] [CrossRef]
- Yan, H.; Yan, K.; Ji, G. Optimization and prediction in the early design stage of office buildings using genetic and XGBoost algorithms. Build. Environ. 2022, 218, 109081. [Google Scholar] [CrossRef]
- Meng, W. The Development and Evolution of Beijing’s Courtyard Since the Reform and Opening Up. Master’s Thesis, Beijing University of Architecture, Beijing, China, 2013. [Google Scholar]
- Gao, W. Evaluation and Optimization of Neighborhood-Scale Microclimate Environment in Central Beijing. Master’s Thesis, Northern Polytechnic University, Fremont, CA, USA, 2022. [Google Scholar] [CrossRef]
- Ramos, G.; Ghisi, E. Analysis of daylight calculated using the EnergyPlus programme. Renew. Sustain. Energy Rev. 2010, 14, 1948–1958. [Google Scholar] [CrossRef]
- Lagios, K.; Niemasz, J.; Reinhart, C.F. Animated building performance simulation (ABPS)–linking Rhinoceros/Grasshopper with Radiance/Daysim. Proc. SimBuild 2010, 4, 321–327. [Google Scholar]
- Sudan, M.; Tiwari, G.N.; Al-Helal, I.M. A daylight factor model under clear sky conditions for building: An experimental validation. Sol. Energy 2015, 115, 379–389. [Google Scholar] [CrossRef]
- Mo, H.; Zhou, Y.; Song, Y. Parametric Design and Spatial Optimization of East-West-Oriented Teaching Spaces in Shanghai. Buildings 2022, 12, 1333. [Google Scholar] [CrossRef]
- Tian, Y.; Huang, Q. Multi-objective optimization design method for building performance and its application—An example of genetic algorithm. New Archit. 2021, 198, 84–89. [Google Scholar]
- Wang, W.; Zmeureanu, R.; Rivard, H. Applying multi-objective genetic algorithms in green building design optimization. Build. Environ. 2005, 40, 1512–1525. [Google Scholar] [CrossRef]
- Jiang, J. Research on the Optimization of High-Density Neighborhood Morphology Design Based on Genetic Algorithm. Master’s Thesis, Shenzhen University, Shenzhen, China, 2020. [Google Scholar] [CrossRef]
- Nelli, F. Machine Learning with scikit-learn. In Python Data Analytics; Apress: Berkeley, CA, USA, 2018. [Google Scholar] [CrossRef]
- Guohua, H. A study on housing rental prices based on XGBoost and LightGBM models. China Mark. 2023, 1145, 143–146. [Google Scholar] [CrossRef]
- McCall, J. Genetic algorithms for modelling and optimization. J. Comput. Appl. Math. 2005, 184, 205–222. [Google Scholar] [CrossRef]
- Ting, K.M. Confusion Matrix. In Encyclopedia of Machine Learning; Sammut, C., Webb, G.I., Eds.; Springer: Boston, MA, USA, 2011. [Google Scholar] [CrossRef]
- Goutte, C.; Gaussier, E. A Probabilistic Interpretation of Precision, Recall and F-Score, with Implication for Evaluation. In ECIR 2005: Advances in Information Retrieval; Losada, D.E., Fernández-Luna, J.M., Eds.; Lecture Notes in Computer Science; Springer: Berlin/Heidelberg, Germany, 2005; Volume 3408. [Google Scholar] [CrossRef]


Disclaimer/Publisher’s Note: The statements, opinions and data contained in all publications are solely those of the individual author(s) and contributor(s) and not of MDPI and/or the editor(s). MDPI and/or the editor(s) disclaim responsibility for any injury to people or property resulting from any ideas, methods, instructions or products referred to in the content. |
© 2023 by the authors. Licensee MDPI, Basel, Switzerland. This article is an open access article distributed under the terms and conditions of the Creative Commons Attribution (CC BY) license (https://creativecommons.org/licenses/by/4.0/).