1. Introduction
The market demand for manufactured sand (MS) in prepared concrete has grown rapidly in recent years [
1,
2,
3,
4]. MS is prepared by mechanically crushing the rock, and massive fine particles of MS are inevitably produced during the production process [
1,
2]. These MS fine particles are called stone powder (SP) or stone chips. The differences in the properties of parent rock and crushing methods of MS often lead to large differences in SP content in MS. Removing these SP particles not only requires a lot of manpower and resources but also leads to serious environmental pollution. Therefore, mixing SP particles and MS to prepare concrete is a very green and environmentally friendly solution. At present, research on the influence of SP content on the performance of MS concrete is one of the hot issues concerned by the concrete industry [
5,
6,
7,
8,
9,
10,
11,
12,
13,
14,
15,
16,
17,
18,
19].
In terms of concrete performance, Celik et al. [
5] reported that without changing the ratio of coarse aggregate to fine aggregate, the specific surface area of the aggregate and the water demand of concrete will increase with increasing stone powder content. Ahmed [
6] believed that although the water requirement of concrete increases with increasing stone powder content, its cohesiveness and water retention will be improved. It is generally believed that a certain amount of SP (10–30% of the total mass of MS) will improve the stacking properties of MS and improve the workability of MS concrete, while an excessive amount of stone powder will reduce the workability of MS concrete [
7,
8,
9,
10]. Wang et al. [
11] reported that the influence of SP from MS concrete on the workability and strength is consistent, showing first a trend of increase and then of decrease. Other studies have also shown that an appropriate stone powder can optimize the water retention and cohesiveness of concrete mix [
5]. Further, it not only improves the ITZ properties of concrete and optimizes the particle gradation of concrete but also improves the compactness and comprehensive durability of concrete [
7,
8,
10,
11,
12,
13]. In terms of microstructure, Soroka et al. [
14] found, for the first time in 1976, that limestone particles could not only absorb Ca
2+ ions released during the hydration of tricalcium silicate (C
3S), which reduces the concentration and orientation arrangement of calcium hydroxide crystals and increases the content of CSH at the interface transition zone but could also provide a nucleation area for hydration products. To date, most research reports agree that the action mechanism of limestone powder on cement-based materials can be divided into the filling effect, nucleation effect, dilution effect, and chemical effect [
15,
16,
17,
18,
19].
At present, most of the work focuses on the study of the change trend of the content of SP on the workability, mechanical properties, and durability of MS concrete. There are few reports on the effects of SP contents from MS in the early volume stability of MS concrete. However, the nucleation, dilution, and chemical effects of SP on the early volume stability [
20,
21,
22,
23] of concrete are far greater than their effects on the mechanical properties and durability of hardened concrete from the perspective of the reaction process of cement hydration. Therefore, the early shrinkage and cracking properties of MS concrete with different SP contents need to be further studied. In view of this, the limestone SP and limestone MS were selected for the test; the workability, early age shrinkage, early age crack resistance, strength, electric flux, and pore structure of MS concrete were tested in this paper. Our purpose is to provide a reference for the preparation of MS concrete in practical engineering, to provide a gateway to the expanded application of MS concrete in areas with poor sand resources, and to reveal the influence mechanism and influence trend of SP content on MS concrete performance.
2. Experiment
2.1. Raw Materials
Type P. O 42.5 Portland cement was used in the experiment, and its main performance indicators are shown in
Table 1. The limestone MS was used as a fine aggregate, and its main properties are shown in
Table 2; the SP is the fine powder produced by MS during the crushing process. The chemical compositions of SP and cement are shown in
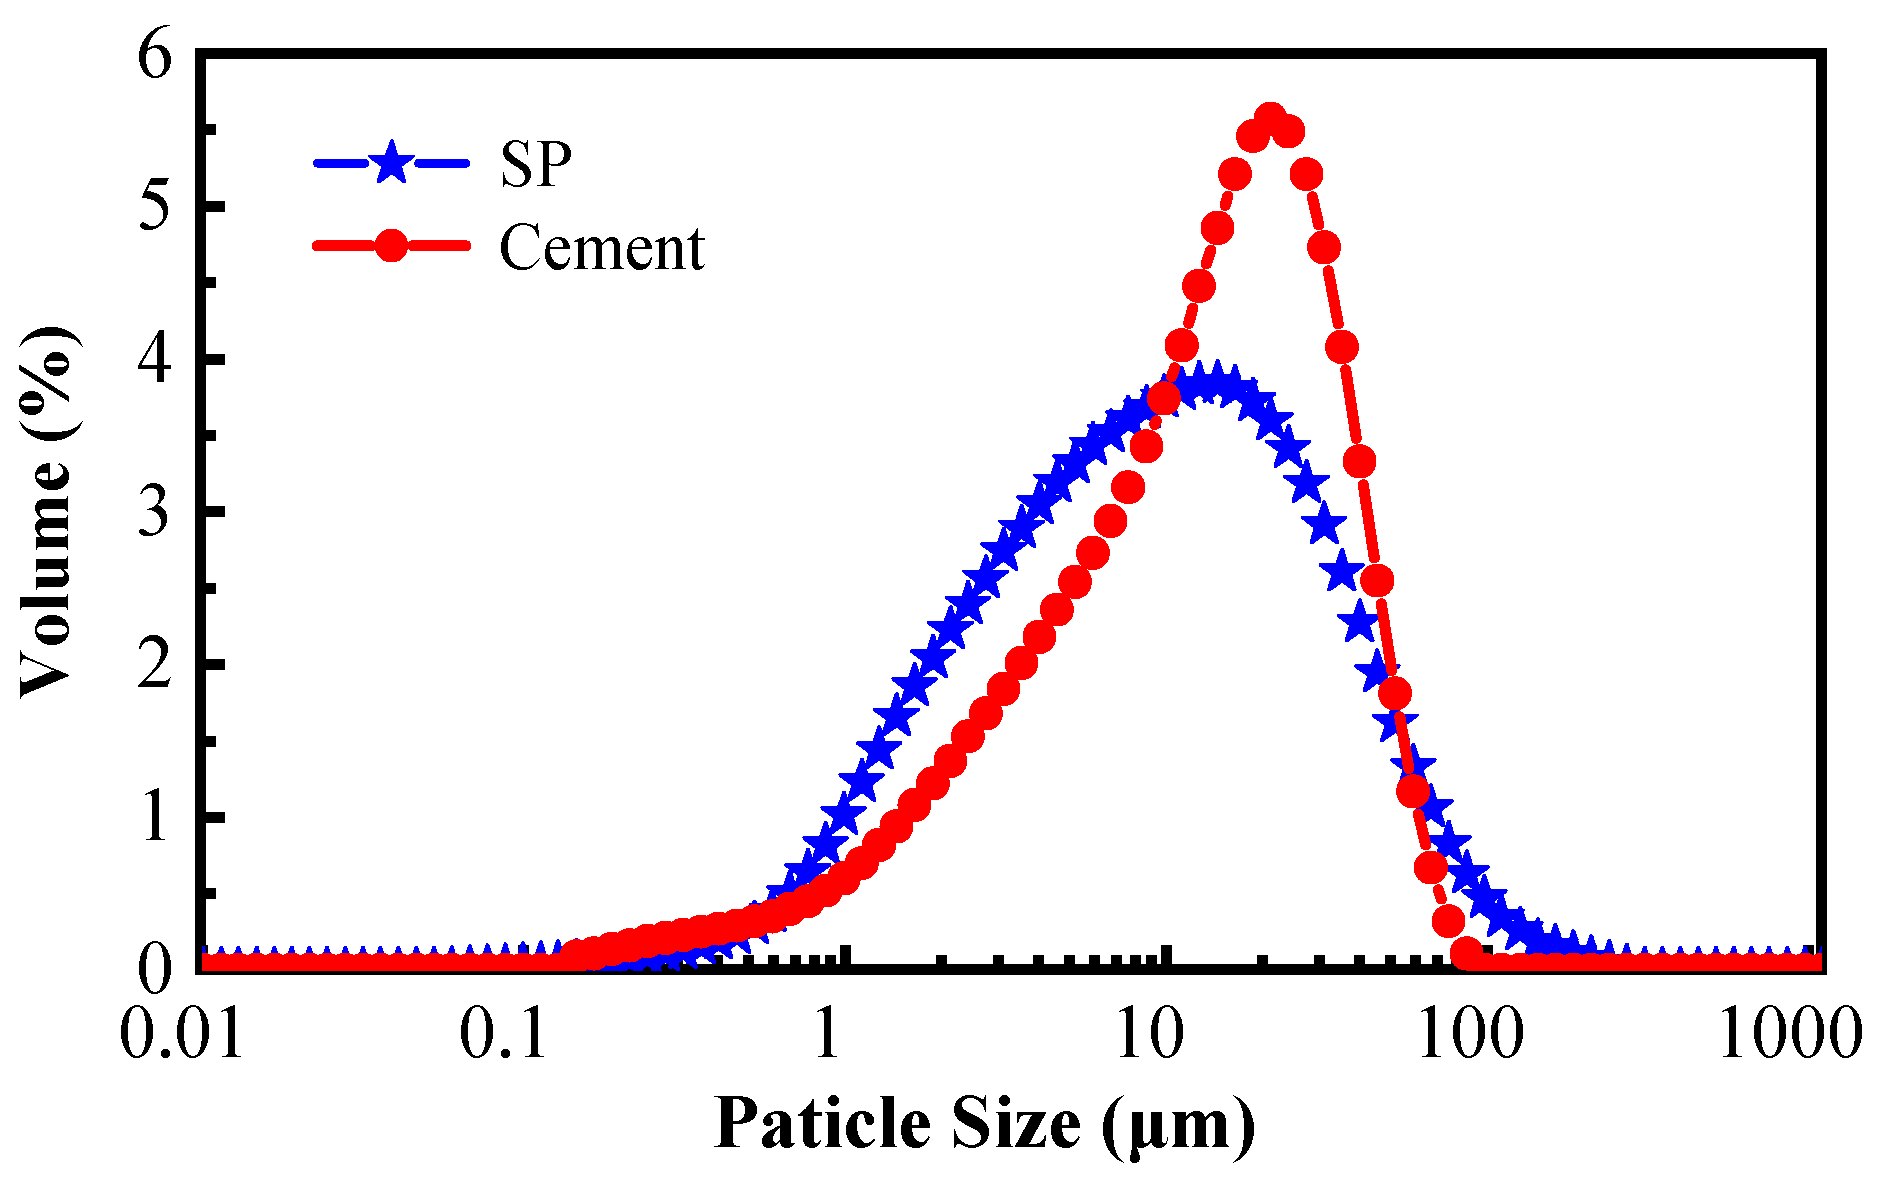
Table 3, and the particle size distribution is shown in
Figure 1. The coarse aggregates consisted of 5–20 mm limestone crushed stone; the MS, SP, and coarse aggregates are provided by the same manufacturer. A polycarboxylate with a 28% water-reducing rate was used, and the test’s water is ordinary tap water.
2.2. Method and Concrete Mix Ratio
2.2.1. Preparation of MS with Different SP Contents
First, MS was washed with water to remove the SP in the MS; then, MS with 0% SP content was obtained. Finally, MS samples (5%, 10%, 15%, and 20%) were prepared by increasing the content of the stone powder. It should be noted that the % is the percentage of SP in the weight of fine aggregate, that is, the ratio of SP mass to the mass of SP and MS.
2.2.2. Design of the Concrete Test
Two kinds of MS concrete with water/cement ratios (W/C) of 0.45 and 0.32 were designed in this experiment and are denoted as C0.45 and C0.32. In addition, the samples of the reference group prepared with clean MS were marked as −0, and the samples of the control group were mixed with MS with SP contents of 5%, 10%, 15%, and 20%, marked as −5, −10, −15, and −20, respectively.
2.2.3. Mix Ratio of Concrete
Considering the needs of engineering applications, we decided to design the slump of the concrete mixture to be 180 ± 20 mm. Therefore, the slump of concrete in different test groups was controlled within 160~200 mm by adjusting the amount of water reducer. To facilitate the evaluation of the workability of concrete mixed with manufactured sand with different SP contents, it is necessary to not only test the slump, slump flow, and segregation rate of concrete but also to observe and record its fluidity, cohesiveness, and water retention during testing. The concrete mixes are shown in
Table 4.
2.3. Testing
2.3.1. Workability Test
The slump, slump flow, and segregation rate were tested according to the GB/T 50080-2016 [
24]. The slump and slump flow tests were performed using slump barrels, and the segregation resistance tests were performed using feeders, square-hole sieves, and trays. The test result of segregation resistance is expressed in terms of the segregation rate, and the unit is %. The workability (mainly including fluidity, cohesiveness, and water retention) of the MS concrete mix should be observed and recorded simultaneously during the test.
2.3.2. Early Age Shrinkage Tests
The 3~72 h shrinkage strain of MS concrete was tested using to the Non-Contact Method of the GB/T 50082-2009 [
25], test equipment and preparation are shown in
Figure 2. The SRFM-810 concrete shrinkage deformation tester was used, and the results are expressed by the shrinkage strain curve of the concrete at an early age (3~72 h). It should be noted that each concrete mix needs to make three specimens, and the results are expressed as the average value of three specimens.
2.3.3. Early Age Crack Tests
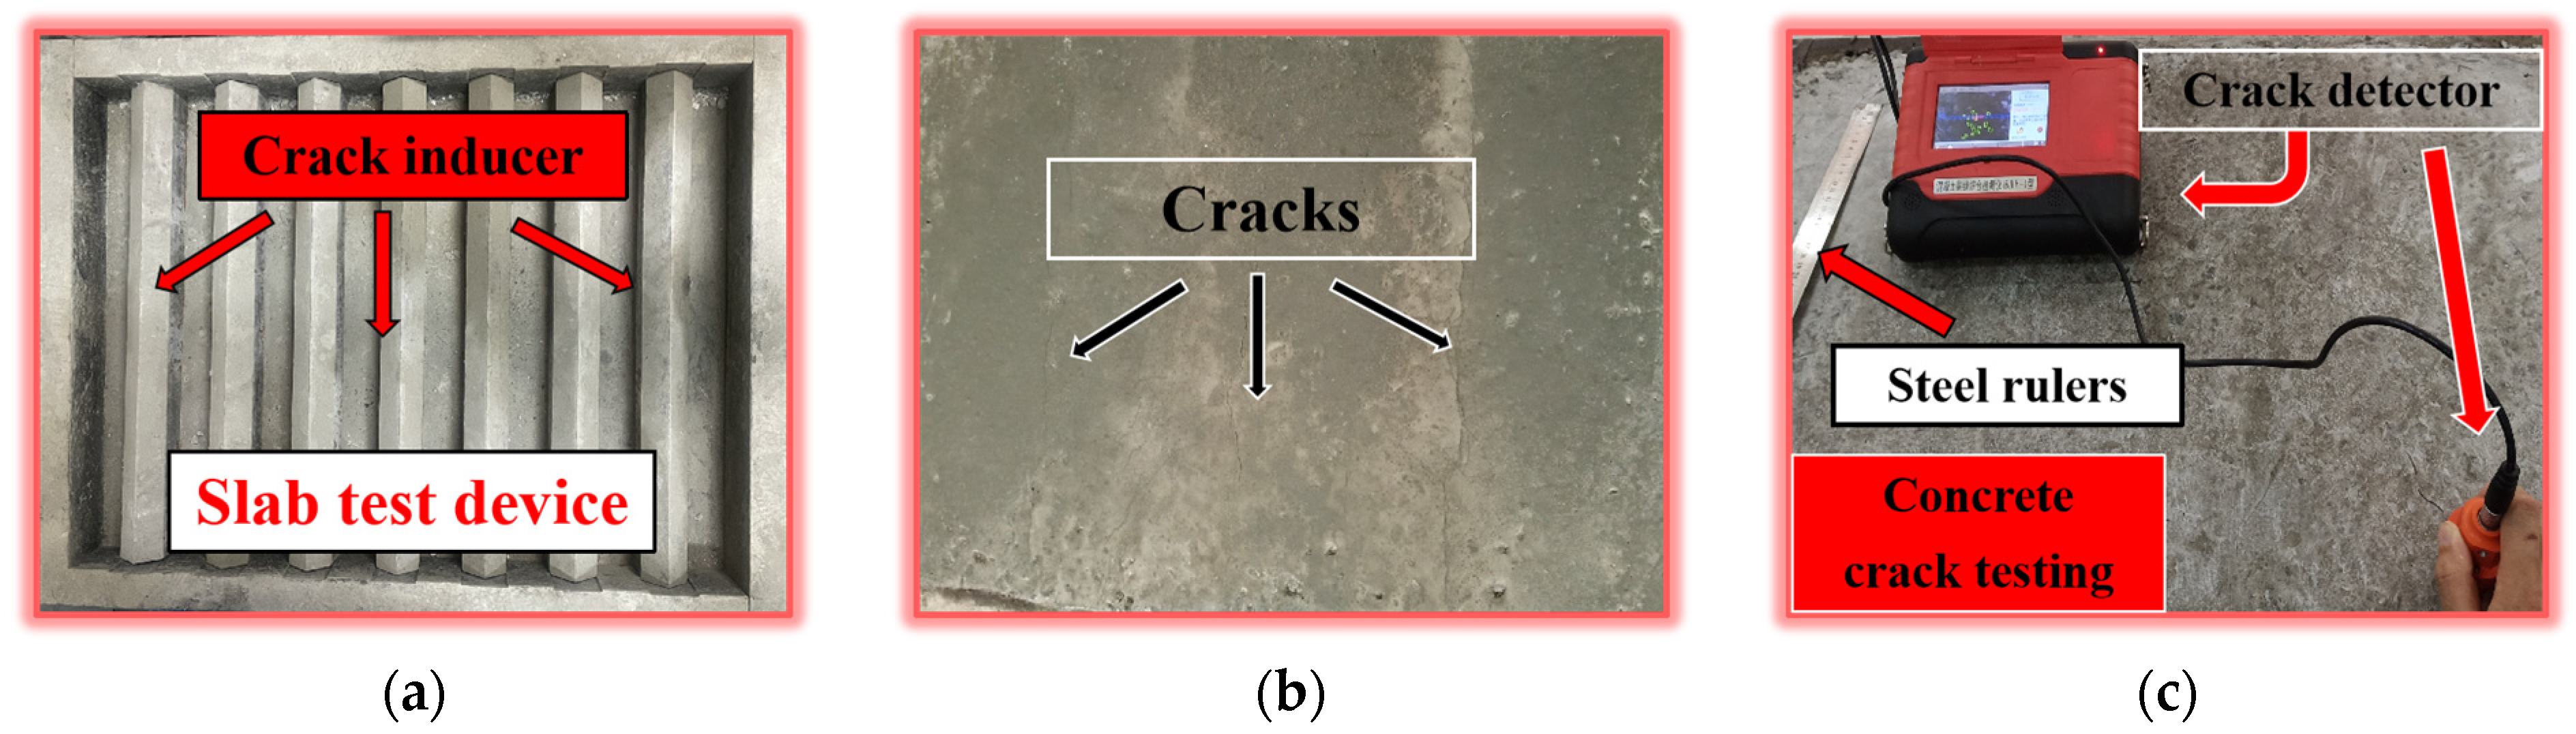
The 1 day cracking results of concrete was tested according to the slab test of the GB/T 50082-2009 [
25]; test equipment and preparation are shown in
Figure 3. The average cracking area of cracks, the number of cracks, and the cracks per unit of area are calculated according to GB/T 50082-2009 to indicate the crack resistance of concrete. It should be noted that each concrete mix needs to make two specimens, and the results are expressed as the average value of two specimens.
2.3.4. Compressive Strength and Electric Flux Tests
The compressive strengths of the concrete and chloride ions permeability were determined according to the GB/T 50081-2019 [
26] and the GB/T 50082-2009 [
25]. Cubes of 100 mm × 100 mm × 100 mm were prepared as compressive strength samples, and cylinders with a diameter of (100 ± 1) mm and a height of (50 ± 2) mm were prepared as electric flux samples. Under the curing stander condition (T = 20 ± 2 °C, RH = 95 ± 5%), the concrete compressive strength and electric flux value were measured after curing to 7 or 28 days of age.
2.3.5. Nuclear Magnetic Resonance (NMR) Tests
NMR is a phenomenon that occurs in systems with magnetic moments and angular momentum nuclei, which excite magnetic nuclei to interact with other nuclei under thermal motion, absorb, and release energy. The magnetic signals related to the energy release process decay exponentially with time constants, which are related to the attenuation of the magnetization of the entire system observed along the direction of the applied magnetic field or perpendicular to it. Notably, the abscissa (relaxation time) of the
T2 curve is related to the pore radius of the test result. The longer the transverse relaxation time
T2, the larger the pore radius. The ordinate (amplitude) is proportional to the number of pores. The higher the longitudinal signal amplitude is, the more pores there are. There is a linear relationship between the area under the
T2 peak and the pore water content [
27,
28,
29,
30]. The transverse relaxation time (
t2) of pore water in concrete can be expressed as:
where
ρ2 is the surface relaxation strength, and
S and
V are the pore surface area and pore volume, respectively.
The NMR test used a nuclear magnetic resonance microstructure analysis system (type: MacroMR12-150H-I), and a cylindrical test block with a diameter of (100 ± 1) mm and a height of (50 ± 2) mm was selected as a sample. After curing, the sample is subjected to vacuum negative pressure water retention treatment, and then the sample is wrapped in a plastic film for NMR testing.
3. Results
3.1. Workability
Table 5 shows the workability test results of MS concrete. It can be seen from
Table 5 that regardless of whether the W/C is 0.45 or 0.32, the amount of water-reducing agent required for the preparation of concrete increases with the SP increase, and the cohesiveness and water retention of MS concrete is obviously improved by increasing the SP in the MS. The reason is that the fine particles in the MS and the total surface area of the MS are small when the SP content is small (0% or 5%), although the concrete water demand is relatively low, and it is prone to segregation and bleeding. Further, the proportion of fine particles in the concrete mix increases with the increase in SP content when the stone powder is added to MS. Consequently, this leads to an increase in the specific surface area of MS, which increases the water demand, and the water-reducing agent increases. On the other hand, the SP in the MS can exert its filling effect to improve the gradation of MS, and the water retention and cohesiveness of the MS concrete were enhanced. In general, an appropriate amount of SP is conducive to improving the cohesiveness and water retention of MS concrete, but it will also increase the water demand during the preparation of concrete. Therefore, a certain amount of SP and super-plasticizer can obviously improve the workability of concrete.
In addition, the segregation resistance and water retention performance of the concrete with a W/C of 0.32 are better than those with a W/C of 0.45 when the SP content is fixed. The reason is that the concrete with a W/C of 0.32 uses more cement, the fine particles account for a larger proportion, and the compactness of the concrete mix is better, which leads to the segregation resistance and water retention of the MS concrete with a W/C of 0.32 being better than 0.45. In addition, the workability of concrete prepared with MS with an SP content of 20% is good when the W/C is 0.45. However, the workability of concrete prepared with MS with an SP content of 10–20% can meet the necessary requirements when the W/C is 0.32.
3.2. Early Age Shrinkage
The curve of the early age shrinkage magnitude of concrete within 3~72 h was tested under the environment of 20 ± 2 °C and 60 ± 5% RH, as shown in
Figure 4. It can be seen that the shrinkage strain of all concrete developed rapidly in the early stage, and the volume shrinkage curve of concrete increased rapidly within 3~20 h. However, the shrinkage strain of concrete began to stabilize after 20 h. The reason is generally believed to be due to the rapid cement hydration reaction within 3~20 h, the consumption of large quantities of water by the concrete, and the obvious concrete shrinkage deformation in this stage. However, the cement hydration reaction speed began to slow down with the increase in concrete age (over 20 h). In addition, its ability to resist deformation increases due to the gradual hardening of the concrete, which also causes the change in the concrete shrinkage curve to gradually stabilize.
It can be seen in
Figure 4 that when the W/C is 0.45, the concrete 72 h shrinkage strains of SP contents of 0%, 5%, 10%, 15%, and 20% are 390 με, 480 με, 680 με, 730 με, and 880 με, respectively. When the W/C is 0.32, the concrete shrinkage strains of SP contents of 0%, 5%, 10%, 15%, and 20% are 570 με, 730 με, 850 με, 930 με, and 1140 με, respectively. We can see that the shrinkage strains of concrete increase significantly with the increase in SP content, regardless of whether the W/C is 0.32 or 0.45. The main reasons for these results may be due to the following: First, SP replaces MS to increase the proportion of small particles in MS. The SP particles are conducive to filling the pores of MS; the concrete capillary becomes thinner, and the capillary pressure increases, resulting in an increase in the concrete shrinkage strain in the early stage [
20]. Second, the SP particles that are finer than the cement can replace the cement as the nucleation point for cement hydration, which improves the degree of hydration and increases the content of the hydration products in MS concrete. That is, the nucleation of the SP promotes the hydration of products and leads to the 3~72 shrinkage strain increase with the increase in SP mass [
1]. Third, the concrete becomes dense due to the increase in SP content and easy evaporation of water on the concrete surface due to its difficulty migrating inward, resulting in the drying shrinkage of the concrete increases. Finally, some studies have shown that the SP may perform a hydration reaction and increase the volume shrinkage strain of concrete at an early age [
1].
In addition, it can be seen that the concrete 3~72 h shrinkage strain with a W/C of 0.32 is much higher than that of concrete with a W/C of 0.45 with the same SP content(whether the SP content is 0%, 5%, 10%, 15%, or 20%). The reason is that concrete with a W/C of 0.32 has a larger amount of cement, the total amount of cement hydration reaction is larger, and the total shrinkage strain of concrete is relatively higher.
3.3. Early Age Cracking
Table 6 shows the test results of the concrete’s early cracking under the following conditions: 20 ± 2 °C and 60 ± 5% RH. The number of cracks and cracking area of C0.45-10 concrete are the largest when the W/C is fixed at 0.45, indicating that its crack resistance is the worst. However, it should be noted that although the cracking test results in
Table 1 show that C0.45-0 and C0.45-5 have a small area and number of cracks, it does not mean that they have good cracking resistance. On the contrary, C0.45-0 and C0.45-5 cannot be applied in practical engineering as they, in fact, have worse workability and crack resistance than C0.45-10 concrete. Because the slab mold has a certain gap at the corner, a large amount of cement slurry is lost during the formation process of C0.45-0 and C0.45-5 concrete (that is, the amount of cement in the concrete is reduced), which is the main reason for the small cracking area of C0.45-0 and C0.45-5 concrete in this test. Therefore, we can consider that the concrete crack resistance of the C0.45-0, C0.45-5, and C0.45-10 samples is poor. It can be seen from
Table 5 that the cracks number and cracking area of concrete C0.45-10, C0.45-15, and C0.45-20 were significantly reduced; it can be concluded that the crack resistance of concrete increases obviously with the increase in SP content when the W/C is fixed at 0.45. Combined with
Table 5 and
Table 6, the main reasons are the SP improves the cohesiveness and water retention of MS concrete and avoids the phenomenon of segregation and bleeding in the process of concrete forming and application. At the same time, it helps improve the particle gradation and increase the compactness of concrete mix, reduces the risk of early cracking of concrete, and significantly improves the crack resistance of concrete.
It can be seen from
Table 6 that the crack resistance of concrete increases first and then decreases with increasing SP content when the W/C is fixed at 0.32, and the crack resistance of C0.32-10 MS concrete is the best. The reason for this is that although there is no loss of cement slurry during the molding process of the C0.32-0 concrete specimen, the cohesiveness of C0.32-0 is also poor (similarly to C0.45-10). When adding SP in MS, the cohesiveness of concrete is significantly improved with increasing SP content. On the other hand, the SP optimizes the MS concrete gradation and increases the cracking resistance performance. Therefore, the crack resistance of concrete increases with the increase in SP content when the SP content is not more than 10% (such as C0.32-5 and C0.32-10). However, the fine particles of SP in the concrete increase more when the SP content is greater than 10%, resulting in an increase in the viscosity of the mortar, and the cohesiveness of the concrete is further continuously enhanced. This also leads to difficult free water migration inside the concrete, large shrinkage, and an increased risk of concrete cracking (such as in C0.32-15 and C0.32-20).
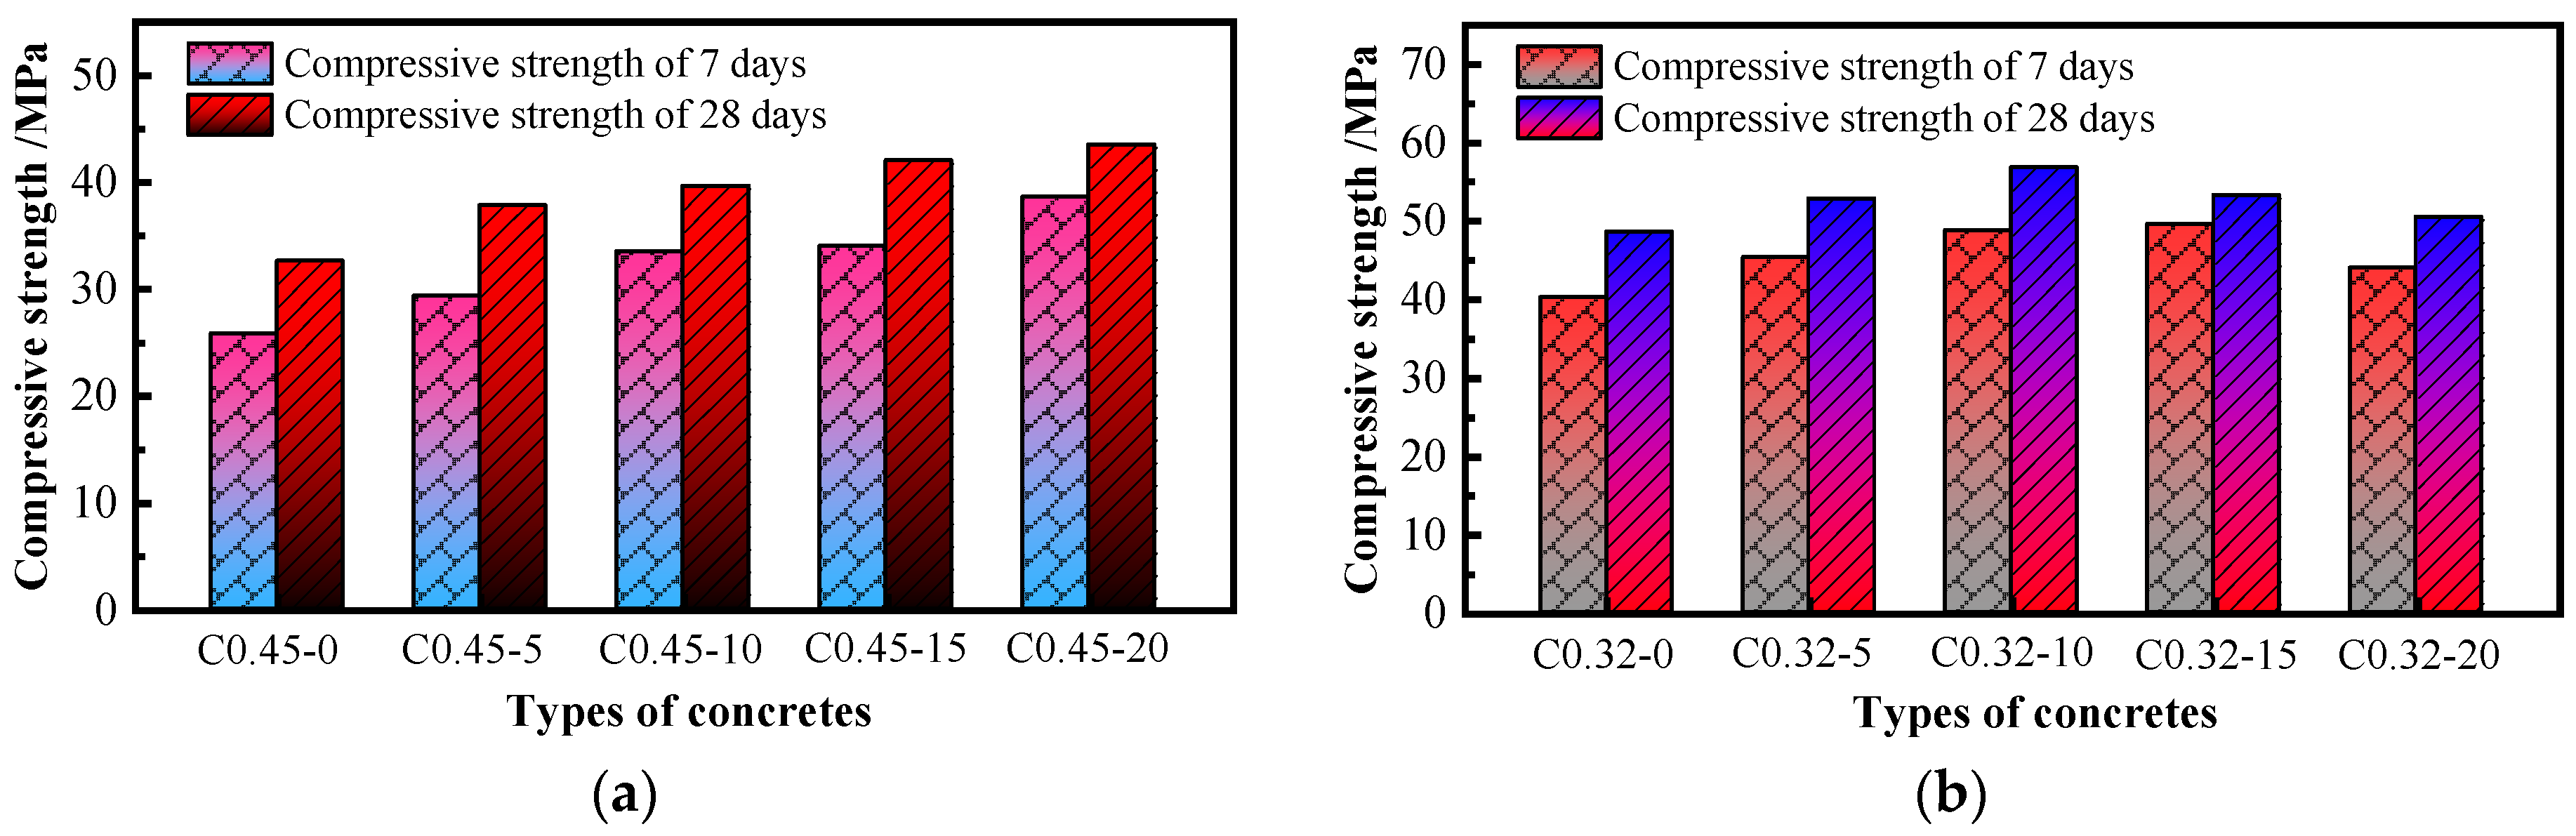
3.4. Compressive Strength
The compressive strength of MS concrete at 7 and 28 days are shown in
Figure 5. The 7 days strength of concrete with SP contents of 5%, 10%, 15%, and 20% increases by 13.6%, 29.8%, 31.8%, and 49.6% when the W/C is 0.45, compared with concrete with SP content of 0%; the 28 days strength increased by 16.0%, 21.5%, 28.8%, and 33.4%, respectively. The data show that when the W/C is fixed at 0.45, the compressive strength of MS concrete increases with increasing SP content. The main reason is that the amount of cement in the concrete mix is small when the W/C is large, and the concrete density is poor. The addition of SP can not only fill the pore structure in the concrete and compensate for the defects of the MS concrete mix but also act as the nuclear site of cement hydration to promote the cement hydration reaction [
18,
19]. When the W/C is 0.32, the 7 days compressive strength of concrete with SP contents of 5%, 10%, 15%, and 20% increases by 12.7%, 21.4%, 23.4%, and 9.5%, compared with concrete with an SP content of 0%; the 28 days compressive strength increases by 8.6%, 16.9%, 9.7%, and 3.9%, respectively. The data show that when the W/C is fixed at 0.32, the compressive strength of MS concrete increases first and then decreases with increasing SP content. The reason is that SP can still improve the pore structure of MS concrete when the SP content is controlled within a certain range. However, when the SP content reaches beyond a certain limit, the pores of the concrete are relatively dense, and the filling effect of SP for concrete tends to be saturated. But on the other hand, this deterioration effect of “tightest structure is destroyed”, “interface defects”, and “internal microcracks” brought by a large amount of SP gradually becomes obvious, resulting in a gradual decrease in the concrete strength [
20].
The strength of MS concrete increases with increasing SP content when the W/C is fixed at 0.45, but it first increases and then decreases when the W/C is fixed at 0.32. In addition, we can also see that the effect of SP content on low-strength MS concrete with less cementitious material is more significant than that on high-strength MS concrete with more cementitious material.
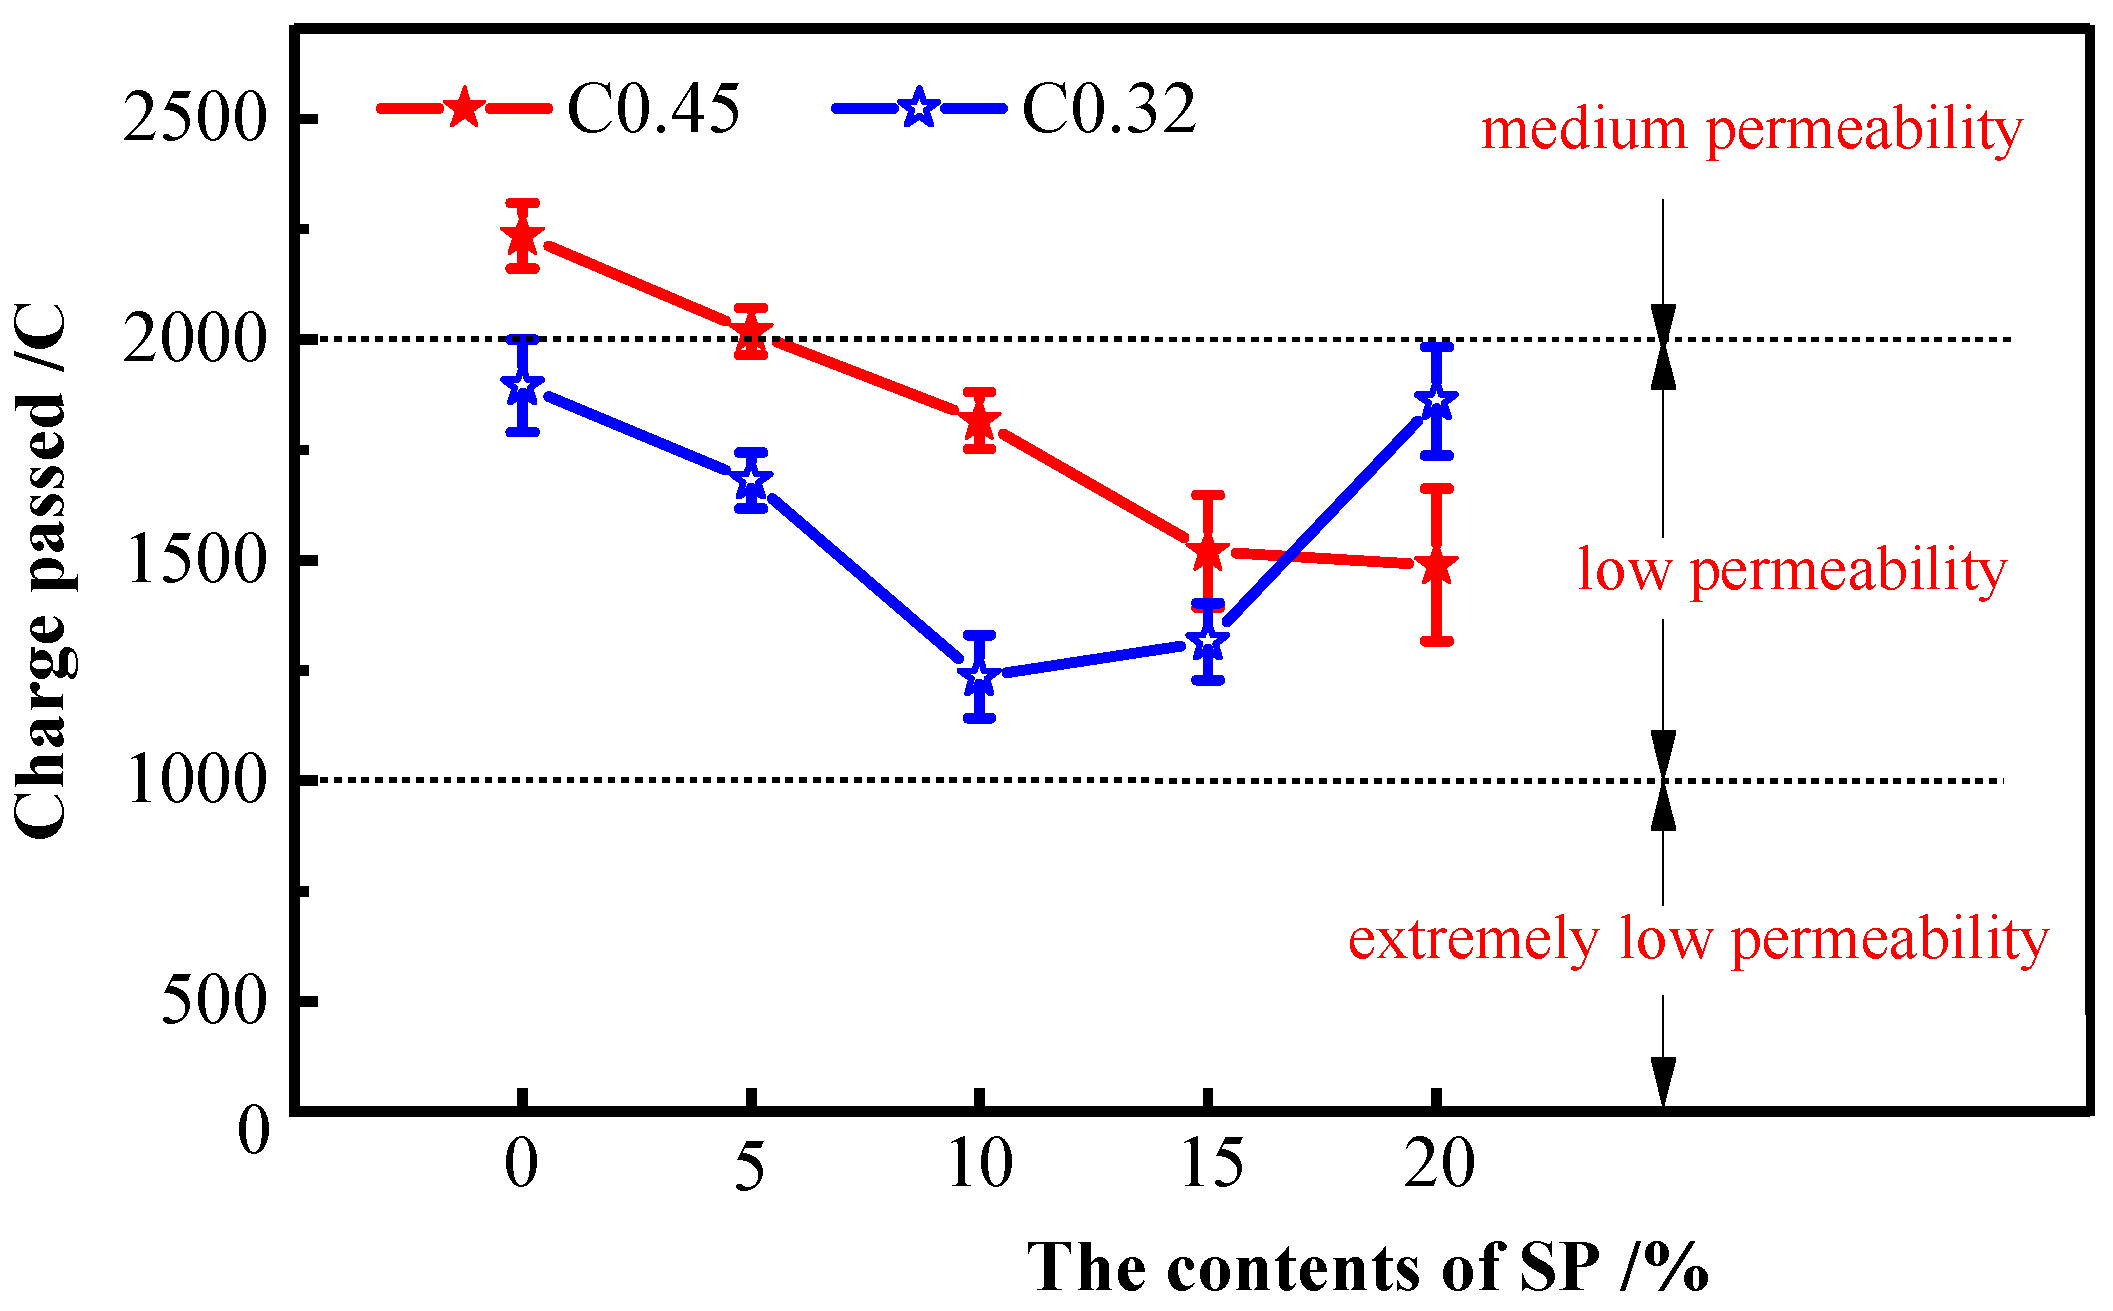
3.5. Electric Flux
The 28 days electric flux values of MS concrete samples are shown in
Figure 6. Compared with the 0% SP concrete when the W/C is 0.45, the 28 days electric flux values of 5%, 10%, 15%, and 20% decrease by 9.7%, 18.7%, 32.0%, and 33.4%, respectively. When the W/C was 0.32, the 28 days electric flux values of 5%, 10%, 15%, and 20% decreased by 11.3%, 34.8%, 30.6%, and 1.8%, compared with the 0% SP concrete. The data show that the chloride ion penetration resistance of concrete increases with increasing SP content when the W/C is fixed at 0.45, and the chloride ion penetration resistance of concrete increases first and then decreases when the W/C is fixed at 0.32. The influence trend and influence mechanism of SP content on the chloride ion penetration resistance of MS concrete are the same as the abovementioned change mechanism of compressive strength. However, it should be noted that although SP did not reduce the strength and resistance of the concrete with a W/C of 0.45 to chloride ion penetration in the test, it can be speculated that the MS concrete with a W/C of 0.45 also has an optimal SP content range and the critical content value of the SP content is greater than that of the concrete with a W/C ratio of 0.32. Furthermore, the mechanical properties and durability of MS concrete with a W/C of 0.45 will also deteriorate when the SP content continues to increase beyond the critical value (20% or more).
3.6. Nuclear Magnetic Resonance
To reveal the effect of SP content on the microscopic pore structure of MS concrete, NMR tests were carried out on five groups of concrete with a W/C of 0.45. The relaxation time
T2 spectrum of the concrete is shown in
Figure 7. It can be seen from
Figure 7 that the areas of the characteristic peaks S1, S2, S3, and the
T2 spectrum total peak area of MS concrete all decreased with increasing SP content. The data show that the free water content in the concrete is obviously reduced with an increase in SP content, meaning the porosity of the concrete is obviously reduced with the increase in SP content. The reason is that, on the one hand, the filling effect of SP optimizes the gradation and improves the compactness of MS concrete, which results in the porosity of the concrete being reduced [
27]. On the other hand, SP can become a nucleation local of cement hydration [
1], which promotes the formation of cement hydration products, optimizes the pore structure, and improves the interfacial bonding performance of MS concrete, further making concrete strength and impermeability increase with increasing SP content in concrete.
In addition, it is worth noting that was found that the strength and impermeability of C0.45 concrete increased with the increase in SP content in this test. However, the strength and impermeability of C0.32 concrete increased first and then decreased with the increase in SP content. It can be concluded that there is an optimal range of massive SP, and too much or too little SP is not conducive to the development of concrete mechanical properties and durability. The optimum SP content of MS concrete may depend on many parameters such as the W/C, the number of cementitious materials, SP characteristics (including lithology, particle size distribution, chemical composition), gradation, aggregate shape, etc. The control of the optimum SP content should be determined in combination with the engineering environment and practical use. However, this is beyond the scope of this paper, which will continue to carry out research in future reports. The influencing factors of the optimal SP value and the influencing mechanism of each factor (especially the deterioration effect) must be further elucidated, which is of great reference value and significance for promoting the development of manufactured sand in the concrete industry.
4. Conclusions
To reveal the influence mechanism and influence trend of SP content on MS concrete performance, the workability, shrinkage strain, cracking resistance, strength, electric flux, and pore structures of MS concrete with different SP contents were tested. The main findings and conclusions are as follows:
SP is beneficial in improving the water retention and cohesiveness of MS concrete, but at the same time, it will increase the amount of concrete water reducer and the shrinkage strain at an early stage.
An appropriate amount of SP added to MS for the preparation of concrete is beneficial, improving the crack resistance, strength, and chloride ion permeability resistance of MS concrete. However, excessive SP will lead to a reduction in the performances of MS concrete.
The optimized effect of SP content on the performance of concrete with a W/C of 0.45 is more significant than that of the concrete with a W/C of 0.32 when adding an appropriate amount of SP.
It is suggested that the optimal SP content of MS concrete with a water/cement ratio of 0.32 is 10%, and that of MS concrete with a water/cement ratio of 0.45 should be less than 20%.
The optimum SP content of MS concrete may depend on many parameters such as the W/C, the number of cementitious materials, SP characteristics (including lithology, particle size distribution, chemical composition), gradation, aggregate shape, etc. The control of the optimum SP content should be determined in combination with the engineering environment and practical use. However, this is beyond the scope of this paper. Nevertheless, we will continue to carry out research in future reports.
Author Contributions
M.Z.: Conceptualization, methodology, writing—original draft preparation, writing—review and editing; J.X.: Visualization, original draft preparation; M.L.: Formal analysis, review and editing; X.Y.: Formal analysis, review and editing. All authors have read and agreed to the published version of the manuscript.
Funding
This research was funded by the Scientific Research Program for Youth Innovation Team Construction of Shaanxi Provincial Department of Education grant number 22JP098.
Data Availability Statement
No new data were created or analyzed in this study. Data sharing is not applicable to this article.
Conflicts of Interest
The authors declare that there is no conflict of interest related to this work.
References
- Liu, T.; Zhu, L.H.; Yu, B.T.; Li, T. Experimental Studies to Investigate Efficacies of Granite Porphyry Powder as Homologous Manufactured Sand Substitute. J. Adv. Concr. Technol. 2023, 21, 307–321. [Google Scholar]
- Shen, W.G.; Liu, Y.; Wang, Z.W.; Cao, L.H.; Wu, D.L.; Wang, Y.J.; Ji, X.L. Influence of manufactured sand’s characteristics on its concrete performance. Constr. Build. Mater. 2018, 172, 574–583. [Google Scholar] [CrossRef]
- Ma, H.; Sun, Z.; Ma, G. Research on Compressive Strength of Manufactured Sand Concrete Based on Response Surface Methodology (RSM). Appl. Sci. 2022, 12, 3506. [Google Scholar] [CrossRef]
- Feng, J.; Dong, C.; Chen, C.; Wang, X.; Qian, Z. Effect of Manufactured Sand with Different Quality on Chloride Penetration Re-sistance of High–Strength Recycled Concrete. Materials 2021, 14, 7101. [Google Scholar] [CrossRef]
- Celik, T.; Marar, K. Effects of crushed stone dust on some properties of concrete. Cem. Concr. Res. 1996, 26, 1121–1130. [Google Scholar] [CrossRef]
- Ahmed, A.E.; El-Kourd, A.A. Properties of concrete incorporating natural and crushed stone very fine sand. ACI Mater. J. 1989, 86, 417–424. [Google Scholar]
- Guo, M.; Yang, J.; Huang, P.Y.; Gao, C.; Xia, J.L. Effect of MB value of granite-made sand powder on concrete performance. New Build. Mater. 2022, 49, 76–80. [Google Scholar]
- He, S.Q.; Lv, M.; Ma, D.Z.; Cai, S.Y. Experimental study on mix method of self-compacting concrete with high stone powder manufactured sand. Concrete 2019, 11, 132–135. [Google Scholar]
- Fang, G.F.; You, Q.S.; Zhang, X.Y.; Li, X.Y. Study on influence mechanism of siliceous manufactured sand on concrete performance. New Build. Materials 2022, 49, 81–84. [Google Scholar]
- Nanthagopalan, P.; Santhanam, M. Fresh and hardened properties of self-compacting concrete produced with manufactured sand. Cem. Concr. Compos. 2011, 33, 353–358. [Google Scholar] [CrossRef]
- Wang, Y.L.; Wang, W.D.; Zhou, M.K.; Li, B.X.; Liu, S.X. Determination analysis of content of aggregate micro fines of middle and low compressive strength manufactured fine aggregate concrete. J. Civ. Environ. Eng. 2012, 34, 154–158. [Google Scholar]
- Lu, L.; Yang, Z.X.; Lin, Y.; Dong, S.L. Partial replacement of manufactured sand with homologous granite powder in mortar: The effect on porosity and capillary water absorption. Constr. Build. Mater. 2023, 376, 131031. [Google Scholar] [CrossRef]
- Diab, A.M.; Elmoaty, A.E.M.A.; Aly, A.A. Long term study of mechanical properties, durability and environmental impact of limestone cement concrete. Alex. Eng. J. 2016, 55, 1465–1482. [Google Scholar] [CrossRef]
- Soroka, I.; Stern, N. Calcareous fillers and the compressive strength of portland cement. Cem. Concr. Res. 1976, 6, 367–376. [Google Scholar] [CrossRef]
- Vance, K.; Aguayo, M.; Oey, T.; Sant, G.; Neithalath, N. Hydration and strength development in ternary portland cement blends containing limestone and fly ash or metakaolin. Cem. Concr. Compos. 2013, 39, 93–103. [Google Scholar] [CrossRef]
- Lin, J.Y.; Jiang, Y.; Wu, X.Y.; Wang, Y.L.; He, H. Research status on influence of aggregate micro fines on concrete performance. Bull. Chin. Ceram. Soc. 2018, 37, 3842–3848. [Google Scholar]
- Shi, C.J.; Wang, D.H.; Jia, H.F.; Liu, J.F. Role of limestone powder and its effect on durability of cement-based materials. J. Chin. Ceram. Soc. 2017, 45, 1582–1593. [Google Scholar]
- Wang, D.H.; Shi, C.J.; Farzadnia, N.; Shi, Z.G.; Jia, H.F. A review on effects of limestone powder on the properties of concrete. Constr. Build. Mater. 2018, 192, 153–166. [Google Scholar] [CrossRef]
- Wang, D.H.; Shi, C.J.; Farzadnia, N.; Shi, Z.G.; Jia, H.F.; Ou, Z.H. A review on use of limestone powder in cement-based materials: Mechanism, hydration and micro-structures. Constr. Build. Mater. 2018, 181, 659–672. [Google Scholar] [CrossRef]
- Yu, B.T.; Liu, T.; Wang, H.; Xie, C.; Li, S. Influence of granite porphyry stone powder content on properties and microstructure of concrete. J. Jilin Univ. 2022, 52, 1053–1062. [Google Scholar]
- Wang, L.; Lu, X.; Liu, L.S.; Xiao, J.; Zhang, G.; Guo, F.X.; Li, L. Influence of MgO on the Hydration and Shrinkage Behavior of Low Heat Portland Cement-Based Materials via Pore Structural and Fractal Analysis. Fractal Fract. 2022, 6, 40. [Google Scholar] [CrossRef]
- Wang, L.; Zeng, X.M.; Li, Y.; Yang, H.M.; Tang, S.W. Influences of MgO and PVA Fiber on the Abrasion and Cracking Re-sistance, Pore Structure and Fractal Features of Hydraulic Concrete. Fractal Fract. 2022, 6, 674. [Google Scholar] [CrossRef]
- Wang, L.; Guo, F.X.; Yang, H.M.; Wang, Y.; Tang, S.W. Comparison of fly ash, PVA fiber, MgO and shrinkage-reducing ad-mixture on the frost resistance of face slab concrete via pore structural and fractal analysis. Fractals-Complex Geom. Patterns Scaling Nat. Soc. 2021, 29, 2140002. [Google Scholar]
- GB/T 50080-2016; Standard for Test Method of Performance on Ordinary Fresh Concrete. National Standards of People’s Republic of China: Beijing, China, 2016.
- GB/T 50082-2009; Standard for Test Method for Long-Term Performance and Durability of Ordinary Concrete. National Standards of People’s Republic of China: Beijing, China, 2009.
- GB/T 50081-2019; Standard for Test Method of Concrete Physical and Mechanical Properties. National Standards of People’s Republic of China: Beijing, China, 2019.
- Nicula, L.M.; Corbu, O.; Ardelean, I.; Sandu, A.V.; Iliescu, M.; Simedru, D. Freeze-Thaw Effect on Road Concrete Containing Blast Furnace Slag: NMR Relaxometry Investigations. Materials 2021, 14, 3288. [Google Scholar] [CrossRef] [PubMed]
- Shen, Y.J.; Wang, Y.Z.; Wei, X.; Jia, H.L.; Yan, R.X. Investigation on meso-debonding process of the concrete interface induced by freeze–thaw cycles using NMR technology. Constr. Build. Mater. 2020, 252, 118962. [Google Scholar] [CrossRef]
- Zhang, S.Y.; Zheng, S.Q.; Wang, E.; Dai, H.J. Grey model study on strength and pore structure of self-compacting concrete with different aggregates based on NMR. J. Build. Eng. 2023, 64, 105560. [Google Scholar] [CrossRef]
- Li, Y.L.; Ma, H.; Wen, L.F.; Yuan, J.P.; Zhang, Y.; Li, Y.; Zhou, H.; Chen, J.H. Influence of pore size distribution on concrete cracking with different AEA content and curing age using acoustic emission and low-field NMR. J. Build. Eng. 2022, 58, 105059. [Google Scholar] [CrossRef]
| Disclaimer/Publisher’s Note: The statements, opinions and data contained in all publications are solely those of the individual author(s) and contributor(s) and not of MDPI and/or the editor(s). MDPI and/or the editor(s) disclaim responsibility for any injury to people or property resulting from any ideas, methods, instructions or products referred to in the content. |
© 2023 by the authors. Licensee MDPI, Basel, Switzerland. This article is an open access article distributed under the terms and conditions of the Creative Commons Attribution (CC BY) license (https://creativecommons.org/licenses/by/4.0/).


