Abstract
This paper analyses, as a case study, various balcony glazing arrangements in a typical tourist apartment building on the Mediterranean coast of south-eastern Spain, and their effects on the energy performance. The glazing of terraces has been very common in this type of flat over the last 40 years. The objective is to determine qualitatively and quantitatively how the glazing of terraces in such buildings influences their energy efficiency and indoor thermal comfort, considering the specific characteristics of the dry Mediterranean climate (BShs) within a warm semi-arid climate (BSh). The scientific novelty of the work consists of demonstrating that the installation of glazed enclosures on terraces allows the houses to be heated for free in winter, taking advantage of the greenhouse effect, and allows excess heat to be dissipated in summer by using natural ventilation. The results of the work enable the determination of appropriate terrace glazing solutions to improve the energy efficiency and thermal comfort of the dwelling, obtaining a reduction of more than 58% in annual energy demand and annual energy consumption. The work demonstrates the advantages that glazing systems for terraces can have in improving the energy efficiency of houses by using systems like glass curtains.
1. Introduction
This work studies the energy performance of a typical tourist apartment building in south-eastern Spain. On the Spanish Mediterranean coast, tourist apartment buildings with large balconies have abounded since the tourist boom of the 1960s and 1970s []. These balconies provide a great outdoor space in which to enjoy the sunny and warm climate of the Mediterranean coast [] and protect the glazing from the high solar radiation of this geographical area [,,]. These types of beach apartment buildings were traditionally used as second homes to be used only in summer []. Therefore, their use was mainly occasional and for holiday relaxation [].
However, in recent decades, there has been a progressive change of use in respect of these beach flats into year-round primary dwellings, due to the rise in house prices in city centres []. The new permanent usage has increased energy consumption and the need for more usable space inside the house [,] by generalising the enclosure of terraces with glazing in order for them to be used as interior spaces of the house throughout the whole year []. In many cases, these glazed terraces are joined to the living room by removing the original façade enclosure of the building []. In other cases, the original façade enclosure is maintained so the terrace forms an independent space complementary to the living room []. In both situations, the glazing of the terraces implies losing the solar protection provided by balconies overhanging the original glazing of the building façade []. This causes a significant change in the thermal behaviour of the indoor environment, especially in a climate characterised by a high annual solar radiation [,]. Furthermore, this change in thermal behaviour is different depending on whether the glazed terrace is joined to the living room by removing the original façade enclosure, or whether the glazed terrace is kept as an independent space [,,]. However, these indoor thermal effects are usually ignored by homeowners, who do not know and do not foresee the consequences of these changes on the energy efficiency and indoor thermal comfort of their dwellings [,].
Previous research has demonstrated the high greenhouse effect generated by glazed surfaces in the BShs climate [] and the beneficial effect of natural ventilation in dissipating excess heat from the indoor environment [,,,,]. Some case studies consider modern single-family houses with large windows, or public buildings with large semi-transparent roofs, such as sports buildings or heated public swimming pools []. However, there is a lack of studies on the important effects (positive and negative) on energy efficiency and indoor thermal comfort due to the glazing of terraces in this specific climate [].
The particularly high solar radiation of the BShs climate [] requires different energy-saving strategies in comparison to continental and Central European climates []. Ghrab-Morcos demonstrated the importance of adequate compensation for winter and summer considerations in a Mediterranean climate []. In winter and cold days in spring and autumn, enclosed glazed terraces can be used as “solar galleries” to capture the sun’s heat [,] as they generate a favourable greenhouse effect for the heating of the house []. In summer, glazed terraces can be opened to take advantage of the benefits of natural cross-ventilation to reduce heat. This contributes to energy savings [,,,,] and to thermal comfort and indoor air quality [,,,,,,], reducing reliance on mechanical systems []. It avoids excessive reliance on renewable energies, whose fluctuations due to climatic conditions require the use of conventional energy sources or renewable-energy-resource-based poly-generation microgrids [] and advanced storage technologies [].
However, current Spanish regulations do not sufficiently consider the particularities of the Mediterranean climate, forcing the design of very insulated and airtight dwellings. Nevertheless, Mediterranean architecture has historically been characterised by more permeable envelopes with plenty of natural ventilation to take advantage of the goodness of the climate as an important architectural resource []. In fact, regulations and energy certification software do not facilitate the use of these kinds of passive systems and, despite their advantages, do not allow consideration of the natural ventilation of dwellings [,,].
This work challenges these regulatory limitations and explores the possibility of using glazed terraces as a passive method to heat houses in winter, and natural ventilation to cool houses in summer. This paper analyses the thermal behaviour of several dwellings of a tourist apartment building with glazed and unglazed terraces. Three real dwellings with the same construction characteristics, orientation and usable area are studied. One of them maintains its original layout with an open-air terrace. The second property was renovated by glazing the terrace and joining it to the living room. The third dwelling was renovated by glazing the terrace and keeping the original façade windows and enclosures between the terrace and the living room. The experimental design includes a climatic study of the area, a study of the current hygrothermal conditions of the building, and a study of the thermal comfort and energy efficiency of the three dwellings via in situ measurements and computer simulations.
For the study of thermal comfort, on-site surveys of the users of the three dwellings were carried out, and the Fanger analytical method comprising the predicted mean vote (PMV) and the predicted percentage dissatisfied (PPD) was applied. According to this method, the following values were considered for the PMV: −3 (cold), −2 (fresh), −1 (slightly cool), 0 (neutral), +1 (slightly warm), +2 (warm), +3 (very hot). Values between −1 and +1 are assumed adequate according to the adaptive method established by ASRAHE 55 []. For the PPD, values of less than 10% unsatisfactory were assumed to be adequate.
The significance of the study is to determine qualitatively and quantitatively how the glazing of terraces affects the thermal behaviour of dwellings. The work analyses the influence of this glazing on indoor temperatures, indoor thermal comfort and energy efficiency throughout the year. The research allows the determination of appropriate terrace glazing solutions for the improvement of energy efficiency and thermal comfort of the dwelling. The results and conclusions can be applied to many other energy renovation projects in residential buildings in the BSHs climate.
2. Materials and Methods
The case study building is located on the San Juan Beach, Alicante (Spain). This geographical area corresponds to the dry Mediterranean climate (BShs) within a warm semi-arid climate (BSh) according to the Köppen-Geiger climate zones [], and to climate B4 according to Spanish legislation []. The area has a temperate climate, with mild winters and hot, dry summers. Winter temperatures are around 18 °C, and summer temperatures are around 27 °C. The sea breeze acts as a thermal regulator, reducing the sensation of heat. It is important to highlight this fact because the correct use of the effects of the thermal breeze makes it possible to improve comfort and energy efficiency with economical passive methods []. However, for this research, the most remarkable aspect of this climate is the high solar exposure during the whole year, with more than 3000 h of sunshine per year (Figure 1). For the energy calculation, the climate database of the El Altet weather station (Alicante) was used.
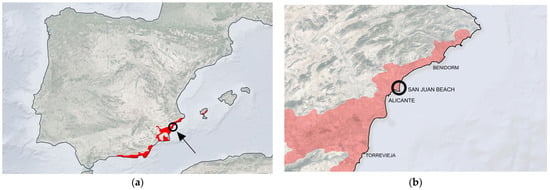
Figure 1.
(a) BShs climate zone (red) according to the Köppen–Geiger Climate Classification for the Iberian Peninsula, the Balearic Islands and the Canary Islands by the Agencia Estatal de Meteorología del Ministerio para la Transición Ecológica del Gobierno de España (location map of Alicante in a circle); (b) location map of San Juan Beach (own elaboration).
The selected case study is the Maralic building (Figure 1a), which was built in 1963. It was designed by the well-known Alicante architect Juan Antonio García Solera in collaboration with the Madrid architect Jaime de Alvear []. This building was one of the first tourist buildings constructed on the Spanish Mediterranean coast and is a clear example of the tourist boom of the 1960s and 1970s in the city. It is a ten-storey building, with a rectangular plan geometry of 66 m long and 13 m wide (Figure 2a). On the main façade there are the terraces of the flats. Each flat has a living area of 48 m2 (Figure 2b). The dwellings have a living-dining room/bedroom, a kitchen, a bathroom and a terrace. The original dwellings are characterised by a small interior area and large exterior terraces (Figure 2c). Three identical dwellings with three different renovations were studied. One of them keeps the original design with the open-air terrace. Another house was renovated by glazing the terrace and joining it to the living room by eliminating the original enclosure that separated the living room from the terrace. The third dwelling was renovated by glazing the terrace but maintains the original façade windows and enclosures between the terrace and the living room.
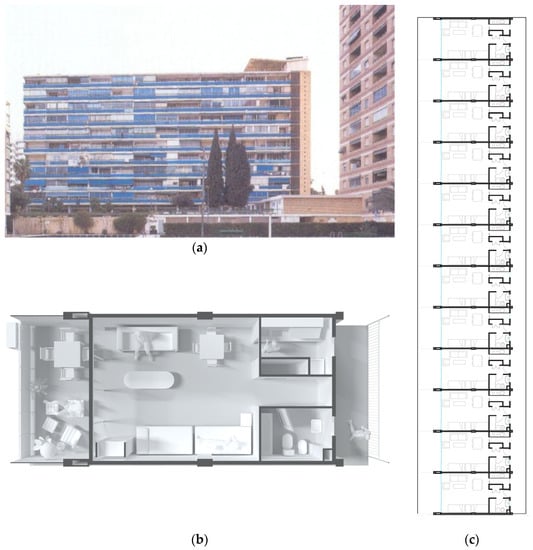
Figure 2.
Case study building: (a) external image of the building; (b) floor plan of the original dwelling; (c) floor plan of the original building without the glazed terraces.
This building has been selected because it has a typology of tourist housing that is very common to most of the tourist buildings built in the 1960s and 1970s in Spain. The construction typology and its solutions show a significant advance in terms of space and construction solutions compared to the period of “hygienic housing” [] after the Spanish Civil War. The dwellings have a simple interior layout, which allows a better analysis of the influence that the modification of glazing has on the overall energy performance. As a result, this study can be extrapolated to most of the tourist buildings on the Spanish Mediterranean coast, which are characterised by large balconies and terraces.
The methodology used in this work consisted of three phases. First, a climatic study of the area was carried out considering the exact location and orientation of the building. Second, an investigation of the current hygrothermal conditions of the dwellings was conducted with on-site temperature measurements and user comfort surveys. Thirdly, a systematised study of the energy performance of the three dwellings was carried out using computer simulations. All these aspects allowed a comparison between the original dwelling with an outdoor terrace and the two other renovated dwellings with different conditions in glazed terraces, and their effect on the global building energy performance and thermal comfort, considering the specific conditions of the local climate.
Phase 1. The annual cumulative radiation on the building envelopes and the wind speed on the facades were analysed using computational fluid dynamics (CFD).
Phase 2. To study the constructive and hygrothermal conditions of the dwellings, two types of in situ measurements were carried out: thermographic photographs (Figure 3a) and thermal transmittance of the facades using a thermal transmittance flow-meter (Figure 3b). To study the annual evolution of indoor temperatures, on-site measurements were carried out with a hot-wire sensor (Figure 3c).

Figure 3.
On-site measurements of the studied house enclosures: (a) thermographic photograph; (b) thermal transmittance measurement; (c) temperature and air velocity measurement.
In addition, surveys were carried out to evaluate the users’ perception of thermal comfort inside the dwellings and their thermal adaptation. The questionnaire was completed by the usual residents of the property. For on-site assessments and surveys, the air conditioning had to be switched off throughout the day so as not to interfere with the indoor conditions. The measuring devices were switched on five minutes beforehand to allow the sensors to acclimatise to the indoor environment. These strict settings meant that measurements had to be taken on specific days. This prevented the use of an automatic data collection system. The humidity and outside temperature of the enclosure were also measured. The on-site measurements and surveys were carried out simultaneously and at the same time, between 13:00 h and 14:00 h, every fortnight and for 12 months.
The thermographic evaluation was carried out using a Testo 868 camera. The measurement of thermal transmittance, humidity, temperature and air speed was carried out using a Testo 435-2 multifunctional instrument calibrated at standard settings (Figure 4 and Table 1).
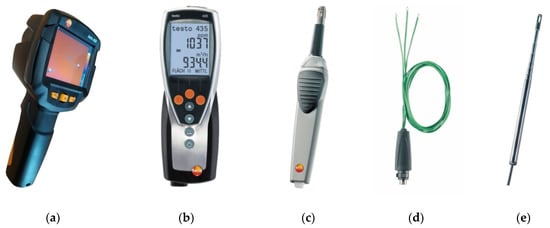
Figure 4.
Instruments and measuring equipment used: (a) Testo 868 thermal imaging camera; (b) Testo 435-2 thermal transmittance flowmeter; (c) humidity/temperature sensor with wireless handle; (d) surface sensor; (e) hot-wire sensor.

Table 1.
Summary of measuring instruments and their characteristics.
Phase 3. On-site measurements of indoor temperatures and thermal comfort surveys were complemented by computer simulations. The actual measurements and surveys were then compared with the computer simulations to adjust and validate the calculations made with the energy simulation tool. Finally, computer simulations were used to accurately calculate the annual cooling and heating energy needs of the three dwellings. To compare the energy performance of the three dwellings caused by the thermal effect of the terraces, the same conditions of use and air-conditioning installations were considered in all three dwellings. For this reason, actual measurements from electricity meters could not be used and simulations had to be performed.
The research has a systematised approach and is based on the following four case studies:
- -
- Original house: A dwelling that maintains the original distribution with the exterior terrace (Figure 5a).
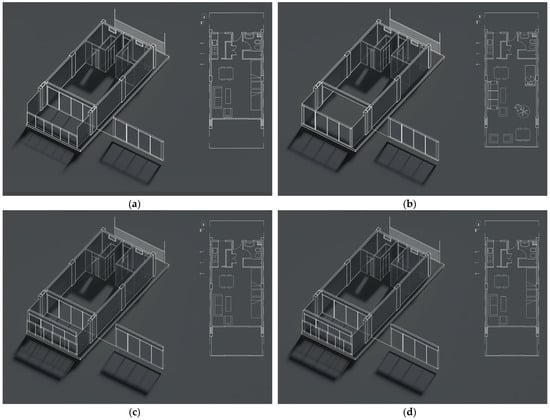 Figure 5. Sketch of the case studies: (a) original dwelling; (b) Modification 1; (c) Modification 3; (d) Modification 4.
 - -
- Modification 1: A refurbished dwelling with glazing on the terrace that joins it to the living room and eliminates the original enclosure that separated the living room from the terrace (Figure 5b).
- -
- Modification 2: A refurbished dwelling with glazing on the terrace that maintains the original façade windows and enclosures between the terrace and the living room (Figure 5c).
- -
- Modification 3: A refurbished dwelling with glazing on the terrace, maintaining the original façade enclosures and windows between the terrace and the living room, and applying natural ventilation in summer (Figure 5d).
The size and interior layout of the three houses is the same. The insulating characteristics of the glass and joinery used in the glazing of the terraces of the refurbished houses are very similar to the glass and joinery of the original houses.
A diagram of the methodology used in the research is shown below (Figure 6).
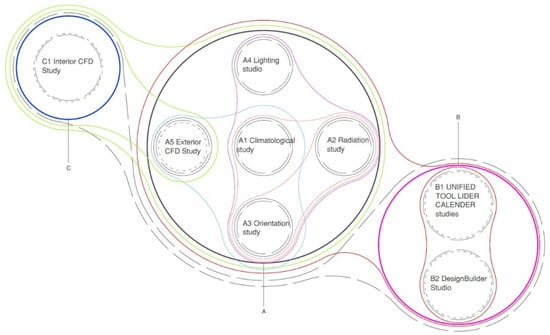
Figure 6.
Methodology diagram of the study.
DesignBuilder software (version v.7.0.1.006, DesignBuilder Software Limited, Stroud, UK) was used for modelling and simulations. It is a spatialised computer programme used to simulate the energy performance and thermal comfort of buildings using the EnergyPlus calculation engine []. This programme also allows CFD calculations and simulations for the effect of natural ventilation (Figure 7 and Figure 8).
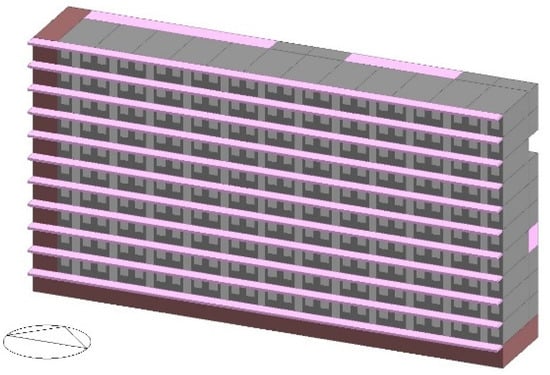
Figure 7.
Full exterior view of the building modelled in DesignBuilder software.
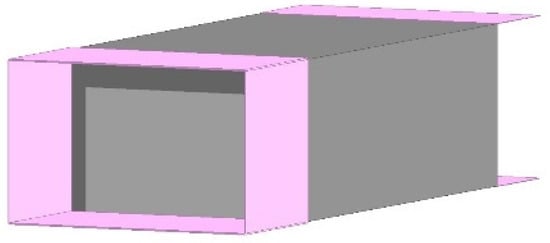
Figure 8.
Full interior view of the building modelled in DesignBuilder software.
The computer model of the original house has taken into account its geometry, orientation, and the size and arrangement of the glazing, as well as the constructive composition of each architectural element that makes up the envelope (Figure 9 and Table 2).
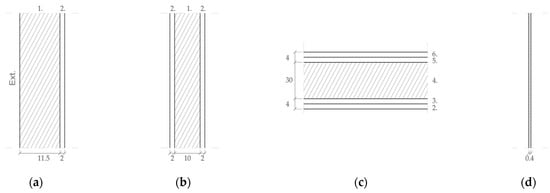
Figure 9.
Current constructive composition of the dwellings: (a) façade constructive section; (b) inner division section; (c) slab section; (d) glazing section. Materials: 1. 1/2 ceramic brick; 2. low-hardness gypsum d < 600; 3. mass concrete 2000 < d < 2300; 4. unidirectional slab with ceramic beams; 5. cement mortar; 6. ceramic tile; 7. monolithic glass, Ug = 5.70 W/m2 K, g = 0.85; 10. ggl;sh;wi = 0.68; 11. Uf = 2.2 W/m2 K (dimensions in cm).

Table 2.
Summary of the construction composition of the thermal envelope in the original house.
The calculations considered parameters such as occupation, performance of air-conditioning equipment, usage schedules and calendars, set-point temperatures, ventilation air renewals required by regulations and internal lighting loads. To compare the three dwellings analysed by evaluating the thermal effect of the terraces, these parameters were unified in all three dwellings (Table 3).

Table 3.
Parameters considered in the computer simulation calculations.
3. Results
3.1. Climate Studies of the Building
The results of the radiation study show higher accumulated annual radiation on the façades of buildings with a south–north orientation in the tourist area of San Juan Beach, obtaining average values between 1215.47 KW/m2 and 1562.75 KW/m2 per year. The building studied is one of them, with its dwellings facing south–north. The results obtained confirm the high level of solar radiation in Alicante during all of the year, even in winter (Figure 10).
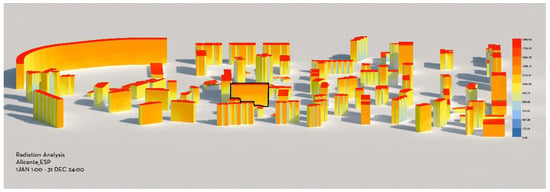
Figure 10.
Annual radiation study of the tourist area of San Juan Beach. Study building highlighted in black.
The results of the computational fluid dynamics (CFD) calculations of the wind behaviour in the building, considering the prevailing winds of the area and the shape and layout of the building, show a higher wind pressure against the north façade than against the south façade. The wind impacts against the facades with an average velocity between 1.43 m/s and 4.28 m/s (Figure 11).
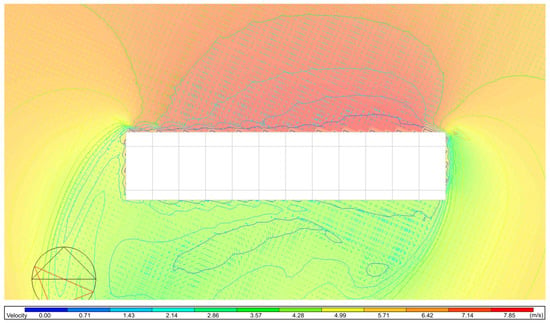
Figure 11.
Plan of exterior CFD study in the building (velocity and pressure).
3.2. Indoor Temperatures
Comparison of the real results with the computer simulation allows validation of the calculations made with the simulation tool because the deviation is low. The simulations show more thermal oscillation because they indicate all the daily temperatures by hour. However, the evolution of daily and monthly temperatures is similar to the on-site measurements in the four case studies. The difference between the real temperatures and simulations in the same time zone is less than 5% (Figure 12).
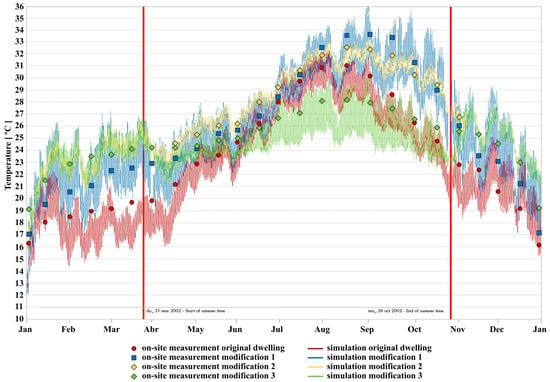
Figure 12.
Indoor temperatures considering the four case studies: on-site measurements and simulation results.
The results obtained for the original building show that indoor temperatures in the house, without using air-conditioning systems, are below 21 °C for about 42% of the year (equivalent to 3630 h). Temperatures are below 19 °C for about 26% of the year (equivalent to 2277 h). However, temperatures are above 25 °C for about 36% of the year (equivalent to 3154 h) and above 27 °C for about 28% of the year (equivalent to 2453 h). The temperatures do not exceed 32 °C and are not below 12.5 °C throughout the year. Consequently, indoor temperatures are between 21 °C and 25 °C for about 22% of the annual hours (equivalent to 1927 h), and between 19 °C and 27 °C for about 46% of the annual hours (equivalent to 4030 h).
The results obtained for the house with the glazed terrace connected to the living room (Modification 1) show temperatures below 21 °C for about 23% of the year (equivalent to 2015 h). Temperatures are below 19 °C for about 8% of the year (equivalent to 700 h). However, temperatures are above 25 °C for about 63% of the year (equivalent to 5519 h) and above 27 °C for about 42% of the year (equivalent to 3679 h). Temperatures reach 35 °C in summer and do not drop below 17 °C in winter except for some days in January. Consequently, for about 14% of the annual hours (equivalent to 1226 h), indoor temperatures are maintained between 21 °C and 25 °C, and for about 50% of the annual hours (equivalent to 4380 h), indoor temperatures are maintained between 19 °C and 27 °C.
The house with the glazed terrace separated from the living room (Modification 2) shows temperatures below 21 °C for about 6% of the year (equivalent to 525 h). Temperatures are below 19 °C for only 3% of the year (equivalent to 263 h). However, temperatures are above 25 °C for 71% of the year (equivalent to 6220 h) and above 27 °C for about 44% of the year (equivalent to 3854 h). Temperatures reach 35 °C in summer and do not drop below 17 °C throughout the winter. Consequently, for about 23% of the annual hours (equivalent to 2015 h), indoor temperatures are maintained between 21 °C and 25 °C, and for about 53% of annual hours (equivalent to 4643 h), indoor temperatures are maintained between 19 °C and 27 °C.
Finally, the house with the glazed terrace separated from the living room and natural ventilation (Modification 3) has the same temperatures in winter as the previous case, and in summer temperatures are above 25 °C only for about 40% of the year (equivalent to 3500 h), and above 27 °C for less than 14% of the year (equivalent to 1226 h). Consequently, for about 54% of the annual hours (equivalent to 4730 h), indoor temperatures are maintained between 21 °C and 25 °C. Indoor temperatures are maintained between 19 °C and 27 °C for more than 83% of the annual hours (equivalent to 7270 h).
3.3. Thermal Comfort
Comparison of the surveys with the results of the computer simulation shows that, in summer, the analytical values are lower than the actual opinions of the users. This reflects that the surveys were conducted at the hottest time of the day and the analytical method reflects the average daily thermal comfort. The Fanger method does not reflect the discomfort caused by excessive summer heat in the BShs climate in the central hours of the day. However, the analytical results give a more detailed comparison of the daily estimation of user comfort throughout the year in the four case studies (Figure 13a,b).
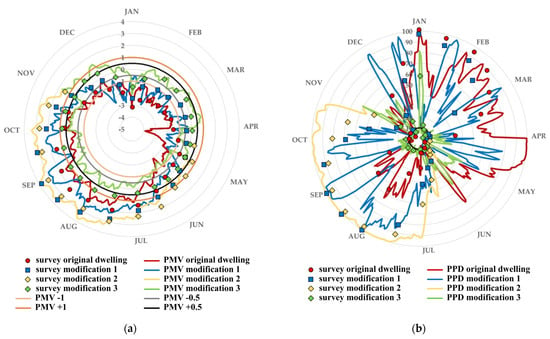
Figure 13.
Thermal comfort analysis considering the four case studies: (a) results of user surveys on indoor thermal sensation and predicted mean vote (PMV) calculated using the Fanger analytical method; (b) results of the percentage of dissatisfied according to the surveys and predicted percentage of dissatisfied (PPD) calculated using the Fanger analytical method.
In winter, analytical calculations of the wind chill estimation in the original house according to the Fanger method show PMV values below −1 from December to May, and even values below −2 on a few days from January to April. However, values above +1 are generalised during the summer, from July to September (Figure 13a). In line with these data, the results of the PPD calculations in winter show values close to 90% for a few days from January to April. There are general values above 50% from January to May. In summer, many days in August and September have values above 50% (Figure 13b).
By glazing the terrace and connecting it to the living area (Modification 1), PMV values below −1 are usual from November to June, with most days having values below −2 from January to May. In summer, there are very few days in August with values above +1 (Figure 13a). As a result, PPD calculations in winter show values close to 90% in January, February and April. There are values above 70% from November to May. In summer, only some days in August have values above 30% (Figure 13b).
The house with the glazed terrace separated from the living room (Modification 2) shows PMV values below −1 for a few days in January and April but has values above +1 from June to November (Figure 13a). As a result, PPD calculations in winter show very low values with only a few days above 80% in January and April, and from July to September (Figure 13b).
Finally, the house with the glazed terrace separated from the living room and natural ventilation in summer (Modification 3) shows PMV values between +1 and −1 almost all year round (Figure 13a). In addition, PPD values are close to 10% all year round (Figure 13b).
Simulation results of the indoor air circulation calculations by means of CFD show that natural cross-ventilation improves the indoor thermal comfort of the house. The comparative analysis of the results obtained for Modification 2 and Modification 3 shows that the temperature drops by 2–4 °C thanks to natural cross-ventilation. In Modification 2, maximum indoor temperatures reach 28 °C (Figure 14a) without cross-ventilation (Figure 14b).
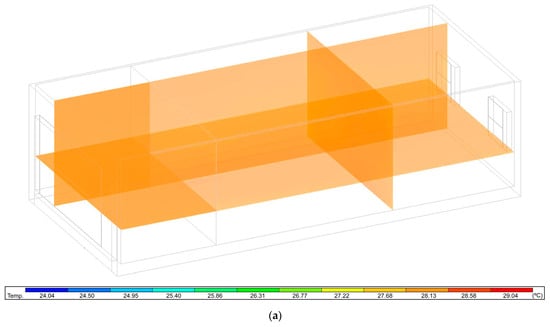
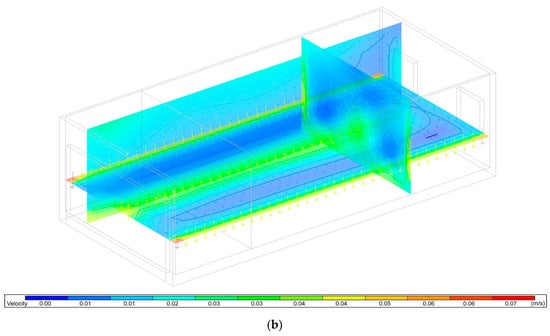
Figure 14.
Simulation results of the indoor air circulation calculations using CFD in Modification 2 without natural cross-ventilation: (a) air temperature results; (b) air velocity results.
In Modification 3, the maximum indoor temperature drops to 25 °C with natural cross-ventilation (Figure 15a). Simulation results show that cross-ventilation achieves comfortable temperatures with adequate air velocities, mostly below 0.10 m/s, in accordance with Spanish regulations (Figure 15b).
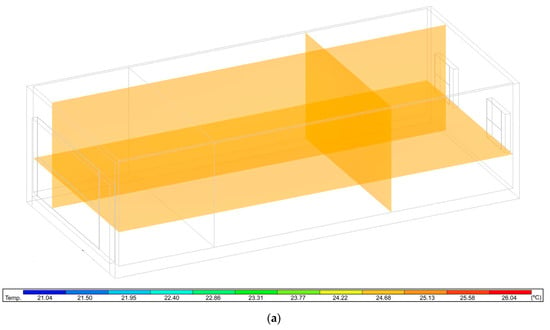
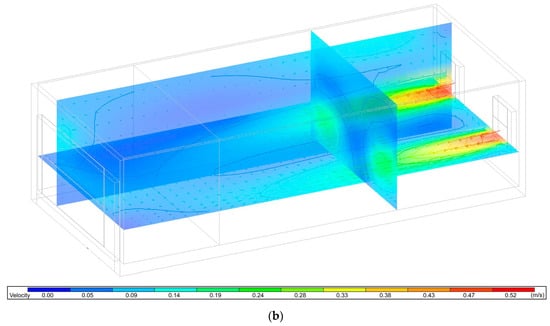
Figure 15.
Simulation results of the indoor air circulation calculations using CFD in Modification 3 with natural cross-ventilation in summer: (a) air temperature results; (b) air velocity results.
3.4. Energy Efficiency
The annual calculations performed for the original house show that the heating need in winter reaches 42.62 KWh/m2 year and the cooling need in summer reaches 30.94 KWh/m2 year (Figure 11). As a result, the overall annual need (cooling + heating) reaches 73.56 KWh/m2 year. Winter heating needs are 38% greater than summer cooling needs (Figure 16).
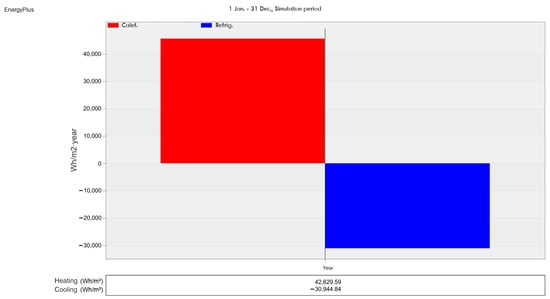
Figure 16.
Simulation results for the calculations of heating and cooling demands in the original building using the software “DB”, considering original construction features.
The results indicate that glazing the terrace by joining it to the living room (Modification 1) reduces by 62% (16.35 KWh/m2 year) the heating energy needs in winter compared to the original house, but significantly increases the cooling energy needs in summer by 110% (64.90 KWh/m2 year). Consequently, the total annual demand (cooling + heating) increases by 10% compared to the original house (81.25 KWh/m2 year) (Figure 17).
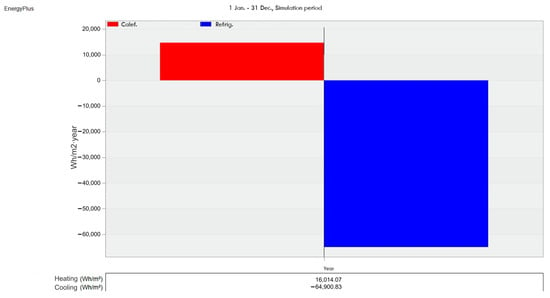
Figure 17.
Simulation results of the calculations for heating and cooling demands of Modification 1.
The results show that glazing the terrace and keeping the separation between the terrace and the living room (Modification 2) reduces the heating energy requirement in winter by 80% compared to the original house (8.47 KWh/m2 year). However, this solution increases the cooling energy requirement in summer by 62% (49.97 KWh/m2 year). As a result, the overall annual requirement (cooling + heating) decreases by 21% compared to the original house (58.44 KWh/m2 year) (Figure 18).
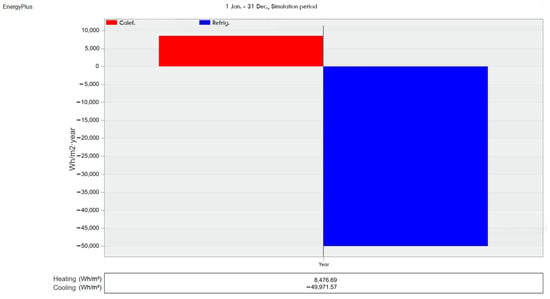
Figure 18.
Simulation results for the calculations of heating and cooling demands of Modification 2.
Using natural ventilation in the last house studied in summer (Modification 3) does not affect the heating needs in winter and greatly reduces the cooling needs in summer by 28% compared to the original house (22.31 KWh/m2 year). This represents a reduction of 58% in total heating and cooling energy needs compared to the original house (30.78 KWh/m2 year) (Figure 19). Natural cross-ventilation was considered during the months of May, June, July, August and September. In winter, between November and March, only the minimum mechanical ventilation established by Spanish regulations [] was considered. For the rest of the year, natural cross-ventilation was considered when the temperature inside the house exceeded 25 °C.
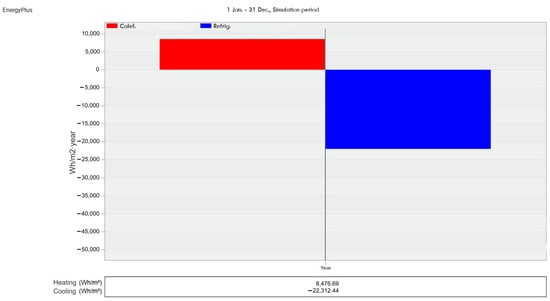
Figure 19.
Simulation results for the calculations of heating and cooling demands of Modification 3.
The results obtained for the four cases studied are summarised below (Table 4).

Table 4.
Summary of the values obtained in the DesignBuilder energy programme.
4. Discussion
4.1. Indoor Temperatures and Thermal Comfort
From the analysis of the indoor temperature calculations, it was found that the indoor temperatures of the original dwelling are comfortable for less than a half of the annual hours, i.e., 46%. In addition, the thermal oscillation between the daily maximum and minimum temperatures inside the dwelling is approximately 4 °C. The overhang of the external terrace roof protects from solar radiation in summer (Figure 20a), but also reduces solar radiation in winter and the corresponding heat gains (Figure 20b).
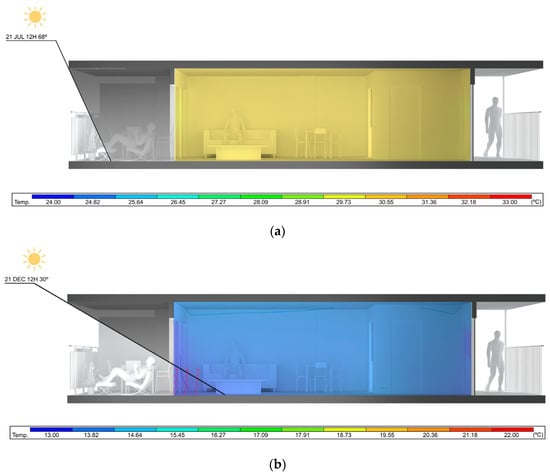
Figure 20.
Simulation results of the indoor air temperature using CFD in the original house: (a) 21 July; (b) 21 December.
By glazing the terrace connected to the living room (Modification 1), the thermal behaviour of the dwelling in winter is greatly improved, increasing the indoor temperatures in winter by about 4 °C. The new glazing does not have the solar shading of the roof overhang that the terrace had (Figure 21a,b). This allows comfortable temperatures almost all winter long, between 19 and 27 °C, reducing the hours of discomfort to 16% in winter. In summer, however, the indoor environment in the dwelling overheats, increasing temperatures by 5–6 °C, reaching 34 °C and increasing the hours of discomfort in summer by up to 84%. In addition, the daily temperature variation increases to 5 °C in winter and 6 °C in summer, due to overheating of the external glazing in the middle of the day and cooling at night.
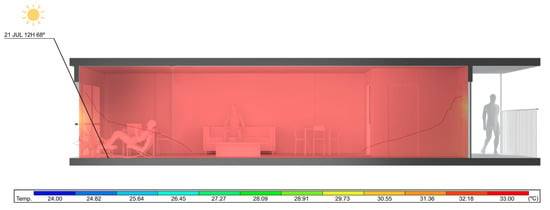
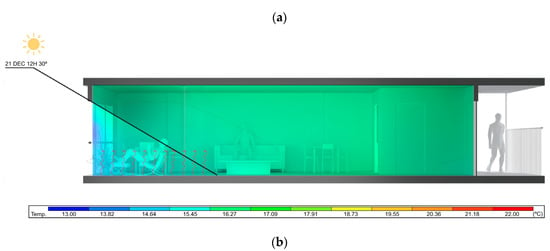
Figure 21.
Simulation results of the indoor air temperature using CFD in Modification 1: (a) 21 July; (b) 21 December.
By glazing the terrace separately from the living room (Modification 2), the average daily indoor temperatures in winter are increased by about 6 °C compared to the original dwelling. This solution makes it possible to maintain comfortable indoor temperatures almost all winter long, between 19 °C and 27 °C, reducing the hours of discomfort to 8% in winter. Furthermore, this solution reduces the daily temperature variation in winter to less than 1 °C. This is due to the fact that the terrace space, being located between two glazing units, acts as a “thermal buffer” that dampens the temperature difference between the house and the outside (Figure 22a,b). On the negative side, the temperature in summer also increases by 3–4 °C compared to the original house, reaching 31 °C and with 88% of the hours of discomfort in summer.
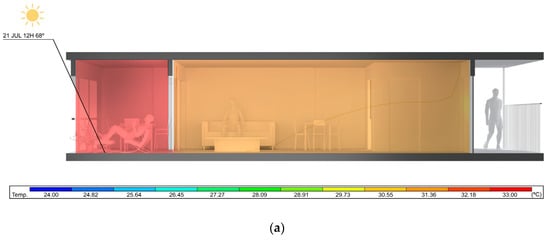
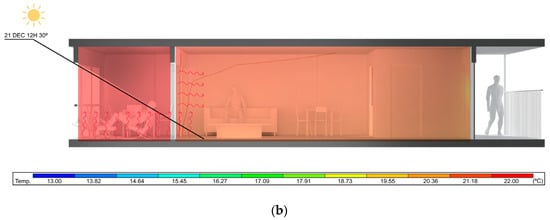
Figure 22.
Simulation results of the indoor air temperature using CFD in Modification 2: (a) 21 July; (b) 21 December.
The solution that offers the best thermal performance inside the house involves glazing the terrace separately from the living room with natural ventilation in summer (Modification 3). This solution manages to maintain comfortable indoor temperatures throughout the winter and dissipates the excess of heat in summer (Figure 23a,b). In winter, the free-standing and insulated terrace space creates a “thermal buffer” between the house and the outside. In summer, the glazing is opened to generate natural cross-ventilation, dissipating the heat inside the house. With this solution, average daily temperatures are between 19 and 27 °C throughout the year. The only negative aspect is that in summer the daily temperature fluctuation is high due to the dependence of the outside air temperature on natural ventilation. This involves peak temperatures of over 29 °C in the hot season and 28% of the discomfort hours in the summer. Despite this, this solution reduces the annual thermal oscillation, flattening the temperature graph in winter and summer. As a result, a more thermally stable house is achieved throughout the year, reducing the annual hours of discomfort to 17%.
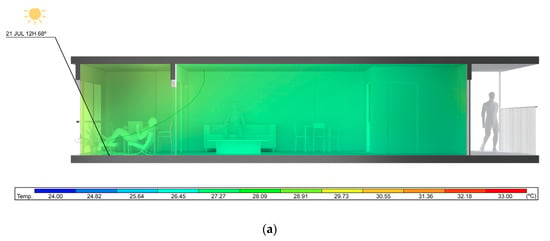
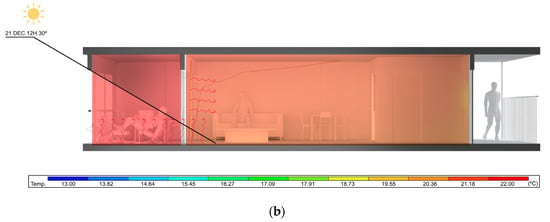
Figure 23.
Simulation results of the indoor air temperature by means of CFD in Modification 3: (a) 21 July; (b) 21 December.
The study has some limitations. The estimation of thermal comfort has mainly considered the indoor air temperature. However, other aspects such as the metabolic rate, age, habits and behaviours of the users have not been considered. Nor have gender, psychology or mood been considered, whose influence on thermal comfort has been demonstrated by other research [,]. It is important to note that in recent decades the use of air-conditioning systems has become widespread in Spain, especially in summer. Therefore, users have become accustomed to keeping their windows closed all day long and not using natural ventilation. These habits have influenced the psychology of the occupants by lowering their thermal tolerance threshold and applying very low set-point temperatures in summer. As a result, glazing is kept closed, houses are not ventilated, the greenhouse effect inside the house is increased and cooling costs increase in summer. This study demonstrates the convenience of recovering habits that are less dependent on air conditioning with solutions such as Modification 3, by glazing the terrace separately from the living room with natural ventilation in summer.
4.2. Energy Efficiency
The study of the results shows that the original dwelling has a heating demand that is 38% higher than the cooling demand. These data corroborate that the original design of this type of tourist building from the 1960s and 1970s was for seasonal use of the dwelling in summer. Nowadays, with the widespread use of these dwellings throughout the year, energy consumption needs are increasing significantly, especially for heating in winter (Figure 24).
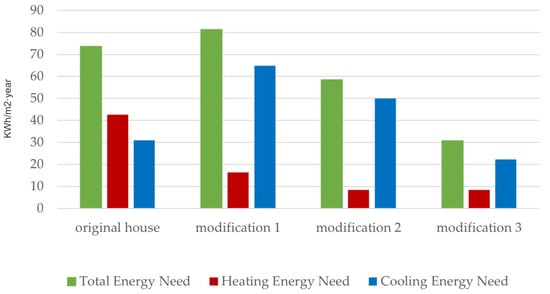
Figure 24.
Simulation results of the calculations of heating and cooling demands, using DesignBuilder software, for case 1 and case 2.
The comparative study of the results between the original house and Modification 1 shows that the heating demand decreases by up to 62% when the terrace is glazed and joined to the rest of the house, but the cooling demand increases by up to 110% in summer. This is explained by the fact that the new external glazing of the terrace does not have the solar shading of the roof overhang. This situation greatly increases the solar gains and the greenhouse effect in the indoor environment. As a result, summer discomfort hours are greatly increased, and the total annual energy demand increases by 10%.
The comparative study of the results between the original house and Modification 2 shows that glazing the terrace while maintaining the original enclosures separating the terrace from the rest of the house further reduces the heating demand compared to the original house by up to 80%. Summer cooling demand increases less than in the previous case, i.e., by 62%. This is explained by the fact that, as in the previous case, the heating demand decreases with increasing solar gains because the terrace glazing does not have the solar protection of the floor slab. In addition, two types of glazing are generated, i.e., the original façade glazing and the new external glazing of the terrace, increasing insulation and reducing thermal transmittance. The two glazing units turn the terrace into an independent intermediate space that acts as a “thermal buffer” between the inside of the house and the outside. This space captures and accumulates the heat from solar radiation and transmits it slowly into the interior of the dwelling. It also transfers heat more slowly from the inside of the dwelling to the outside. As a result, the energy performance of the dwelling improves compared to the original house, reducing the total annual demand by 21%.
Finally, applying natural ventilation in the last house studied in summer (Modification 3) achieves the best results. This solution does not affect the heating needs in winter. However, it does greatly reduce summer cooling needs by 28%. These results lead to a reduction in the overall annual heating and cooling energy needs by 58% compared to the original house. This is because, in hot weather, the terrace can be opened up to create natural ventilation to dissipate the heat accumulated inside the house. In addition, opening the external glazing does not generate a greenhouse effect, and the overhang of the floor slab protects the interior of the house from direct solar radiation, reducing solar gains.
5. Conclusions
The research carried out demonstrates the strong influence of solar radiation on the thermal performance of residential buildings in a warm semi-arid Mediterranean climate (BShs). Therefore, the specific characteristics of this climate, with many hours of sunshine per year, must be taken into account in the design and renovation of dwellings to allow more effective and economical passive solutions.
The glazing of terraces in such buildings influences energy efficiency and indoor comfort. The installation of glazed enclosures on terraces allows the generation of a greenhouse effect to heat the house in winter for free, and the dissipation of excess heat in summer with natural ventilation.
The typical solution of glazing terraces being connected to the living room improves the energy efficiency of the original house in winter, but greatly worsens its thermal behaviour in summer. The results show that this solution allows heating requirements in winter to be reduced by up to 62%, but cooling requirements in hot weather also increase by up to 110%. As a result, the total annual energy requirement is increased by 10% compared to the original house.
The optimal solution to improve the hygrothermal performance and energy efficiency of the existing dwelling is to glaze the terrace while maintaining the original façade enclosures and windows between the terrace and the living room. With this solution, an intermediate space is created in winter that captures the heat from solar radiation and acts as a “thermal buffer” between the house and the outside. In hot weather, the terrace can be opened up to provide natural ventilation to dissipate heat and protect the interior living space from direct solar radiation by reducing solar gains. Research shows that this solution allows heating requirements in winter to be reduced by up to 80% and cooling requirements in hot weather to be reduced by up to 28%. As a result, the annual energy requirement is reduced by up to 58% compared to the original house, reducing the operational needs of air-conditioning systems and their energy consumption.
This work demonstrates that glazed terraces benefit the thermal performance of dwellings if they remain insulated and separated from the rest of the house in winter and are adequately ventilated in summer. This solution improves indoor thermal comfort and energy efficiency. The results of this work open up the possibility of using terrace glazing as a method of energy rehabilitation of buildings. They also show that balcony glazing with a higher proportion of glass and a higher opening capacity offers greater energy benefits. Based on the results of this work, new research is currently being carried out into the influence on energy efficiency and thermal comfort of using retractable glazing without frames known as “glass curtain” systems. This type of glazing offers the maximum proportion of glass and the maximum opening. This new work studies the optimal size of the glazed terrace, glazing characteristics, natural ventilation systems and solar protection systems to achieve the best energy performance of the dwelling. The results of this research will be the topic of a future publication.
This study demonstrates the effectiveness of passive systems as an alternative to the widespread use of active air-conditioning systems for the hygrothermal control of residential buildings in the BShs climate. As long as regulations and energy certification programmes prevent the use of natural ventilation, users will have to invest in air-conditioning systems that are dispensable, as has been demonstrated. It would also improve sustainability and energy efficiency in cities if urban planning regulations were to consider the benefits of solar radiation in determining building orientations.
The results and conclusions of this work can be extrapolated to many residential and tourist buildings with similar characteristics to the cases studied, adapting the energy rehabilitation methodologies to the characteristics of this specific climate. Furthermore, this case study is representative of quite well-spread housing design within the Mediterranean basin, and therefore carries relevance beyond the specific area of study.
Author Contributions
Conceptualisation, S.S.-C., C.P.-C. and Á.B.G.-A.; methodology, S.S.-C. and C.P.-C.; software, S.S.-C. and C.P.-C.; validation, C.P.-C., Á.B.G.-A. and A.G.-G.; formal analysis, S.S.-C.; investigation, S.S.-C., C.P.-C., Á.B.G.-A. and A.G.-G.; resources, S.S.-C. ; data curation, S.S.-C. and C.P.-C.; writing—original draft preparation, S.S.-C., C.P.-C. and Á.B.G.-A.; writing—review and editing, S.S.-C., C.P.-C. and Á.B.G.-A.; visualisation, S.S.-C. and C.P.-C.; supervision, C.P.-C., Á.B.G.-A. and A.G.-G.; project administration, C.P.-C. and Á.B.G.-A.; funding acquisition, C.P.-C. All authors have read and agreed to the published version of the manuscript.
Funding
This research received an external grant from C3Systems S.L. Telephone 966286186. www.c3systems.es (accessed on 25 May 2023). There is no specific funding number.
Data Availability Statement
The data presented in this study are available on request from the corresponding author.
Conflicts of Interest
The authors declare no conflict of interest.
References
- Martínez Medina, A. Arquitectura del boom turístico (1953–1979). Canelobre 2016, 66, 167–185. [Google Scholar]
- Adams, B.; Bissio, R.; Yoke Ling, C.; Donald, K.; Martens, J.; Prato, S.; Vermuyten, S. Spotlight. Enfoques sobre Desarrollo Sostenible 2017; Social Watch: Montevideo, Uruguay, 2017; pp. 110–122. [Google Scholar]
- Grao-Gil, O. El Desafío a las Alturas Desde la Singularidad. El Apartotel Riscal de Alicante de Francisco Muñoz. pp. 1–12. Available online: https://congresopionerosarquitectos.com/api/assets/es/VI_PDF_comunicaciones_aceptadas/VI_Congreso_Pioneros_Arquitectura_moderna_-_16.pdf (accessed on 20 March 2022).
- Navas, J. VIA 02p-120. Francisco Muñoz Llorens; ViA-Arquitectura: Barcelonca, Spain, 2022; Available online: https://www.via-arquitectura.net/02_prem/02p-120.htm (accessed on 9 June 2022).
- Jaén Urban, G.; Martínez Medina, A.; Oliva Meyer, J.; Oliver Ramírez, J.L.; Sempere Pascual, P.; Calduch Cervera, J. Guía de Arquitectura de la Provincia de Alicante; Instituto Alicantino de Cultura “Juan Gil-Albert”: Alicante, Spain, 1999. [Google Scholar]
- Martínez-Medina, A. Mestres. Arquitectura Moderna en la Comunidad Valenciana; Universidad de Alicante: Alicante, Spain, 2019; Available online: http://hdl.handle.net/10045/122744 (accessed on 20 March 2022).
- Martínez Medina, A.; Calduch Cervera, J.; Agustí Lara, L.; Oliva Meyer, J. Arquitectura del Sol en la Comunidad Valenciana; Colegio Oficial de Arquitectos de la Comunitat Valenciana, Ed.; Universidad de Alicante y Colegio Oficial de Arquitectos de la Comunidad Valenciana: Alicante, Spain, 2001; Available online: http://hdl.handle.net/10045/102529 (accessed on 20 March 2022).
- Huete, R. Tendencias del turismo residencial: El caso del Mediterráneo Español. El Periplo SustenTable 2008, 14, 65–87. Available online: http://www.uaemex.mx/plin/psus/periplo14/articulo_04.pdf (accessed on 20 March 2022). [CrossRef]
- Suárez, M. Los Espacios Intermedios como Tema y Estrategia de Proyecto en la Arquitectura Moderna. 2013. Available online: http://saber.ucv.ve/bitstream/123456789/7780/1/T026800009758-0-PDF_Marjorie_S_Surez_Pesquera_ltima_versin-000%281%29.pdf (accessed on 20 March 2022).
- Kapstein, G. Espacios Intermedios: Respuesta Arquitectónica al Medio Ambiente, 2nd ed.; Ediciones ARQ: Santiago de Chile, Chile, 2015. [Google Scholar]
- Moltó, E. Francisco Muñoz, Maestro de Arquitectos en Alicante|Agenda|EL PAÍS. El País. 2005. Available online: https://elpais.com/diario/2005/04/28/agenda/1114639206_850215.html (accessed on 20 March 2022).
- Aelenei, D.; De Azevedo Leal, H.; Aelenei, L. The use of attached-sunspaces in retrofitting design: The case of residential buildings in Portugal. Energy Procedia 2014, 48, 1436–1441. [Google Scholar] [CrossRef]
- Grudzińska, M. Evaluation of the performance of enclosed balconies based on temperature monitoring. J. Phys. Conf. Ser. 2021, 2069, 012133. [Google Scholar] [CrossRef]
- Simões, N.; Manaia, M.; Simões, I. Energy performance of solar and Trombe walls in Mediterranean climates. Energy 2021, 234, 121197. [Google Scholar] [CrossRef]
- Sancho Ávila, J.M.; Jesús Riesco, M.; Sánchez de Cos Escuin, M.C.; Montero Caldaso, J.; Alonso Jiménez, C.; López, B.M. Atlas de Radiación Solar en España Utilizando Datos del SAF de Clima de EUMETSAT. España; Ministerio de Agricultura Alimentación y Medio Ambiente: Madrid, Spain, 2012; 162p, Available online: https://repositorio.aemet.es/bitstream/20.500.11765/2531/1/atlasradiacion_cal2013.pdf (accessed on 20 March 2022).
- Chazarra Bernabé, A.; Flórez García, E.; Peraza Sánchez, B.; Tohá Rebull, T.; Lorenzo Mariño, B.; Pinto, E.C.; Moreno García, J.V.; Romero Fresneda, R.; Botey Fullat, R. Mapas Climáticos de España (1981–2010) Y ETo (1996–2016); Ministerio Para La Transición Ecológica: Madrid, Spain, 2018; p. 75. [Google Scholar] [CrossRef]
- Hilliaho, K.; Kovalainen, V.; Huuhka, S.; Lahdensivu, J. Glazed spaces: A simplified calculation method for the evaluation of energy savings and interior temperatures. Energy Build. 2016, 125, 27–44. [Google Scholar] [CrossRef]
- Bataineh, K.M.; Fayez, N. Analysis of thermal performance of building attached sunspace. Energy Build. 2011, 43, 1863–1868. [Google Scholar] [CrossRef]
- Fernández-González, A. Analysis of the thermal performance and comfort conditions produced by five different passive solar heating strategies in the United States midwest. Sol. Energy 2007, 81, 581–593. [Google Scholar] [CrossRef]
- Frontczak, M.; Wargocki, P. Literature survey on how different factors influence human comfort in indoor environments. Build. Environ. 2011, 46, 922–937. [Google Scholar] [CrossRef]
- Aghamolaei, R.; Ghaani, M.R. Balancing the impacts of energy efficiency strategies on comfort quality of interior places: Application of optimization algorithms in domestic housing. J. Build. Eng. 2020, 29, 101174. [Google Scholar] [CrossRef]
- Cañadas, J.J.M.; Fernández, Á.B.L.; Juan, J.J.P.P.; Hernández, J.C.L. Invernaderos con cubierta de plástico y cristal en el sureste español. Cuad. Investig. 2008, 1, 1–54. Available online: https://www.publicacionescajamar.es/publicacionescajamar/public/pdf/series-tematicas/centros-experimentales-las-palmerillas/invernaderos-con-cubierta-de-plastico.pdf (accessed on 20 March 2022).
- Gao, C.F.; Lee, W.L. Evaluating the influence of window types on the natural ventilation performance of residential buildings in Hong Kong. Int. J. Vent. 2011, 10, 227–238. [Google Scholar] [CrossRef]
- Alhamad, I.M.; Alsaleem, M.; Taleb, H. Passive Heating and Cooling Potential Strategies: A Comparison between Moderate Summers and Warm Winters Climate Zones. J. Phys. Conf. Ser. 2019, 1276, 012059. [Google Scholar] [CrossRef]
- Lucon, O.; Ürge-Vorsatz, D.; Ahmed, A.Z.; Akbari, H.; Bertoldi, P.; Cabeza, L.F.; Eyre, N.; Gadgil, A.; Harvey, L.D.; Jiang, Y.; et al. Climate Change 2014: Mitigation of Climate Change. In IPCC Working Group III Contribution to AR5: Chapter 9—Buildings; Cambridge University Press: Cambridge, UK, 2015. [Google Scholar]
- Pérez-Carramiñana, C.; González-Avilés, Á.B.; Galiano-Garrigós, A.; Lozoya-Peral, A. Optimization of Architectural Thermal Envelope Parameters in Modern Single-Family House Typologies in Southeastern Spain to Improve Energy Efficiency in a Dry Mediterranean Climate. Sustainability 2022, 14, 3910. [Google Scholar] [CrossRef]
- González-Avilés, Á.B.; Pérez-Carramiñana, C.; Galiano-Garrigós, A.; Ibarra-Coves, F.; Lozano-Romero, C. Analysis of the Energy Efficiency of Le Corbusier’s Dwellings: The Cité Frugès, an Opportunity to Reuse Garden Cities Designed for Healthy and Working Life. Sustainability 2022, 14, 4537. [Google Scholar] [CrossRef]
- Pérez-Carramiñana, C.; AnMaciá-Mateu, A.; Sirvent-García, G.; Lledó-Llorca, I. Study of Natural Ventilation and Solar Control Strategies to Improve Energy Efficiency and Environmental Quality in Glazed Heated Swimming Pools in a Dry Mediterranean Climate. Sustainability 2022, 14, 8243. [Google Scholar] [CrossRef]
- O’Donovan, A.; O’Sullivan, P.D.; Murphy, M.D. Predicting air temperatures in a naturally ventilated nearly zero energy building: Calibration, validation, analysis and approaches. Appl. Energy 2019, 250, 991–1010. [Google Scholar] [CrossRef]
- Esther Falcón Pérez, C. Afrontando el Reto de la Eficiencia Energética en Edificios a Través de las Cooperativas de Viviendas. Rev. Crítica Derecho Inmob. 2021, 97, 13–63. Available online: https://www.researchgate.net/publication/350385979_Afrontando_el_reto_de_la_eficiencia_energetica_en_edificios_a_traves_de_las_cooperativas_de_viviendas (accessed on 7 June 2022).
- Pellegrino, A.; Cammarano, S.; Lo Verso, V.R.M.; Corrado, V. Impact of daylighting on total energy use in offices of varying architectural features in Italy: Results from a parametric study. Build. Environ. 2017, 113, 151–162. [Google Scholar] [CrossRef]
- Ghrab-Morcos, N. CHEOPS: A simplified tool for thermal assessment of Mediterranean residential buildings in hot and cold seasons. Energy Build. 2005, 37, 651–662. [Google Scholar] [CrossRef]
- Borrallo-Jiménez, M.; Lopezdeasiain, M.; Esquivias, P.M.; Delgado-Trujillo, D. Comparative study between the Passive House Standard in warm climates and Nearly Zero Energy Buildings under Spanish Technical Building Code in a dwelling design in Seville, Spain. Sci. Energy Build. 2021, 254, 111570. [Google Scholar] [CrossRef]
- Troup, L.; Phillips, R.; Eckelman, M.J.; Fannon, D. Effect of window-to-wall ratio on measured energy consumption in US office buildings. Energy Build. 2019, 203, 109434. [Google Scholar] [CrossRef]
- Simon, F.; Ordoñez, J.; Girard, A.; Parrado, C. Modelling energy use in residential buildings: How design decisions influence final energy performance in various Chilean climates. Indoor Built Environ. 2019, 28, 533–551. [Google Scholar] [CrossRef]
- López-Ochoa Luis, M.; Las-Heras-Casas, J.; López-González, L.M.; Olasolo-Alonso, P. Towards nearly zero-energy buildings in Mediterranean countries: Energy Performance of Buildings Directive evolution and the energy rehabilitation challenge in the Spanish residential sector. Energy 2019, 176, 335–352. [Google Scholar] [CrossRef]
- López-Ochoa, L.M.; Las-Heras-Casas, J.; López-González, L.M.; García-Lozano, C.; López-Ochoa, L.M.; Las-Heras-Casas, J.; López-González, L.M.; García-Lozano, C. Environmental and energy impact of the EPBD in residential buildings in cold Mediterranean zones: The case of Spain. Energy Build. 2017, 150, 567–582. [Google Scholar] [CrossRef]
- Figueiredo, A.; Kämpf, J.; Vicente, R. Passive House Optimization for Portugal: Overheating Evaluation and Energy Performance. Energy Build. 2016, 118, 181–196. [Google Scholar] [CrossRef]
- Harkouss, F.; Fardoun, F.; Biwole, P.H. Passive design optimization of low energy buildings in different climates. Energy 2018, 165, 591–613. [Google Scholar] [CrossRef]
- Causone, F.; Pietrobon, M.; Pagliano, L.; Erba, S. A high performance home in the Mediterranean climate: From the design principle to actual measurements. Energy Procedia 2017, 140, 67–79. [Google Scholar] [CrossRef]
- Orden. Orden FOM/588/2017, de 15 de Junio, Por La Que Se Modifican El Documento Básico DB-HE 975 “Ahorro de Energía” y El Documento Básico DB-HS “Salubridad”, Del Código Técnico de La Edificación, Aprobado Por Real Decreto 976 314/2006, de 17 de Marzo, 2017; Agencia Estatal Boletín Oficial del Estado: Madrid, Spain, 2017. [Google Scholar]
- Muñoz Criado, A.; Doménech Gregori, V. Energía. Estrategia Territorial Comunitat Valenciana; Generalitat Valenciana, Conselleria de Medi Ambient, Aigua, Urbanisme i Habitatge: València, Spain, 2011; 70p. [Google Scholar]
- Martínez Noguera, J. Hacia una Construcción Sostenible: Análisis de Soluciones Constructivas para Mejora de la Eficiencia Energética y la Reducción de la Huella de Carbono; Universidad Politécnica de Cartagena: Cartagena, Spain, 2021; Available online: https://repositorio.upct.es/handle/10317/9650 (accessed on 20 March 2022).
- Albatayneh, A.; Alterman, D.; Page, A.; Moghtaderi, B. The Significance of Building Design for the Climate. Environ. Clim. Technol. 2018, 22, 165–178. [Google Scholar] [CrossRef]
- Albatayneh, A. Optimisation of building envelope parameters in a semi-arid and warm Mediterranean climate zone. Energy Rep. 2021, 7, 2081–2093. [Google Scholar] [CrossRef]
- Galiano-Garrigós, C.L.; Marcos, T.K.; Juan Gutiérrez, P.J. Reassessing thermal comfort in modern architecture: E.1027 as a case study. Build. Res. Inf. 2022, 50, 230–254. [Google Scholar] [CrossRef]
- Morán Blanco, S.; Miguel, C.; Barrado, D. El objetivo de desarrollo sostenible 11 de la Agenda 2030: Ciudades y comunidades sostenibles. Metas 2020, desafíos, políticas y logros. Cuad. Estrateg. 2020, 206, 21–68, ISSN 1697-6924. Available online: https://dialnet.unirioja.es/servlet/articulo?codigo=7649178&info=resumen&idioma=ENG%0Ahttps://dialnet.unirioja.es/servlet/articulo?codigo=7649178&info=resumen&idioma=SPA%0Ahttps://dialnet.unirioja.es/servlet/articulo?codigo=7649178 (accessed on 20 March 2022).
- Taheri, B.; Jabari, F.; Akbari Foroud, A. A green cogeneration microgrid composed of water-source heat pumps, a gravity energy storage, and a bio-fueled gas turbine: Design and techno-economic optimization. Sustain. Cities Soc. 2023, 95, 104594. [Google Scholar] [CrossRef]
- Taheri, B.; Akbari Foroud, A.; Jabari, F. Design and performance optimization of a tri-generation energy hub considering demand response programs. Energy Sci. Eng. 2022, 11, 675–684. [Google Scholar] [CrossRef]
- Niampira Daza, A.; Puche Berroca, J.D.; Ceferino Urrea, G. Estrategias de diseño arquitectónico de bajo impacto ambiental como aporte a la eficiencia energética en el clima cálido húmedo. ACAIRE 2021, 1, 8. [Google Scholar]
- Martinez, R. ¿Qué es una Ciudad Sostenible?, por Rosa Martínez: Ethic. Ethic. 2018. Available online: https://ethic.es/2018/10/que-es-una-ciudad-sostenible/ (accessed on 20 March 2022).
- Prieto, A.; Knaack, U.; Auer, T.; Klein, T. Passive cooling & climate responsive façade design exploring the limits of passive cooling strategies to improve the performance of commercial buildings in warm climates. Energy Build. 2018, 175, 30–47. [Google Scholar] [CrossRef]
- AICIA. Líder-Calener Unified Tool Software, v2.0.2253.1167; Dirección General de Arquitectura, Vivienda y Suelo del Ministerio de Transportes, Movilidad y Agenda Urbana y por el Instituto para la Diversificación y Ahorro de la Energía (IDEA): Madrid, Spain, 2021; Herramienta Unificada LIDER-CALENER (V 2.0.2253.1167); Available online: https://www.codigotecnico.org/Programas/HerramientaUnificadaLIDERCALENER.html (accessed on 20 March 2022).
- ASHRAE Standard-55; Thermal Environment Conditions for Human Occupancy. American Society of Heating, Refrigerating and Air-Conditioning Engineers: Peachtree Corners, GA, USA, 2020.
- Chazarra, A.; Flórez, E.; Peraza, B.; Tohá, T.; Lorenzo, B.; Criado, E.; Moreno, J.V.; Romero, R.; Botey, R. Mapas Climáticos de España (1981–2010) y ETo (1996–2016); Ministerio para la Transición Ecológica, Agencia Estatal de Meteorología: Madrid, Spain, 2018. [Google Scholar]
- Ministerio de Fomento. Documento Descriptivo Climas de Referencia; Ministerio de Fomento: Madrid, Spain, 2017. [Google Scholar]
- García Kerdan, I.; Morillón Gálvez, D.; Sousa, G.; Suárez de la Fuente, S.; Silva, R.; Hawkes, A. Thermodynamic and thermal comfort optimisation of a coastal social house considering the influence of the thermal breeze. Build. Environ. 2019, 155, 224–246. [Google Scholar] [CrossRef]
- Oliva Meyer, J. Juan Antonio García Solera 1953–2003; Colegio Oficial De Arquitectos De La Comunidad Valenciana: Valencia, Spain, 2005. [Google Scholar]
- Kurtz, F.; Monzón, M.; López-Mesa, B. Obsolescencia de la envolvente térmica y acústica de la vivienda social de la postguerra española en áreas urbanas vulnerables. El caso de Zaragoza. Inf. Construcción 2015, 67, m021. [Google Scholar] [CrossRef]
- DesignBuilder v.7.0.1.006; DesignBuilder Software Ltd.: Stroud, UK, 2021.
- Villar Burke, R.; Sorribes Gil, M.; Jiménez González, D.; Sobaler Rodríguez, J. Guía de Aplicación DB-HE 2019; Ministerio de Transportes, Movilidad y Agenda Urbana. Gobierno de España: Madrid, Spain, 2019. [Google Scholar]
- Agencia Estatal Boletín Oficial del Estado. Real Decreto 486/1997, de 14 de Abril, por el que se Establecen las Disposiciones Mínimas de Seguridad y Salud en los Lugares de Trabajo; Agencia Estatal Boletín Oficial del Estado: Madrid, Spain, 1997. [Google Scholar]
- Ege Çeter, A.; Furkan Ozbey, M.; Turhan, C. Gender inequity in thermal sensation based on emotional intensity for participants in a warm mediterranean climate zone. Int. J. Therm. Sci. 2023, 185, 108089. [Google Scholar] [CrossRef]
- Furkan Ozbey, M.; Ege Çeter, A.; Orfioglu, S.; Alkan, N.; Turhan, C. Sensitivity analysis of the effect of current mood states on the thermal sensation in educational buildings. Indoor Air 2022, 32, e13073. [Google Scholar]
Disclaimer/Publisher’s Note: The statements, opinions and data contained in all publications are solely those of the individual author(s) and contributor(s) and not of MDPI and/or the editor(s). MDPI and/or the editor(s) disclaim responsibility for any injury to people or property resulting from any ideas, methods, instructions or products referred to in the content. |
© 2023 by the authors. Licensee MDPI, Basel, Switzerland. This article is an open access article distributed under the terms and conditions of the Creative Commons Attribution (CC BY) license (https://creativecommons.org/licenses/by/4.0/).