Abstract
The issue of environmental sustainability is increasingly topical, and one of the most impactful sectors is the construction industry. As stated in the GlobalABC reports, the building sector is the main sector responsible for GHG emissions, generating about 37% of global CO2e emissions. Already during the phases of production and construction of buildings, about 10% of global emissions are produced, while the remaining part comes from using energy for air conditioning and lighting. Reducing emissions in buildings’ pre-use phase is a crucial issue for fighting climate change. This research investigates the potential of timber construction systems due to the carbon storage property of the material. The proposed calculation methodology is structured according to the Life Cycle Assessment (LCA) approach, referring to the C2H phase (from Cradle-to-Handover), and evaluates emissions related to buildings production and construction. In order to identify the timber construction system that minimizes CO2e emissions, the method was applied within the limits of the investigation (A1–A5 phases) to two buildings built with different technologies: an X-Lam panel and a framed structured building. The results were analyzed, compared, and discussed to demonstrate that timber buildings will be the most virtuous solution in the Net Zero Carbon perspective by 2050.
1. Introduction
The current awareness of environmental issues’ importance, linked to the scarcity of the planet’s resources and the negative consequences of greenhouse gas emissions, has imposed the need to adopt alternative approaches to construction. Today’s building industry is more concerned with material selection and every phase of the structure’s life cycle. This new way of designing has the parameters of the so-called circular economy, an alternative model to the traditional linear type, where waste is no longer something to be disposed of in landfills but a resource to be reused and recycled. To pursue sustainable development, the European Commission’s 2030 Climate Target Plan [1] proposes to increase the EU’s ambition to reduce greenhouse gas emissions to at least 55% below 1990 levels by 2030 and achieve climate neutrality by 2050. The new proposal maintains the commitment made in the Communication on the European Green Deal and aligns with the Paris Agreement [2], which aims to keep the global temperature rise below 2 °C [3]. Global efforts are currently focused on achieving the UN’s 2030 Agenda for Sustainable Development goals [4], signed in 2015 by 193 countries, which provides an integrated vision of the three dimensions of sustainable development: economic, social, and environmental sustainability. The seventeen goals set by the Agenda, to be achieved by 2030, are interconnected and embrace the most important issues for sustainability, such as the fight against poverty, the elimination of hunger in the world, the reduction of inequalities, and the fight against climate change.
Environmental policies contributed to a decline in greenhouse gas emissions for construction operations between 2019 (9.6 Gt) and 2020 (8.7 Gt). Despite the slight reduction, however, the global account of CO2e emissions (directly and indirectly related to heating, cooling, lighting, etc.) from the construction sector, compared to the total, remains high at 37% [5]. The construction industry requires the extraction of large quantities of raw materials, with the consequent consumption of energy resources and release of pollutant emissions into the atmosphere. The pyramid in Figure 1 highlights the hierarchy of policy strategies to mitigate CO2e emissions from the construction sector; in the perspective of complete decarbonization, the best approach would be not to build at all, an unattainable goal that points us toward a construction model based on flexible design and removable and reusable structures. When not building is not feasible, we should build less, make better use of existing structures, repurpose waste materials, use low-carbon products, and create a construction design that minimizes waste through prefabrication, reuse, and recycling. It is possible to reach an efficient design and optimize structural solutions with effort.
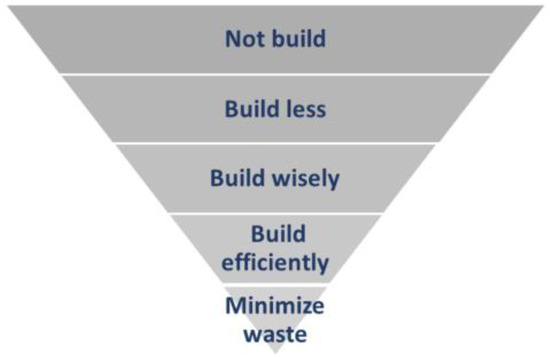
Figure 1.
Approaches to a decarbonization-oriented design (© Di Ruocco, Gaita).
The construction industry is increasingly recognizing the importance of mitigating the environmental impact associated with building materials and practices. Wood stands out as a virtuous choice among these materials due to its carbon sequestration properties. As the world strives towards a more sustainable future, investigating the inherent potential of wood-based construction systems becomes crucial. This article aims to explore the possibilities offered by wood construction systems, with a focus on their role in achieving carbon neutrality in the building sector. This study consists of three main phases: the development of a methodology based on the Life Cycle Assessment (LCA), the application of this methodology to two wooden buildings with different construction systems, and the analysis, comparison, and discussion of the obtained results. By establishing a clear and reproducible calculation methodology, this study aims to provide an accurate assessment of emissions during the Cradle-to-Handover (C2H) phase. By investigating the potential of wood construction systems and developing a robust calculation methodology, this study contributes to advancing sustainable practices in the building sector. Our findings will shed light on the environmental benefits offered by wood as a construction material and pave the way for more informed decision-making toward carbon neutrality in the industry.
2. State-of-the-Art
The LCA (life cycle assessment) method makes it possible to assess the environmental impact associated with a product or activity and to guide design choices to improve environmental quality. LCA analysis quantifies factors contributing to CO2e emissions at all stages of the life cycle, from the acquisition of raw materials to the benefits of their recovery/reuse/recycling (Figure 2).
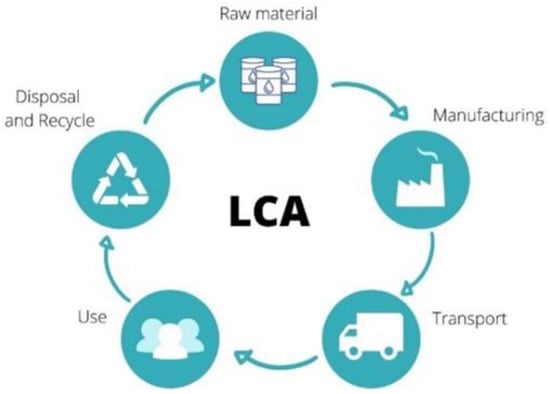
Figure 2.
Life cycle assessment phases (© Di Ruocco, Gaita).
The LCA method makes it possible to identify steps with significant greenhouse gas emissions and intensive resource consumption. Therefore, careful LCA analysis can help preserve natural resources, mitigate climate change, improve air and water quality, and promote sustainable development. Adopting green approaches in product design provides economic benefits, meets the demand of environmentally conscious consumers, and complies with environmental regulations [6,7,8]. Life Cycle Thinking is applicable to all types of products. Fargnoli et al. [9] stressed the importance of integrating environmental aspects into product design, demonstrating the positive impact of reconditioning operations using life cycle simulation and product-service systems (PSS). The study on household dishwashers highlighted the benefits of the PSS approach on environmental performance, customer satisfaction, and company profitability. The LCA approach is recommended by several European policies, including the Integrated Product Policy [10]. This study uses two environmental indicators to quantify the impact, over the life cycle, of each case study: Operating Energy (OE) and Embodied Energy (EE). Embodied energy is that which materials need during their life cycle. Operational energy is the amount of energy needed in the utilization phase of the building. Embodied and operational energy factors correspond to CO2e emission factors: Embodied Carbon (EC) and Operational Carbon (OC) [11,12]. Open access databases containing information on embodied carbon and energy for various raw materials are critical to helping develop sustainability analysis tools based on energy use and emissions [13]. The European standard BS EN 15978:2011 [14] develops the life-cycle analysis methodology for assessing the environmental performance of buildings, outlining five key blocks: Production, Construction, Use, End of Life, and Benefits and Loads (Figure 3) (Table 1).
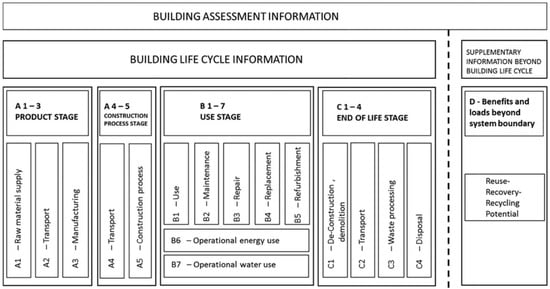
Figure 3.
Building assessment information (Source: [14]).

Table 1.
Carbon emission factors in relation to the engine of the machinery.
The F.G. Banfill et al. [15] study provides an overview of LCA studies in the building sector, identifying challenges and suggesting further research. They highlight complexities, lack of standardization, and the need for an internationally accepted framework and conversion tools. Despite limitations, the study concludes that LCA is a powerful tool for evaluating the environmental impact of buildings and supporting sustainable development. Even for wood, which has gained popularity in construction due to its sustainability and low environmental impact compared to traditional building materials, it is important to conduct a thorough Life Cycle Assessment (LCA) that considers the entire life cycle of the material, from production to disposal, to ensure that it is a truly sustainable option.
Cultivating trees and using wooden buildings as carbon sinks is a potentially significant strategy, but it raises questions about the environmental impact of timber and forest growth. Hawkins’ [16] comparison of a commercially managed Sitka spruce forest with an unmanaged forest reveals that carbon absorption in newly planted trees begins slowly but increases over time (Figure 4). Unlike unmanaged forests, which reach a peak and stabilize, managed forests continuously accumulate carbon, although with shorter harvesting cycles. Moreover, storing carbon in wood products significantly contributes to overall carbon sequestration, surpassing the levels found in unmanaged forests [17].
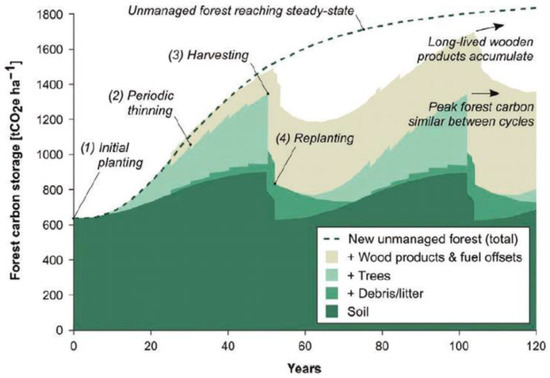
Figure 4.
Carbon stored in trees and soil for a typical Sitka spruce plantation with a periodic rotation of 50 years, compared to an unmanaged forest (Source: [16]).
In Italy, the importance of sourcing wood from responsibly managed forests is emphasized by CAM Edilizia [18,19,20] regulations, which require sustainable and legal wood sourcing for construction materials. This includes using recycled wood or a combination of recycled and responsibly sourced wood.
Hawkins [16] also conducted a study comparing the environmental impact of different materials for a multi-story structure, following the life-cycle phases outlined in the European standard BS EN 15978:2011. The report shows that the concrete structure solution is the most impacting on the environment, followed by steel and wood. Production emissions for timber products from harvesting, drying, and sawdust are significant and cannot be avoided; in fact, it is better not to build at all than to build a wooden building. In phase B (BS EN 15978:2011), it is possible to appreciate the advantage of the use of wood due to the compensatory carbon credit. Carbon storage is possible because the tree, during its growth, absorbs carbon dioxide, transforms it into carbon, and releases oxygen into the environment. Carbon remains trapped in the tree until it rots or is incinerated and then returns to the atmosphere. Building in wood, therefore, means creating a real carbon warehouse, which would otherwise have ended up in the atmosphere once the life of the tree had ended. For the concrete and steel structures, analyzing the phases of use (B) and end of life (C), we notice very small changes in the amount of Embodied Carbon, while for the wood solution, the change is remarkable. Despite the large emissions, total carbon is still lower for the wooden building than for concrete and steel ones (Figure 5).
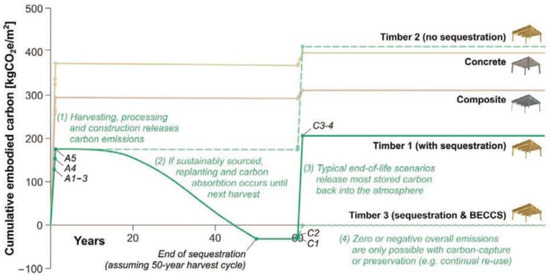
Figure 5.
Comparison of cumulative emissions of embodied carbon for different types of construction (Source: [16]).
In fact, despite being among the first materials to be used in construction, wood is among the best solutions for biocompatible buildings. In recent years, research has been interested in these innovative systems and the advantages of building dry rather than wet in terms of Embodied Energy and Embodied Carbon. Studies conducted by Di Ruocco et al. [21,22,23,24] explored different building systems, including reinforced concrete, steel, and wood, to determine their environmental impact in terms of embodied energy (EE) and embodied carbon (EC). The results indicate that the wood building system has the lowest EE and EC values.
The analysis of the state of the art revealed, almost unanimously, the advantages of wood construction, but, at the same time, it highlighted the following critical issues:
- -
- The circular C2C (from Cradle-To-Cradle) approach was only partially investigated;
- -
- No study has quantified, using the C2C approach, the potential of wood systems for carbon storage;
- -
- No standardized calculation methodology has been established to measure the amount of carbon embodied in the production and construction phases.
With reference to the critical issues found in the state-of-the-art, the purpose of this study is to develop a calculation methodology for wood building systems to evaluate the energy and carbon embodied during the production and construction phases.
3. Tools and Methods
The proposed methodology is articulated in the following phases:
- Phase I: Definition of the scope of the investigation;
- Phase II: Technological characterization of the building;
- Phase III: Estimation of CO2e emissions.
3.1. Phase I: Definition of the Scope of Investigation
In the first phase, the study boundaries were defined in accordance with the European standard BS EN 15978:2011 [14]. Specifically, the scope of this research is the analysis of phase A, consisting of five modules. Modules A1 to A3 of the building life cycle are about the environmental impact of the production phase and include raw material procurement, transportation to factories, and production. On the other hand, modules A4 and A5 are about the impact of the construction phase, which includes transport to the construction site and construction activities. The boundary of the system that has been considered is called ‘from Cradle-to-Handover’ (Figure 6).
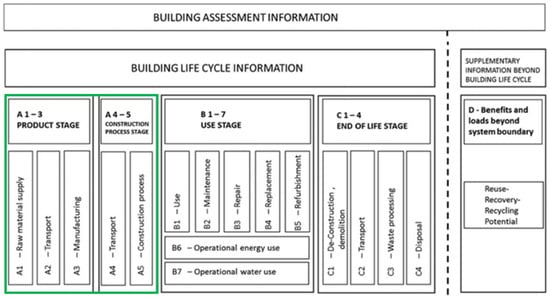
Figure 6.
Building assessment information; from Cradle-to-Handover phases (Source: [14]).
3.2. Phase II: Technological Characterization of the Building
The technological characterization of the building was based on the UNI 8290-1981 [25] standard, with a detailed breakdown into classes of technological units (1st level), technological units (2nd level), and technical elements (3rd level). The classes of technological units of supply and service facilities, safety installations, and internal and external equipment have not been counted for research purposes, as they are considered invariant. The next step was the analysis of two construction technologies in wood: the framed one and the X-LAM paneled one. The study of the construction systems, the materials of the technical elements, and the connections are fundamental to defining the processes needed for the construction. This was conducted using technical data sheets and catalogs provided by companies operating in the sector, as well as the UNI 11277:2008 [26] standard, which combines each construction system with a laying technology.
3.3. Phase III: Estimation of CO2e Emissions
In the third step, the CO2e emissions generated during the phases of production and construction of a building, obtained as the sum of three rates, were calculated:
- Rate of CO2e, A1—–A3 emissions due to the production activity;
- Rate of CO2e, A4 emissions due to the transport from production site to construction site;
- Rate of CO2e, A5 emissions due to construction activities.
CO2e, A1—–A5 = CO2e, A1—–A3 + CO2e, A4 + CO2e, A5
CO2e, A1—–A3: CO2e emissions with reference to production activity.
CO2e, A4: CO2e emissions with reference to transportation from the production site to the construction site.
CO2e, A5: CO2e emissions with reference to construction activities.
The methodology combines modules A1 to A3 because the emission estimation refers to coefficients (derived from the ICE database) that consider together the extraction of raw materials, transport to factories, and production.
3.3.1. Rate of CO2e, A1—–A3 Emissions due to Production Activity
The target of the production phase analysis (A1–A3) is to highlight the variation in CO2e emissions according to the choices that the designer can make. These choices may concern the use of virgin materials or secondary raw materials, technological solutions, or even the evaluation of the chemical characteristics of the elements.
The total embodied carbon related to the production phase has been calculated, through the LCI (Life Cycle Inventory) approach, multiplying the weight of each material by the relative “Coefficient of Embodied Carbon Primary” contained in the “Inventory of carbon and energy” (ICE database V.3.0) [27] drawn up by the University of Bath. For wood elements, this inventory gives two EC values, a negative one and a positive one. Between the two values, the negative one was chosen to consider the carbon storage property of the material. In fact, if the carbon stored in wood exceeds the carbon emissions associated with its production and processing, the net result will be a negative embodied carbon value. However, it is important to consider all aspects of the wood’s life cycle and the sources of emissions associated with its production, transportation, and disposal to obtain an accurate assessment of its environmental impact. The conditions under which a negative value can be chosen include:
- Use of wood from sustainably managed forests;
- Use of locally sourced wood to reduce transportation emissions;
- Adoption of recycling and reuse practices.
It should be noted that the ICE database considers the production processes required to realize the individual elements listed, providing reliable and precise indices.
where
CO2e, A1—–A3 (i) [kgCO2e] = W(i) [kg] × ECICE(i) [kgCO2e/kg]
CO2e, A1—–A3 (i): CO2e emissions generated by the production activity, with reference to the single material.
W(i): Material weight.
ECICE(i): Embodied Carbon Factor, from ICE (Inventory Carbon and Energy) [27].
The total emissions for modules A1–A3 are obtained by adding the emissions for each material:
where
CO2e, A1—–A3 = Σ CO2e, A1—–A3 (i)
CO2e, A1–A3: Total CO2e emissions, with reference to the production stage (A1–A3).
Σ CO2e, A1–A3 (i): Summation of emission contributions made in the production phase (A1–A3) by all materials in the construction.
3.3.2. Rate of CO2e, A4 Emissions due to the Transport from Production to Construction Site
The rate of CO2e related to module A4 (construction phase) is the sum of the emissions generated by the production of the percentage of loss due to handling and the ones generated by the means of transport.
where
CO2e, A4 = CO2e, A4 loss + CO2e, A4 equipment
CO2e, A4: Total CO2e emissions, with reference to transportation from the production site to the construction site (A4).
CO2e, A4 loss: CO2e emission rate generated by the production of material loss during transportation.
CO2e, A4 equipment: CO2e emissions rate generated by transport vehicles.
Therefore, we need to consider, in addition to the weight of the material that arrives intact at the construction site, the percentage of loss due to transport problems (damage due to movement). The total quantity to be transported is then calculated like this:
where
Wgross (i) [kg] = W(i) [kg] + (W(i) [kg] × %loss(i))
Wgross: gross weight for each material to be transported.
W(i): weight of the material loss/damage rate during transport.
%loss: percentage incidence of material loss/damage.
The emissions generated by the additional quantity in phases A1–A3 are calculated using the ICE database again:
where
CO2e, A4 loss (i) [kgCO2e] = W(i) [kg] × %loss(i) × ECICE(i) [kgCO2e/kg]
CO2e, A4 loss = Σ CO2e, A4 loss(i)
CO2e, A4 loss (i): CO2e emissions related to the loss/damage of each building material during transportation.
W(i): weight of the incidence of lost/damaged of each material.
%loss(i): percentage incidence of each material loss/damage.
ECICE(i): Embodied Carbon Factor, from ICE (Inventory Carbon and Energy) [27], with reference to each lost material.
Σ CO2e, A4 loss(i): Overall summation of CO2e emissions, for the production of lost/damaged material rates, during the transportation phase.
Moreover, we must evaluate the stops to be obtained by transported elements and the number of trips from the production site to the construction one. The number of trips is strongly influenced by the chosen transportation model, specifically the size of the container, the maximum transportable volume, and the maximum transportable weight. Since wood panels are lightweight but bulky, the limitation that will determine the number of trips for panels is primarily represented by volume; however, the weight will also be considered to ensure that the load for each trip does not exceed the maximum carrying capacity of the vehicle. Starting from the total amount of material to be transported (Vgross and Pgross), the volume and weight of the first portion of transportable elements are subtracted from it, resulting in the remaining amount. This process is repeated until all groups of elements are loaded. The number of trips is obtained by determining the number of vehicles that, after loading material fractions, reach the maximum weight or maximum transportable volume. At this point, considering the type of transportation used and defining the calculation methodology for the number of trips from various production sites to the construction site, it is possible to estimate the amount of CO2e emissions amount produced by the transportation vehicles in phase A4.
where
CO2e, A4 equipment (i) [kgCO2e]= D(i)[km] × n°travels (i) [n] × Fequip(i)[kgCO2e/km]
D(i): Distance to be covered to transport the single material.
Fequip(i): Emission factor for the specific means of transport.
All the vehicles chosen have a diesel engine, and the emission factor has been calculated on the basis of the maximum transportable flow from them. These values were taken from a study by the Politecnico di Milano on average GHG emissions from means of transport [28]. The recycling of parts lost during transportation has not been calculated as it is considered insignificant (most building elements are highly resistant to transportation damage, being mainly prefabricated elements).
3.3.3. Rate of CO2e, A5 Emissions due to the Construction Activities
The emissions related to the construction phase are divided into two rates:
- Emissions from installation waste management (A5w);
- Emissions from general construction activities (A5a).
CO2e, A5= CO2e, A5w+ CO2e,A5a
- WASTE—A5w
The emissions from waste management for each material are calculated as follows:
where
CO2e A5w (i) = WF(i) × (CO2e A1-3(i) + CO2e A4(i) + CO2e C2(i) + CO2e C3/C4(i))
CO2e, A5w = Σ CO2e, A5w(i)
CO2e A5w(i): Embodied carbon factor from construction waste [kgCO2e].
WF(i): Single material waste factor, given by the equation:
WF(i) = [(1/1 − WR(𝑖)𝑊𝑅(𝑖)) − 1]
WR(i): scrap rate. It can be estimated using the WRAP Net Waste Tool data [29] or obtained from guides for construction companies.
CO2e(A1—A3)(i) A1—–3(i): Emissions from the material in stages A1 to A3, including carbon sequestration for all wood elements.
CO2e A4(i): Emissions from the transport of material from the production site to the construction site.
CO2e C2(i): Emissions related to the transport of material from the construction site to the landfill site.
CO2e C3/C4(i): In the case of landfill disposal, stage C4 is considered. When waste is reusable, reference is made to the C3 stage, which is about the treatment for recovery or recycling.
Recycling will be considered the only possible option in this research since waste will certainly be of such a size that it cannot be reused; landfill and incineration will not be considered for environmental protection.
The first step is the classification of waste materials based on the European Waste Catalogue [30] which assigns a European Waste Code (EWC) to each category of materials. This allows the identification of the nearest authorized transforming center. After setting transport distances, the number of trips, and the means of transport, emissions are also calculated for transport phase A4:
where
CO2e, C2 (i) [kgCO2e] = D(i)[km] × n°travels (i) [n] × Fequip(i)[kgCO2e/km]
D(i): Distance from the construction site to the component recycling center.
Fequip(i): Emission factor for the specific means of transport.
The carbon incidence due to materials recycling processing is calculated considering the type of treatment, the machinery used, the hourly power of the machinery, the number of kilograms treated in one hour, the total treatment time, energy consumed, and carbon emission coefficient (depending on the type of machinery).
where
CO2e, C3 (i) [kgCO2e] = E(i) [kW h] × Fmachine(i) [kgCO2e/kW h]
E(i) [kW h] = t(i) [h] × P(i)[kW]
E(i): Energy consumed for the processing.
Fmachine(i): Emission factor for the specific machinery.
t(i): Time required for processing.
P(i): Power of the machinery.
Information relating to the specific type of machinery is derived from the datasheets, and the carbon emission coefficient varies according to the type of engine, as specified in Table 1. These are data derived from Appendix A of the UKETS Manual (01)05, “Guidelines for the measurement and reporting of emission in the UK Emission Trading Scheme” [31], coherent with the National Plan for Atmospheric Emissions (National Air Emission Inventory) [32].
- 2.
- General Construction Activities—A5a
The A5a rate is obtained by the sum of the emissions generated by two types of operations: components placement (CO2e, A5a placement) and connections realization (CO2e CO2e, A5a connection). Depending on the construction system and assembly technology, the transportation mode and the instrument and/or the machinery used for installation have been defined. Therefore, the total emissions related to construction activities are calculated as follows:
CO2e, A5a= CO2e, A5a placement + CO2e, A5a connection
3.4. Rate of CO2e Emissions from Component Placement (CO2e, A5a Placement)
CO2e, A5a placement (i) [kgCO2e] = t(i)[h] x P(i)[kW] x Fmachinery(i) [kgCO2e /kW h]
CO2e, A5a placement = Σ CO2e, A5 placement (i)
t = Time of use of the machine needed to place each element, also considering the return trip.
P(i) = Machine power.
Fmachinery (i) = Emission factor of the specific handling machinery.
To define the transport methods of the elements to be connected, it is necessary to consider that:
- The maximum weight an operator can lift under optimal conditions is 25 kg (UNI ISO 11228-1) [33];
- The maximum load capacity of a Liebherr crane 32TT [34] is 2500 kg;
- The maximum capacity of a Liebherr telescopic crane, LTM 1040-2.1 [35], is 40,000 kg.
Therefore, it is established which elements of the buildings required transport by machinery and which, instead, could have been transported manually. The seconds required for the positioning operations were evaluated based on the technical data sheets of the machines and the videos available on the web and divided into three steps: T0 (seconds required to connect the element to the crane hook), T1 (seconds required to reach the position), T1′ (seconds required to return to the starting point) (Table 2).
Table 2.
Seconds required for the positioning operations.
A connecting crane is a current-powered machine; the emission factor for the production and consumption of electricity has been provided by Ispra [36], and considers electricity produced from renewable and non-renewable sources.
3.5. Rate of CO2e Emissions from the Connections (CO2e, A5a Connection)
CO2e, A5a connection (i) [kgCO2e] = t(i)[h] × P(i)[kW] × Ftool(i) [kgCO2e/kW h]
CO2e, A5a connection = Σ CO2e, A5 connection (i)
t = Time of use of the connection tool.
P(i)= Tool power.
Ftool (i) = Emission factor of the specific tool.
The installation technology of the elements and the precise models of the tools used have been identified (Table 3).
Table 3.
Tools.
For each of the instruments, the operating time has been determined through videos provided by the manufacturers. Those videos correspond to real cases, and data sheets (Table 4).
Table 4.
Operating time of the instruments.
A processing capacity of 6 m3/h is declared on the data sheets of the concrete screed machinery [42], based on which the operating time of the machine is then calculated.
4. Application to the Case Studies
The selection of case studies considered the following requirements:
- Buildings made with predominantly dry technology systems;
- No.1 building made with a wood-framed construction system;
- No.1 building made with an XLAM panel construction system;
- The selected buildings must present the characteristics of contemporary architectural works in terms of the number of publications, citations, and web presence.
The first selected building is the ‘IRIDE’ kindergarten (Figure 7) in Guastalla, Italy, designed by Mario Cucinella and realized in 2015 with a timber-framed structure [43,44,45].
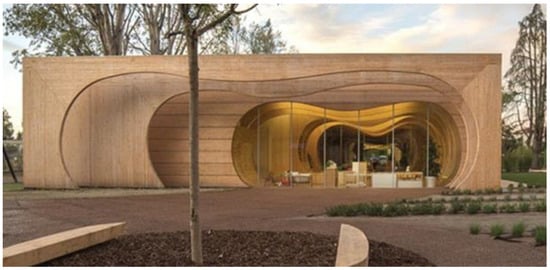
Figure 7.
IRIDE Kindergarten by Mario Cucinella, Guastalla.
The second building studied for the purpose of this research is the kindergarten of Ponte d’Arbia, Italy, designed in 2016 by Studio Settanta7, in timber X-LAM panels (Figure 8) [46].
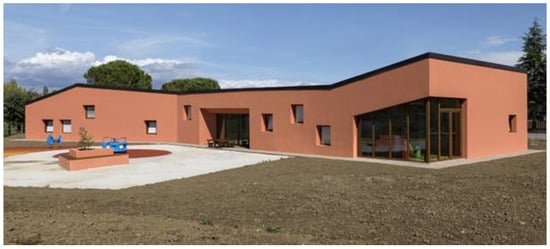
Figure 8.
Kindergarten of Ponte d’Arbia by Studio Settanta7, Ponte d’Arbia.
Estimation of CO2e Emissions
Once the technological units and the installation methods of the building components have been determined, the CO2e emissions generated during the production and construction phases of the two selected cases have been estimated. The results obtained for each rate regarding kg of CO2e and the incidence of each of the three rates on the total CO2e emissions generated by the production and construction process are reported below (Table 5 and Table 6, Figure 9 and Figure 10).
Table 5.
Case study: IRIDE kindergarten. Total emissions, in terms of tones, of each of the three rates.
Table 6.
Case study: Kindergarten of Ponte d’Arbia. Total emissions, in terms of tones, of each of the three rates.
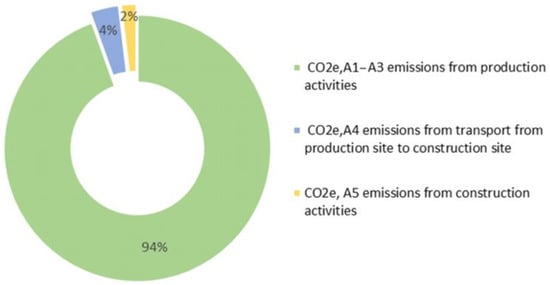
Figure 9.
Impact of the three CO2e emission rates—IRIDE kindergarten.
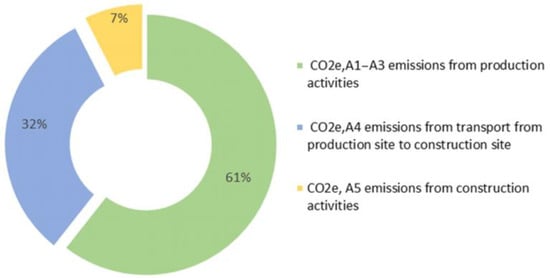
Figure 10.
Impact of the three CO2e emission rates—kindergarten of Ponte d’Arbia.
5. Results
To compare the results obtained, the emissions for 1 m3 of built volume were evaluated by dividing the values obtained (in kg CO2e) by the volume of the two schools (Table 7 and Figure 11).
Table 7.
Comparison table of emissions from each school.
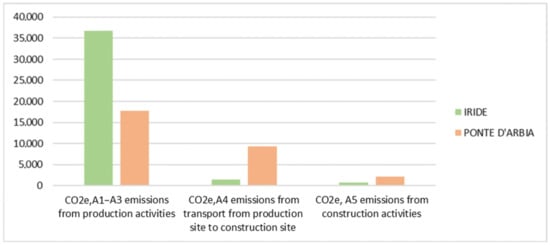
Figure 11.
Comparison graph of emissions from each school.
5.1. Rate of CO2e, A1–A3 Emissions due to Production Activity
As regards the emissions rate at the production stage, a significant discrepancy between the results for the two case studies exists, with 36.68 kg CO2e/m3 for the Guastalla building and 17.74 kg CO2e/m3 for the Ponte d’Arbia building (Figure 12).
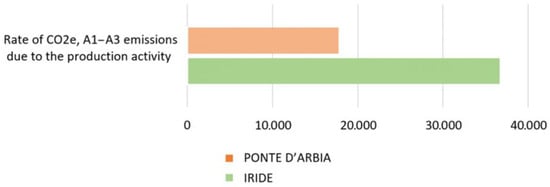
Figure 12.
Rate of CO2e, A1–A3 emissions of the Iride kindergarten and the Ponte D’Arbia kindergarten.
To investigate the reasons for the difference in CO2e, A1 — A3 emissions between the two buildings, the ones caused by the production of envelope elements and those generated by the production of other building components were separately compared.
By extrapolating the data on production emissions related to the building envelope, a significant difference can be observed between the two schools. For the Guastalla kindergarten (Climatic zone E), they amount to 28.80 Kg CO2e/m3 (79%), whereas for the Ponte d’Arbia kindergarten (Climatic zone D), they even have a negative value of −9.83 Kg CO2e/m3 (−26%) (Figure 13). On the other hand, to produce the other building elements, the emissions generated are, respectively, 7.88 Kg CO2e/m3 and 27.57 Kg CO2e/m3.
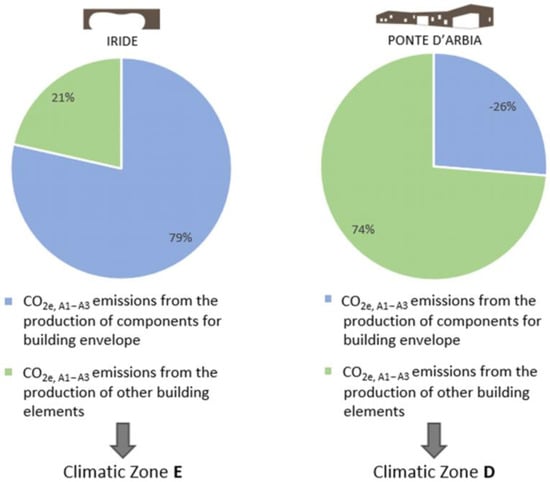
Figure 13.
Rate of CO2e, A1–A3 emissions of the Iride kindergarten (left) and the Ponte D’Arbia kindergarten (right).
5.2. Rate of CO2e, A4 Emissions due to the Transport from Production Site to Construction Site
Regarding the emissions related to the transportation of the elements, it is important to note the negative value of those caused by producing transportation losses for the Guastalla kindergarten (−0.016 kg CO2e). In this school, among the elements considered vulnerable to transportation damages, the industrial parquet is to be mentioned as it has an embodied carbon ICE coefficient of −0.81 kg CO2e/kg, considering the carbon storage property of wood. For the Ponte d’Arbia kindergarten, no element was considered vulnerable to handling damages; therefore, the emissions generated during production due to losses are zero (Figure 14).
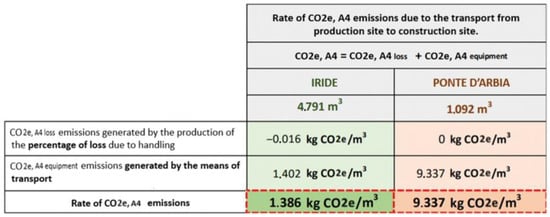
Figure 14.
Rate of CO2e, A4 emissions of the Iride kindergarten and the Ponte D’Arbia kindergarten.
The building situated in Siena generates notably higher CO2e emissions due to transportation compared to the one in Reggio Emilia. This discrepancy can be attributed to the elevated concentration of the construction industry in Northern Italy.
Specifically, in phase A4, the CO2e production amounts to 1.402 kg CO2e/m3 for the Ponte d’Arbia kindergarten, while it reaches 9.337 kg CO2e/m3 for the Guastalla kindergarten (Figure 15).
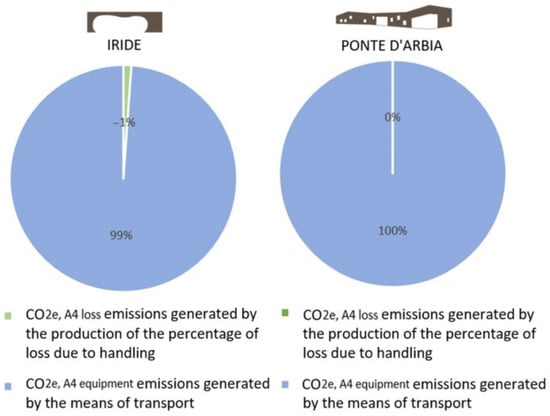
Figure 15.
Rate of CO2e, A4 emissions of the Iride kindergarten (left) and the Ponte D’Arbia kindergarten (right).
5.3. Rate of CO2e, A5w Emissions due to Installation Waste Management
Comparing the results of CO2e, A5w emissions obtained, after dividing them by the volume of the respective schools a similarity can be observed between the two values related to the transportation of waste to the disposal site (0.013 kg CO2e/m3 for the Guastalla kindergarten and 0.015 kg CO2e/m3 for the Ponte d’Arbia kindergarten) and those related to the recycling treatment (approximately 0.001 kg CO2e/m3 for both case studies) (Figure 16).
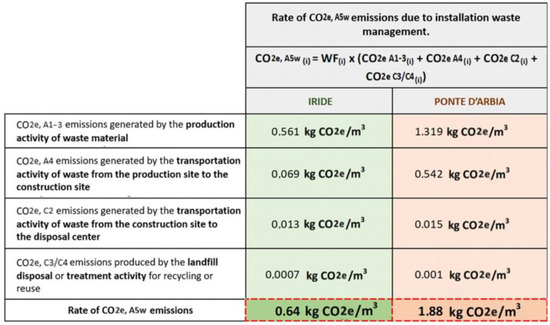
Figure 16.
Rate of CO2e, A5w emissions of the Iride kindergarten and the Ponte D’Arbia kindergarten.
However, a significant difference in the production emissions rate can be observed: it amounts to 0.561 kg CO2e/m3 for the construction in Guastalla, whereas it reaches 1.319 kg CO2e/m3 for the construction in Ponte d’Arbia. This discrepancy is due to the presence of industrial parquet as construction waste in Guastalla, which, being made of wood, has a negative embodied carbon coefficient, thereby lowering the overall emissions value.
Regarding the results related to transportation from the production site to the construction site, the same considerations mentioned earlier for phase A4 apply.
From the observation of the pie charts (Figure 17), it is evident that the emissions generated by the processes aimed at recycling construction waste have a very minimal impact on the total CO2e, A5w. These emissions are present in such small quantities that they do not appear within the diagrams.
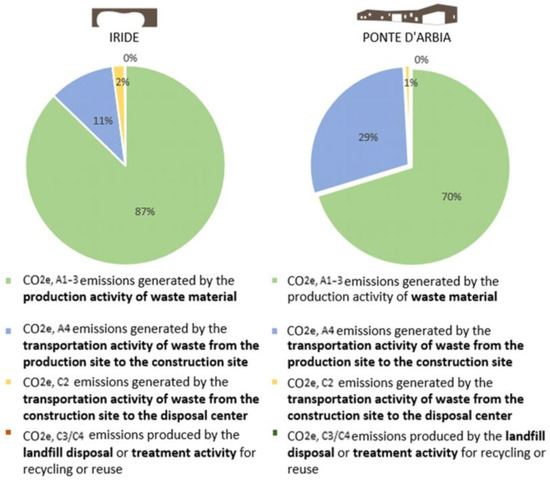
Figure 17.
Rate of CO2e, A5w emissions of the Iride kindergarten (left) and the Ponte D’Arbia kindergarten (right).
5.4. Rate of CO2e, A5a Emissions due to the General Construction Activities
From the comparison of the results (Figure 18 and Figure 19), a significant difference in emissions produced by the transportation activity for the positioning of elements is evident between the two schools. This is justified by the fact that while a self-erecting crane powered by electricity, consuming 17.6 kW per hour, was used for the Guastalla kindergarten, a diesel-powered mobile crane with a consumption of 209 kW per hour was used for the Ponte d’Arbia kindergarten, resulting in approximately twelve times higher consumption. However, the two case studies show comparable values for emissions related to the installation of connections per cubic meter, with 0.073 kg CO2e/m3 for the Guastalla school and 0.064 kg CO2e/m3 for the Ponte d’Arbia school.
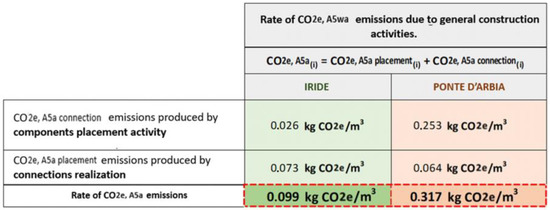
Figure 18.
Rate of CO2e, A5a emissions of the Iride kindergarten and the Ponte D’Arbia.
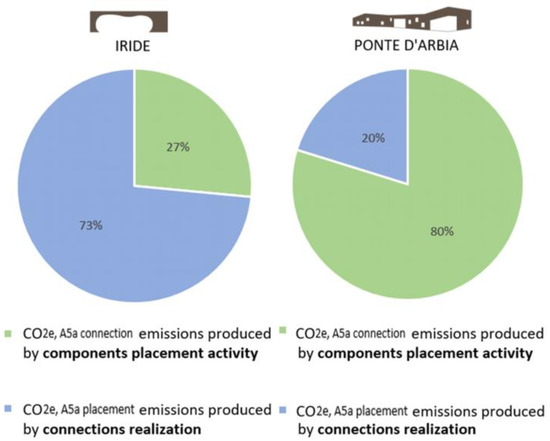
Figure 19.
Rate of CO2e, A5a emissions of the Iride kindergarten (left) and the Ponte D’Arbia kindergarten (right).
5.5. Comparison of the Results Obtained Considering and Not Considering the Compensatory Emission Credit for Carbon Storage in Timber
In order to assess the benefits of timber utilization, emissions were evaluated without considering carbon storage. The results show that the amount of stored CO2e is approximately 50 kg CO2e/m3 for both schools (Figure 20).
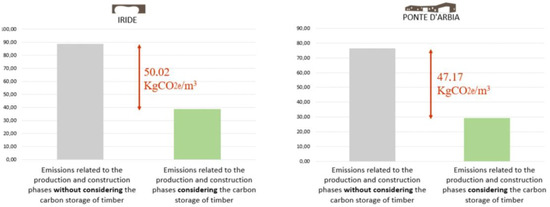
Figure 20.
Results for the Iride kindergarten (left) and the Ponte D’Arbia (right) were obtained considering and not considering the compensatory emission credit for carbon storage in timber.
6. Discussion of Results
Analyzing the obtained results leads to three important considerations:
- With reference to emissions generated during A1–A3 phases, the results are closely dependent on the design choices, which are also influenced by the climatic zones the buildings are located in. The Guastalla kindergarten, for instance, falls within climatic zone E, characterized by colder temperatures that require higher passive energy performance. On the other hand, the Ponte d’Arbia school (climatic zone D) has a very low, and even negative, emission rate also due to most of its elements being made of wood, which provides the advantage of a carbon offset credit;
- The building in Siena exhibits considerably higher CO2e emissions resulting from transportation compared to the one in Reggio Emilia. This disparity can be attributed to the greater concentration of the construction industry in Northern Italy, which represents approximately 52% of all industries in Italy. This regional concentration significantly impacts the transportation distances required for goods, as they need to be transported from the production sites to the construction sites. To date, CO2e emissions resulting from transportation operations are mitigated using Low Emission Vehicles (LEV) as mandated by the Italian Ministerial Decree of 11 October 2017. In accordance with Criterion 2.5.3, the exclusive use of highly energy-efficient vehicles (EEV) is ensured. Additionally, the incentivizing Criterion 2.6.5 stipulates a maximum distance of 150 km for sourcing construction products. This requirement further reduces carbon emissions during transportation by promoting local suppliers and limiting the need for long-distance travel;
- The results of phase A5 (construction) showed the importance of using electrical machinery and equipment to reduce greenhouse gas emissions and energy consumption. For the construction of the Guastalla kindergarten, an electric crane was used, with an energy consumption twelve times lower than the diesel-powered crane used for the kindergarten in Siena.
The objective of this research is to provide a clear calculation methodology and fill existing gaps in the literature. In particular, there is currently no standardized method for calculating emissions during the design and construction (C2H) phases, not allowing the results obtained to be compared with the experimental method developed from previous studies. This study confirmed the findings of other researchers on the potential of using wood, particularly with reference to its carbon storage properties, while quantifying these benefits. The prospects for implementation of this research offer valuable insights for further study. First, it would be appropriate to extend the scope of the investigation to the other stages of the life cycle, namely stages B, C, and D.
The objective of this research is to provide a clear calculation methodology and address the existing gaps in the literature. Specifically, there is currently no standardized method for calculating emissions during the design and construction phases (C2H). This lack of a standard method hinders the ability to compare the results obtained through the developed experimental method with previous research studies. This study has confirmed the findings of other researchers regarding the potential of wood utilization, particularly its carbon storage properties, while also quantifying these benefits. The implementation perspectives of this research offer valuable directions for further exploration. Firstly, it is important to extend the field of investigation beyond the initial focus on the production and construction phases (phase A) to encompass the entire life cycle of the building, including phases B, C, and D.
The analysis of the environmental impact throughout the life cycle provides a complete view of the sustainability of timber construction systems. This broader perspective allows for the identification of potential strategies to minimize environmental impacts. Secondly, in addition to evaluating the environmental aspects, it is essential to define an economic profile of the building’s production and construction process. This involves evaluating the costs associated with various stages of the construction process, including design, procurement of materials, labor, and other relevant factors. By analyzing the economic aspects, such as the initial investment, operating costs, and potential long-term savings, we can evaluate the overall efficiency and financial sustainability of the various design and construction choices. This economic perspective provides valuable information for decision-making and enables stakeholders to make informed choices that balance environmental and economic considerations.
7. Conclusions
The study highlights the importance of the choice of building systems and materials. Compared to concrete and steel, wood’s impact on the environment is far less damaging. Environmental policies are encouraging greater use of wood, focusing on issues such as carbon pricing, life cycle assessment, and carbon offsetting. This study developed a methodology for assessing the environmental impact of the production phases of building materials and building construction, which was then applied to two case studies. The case studies analyzed are the Iride kindergarten by Mario Cucinella, located in Guastalla (Reggio Emilia), with a wood-frame construction system, and the Ponte d’Arbia kindergarten in Siena, built by the firm Settanta7, with an X-Lam panel load-bearing structure. The results of this research showed that, with reference to the production and construction phases, frame construction technology has an environmental impact about 30 percent greater than X-Lam panel technology. However, both systems can store an amount of carbon equal to about 50 kgCO2eCO2e per cubic meter of construction, empty or full. Finally, the advantage of carbon storage in wood results in a saving of about 60 percent of CO2eCO2e emissions in the survey. Therefore, it can be said that a predominantly wood building system, due to its carbon storage property, is confirmed as the most virtuous solution in the perspective of climate neutrality by 2050. It should be emphasized that the use of wood in building design and construction need not replace other more established building materials; rather, it can offer a wide range of possibilities, being suitable for composite components and hybrid structures in combination with concrete, steel, polymers, and even glass. Wood construction, in addition to its ability to cut greenhouse gas emissions, also promotes better forest management and renewal and the control of deforestation, both important issues related to global warming.
Author Contributions
Conceptualization, G.D.R.; methodology, G.D.R.; software, A.G.; validation, G.D.R. and A.G.; formal analysis, A.G.; investigation, A.G; resources, A.G.; data curation, A.G.; writing—original draft preparation, A.G.; writing—review and editing, G.D.R.; visualization, G.D.R.; supervision, G.D.R. All authors have read and agreed to the published version of the manuscript.
Funding
This research received no external funding.
Data Availability Statement
Research data can be accessed at the websites: https://docenti.unisa.it/020080/ricerca/pubblicazioni, https://www.researchgate.net/profile/ Giacomo-Di-Ruocco, https://orcid.org/0000-0002-4267-1502 (accessed on 3 February 2023).
Conflicts of Interest
The authors declare no conflict of interest. The funders had no role in the study design, data collection, analysis, interpretation, the writing of the manuscript, or the decision to publish the results.
References
- Communication from the Commission to the European Parliament, the Council, the European Economic and Social Committee and the Committee of the Regions ‘Fit for 55’: Delivering the EU’s 2030 Climate Target on the Way to Climate Neutrality COM (2021) 550 Final. Available online: https://eur-lex.europa.eu/legal-content/EN/TXT/PDF/?uri=CELEX:52021DC0550&from=EN (accessed on 25 March 2023).
- The Paris Agreement. Available online: https://unfccc.int/sites/default/files/resource/parisagreement_publication.pdf (accessed on 7 March 2023).
- IPCC—Global Warming of 1.5 °C-Summary for Policymakers. 2018. Available online: https://www.ipcc.ch/sr15 (accessed on 3 February 2022).
- United Nations General Assembly—Transforming Our World: The 2030 Agenda for Sustainable Development. Available online: https://www.un.org/en/development/desa/population/migration/generalassembly/docs/globalcompact/A_RES_70_1_E.pdf (accessed on 25 March 2023).
- United Nations Environment Programme. 2022 Global Status Report for Buildings and Construction. Available online: https://globalabc.org/sites/default/files/2022-11/FULL%20REPORT_2022%20Buildings-GSR_1.pdf (accessed on 25 March 2023).
- Report From the Commission to the Council, the European Parliament, the European Economic and Social Committee and the Committee of the Regions—On the State of Implementation of Integrated Product Policy. Available online: https://eur-lex.europa.eu/legal-content/EN/TXT/PDF/?uri=CELEX:52009DC0693&from=EN (accessed on 22 March 2023).
- UN EN ISO 14040:2021; Gestione Ambientale—Valutazione del Ciclo di Vita—Principi e Quadro di Riferimento. Ente Italiano di Normazion: Milan, Italy, 2021. Available online: https://store.uni.com/uni-en-iso-14040-2021 (accessed on 12 June 2023).
- UNI EN ISO 14044:2021; Gestione Ambientale—Valutazione del Ciclo di Vita—Requisiti e Linee Guida. Ente Italiano di Normazion: Milan, Italy, 2021. Available online: https://store.uni.com/uni-en-iso-14044-2021 (accessed on 13 June 2023).
- Fargnoli, M.; De Minicis, M.; Tronci, M. Product’s Life Cycle Modelling for Ecodesigning Product-Service Systems. In Proceedings of the International Design Conference—Design 2012, Dubrovnik, Croatia, 21–24 May 2012; pp. 869–878. Available online: https://www.designsociety.org/publication/32055/PRODUCT%E2%80%99S+LIFE+CYCLE+MODELLING+FOR+ECO-DESIGNING+PRODUCT-SERVICE+SYSTEMS (accessed on 12 June 2023).
- UNEP, United Nations Environment Programme, 2004 Annual Evaluation Report. September 2005. Available online: https://wedocs.unep.org/bitstream/handle/20.500.11822/356/UNEP_Annual_Evaluation_Report_2004.pdf?sequence=1&isAllowed=y (accessed on 3 February 2022).
- Wen, R.; Qi, S.; Jrade, A. Simulation and Assessment of Whole Life-Cycle Carbon Emission Flows from Different Residential Structures. Sustainability 2016, 8, 807. [Google Scholar] [CrossRef]
- Net Zero Carbon Buildings Three Steps to Take Now, ARUP. Available online: https://www.arup.com/perspectives/publications/research/section/net-zero-carbon-buildings-threesteps-to-take-now (accessed on 13 June 2023).
- Bontempi, E. How to perform a material recovery sustainability evaluation preliminary to LCA? Resour. Environ. Sustain. 2022, 9, 100074. [Google Scholar] [CrossRef]
- BS EN 15978:2011; Sustainability of Construction Works—Assessment of Environmental Performance of Buildings—Calculation Method (Incorporating Corrigendum November 2011). British Standards Institution: London, UK, 2011. Available online: https://www.greenbooklive.com/filelibrary/EN_15804/PN326-BRE-EN-15978-Methodology.pdf (accessed on 20 January 2020).
- Khasreen, M.M.; Banfill, P.F.; Menzies, G.F. Life-Cycle Assessment and the Environmental Impact of Buildings: A Review. Sustainability 2009, 1, 674–701. [Google Scholar] [CrossRef]
- Hawkins, W. Timber and Carbon Sequestration. The Structural Engineer 2021. Available online: https://www.istructe.org/journal/volumes/volume-99-(2021)/issue-1/timber-and-carbon-sequestration/ (accessed on 25 June 2023).
- Forestry Commission, Forestry Commission Research Report: Understanding the Carbon and Greenhouse Gas Balance of Forests in Britain. November 2020. Available online: https://www.forestresearch.gov.uk/documents/953/FCRP018.pdf (accessed on 11 June 2023).
- Decreto Legislativo n. 50, Repubblica Italiana. 18 April 2016. Available online: https://www.gazzettaufficiale.it/atto/serie_generale/caricaDettaglioAtto/originario?atto.dataPubblicazioneGazzetta=2016-04-19&atto.codiceRedazionale=16G00062 (accessed on 13 June 2023).
- Decreto Legislativo n. 58, Repubblica Italiana. 1 April 2017. Available online: https://www.gazzettaufficiale.it/eli/id/2017/05/5/17G00078/sg (accessed on 13 June 2023).
- Decreto Ministeriale 11 October 2017. Ministero Dell’ambiente e Della Tutela del Territorio e del Mare. Available online: https://www.bosettiegatti.eu/info/norme/statali/2017_dm_11_10_cam_edilizia.htm (accessed on 13 June 2023).
- Di Ruocco, G.; Melella, R. Evaluation of Environmental Sustainability Threshold of “Humid” and “Dry” Building Systems, for Reduc-tion of Embodied Carbon (CO2). Vitruvio 2018, 3, 17–35. Available online: https://polipapers.upv.es/index.php/vitruvio/article/view/11020 (accessed on 16 April 2023). [CrossRef]
- Di Ruocco, G.; Melella, R.; Sicignano, E. Mitigation Strategies for Reduction of Embodied Energy and Carbon, in the Construction Systems of Contemporary Quality Architecture. Sustainability 2019, 11, 3806. [Google Scholar] [CrossRef]
- Di Ruocco, G.; Melella, R.; Sabatano, L. Timber Buildings Deconstruction as a Design Solution toward Near Zero CO2e Emissions. Buildings 2023, 13, 157. [Google Scholar] [CrossRef]
- Di Ruocco, G.; Melella, R.; Sorvillo, A. Circular construction process: Method for developing a selective, low co2eq disassembly and demolition plan. Sustainability 2021, 13, 8815. [Google Scholar] [CrossRef]
- Italian Standard UNI 8290/1-1981; Edilizia Residenziale. Sistema Tecnologico. Classificazione e Terminologia. Ente Italiano di Normazion: Milan, Italy, 1981. Available online: https://store.uni.com/uni-8290-1-1981-a122-1983 (accessed on 30 January 2023).
- Italian Standard UNI 11277:2008; Sostenibilità in Edilizia—Esigenze e Requisiti di Ecocompatibilità dei Progetti di Edifici Residenziali e Assimilabili, Uffici e Assimilabili, di Nuova Edificazione e Ristrutturazione. Ente Italiano di Normazion: Milan, Italy, 2008. Available online: https://store.uni.com/uni-11277-2008-77843.html (accessed on 30 January 2023).
- Inventory of Carbon and Energy (ICE). Available online: https://circularecology.com/embodied-carbon-footprint-database.html (accessed on 30 January 2023).
- Politecnico di Milano. Convenzione tra il Ministero Dell’ambiente e Della Tutela del Territorio e del Mare ed il Politecnico di Milano del 24 Marzo 2014 per L’attuazione Delle Metodologie di Calcolo Dell’impronta di Carbonio e di Compensazione Delle Emissioni di CO2 di EXPO 2015. Available online: https://www.mase.gov.it/sites/default/files/archivio/allegati/impronta_ambientale/approfondimento_metodologico_viaggi.pdf (accessed on 11 May 2023).
- WRAP, Welcome to the Net Waste Tool. Available online: https://wrap.org.uk/wraps-builtenvironment-programme (accessed on 11 May 2023).
- European Waste Catalogue. 18 December 2014. Available online: https://eurlex.europa.eu/legal-content/IT/TXT/PDF/?uri=CELEX:32014D0955&from=IT (accessed on 11 May 2023).
- Department for Environment, Food and Rulal Affairs. Annex A: Protocols for Energy Related CO2 Emissions. UKETS (01)05rev2. Guidelines for the Measurement and Reporting of Emissions by Direct Participants in the UK Emission Trading Scheme. Available online: https://www.gov.uk/government/collections/uk-emissions-trading-scheme-uk-ets-technical-guidance-and-tools (accessed on 20 May 2023).
- National Emissions Inventory. Available online: https://www.epa.gov/air-emissions-inventories/national-emissions-inventory-nei (accessed on 11 May 2023).
- Italian Standard UNI ISO 11228-1; Ergonomia—Movimentazione Manuale—1: Sollevamento e Trasporto. Ente Italiano di Normazion: Milan, Italy, 2009. Available online: http://store.uni.com/catalogo/uni-iso-11228-1-2009 (accessed on 30 January 2023).
- Data Sheet for Liebeherr Crane 32TT. Available online: https://cranemarket.com/specification1573 (accessed on 11 May 2023).
- Data Sheet for Liebeherr Telescopic Crane LTM 1040-2.1. Available online: https://www.liebherr.com/en/int/products/mobile-and-crawler-cranes/mobile-cranes/liebherrmobile-cranes/ltm-1040-2.1.html (accessed on 11 May 2023).
- ISPRA-Istituto Superiore per la Protezione e la Ricerca Ambientale, Report: Efficiency and Decarbonisation Indicators of the National Energy System and the Electricity Sector. 2021. Available online: https://www.isprambiente.gov.it/files2021/pubblicazioni/rapporti/r343-2021.pdf (accessed on 10 April 2022).
- Data Sheet for Nailer Hilti, BX3-L. Available online: https://www.hilti.it/medias/sys_master/documents/hf9/h29/9559464935454/BX-3-Data-SheetTechnical-information-ASSET-DOC-8281172.pdf (accessed on 11 May 2023).
- Data Sheet for Drill Screwdriver Hilti SF 4-A22. Available online: https://www.hilti.it/c/CLS_POWER_TOOLS_7124/CLS_DRILL_DRIVERS_SCREW_DRIVERS__7124/CLS_CORDLESS_DRILL_DRIVERS_7124/r10563878 (accessed on 11 May 2023).
- Data Sheet for Powered Rotary Hilti TE 30-A36. Available online: https://www.hilti.it/c/CLS_POWER_TOOLS_7124/CLS_ROTARY_HAMMERS_SDSPLUS_7124/CLS_CORDLESS_ROTARY_HAMMERS_SDSPLUS_7124/r7492564 (accessed on 11 May 2023).
- Data Sheet for Impact Wrench HILTI SIW 22T-A-1/2″. Available online: https://www.hilti.it/c/CLS_POWER_TOOLS_7124/CLS_IMPACT_DRIVERS_WRENCHES_7124/CLS_CORDLESS_IMPACT_WRENCHES_7124/r4265 (accessed on 11 May 2023).
- Data Sheet for Impact Wrench HILTI SID 4-A22. Available online: https://www.hilti.it/c/CLS_CORDLESS_TOOLS_7123/CLS_CORDLESS_DRIVER_WRENCH_7123/CLS_CORDLESS_IMPACT_DRIVER_7123/r3357052 (accessed on 11 May 2023).
- Data Sheet for Overmat 24.7 T R and OVERMAT: 13.4 T. Available online: https://www.overmat-screed.com/soluzioni/macchina-per-massetti-serie-t (accessed on 11 May 2023).
- Rubner. Nido D’infanzia Iride, Guastalla (RE)–ITA. Available online: https://www.rubner.com/it/holzbau/referenze/referenza/nido-dinfanzia-iride-guastalla-re-ita/ (accessed on 13 June 2023).
- MCArchitects. Asilo Nido Iride: Il Design che ha un Impatto Positivo Sull’apprendimento e L’educazione. Available online: https://www.mcarchitects.it/progetti/nido-dinfanzia-la-balena (accessed on 13 June 2023).
- Galatolo, E.; Minuto, G.; Gambarotta, L.; Lepidi, M. Nido D’infanzia Iride. Available online: http://www3.dicca.unige.it/mlepidi/Morfo/Nidoinfanziairide.pdf (accessed on 13 June 2023).
- The Plan Award 2019. Scuola Materna di Ponte D’arbia (SI): SETTANTA7 Studio Associato. Available online: https://www.theplan.it/eng/award-2019-education/scuola-materna-di-ponte-darbia-si (accessed on 13 June 2023).


Disclaimer/Publisher’s Note: The statements, opinions and data contained in all publications are solely those of the individual author(s) and contributor(s) and not of MDPI and/or the editor(s). MDPI and/or the editor(s) disclaim responsibility for any injury to people or property resulting from any ideas, methods, instructions or products referred to in the content. |
© 2023 by the authors. Licensee MDPI, Basel, Switzerland. This article is an open access article distributed under the terms and conditions of the Creative Commons Attribution (CC BY) license (https://creativecommons.org/licenses/by/4.0/).