Article

Human Preferences for the Visual Appearance of Desks: Examining the Role of Wooden Materials and Desk Designs

by
Dean Lipovac
1,2,* and
Michael D. Burnard
1,3,4
1
InnoRenew CoE, Livade 6, 6310 Izola, Slovenia
2
Faculty of Mathematics, Natural Sciences and Information Technologies, University of Primorska, Glagoljaška Ulica 8, 6000 Koper, Slovenia
3
Andrej Marušič Institute, University of Primorska, Muzejski Trg 2, 6000 Koper, Slovenia
4
Faculty of Agriculture and Forestry, University of Helsinki, Latokartanonkaari 7, 00014 Helsinki, Finland
*
Author to whom correspondence should be addressed.
Buildings 2023, 13(7), 1680; https://doi.org/10.3390/buildings13071680
Submission received: 12 May 2023 / Revised: 8 June 2023 / Accepted: 16 June 2023 / Published: 30 June 2023

Abstract

:
Visually pleasing materials and furnishings may be an important component of pleasant, restorative indoor spaces, where people can rest, relax, and recover from stress. We conducted two studies to examine human preferences for different wooden desk materials and designs. In Study 1, 77 participants evaluated the visual appearance of 20 wooden materials and 18 desk designs, in which desk elements and their arrangements were systematically varied. The three highest rated wooden materials and desk designs from Study 1 were combined in 18 new desks evaluated by 80 participants in terms of visual appearance in Study 2, where we systematically varied the type of material, amount of material, and desk design. The results show that preference for different materials and desks varies greatly from person to person, but several evaluated items are on average preferred to others. Study 1 shows that certain materials, desk elements, and the arrangements of those elements received higher preference ratings than others. Study 2 indicates that the type of material, amount of material, and desk design all play a significant role in human preference for the visual appearance of desks. Researchers and designers can build on these findings to create aesthetically appealing indoor environments that have the potential to positively impact human wellbeing.

1. Introduction

A large body of evidence suggests that building occupants feel and function better when exposed to nature in indoor spaces [1,2]. After being in contact with elements of nature, such as potted plants and photos of landscapes, occupants tend to exhibit improved affective states, lowered physiological arousal, and enhanced cognitive performance. Due to these effects, environments that contain elements of nature are thought to be restorative, as they restore human functioning and wellbeing after it has been diminished by stress and effort [2,3]. Bringing nature indoors is an intervention that can be particularly useful for office workers, as they can be at a heightened risk of experiencing stress [4] and may spend most of their working hours in indoor spaces. Indeed, a recent review reported that implementing nature into the office environment improves worker wellbeing and productivity [5].
The positive effects that people experience when in contact with (elements of) nature are reflected in human environmental preferences: people consistently prefer natural over built environments, especially individuals who are in higher need of restoration due to stress [6,7]. This suggests that environmental preference can be used as a proxy indicator of environmental restorativeness: settings that occupants find attractive may be more likely to provide restorative effects.
Compared to other approaches of bringing nature to indoor spaces, the current literature has largely overlooked the possibility that wood—a natural material—could positively impact building users. Wood can complement other elements of nature used indoors by bringing naturalness to structural and functional elements of the building, such as furniture, flooring, stairs, and handrails. Many studies suggest that contact with wood could impact building occupants positively: people perceive wood as natural [8], tend to prefer wood over other common materials [9] and, after being exposed to wood, may experience less stress and perform better on tests of cognitive functioning [10,11,12,13,14]. Applying wood indoors could be particularly promising for office workers, who spend much of their time in contact with desks.
However, not all studies have found positive effects of wooden furnishings [15,16]. This could in part result from studies testing different types of wood, applied in various colours, patterns, amounts, and layouts [10]. For example, previously studied materials include birch-, oak-, and walnut-veneered furniture, as well as solid spruce and fir wood, and wood’s coverage in studies ranges from a small wooden desktop [16] to wood applied to most of the room [17]. Identifying the most effective wooden materials and their applications is further complicated by other unique characteristics of previously studied wooden settings: wood emitted noticeable scents in some studies [15,17], but not in others [12,16], and participants were exposed to wooden environments for different amounts of time, from 90 s [18,19] to 75 min [12]. So far, studies on human responses to interior spaces furnished with wood have not clarified which wooden materials to select and how to apply them in indoor settings to increase the likelihood of providing positive effects for building occupants.
Due to the apparent connection between preference and restorative effects, studies investigating human preferences for wooden materials could provide clarity and guidance for researchers, architects, designers, and other stakeholders who want to create restorative indoor spaces. However, most of the existing research has examined how people perceive one or a few types of wood compared to other everyday materials [20,21,22,23], whereas fewer studies have compared human perception between different types of wood. The few existing studies that did compare different wooden materials in terms of human preference either observed no difference between the evaluated wooden materials [23] or found that people prefer wooden surfaces that are perceived as more homogenous [24,25] and closer to red on the green–red colour component [26]. The preference for specific wooden qualities, however, may greatly depend on the intended application of the wood. For example, people might prefer lighter and glossier wooden materials for no particular application [27] but favour darker wood for an outdoor tabletop [26] and wood with a matte surface for handrails [28]. Due to the many and diverse wooden materials and possibilities for their indoor application, human preferences for wood applied in indoor spaces remain underexplored.
The ambition to create office desks that could be part of restorative environments is further complicated by the numerous possibilities of designing a desk but few evidence-based design guidelines that could positively impact human wellbeing. Existing desk-design guidelines focus on ergonomic aspects, which suggest creating desks with adjustable height, sufficient width, adequate knee space, and rounded edges [29]. However, desks that follow these recommendations can still vary in many aspects, such as the type of desk legs and the presence or absence of drawers and shelves. The design possibilities can lead to desks with diverse aesthetic and functional qualities, and the more visually appealing designs are, in principle, more likely to lead to restorative effects. Currently, however, it is not clear how the visual appearance of desks is related to the preferences of people. To the best of our knowledge, human preferences for different desk designs have not yet been examined and reported in a peer-reviewed article. It is also not known to what extent to incorporate wooden materials in desk designs to make desks more visually appealing to users. People seem to prefer a medium amount of wood coverage in a room [30], but it is unclear whether the desired wood coverage is similar in a single piece of furniture, such as a desk.
In summary, from the existing studies, it cannot be determined which wooden materials and desk designs are preferred in terms of visual appearance and, in turn, more likely to provide restorative effects to office workers. However, as office employees may spend most of their working hours at a desk, having such knowledge may lead to an effective, efficient, and scalable passive intervention that could increase worker wellbeing and productivity. The first steps of developing such an intervention are the objectives of this study, which aims to investigate which wooden materials and desk designs are the most visually appealing to people, and how the preferred wooden materials and desk designs can be best integrated to produce aesthetically pleasing desks.
The present research consists of two studies: In Study 1, we examined the preferences of people for selected images of wooden materials and desk designs. The most preferred materials and designs from Study 1 were used to create a new set of (images of) desks that combined different desk designs, wooden materials, and amounts of wooden materials. The preferences of people for these new desks were examined in Study 2. The methodology of the two studies is summarised in Figure 1.

2. Study 1

2.1. Materials and Methods

2.1.1. Wooden Materials

The selection of wooden materials tested in this study was based on existing studies investigating human preferences for and responses to wooden materials and settings. We identified 17 relevant articles [13,16,19,20,21,22,24,25,26,31,32,33,34,35,36,37] and extracted a list of 22 unique wood species that had been reported. Our goal was to present each unique wood species as one untreated wooden material, regardless of whether the original study had tested the wooden material that had been untreated, treated, or both. From the list of identified wooden materials, we excluded (1) silver fir, due to its considerable resemblance to the more commonly reported Norway spruce, and (2) Hinoki (Japanese) cypress, due to the unavailability of the image in the online database from which the images were later collected. The images of the resulting 20 wooden materials (Figure S1) were extracted from the website https://www.wood-database.com (with permission from the website owner, accessed date 13 June 2021).

2.1.2. Desk Designs

We identified 12 vendors of office desks with the online store available in Slovenia. Of those 12 vendors, the online stores of 4 offered the possibility to sort products by popularity. At each of those four websites, we visited the section with desks and sorted them by popularity. We extracted five desk designs from each of the four vendors, resulting in 20 desk designs in total. From these 20 desk designs, we identified common design components that fell into three categories: (1) type of desk legs, (2) type of storage, and (3) arrangement of desk legs and storage. In the first category, we identified three types of desk legs: poles (round legs), board, and square support. In the second category, we identified three types of storage: drawers, single-door cabinet (“cabinet”), and single-door cabinet with a shelf at the top (“shelf”). In the third category, we identified three distinct arrangements of desk legs and storage: the same type of legs were used at both sides of the desk (“both-stand desks”), one side of the desk had some type of legs and the other side of the desk had some type of storage (“one-stand-one-storage desks”), or both sides of the desk had some type of storage (“both-storage desks”).
Based on these identified patterns, we first created digital models of the three types of legs and three types of storage, and then we created desk designs with all possible arrangements of these elements, with the following exceptions: (1) if only desk legs were used in the desk, both sides of the desk must have had the same type of legs, and (2) different elements (i.e., types of legs or storage) were combined only once, without repeating that same combination in the mirror image of the desk design (e.g., if we prepared a desk design with poles on the left and drawers on the right, we did not prepare a desk design with poles on the right and drawers on the left). This process resulted in 18 distinct desk designs (Figure S2). The models of desks were designed in SketchUp Make 2017 [38] and rendered with the SketchUp extension Raylectron 4 [39]. The dimensions of each digital desk model were in the approximate ratio of 2 (length) × 1 (width) × 1 (height) (i.e., 160 cm × 80 cm × 70 cm). The desk models were given a light wood texture (instead of a neutral white) due to the resulting higher quality of the rendered images. Two types of legs—poles and square legs—were coloured with a light metal silver colour.

2.1.3. Survey

In Study 1, the participants first provided preference ratings for 20 wooden materials, and later for 18 desk designs. When presented with each image of the wooden material, participants responded to the question “How do you like the appearance of the material in the image as a material for visible surfaces of an office desk?”, and when presented with the image of each desk design, subjects responded to the question “How do you like the appearance of the desk design in the image?” Each question was responded to on a 7-point rating scale (1—dislike a lot, 2—dislike, 3—somewhat dislike, 4—in between, 5—somewhat like, 6—like, 7—like a lot). The instructions emphasised that the participants should focus on stating their preference for the appearance (and not the functionality) of the rated items. Before rating each wooden material and desk design, the participants were able to first see all images of wooden materials and later desk designs in one large grid of images, to familiarise themselves with the rating task ahead of them. In the survey, the images of the wooden materials did not contain the names of the wood species. All images were presented in the same (random) order to all participants.
The survey was implemented in the 1KA survey platform [40] and run in August 2021. The participants typically needed 5–10 min to complete the survey, which was administered in both Slovenian (Supplementary Materials S1) and English language (Supplementary Materials S2). For the purposes of the survey, the images of the wooden materials and desk designs were processed (i.e., cropped and arranged to a grid) with the R package magick [41].

2.1.4. Participants

Participants were invited to the online survey through the internal and external (social media) communication channels of the InnoRenew CoE research institute (conducting research on renewable materials and healthy environments) and through the personal social media accounts of the first author. At the beginning of the survey, the subjects provided informed consent to participate in the study, after they had been informed about the study’s purpose and procedure, the rights of the participants, and the data management practices.
In total, 83 people responded to the Study 1 survey. All 83 respondents completed the first part of the survey (on preference for wooden materials), whereas 77 of those also completed the second part of the survey (on preference for desk designs). Of the 77 respondents who completed the entire survey (and for whom the demographic data are available), 6 were below 25 years old (8%), 55 (71%) were between the ages of 25 and 44, 15 were aged above 44 (20%), and 1 person (1%) did not wish to disclose their age. Forty-two participants identified as female (55%), thirty-four identified as male (44%), and one respondent (1%) did not wish to disclose their gender. Education and work were unrelated to wood or design in 47 respondents (61%), related to wood in 25 respondents (32%), and related to design in 5 respondents (7%).

2.1.5. Statistical Analysis

The data were processed, analysed, and visualised in R 4.0.2 (R Core Team, 2021) using RStudio 1.4.1106 [42,43], with the packages rstatix [44], ordinal [45], emmeans [46], imager [47], colordistance [48], spacesXYZ [49], flextable [50], ggtext [51], gridextra [52], and the tidyverse [53] collection of packages. Descriptive statistics are reported as means and standard deviations (SD).
Images of wooden materials were processed with the R package colordistance [48] to express the colours of the materials in the three parameters of the CIELAB colour space: L* (lightness), a* (red–green component), and b* (yellow–blue component).
To quantify the colour variability within images, each image was first separated into 900 non-overlapping segments, each 200 pixels in size. For each segment, the average colour was computed by selecting 20 random pixels, identifying their L*a*b values, and calculating the means of those values. Using these means, we calculated Delta E—a measure of colour difference in the CIELAB space [49,54,55]—between all unique pairs of the 900 segments (900 × 899/2; 404550 total comparisons). The mean of these Delta E values was then calculated for each image, representing the degree of colour variability within the image (the higher the mean Delta E, the higher the colour variability). The relationship between these Delta E means and the preference ratings was then examined visually and using Spearman’s rank correlation coefficient.
We also quantified colour differences between the images of wood, using the approach described in the colordistance R package documentation [48,56]. This approach bins pixels of an image into a select number of bins, each with a specific colour and size. The colours of each image can thus be represented on a histogram. The difference in colour between images can be calculated with several metrics that compare the colour histograms of the images. We used the (recommended) Earth mover’s distance, which calculates the minimum cost of transforming one colour distribution into another. Higher Earth mover’s distance values denote greater colour differences [57]. The mean Earth mover’s distance was then calculated for each material (i.e., the material’s average colour distance to all other materials), and the association between these mean distances and preference ratings was examined visually and using Spearman’s rank correlation coefficient.
Cumulative link mixed models (fitted with the function clmm [58] from the R ordinal [45] package) [45,59,60] were used to examine how specific wooden materials, desk designs, desk elements, and the arrangements of desk elements affect the preference ratings of people. These models aim to explain the latent continuous variable (i.e., degree of preference) that underlies the ordinal variable (i.e., discrete preference ratings), based on a set of predictor variables treated as fixed effects (i.e., specific desk designs) and subjects treated as random effects. The main models (i.e., those fitted on all data instead of subsets of data) at first included demographic variables as predictors (i.e., age, gender, and a variable indicating whether the respondent’s education was related to wood or design). These models were then compared with the versions of the models that excluded the demographic variables. As there were no significant differences between the models with and without demographic variables (as tested with analysis of variance), we report the simpler models with fewer predictors.
If the model detected a statistically significant effect of a predictor variable, post hoc comparisons were conducted with the R package emmeans [46]. Due to the exploratory nature of the study, the p-values were not adjusted for multiple comparisons, as we aimed to decrease the possibility of Type II error (i.e., false negatives). This means that the possibility of a Type I error (i.e., false positive) was increased, so the results should be interpreted with caution. The results of post hoc comparisons are reported as exceedance probability (EP): the probability of the item (e.g., specific desk design) being rated as liked (i.e., the probability of having a rating of at least 5—“somewhat like”—on the scale of 1 to 7). For models with more than one factor as predictors,, the EPs were averaged over the levels of the other factors.
We first fitted the model and calculated the EPs separately for all 20 wooden materials and 18 desk designs as predictors, which showed us how individual wooden materials and desk designs compare to one another in terms of the preferences of people. We continued with the model examining the role of the arrangement of desk elements, where desks were grouped according to three distinct arrangements: (1) both-storage desks, where both sides of the desk contained an element intended for storage; (2) both-stand desks, where both sides of the desk contained a leg element; or (3) one-stand-one-storage desks, where one side of the desk contained a storage element and the other a leg element. Finally, we fitted models that explored the roles of specific desk elements (e.g., drawers, poles) in human preferences. The latter models were fitted on specific subsets of data, because some desk elements (e.g., cabinet) were not present in some subsets of data (e.g., desks with both elements used as a stand). A separate model with specific desk elements as predictors was thus fitted for each group of desks based on the arrangement of their desk elements (i.e., both-storage, both-stand, or one-stand-one-storage desks), resulting in three separate models examining the role of desk elements in preference.
To determine the statistical power of our data and our analytical approach to consistently detect the effect that we observed, we conducted a post hoc power analysis using simulations. The simulation was performed in R. We selected a representative model with one independent variable with three groups and one dependent variable to base our simulation on. We simulated new data based on the probabilities observed in our data and fitted a new model to the simulated data. We tracked whether the new model detected a statistically significant (p < 0.05) coefficient for a selected group with p < 0.05 in the original model. We ran 1000 simulations and found that in 99.7% of the cases the simulated outcome matched the expectation from our model, indicating that our model was sufficiently powered to detect significant differences with our data.

2.2. Results

2.2.1. Wooden Materials

Preference for Wooden Materials

Most of the rated materials received a similar mean preference rating, which was typically between approximately 4 (“in between”) and 4.5 (between “in between” and “somewhat like”). Oak, maple, and guibourtia were the highest-rated materials, with mean preference ratings of 4.87 (SD = 1.48), 4.63 (SD = 1.41), and 4.53 (SD = 1.39), respectively (Figure 2, Table S1). The preference ratings of the remaining materials decreased gradually; their mean preference ratings were between 4.47 and 3.81 (SD between 1.40 and 2.04), except for the three lowest-rated materials (aspen, pine, and spruce), which had mean preference ratings between 3.39 and 3.10 (SD between 1.51 and 1.67).
The variability of individual preference ratings within the materials was high; for all materials, the ratings ranged across most or all of the seven possible ratings (from 1—“dislike a lot” to 7—“like a lot”). All of the materials, except for birch, received at least one rating of “like a lot”, while only three materials did not receive a rating of “dislike a lot”: maple, guibourtia, and Japanese cedar. The variability of the ratings was especially high for ebony and relatively low for lauan, but still spanning the entire range of possible ratings in both materials.
The model with the individual wooden materials as predictors and the preference rating as the outcome is available in Table S2. Statistically significant differences between pairs of materials (with the total of 190 paired comparisons) most often occurred in pairs with one of the four lowest-rated materials (i.e., aspen, pine, spruce, and chestnut) or the highest-rated material (i.e., oak) (in 72 of 80 pairs with statistically significant differences), with the remaining eight pairs including birch, guibourtia, maple, radiata pine, teak, and lauan (Table S3).

The Role of Wood Colour in Preferences for Wooden Materials

The analysis of colour distances between materials (i.e., Earth mover’s distances) showed that ebony stands out from the rest, with relatively large colour distances to most other materials in the study. Other materials with somewhat large colour distances to the remaining materials included aspen, walnut, spruce, pine, and guibourtia, with the (mean) colour distances gradually decreasing for the other materials (Figure 3, Table S4).
There was no noticeable overall relationship between the mean colour distances of the materials (with reference to all other materials) and their preference ratings (Figure S3), and the Spearman’s rank correlation coefficient between the two variables was not statistically significant (rs = 0.30, p = 0.225). The only notable exceptions were the three lowest-rated materials (aspen, pine, and spruce), which had a relatively high colour distance to colours of the other materials.
The analysis of colour variability within materials, as examined with the mean Delta E values, indicated that the colour varied the most within poplar, elm, and pine, and the least within red cedar, birch, and walnut (Table S5). There was no obvious association between preference ratings and colour variability within materials (rs = 0.01, p = 0.962, Figure S4).

2.2.2. Preference for Desk Designs

Most of the desks received mean preference ratings between slightly below 4 (“in between”) and slightly above 4.5 (between “in between” and “somewhat like”). The desks that received the highest preference ratings were board-cabinet, board-drawers, square-drawers, and board-board, with mean preference ratings of 4.70 (SD = 1.51), 4.68 (SD = 1.51), 4.56 (SD = 1.54), and 4.56 (SD = 1.74), respectively (Figure 4, Table S6). The mean preference ratings of the other materials gradually decreased and were between 4.52 and 3.31 (SD between 1.36–1.81), with aspen, pine, and spruce being the lowest-rated materials.
The variability of individual preference ratings within the desk designs was generally high, spanning throughout the entire range of possible ratings for all designs, although in many cases only one or few ratings were in the extreme parts of the scale. The board-shelf desk design had a somewhat lower variability of preference ratings compared to the other designs.
Of the six highest-rated desks, five were in the group of one-stand-one-storage desks, and four contained the board element. All six desks from the both-storage desk group were among the seven lowest-rated desks.
The model with desk designs as predictors and the preference rating as the outcome is available in Table S7. Post hoc analysis showed that 79 out of the total 153 comparisons between desk designs were statistically significant. Many of the significant differences predictably appeared within pairs that included the highest- and lowest-rated desk designs, but they also occurred within pairs with other desk designs (Table S8).

2.2.3. The Role of the Arrangement of Desk Elements in Preference for Desk Designs

The model examining the role of the arrangement of desk elements (i.e., both-stand, both-storage, one-stand-one-storage) in preference is available in Table S9. Post hoc analysis showed that both-stand desks (EP = 0.51, 95% CI [0.44, 0.59]) and one-stand-one-storage desks (EP = 0.53, 95% CI [0.47, 0.59]) were similarly likely to be rated as liked (both-stand desks − one-stand-one-storage desks = −0.02, 95% CI [−0.08, 0.04], p = 0.51). Both-storage desks (EP = 0.34, 95% CI [0.28, 0.39]) were significantly less likely to be rated as liked than both-stand desks (both-stand desks − both-storage desks = 0.18, 95% CI [0.11, 0.24], p < 0.001) and one-stand-one-storage desks (both-storage desks − one-stand-one-storage desks = −0.20, 95% CI [−0.25, −0.15], p < 0.001).

2.2.4. The Role of Individual Desk Elements in Preference for Desk Designs

The role of specific desk elements in preference was analysed separately for both-storage desks, both-stand desks, and one-stand-one-storage desks.

The Role of Desk Elements within Both-Storage Desks

The model examining the role of specific desk elements in preference within both-storage desks is available in Table S10. Post hoc analysis showed that a both-storage desk was significantly more likely to be rated as liked if the shelf element was not present (shelf not present: EP = 0.21, 95% CI [0.06, 0.36]; shelf present: EP = 0.12, 95% CI [0.01, 0.23]; difference = 0.09, 95% CI [0.01, 0.17], p = 0.020). The preference ratings of both-storage desks did not significantly differ based on the presence or absence of the remaining two elements: cabinet (cabinet not present: EP = 0.16, 95% CI [0.03, 0.28]; cabinet present: EP = 0.18, 95% CI [0.04, 0.31]; difference = −0.02, 95% CI [−0.08, 0.04], p = 0.501) and drawers (drawers not present: EP = 0.16, 95% CI [0.03, 0.28]; drawers present: EP = 0.18, 95% CI [0.04, 0.31]; difference = −0.02, 95% CI [−0.08, 0.04], p = 0.553).

The Role of Desk Elements within Both-Stand Desks

The model examining the role of specific desk elements in preference within both-stand desks is available in Table S11. Post hoc analysis indicated that the desks containing the board element (EP = 0.62, 95% CI [0.48, 0.75]) were similarly likely to be rated as liked as desks containing the square element (EP = 0.57, 95% CI [0.43, 0.70]; board − square = 0.05, 95% CI [−0.08, 0.18], p = 0.462). The desks containing board or square elements were more likely to be rated as liked than the desks containing poles (EP = 0.37, 95% CI [0.24, 0.50]; board − poles = 0.25, 95% CI [0.12, 0.38], p < 0.001; poles − square = −0.20, 95% CI [−0.33, −0.07], p = 0.003).

The Role of Desk Elements within One-Stand-One-Storage Desks

The model examining the role of specific desk elements in preference within one-stand-one-storage desks is available in Table S12. Post hoc analysis revealed that the desks containing the board element (EP = 0.66, 95% CI [0.56, 0.75]) were more likely to be rated as liked than the desks containing the square element (EP = 0.57, 95% CI [0.47, 0.67]; board − square = 0.08, 95% CI [0.01, 0.16], p = 0.030). The desks containing board or square elements were more likely to be rated as liked than desks containing poles (EP = 0.44, 95% CI [0.34, 0.54]; board − poles = 0.21, 95% CI [0.14, 0.29], p < 0.001; poles − square = −0.13, 95% CI [−0.21, −0.06], p < 0.001).
The desks containing cabinets (EP = 0.59, 95% CI [0.49, 0.68]) and drawers (EP = 0.57, 95% CI [0.48, 0.67]) were similarly likely to be rated as liked (cabinet − drawers = 0.01, 95% CI [−0.06, 0.08], p = 0.728), whereas the desks containing the shelf (EP = 0.51, 95% CI [0.41, 0.61]) were somewhat less likely to be rated as liked, but the differences were not statistically significant (cabinet − shelf = 0.07, 95% CI [0.00, 0.13], p = 0.053; drawers − shelf = 0.06, 95% CI [−0.01, 0.13], p = 0.113).

2.3. Discussion

2.3.1. Preference for Wooden Materials

The findings suggest that people’s preferences for wooden desk materials vary significantly, and that no individual material can satisfy most tastes. However, some materials—especially oak and maple—were favoured more often, and other materials—such as aspen, pine, or spruce—were liked less than others. There were no obvious overall relationships between the colour and preference ratings of materials once the three lowest-rated materials were excluded. Interestingly, these three materials were lighter in colour, which partially contrasts with the findings of Fujisaki et al. [27], who observed that people evaluating the aesthetics of wooden materials not intended for any particular use preferred materials with a lighter colour. Perhaps participants in our study associated very light colour with wooden materials that are commonly used in construction (e.g., spruce), which they did not consider particularly suitable for use in furniture, such as desks. It should be emphasised, however, that outside of the three lowest-rated materials, there was no trend indicating that darker materials were generally preferred, as was the case in the study by Lipovac et al. [26], which examined preferences for outdoor tabletop materials.
Interestingly, in the same study by Lipovac et al. [26], materials made of oak—one of the materials among the most preferred in our study—were associated with lower preference, and materials made of pine, radiata pine, and spruce—the materials among the least preferred in our study—tended to be more preferred (although the trend was not statistically significant).
These patterns of results suggest that the preferences of people for different wood species and colours importantly depend on the context of wood use. Future studies could build on these results and systematically vary certain aspects of wooden materials (e.g., colour hue, intensity of the grain pattern, etc.) to identify the most important aesthetic qualities of wood in different contexts of use.

2.3.2. Preference for Desk Designs

Both-storage desks were less preferred than both-stand desks and one-stand-one-storage desks, with no significant differences between the latter two. The shelf element was clearly associated with lower preference within both-storage desks and showed a tendency towards being associated with lower preference within one-stand-one-storage desks. The remaining two storage elements—cabinet and drawers—were not significantly associated with preference within either group (i.e., both-storage, one-stand-one-storage) of desks. The poles element was associated with lower preference within both both-stand desks and one-stand-one-storage desks, whereas the board element was associated with higher preference ratings than the square element within the one-stand-one-storage desks, but not within the both-stand desks.
This is the first study that we are aware of to examine human preferences for the aesthetics of desk designs. The findings suggest that desks with certain desk elements and their arrangements are on average more preferred than others. Future studies should build on these results, to advance our understanding of desk elements and their arrangements that have the potential to appeal to the greatest number of people.

3. Study 2

3.1. Materials and Methods

3.1.1. Desks with Different Designs and Types and Amounts of Wood

From the results of Study 1, we extracted the three highest-rated wooden materials and the three highest-rated desk designs (according to the mean preference ratings). The mean preference ratings of square-drawers and board-board desk designs were tied in 3rd place in Study 1; this tie was resolved by selecting the material with the lower SD for further study in Study 2. Based on the highest-rated wooden materials and desk designs, we created new images of desks that combined and systematically varied different wooden materials, desk designs, and amounts of wood coverage. Specifically, each of the three desk designs was prepared in one of three options of wood coverage (i.e., no wood—white, medium amount of wood, all wood) using each of the three highest-rated wooden materials. This resulted in 21 new desks (Figure S5).
The details of the specific desk designs were based on the desk designs identified on the websites of online vendors (Section 2.1.2): (1) the square legs remained non-wooden even in the “all wood” condition, as they are typically made of metal; (2) in the “medium amount of wood” condition, wood was applied to desk parts to which it is normally applied when the desk includes some wood but is not fully wooden (many desks in this condition contain more wood than implied by the term “medium”).

3.1.2. Survey

The Study 2 survey was similar to the second part of the Study 1 survey (preference for desk designs; see Section 2.1.3 for a detailed description). The respondents were presented with 21 desk designs and asked “How do you like the appearance of the desk in the image?”, to which they responded using the 7-point rating scale used in Study 1. The Study 2 survey ran between September and November 2021, and the respondents needed about five minutes to complete the survey. The procedure, languages, online survey platform, and other characteristics of the survey were otherwise the same as in the Study 1 survey.

3.1.3. Participants

Eighty people completed the Study 2 survey. Eight participants were below the age of 25 (10%), 51 (64%) were aged 25–44, 20 were aged above 44 (25%), and 1 person (1%) did not wish to disclose their age. Forty-three participants were female (54%), thirty-three were male (41%), two identified as non-binary (3%), and two (3%) did not wish to disclose their gender. Education and work were unrelated to wood or design in 56 respondents (70%), related to wood in 21 respondents (26%), and related to design in 3 respondents (4%).

3.1.4. Statistical Analysis

The statistical analysis was similar to the analysis of the second part of the Study 1 results (preference for desk designs; see Section 2.1.5 for a detailed description). We first fitted a cumulative link mixed model with all 21 desks as predictors and the preference rating as the outcome, which showed us how the desks compared to one another in terms of preference. We continued with the model that contained desk design and material as predictors of preference. Finally, we fitted a model that, in addition to the latter two predictors, included the wood amount as a predictor. This model was fitted to the subset of data within desks that have at least some wood (i.e., are not white). The main models (those fitted on all data instead of subsets of data) did not include demographic variables as predictors, as the models with demographic variables did not significantly differ from the simpler models without them. As in Study 1, the results of post hoc comparisons are reported as EPs, and for models that have more than one factor as predictors, the EPs were averaged over the levels of other factors.

3.2. Results

3.2.1. Preference for Desks

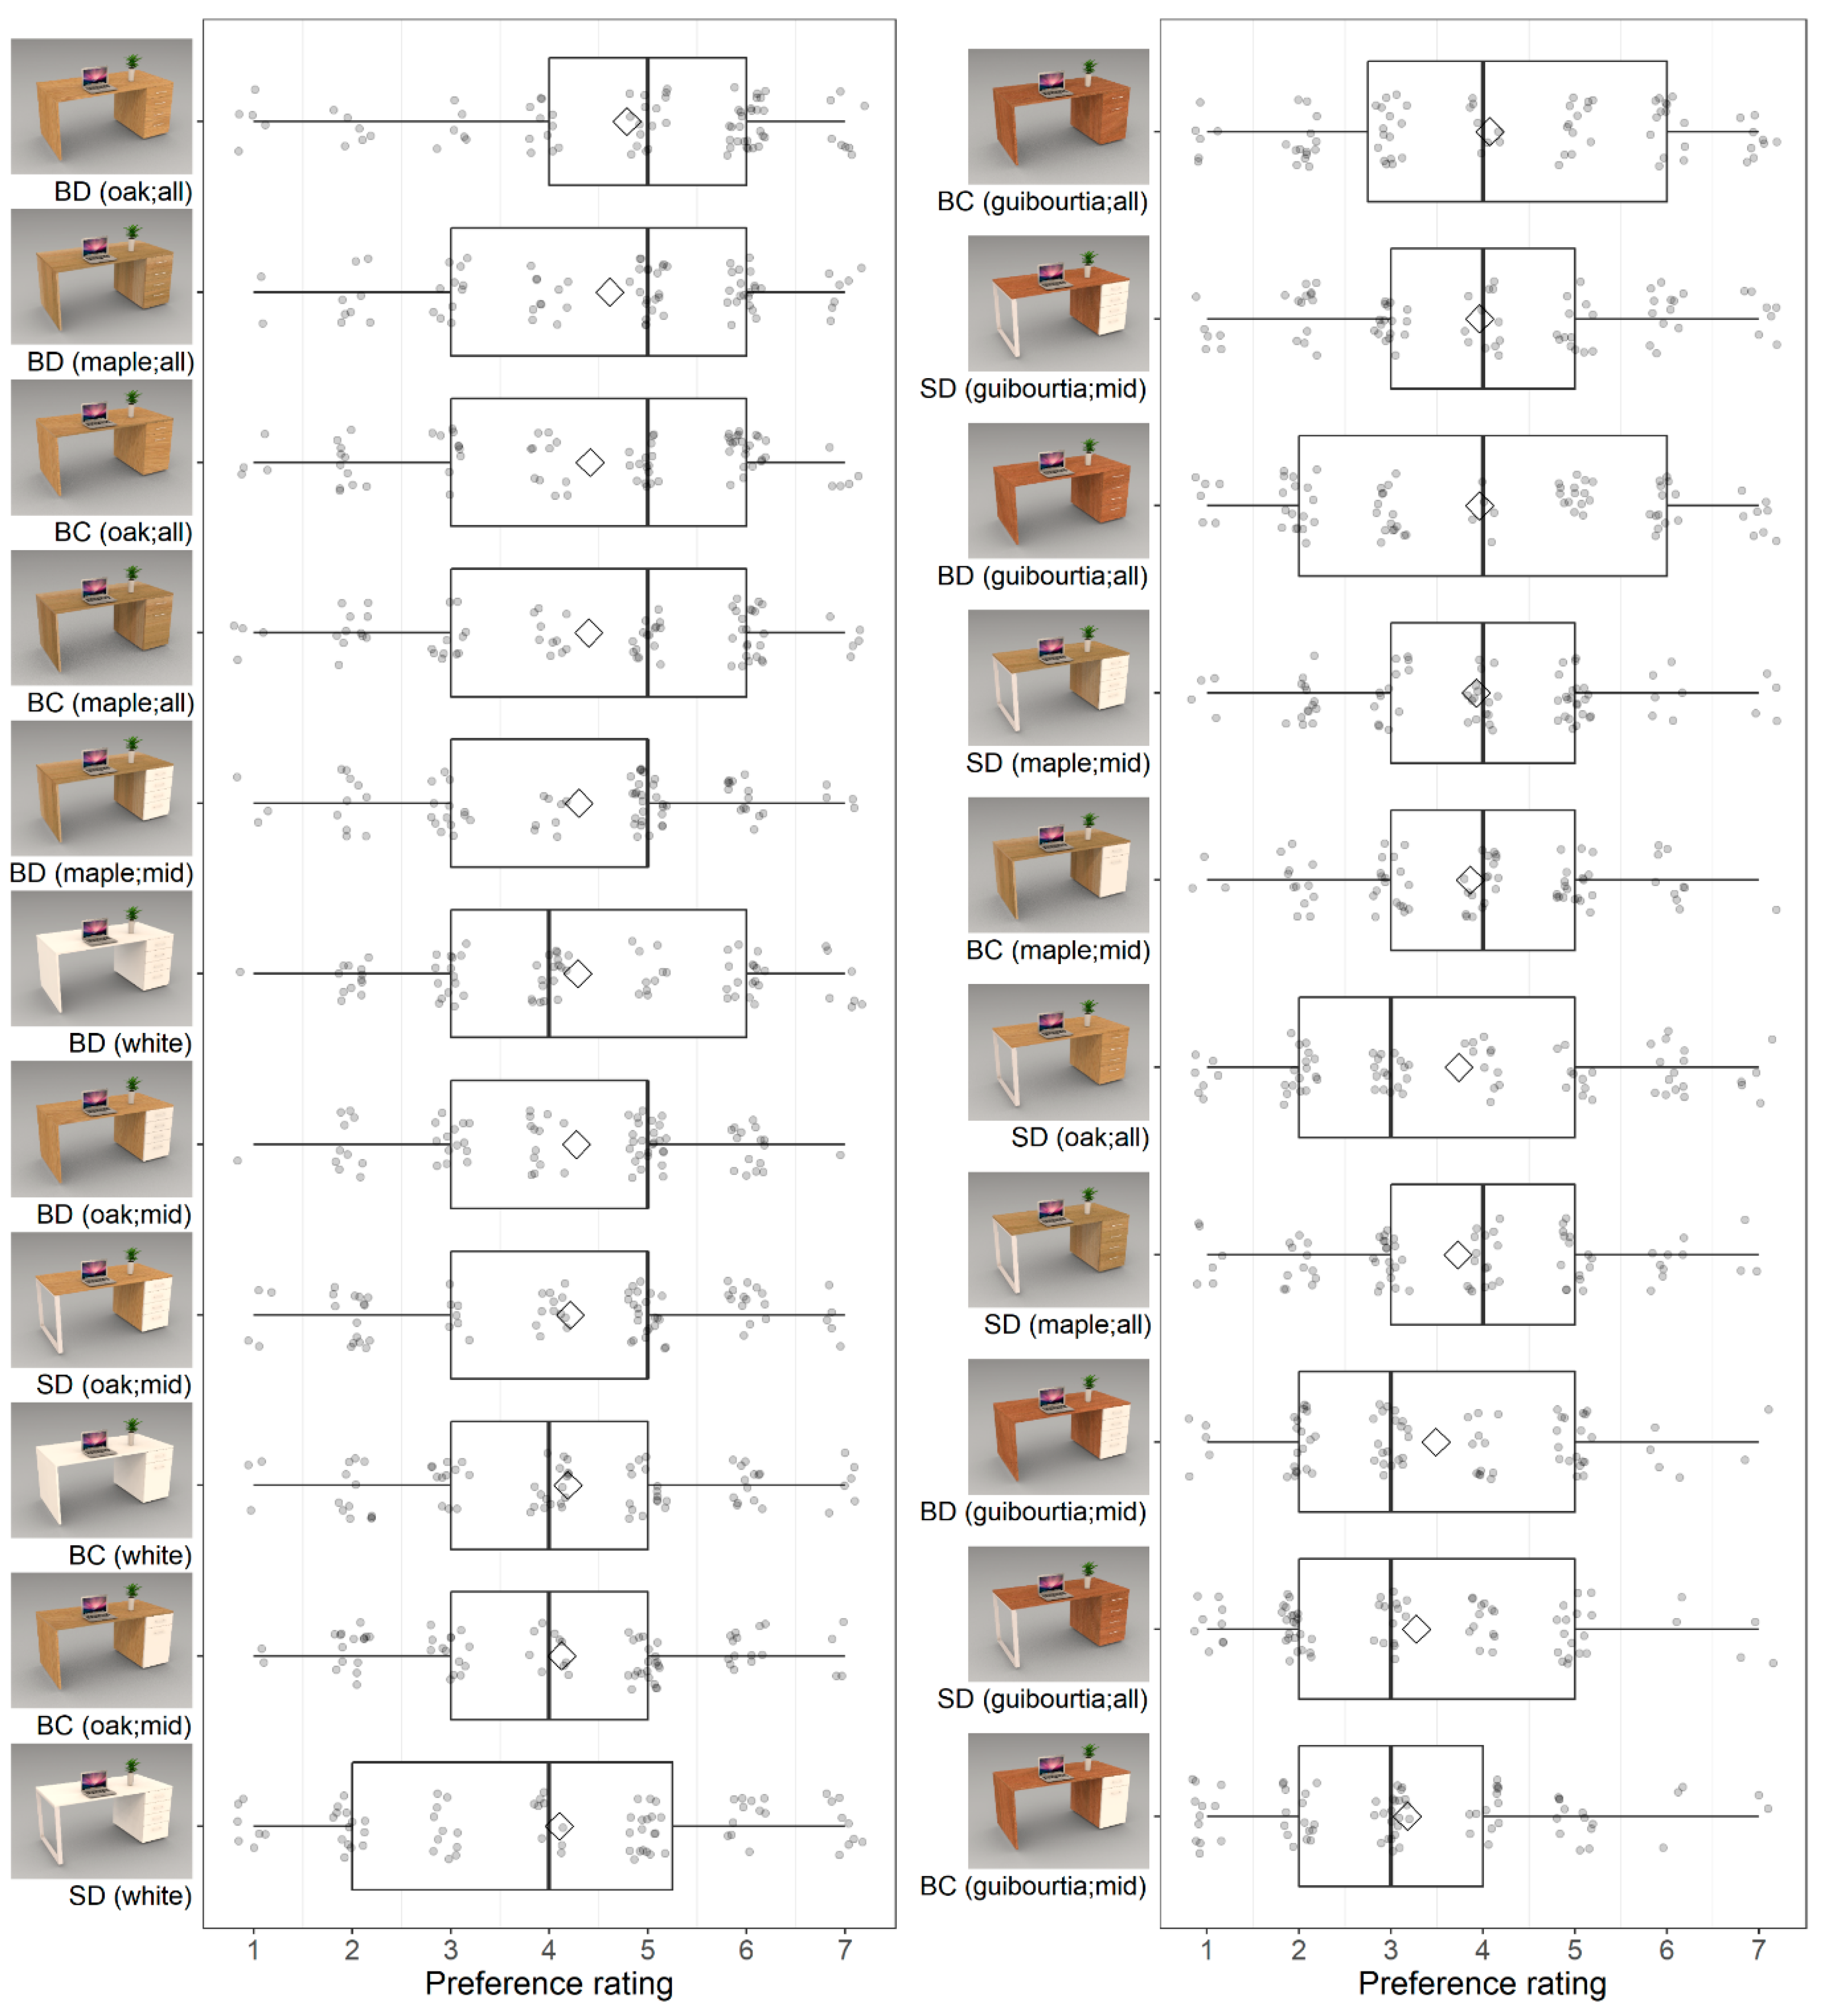
The desks received a relatively wide range of mean preference ratings—from slightly above 3 (“somewhat dislike”) to slightly below 5 (“somewhat like”) (Figure 5). The highest-rated desks were board-drawers made with oak, board-drawers made with maple, board-cabinet made with oak, and board-cabinet made with maple (all four desks completely made of wood), with mean preference ratings of 4.79 (SD = 1.69), 4.61 (SD = 1.57), 4.41 (SD = 1.70), and 4.40 (SD = 1.71), respectively. The lowest-rated desks were square-drawers made of maple (all wood) and three desks made of guibourtia—board-drawers (medium amount of wood), square-drawers (all wood), and board-cabinet (medium amount of wood)—with mean preference ratings of 3.73 (SD = 1.55), 3.49 (SD = 1.48), 3.28 (SD = 1.58), 3.18 (SD = 1.52), respectively.
The variability of individual preference ratings within the desks was typically high and spanned throughout the entire range of possible ratings for all desks, with one desk—board-drawers made entirely of guibourtia—displaying even more variability in preference ratings than the other desks.
The four highest-rated desks were all made entirely of wood, and they all contained the board element. All three white desks were among the highest-rated half of desks (i.e., top 11 desks), whereas all six desks made of guibourtia were among the lowest-rated half of desks (i.e., bottom 10 desks).
The model with individual desks as predictors and the preference rating as the outcome is presented in Table S13. Ninety-two comparisons of pairs of desks (out of the total of 210 comparisons) were statistically significant, mostly within pairs that included the two highest- and five lowest-rated desks, but also within pairs that included other desks (Table S14).

3.2.2. The Role of Material and Desk Design in Preference

The model examining the role of desk design and material in preference is presented in Table S15. Post hoc analysis of the role of materials in preference showed that maple (EP = 0.44, 95% CI [0.37, 0.51]), oak (EP = 0.48, 95% CI [0.40, 0.55]), and the white material (EP = 0.47, 95% CI [0.39, 0.55]) were similarly likely to be rated as liked, with no significant differences between them (maple − oak = −0.03, 95% CI [−0.09, 0.02], p = 0.196; maple − white = −0.02, 95% CI [−0.09, 0.04], p = 0.477; oak − white = 0.01, 95% CI [−0.05, 0.07], p = 0.732). Guibourtia (EP = 0.31, 95% CI [0.25, 0.38]) had a significantly lower probability of being rated as liked compared to all three remaining materials (guibourtia − maple = −0.13, 95% CI [−0.18, −0.08]; guibourtia − oak = −0.16, 95% CI [−0.21, −0.11]; guibourtia − white = −0.15, 95% CI [−0.21, −0.09]; all p < 0.001).
Post hoc analysis of the role of desk design in preference showed that the board-drawers desks (EP = 0.48, 95% CI [0.41, 0.55]) were more likely to be rated as liked than the board-cabinet desks (EP = 0.42, 95% CI [0.35, 0.49]; board-cabinet − board-drawers = −0.06, 95% CI [−0.11, −0.01], p = 0.012), and both desk designs were more likely to be rated as liked than the square-drawers desks (EP = 0.37, 95% CI [0.30, 0.44]; board-drawers − square-drawers = 0.11, 95% CI [0.07, 0.16], p < 0.001; board-cabinet − square-drawers = 0.05, 95% CI [0.01, 0.10], p = 0.027).

3.2.3. The Role of Wood Amount in Preference

Table S16 presents the model examining the role of wood amount in respondent preferences. Post hoc analysis showed that desks made entirely of wood (EP = 0.44, 95% CI [0.37, 0.51]) were rated similarly to desks without any wood (EP = 0.47, 95% CI [0.39, 0.55]; all wood − no wood = −0.03, 95% CI [−0.09, 0.03], p = 0.351), and both types of desks had a higher probability of being liked than desks with a medium amount of wood (EP = 0.39, 95% CI [0.32, 0.45]; all wood − medium wood = 0.05, 95% CI [0.01, 0.10], p = 0.011; medium wood − no wood = −0.08, 95% CI [−0.14, 0.02], p = 0.007).

3.3. Discussion

The highest-rated desk design was board-drawers, followed by board-cabinet and square-drawers, with the preference for each desk design differing significantly from the next. Maple, oak, and the white material were similarly liked, and they were all liked more than guibourtia. This somewhat contrasts with the results of two other studies, which observed that wood tends be more appealing to people than some other common materials when used for desktops [23] and handrails [28]. In these two studies, the participants were able to see and touch the materials, and the tactile experience may have contributed to the generally high preference for wooden materials. This could explain the somewhat diverging findings between these studies and the present study, in which the participants could only see the images of the materials. Another explanation may be that preferences for materials are context-specific. That is, people may prefer wood in some situations or for some products, but be ambivalent or prefer other materials for different uses.
The desks made entirely of wood were rated similarly to desks without any wood, and both types of desks were preferred to desks with a medium amount of wood (i.e., desks with mixed materials). The preference for wood coverage could thus be different for desks than for rooms, where the opposite trend was observed: a medium amount of wood in a room seemed to be preferred to a room furnished without any wood (i.e., white room) and a room made entirely of wood [30]. Alternatively, users may have preferred those desks less due to the specific way in which the materials were mixed, and not because of the specific amounts of the materials or the fact that the materials were mixed.
Because the rated desks were perfectly balanced in terms of features—they included all possible combinations of desk designs, wooden materials, and amounts of wood—we can easily compare the roles of the different features in the preference of desks. The highest-rated desk design (i.e., board-drawers) increased the probability of the desk being liked by about 11% relative to the lowest-rated design (i.e., square-drawers), whereas the presence of guibourtia decreased the probability of the desk being rated as liked by about 13–16% relative to the three higher-rated materials. This suggests that the material may play a slightly more important role in the overall evaluation of a desk than the desk design. It should be noted, however, that the desk designs in Study 2 were very similar; if they had differed substantially, their role may have been greater and more important than the role of the materials.
The desks made entirely of wood were about 6% more likely to be rated as liked than desks with a medium amount of wood. This suggests that the amount of wood plays a noticeable role in preference, but not necessarily as important as that of the materials and desk designs. As we are not aware of any studies examining a similar topic, we cannot compare our results with existing findings. Future studies are encouraged to build on our findings by investigating human preferences for desks consisting of different combinations of wooden materials and desk designs.

4. General Discussion

The two studies reported in this article show that human preferences for wooden materials and desks vary widely: any given material or desk tends to be (very) liked by some people and (very) disliked by others. Still, some wooden materials and desks are on average more preferred and can serve as a starting point for both designers and researchers who wish to understand how interior spaces impact the occupants.
Comparing the results of Study 1 and Study 2 reveals an interesting pattern. The top three wooden materials and desk designs in Study 1 had very similar preference ratings; however, when the same wooden materials and desk designs were tested in Study 2, their preference ratings clearly differed. In Study 2, guibourtia was rated noticeably lower than oak and maple, and the top three rated designs all received ratings that were significantly different from one another.
This pattern of results could be explained by possible differences in the use of the preference rating scale by the participants in the two studies. Study 1 included numerous and diverse wooden materials and desk designs, and it is not surprising that the variability of their visual characteristics led to variability in their preference scores. Because of this wide range of preferences, the rated items in Study 1 that were similar (but not the same) in terms of preference might have received the exact same rating, so the larger differences in preference could be properly captured by the scale. In contrast, Study 2 had fewer unique wooden materials and desk designs, which might have allowed participants to use the rating scale in a way that captured even the smaller differences in preference between the rated items (i.e., the differences that could not have surfaced in Study 1).
Another explanation for the pattern of results when comparing Study 1 and Study 2 is related to the presentation of the wooden materials and desk designs, which differed between the two studies. In Study 1, the participants rated a wooden material that would be used for a desk, whereas in Study 2 they rated a desk that incorporated the material. The rated desk designs were all made of the same material in Study 1, whereas they included different materials applied in different amounts in Study 2. The wooden materials and desk designs may interact, so that the preference for a specific wooden material or desk design depends significantly on other properties of the desk in which the material or design is applied.
Taken together, the results of both studies suggest that despite the variability of preference ratings, (1) people can discriminate between a variety of (sometimes similar) wooden materials and desks in terms of preference, and (2) preference for a particular desk cannot necessarily be predicted from separate preference assessments of the desk design and wooden material that comprise that desk.
The findings of the two studies can be seen as initial steps towards designing furnishings that are part of restorative indoor environments—pleasant, comfortable spaces that can positively impact human wellbeing. Visually appealing furnishings are likely an important element of restorative indoor environments, and desks are among the furnishings that might be used frequently, especially in offices. Future studies could build on our findings to not only expand our understanding of preference for different desk features, but also to examine preferences for other types of furnishings, and how different types of furnishings could be integrated into a coherent whole that occupants will find appealing.

5. Limitations

As we aimed to systematically vary the desk elements and their arrangements in the tested desks, the number of unique elements had to remain small to keep the total number of desks manageable for the study. As a result, the resulting desks were relatively simple in terms of design. We did not consider many desk design features that might influence human preference, such as material thickness, height-to-width ratio, or type of handles.
Because the appearance of the tested wooden materials varied widely, any notable patterns between wood colour properties and preference were unlikely to emerge (and did not).
Another limitation is related to the presentation of the rated items: the wooden materials and desk designs might have been perceived differently if seen in person rather than in images. This might be especially true for the rendered images of desks made of different wooden materials, where the quality of the rendering (instead of the actual appearance of the wood) may have influenced the results.
It should be noted that several of the rated items in our study yielded similar average scores. Even when the differences between the average scores of some items were statistically significant, the differences might be too small to translate into meaningful effects in real-world terms. Readers are urged to interpret our results while considering the specific rating scale employed in the study.

6. Summary and Conclusions

This study examined the preferences of people for different wooden desk materials, desk designs, and desks that combine different designs and materials. In general, the results show considerable variability in preference ratings, suggesting that no single material or desk can satisfy all tastes. Still, the results suggest that some wooden materials and desks are more liked than others, and that the material, design, and amount of wood all play an important role in preference. It seems that both-storage desks are less liked than both-stand and one-stand-one-storage desks, and that desks containing the shelf and poles elements are less liked than desks containing other elements (i.e., cabinet, drawers, square, board). Board-cabinet seems to be a particularly liked desk design. Some wooden materials—especially oak and maple—seem to be more liked than others, and some other materials—especially spruce, pine, and aspen—appear to be less liked than others. Desks with the white material were rated similarly to desks with oak and maple, and they were liked more than desks with guibourtia. The preference for the desk seemed to be higher when it was made entirely of wood or without any wood than when it was made with a medium amount of wood (i.e., when the materials were mixed).
As furniture is a relatively easy way to introduce natural materials to built environments, using wooden furniture for this purpose may make sense. Designers can take hints from our results, but they must be cautious to select or design furniture that matches the preferences of users, which we have shown vary considerably. Involving users in selecting their furniture may produce the best outcomes in terms of restorativeness.
We encourage future studies to systematically explore which indoor furnishings and features users prefer, and how the functional and design elements of the built environment are associated with the restorative qualities that they can provide.

Supplementary Materials

The following supporting information can be downloaded at: https://www.mdpi.com/article/10.3390/buildings13071680/s1, Figure S1: Wooden materials tested in the Study 1; Figure S2: Desk designs tested in Study 1; Figure S3: Relationship between the mean colour distances of materials (in reference to all other materials) and their preference ratings; Figure S4: Relationship between preference ratings and colour variability within materials; Figure S5: Desks tested in Study 2; Table S1: Summary statistics for wood preference scores; Table S2: Model with individual wooden materials as predictors and preference rating as the outcome (with aspen as the reference material); Table S3: Paired comparisons for preference of wooden materials; Table S4: Mean colour distances of wooden materials in relation to all other materials; Table S5: Mean Delta E values denoting colour variability within materials; Table S6: Summary statistics for desk preference scores; Table S7: Model with individual desk designs as predictors and preference rating as the outcome (with Board–Board as the reference desk); Table S8: Paired comparisons for preference of desks; Table S9: Model with arrangement of desk elements as predictors and preference rating as the outcome (with both-stand desks as the reference); Table S10: Model with specific desk elements (within both-storage desks) as predictors and preference rating as the outcome; Table S11: Model with specific desk elements (within both-stand desks) as predictors and preference rating as the outcome (with board as the reference element); Table S12: Model with specific desk elements (within one-stand-one-storage desks) as predictors and preference rating as the outcome (with board as the reference for stand elements, and cabinet as the reference for storage elements); Table S13: Model with specific desks as predictors and preference rating as the outcome; Table S14: Paired comparisons for preference of desks; Table S15: Model with material and desk design as predictors and preference rating as the outcome (with Board - Cabinet as the reference for desk designs and guibourtia as the reference for materials); Table S16: Model with wood amount and desk design as predictors and preference rating as the outcome (with Board–Cabinet as the reference for desk designs and “all” as the reference for wood amount); Supplementary Materials S1: The survey in Slovenian language; Supplementary Materials S2: The survey in English language

Author Contributions

Conceptualization, D.L.; methodology, D.L. and M.D.B.; formal analysis, D.L. and M.D.B.; investigation, D.L.; data curation, D.L.; writing—original draft preparation, D.L.; writing—review and editing, D.L. and M.D.B.; visualization, D.L. All authors have read and agreed to the published version of the manuscript.

Funding

The study was funded by the InnoRenew CoE project (Grant Agreement 739574) under the Horizon2020 Widespread-Teaming program and the Republic of Slovenia (Investment funding of the Republic of Slovenia and the European Union of the European Regional Development Fund), and the Slovenian Research Agency ARRS infrastructure program IO-0035. The APC was funded by the InnoRenew CoE project (Grant Agreement 739574).

Data Availability Statement

The datasets and the R analysis code are available online (https://doi.org/10.5281/zenodo.8097014).

Acknowledgments

The authors gratefully acknowledge the European Commission for funding the InnoRenew CoE project (Grant Agreement 739574) under the Horizon2020 Widespread-Teaming program and the Republic of Slovenia (Investment funding of the Republic of Slovenia and the European Union of the European Regional Development Fund), and the Slovenian Research Agency ARRS for funding the infrastructure program IO-0035. The authors would also like to express their gratitude to the owner of the website www.wood-database.com, who allowed the use of images of wood for the purposes of this study.

Conflicts of Interest

The authors declare no conflict of interest.

References

  1. Gillis, K.; Gatersleben, B. A Review of Psychological Literature on the Health and Wellbeing Benefits of Biophilic Design. Buildings 2015, 5, 948–963. [Google Scholar] [CrossRef] [Green Version]
  2. Mcsweeney, J.; Rainham, D.; Johnson, S.A.; Sherry, S.B.; Singleton, J. Indoor nature exposure (INE): A health-promotion framework. Health Promot. Int. 2015, 30, 126–139. [Google Scholar] [CrossRef] [PubMed] [Green Version]
  3. Kaplan, S. The Restorative Benefits of Nature: Toward an Integrative Framework. J. Environ. Psychol. 1995, 15, 169–182. [Google Scholar] [CrossRef]
  4. Danna, K.; Griffin, R.W. Health and well-being in the workplace: A review and synthesis of the literature. J. Manag. 1999, 25, 357–384. [Google Scholar] [CrossRef]
  5. Al Horr, Y.; Arif, M.; Kaushik, A.; Mazroei, A.; Katafygiotou, M.; Elsarrag, E. Occupant productivity and office indoor environment quality: A review of the literature. Build. Environ. 2016, 105, 369–389. [Google Scholar] [CrossRef] [Green Version]
  6. Van den Berg, A.E.; Koole, S.L.; Van der Wulp, N.Y. Environmental preference and restoration: (How) are they related? J. Environ. Psychol. 2003, 23, 135–146. [Google Scholar] [CrossRef]
  7. Hartig, T.; Staats, H. The need for psychological restoration as a determinant of environmental preferences. J. Environ. Psychol. 2006, 26, 215–226. [Google Scholar] [CrossRef]
  8. Burnard, M.D.; Nyrud, A.Q.; Bysheim, K.; Kutnar, A.; Vahtikari, K.; Hughes, M. Building material naturalness: Perceptions from Finland, Norway and Slovenia. Indoor Built. Environ. 2017, 26, 92–107. [Google Scholar] [CrossRef]
  9. Rice, J.; Kozak, R.A.; Meitner, M.J.; Cohen, D.H. Appearance Wood Products and Psychological Well-Being. Wood Fiber Sci. 2006, 38, 644–659. [Google Scholar]
  10. Lipovac, D.; Burnard, M.D. Effects of visual exposure to wood on human affective states, physiological arousal and cognitive performance: A systematic review of randomized trials. Indoor Built. Environ. 2020, 30, 1021–1041. [Google Scholar] [CrossRef]
  11. Shen, J.; Zhang, X.; Lian, Z. Impact of Wooden Versus Nonwooden Interior Designs on Office Workers’ Cognitive Performance. Percept. Mot. Skills 2020, 127, 36–51. [Google Scholar] [CrossRef]
  12. Burnard, M.D.; Kutnar, A. Human stress responses in office-like environments with wood furniture. Build Res. Inf. 2020, 48, 316–330. [Google Scholar] [CrossRef] [Green Version]
  13. Burnard, M.D.; Kutnar, A. Wood and human stress in the built indoor environment: A review. Wood Sci. Technol. 2015, 49, 969–986. [Google Scholar] [CrossRef]
  14. Nyrud, A.Q.; Bringslimark, T. Is interior wood use psychologically beneficial? A review of psychological responses toward wood. Wood Fiber Sci. 2010, 42, 202–218. [Google Scholar]
  15. Bamba, I.; Azuma, K. Psychological and Physiological Effects of Japanese Cedar Indoors after Calculation Task Performance. J. Hum. Environ. Syst. 2015, 18, 33–41. [Google Scholar] [CrossRef] [Green Version]
  16. Lipovac, D.; Podrekar, N.; Burnard, M.D.; Šarabon, N. Effect of desk materials on affective states and cognitive performance. J. Wood Sci. 2020, 66, 43. [Google Scholar] [CrossRef]
  17. Zhang, X.; Lian, Z.; Ding, Q. Investigation variance in human psychological responses to wooden indoor environments. Build. Environ. 2016, 109, 58–67. [Google Scholar] [CrossRef]
  18. Tsunetsugu, Y.; Yoshifumi, M.; Sato, H. Visual effects of interior design in actual-size living rooms on physiological responses. Build. Environ. 2005, 40, 1341–1346. [Google Scholar] [CrossRef]
  19. Tsunetsugu, Y.; Miyazaki, Y.; Sato, H. Physiological effects in humans induced by the visual stimulation of room interiors with different wood quantities. J. Wood Sci. 2007, 53, 11–16. [Google Scholar] [CrossRef]
  20. Ikei, H.; Song, C.; Miyazaki, Y. Physiological effects of touching wood. Int. J. Environ. Res. Public Health 2017, 14, 801. [Google Scholar] [CrossRef] [Green Version]
  21. Ikei, H.; Song, C.; Miyazaki, Y. Physiological effects of touching hinoki cypress (Chamaecyparis obtusa). J. Wood Sci. 2018, 64, 226–236. [Google Scholar] [CrossRef] [Green Version]
  22. Sakuragawa, S.; Miyazaki, Y.; Kaneko, T.; Makita, T. Influence of wood wall panels on physiological and psychological responses. J. Wood Sci. 2005, 51, 136–140. [Google Scholar] [CrossRef]
  23. Loredan, N.P.; Lipovac, D.; Jordan, S.; Burnard, M.D.; Šarabon, N. Thermal effusivity of different tabletop materials in relation to users’ perception. Appl. Ergon. 2022, 100, 103664. [Google Scholar] [CrossRef] [PubMed]
  24. Høibø, O.; Nyrud, A.Q. Consumer perception of wood surfaces: The relationship between stated preferences and visual homogeneity. J. Wood Sci. 2010, 56, 276–283. [Google Scholar] [CrossRef]
  25. Nyrud, A.Q.; Roos, A.; Rødbotten, M. Product attributes affecting consumer preference for residential deck materials. Can. J. For. Res. 2008, 38, 1385–1396. [Google Scholar] [CrossRef]
  26. Lipovac, D.; Burnard, M.D.; Sandak, A.; Sandak, J. Wood protection techniques and natural weathering: Their effect on aesthetics and preference of people. In Proceedings of the IRG Annual Meeting, Quebec City, QU, Canada, 12–16 May 2019; The International Research Group on Wood Protection: Stockholm, Sweden, 2019. [Google Scholar]
  27. Fujisaki, W.; Tokita, M.; Kariya, K. Perception of the material properties of wood based on vision, audition, and touch. Vision Res. 2015, 109, 185–200. [Google Scholar] [CrossRef]
  28. Lipovac, D.; Wie, S.; Nyrud, A.Q.; Burnard, M.D. Perception and evaluation of (modified) wood by older adults from Slovenia and Norway. Wood Fiber Sci. 2022, 54, 45–59. [Google Scholar] [CrossRef]
  29. Openshaw, S.; Taylor, E. Ergonomics and Design: A Reference Guide; Allsteel Inc.: Muscatine, IA, USA, 2006. [Google Scholar]
  30. Nyrud, A.Q.; Bringslimark, T.; Bysheim, K. Benefits from wood interior in a hospital room: A preference study. Archit. Sci. Rev. 2014, 57, 125–131. [Google Scholar] [CrossRef]
  31. Fell, D.R. Restorative Properties of Wood in the Built Indoor Environment. Ph.D. Thesis, The University of British Columbia, Vancouver, BC, Canada, 2010. [Google Scholar] [CrossRef]
  32. Zhang, X.; Lian, Z.; Wu, Y. Human physiological responses to wooden indoor environment. Physiol. Behav. 2017, 174, 27–34. [Google Scholar] [CrossRef]
  33. Demattè, M.L.; Zucco, G.M.; Roncato, S.; Gatto, P.; Paulon, E.; Cavalli, R.; Zanetti, M. New insights into the psychological dimension of wood–human interaction. Eur. J. Wood Wood Prod. 2018, 76, 1093–1100. [Google Scholar] [CrossRef]
  34. Nakamura, M.; Ikei, H.; Miyazaki, Y. Physiological effects of visual stimulation with full-scale wall images composed of vertically and horizontally arranged wooden elements. J. Wood Sci. 2019, 65, 55. [Google Scholar] [CrossRef]
  35. Bhatta, S.R.; Tiippana, K.; Vahtikari, K.; Hughes, M.; Kyttä, M. Sensory and emotional perception of wooden surfaces through fingertip touch. Front. Psychol. 2017, 8, 367. [Google Scholar] [CrossRef] [PubMed] [Green Version]
  36. Manuel, A.; Leonhart, R.; Broman, O.; Becker, G. Consumers’ perceptions and preference profiles for wood surfaces tested with pairwise comparison in Germany. Ann. For. Sci. 2015, 72, 741–751. [Google Scholar] [CrossRef] [Green Version]
  37. Overvliet, K.E.; Soto-Faraco, S. I can’t believe this isn’t wood! An investigation in the perception of naturalness. Acta Psychol. AMST 2011, 136, 95–111. [Google Scholar] [CrossRef] [PubMed]
  38. SketchUp Make. Available online: https://www.sketchup.com/ (accessed on 20 May 2021).
  39. Raylectron 4. Available online: https://raylectron.com/webver2/ (accessed on 20 May 2021).
  40. 1KA. Available online: www.1ka.si (accessed on 10 June 2021).
  41. Ooms, J. Magick: Advanced Graphics and Image-Processing in R. Available online: https://cran.r-project.org/package=magick (accessed on 20 December 2021).
  42. R Studio Team. R: A Language and Environment for Statistical Computing; R Foundation for Statistical Computing: Vienna, Austria, 2021; Available online: https://www.r-project.org/ (accessed on 14 December 2021).
  43. R Studio Team. RStudio: Integrated Development Environment for R; R Foundation for Statistical Computing: Vienna, Austria, 2021; Available online: https://www.rstudio.com/ (accessed on 14 December 2021).
  44. Kassambara, A. Rstatix: Pipe-Friendly Framework for Basic Statistical Tests; R Package Version 0.7.0; R Foundation for Statistical Computing: Vienna, Austria, 2020; Available online: https://cran.r-project.org/package=rstatix (accessed on 14 December 2021).
  45. Christensen, R.H.B. Ordinal-Regression Models for Ordinal Data; R Package Version 2019.12-10; R Foundation for Statistical Computing: Vienna, Austria, 2019. [Google Scholar]
  46. Lenth, R.V. Emmeans: Estimated Marginal Means, Aka Least-Squares Means. Available online: https://github.com/rvlenth/emmeans (accessed on 16 December 2021).
  47. Barthelme, S. Imager: Image Processing Library Based on ‘CImg’; R Package Version 0.42.11; R Foundation for Statistical Computing: Vienna, Austria, 2023; Available online: https://cran.r-project.org/package=imager (accessed on 20 December 2021).
  48. Weller, H. Colordistance: Distance Metrics for Image Color Similarity; R Foundation for Statistical Computing: Vienna, Austria, 2021; Available online: https://cran.r-project.org/package=colordistance (accessed on 20 December 2021).
  49. Davis, G. SpacesXYZ: CIE XYZ and Some of Its Derived Color Spaces; R Package Version 1.1-1. Available online: https://cran.r-project.org/package=spacesXYZ (accessed on 20 December 2021).
  50. Gohel, D. Flextable: Functions for Tabular Reporting. Available online: https://cran.r-project.org/package=flextable (accessed on 23 December 2021).
  51. Wilke, C.O. ggtext: Improved Text Rendering Support for ggplot2. Available online: https://wilkelab.org/ggtext/ (accessed on 23 December 2021).
  52. Auguie, B. GridExtra: Miscellaneous Functions for ‘Grid’ Graphics; R Package Version 2.3; R Foundation for Statistical Computing: Vienna, Austria, 2017; Available online: https://cran.r-project.org/package=gridExtra (accessed on 23 December 2021).
  53. Wickham, H.; Averick, M.; Bryan, J.; Chang, W.; McGowan, L.D.; François, R.; Grolemund, G.; Hayes, A.; Henry, L. Welcome to the {tidyverse}. J. Open Source Softw. 2019, 4, 1–6. [Google Scholar] [CrossRef] [Green Version]
  54. DeltaE Function—RDocumentation. Available online: https://www.rdocumentation.org/packages/spacesXYZ/versions/1.1-1/topics/DeltaE (accessed on 21 January 2022).
  55. Hunt, R.W. The Reproduction of Colour, 6th ed.; John Wiley & Sons: Chichester, UK, 2004. [Google Scholar] [CrossRef]
  56. Weller, H. Introduction [to the Colordistance R. Package]; R Foundation for Statistical Computing: Vienna, Austria, 2021; Available online: https://cran.r-project.org/web/packages/colordistance/vignettes/colordistance-introduction.html (accessed on 21 January 2022).
  57. Rubner, Y.; Tomasi, C.; Guibas, L.J. Earth mover’s distance as a metric for image retrieval. Int. J. Comput. Vis. 2000, 40, 99–121. [Google Scholar] [CrossRef]
  58. Clmm Function—RDocumentation. Available online: https://www.rdocumentation.org/packages/ordinal/versions/2019.12-10/topics/clmm (accessed on 21 January 2022).
  59. Tutz, G.; Hennevogl, W. Random effects in ordinal regression models. Comput. Stat. Data Anal. 1996, 22, 537–557. [Google Scholar] [CrossRef]
  60. Liou, P.Y.; Bulut, O. The Effects of Item Format and Cognitive Domain on Students’ Science Performance in TIMSS 2011. Res. Sci. Educ. 2020, 50, 99–121. [Google Scholar] [CrossRef]
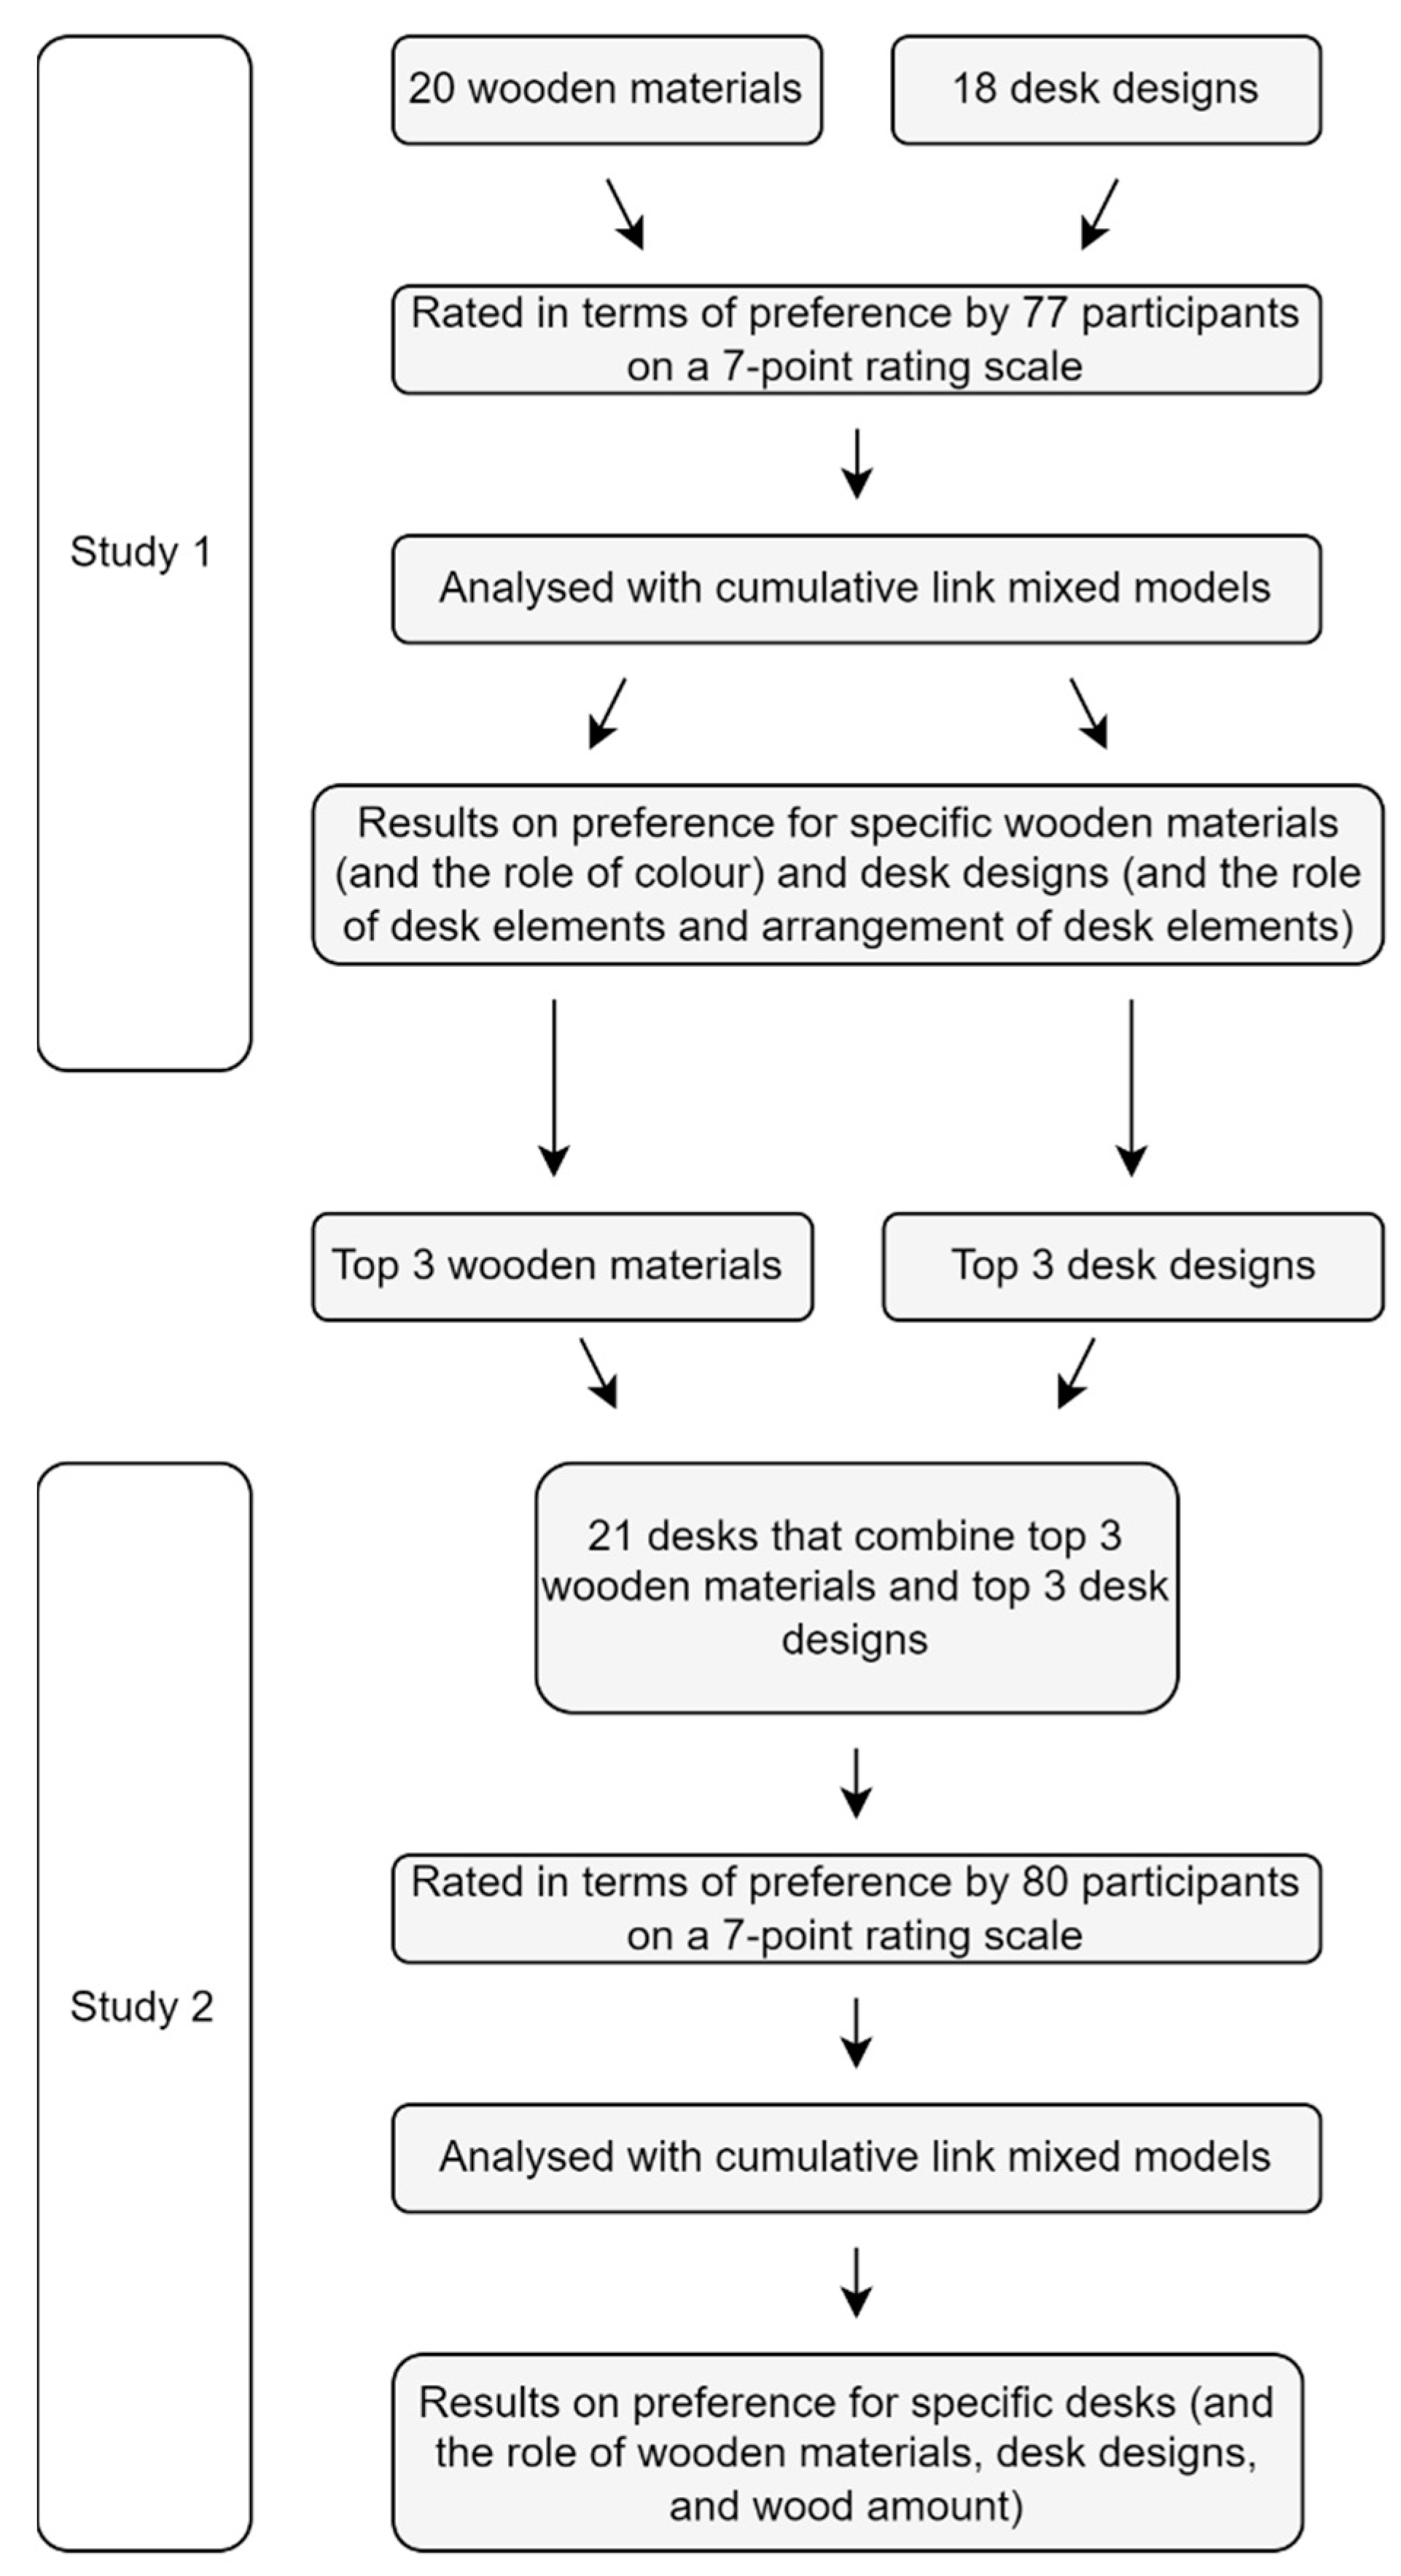
Figure 1. The methodology of the two studies presented in this article.
Buildings 13 01680 g001
Figure 2. Preference ratings for wooden materials (ordered from the highest to lowest mean preference rating, represented with the diamond shape).
Buildings 13 01680 g002
Figure 3. Colour distance between wooden materials (higher number/browner colour indicates a larger distance between colours).
Buildings 13 01680 g003
Figure 4. Preference ratings of desk designs (ordered from the highest to lowest mean preference rating, represented with the diamond shape).
Buildings 13 01680 g004
Figure 5. Preference ratings of desks (ordered from the highest to lowest mean preference rating, represented with the diamond shape). “BD” = board-drawers, “BC” = board-cabinet, “SD” = square-drawers; “Mid” = medium amount of wood, “All” = all wood.
Buildings 13 01680 g005
Disclaimer/Publisher’s Note: The statements, opinions and data contained in all publications are solely those of the individual author(s) and contributor(s) and not of MDPI and/or the editor(s). MDPI and/or the editor(s) disclaim responsibility for any injury to people or property resulting from any ideas, methods, instructions or products referred to in the content.