Article

CO2 Emission Allocation for Urban Public Buildings Considering Efficiency and Equity: An Application at the Provincial Level in China

School of Economics and Management, Beijing Jiaotong University, Beijing 100044, China
*
Author to whom correspondence should be addressed.
Buildings 2023, 13(6), 1570; https://doi.org/10.3390/buildings13061570
Submission received: 16 May 2023 / Revised: 19 June 2023 / Accepted: 19 June 2023 / Published: 20 June 2023
(This article belongs to the Special Issue Energy Efficiency and Carbon Neutrality in Buildings)

Abstract

:
China is currently recognized as the leading global energy consumer and CO2 emitter. A significant amount of carbon emissions can be attributed to urban public buildings. Establishing an equitable and efficient carbon emission allocation mechanism is a crucial step to meeting the ambitious targets in China’s 2030 carbon peak plan. In this study, we estimate the total amount of CO2 emissions from urban public buildings by 2030 and propose a preliminary scheme of carbon quota assignment for each province. By means of applying the zero-sum gains data envelopment analysis (ZSG-DEA) model, the carbon emission quotas allocation of urban public buildings in China’s 30 provinces is proposed, and the corresponding pressure to reduce provincial carbon emissions is analyzed. The results indicate that Qinghai has the lowest carbon emission rate (0.01%) for urban public buildings, while Guangdong has the highest (9.06%). Among the provinces, Jiangsu, Jiangxi, and Tianjin face the least pressure in reducing carbon emissions from urban public buildings. On the other hand, Hebei, Beijing, and Anhui are under great pressure to decrease carbon emissions. Notably, Hebei is predicted to have the highest emission reduction requirement of 95.66 million tons. In terms of pressures on carbon emissions reduction for urban public buildings, Jiangsu, Jiangxi, and Tianjin exhibit the least pressure. Hebei, Beijing, and Anhui are facing intense pressure to decrease carbon emissions. These findings offer policymakers valuable insights into developing a fair and efficient carbon allowance allocation strategy, while also contributing to China’s efforts to mitigate carbon emissions and combat climate change.

1. Introduction

Greenhouse gases are widely recognized as the primary contributors to climate change [1]. The control of greenhouse gas emissions and mitigation of global warming are not only a concern for developed countries, but also for developing countries. In 2015, over 190 parties signed the United Nations Framework Convention on Climate Change in Paris (UNFCCC). This international agreement stipulates that the average global temperature growth should not exceed preindustrial levels by 2 °C, and preferably 1.5 °C [2].
As the world’s largest developing country, China has grown into the world’s top consumer of energy and carbon emissions producer [3]. China released 28% of the world’s total carbon emissions in 2017, which is significantly more than the United States, the second-largest emitter, which contributed only 15% [4]. China has taken significant measures to address climate change by presenting remarkably ambitious Intended Nationally Determined Contributions (INDCs) as part of the Paris Agreement [5]. By 2030, China has pledged to reduce carbon intensity by 60% to 65% from 2005 levels [6] and achieve carbon neutrality no later than 2060 [7]. The Action Plan for Peaking Carbon Dioxide by 2030 was released by China in 2021 in order to provide policy direction for the execution of various peaking carbon efforts and promote the achievement of the peaking carbon objective [8].
Buildings are a major source of both energy consumption and CO2 emissions. In 2019, buildings’ energy consumption in China amounted to approximately 1.11 billion tons of standard coal, leading to total carbon emissions of around 2.2 billion tons, which accounted for approximately 22% of the entire carbon emissions in China [9]. In 2018, the overall building area in China encompassed about 60.1 billion square meters, with approximately 12.8 billion square meters of urban public buildings accounting for 21.3% of the total building area [10]. The average annual building completion area increased by about 2.5 billion square meters from 2014 to 2018, with urban public areas accounting for about 33%. The urban public building area per capita rose from 9 square meters in 2001 to 15 square meters in 2018 [11]. Nevertheless, there remains ample room for future growth as it still lags behind the levels observed in developed countries.
Urban public buildings play a pivotal role as crucial venues for various activities, and their significant energy consumption throughout their lifecycle, including construction, operation, maintenance, and dismantling, has made carbon dioxide emissions from these buildings a focal point for emission reduction targets. It is imperative to reduce carbon dioxide emissions from urban public buildings to achieve China’s carbon reduction goals. Among the array of strategies for emission reduction, carbon trading is widely acknowledged as one of the most effective methods [12]. Therefore, it is of paramount importance to research methods that incentivize the participation of urban public buildings in carbon trading, particularly through the equitable allocation of carbon dioxide emission quotas.
However, many studies have focused solely on the fairness or efficiency of carbon emission allocation, overlooking the importance of considering both aspects. For instance, Serrao et al. [13] employed a data envelopment analysis approach to redistribute agricultural greenhouse gas emissions among EU15 countries. Park et al. [14] employed the Boltzmann distribution, which takes efficiency into account, to allocate permits in carbon emissions trading. Meng et al. [15] considered the fairness principle and employed a three-indicator allocation model to measure the provincial quota allocation for carbon emissions in China’s electric power sector. Jin et al. [16] investigated the allocation plan of carbon emission allowances among each province in China based on a two-stage DEA model. However, given the varying technological development levels and different stages of development across different regions, as well as the diverse emission reduction targets set for different regions, a research approach that solely emphasizes fairness or effectiveness appears insufficiently comprehensive and integrated. To establish a rational carbon emission allocation mechanism, we contend that both fairness and effectiveness principles should be simultaneously considered.
Furthermore, scholars have extensively researched energy consumption analysis and carbon emission measurement in the context of public buildings. Huang et al. [17] employed the life cycle assessment approach to evaluate the achievements of public buildings in Shenzhen by quantifying the reduction of CO2 emissions over the past decades. Qian et al. [18] empirically investigated the carbon emissions of public infrastructure and their influence on the global greenhouse effect. You et al. [19] conducted a study on the carbon dioxide emissions from public and commercial buildings in China, analyzing the temporal and spatial changes as well as the driving factors of CO2 emissions. Li et al. [20] examined the interoperability between energy simulation and building information modeling (BIM) tools, focusing on simulating the total energy consumption during the operational phase of buildings. The study compared the predicted total energy consumption with the actual monitored data to evaluate the accuracy of the simulation results. Liu et al. [21] and Huang et al. [22] developed a support vector machine (SVM) model for predicting and diagnosing the total energy consumption in public buildings. Yue et al. [23] utilized a dynamic life cycle model to accurately calculate the carbon footprint of hospital buildings, which provides a basis for developing energy conservation and emission reduction plans.
It is evident that only a limited number of studies have examined the allocation of carbon emission quotas at the provincial level, with a specific focus on urban public buildings. Gan et al. [9] conducted a comparison between provincial allocation results derived from the ZSG-DEA model and the fixed cost allocation model. They further utilized these models to develop an allocation scheme for carbon emission quotas in China’s public buildings. Zhang et al. [24] employed the SBM-DEA model to allocate carbon emission quotas for public buildings across different provinces, with the aim of achieving carbon reduction targets. Therefore, there exists a research gap in the current literature regarding the allocation of carbon emission quotas at the provincial level, particularly in the context of urban public buildings.
This paper addresses the research gap by examining how to allocate carbon quotas among urban public buildings in provinces. The objective is to develop a scientifically rigorous allocation mechanism with the objective of determining the optimal interprovincial distribution of carbon quotas for urban public buildings in China. By doing so, we aim to provide informed guidance to policymakers and promote the sustainable and low-carbon development of urban public buildings. Firstly, we predicted the overall carbon emission of urban public buildings in 2030 and formulated an initial scheme for carbon quota distribution for each province. Then, we transformed the traditional model referred to by Lins et al. [25] into a novel zero-sum gain data envelopment analysis (ZSG-DEA) model, which maintains the constant total amount concept while simultaneously achieving the best input and output efficiency. Subsequently, in accordance with principles of both equality and efficiency, we utilized the ZSG-DEA approach to appraise the comprehensive efficiency of the above-mentioned allocation outcomes. In the adjustment of carbon emission allowances, the quota allocation among provinces is typically considered a zero-sum game, implying that an increase in the quota allowances for one province would lead to a corresponding decrease in the allocation for another province. The state of Pareto efficiency is achieved and the final allocation results are obtained.
Urban public buildings’ carbon emission quota allocation can serve as an incentive for provinces to collaborate in achieving carbon emissions peak targets, effectively controlling carbon emissions in public buildings, and attaining energy conservation and emission reduction objectives. Additionally, it can provide policy guidance and support for carbon trading market quota allocation.
This study has made the following contributions.
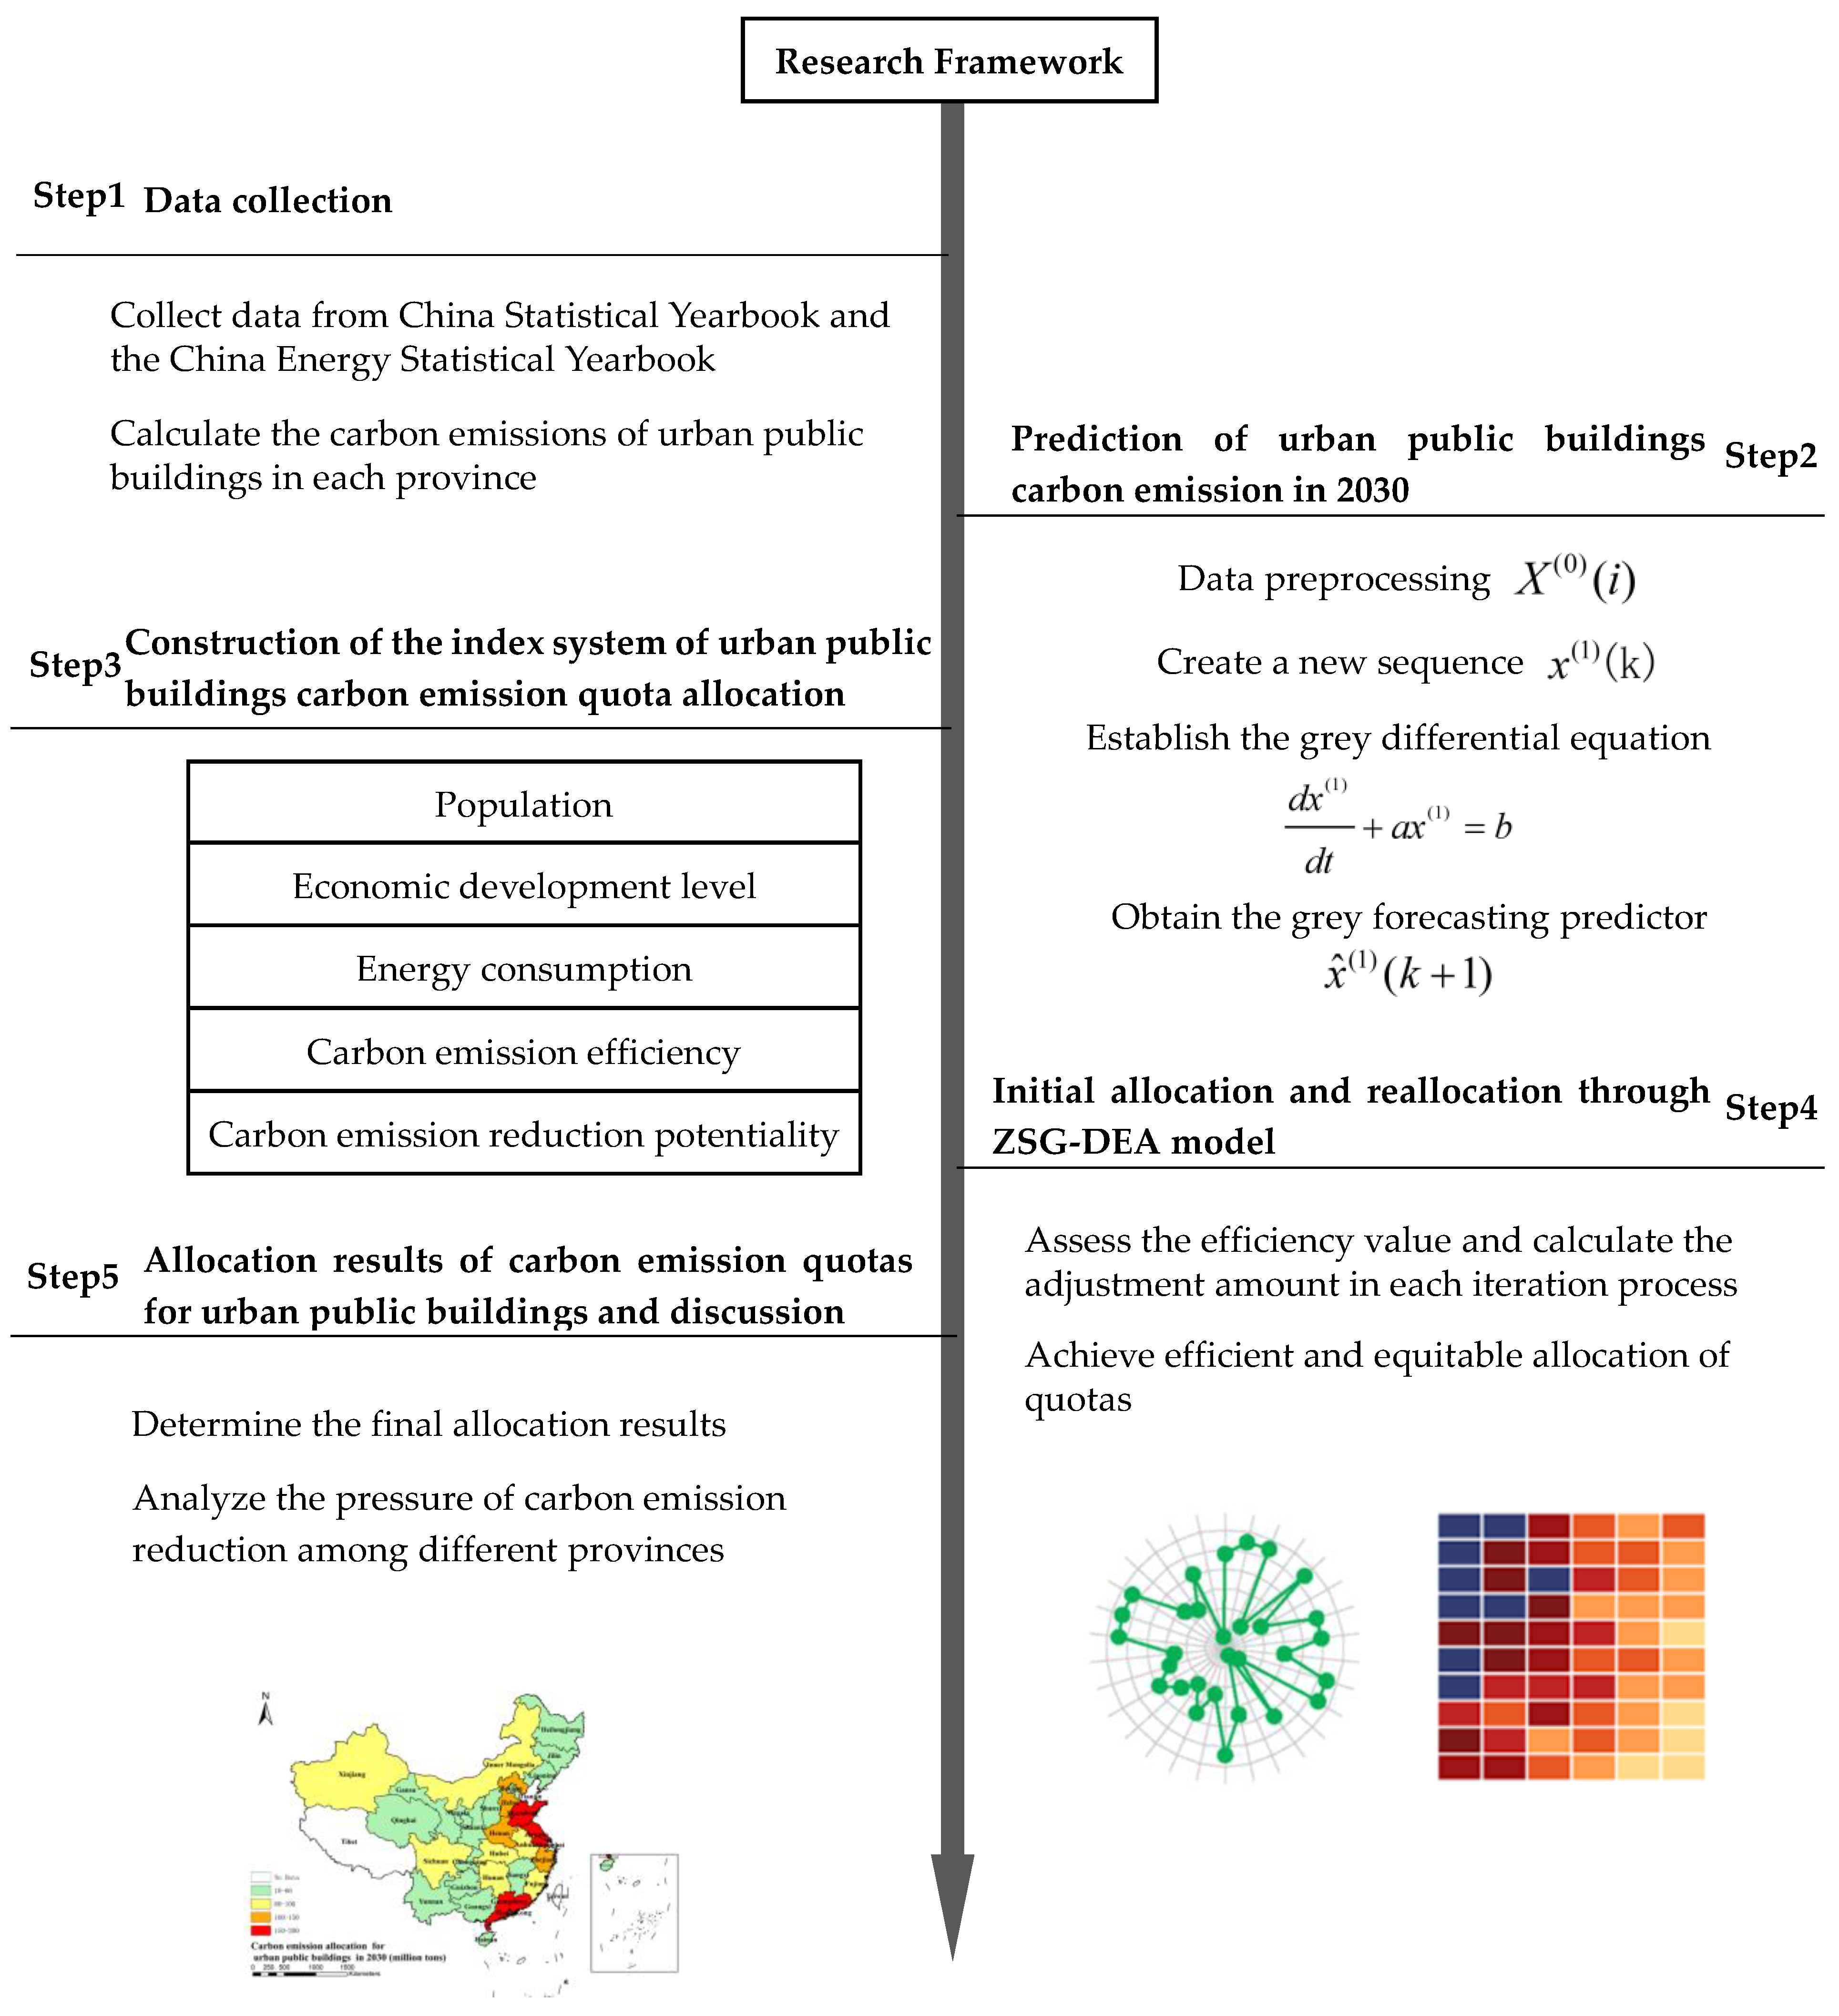
  • Many earlier studies in the field of carbon emission allocation have concentrated on the distribution of CO2 emissions among provinces primarily. However, we have directed our attention to carbon emission allocation in provincial public buildings, and fill the gap created by the lack of studies shedding light on carbon emission allocation in the public building sector. We developed an optimal scheme for carbon emission allocations in provincial urban public buildings in China which provides a clear and effective strategy for reducing carbon emissions in these buildings.
  • We have developed a ZSG-DEA model which takes into account the actual performance of each region in achieving its carbon emission goals. Compared to other models of previous research, this model gives more attention to the overall regional efficiency and allows for the reward of regions that achieve optimal performance in reducing their carbon emissions while penalizing those that do not meet the fixed target.
  • This study not only proposes an innovative scheme for carbon emission allocations in provincial urban public buildings but also provides significant policy recommendations for provincial-level allocation quotas for urban public buildings. It is significant in addressing China’s serious challenge of decreasing carbon emissions.
The rest of this paper is structured as follows. Section 2 examines significant research on the allocation of carbon emission allowances. Section 3 describes the methods and data source. Section 4 shows the results and discussion. Finally, the summary of the key findings and the policy recommendations are presented in Section 5.

2. Literature Review

2.1. Equity and Efficiency in Carbon Emission Allocation

In recent years, there has been a considerable body of research on low-carbon development, with scholars focusing their attention on carbon emission allowances and showing a particular interest in the choosing of appropriate principles and approaches. In order to tackle climate change, the UNFCCC [26] emphasizes equality principles and proposes a framework of “shared but distinct responsibilities”. The principle of equity is a broad concept that encompasses several criteria, including equality, historical responsibility, carbon emission abatement capability, and grandfathering [27].
In the recent literature, the equity principle has been explored through various indicators. Pan et al. [28] have proposed an allocation plan based on equal cumulative carbon emissions per person, emphasizing the notion of equality. Similarly, Ye et al. [29] utilize the population indicator to reflect the concept of equality. Fang et al. [30] employ a multi-criteria allocation approach for 30 provinces using an enhanced ZSG-DEA model, incorporating GDP and historical carbon emissions as measures of equity. Zhang et al. [31] put forth a regional CO2 allocation scheme that aligns with the principle of equality. Furthermore, Han et al. [32] and Qin et al. [33] have considered indicators such as per capita GDP, historical CO2 emissions, and CO2 emissions per unit of industrial added value as indicators to represent the principle of equality. It can be seen that when it comes to the issue of fairness in carbon emission allocation, researchers frequently take population size, economic status, and historical carbon emissions into account.
As research advances and our knowledge deepens, these studies continue to enhance our comprehension of the equity in carbon emission allocation. However, it becomes increasingly apparent that the concept of absolute fairness in the allocation of carbon emissions does not necessarily serve the best interests of all nations and regions [4]. While the equity principle considers all regions, it lacks efficiency as it fails to incentivize provinces with low carbon emissions or constrain those with high emissions, thereby limiting overall efficiency. Therefore, efficiency should be a crucial principle to consider when allocating carbon emission allowances [34]. The objective of this principle is to optimize society’s overall carbon emission efficiency, where regions that produce greater output with lower emissions ought to be granted a greater number of allowances [35]. The allocation of carbon emissions is primarily based on DEA-based efficiency measurements that reflect the production efficiency of countries or regions. This evaluation method offers a more comprehensive reflection of production factors and enables a detailed assessment of a country’s or region’s efficiency [36].

2.2. Data Envelopment Analysis (DEA) Model

The data envelopment analysis (DEA) model, which was first developed by Charnes [37], has gained extensive application in the distribution of resources, particularly when the input or output remains constant [38]. This method is categorized into two types: input-oriented models and output-oriented models. It is primarily utilized to evaluate the effectiveness of decision-making units (DMUs) that contain numerous inputs and outputs. The DEA model has been widely adopted by numerous scholars in their research on carbon emission allocation, serving as a valuable tool for evaluating the efficiency of carbon emission quotas. Lozano et al. [39] proposed a three-stage DEA method which involves maximizing the total desirable outputs, minimizing the total undesirable emissions, and minimizing the consumption of input resources, in order to reallocate emission permits.
The overall quantity of CO2 emissions must stay within certain limits due to the establishment of carbon emission goals by countries and regions. Consequently, determining how to achieve maximum efficiency in carbon emission allocation remains a significant challenge. The ZSG-DEA model, introduced by Lins et al. [25], is a suitable approach to address this issue. The ZSG-DEA follows procedures that resemble a game with a zero-sum outcome, where a gain for one side corresponds to a loss for the other, but the total allotment of resources remains constant [40]. This model is easy to implement and enables the maximization of overall efficiency by adjusting the quotas to their maximum potential [41]. Gomes and Lins et al. [42] employed the ZSG-DEA model to analyze a case study on carbon emissions. Chiu et al. [43] investigated the reallocation of carbon emission allowances among the European Union’s 24 members by applying the ZSG-DEA model. Xiong et al. [44] developed a weighted ZSG-DEA model to assess the allocation of energy consumption for every province. Furthermore, The appraisal of carbon emission allowances at a provincial level has been carried out by various scholars using the ZSG-DEA model. For instance, Cai et al. [45] utilized the ZSG-DEA model to allocate emission allowances throughout China’s 30 provinces. Yang et al. [46] assessed carbon emission allocation schemes in China through the ZSG-DEA model. Cui et al. [47] and Fang et al. [30] redistributed carbon emission quotas among China’s 30 provinces using the ZSG-DEA model. Song et al. [48] integrated the fairness principle into the ZSG-DEA model with the aim of improving the efficiency of carbon emission quotas and creating a more equitable allocation scheme among provinces. However, it is worth noting that the existing literature in this field predominantly focuses on either fairness or efficiency, with limited consideration given to the integrated principles of fairness and efficiency. By combining these two principles, not only can the equitable allocation of resources be ensured, but also the enhancement of carbon emission reduction efficiency can be promoted. Therefore, this study adopts a holistic approach that incorporates both fairness and efficiency considerations. By taking into account indicators such as population, economy, and historical carbon emissions, the ZSG-DEA model is employed to explore the allocation of carbon emission quotas for urban public buildings in 30 provinces in China.

3. Methodology and Data Sources

Due to significant disparities in development among different regions in China, the allocation of carbon emission quotas for urban public buildings should be coordinated and harmonized. The allocation process is illustrated in Figure 1. First, the research data were collected from China Statistical Yearbook and the China Energy Statistical Yearbook. Next, the carbon emissions from urban public buildings in China for the year 2030 were predicted using the GM (1,1) model. Subsequently, adhering to the principles of fairness and efficiency, and considering factors such as population, economic development, and energy consumption in each province, the iteration and reallocation results were carried out using the ZSG-DEA model. Lastly, analysis and discussion were conducted on the allocation results of carbon emission quotas for urban public buildings and the pressure to reduce emissions.

3.1. Methodology

DEA is a linear programming technique that was first introduced in 1978 by Charnes [37]. It is widely utilized to assess the effectiveness of homogenous collections of decision-making units (DMUs). The conventional DEA model makes the assumption that all inputs and outputs of all decision-making units are independent of one another and have no impact on other activities. However, the entire quantity of a certain input or output is constant in the allocation field. If a specific DMU’s input or output increases, it will result in a decrease in other DMUs’ input or output; this renders the typical DEA model ineffective. Consequently, Lins et al. [42] proposed the ZSG-DEA model. The ZSG-DEA model reconfigures the inputs and outputs of DMUs to achieve new targets for all DMUs while keeping the sum of the changing variables constant [4]. This feature enables the ZSG-DEA model to be more suitable for resource-constrained research, such as carbon emission allocation.
Input-oriented models are used to measure the efficiency of decision-making units. If  D M U 0  is not technically efficient, it is assigned an efficiency value  φ 0  under the ZSG-DEA model. To become DEA efficient, the  D M U 0  must decrease its input  k  by a certain amount  u 0 = x 0 k ( 1 φ 0 ) . This decreased amount is then allocated proportionally to the other  D M U . The value  k  of allocation that  D M U i  obtained from  D M U 0  is
x i k i 0 x i k · x 0 k 1 φ 0
Since the percentage of input is being decreased simultaneously by each  D M U , after all adjustments are completed, the redistribution of input  k  to  D M U i  is
x i k = i 0 X i x i k i 0 x i k · x 0 k 1 φ 0 x i k 1 φ i , i = 1 , 2 , 3 , , N
The input-oriented BCC model employs the ZSG-DEA approach to assess the relative efficiency of  D M U 0 . The result [49] is shown in Equation (3).
In the original model, all non-DEA-efficient DMUs allocate their excess inputs proportionally to achieve DEA efficiency. However, the consequence of doing so for all DMUs is that some DMUs still fail to achieve DEA efficiency after abating their inputs, even according to Equation (3). There are two approaches to address this problem: the proportional abatement formula method [25] and the iterative method [50]. In this study, the iterative method is used, and multiple redistributions of the input k can be achieved through multiple iterations. Eventually, all DMUs will attain the effective boundary, that is, all DMUs will be 100% effective. The result of the reallocation of inputs at this point is the allocation scheme that makes the best efficiency.
  min φ 0 s . t . i = 1 N λ i y i j y 0 j , j = 1 , 2 , 3 , , M i = 1 N λ i x i k 1 + x 0 k 1 φ 0 i 0 x i k φ 0 x 0 k , k = 1 , 2 , 3 , , R i = 1 N λ i = 1 , i = 1 , 2 , 3 , , N λ i 0 , i = 1 , 2 , 3 , , N
In the economic-environmental system, carbon emissions are non-desired outputs. The DEA-based environmental efficiency evaluation model offers several methods to handle non-desired outputs, including the main idea of “treating non-desired outputs as inputs”. This approach aligns with the DEA model’s requirements for input indicators, where the lower the input and the higher the desired output, the more efficient the technology is deemed to be. Similarly, in this study, we employed this approach and served carbon emissions as the input variable of the model.
Gomes et al. [42] have utilized GDP, population, and energy consumption as output variables. Choosing GDP as the desired output associated with carbon emissions is more comprehensible. Considering population as the desired output suggests that regions with larger populations are more efficient in terms of GDP when they maintain the same level of carbon emissions between regions. Moreover, selecting energy consumption as the desired output implies that regions with lower levels of carbon emissions are more efficient when they maintain comparable levels of energy consumption between regions.
The GM (1,1) model, which was first introduced by Deng in 1982, is a time series prediction model [51]. The GM (1,1) model employs a single input variable and differential equations distinct from first-order ones [52], allowing it to generate predictions for unavailable or incomplete time series data by analyzing existing information. It is frequently utilized to estimate population and has been widely applied in predicting resources and emissions [53]. Due to a lack of officially ordered and uniformly spaced statistics on GDP, population, and energy consumption for 2030, there is a strong demand for reliable prediction models to forecast these crucial variables. Therefore, this study adopts the GM (1,1) model to predict these indicators.
The formulas are as follows:
Step 1: Data preprocessing. This step involves the collection and preprocessing of the input data. Let the original data sequence be  X ( 0 ) ( i ) , where  i  denotes the  i   th  sample. Additionally, the raw sequence of  n  samples is defined as
X ( 0 ) = x ( 0 ) ( 1 ) , x ( 0 ) ( 2 ) , , x 0 n , x ( 0 ) ( k ) > 0 ,   k = 1 , 2 , 3 , , n
Step 2: Create a new sequence from the original data sequence. Using the accumulated generating operation (AGO), generate a new sequence  X ( 1 ) .
X ( 1 ) = x ( 1 ) ( 1 ) , x ( 1 ) ( 2 ) , , x ( 1 ) n
The  x ( 1 ) ( k )  is calculated in the following way:
x ( 1 ) ( k ) = i = 1 n x ( 0 ) ( i ) , k = 1 , 2 , 3 , , n
Step 3: Establish the grey differential equation. Transform the original data sequence into a first-order differential equation to approximate the time series using an exponential function. This results [54] in the grey differential model, which is represented as
d x ( 1 ) d t + a x ( 1 ) = b
where a and b are the development coefficient and grey input, respectively, obtained through least squares estimation using Equations (8) and (10). Parameter â is represented
a ^ = ( B T B ) 1 B T Y
where
B = z ( 1 ) ( 2 ) 1 z ( 1 ) ( 3 ) 1 z ( 1 ) ( n ) 1 , z ( 1 ) = ( z ( 1 ) ( 2 ) , z ( 1 ) ( 3 ) , , z ( 1 ) ( n ) )
In Equations (8) and (9),  B  is the accumulation matrix of the interval-type accumulated generating sequence, where the element in  B  is
z ( 1 ) ( k ) = 1 2 x ( 1 ) ( k ) + x ( 1 ) ( k 1 ) , k = 2 , 3 , , n
and
Y = x ( 0 ) ( 2 ) x ( 0 ) ( 3 ) x ( 0 ) ( n )
Step 4: Obtain the grey forecasting predictor by substituting the estimated parameters obtained from Equations (8) to (11) into Equation (7). The resulting equation [55] is
x ^ ( 1 ) ( k + 1 ) = ( x ( 1 ) ( 0 ) b a ) e a k + b a ,   k = 1 , 2 , 3 , , n
where  x ^ ( 1 ) ( k + 1 )  represents the predicted value of the future  k + 1  time point of the time series. a is the development coefficient of the GM (1,1) model, b is the gray input data, k is the prediction step, and  x ( 1 ) ( 0 )  is the first element of the original data.
Step 5: Check the prediction process. Repeat Steps 1–4 to forecast process behavior after obtaining a new sample until abnormal circumstances emerge. If a forecast point falls between the upper and lower control boundaries, the process is under control, and monitoring can proceed. However, If the predicted point goes outside of these boundaries, this suggests the process has been out of control, necessitating further analysis and corrective action.

3.2. Data Sources

This study employs the ZSG-DEA approach to allocate 2030 CO2 emission quotas for interprovincial urban public buildings across China. Hong Kong, Macao Taiwan, and Tibet are excluded owing to lacking data. The data period covers from 2005 to 2020, with the latest published data available until 2020. Additionally, the GM (1,1) model is employed in this research to forecast the CO2 emissions of provincial public buildings in 2030.
Carbon emissions were selected as the undesirable input, with GDP, population, and energy consumption as the three output variables. Table 1 provides a description of these input and output variables. The China Energy Statistical Yearbook and China Statistical Yearbook were the sources of data for the years spanning from 2005 to 2020.

4. Results

4.1. The Initial Carbon Quotas Allocation

The initial carbon quotas allocation for urban public buildings among Chinese provinces is a crucial step in managing carbon emissions and addressing climate change. As depicted in Figure 2, the initial carbon quota allocation results show that the provinces with the highest allocations are primarily located in the east and southeast regions of China, while those with the lowest allocations are primarily located in the western regions. The provinces of Hebei, Jiangsu, and Guangdong received the highest carbon quotas, accounting for 25.32% of the total initial allocation. This can be attributed to their significant economic development, large population, and high levels of carbon emissions. In contrast, Qinghai, Ningxia, and Gansu received the lowest carbon quotas, amounting to only 2.08% of the total allocation. These provinces exhibit low levels of economic development, small populations, and relatively low carbon emissions, which may explain the lower allocation.
Table 2 presents the energy consumption, GDP, population, and allocation results of urban public buildings’ initial CO2 emission quotas in 2030. The following are the reasons for allocating CO2 emission allowances to urban public buildings. Provinces with lower CO2 reduction potential or obligation, such as Hebei and Guangdong, were assigned higher quotas. Provinces with less CO2 reduction responsibility but higher emission efficiency, such as Shanghai, Zhejiang, and Jiangsu, were given more quotas. Provinces with greater CO2 sequestration potential, such as Fujian, Yunnan, and Sichuan, were considered to have higher emission feasibility and were given more quotas. Conversely, provinces with higher CO2 reduction responsibility but lower economic feasibility or environmental sustainability were given fewer quotas. In conclusion, the initial carbon quota allocation for urban public buildings is a significant step toward carbon emission reduction in China. The allocation results indicate that provinces with the highest carbon emissions and greater economic development have been assigned higher quotas.

4.2. Efficiency and Final Carbon Quotas Allocation

The initial carbon quotas allocation for urban public buildings across 30 Chinese provinces was found to be largely inefficient. As shown in Table 3, only 8 of the 30 provinces achieved an optimal efficiency score of 1, achieving the DEA frontier. This group includes Henan, Hubei, Guangdong, Guangxi, Qinghai, Ningxia, and Xinjiang. Following closely was Hunan, with an efficiency assessment of 0.932. The remaining 22 provinces had efficiency scores ranging from 0.4 to 0.9, indicating that the initial quota allocation in these regions was not entirely efficient. Specifically, Shanghai, Zhejiang, Jilin, Heilongjiang, Hainan, Anhui, Beijing, and Hebei were among the eight provinces with efficiency scores below 0.62, significantly below the DEA frontier. Hebei received the lowest efficiency score at 0.42.
To attain efficient and equitable quota allocation across provinces, an iterative process was applied to the adjustment of the initial quotas. In each iteration, the carbon quota allocation was recalibrated based on the ZSG-DEA model to ensure that the efficiency score of each province approached 1 while keeping the total carbon emissions constant throughout the iteration [45].
Figure 3 depicts the results of the iterative process in optimizing the carbon emission quota allocation plan. The graph presents the efficiency values for each province in each iteration. During the first iteration, there were numerous provinces with low efficiency values, while some provinces started to approach the efficient frontier. During the second iteration, the efficiency values of many provinces improved, and eight provinces achieved high efficiency values approaching 0.99. In the third and fourth iterations, many provinces with high efficiency values increased, and 26 and 29 provinces achieved near-perfect efficiency values above 0.99. Finally, in the fifth iteration, almost every province achieved an efficiency value of 1, indicating that the carbon emission quota allocation plan had been optimized. Therefore, Figure 3 demonstrates the effectiveness of the iterative process in improving provinces’ efficiency values and ultimately achieving an optimal carbon emission quota allocation plan.
In Figure 4, the carbon emission quotas for urban public buildings for 30 different provinces are shown as they are adjusted following every iteration. The overall carbon emission quota for provinces combined remains constant at 2108 million tons throughout the iterations. However, the amount of carbon emissions allowed for each province’s urban public buildings changes with each iteration. It is crucial to emphasize that the total carbon emission quota adjustment for all urban public buildings in all provinces amounts to zero after each iteration. This means that any increase in the carbon emission quota for one province’s urban public buildings must be offset by a decrease in another province’s carbon emission quota.
As a result of these adjustments, some provinces will experience an increase in their carbon emission quotas, while others will see a decline. This suggests that there may be differences in urban public building carbon emissions across the provinces. By adjusting the carbon emission quotas after each iteration, the overall goal of reducing carbon emissions can be achieved while also accounting for provincial differences.
The first two iterations exhibit substantial changes in carbon quotas, with certain provinces experiencing much larger adjustments compared to others. The provinces with significant increases in carbon emission allowances include Guangdong, Shandong, Henan, Hubei, etc. Guangdong increased by 37.85 million tons, and Shandong increased by 36.82 million tons. Conversely, Hebei experienced a significant decrease in carbon emission allowances, primarily due to its lower efficiency value, resulting in a reduction of 77.10 million tons during the redistribution process. In contrast, the third, fourth, and fifth iterations exhibit minimal deviations in quotas, which suggests that quotas have stabilized over time. Furthermore, in the fifth iteration, the majority of provinces display an increase in carbon quotas, whereas Hebei and Beijing observe a decrease due to their initially low efficiency values. Overall, these findings demonstrate the potential for policy interventions to improve energy efficiency and carbon reduction in public buildings, which can be sustained over time with appropriate measures. The stabilization of carbon quotas over several iterations also implies that policymakers may refine and optimize their strategies for desirable outcomes.
Figure 5 illustrates the CO2 emission quota allocation for urban public buildings. The data indicate that Guangdong, Shandong, and Jiangsu provinces had the highest carbon quotas, exceeding 150 million tons of carbon emissions per province. Notably, Guangdong province had the most substantial amount of carbon emissions at 191.05 million tons, representing 9.06% of the total quota for the country. The high carbon emission quota for this province can be attributed to its dense population and rapid industrialization. In contrast, the provinces of Qinghai, Hainan, and Ningxia received the smallest carbon quotas, with Qinghai and Hainan getting only 11.77 and 16.74 million tons each, respectively. These provinces have low population densities and are primarily focused on agriculture and tourism, explaining their reduced carbon quotas. Figure 5 demonstrates the wide variation of carbon quotas across different regions of China and underscores the need for a targeted and strategic approach to carbon emission reduction.

5. Discussion

5.1. Pressure of Provincial Carbon Emission Reduction for Urban Public Buildings

This paper utilizes historical data on carbon emissions to forecast the expected CO2 emissions for every province in China by 2030. Subsequently, we utilized the principles of equality and efficiency to distribute carbon quotas to each province, which provide a strong foundation for measuring the pressure of carbon emission reduction for provinces. Reduction pressure is a metric that quantifies each province’s carbon emission reduction goal towards the country’s target. If the projected carbon emissions for a province were to surpass its allocated quota, then it incurred a positive reduction pressure, indicating the need to reduce emissions further. Conversely, if the projected carbon emissions were lower than the allocated quota, then it had a quota surplus, resulting in negative reduction pressure. The carbon emission reduction pressure was estimated by the gap between the allocated quota and the projected carbon emissions of provinces, measured in millions of tons. The higher the reduction pressure value, the greater the mitigation efforts required by the province to meet the 2030 carbon emission reduction targets. Moreover, we utilized the percentage of carbon emission reduction pressure to provide a relative indication of the effort required for each province, calculated as the ratio of the carbon emission reduction pressure to the allocated carbon emission quota. Figure 6 provides a visual representation of the pressure on each province in China to reduce its carbon emissions.
The carbon reduction pressure varied significantly among provinces, and each province had different reasons behind its reduction pressure. In terms of the number of provinces under pressure to reduce their emissions, 17 provinces showed a surplus in their carbon emission quotas, which means that they are emitting less than their permitted limits. The other 13 provinces have experienced positive reduction pressure, which means that they need to put more effort into reducing their carbon emissions. By analyzing the provinces which possess a quota surplus or experience reduction pressure, it is clear that there is a fair distribution, demonstrating the effectiveness and equity of the 2030 carbon emission quota allocation scheme.
Guangdong, Shandong, Henan, Hubei, Xinjiang, Sichuan, Hunan, Fujian, and Guangxi had a significant quota surplus. The province of Guangdong received the highest excess allocation, which amounts to 49.82 million tons of carbon emissions. The majority of these provinces were in the beginning stages of carbon quotas and were expected to have comparatively decreased carbon emissions in 2030. Thus, they had a surplus in their quota. In contrast, Qinghai and Ningxia, positioned in the end stages of carbon quotas, enjoyed a large quota surplus due to the lowest predicted carbon emissions in China. Additionally, a total of nine other provinces, including Fujian, Guangxi, Chongqing, Guizhou, Gansu, Shanxi, Liaoning, and Yunnan, had some quota surplus but not as much as the previously mentioned provinces.
In the provinces where the carbon reduction pressure is positive, Jiangsu, Jiangxi, and Tianjin have less than 5 million tons of reduction pressure value, and they have the least reduction pressure. Conversely, Hebei had the highest reduction pressure at 95.66 million tons. In addition, reduction pressure in Shannxi, Hainan, Jilin, Inner Mongolia, Shanghai, Zhejiang, Anhui, and Beijing gradually increases, ranging from 6.41 million tons to 39.14 million tons. These reduction pressures reflected their responsibilities to mitigate carbon emissions to reach their allocated quotas. Overall, the reduction pressure values provided insight into the measures each province needed to take in order to meet their emission reduction goals and contribute towards China’s carbon emission targets.

5.2. Comparison with the Existing Literature

This study proposes an allocation scheme for carbon quotas in urban public buildings that aims to balance fairness and efficiency principles. Our quota allocation scheme prioritizes provinces with greater potential for output increase while ensuring that the overall carbon emissions from Chinese urban public buildings do not increase. To evaluate the rationale and accuracy of our proposed scheme, we compare it with relevant published studies.
Figure 7 presents the comparison results between this study and the published literature regarding the allocation of carbon quotas in Chinese urban public buildings by 2030 derived from the existing literature [9,24]. Due to differences in allocation principles and measurement methods, the research findings on the allocation of carbon quotas for urban public buildings are inconsistent. By observing Figure 7a, we can note significant variations in the allocation results of carbon quotas for urban public buildings. Figure 7b illustrates the proportion of carbon quota allocations for urban public buildings among provinces. Further analyzing Figure 7b, we find that the provinces with the highest carbon quota allocations, exceeding 4%, include Jiangsu, Guangdong, Zhejiang, Shandong, Beijing, and Shanghai. These regions are located in the economically developed eastern coastal areas. In contrast, the provinces with the lowest carbon quota allocations, less than 1%, consist of Hainan, Gansu, Ningxia, and Qinghai. These areas belong to the less economically developed western regions.
These observations indicate that the economically lagging western regions bear a smaller responsibility for CO2 emissions reduction, providing greater space for future socioeconomic development. Conversely, the economically advanced eastern regions shoulder a larger burden of CO2 emissions reduction, aligning with China’s goal of balanced regional development to narrow the economic development gap.
Although there are some differences in detail between our study and others, the overall trends in our results align with existing research. Our study provides a suitable allocation scheme for carbon quotas in urban public buildings, promoting sustainable development and achieving carbon reduction goals.

6. Conclusions

6.1. Main Findings

The paper proposes a scheme for allocating carbon emission quotas to urban public buildings in China. It is founded on the principles of equality and efficiency and uses the ZSG-DEA model to ensure that each province receives an equitable and appropriate amount of carbon quotas. We first measure the overall CO2 emissions of urban public buildings in China by 2030 using a number of factors, including economic development, historical carbon emissions, and population and, provide a preliminary scheme of carbon emission quotas allotment for all of the provinces at the beginning of the allocation process. Employing the ZSG-DEA model, carbon emission quotas for urban public buildings in 30 different Chinese provinces are determined. Lastly, CO2 emission reduction pressure is investigated.
The research findings can be summarized in three main points:
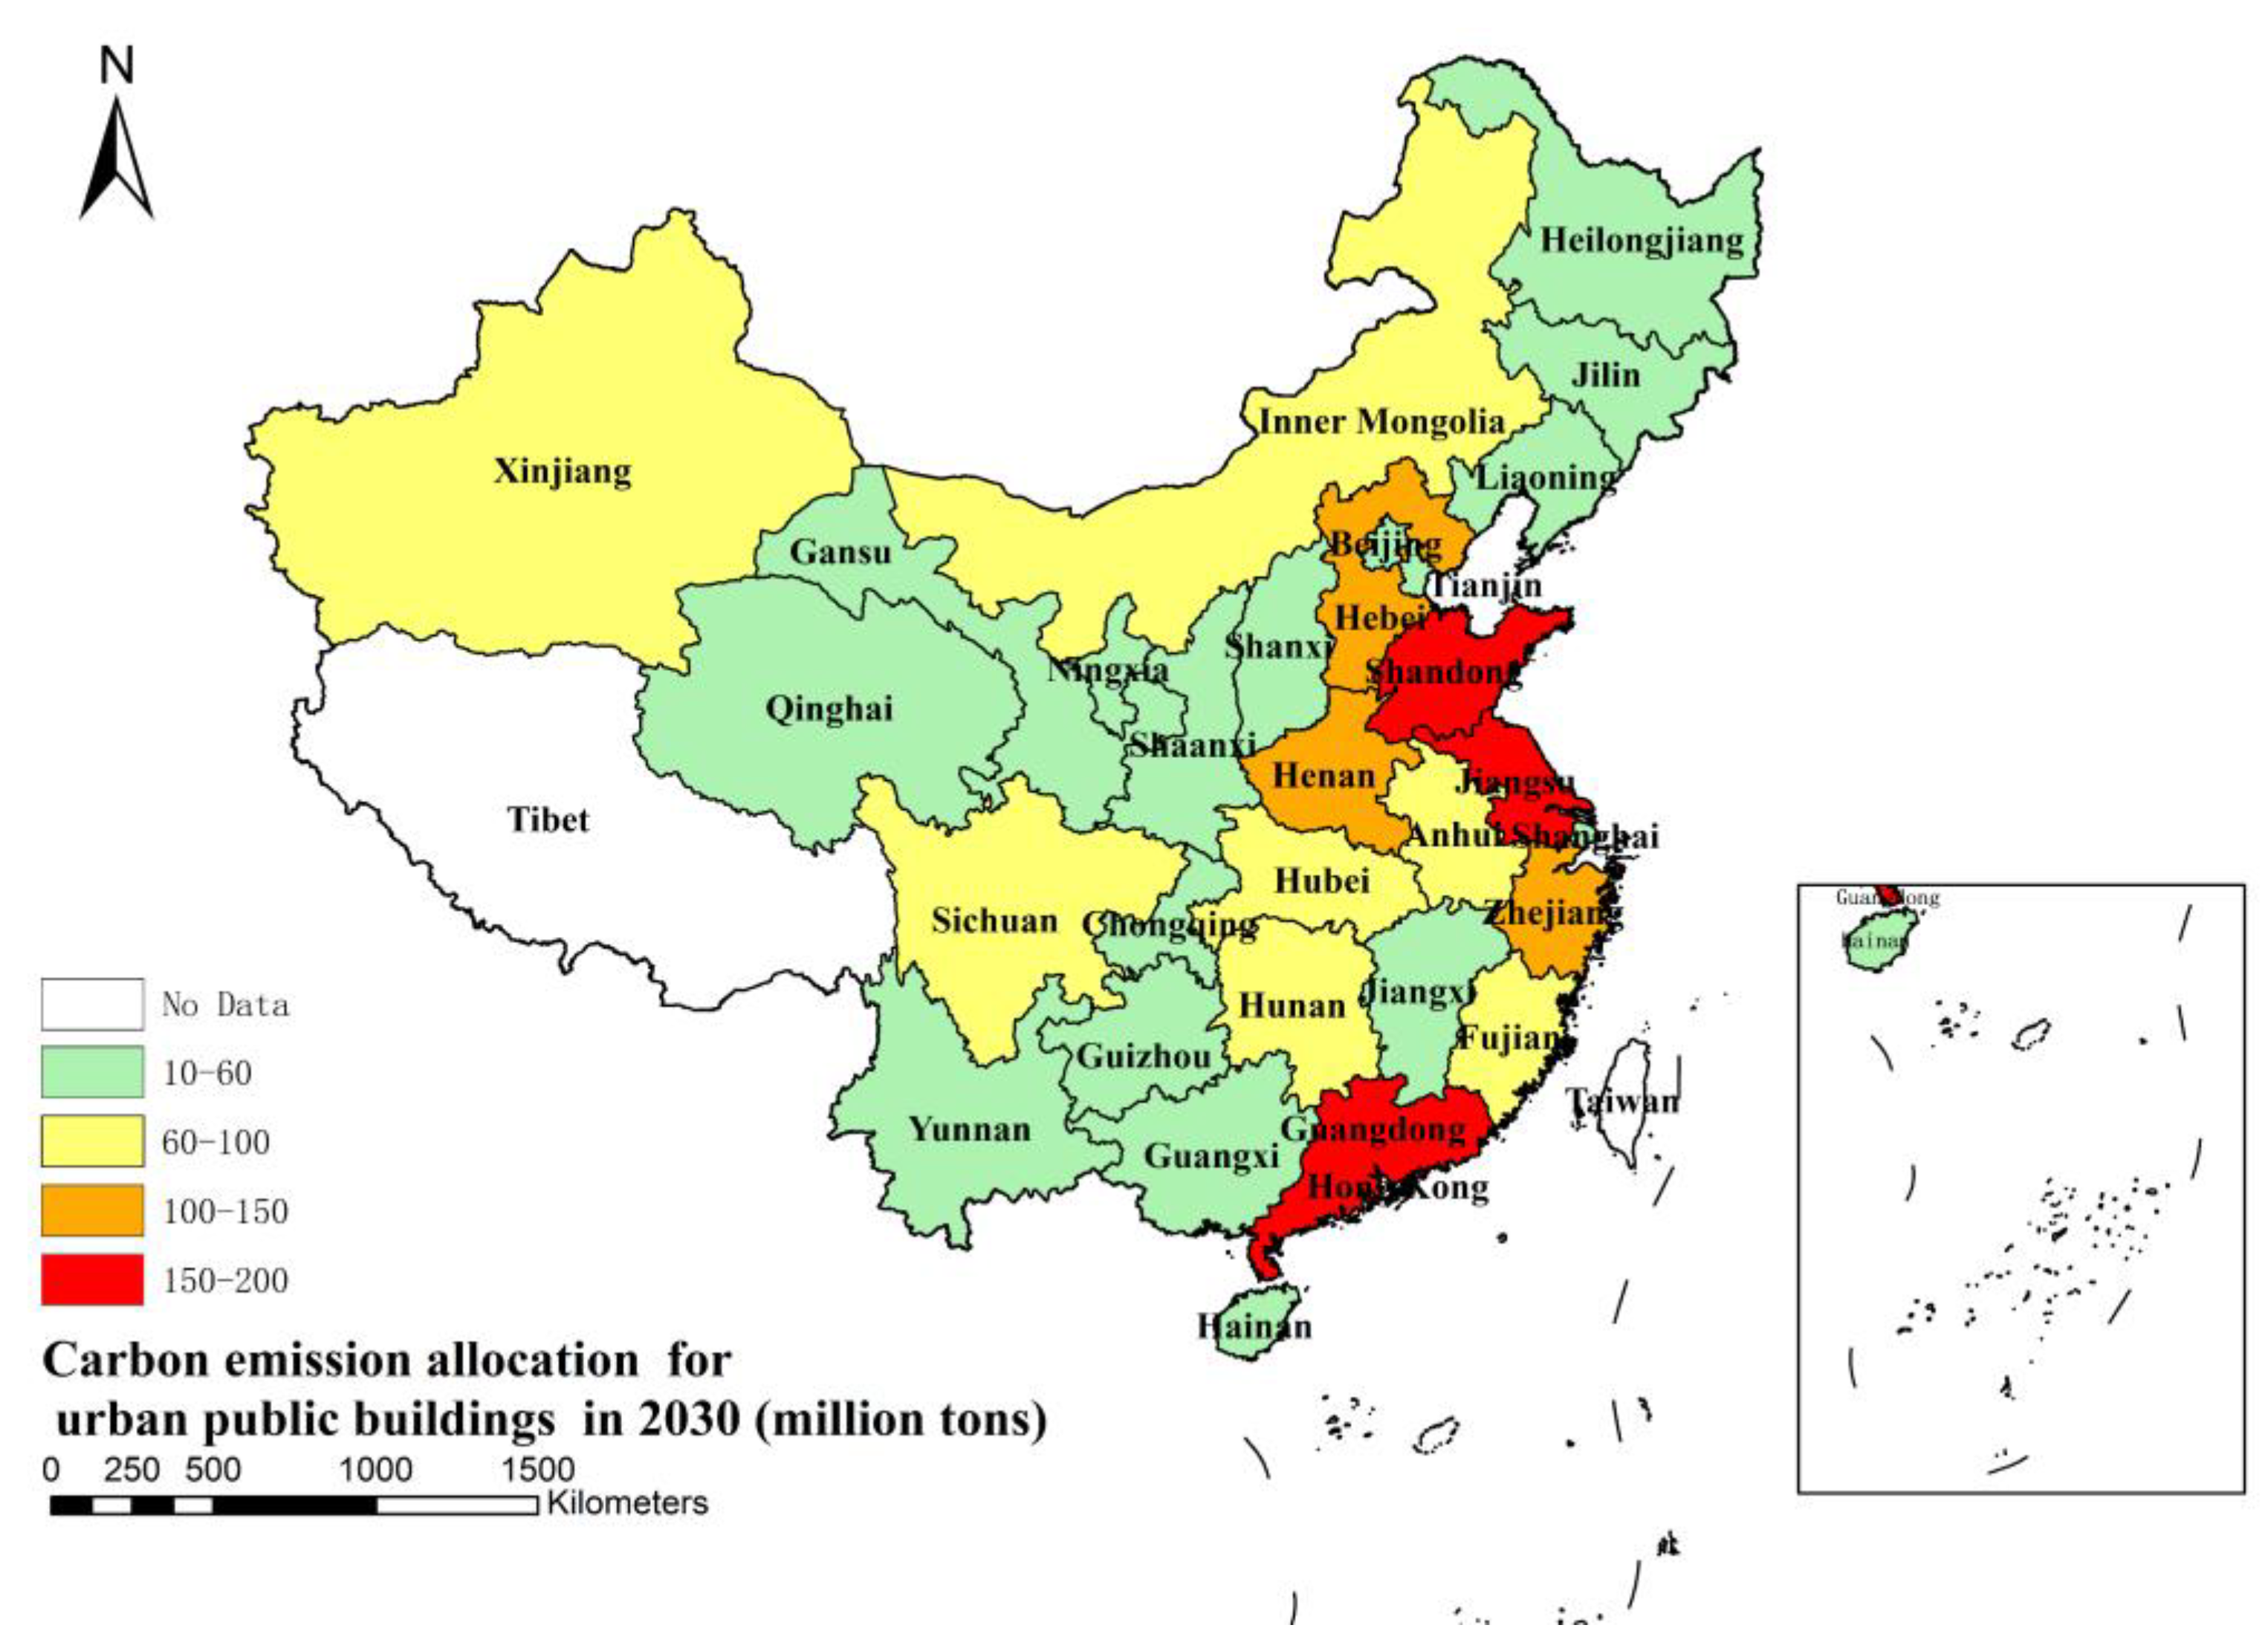
  • Qinghai, Hainan, Ningxia, Tianjin, and Jilin had small carbon quotas for urban public buildings. These provinces, characterized by relatively low population density and abundant resources, have achieved a balance between economic and environmental development, facilitating the attainment of sustainable development objectives. Consequently, these provinces are encouraged to develop their economies while minimizing the negative impact on the environment. Provinces such as Guangdong, Shandon, Jiangsu, Hebei, Zhejiang, and Henan were assigned substantial carbon quotas due to their high population densities and superior input–output efficiencies. In essence, these provinces exhibit a superior ability to generate higher economic output with lower input, positioning them as significant drivers of economic growth. Nonetheless, this advantage often corresponds to increased carbon emissions. In order to balance growth and environmental protection in these provinces, the allocation scheme has awarded higher carbon quotas to enable them to continue developing their economies while minimizing the carbon footprint of their urban public buildings. This not only promotes sustainable development in these provinces but also contributes to achieving the national goal of reducing carbon emissions.
  • There is variation in carbon emission quotas across different regions of China, with quotas gradually increasing from the northwest to the southeast. This is because the southeast coastal areas are more developed economically, have larger populations, and also have higher carbon emission efficiency. As a result, provinces such as Guangdong, Jiangsu, Shandong, and Zhejiang have been assigned higher carbon quotas. The allocation of higher carbon quotas to these provinces is intended to incentivize them to mitigate their carbon emissions and also improve sustainable development. In contrast, the northwest regions have fewer economic advantages, smaller populations, and lower carbon emission efficiency. Consequently, provinces such as Qinghai, Hainan, Ningxia, and Gansu have been assigned relatively lower carbon emission quotas, which may provide incentives to develop cleaner and more sustainable industries and lead to long-term economic and environmental benefits.
  • According to the results of carbon emission reduction pressure, it has been observed that many of the 30 provinces in China are facing pressures to decrease carbon emissions. Out of these provinces, 17 have a surplus in their carbon emission quotas, including Guangdong, Shandong, Hubei, Hunan, and others. Guangdong and Shandong have the highest proportion of quota surplus among all the provinces. Both Guangdong and Shandong are considered highly industrialized and developed regions in China, which could contribute to their better performance in reducing carbon emissions. While some provinces are carbon emissions quota surplus, others are experiencing significant pressure to reduce emissions. Provinces such as Hebei, Beijing, Anhui, and Zhejiang are facing huge emission reduction pressure, indicating that they are struggling to bring their carbon emissions down to more sustainable levels. Provinces with abundant resources, such as Heilongjiang and Inner Mongolia, face significantly higher pressure to reduce emissions in urban public buildings. Conversely, provinces such as Sichuan, Fujian, and Hunan, which have low historical CO2 emissions and strong economic development, experience relatively lower reduction pressure.

6.2. Policy Implications

The findings carry significant implications for policymakers who need to implement measures to mitigate carbon emissions and foster a sustainable future. Based on the findings, three main policy suggestions can be proposed.
Established differentiated goals and strategies: It is imperative for all provinces to contribute to carbon emission reduction by gaining a comprehensive understanding of the current state of greenhouse gas emissions. However, it is not feasible to hold all provinces to the same standards or targets. A one-size-fits-all approach is not practical, and therefore governments need to establish differential benchmarks that take into consideration economic development, energy-use efficiency, and carbon emissions. As a result, establishing differentiated goals and strategies will be key in ensuring that all countries are responding realistically to climate change.
Looser reduction targets for developed and energy-efficient provinces and stricter targets for developing and energy-dependent provinces: Some provinces may be more efficient than others in terms of their energy usage and might have more efficient policies in place that help reduce carbon emissions. In contrast, others might be transitioning away from carbon-intensive energy sources more slowly due to their reliance on them. Owing to these differences, a blanket target for carbon emissions reduction may not be feasible for every province. In such cases, developing and energy-dependent provinces need stricter reduction targets, whereas developed and energy-efficient provinces may have looser targets assigned.
Upgrading industrial structures and increasing clean energy use: Upgrading to cleaner production processes, reducing energy waste, and adopting emissions reduction technologies all contribute to cutting carbon emissions for less efficient provinces. Additionally, using cleaner renewable energy sources such as solar, wind, and hydroelectric power, rather than carbon-intensive sources such as coal, will be important in decreasing emissions. In less efficient provinces, particularly those that depend on coal and other fossil fuels for energy, increasing the use of clean energy should be a priority. It is a long-term process; however, it is necessary to transition towards carbon neutrality in the future.

6.3. Limitations and Future Research

Although this study provides valuable insights into the carbon quota allocation for urban public buildings, it is important to acknowledge the presence of certain limitations. Firstly, the study was carried out with limited data, which may not be generalized to a larger scope, and the results may not be entirely accurate. In future research, more data could be collected, and the sample size could be increased to improve the study’s validity. Secondly, the application of the ZSG-DEA model in this study could be improved to refine the allocation process of CO2 quotas. Researchers can investigate how to set constraints on intensity variables for each region to ensure fair and reasonable allocation of quotas. Thirdly, city-level CO2 quota allocation can be prioritized in future research to enable sustainable development and effective carbon emission reductions. Research on this could consider how different cities can have unique carbon allocations that align with their respective circumstances.

Author Contributions

Z.Z. Conceptualization, Methodology, Writing—original draft, Writing—review and editing. Z.D. Data curation, Software, Visualization. Y.L. Conceptualization, Supervision, Project administration, Funding acquisition. All authors have read and agreed to the published version of the manuscript.

Funding

This research was funded by National Natural Science Foundation of China, grant number 71871014.

Data Availability Statement

The data used to support the results are available from the corresponding author upon request.

Conflicts of Interest

All the authors declare no conflict of interest.

References

  1. Adnan, A.; Khan, S. A Comparative Study of Various Strategies Used for the Mitigation of Global Warming; 2021. Available online: https://scholar.uwindsor.ca/ttccap/2021/online/5/ (accessed on 25 June 2021).
  2. Raupach, M.R.; Davis, S.J.; Peters, G.P.; Andrew, R.M.; Canadell, J.G.; Ciais, P.; Friedlingstein, P.; Jotzo, F.; van Vuuren, D.P.; Le Quere, C. Sharing a quota on cumulative carbon emissions. Nat. Clim. Chang. 2014, 4, 873–879. [Google Scholar] [CrossRef] [Green Version]
  3. Zhang, M.W.; Gao, F.F.; Huang, B.; Yin, B. Provincial Carbon Emission Allocation and Efficiency in China Based on Carbon Peak Targets. Energies 2022, 15, 9181. [Google Scholar] [CrossRef]
  4. Ma, D.L.; Xiao, Y.P.; Zhao, N. Optimization and Spatiotemporal Differentiation of Carbon Emission Rights Allocation in the Power Industry in the Yangtze River Economic Belt. Sustainability 2022, 14, 5201. [Google Scholar] [CrossRef]
  5. Ye, B.; Jiang, J.; Li, C.; Miao, L.; Tang, J. Quantification and driving force analysis of provincial-level carbon emissions in China. Appl. Energy 2017, 198, 223–238. [Google Scholar] [CrossRef]
  6. Enforcing Climate Change Response Initiative–Chinese National Determined Contribution. Available online: http://www.gov.cn/xinwen/2015-06/30/content_2887330.htm (accessed on 30 June 2015).
  7. Normile, D. China’s bold climate pledge earns praise-but is it feasible? Science 2020, 370, 17–18. [Google Scholar] [CrossRef]
  8. Cheng, Y.L.; Gu, B.H.; Tan, X.C.; Yan, H.S.; Sheng, Y.H. Allocation of provincial carbon emission allowances under China’s 2030 carbon peak target: A dynamic multi-criteria decision analysis method. Sci. Total Environ. 2022, 837, 155798. [Google Scholar] [CrossRef]
  9. Gan, L.; Ren, H.; Cai, W.G.; Wu, K.; Liu, Y.; Liu, Y. Allocation of carbon emission quotas for China’s provincial public buildings based on principles of equity and efficiency. Build. Environ. 2022, 216, 108994. [Google Scholar] [CrossRef]
  10. Building Energy Research Centre of Tsinghua University. Annual Report on China Building Energy Efficiency; China Architecture and Building Press: Beijing, China, 2020. [Google Scholar]
  11. Du, Z.Q.; Liu, Y.S.; Zhang, Z.D. Spatiotemporal Analysis of Influencing Factors of Carbon Emission in Public Buildings in China. Buildings 2022, 12, 424. [Google Scholar] [CrossRef]
  12. Yu, N.; Chen, J.H.; Cheng, L. Evolutionary Game Analysis of Carbon Emission Reduction between Government and Enterprises under Carbon Quota Trading Policy. Int. J. Environ. Res. Public Health 2022, 19, 8565. [Google Scholar] [CrossRef] [PubMed]
  13. Serrao, A. Reallocating Agricultural Greenhouse Gas Emission in EU15 Countries; Agricultural and Applied Economics Association: San Antonio, TX, USA, 2010. [Google Scholar]
  14. Park, J.-W.; Kim, C.U.; Isard, W. Permit allocation in emissions trading using the Boltzmann distribution. Phys. A-Stat. Mech. Its Appl. 2012, 391, 4883–4890. [Google Scholar] [CrossRef] [Green Version]
  15. Meng, M.; Wang, L.X.; Chen, Q. Quota Allocation for Carbon Emissions in China’s Electric Power Industry Based upon the Fairness Principle. Energies 2018, 11, 2256. [Google Scholar] [CrossRef] [Green Version]
  16. Jin, X.; Zou, B.; Wang, C.; Rao, K.; Tang, X. Carbon Emission Allocation in a Chinese Province-Level Region Based on Two-Stage Network Structures. Sustainability 2019, 11, 1369. [Google Scholar] [CrossRef] [Green Version]
  17. Huang, Y.; Duan, H.; Dong, D.; Song, Q.; Zuo, J.; Jiang, W. How to evaluate the efforts on reducing CO2 emissions for megacities? Public building practices in Shenzhen city. Resour. Conserv. Recycl. 2019, 149, 427–434. [Google Scholar] [CrossRef]
  18. Qian, Y.; Sun, R.; Zhao, J.; Song, S.; Wang, P. How does public infrastructure construction influence CO2 emissions? A global case. Front. Environ. Sci. 2022, 10, 1048297. [Google Scholar] [CrossRef]
  19. You, K.; Yu, Y.; Cai, W.; Liu, Z. The change in temporal trend and spatial distribution of CO2 emissions of China’s public and commercial buildings. Build. Environ. 2023, 229, 109956. [Google Scholar] [CrossRef]
  20. Li, H.X.; Ma, Z.; Liu, H.; Wang, J.; Al-Hussein, M.; Mills, A. Exploring and verifying BIM-based energy simulation for building operations. Eng. Constr. Archit. Manag. 2020, 27, 1679–1702. [Google Scholar] [CrossRef]
  21. Liu, Y.; Chen, H.; Zhang, L.; Wu, X.; Wang, X.-J. Energy consumption prediction and diagnosis of public buildings based on support vector machine learning: A case study in China. J. Clean. Prod. 2020, 272, 122542. [Google Scholar] [CrossRef]
  22. Huang, J.; Kaewunruen, S. Forecasting Energy Consumption of a Public Building Using Transformer and Support Vector Regression. Energies 2023, 16, 966. [Google Scholar] [CrossRef]
  23. Yue, J.; Li, W.; Cheng, J.; Xiong, H.; Xue, Y.; Deng, X.; Zheng, T. A dynamic calculation model of the carbon footprint in the life cycle of hospital building: A case study in China. Eng. Constr. Archit. Manag. 2022. [Google Scholar] [CrossRef]
  24. Zhang, L.; Liu, Y.; Du, Z. Research on Carbon Allowance Allocation for Public Buildings in China Based on the Target of Carbon Emission Intensity Reduction in 2030; Research Square: Durham, NC, USA, 2023. [Google Scholar] [CrossRef]
  25. Lins, M.P.E.; Gomes, E.G.; de Mello, J.; de Mello, A. Olympic ranking based on a zero sum gains DEA model. Eur. J. Oper. Res. 2003, 148, 312–322. [Google Scholar] [CrossRef] [Green Version]
  26. Raju, N.S. United Nations Framework Convention on Climate Change. Int. J. Empir. Educ. Res. 2019, 13–25. [Google Scholar] [CrossRef] [Green Version]
  27. Wu, F.; Huang, N.; Liu, G.; Niu, L.; Qiao, Z. Pathway optimization of China’s carbon emission reduction and its provincial allocation under temperature control threshold. J. Environ. Manag. 2020, 271, 111034. [Google Scholar] [CrossRef] [PubMed]
  28. Pan, X.Z.; Teng, F.H.; Wang, G. Sharing emission space at an equitable basis: Allocation scheme based on the equal cumulative emission per capita principle. Appl. Energy 2014, 113, 1810–1818. [Google Scholar] [CrossRef]
  29. Li, L.X.; Li, Y.N.; Ye, F.; Zhang, L. Carbon dioxide emissions quotas allocation in the Pearl River Delta region: Evidence from the maximum deviation method. J. Clean. Prod. 2018, 177, 207–217. [Google Scholar] [CrossRef]
  30. Fang, K.; Zhang, Q.F.; Long, Y.; Yoshida, Y.; Sun, L.; Zhang, H.R.; Dou, Y.; Li, S. How can China achieve its Intended Nationally Determined Contributions by 2030? A multi-criteria allocation of China’s carbon emission allowance. Appl. Energy 2019, 241, 380–389. [Google Scholar] [CrossRef]
  31. Zhang, Y.J.; Wang, A.D.; Da, Y.B. Regional allocation of carbon emission quotas in China: Evidence from the Shapley value method. Energy Policy 2014, 74, 454–464. [Google Scholar] [CrossRef]
  32. Han, R.; Tang, B.J.; Fan, J.L.; Liu, L.C.; Wei, Y.M. Integrated weighting approach to carbon emission quotas: An application case of Beijing-Tianjin-Hebei region. J. Clean. Prod. 2016, 131, 448–459. [Google Scholar] [CrossRef]
  33. Qin, Q.D.; Liu, Y.; Li, X.; Li, H.A. A multi-criteria decision analysis model for carbon emission quota allocation in China’s east coastal areas: Efficiency and equity. J. Clean. Prod. 2017, 168, 410–419. [Google Scholar] [CrossRef]
  34. Du, J.; Pan, M.; Chen, Y.; Duan, Y.R. An efficiency-based allocation of carbon emissions allowance: A case study in China. J. Clean. Prod. 2020, 251, 119346. [Google Scholar] [CrossRef]
  35. Phylipsen, G.; Bode, J.W.; Blok, K.; Merkus, H.; Metz, B. A Triptych sectoral approach to burden differentiation; GHG emissions in the European bubble. Energy Policy 1998, 26, 929–943. [Google Scholar] [CrossRef]
  36. Zhang, N.; Wei, X. Dynamic total factor carbon emissions performance changes in the Chinese transportation industry—ScienceDirect. Appl. Energy 2015, 146, 409–420. [Google Scholar] [CrossRef]
  37. Charnes, A.; Cooper, W.W.; Rhodes, E. Measuring the efficiency of decision making units. Eur. J. Oper. Res. 1978, 2, 429–444. [Google Scholar] [CrossRef]
  38. Wu, F.; Fan, L.W.; Zhou, P.; Zhou, D.Q. Industrial energy efficiency with CO2 emissions in China: A nonparametric analysis. Energy Policy 2012, 49, 164–172. [Google Scholar] [CrossRef]
  39. Lozano, S.; Villa, G.; Brännlund, R. Centralised reallocation of emission permits using DEA. Eur. J. Oper. Res. 2009, 193, 752–760. [Google Scholar] [CrossRef]
  40. Ma, C.-Q.; Ren, Y.-S.; Zhang, Y.-J.; Sharp, B. The allocation of carbon emission quotas to five major power generation corporations in China. J. Clean. Prod. 2018, 189, 1–12. [Google Scholar] [CrossRef]
  41. Yang, F.; Lee, H. An innovative provincial CO2 emission quota allocation scheme for Chinese low-carbon transition. Technol. Forecast. Soc. Change 2022, 182, 121823. [Google Scholar] [CrossRef]
  42. Gomes, E.G.; Lins, M. Modelling undesirable outputs with zero sum gains data envelopment analysis models. Taylor Fr. 2008, 59, 616–623. [Google Scholar] [CrossRef]
  43. Chiu, Y.H.; Lin, J.C.; Su, W.N.; Liu, J.K. An Efficiency Evaluation of the EU’s Allocation of Carbon Emission Allowances. Energy Sources Part B-Econ. Plan. Policy 2015, 10, 192–200. [Google Scholar] [CrossRef]
  44. Xiong, S.; Tian, Y.; Ji, J.; Ma, X. Allocation of Energy Consumption among Provinces in China: A Weighted ZSG-DEA Model. Sustainability 2017, 9, 2115. [Google Scholar] [CrossRef] [Green Version]
  45. Cai, W.G.; Ye, P.Y. A more scientific allocation scheme of carbon dioxide emissions allowances: The case from China. J. Clean. Prod. 2019, 215, 903–912. [Google Scholar] [CrossRef]
  46. Yang, M.; Hou, Y.R.; Ji, Q.; Zhang, D.Y. Assessment and optimization of provincial CO2 emission reduction scheme in China: An improved ZSG-DEA approach. Energy Econ. 2020, 91, 104931. [Google Scholar] [CrossRef]
  47. Cui, X.Y.; Zhao, T.; Wang, J. Allocation of carbon emission quotas in China’s provincial power sector based on entropy method and ZSG-DEA. J. Clean. Prod. 2021, 284, 124683. [Google Scholar] [CrossRef]
  48. Song, J.; Chen, R.; Ma, X. Provincial Allocation of Energy Consumption, Air Pollutant and CO2 Emission Quotas in China: Based on a Weighted Environment ZSG-DEA Model. Sustainability 2022, 14, 2243. [Google Scholar] [CrossRef]
  49. Zheng, L. Sharing the Carbon Emission Reduction Responsibility across Chinese Provinces: A Zero Sum Gains DEA Model. Resour. Sci. 2012, 34, 2087–2096. [Google Scholar]
  50. Lin, T.; Ning, J.F. Study on allocation efficiency of carbon emission permit in EU ETS based on ZSG-DEA model. J. Quant. Tech. Econ. 2011, 3, 36–50. [Google Scholar]
  51. Deng, J.L. Control Problems of Grey Systems. Syst. Control Lett. 1982, 1, 288–294. [Google Scholar]
  52. Chang, A.-Y. Prioritising the types of manufacturing flexibility in an uncertain environment. Int. J. Prod. Res. 2012, 50, 2133–2149. [Google Scholar] [CrossRef]
  53. Hamzacebi, C.; Es, H.A. Forecasting the annual electricity consumption of Turkey using an optimized grey model. Energy 2014, 70, 165–171. [Google Scholar] [CrossRef]
  54. Abbas, S.; Yousaf, H.; Khan, S.; Rehman, M.Z.; Blueschke, D. Analysis and Projection of Transport Sector Demand for Energy and Carbon Emission: An Application of the Grey Model in Pakistan. Mathematics 2023, 11, 1443. [Google Scholar] [CrossRef]
  55. Akay, D.; Atak, M. Grey prediction with rolling mechanism for electricity demand forecasting of Turkey. Energy 2007, 32, 1670–1675. [Google Scholar] [CrossRef]
Figure 1. Flowchart of the method.
Buildings 13 01570 g001
Figure 2. Initial carbon emission allocations for urban public buildings among thirty Chinese provinces in 2030.
Buildings 13 01570 g002
Figure 3. The DEA efficiency of initial allocation and reallocation.
Buildings 13 01570 g003
Figure 4. Quota adjustments for each provincial urban public building after each iteration.
Buildings 13 01570 g004
Figure 5. Allocation of final carbon emission quotas for urban public buildings at provincial level in China.
Buildings 13 01570 g005
Figure 6. Carbon emission reduction pressure of provincial urban public buildings in 2030.
Buildings 13 01570 g006
Figure 7. The comparison of allocation results for urban public buildings in 2030 between this paper and the published literature. (a) Carbon emission quota allocation results among provinces; (b) proportion of carbon emission quota allocation results among provinces (Gan et al. (2022) [9] and Zhang et al. (2023) [24]).
Buildings 13 01570 g007
Table 1. Input–output variables.
Variable ClassificationSpecific VariableVariable Explanation
Input variablePopulation
GDP
Energy consumption
Population of each province in 2030
GDP of each province
energy consumption of each province in 2030
Output variableCarbon emissionsEstimated CO2 emissions by regions of urban public buildings
Table 2. Initial carbon emission allocations for urban public buildings among thirty Chinese provinces in 2030.
ProvinceCarbon Quota
(Million Tons)
Energy Consumption
(Million Tce)
GDP
(Billion Yuan)
Population
(Million)
Beijing94.3078.079454.5524.70
Tianjin28.3093.163166.3614.80
Hebei208.77388.437575.2377.81
Shanxi45.61245.373586.5234.77
Inner Mongolia74.69354.294027.3923.56
Liaoning54.11249.384585.1541.57
Jilin31.8454.052397.5121.31
Heilongjiang42.03117.172255.1526.84
Shanghai66.05125.829230.3727.03
Jiangsu183.81413.6127,641.2990.95
Zhejiang137.66319.7016,398.4576.59
Anhui111.31200.3811,932.8561.75
Fujian63.57196.0313,902.6046.86
Jiangxi55.34156.287415.7145.94
Shandong137.41500.1116,645.72107.78
Henan78.16231.8314,505.83103.84
Hubei56.55189.8913,680.2360.13
Hunan60.44166.8711,812.7267.71
Guangdong141.23461.9729,017.68151.85
Guangxi37.97165.916077.9453.25
Hainan23.8238.821612.1211.62
Chongqing40.84100.348053.3235.64
Sichuan78.93232.3314,404.9886.44
Guizhou41.51130.367308.7941.29
Yunnan52.61173.137792.9448.29
Shaanxi61.01211.847436.7141.68
Gansu21.75101.152077.5424.51
Qinghai8.7067.89859.956.24
Ningxia13.61177.151048.718.17
Xinjiang56.33409.453771.6430.43
Table 3. Initial and final carbon emission quotas and allocation efficiency.
ProvinceInitial EfficiencyFinal EfficiencyAdjustment Amount
(Million Tons)
Final Quota
(Million Tons)
Hebei0.42576195.67113.1
Beijing0.44369139.1455.16
Anhui0.50604137.1674.15
Hainan0.5225417.0816.74
Heilongjiang0.52267112.6129.42
Jilin0.5715317.3824.46
Zhejiang0.61115126.87110.79
Shanghai0.61239112.0254.03
Tianjin0.6193914.7123.59
Inner Mongolia0.6632618.4966.2
Shaanxi0.6680716.4254.59
Jiangxi0.6923913.9351.41
Jiangsu0.7447313.04180.77
Yunnan0.767351−1.6854.29
Liaoning0.781631−2.7856.89
Shanxi0.828551−5.3150.92
Guizhou0.866621−7.0148.52
Chongqing0.872621−7.2548.09
Sichuan0.906531−17.5196.44
Fujian0.915651−14.9778.54
Gansu0.923571−5.427.15
Hunan0.932011−15.676.04
Shandong11−48.47185.88
Henan11−27.56105.72
Hubei11−19.9576.5
Guangdong11−49.82191.05
Guangxi11−13.3951.36
Qinghai11−3.0711.77
Ningxia11−4.7918.4
Xinjiang11−19.8676.19
Disclaimer/Publisher’s Note: The statements, opinions and data contained in all publications are solely those of the individual author(s) and contributor(s) and not of MDPI and/or the editor(s). MDPI and/or the editor(s) disclaim responsibility for any injury to people or property resulting from any ideas, methods, instructions or products referred to in the content.

