1. Introduction
In recent years, low-heat concrete has become the focus of attention in the field of hydraulic engineering due to its low hydration heat, high later strength, high durability, and high corrosion resistance compared to ordinary concrete [
1,
2,
3,
4]. The utilization of low-heat concrete is considered to be one of the most effective methods to decrease the thermal stresses and cracking risk in the dam concrete [
5]. Low-heat concrete has the merits of low hydration heat, high strength, and good durability, which are beneficial for decreasing the temperature control stress of mass concrete and enhancing the crack resistance of concrete [
6,
7]. Low-heat concrete possesses better early crack resistance than ordinary concrete due to its lower shrinkage strain at an early age, and the hydration heat and adiabatic temperature rise of low-heat concrete are lower than those of ordinary concrete at all hydration ages. In addition, low-heat concrete has a more refined porous structure than ordinary concrete at late ages [
5]. Researchers have systematically studied the performance of low-heat concrete [
8,
9], and low-heat concrete was applied to the stilling pool of the Xiangjiaba project [
10], the flood discharge tunnel of the Xiluodu project [
11], and the diversion tunnel of the Baihetan project [
12]. Additionally, low-heat concrete was used in the entire dam section of the Baihetan and Wudongde projects under construction in China, and applications of low-heat concrete are booming [
13,
14]. Ji et al. [
15], Yang et al. [
16], and Xin et al. [
17] pointed out that the comprehensive performance of low-heat cement concrete is better than that of medium-heat cement’s. Shi et al. [
18] design lightweight thermal insulation mortar with improved thermal characteristics using glazed hollow beads and micro-encapsulated phase change materials. Peng et al. [
4] investigated the composition of CTF and its influence on cement hydration, concrete temperature, and strength for the Wudongde dam project. However, the above two major projects are located in areas with strong solar radiation. The summer is hot, and the sun is strong. The highest temperature in the valley during the day is above 37 °C, the nighttime temperature is around 22 °C, and the temperature difference between day and night is above 10 °C. With the influences of strong solar radiation and the temperature difference between day and night, the surface temperature of a concrete block changes drastically, the internal concrete temperature changes slowly, and there may be a large temperature gradient from the inside to the outside, which causes large tensile stress. Due to the low early strength of low-heat concrete, the tensile stress is likely to exceed the tensile strength of the corresponding aged concrete, which induces cracks on the concrete surface, reduces the durability of the concrete structure, and may form serious penetrating cracks, which is disadvantageous to structural safety. Therefore, the key to ensuring the quality of dam temperature control is to perform the surface thermal insulation measures on low-heat concrete well before the high-temperature season.
For areas with strong solar radiation, it is the basis for the development of scientific and reasonable surface insulation measures to clarify the influence of solar radiation on the temperature state of concrete structures. In recent years, many scholars have studied the temperature state of concrete structures under the action of sunlight. Radiation can supply pore water with additional energy to change from the liquid to the vapor phase and increase evaporation. Radiation can cause the concrete surface temperature to rise above the air temperature, creating a vapor pressure deficiency and increasing evaporation [
19,
20,
21]. Moelich et al. [
19] investigated the influence of solar radiation on evaporation, concrete temperature, plastic shrinkage, and cracking. Wang et al. [
22] carried out a temperature monitoring experiment and a numerical simulation of the orifice structure in an arch dam, considering solar radiation effects. Sheng et al. [
23] investigated the non-uniform temperature distribution of the steel-concrete composite box girder-ballastless track system induced by the time-varying solar radiation. Li et al. [
24] proposed that large temperature changes and strong solar radiation would hinder concrete temperature control and crack prevention. Zhu et al. [
25] proposed that the seasonal variation in the solar azimuth angle will make the solar radiation absorbed by different regions of high arch dams vary greatly, which may lead to an uneven temperature distribution on the surface of high arch dams and then to adverse stress in the construction and operation of high arch dams. Chang et al. [
26] calculated the influence of solar radiation on the temperature state of a roller compacted concrete (RCC) dam in the high-temperature season and determined that the calculated temperature field considering the influence of sunshine was closer to the actual temperature field. Huang et al. [
27] calculated the influence of solar radiant heat on the temperature rise of RCC by simulation. Ren et al. [
28] calculated the temperature field of a reinforced concrete pier under the action of sunlight. The surface temperature of a reinforced concrete pier under the action of solar radiation reached 52 °C. Oskae et al. [
29] considered that solar radiant heat was the cause of the uneven temperature field of concrete bridges. Zhou et al. [
30] simulated the surface temperature stress field for medium-heat concrete with the action of sunlight. They believed that the influence of solar radiant heat was very unfavorable for the crack resistance of early-age concrete. Su et al. [
31] obtained the influence law of continuous sunshine on the temperature field of a diversion wall according to an actual project. Zhou [
32] and Zhao et al. [
33] gave the temperature field distribution of a concrete box girder structure considering the influence of sunshine, and the solar radiant heat caused a large temperature difference between the upper and lower parts of the box girder structure. Soltani et al. [
34] demonstrated that the influence of solar radiation on the simulation analysis of arch dams is reflected by an increase in the ambient temperature. Castilho et al. [
35] calculated the solar radiation using the solar radiation calculation model and applied it to the finite element model as the third boundary condition, and the calculation results of the finite element analysis agreed well with the measured values.
The above research results provide a reference for the development of temperature control measures for roller-compacted concrete dams and bridges in a strong solar radiation environment. However, for a low-heat concrete dam project, the solar radiation absorption rate is different due to the different types of concrete. Therefore, the degree of influence of solar radiant heat on concrete must also be different. Additionally, the real temperature gradient of a low-heat concrete surface and the influence of solar radiation heat on the real temperature gradient of surface concrete lack experimental temperature monitoring research. At the same time, the real-time monitoring of the solar radiation heat on the surface of the concrete pouring block and the finite element simulation calculation based on the measured solar radiation intensity can truly restore the actual situation. On this basis, it is more accurate and reliable to determine the influence of different temperature control measures on the temperature field of the concrete pouring block.
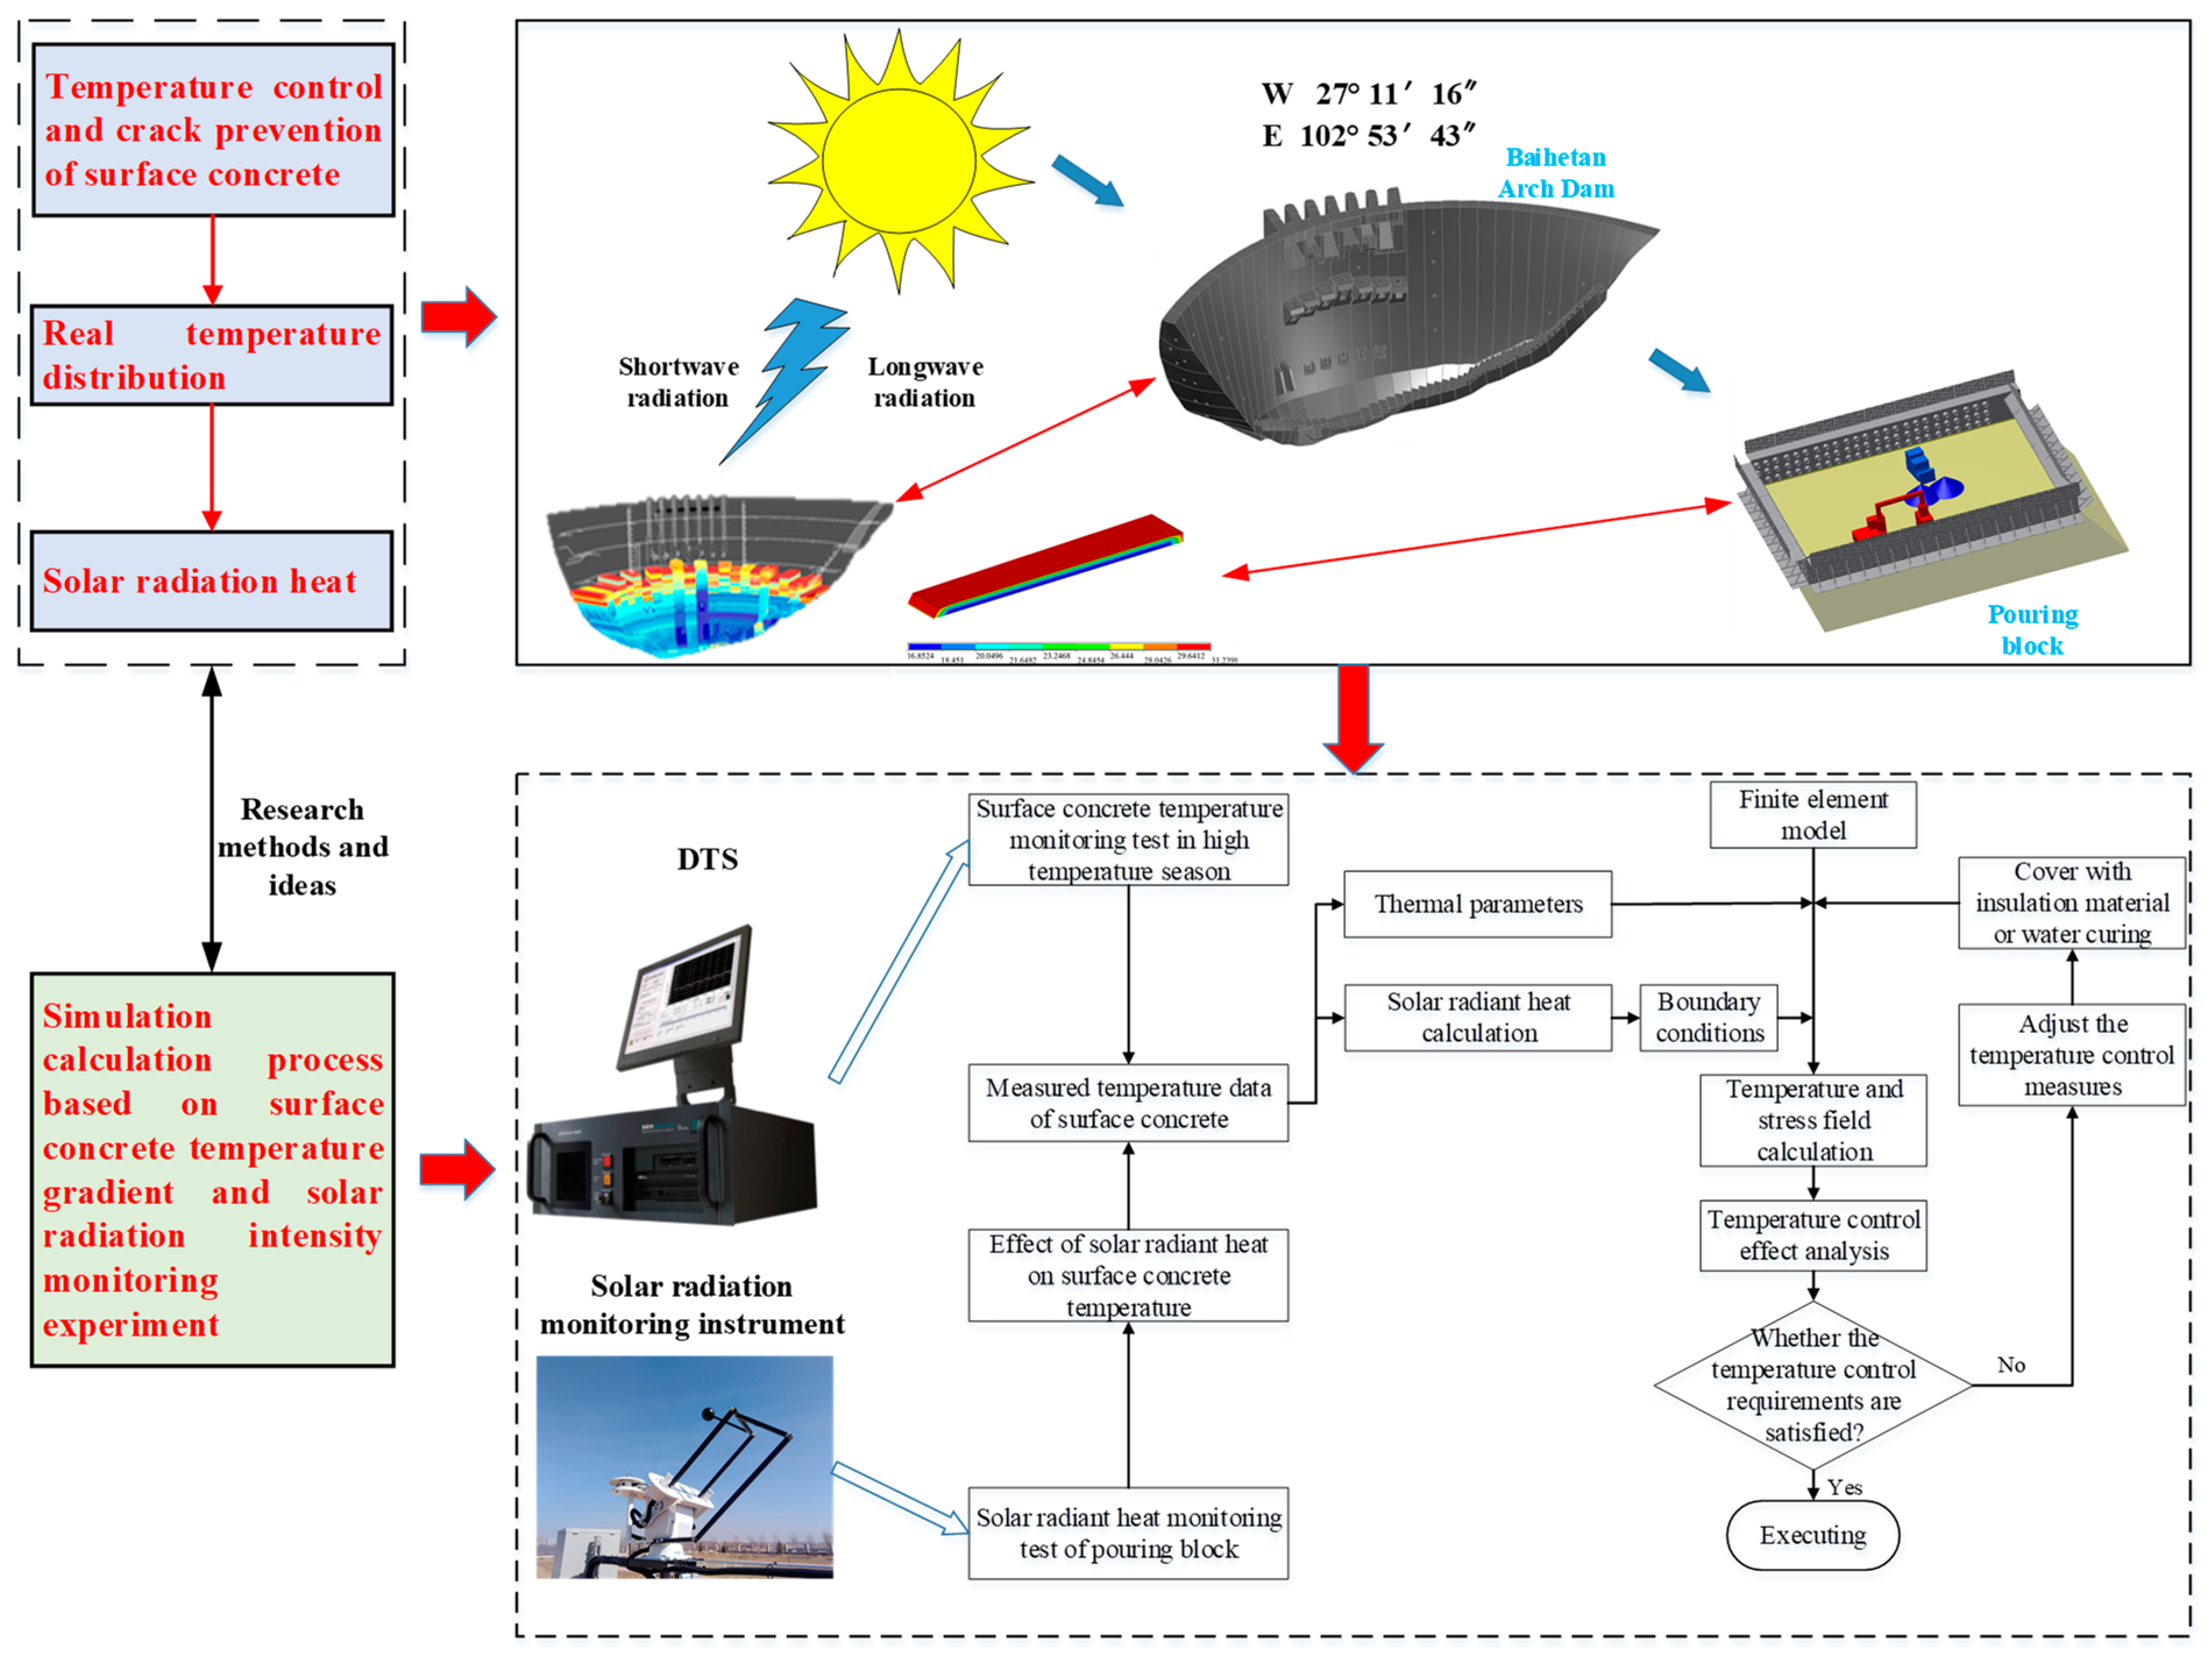
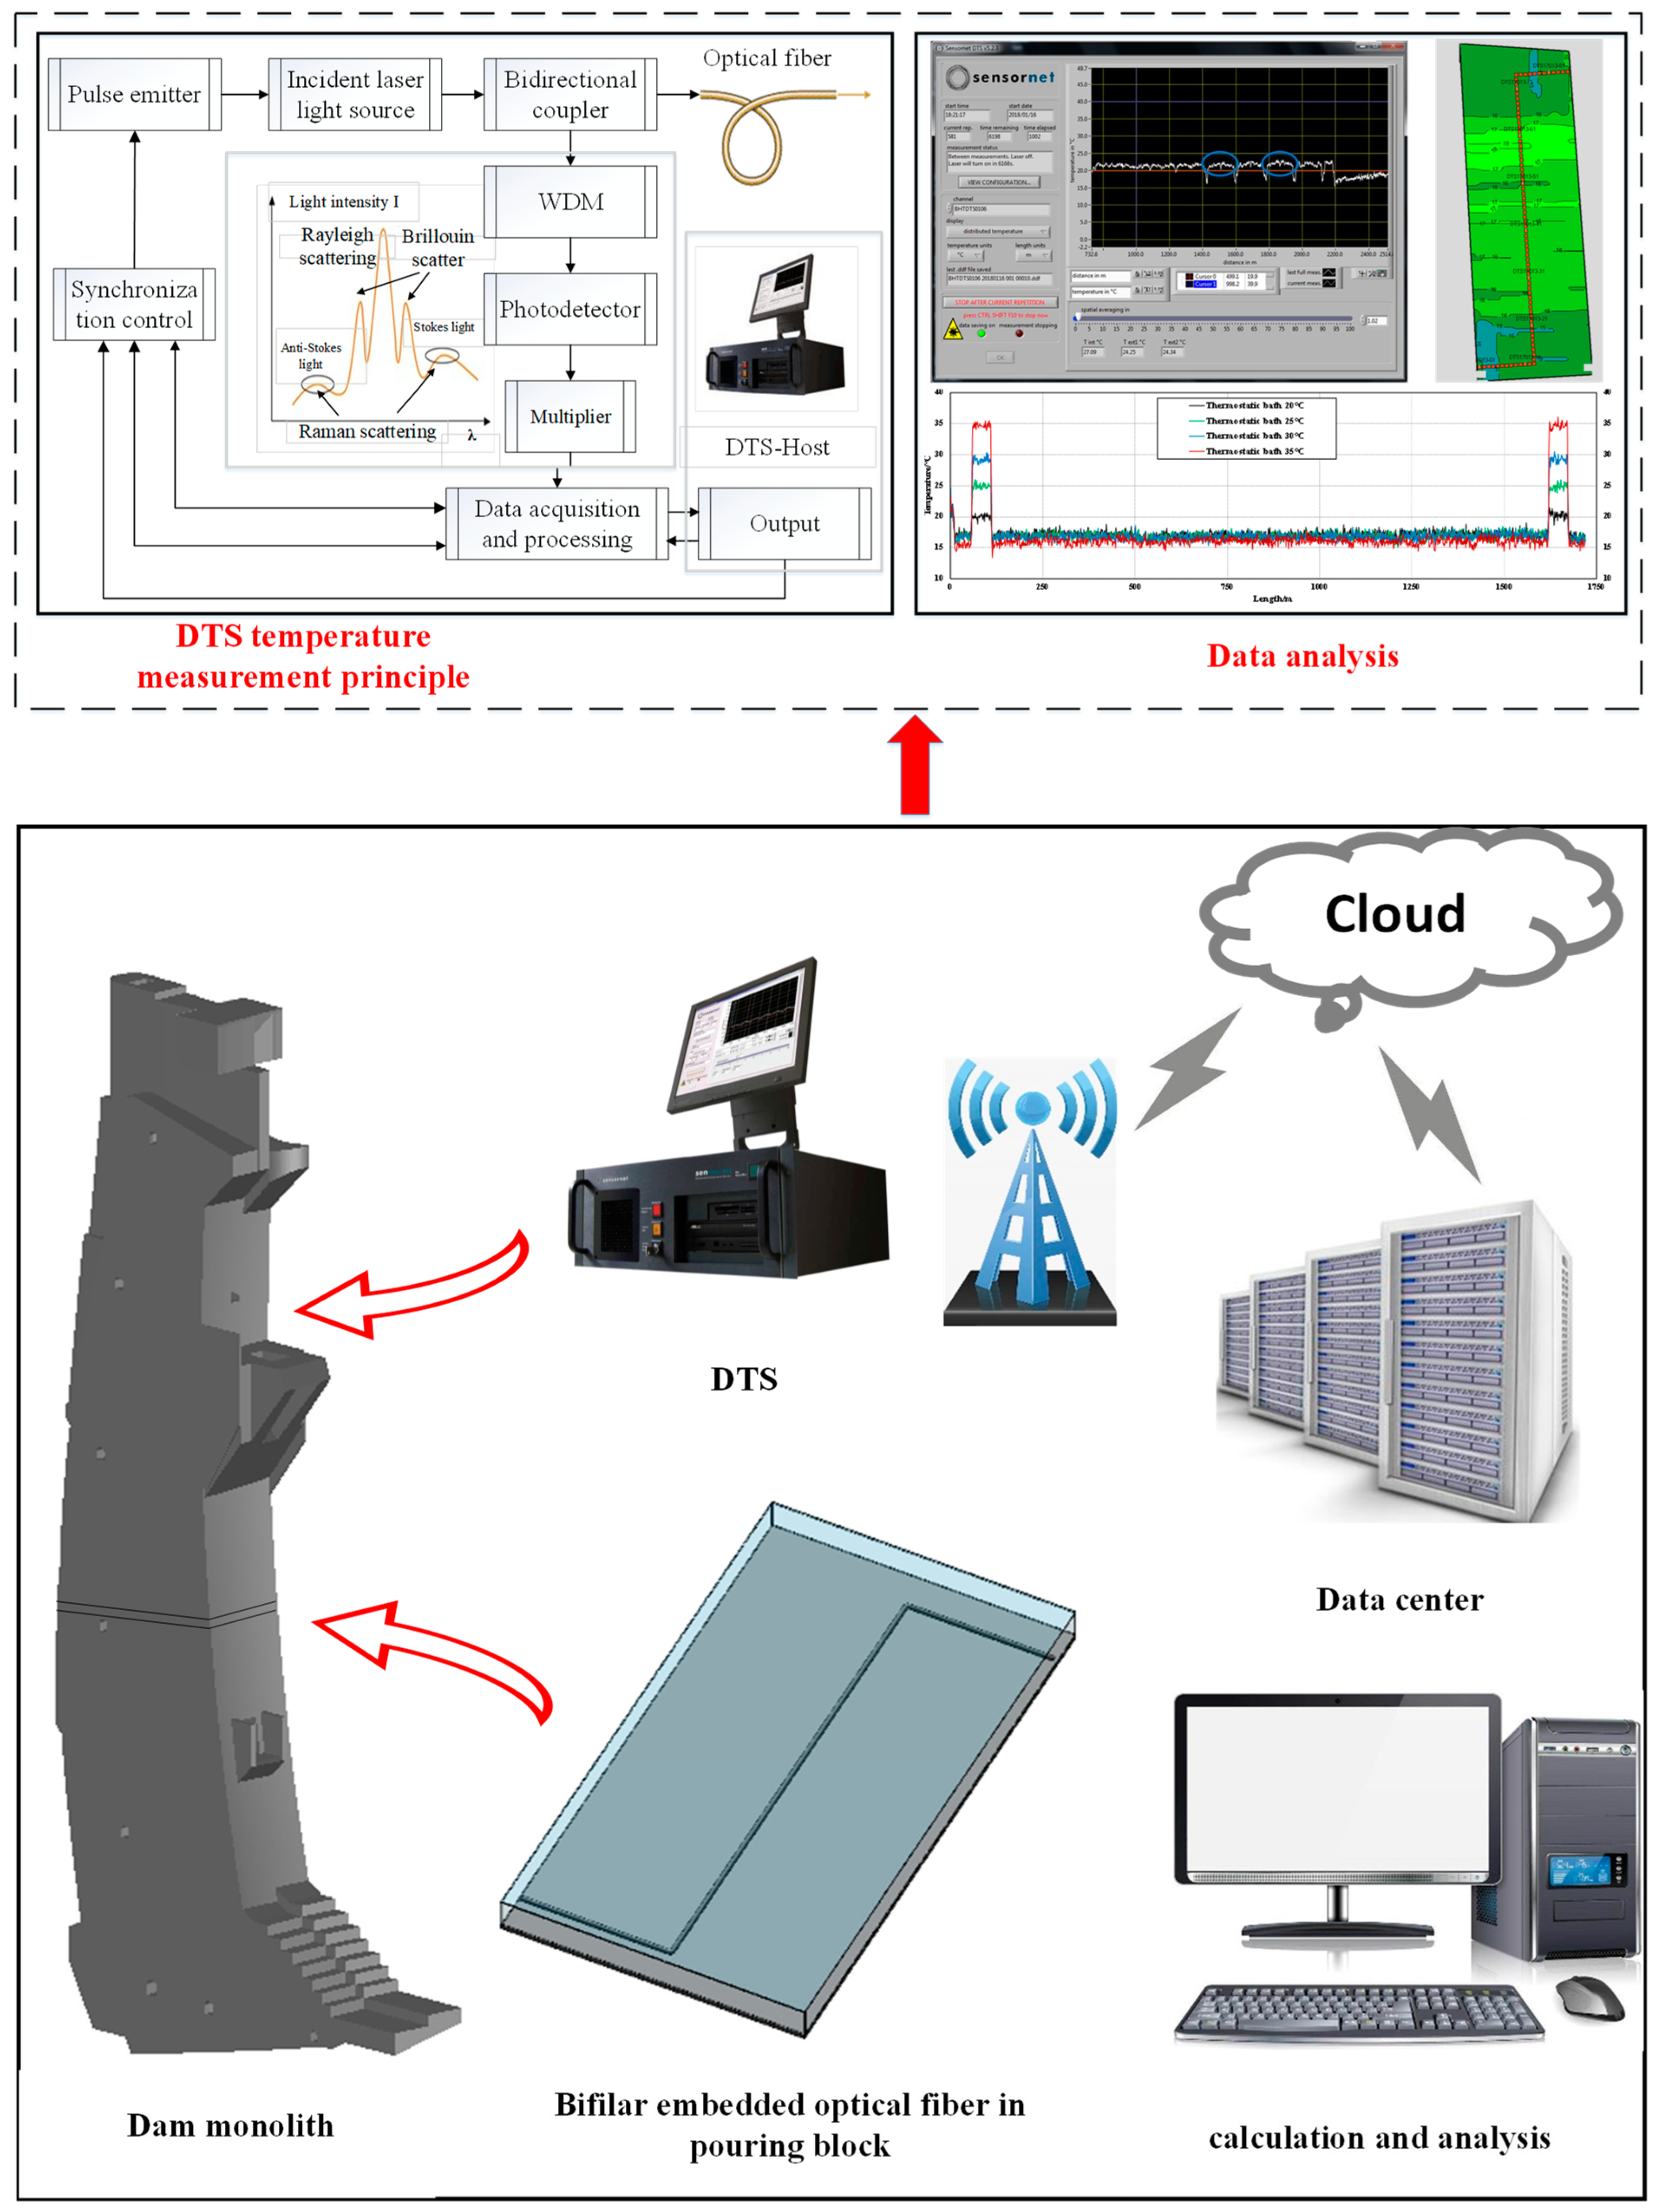
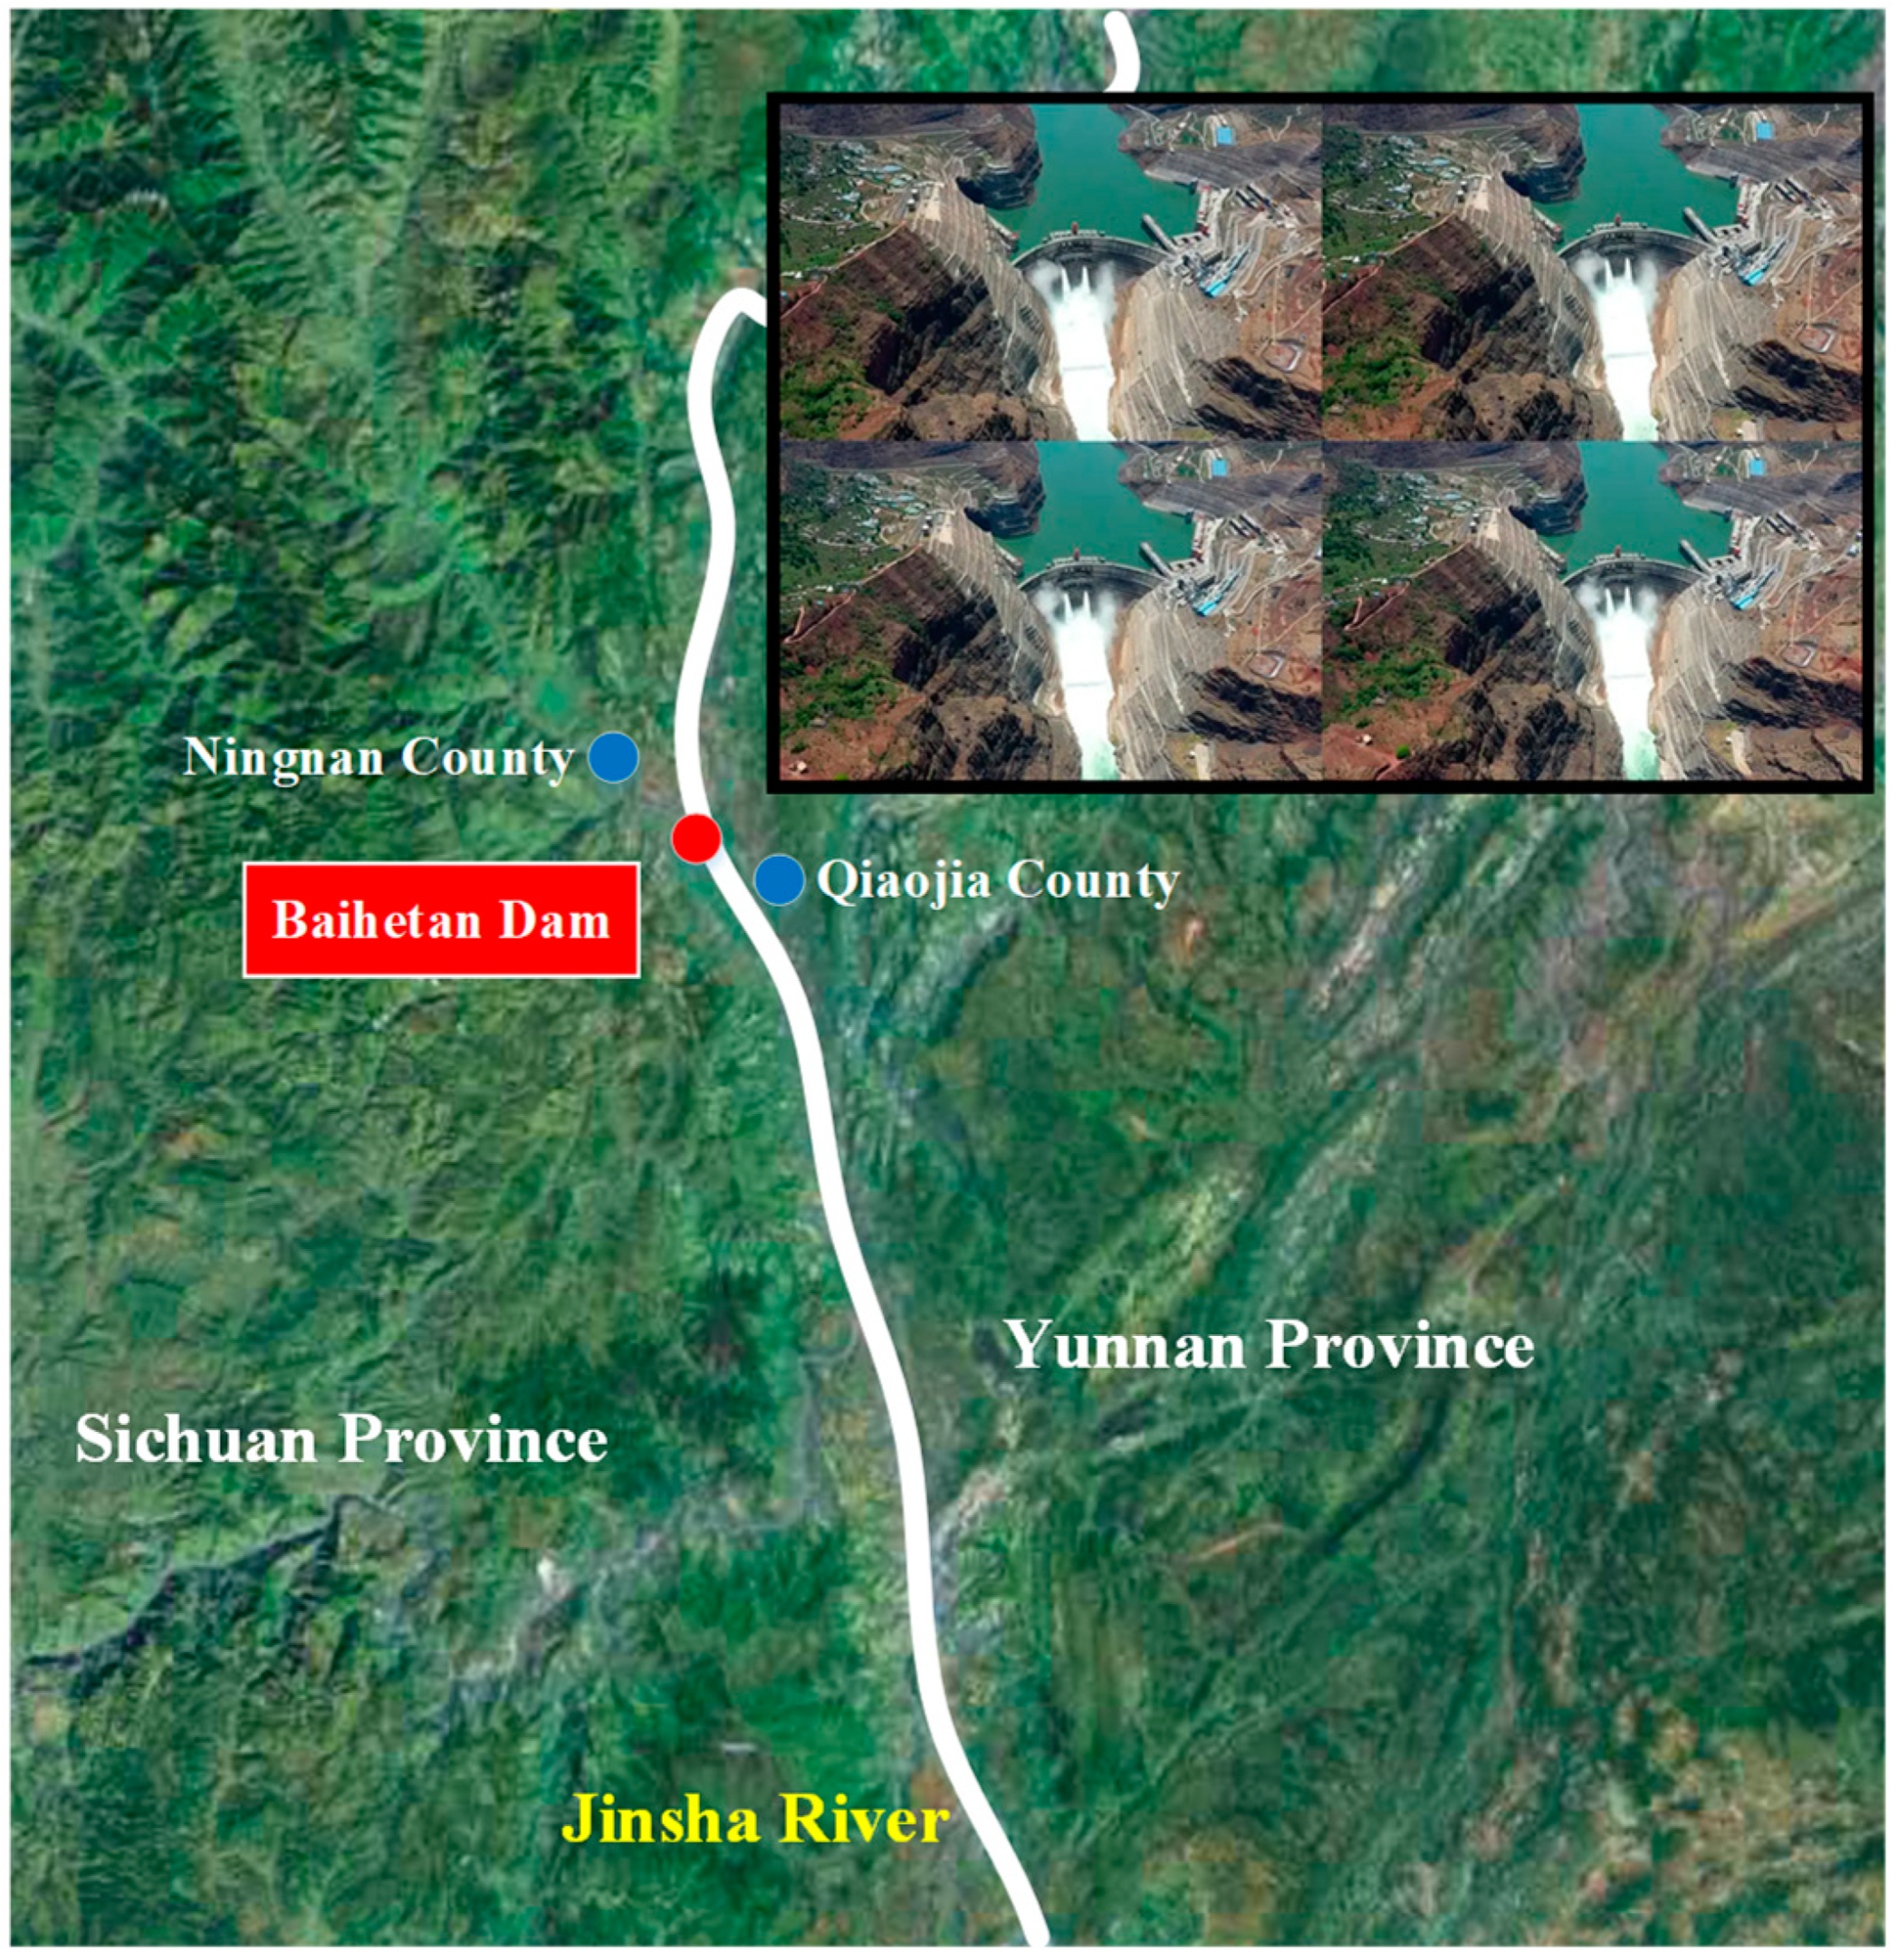
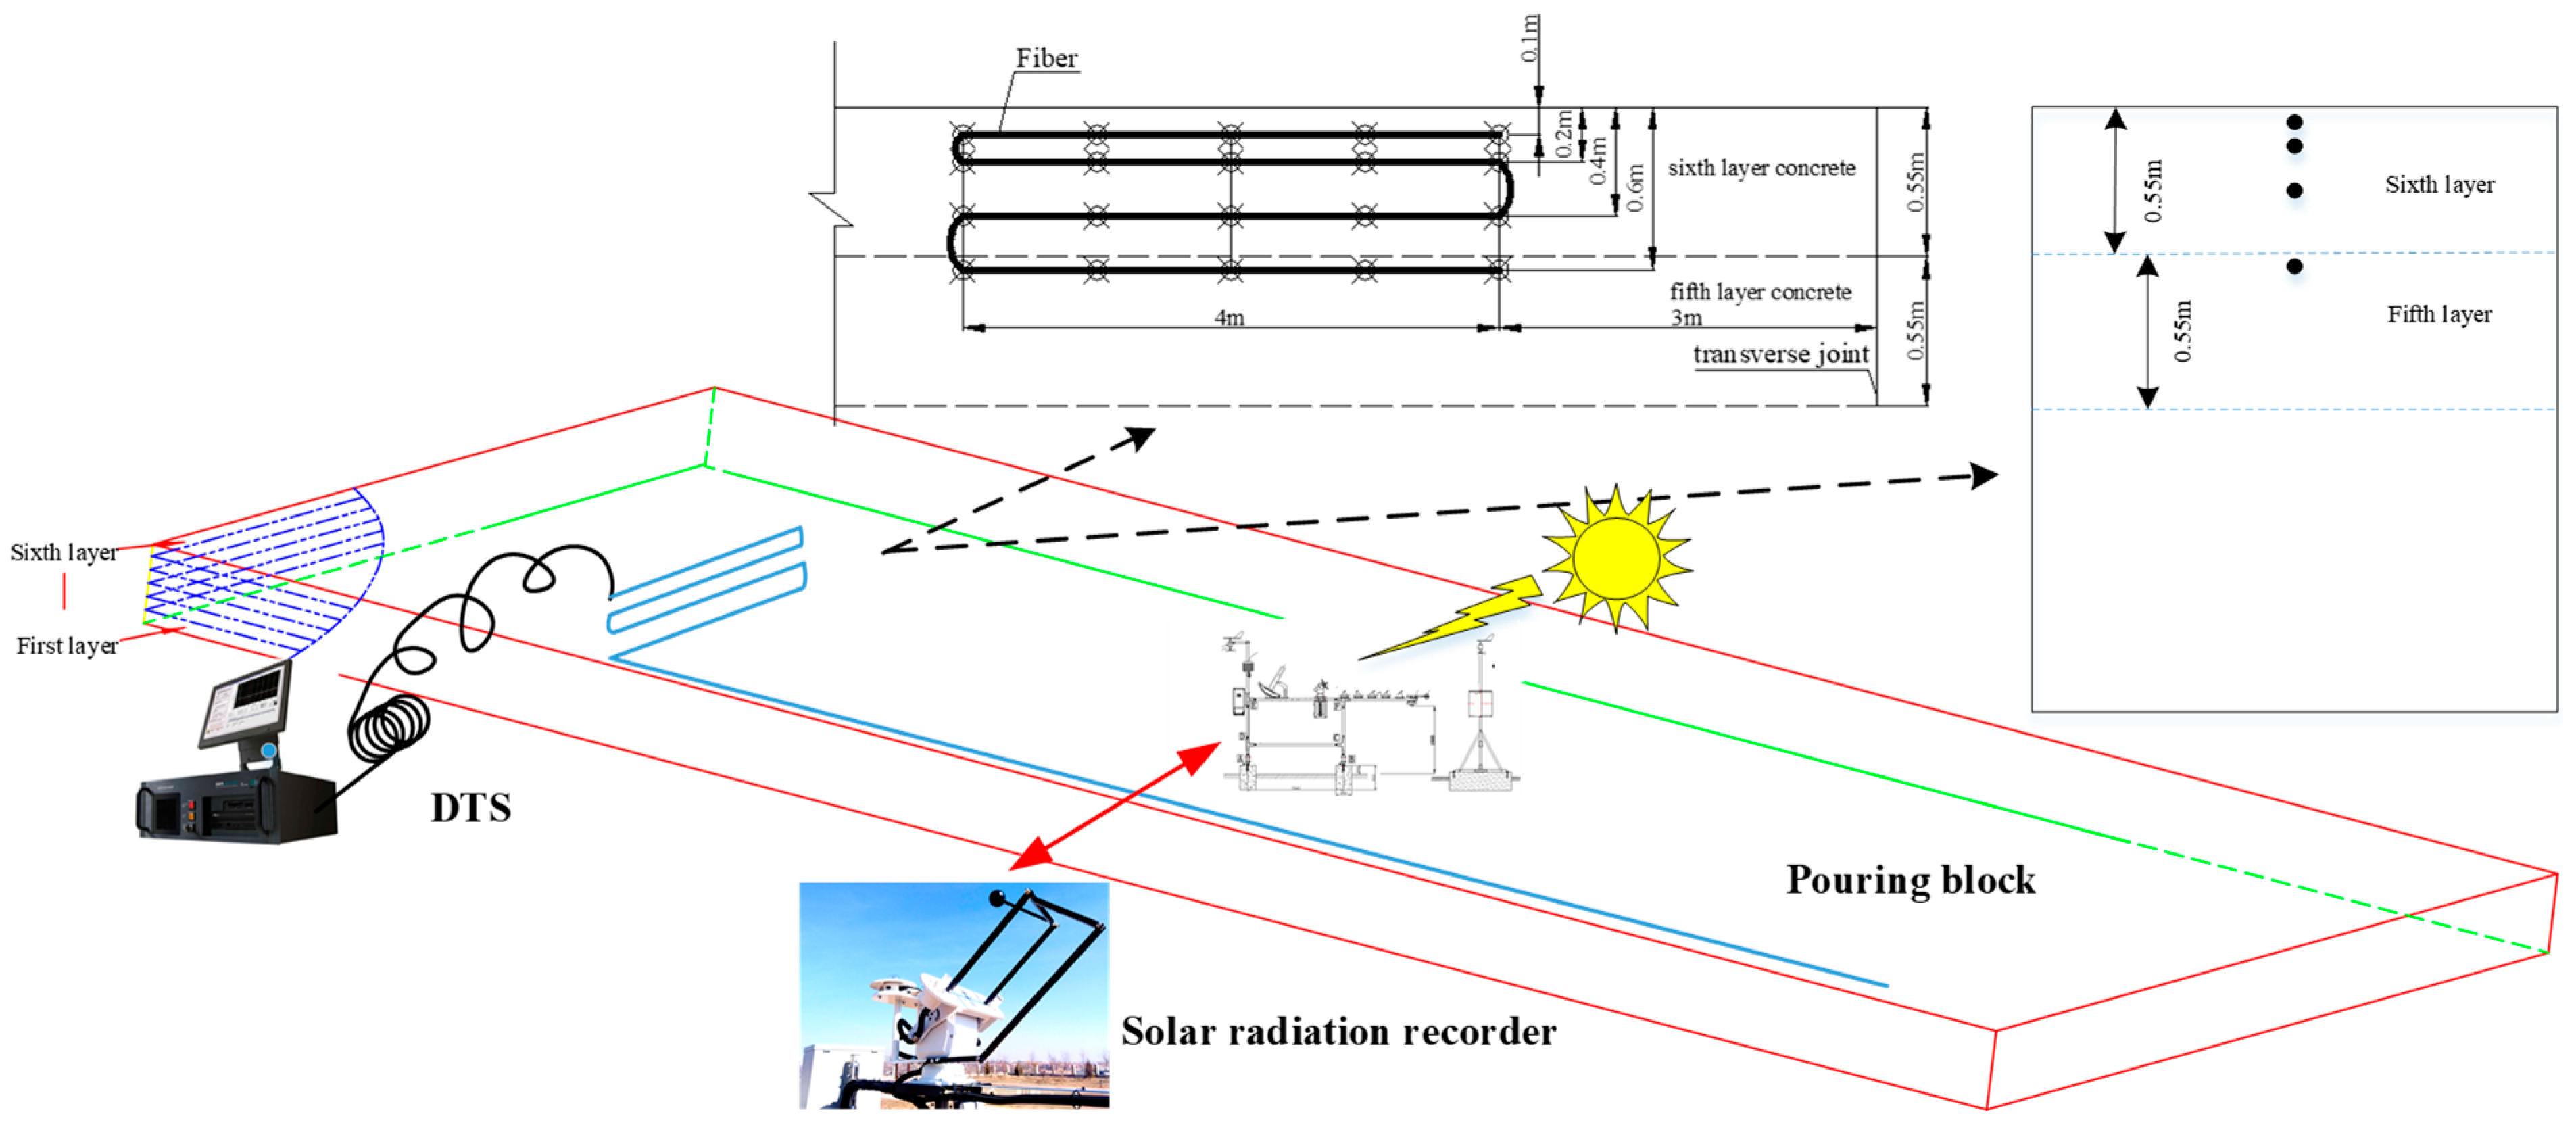
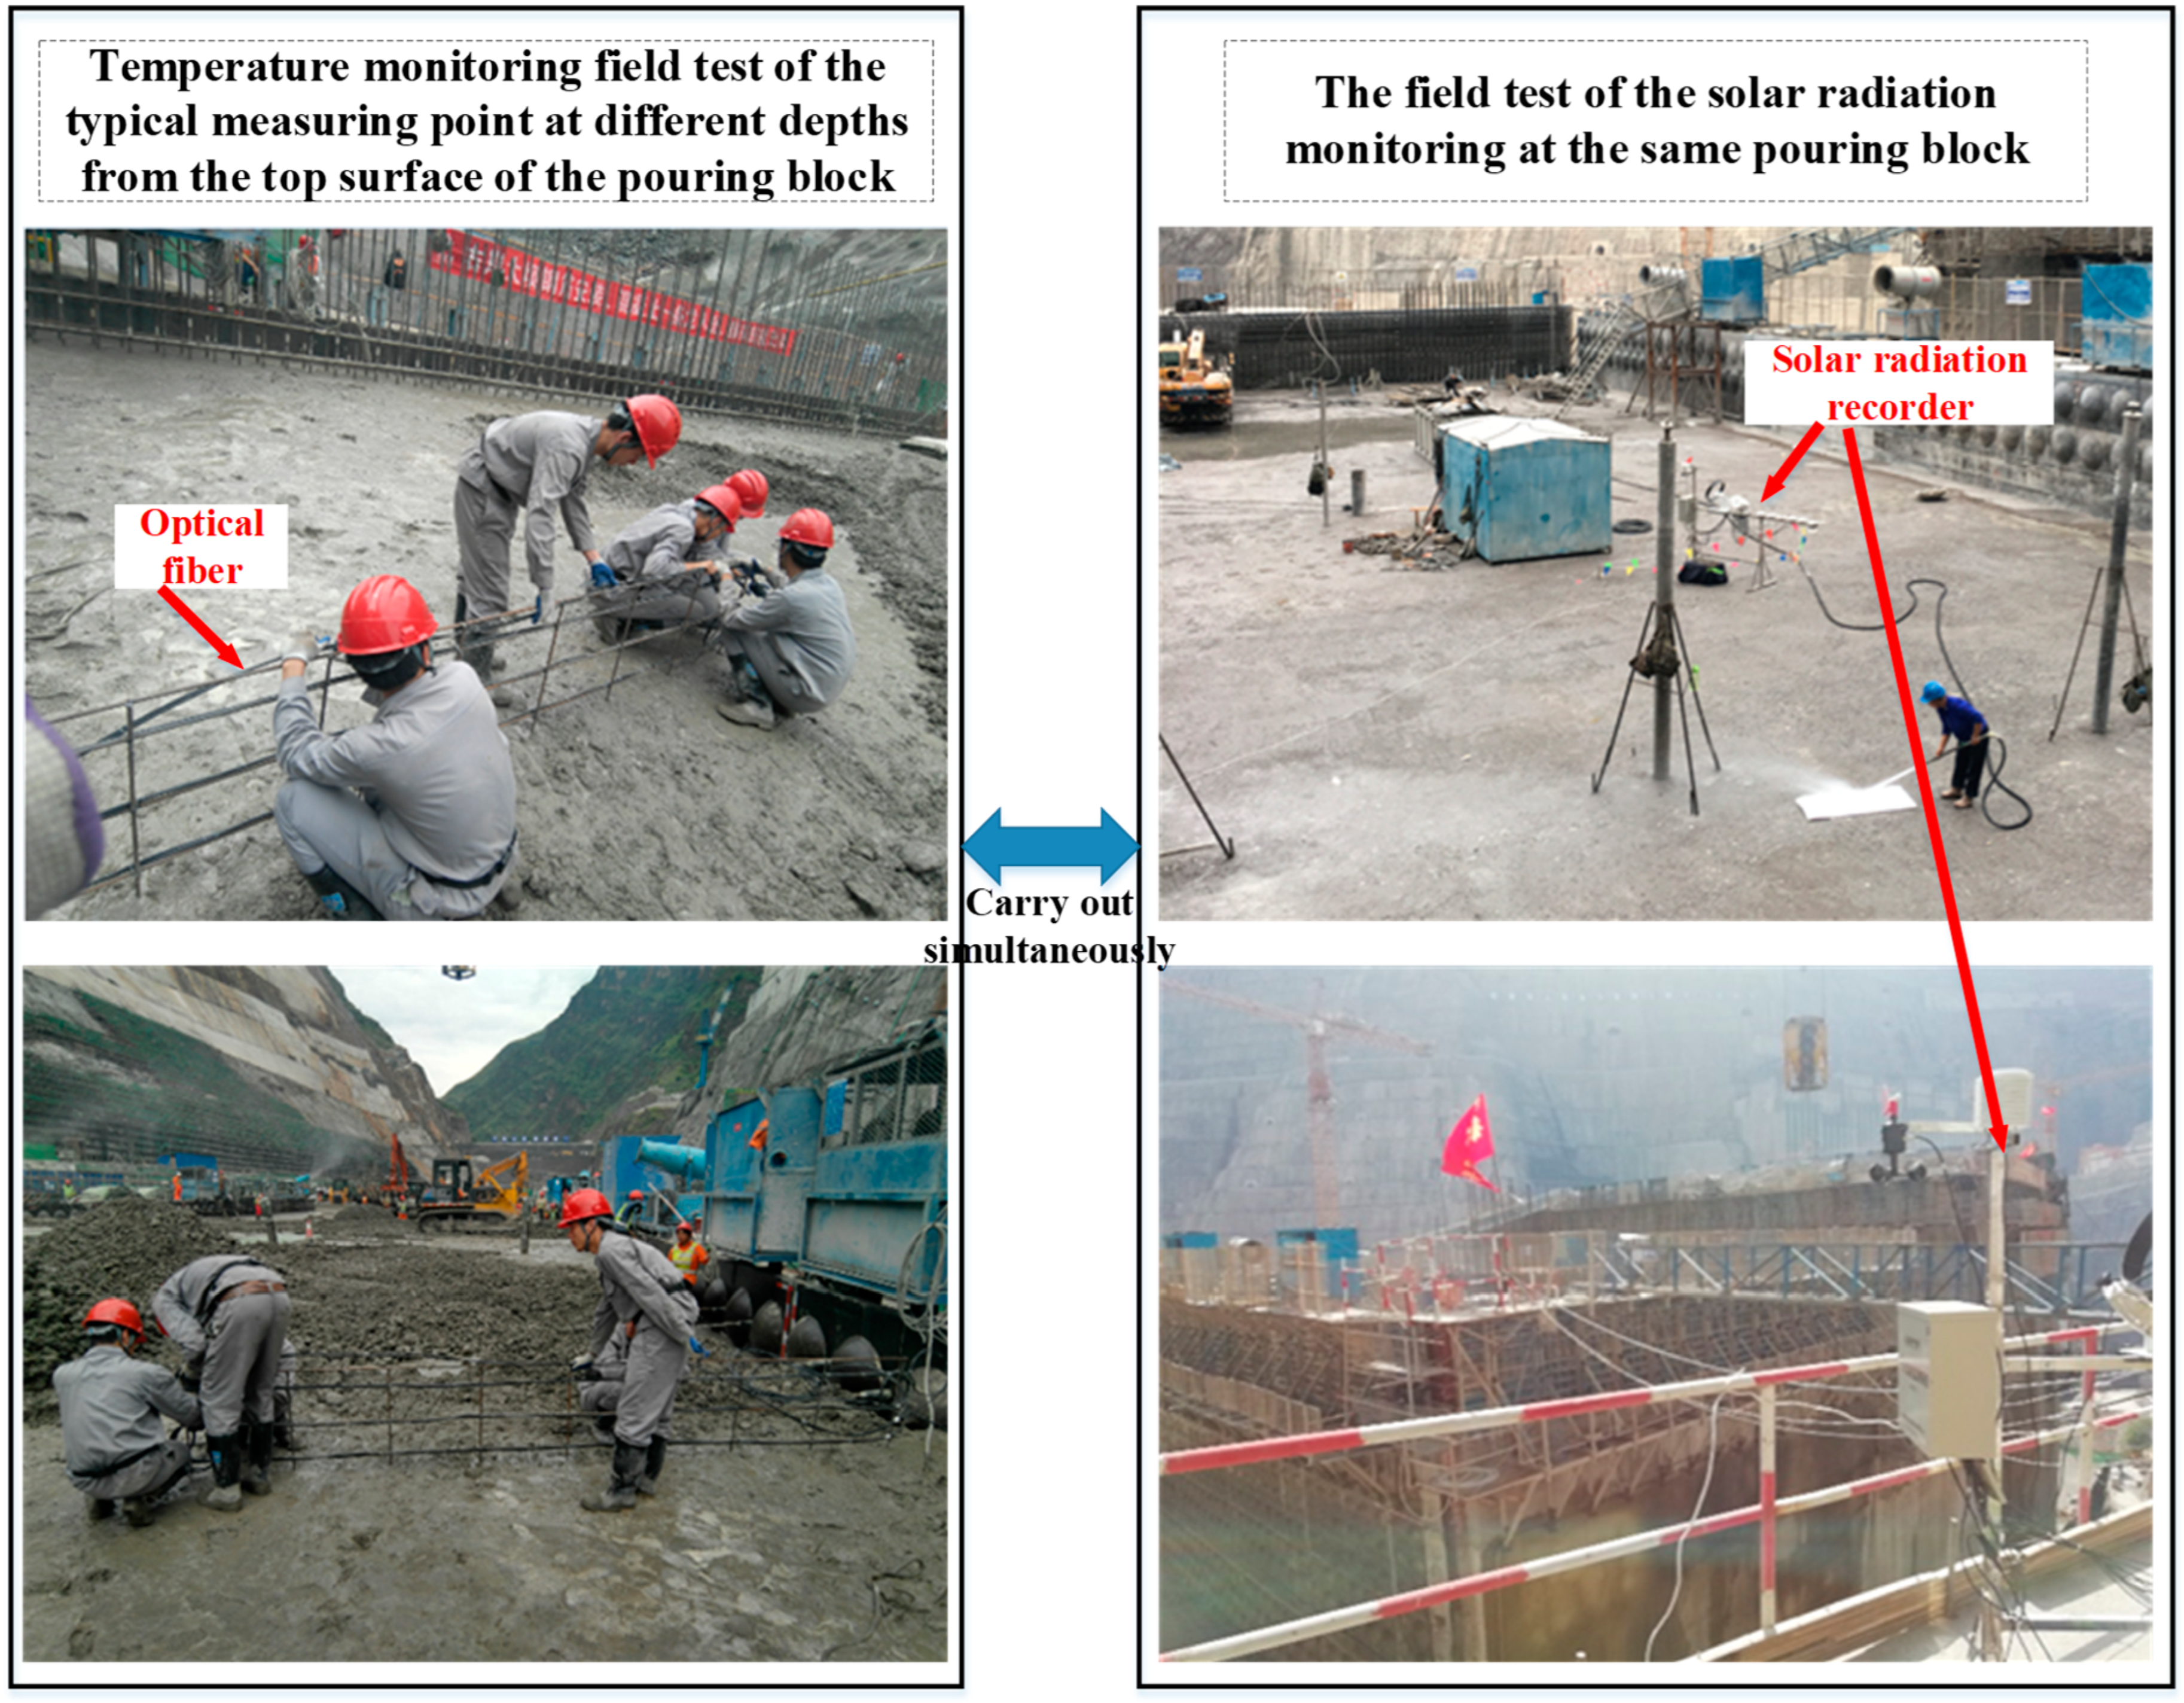
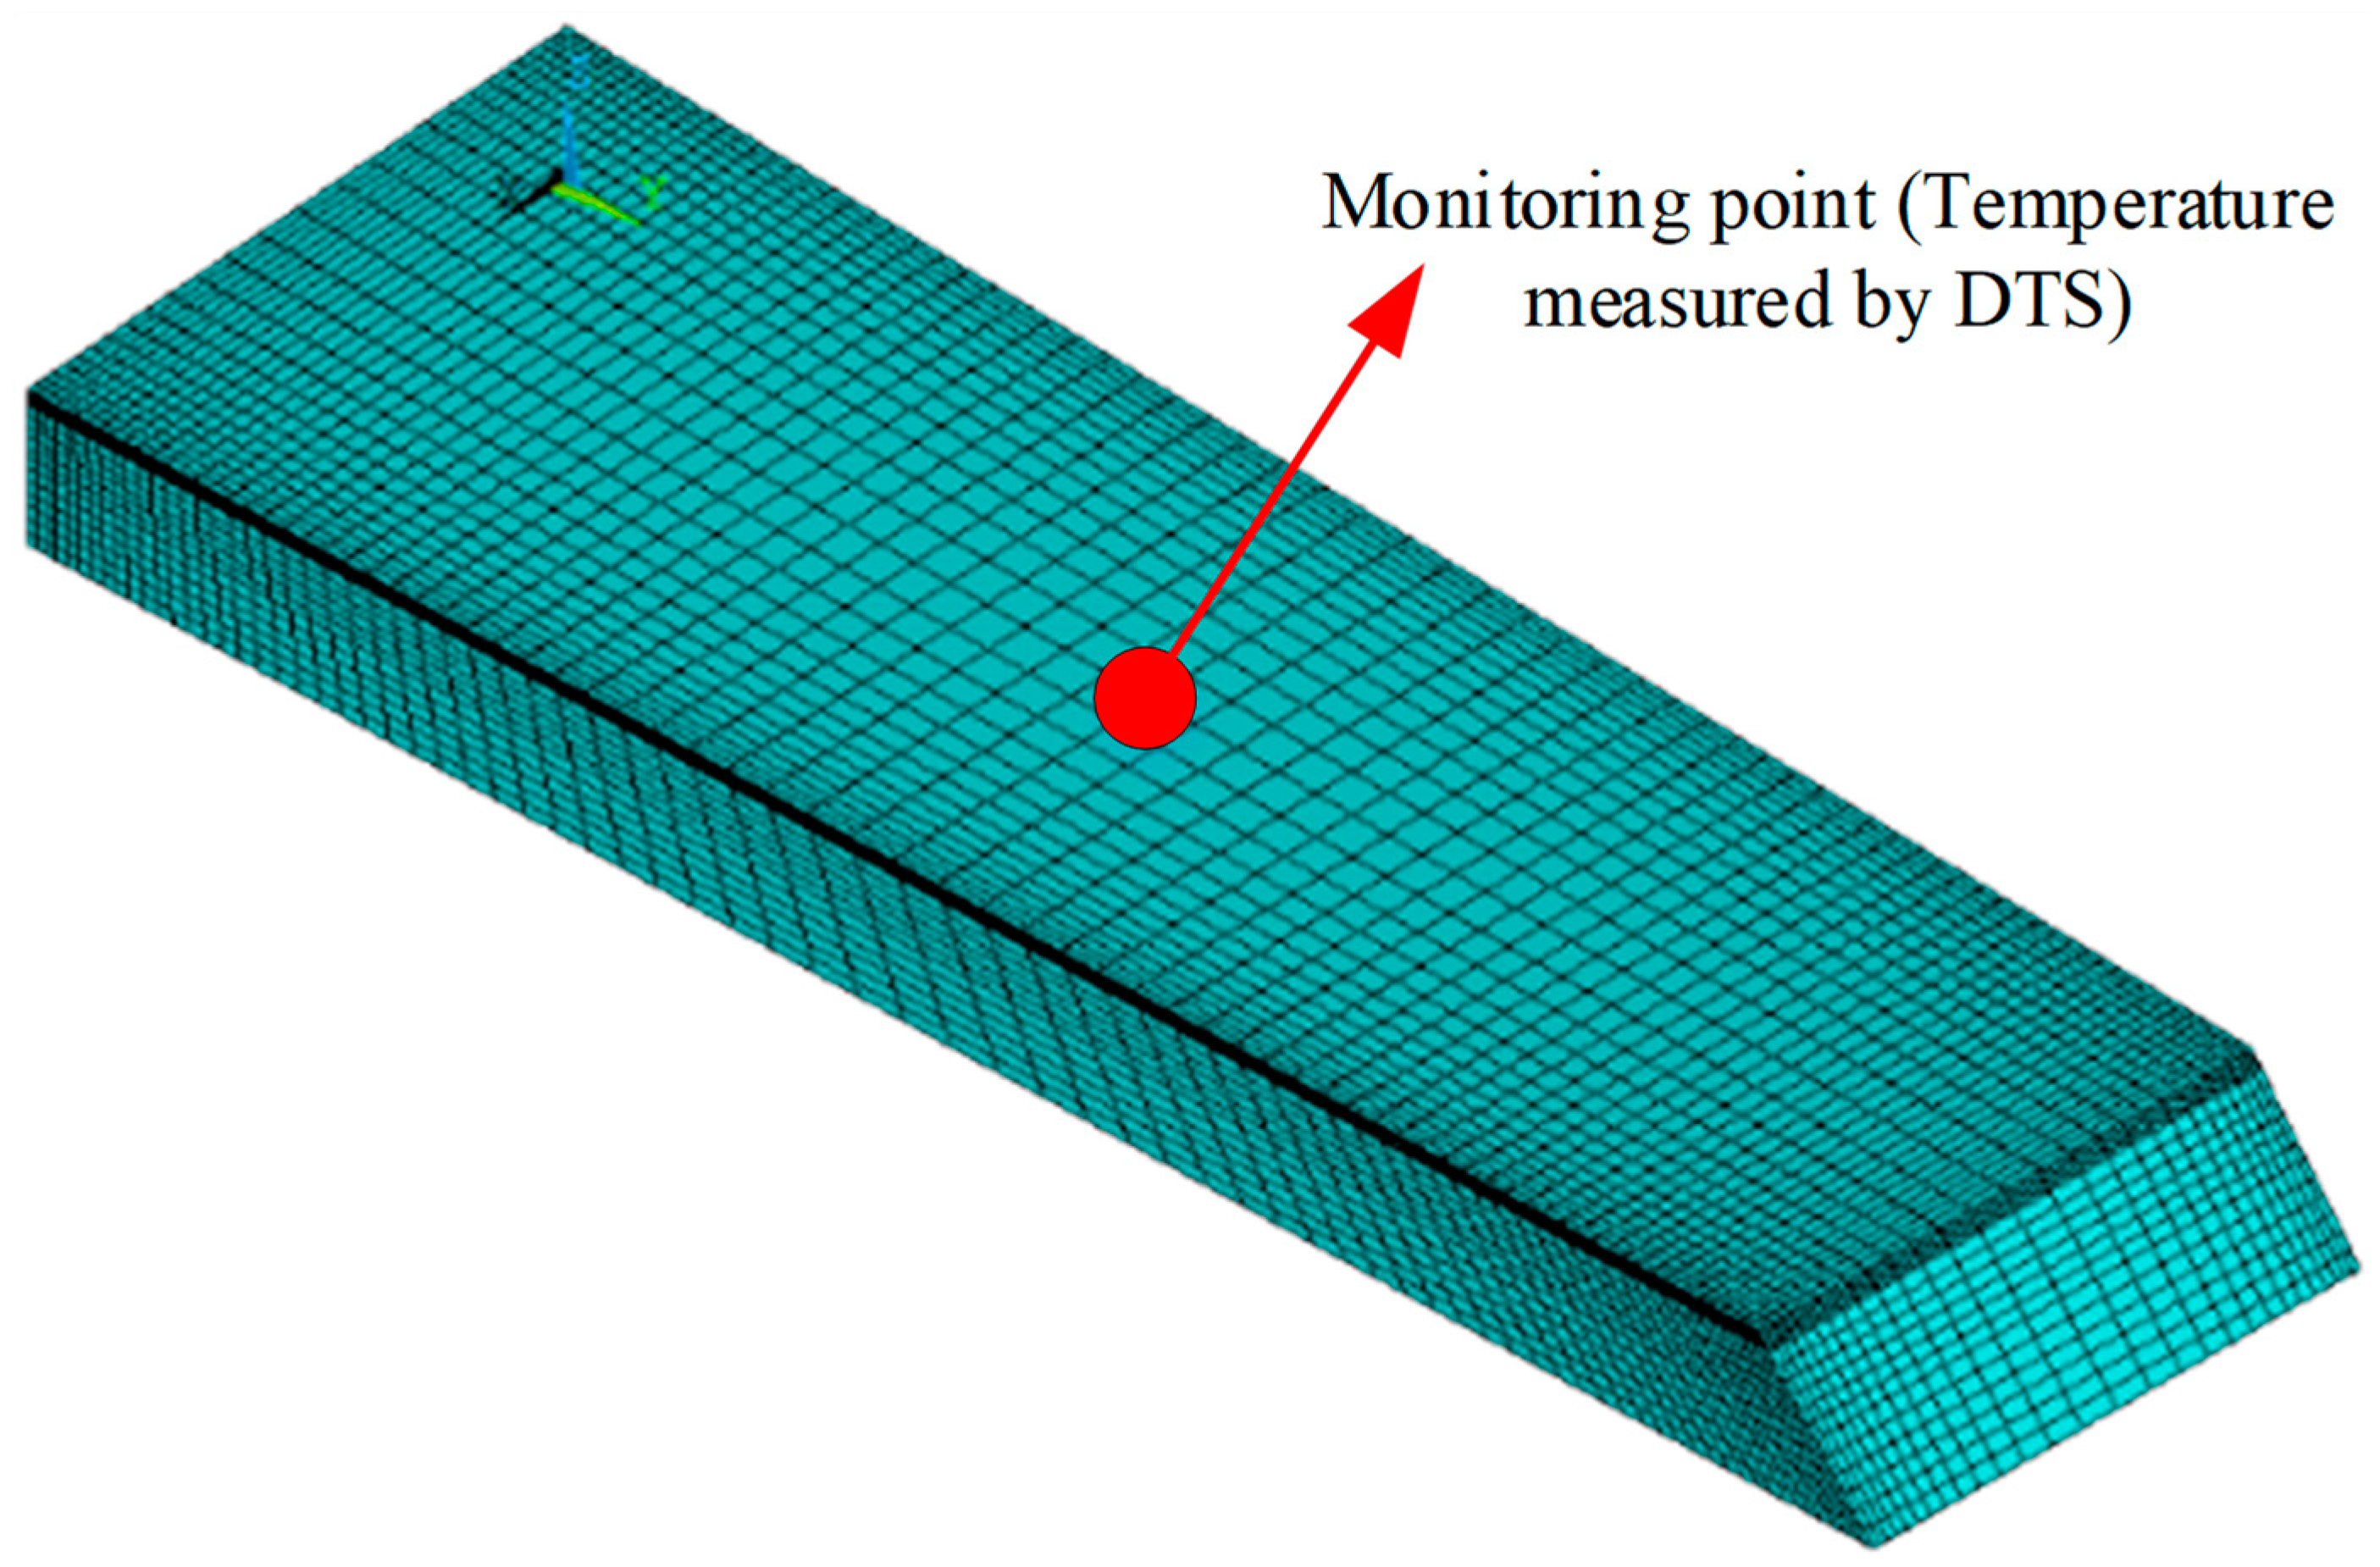
In this research, a typical concrete block of Baihetan high arch dam with low-heat concrete is taken as the research object, a DTS system is used to monitor the surface concrete temperature gradient in real time, and a solar radiation monitoring test is carried out. Based on the measured concrete temperature data and meteorological data, the real thermal parameters of the dam in the high-temperature season are inverted, and the influence of solar radiant heat on the daily variation of the low-heat concrete temperature is analyzed. Meanwhile, a solar radiation loading model and a finite element model have been established. Combined with the measured temperature data and different calculation conditions, the surface temperature changes of medium and low-heat concrete under solar radiation are analyzed, and the temperature control effect of surface concrete with different surface insulation measures is further analyzed. Based on this, the feedback analysis of the surface temperature state of low-heat concrete with and without the influence of solar radiation and with different temperature control measures under the same solar radiation intensity is compared and analyzed. In addition, more targeted low-heat pouring block surface insulation measures are proposed and analyzed based on the monitored temperature data and finite element calculation results. This research can provide guidance for the formulation and implementation of reasonable temperature control measures for the surface concrete of Baihetan dam pouring blocks, which is of great significance for improving the quality of concrete.
Figure 1 shows the overall technology roadmap.
4. Conclusions
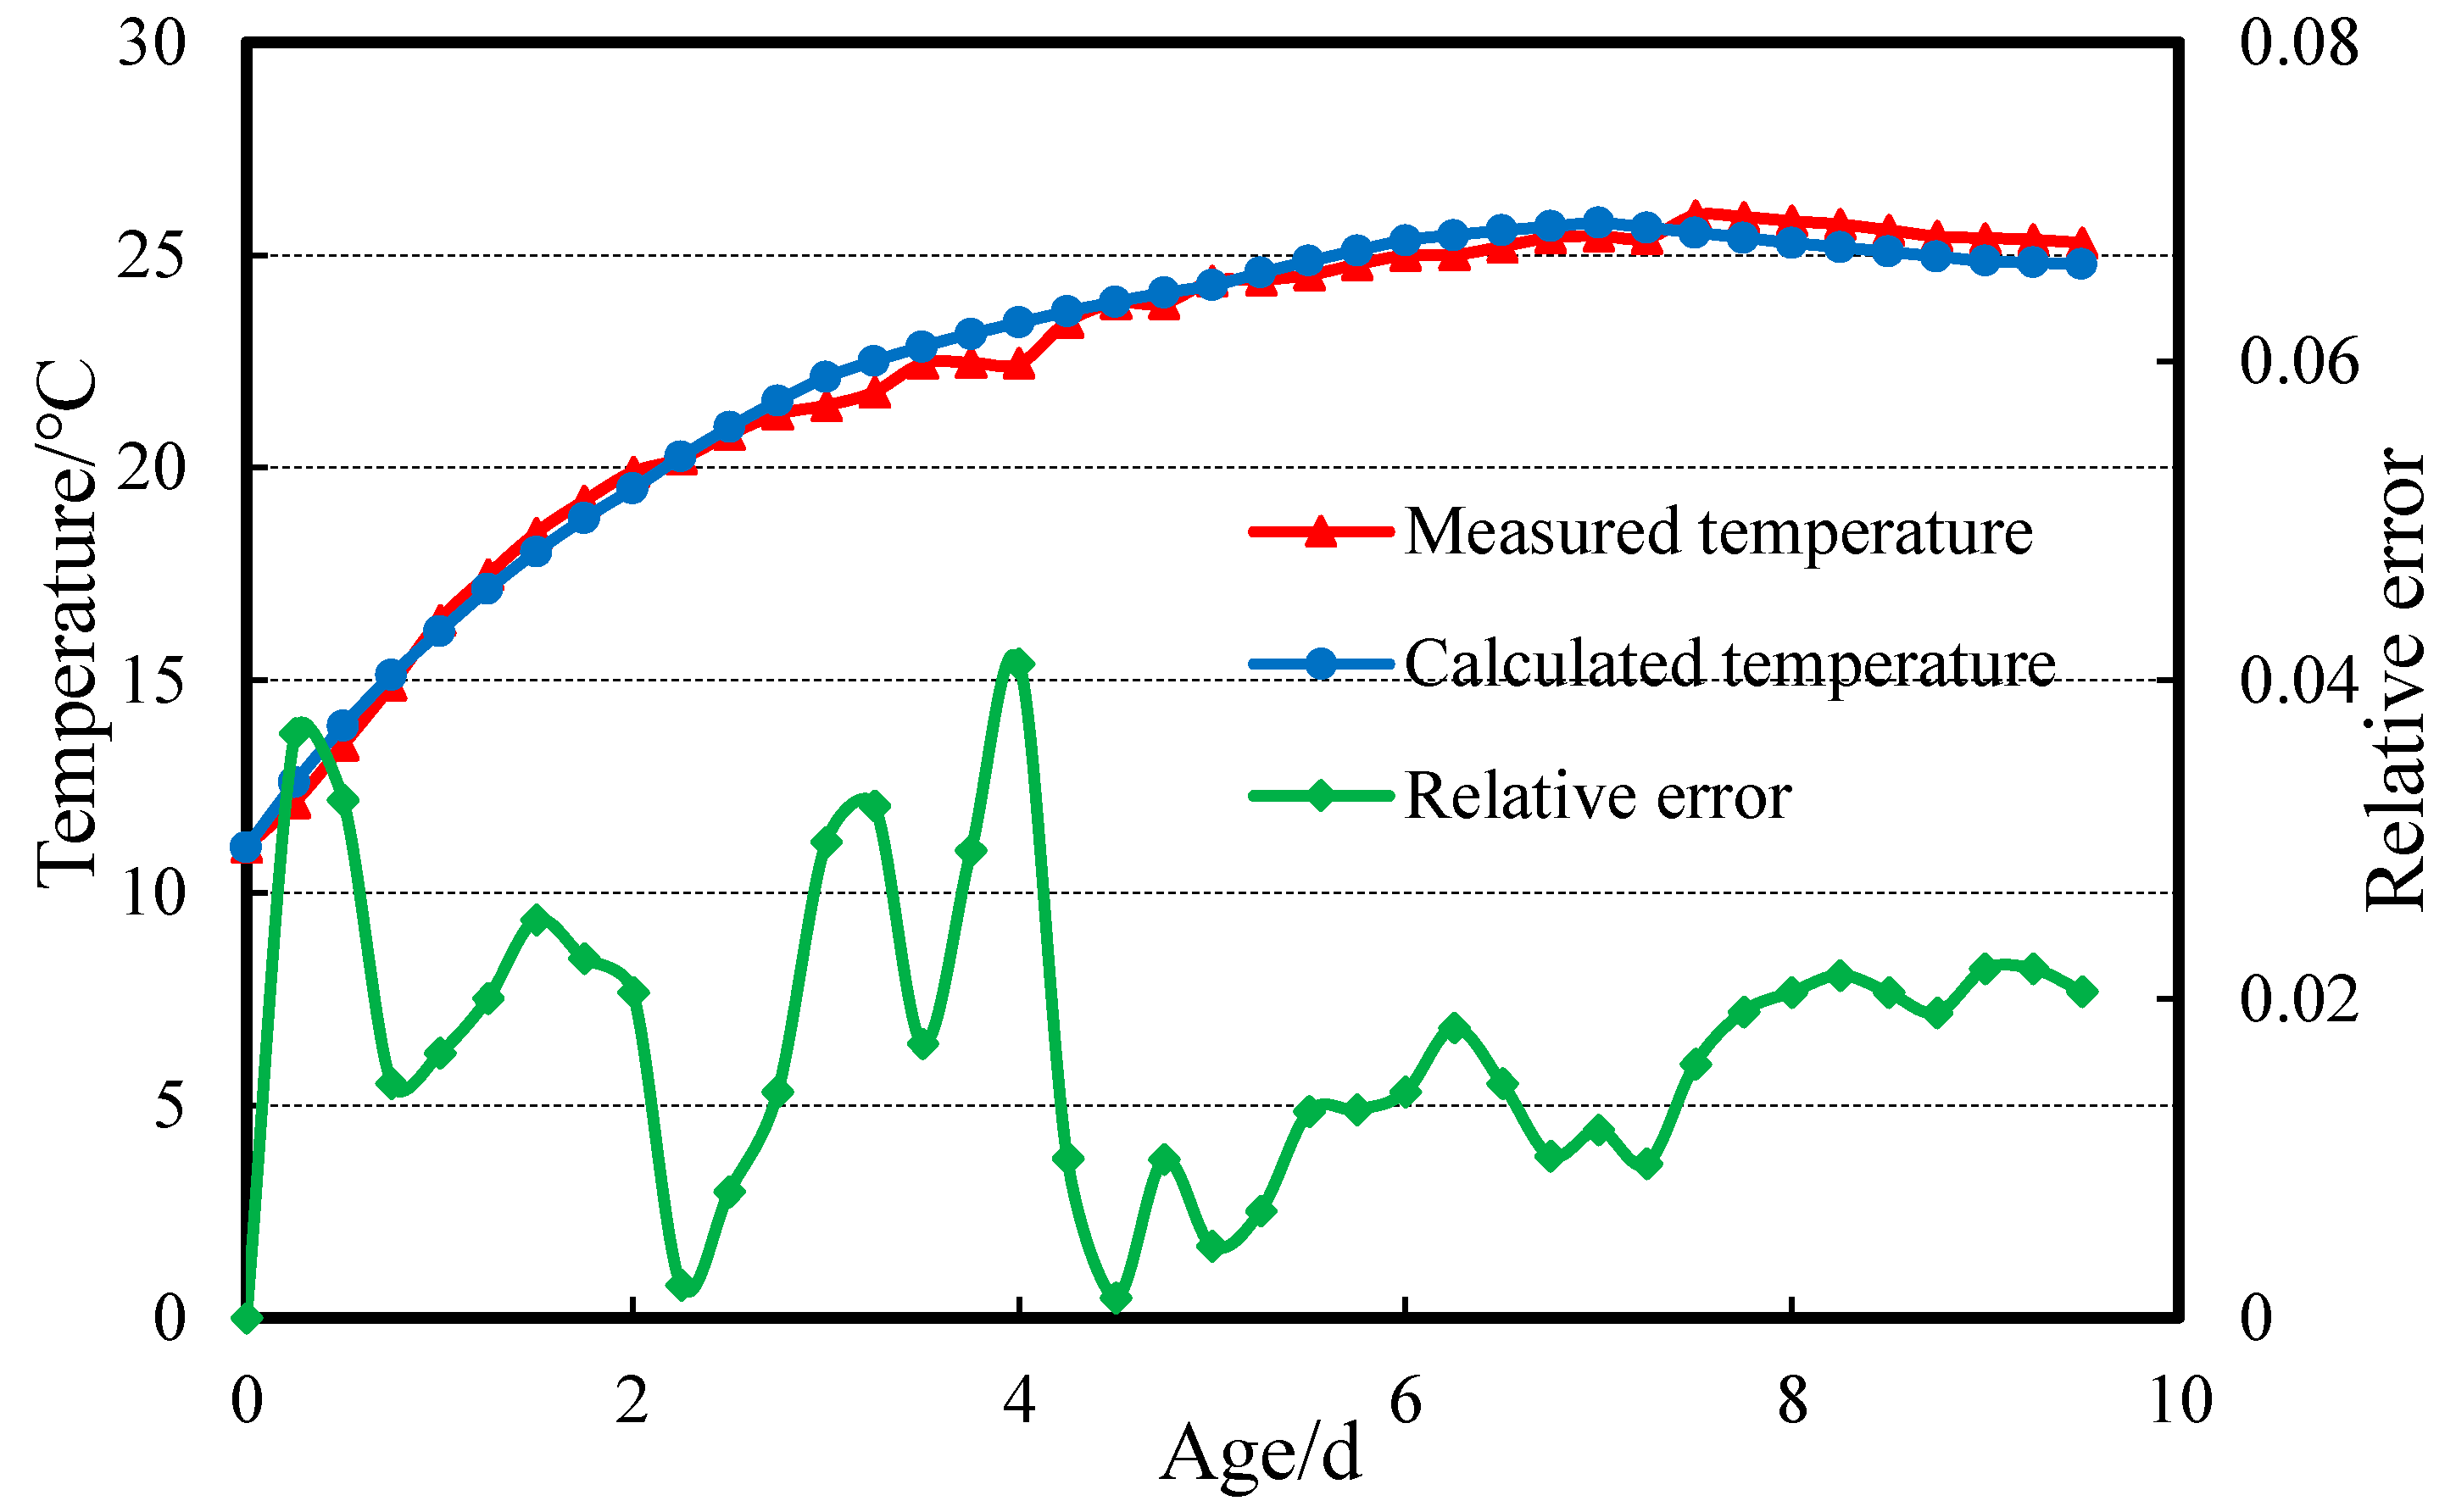
In this study, a DTS system is applied to monitor the surface temperature gradient of concrete in real time, and a solar radiation heat monitoring test is also carried out based on the Baihetan project. Based on this, a solar radiation loading model and a finite element model of a typical pouring block are established. Combined with the measured temperature data and different calculation conditions, the surface temperature changes of medium and low-heat concrete under solar radiation are analyzed, and the temperature control effect of surface concrete with different surface insulation measures is further analyzed. The following results can be obtained:
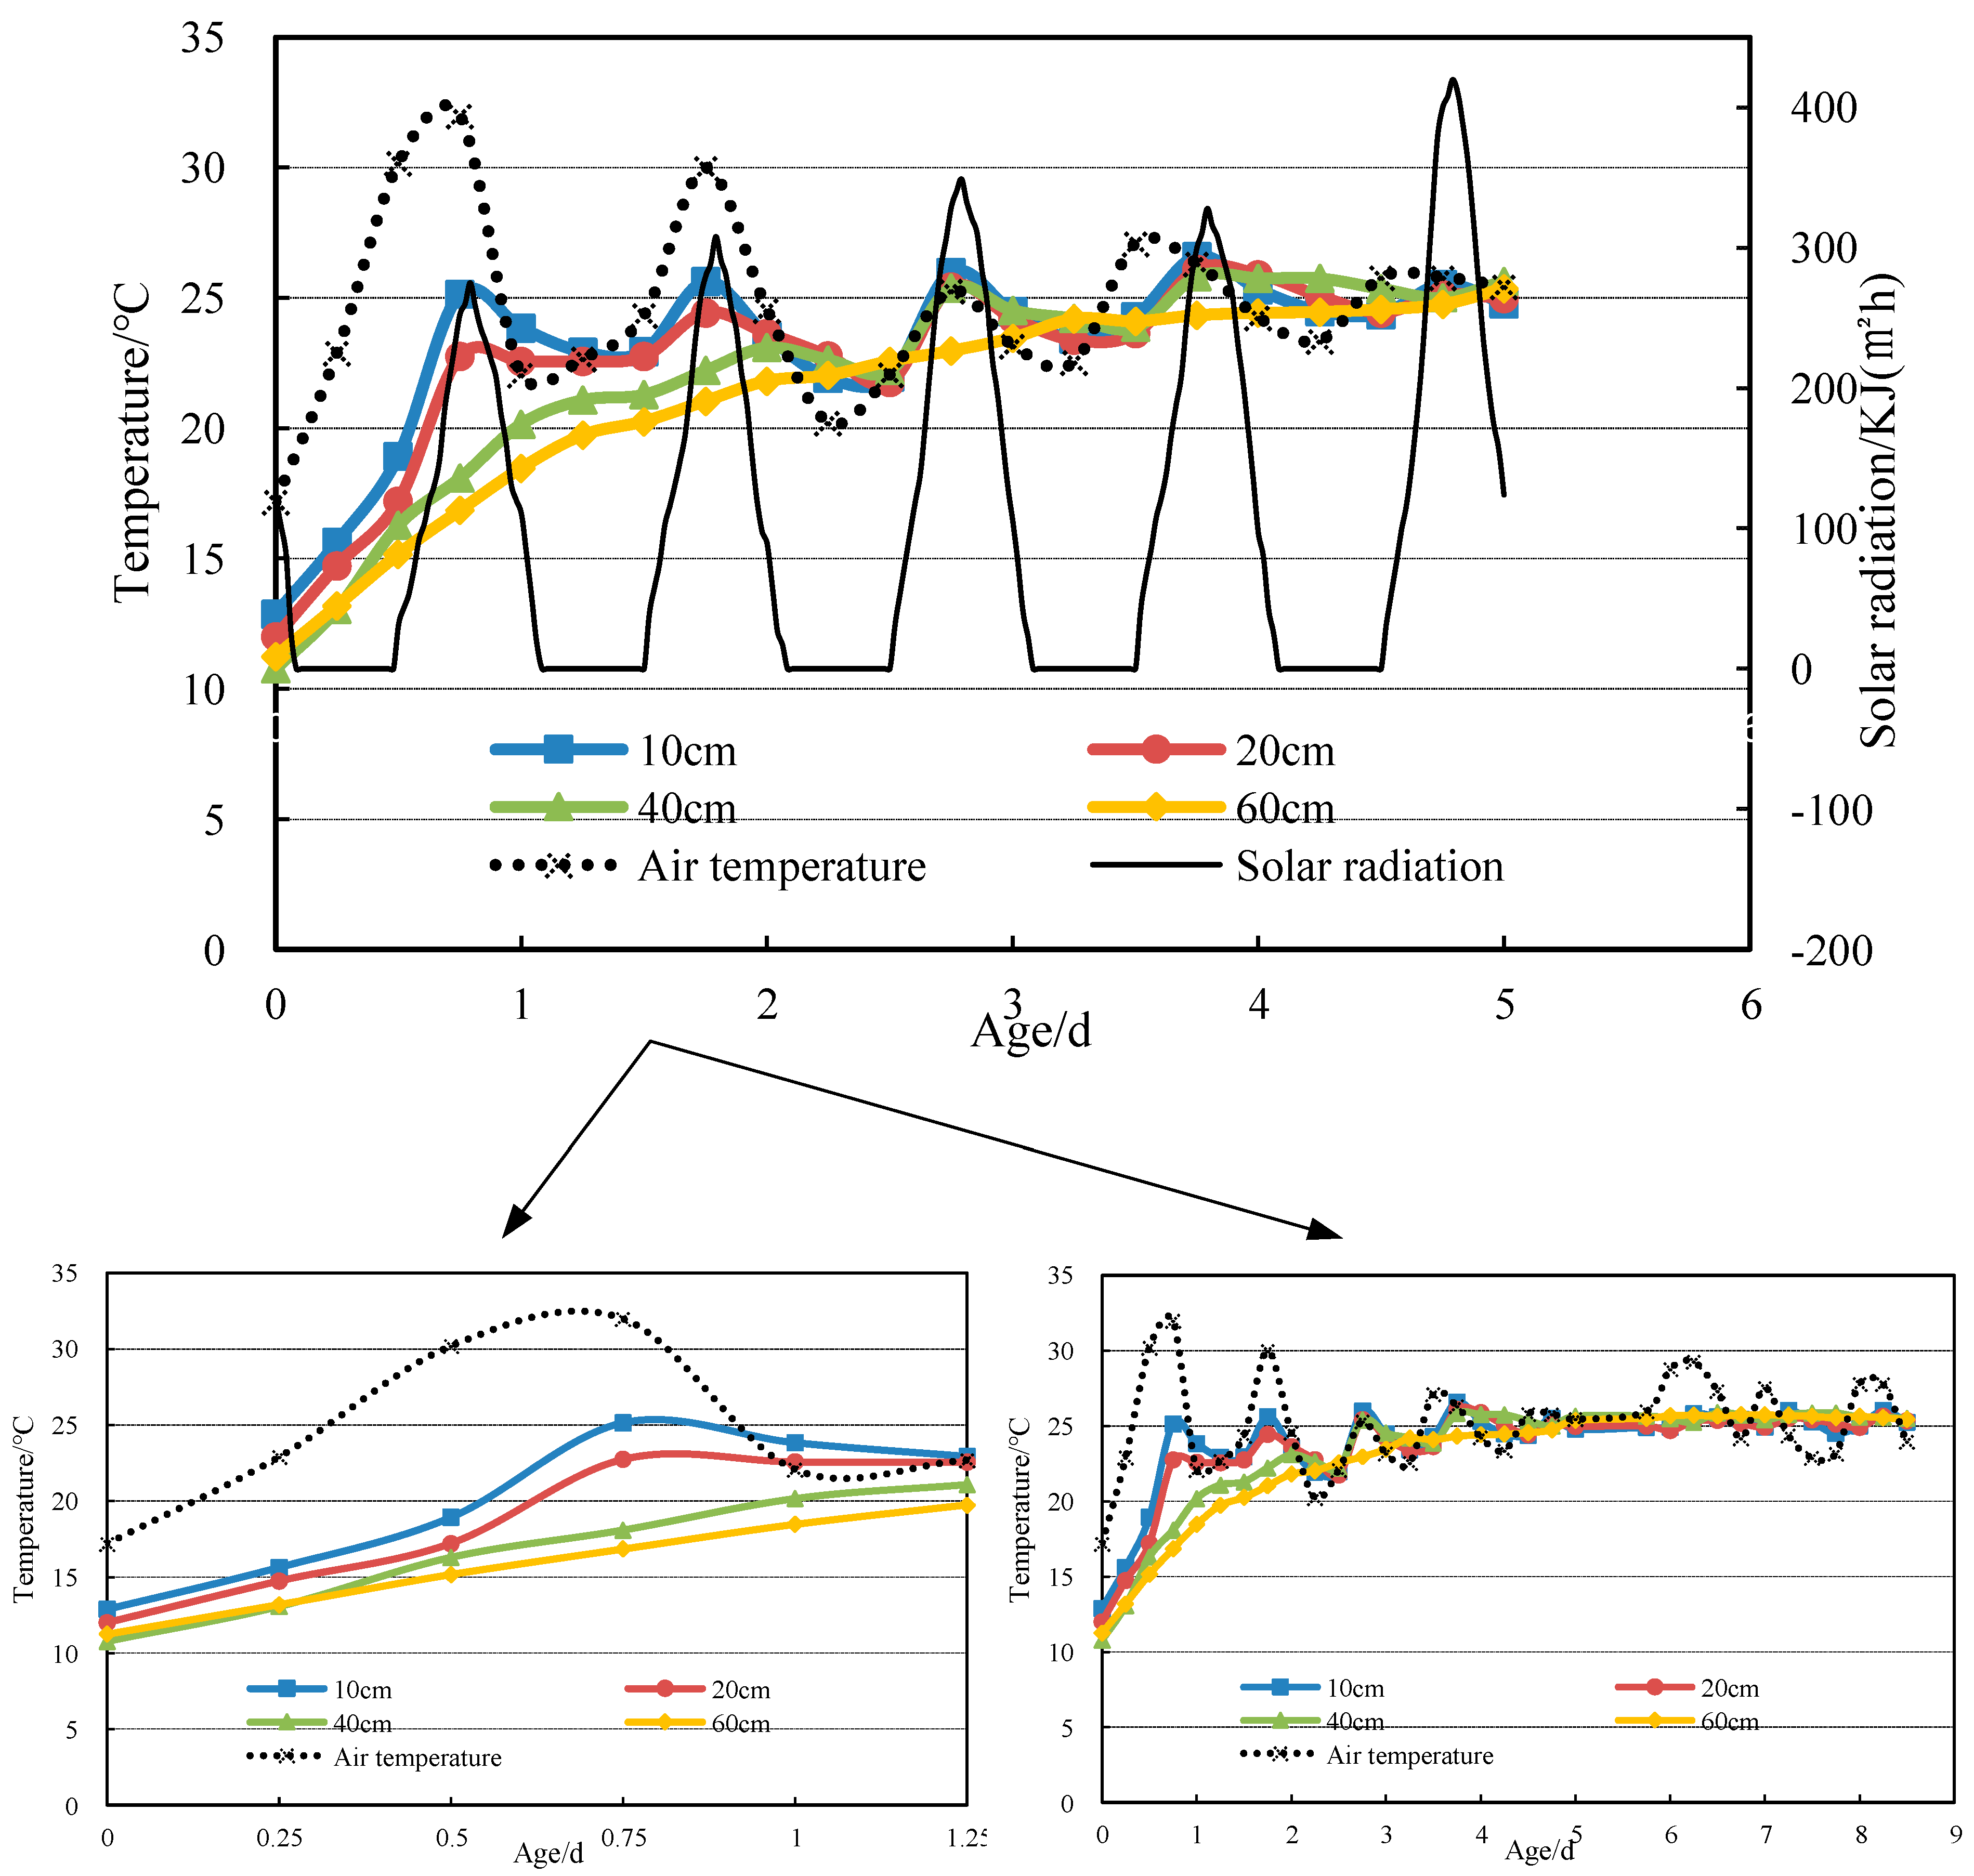
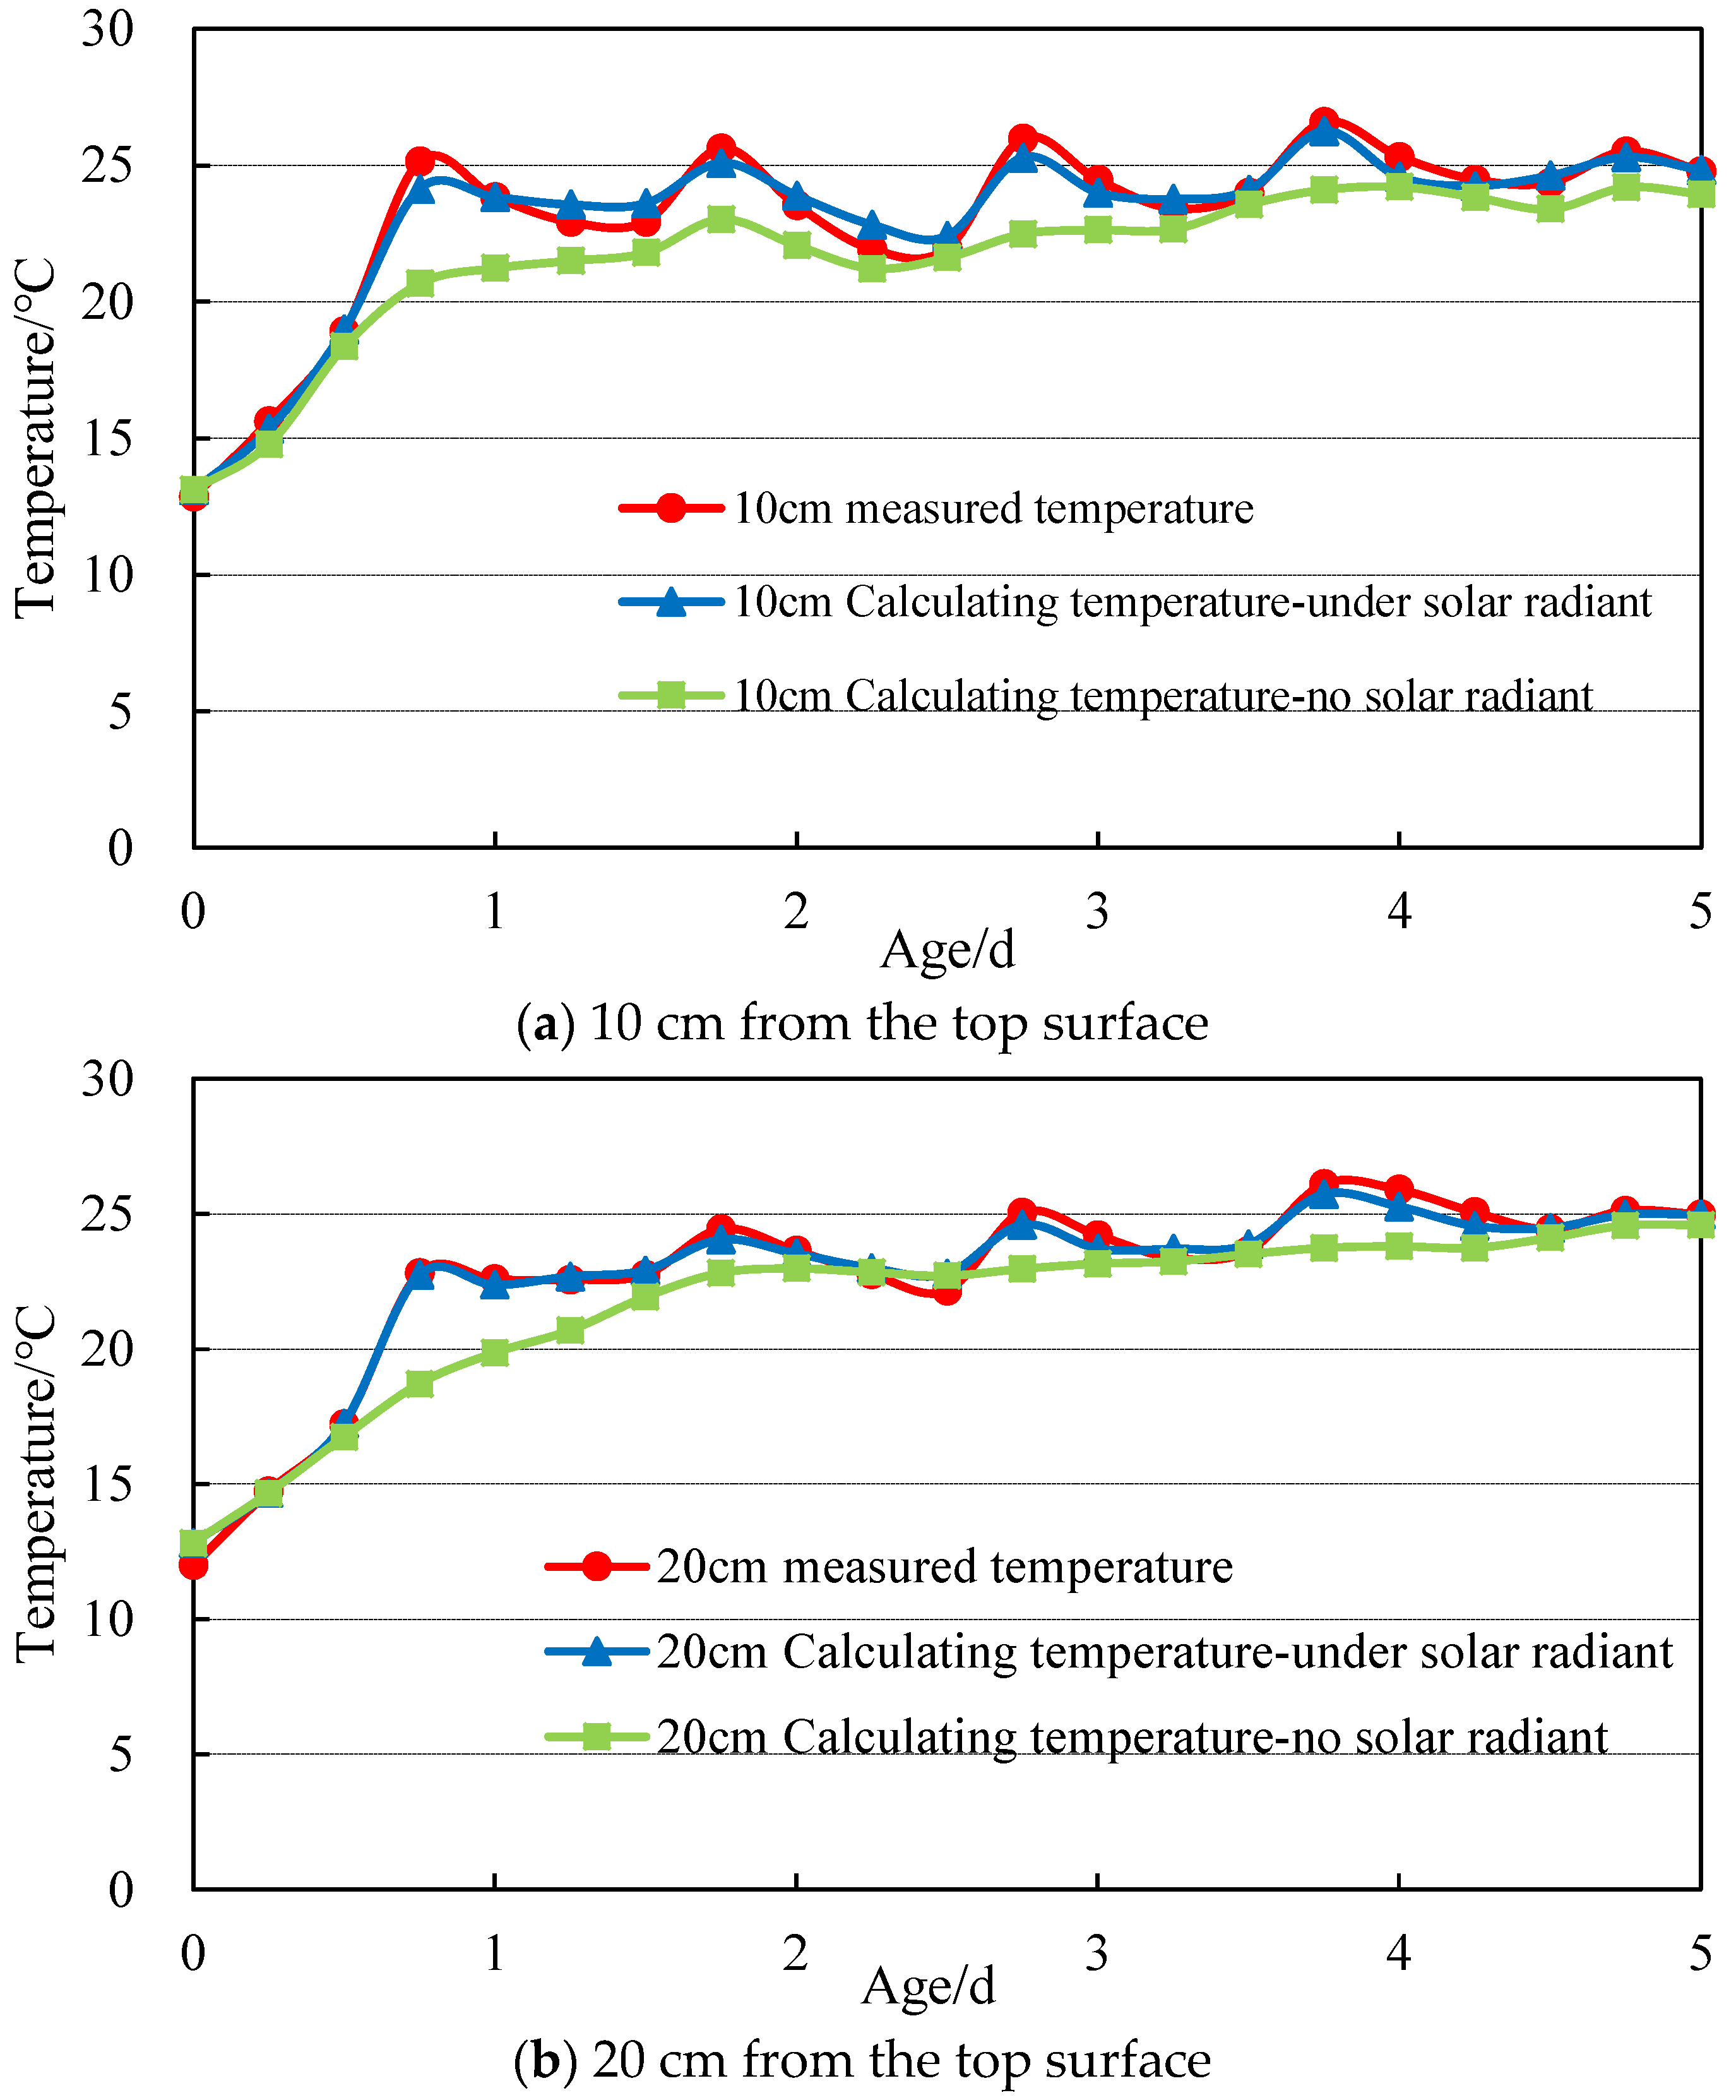
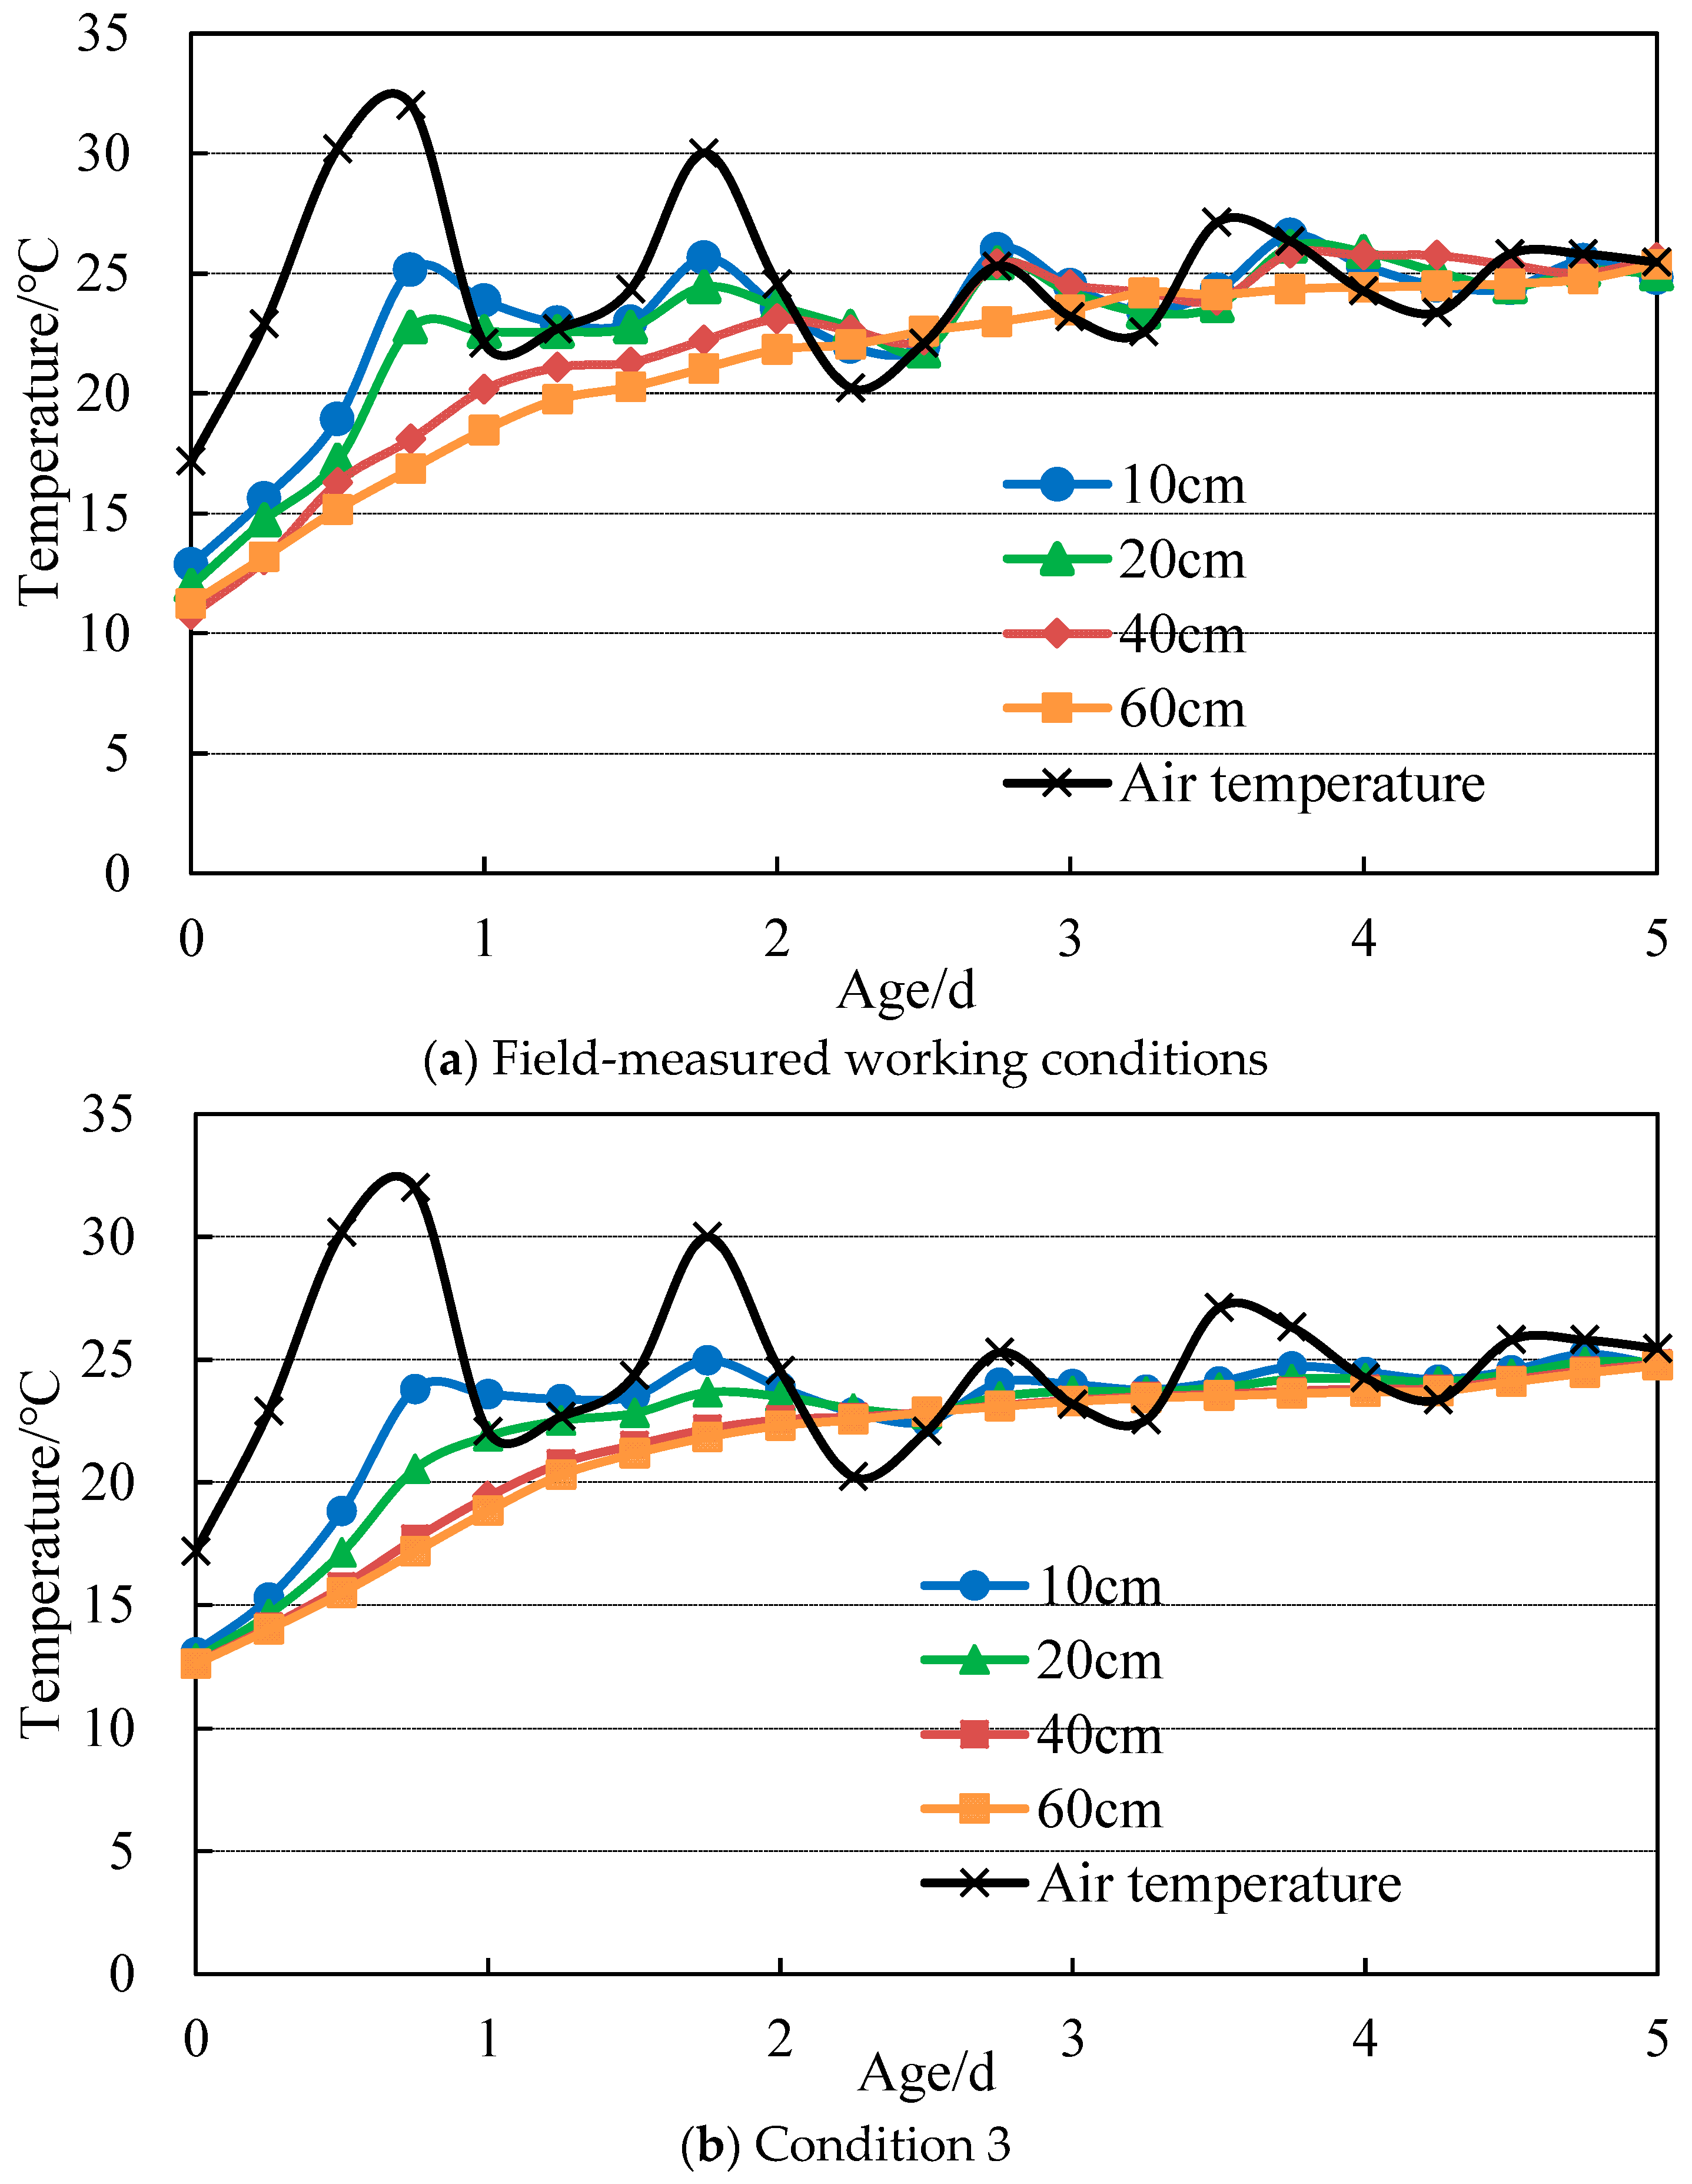
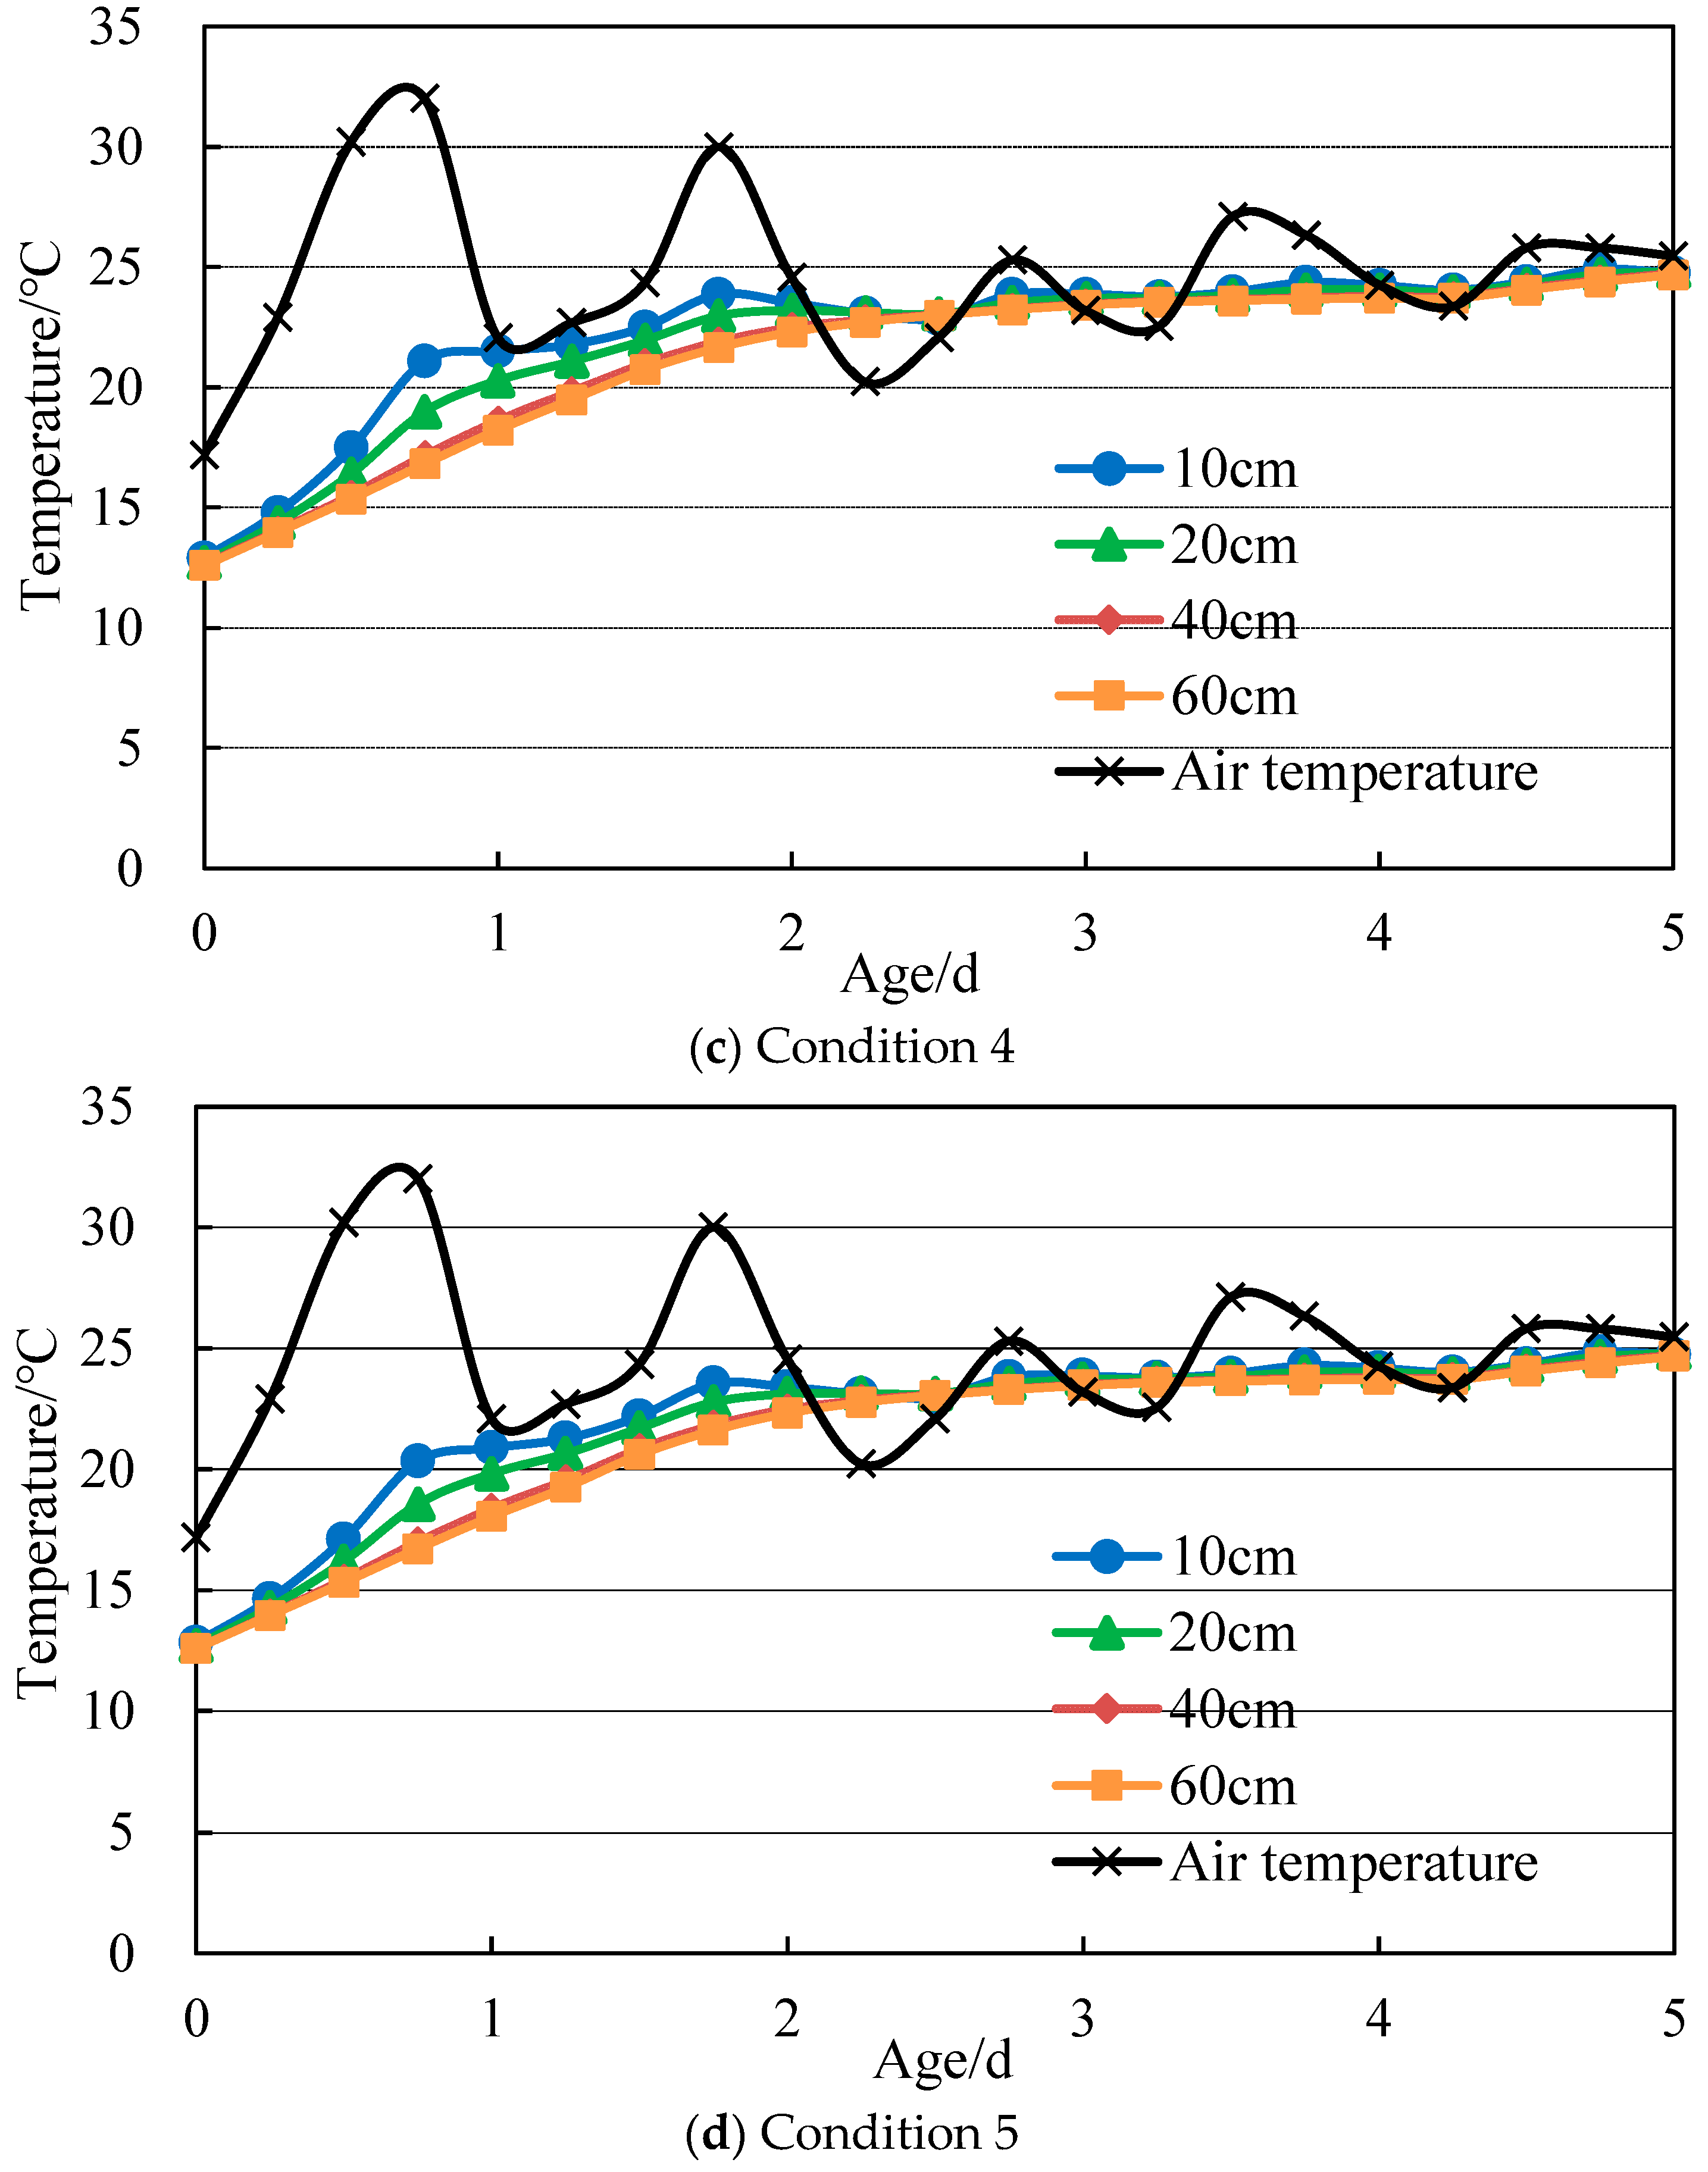
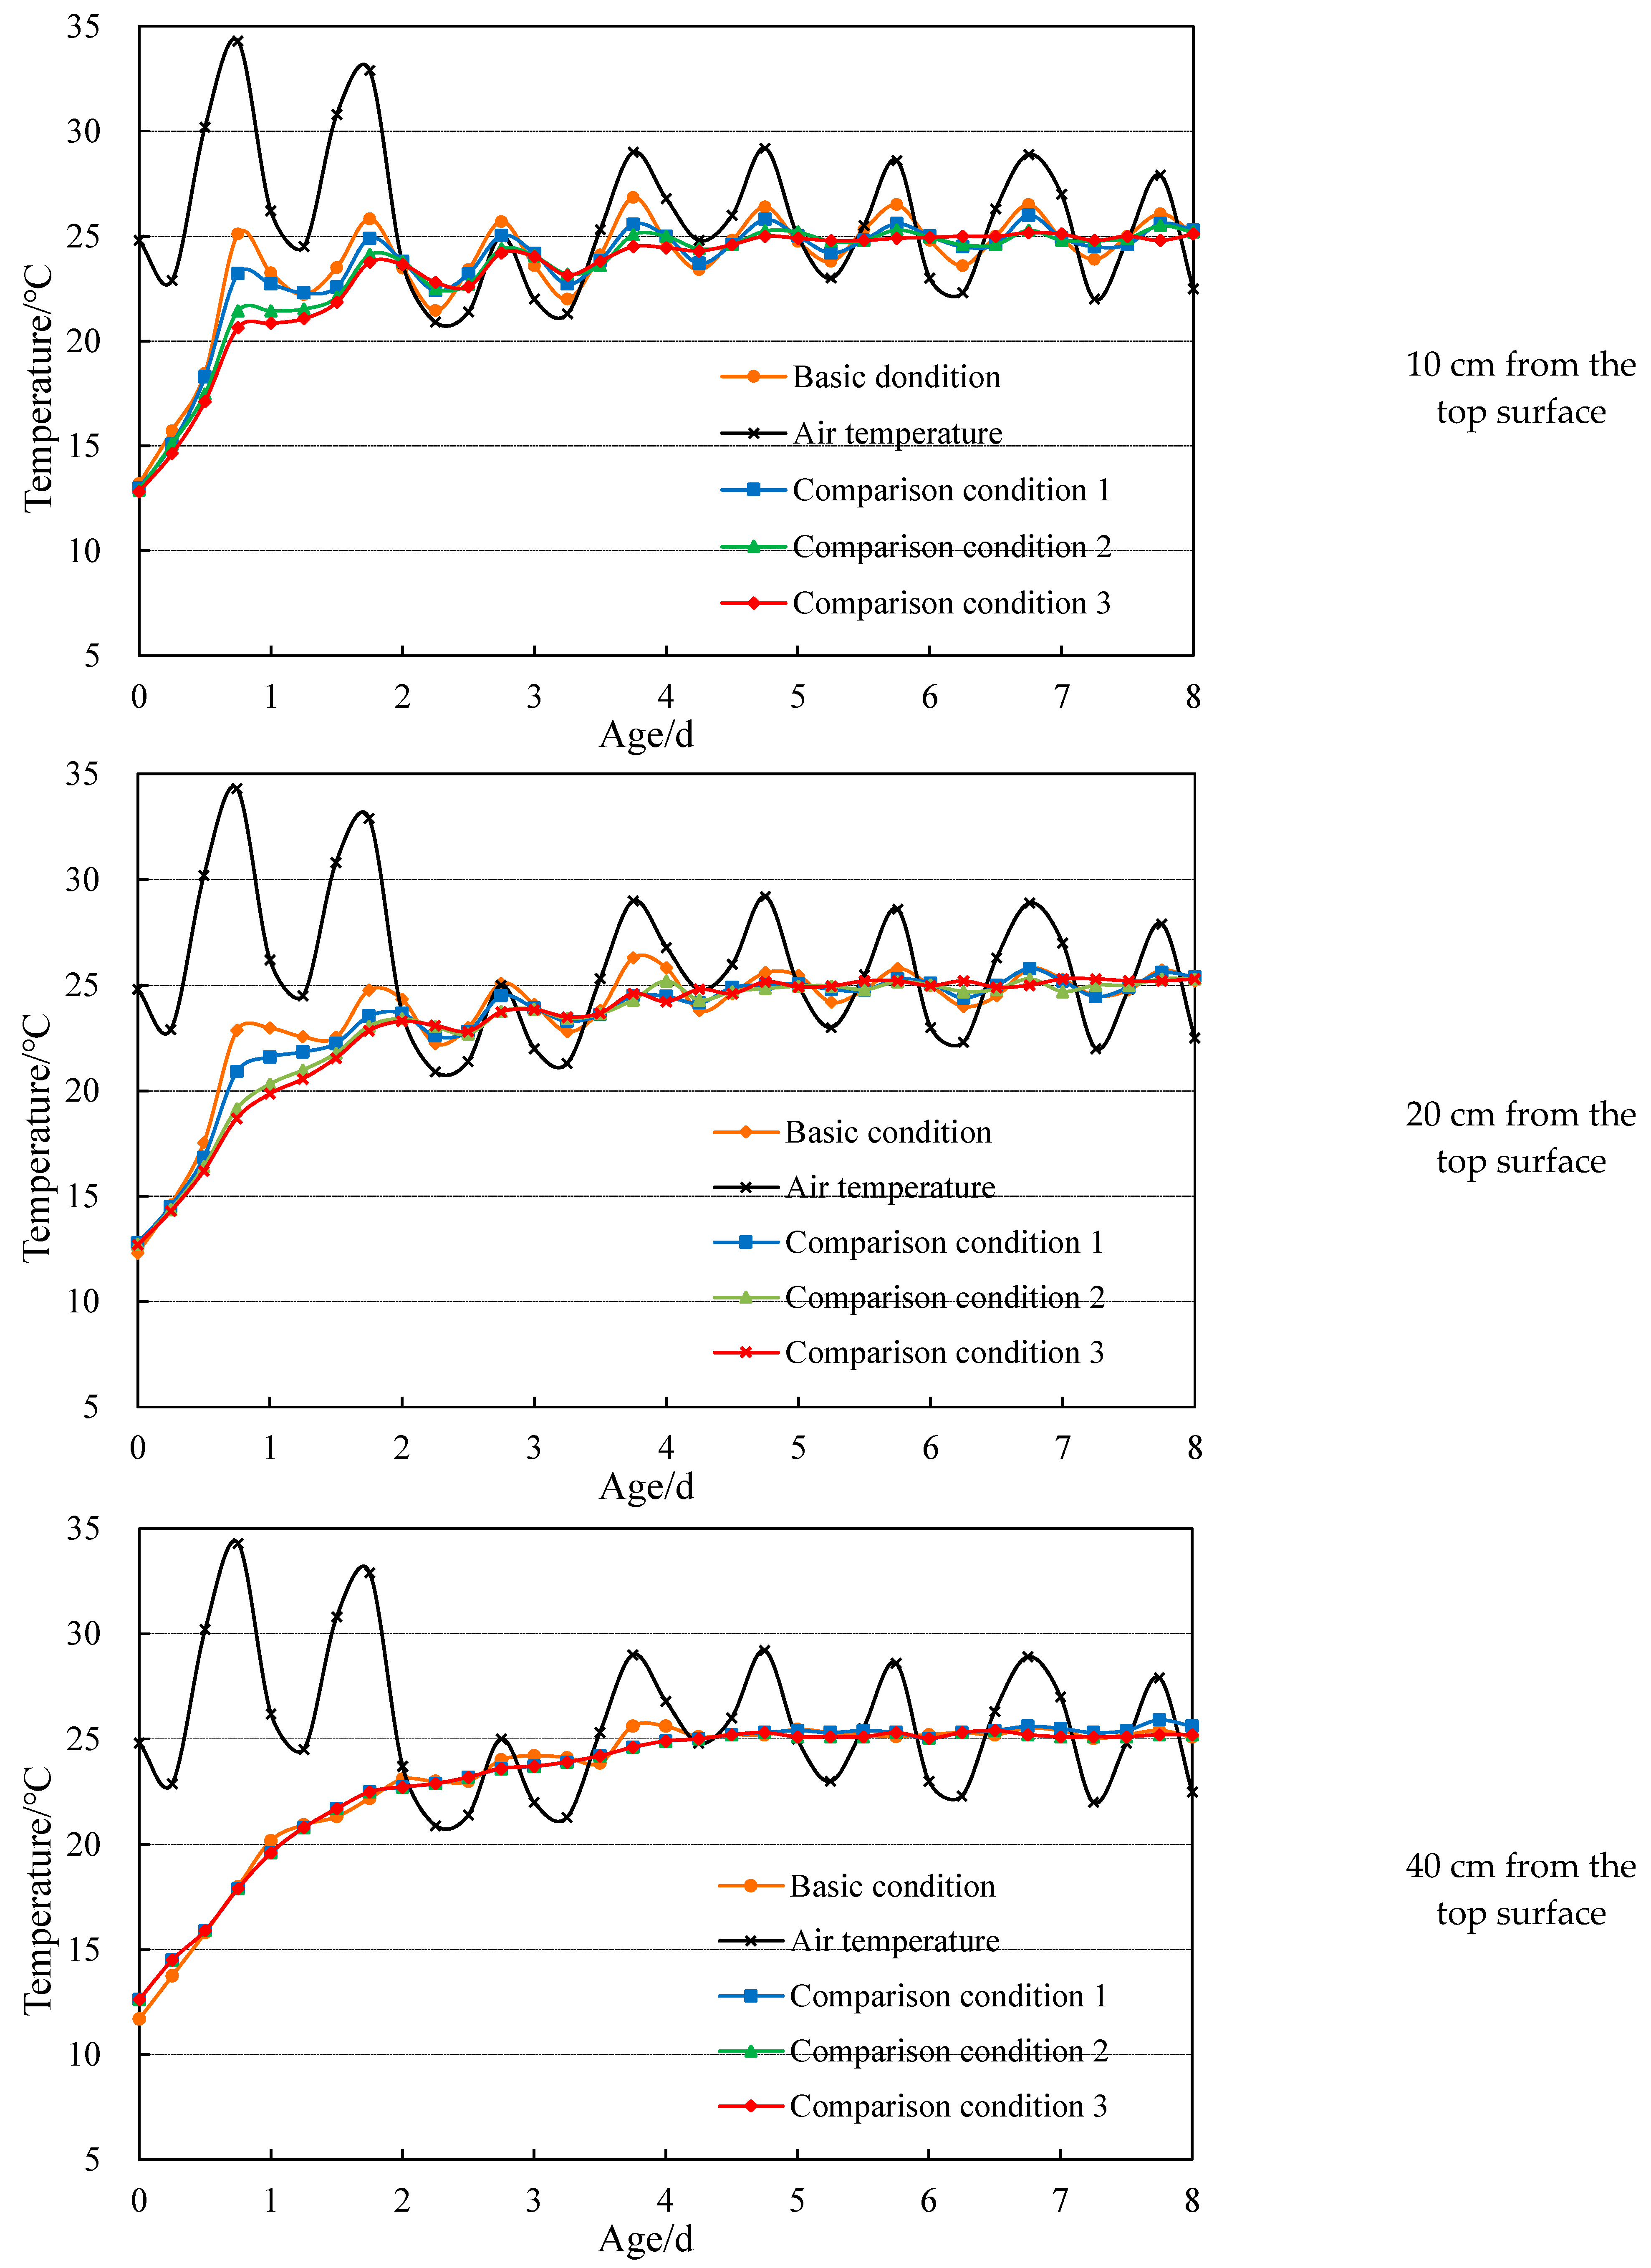
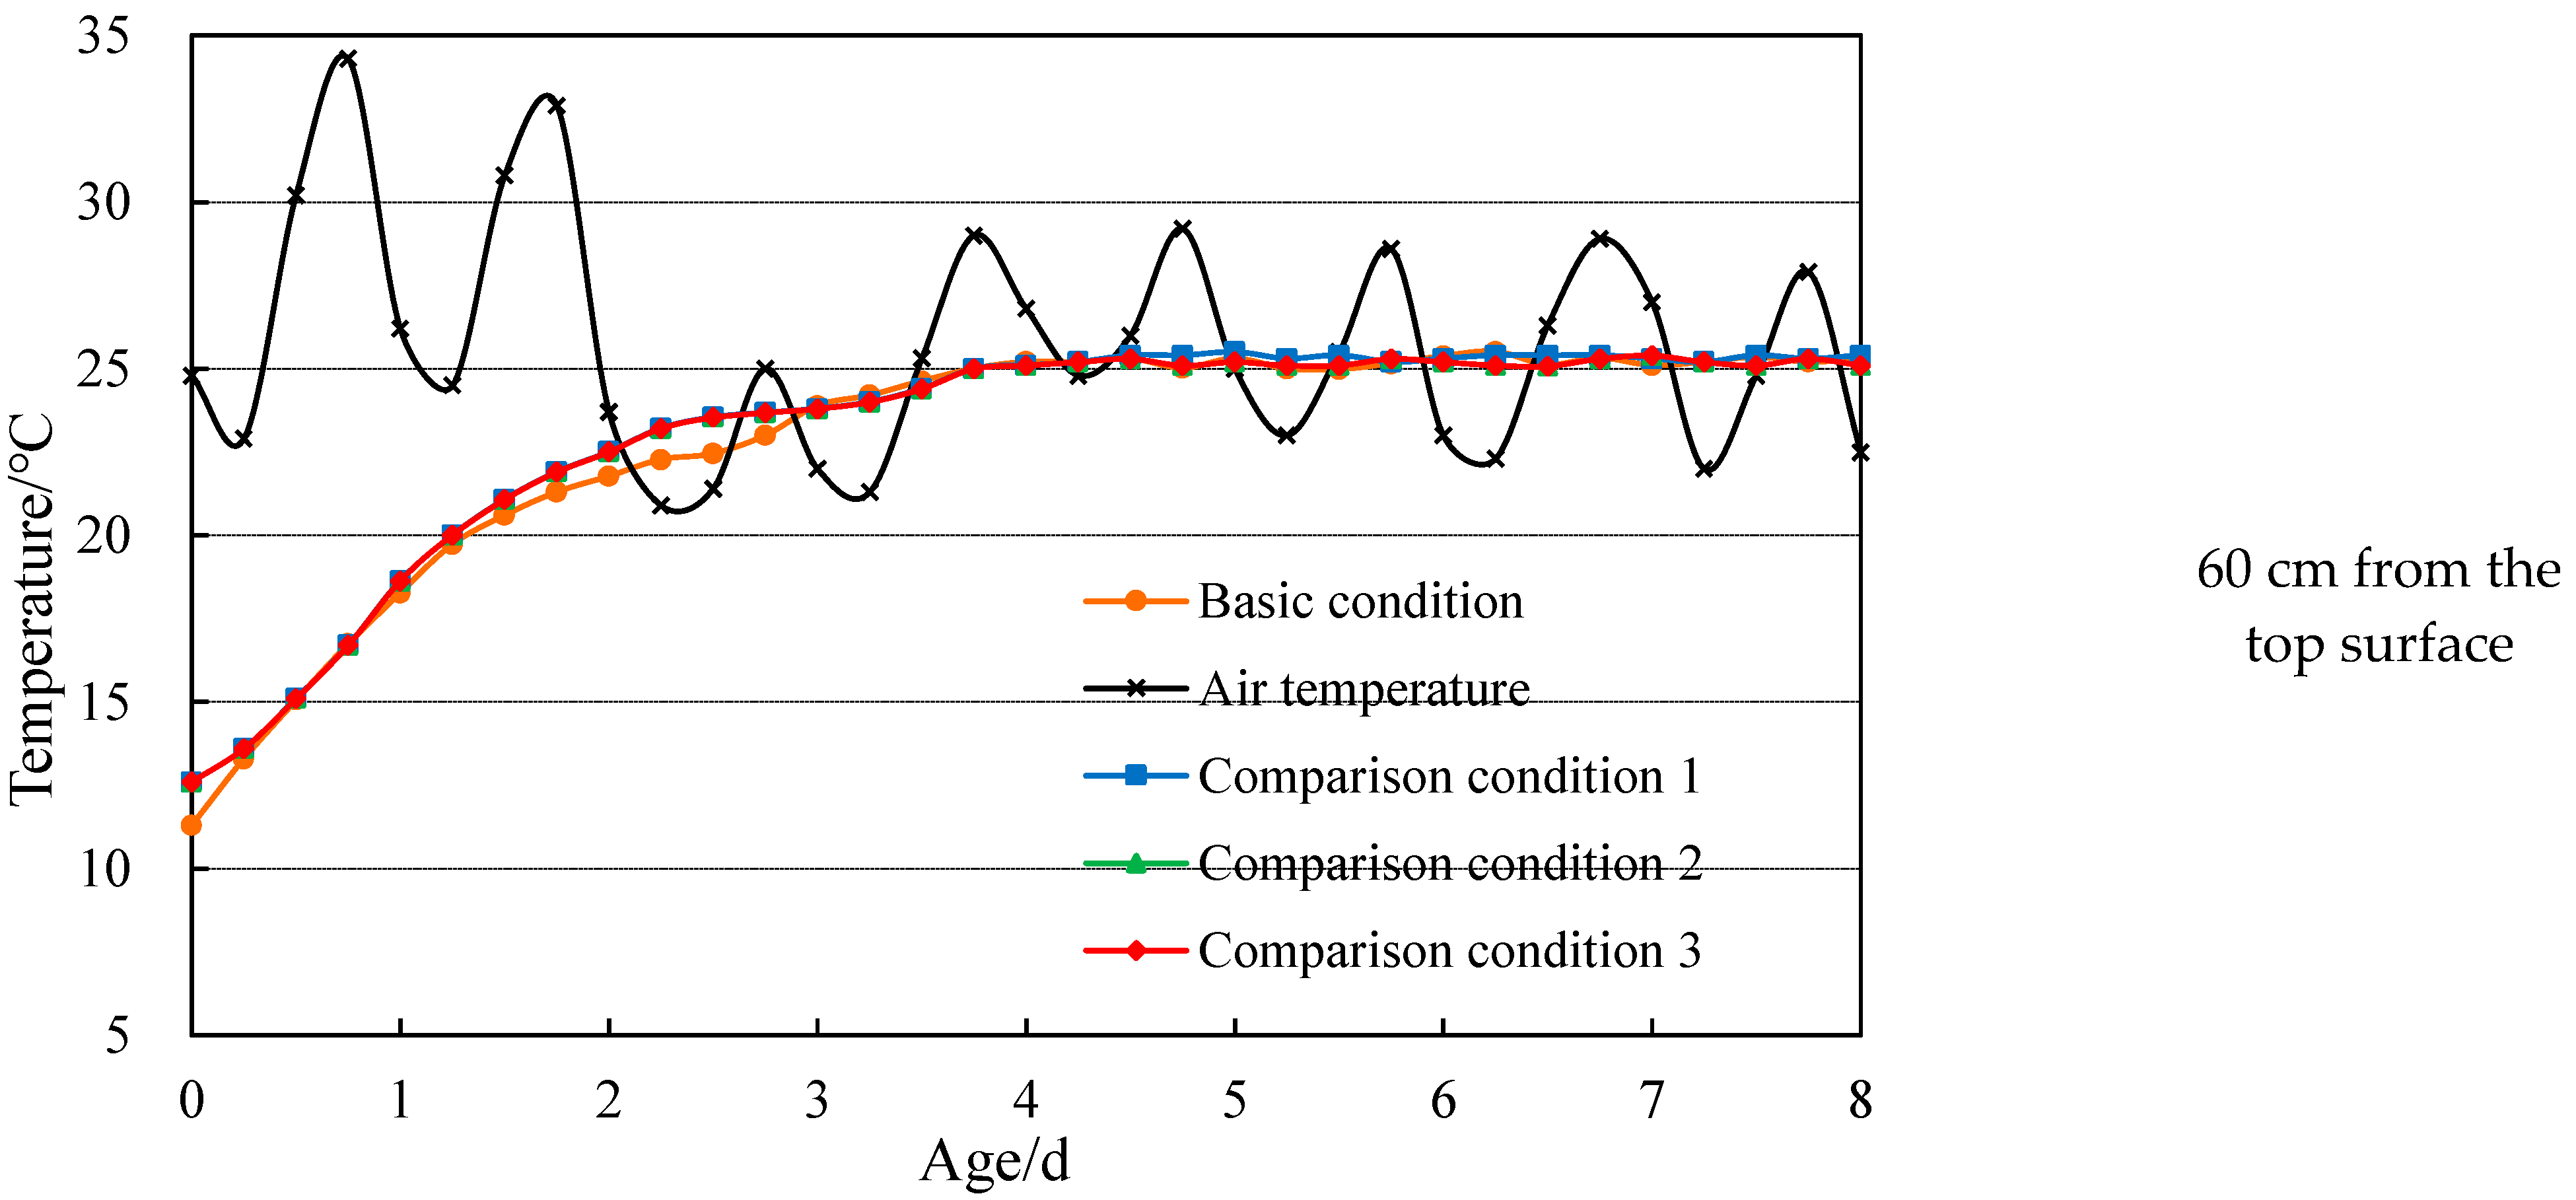
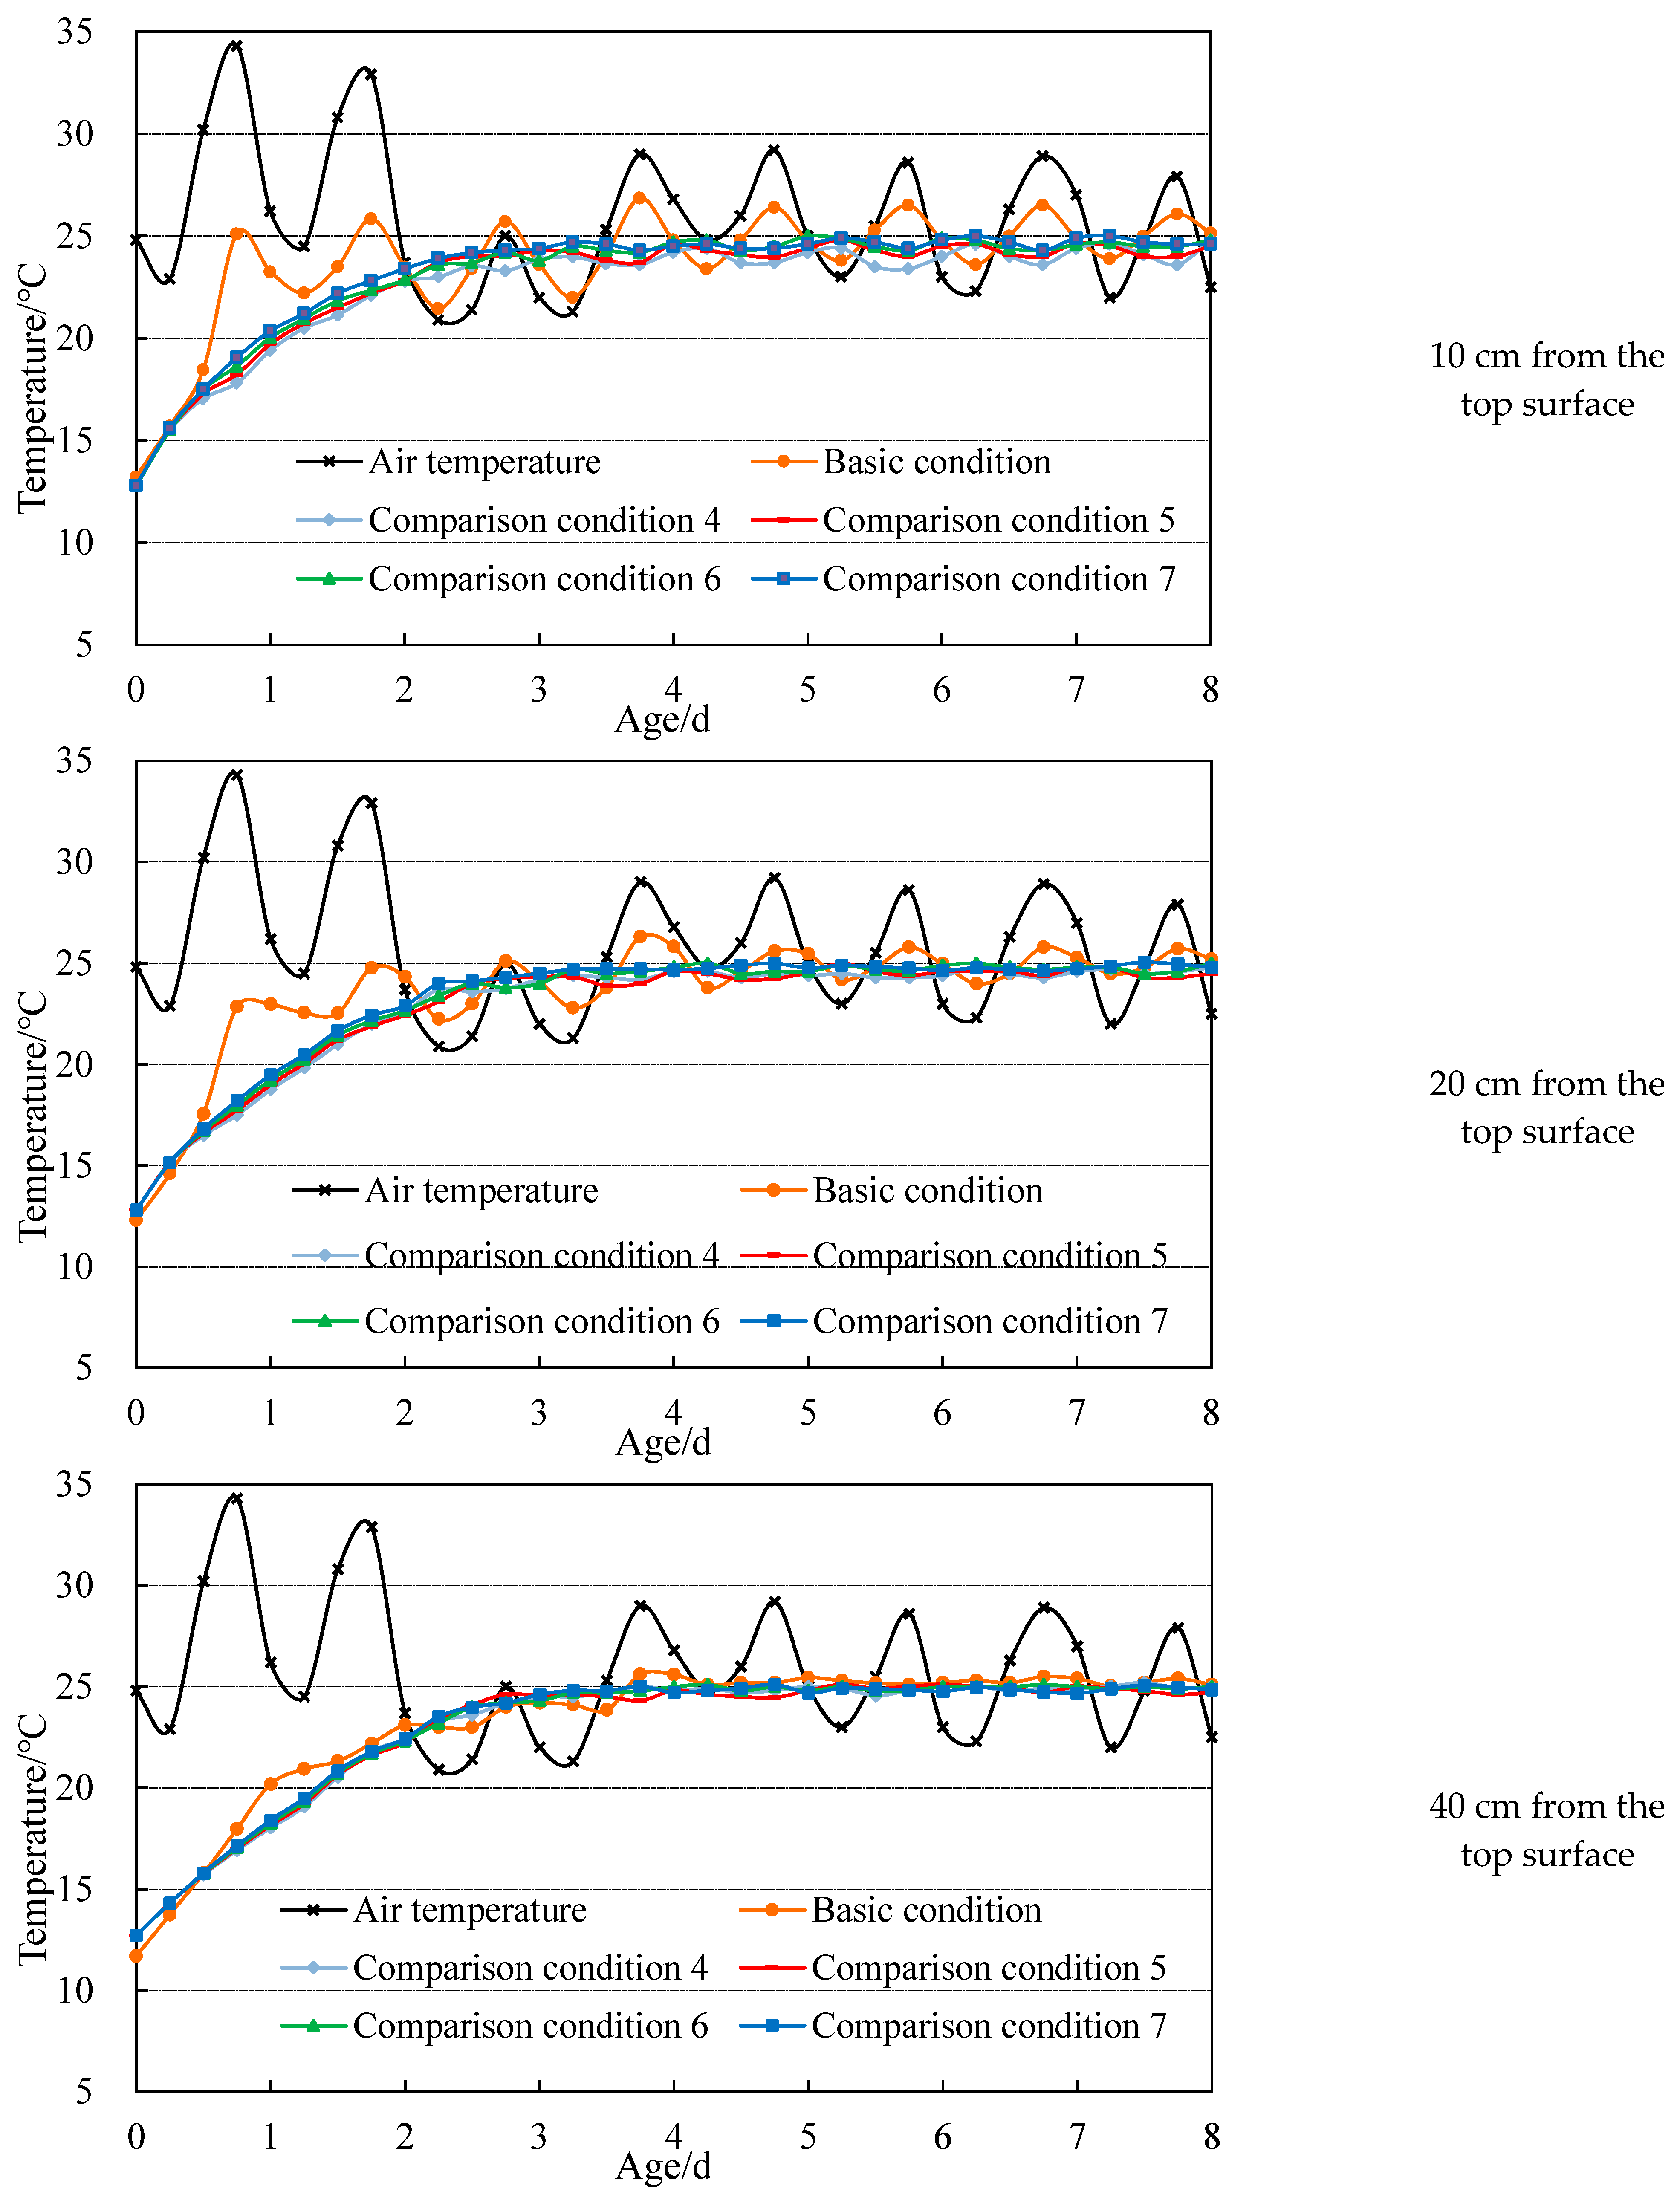
(1) Based on the monitoring experiment, solar radiation heat has a great influence on the temperature of low-heat concrete at different depths from the top surface, especially 10–20 cm from the top surface. With the increase in ambient temperature and sunshine, the temperature difference between the inside and outside of the concrete increases. According to the measured data, when the temperature reaches 32 °C, the temperature difference between concrete 10 cm from the top and 60 cm from the top reaches 8.3 °C.
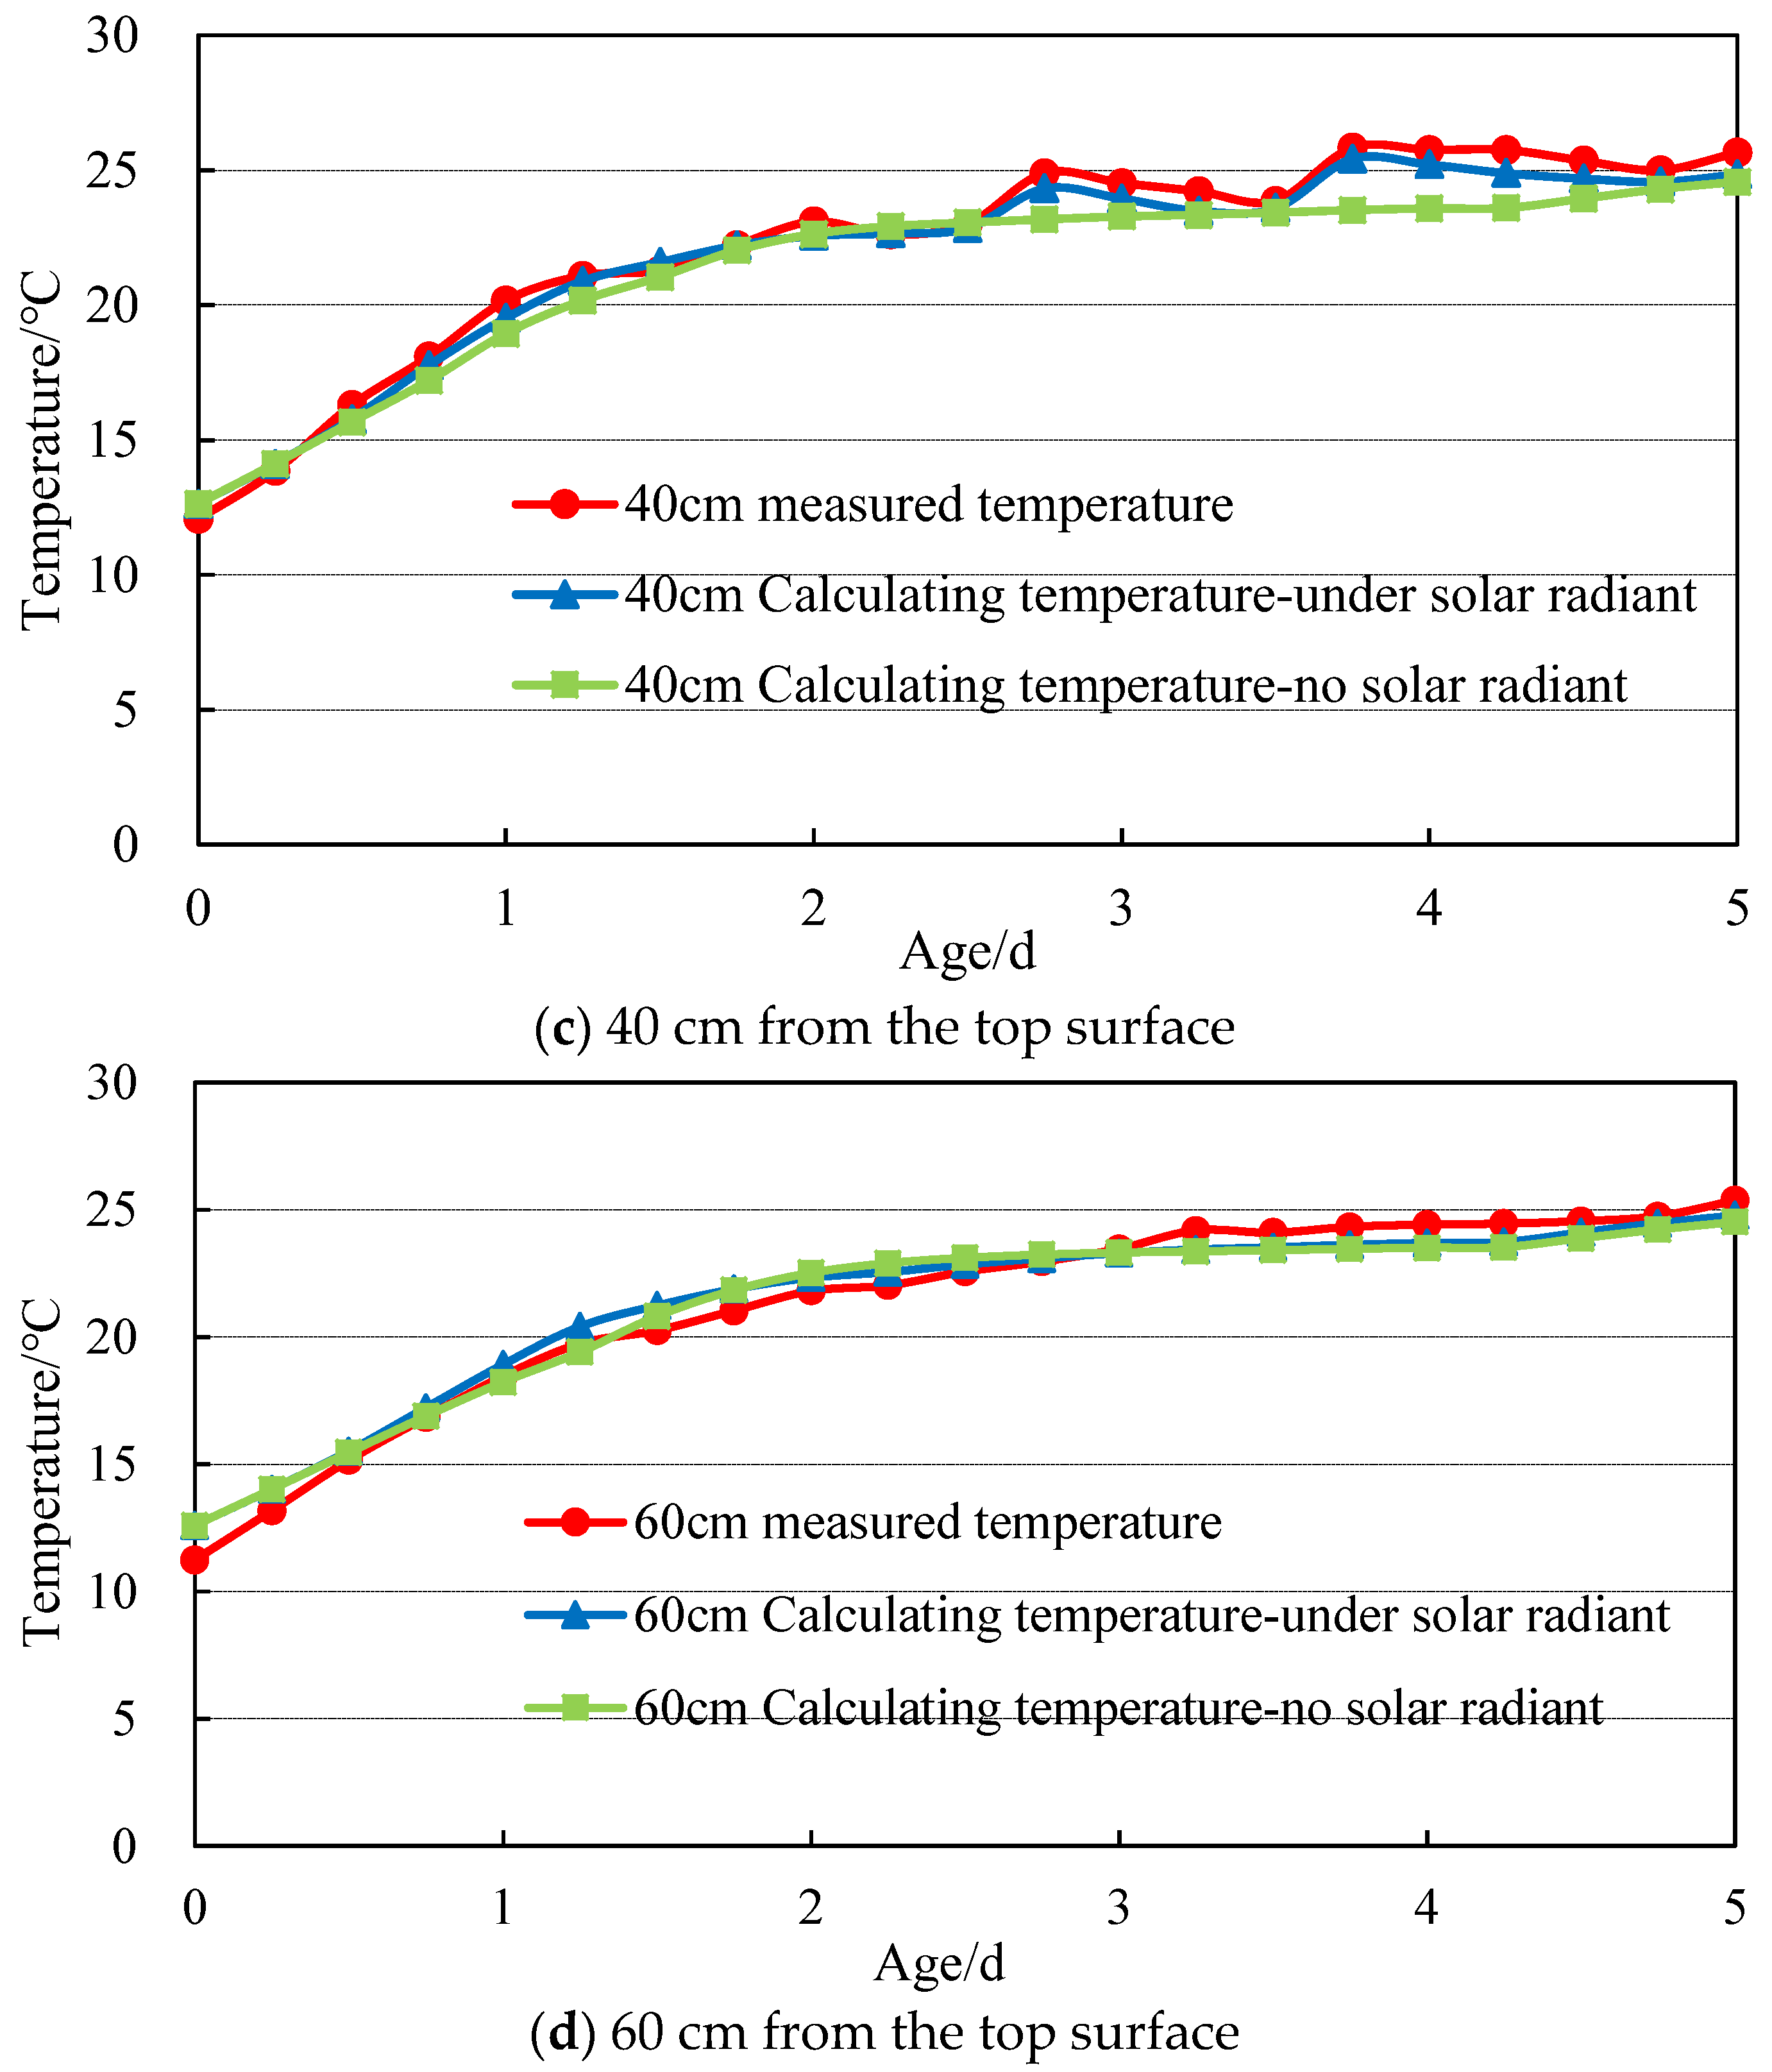
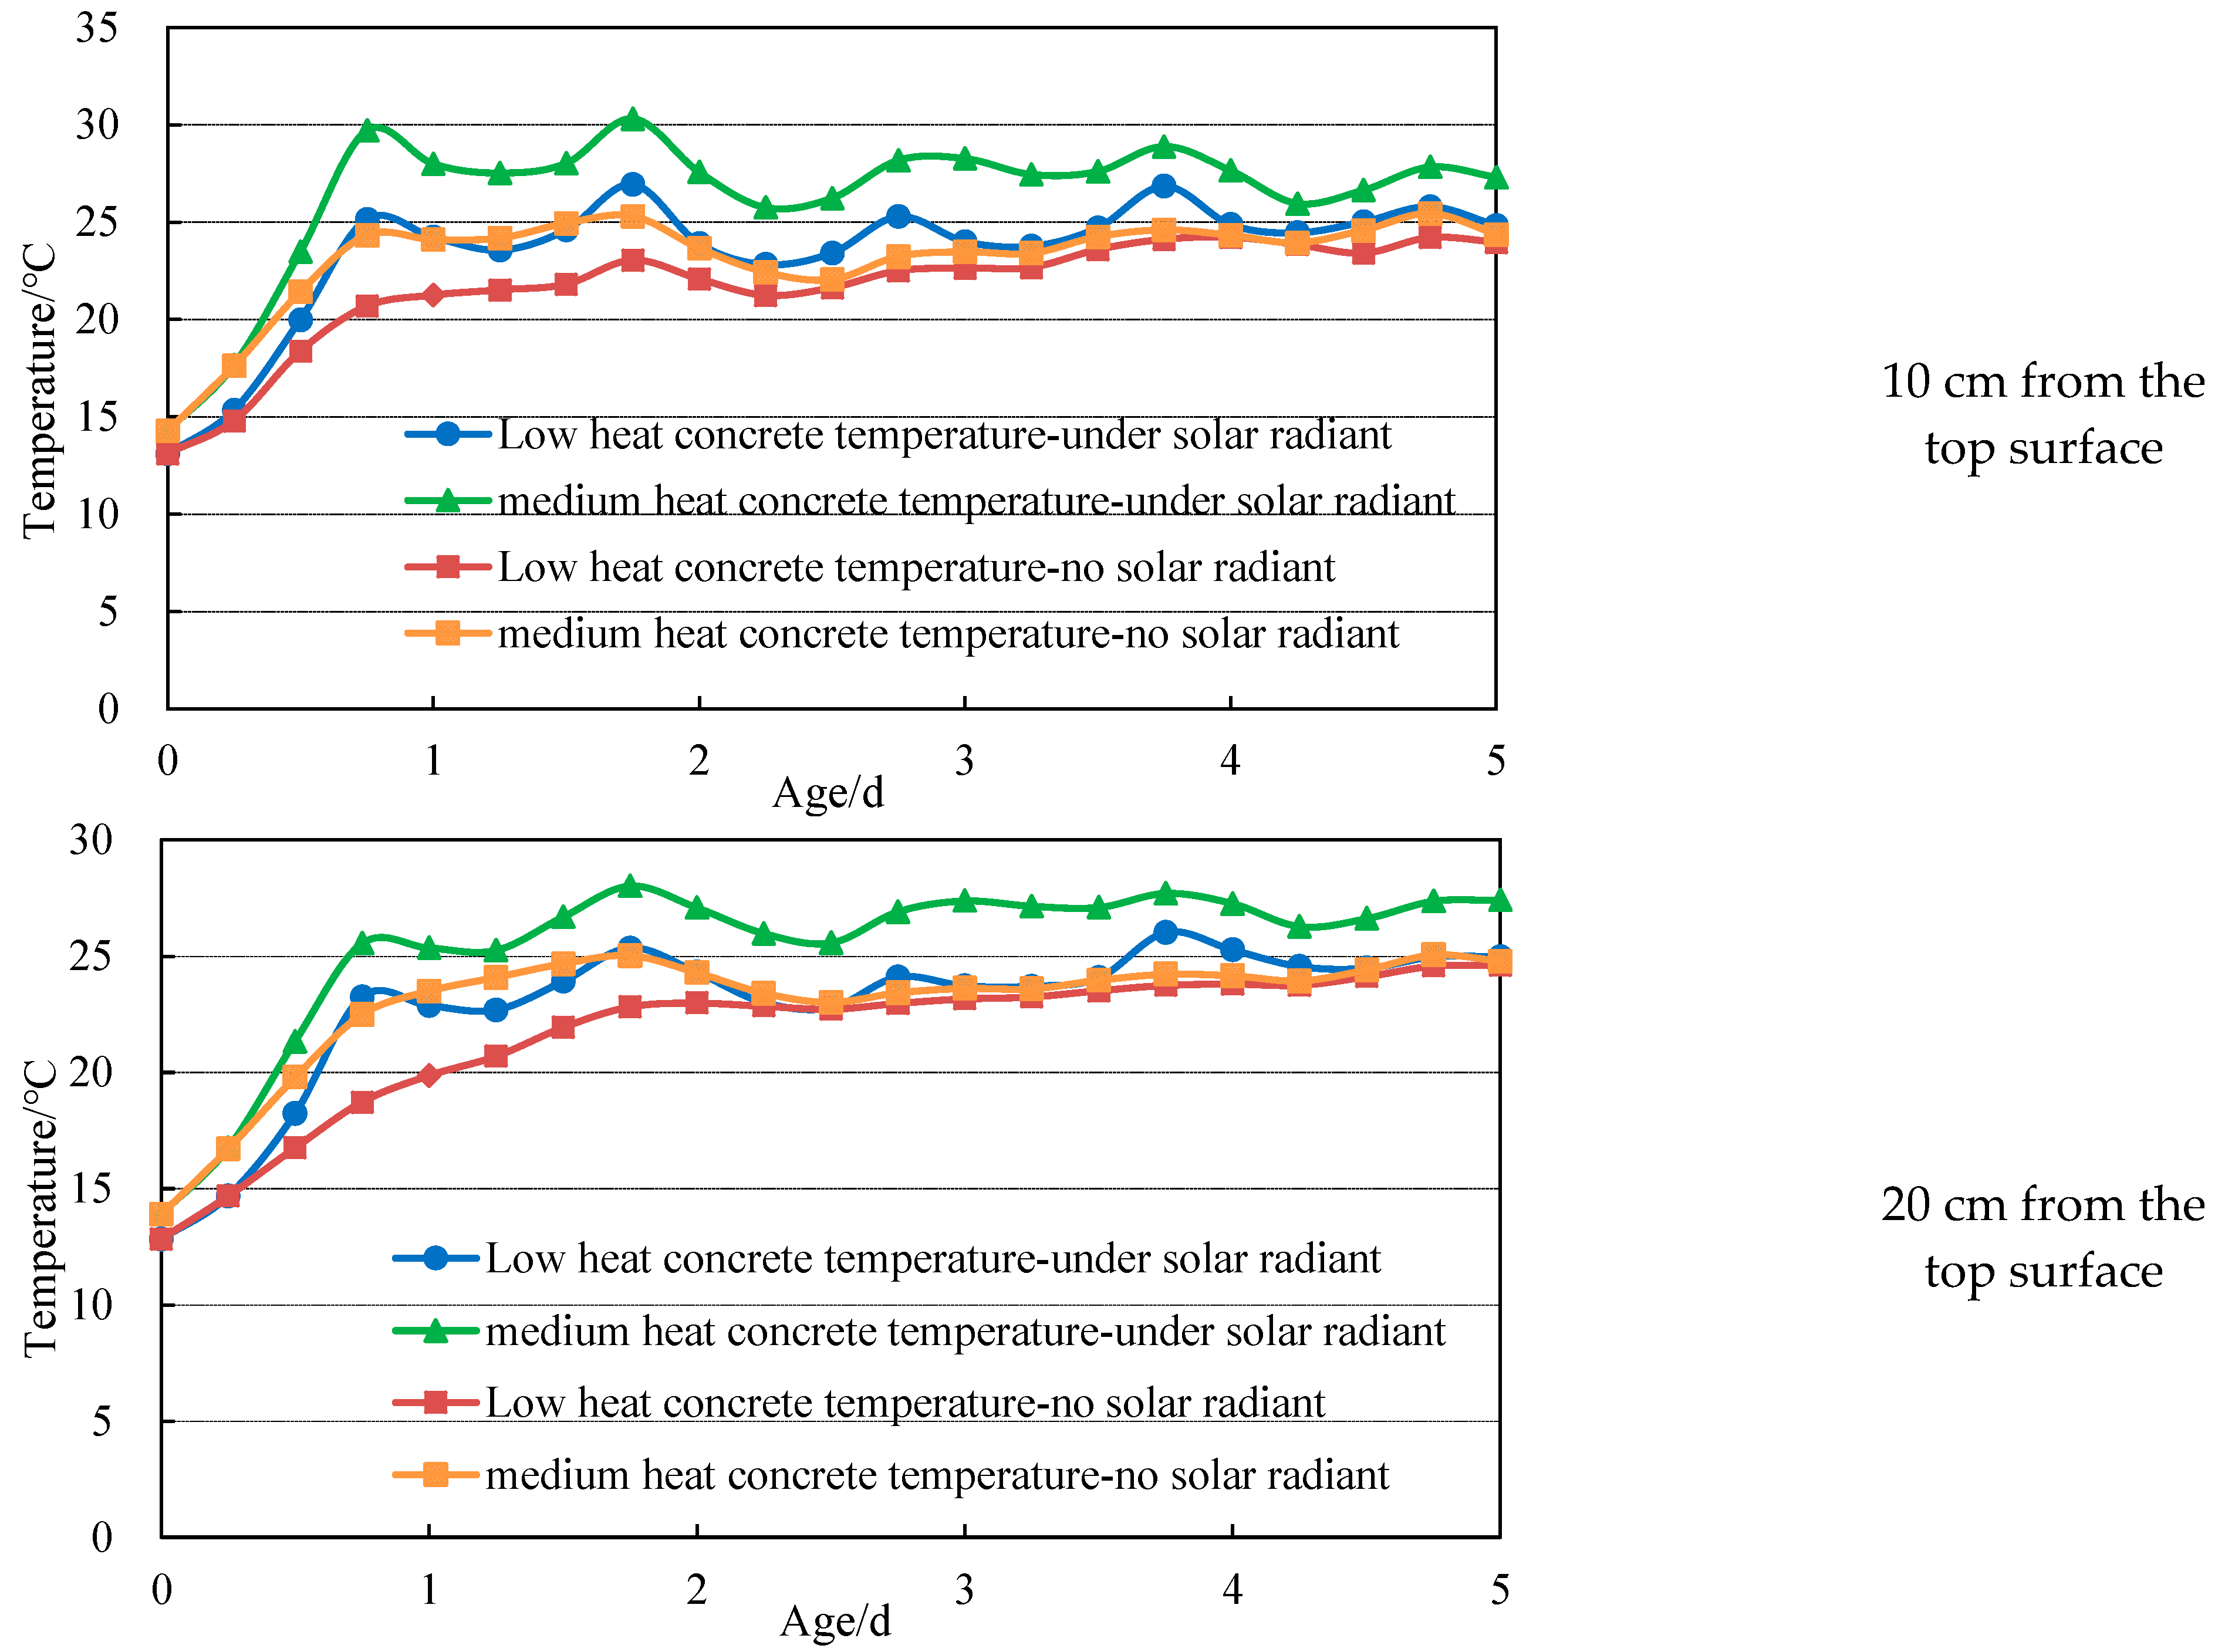
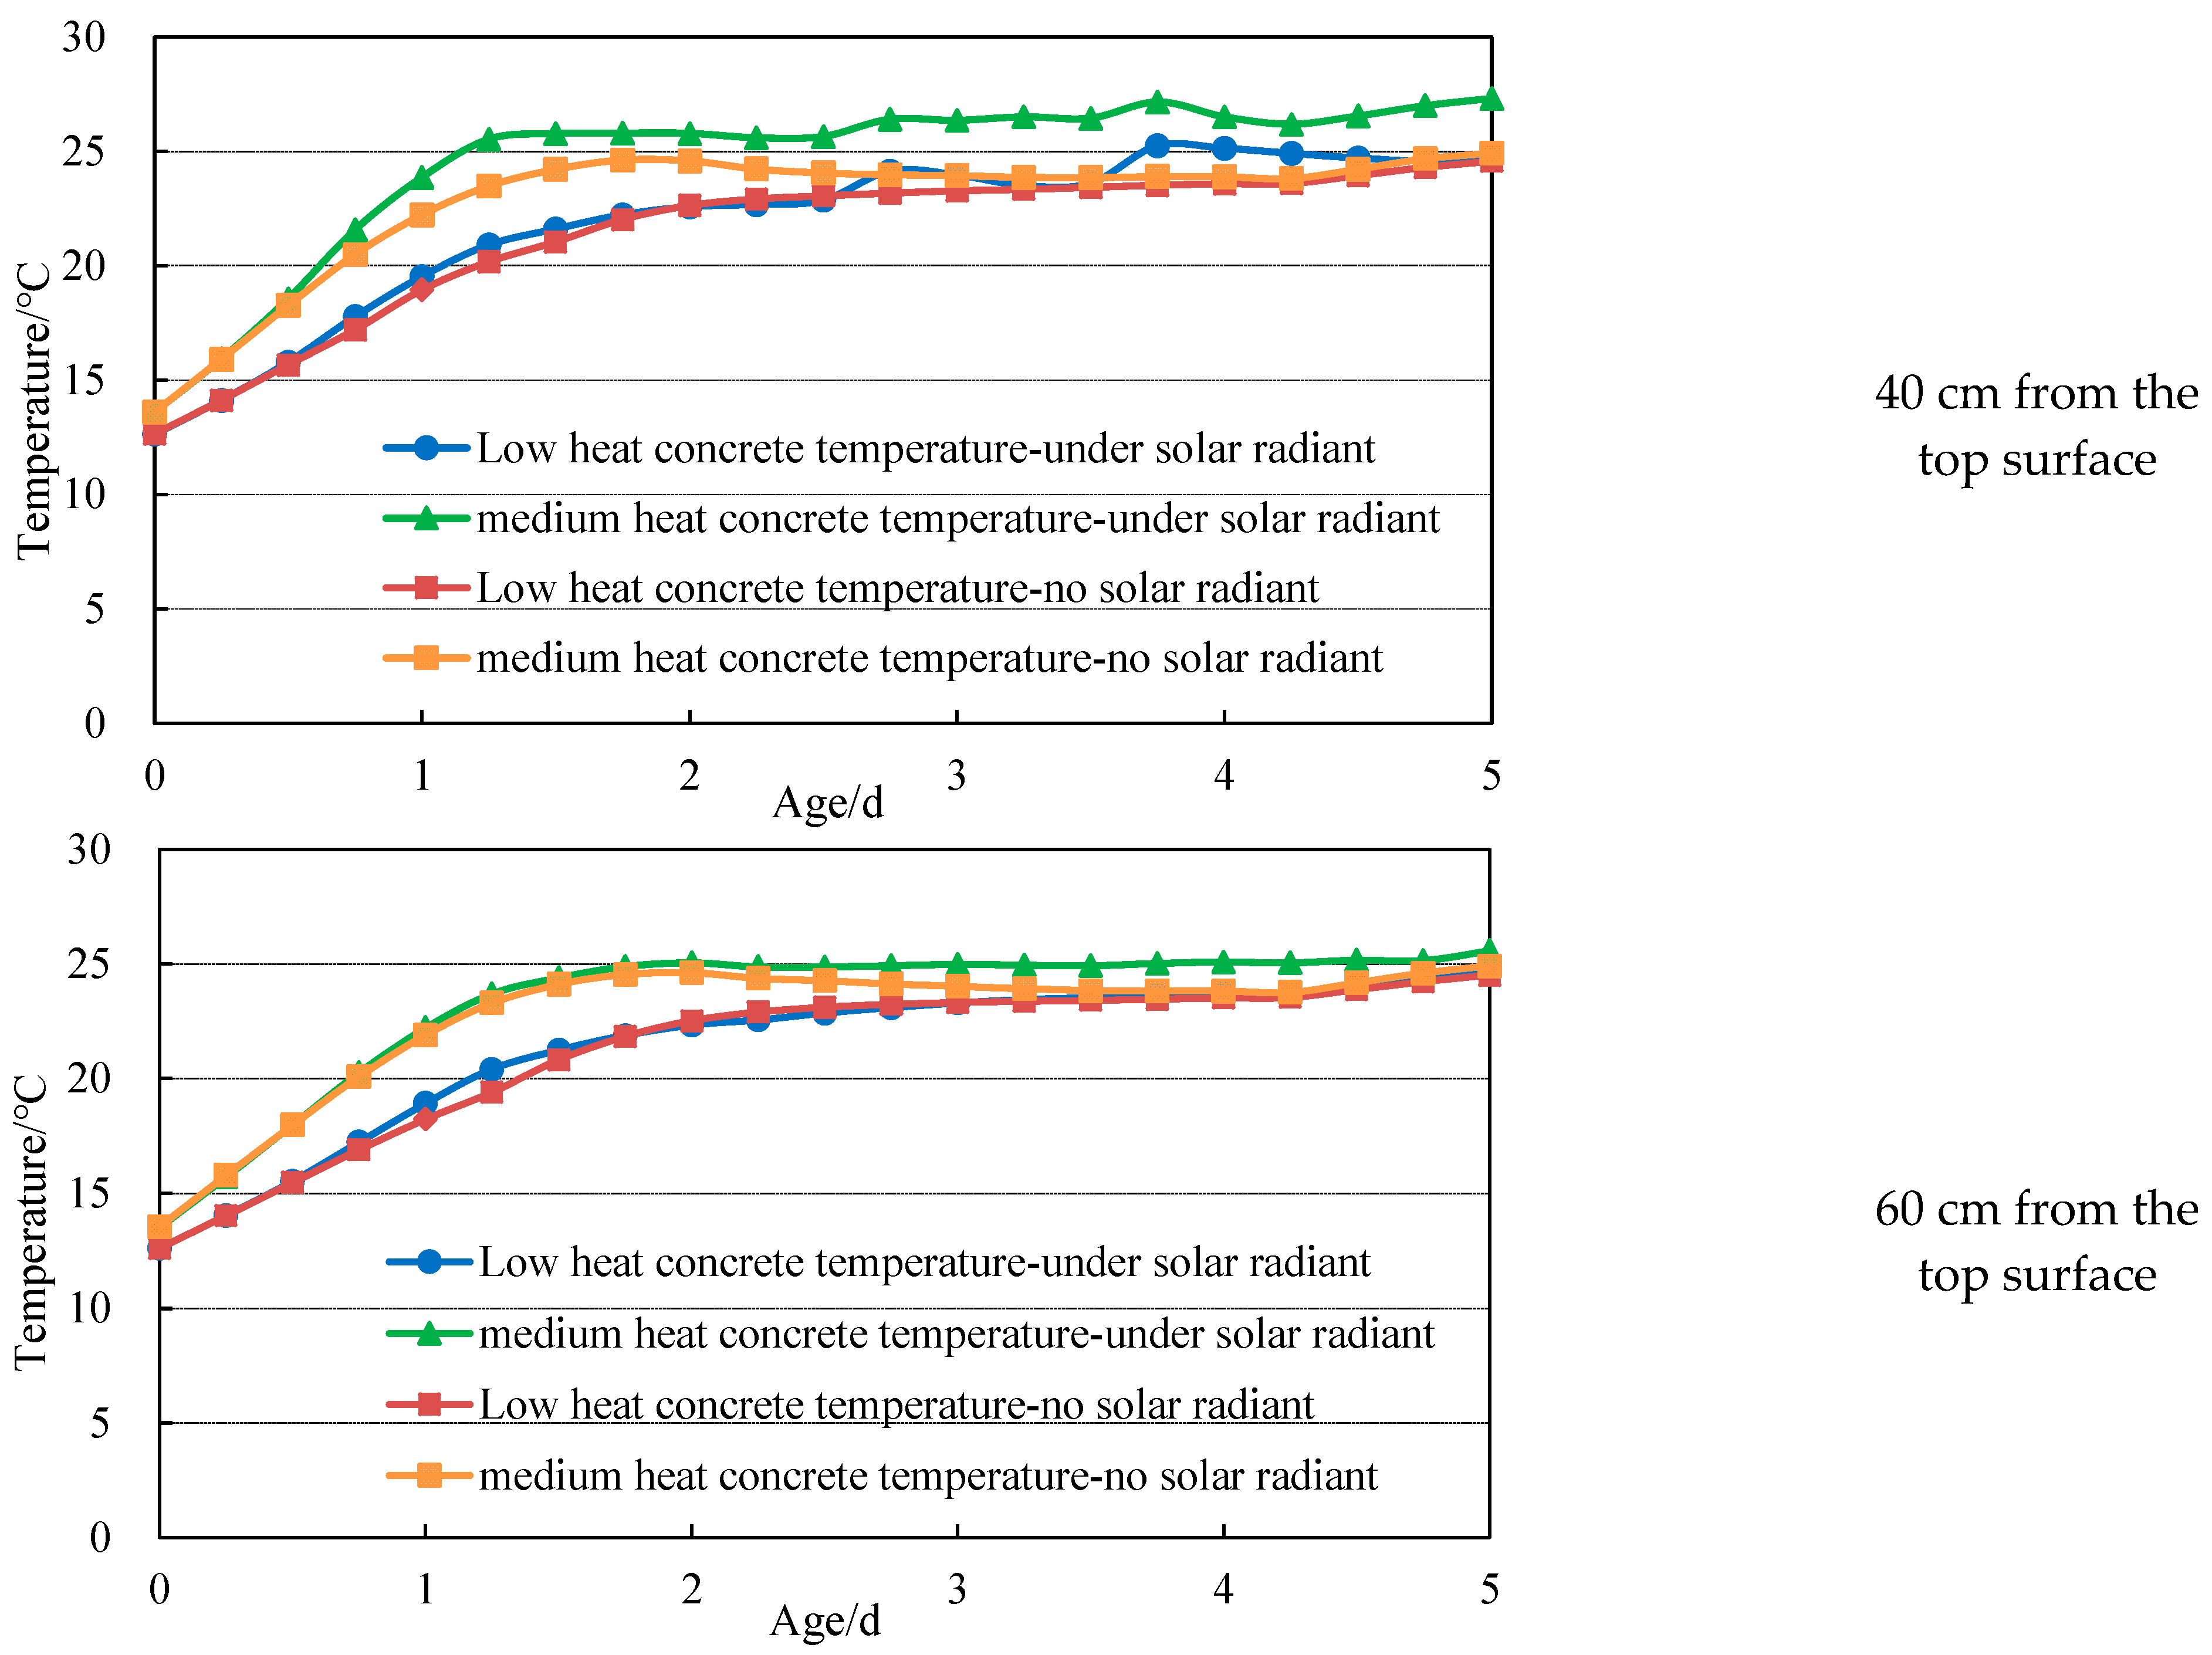
(2) The influence depth of solar radiation heat on the temperature of medium and low-heat concrete is the same, within 40 cm from the top of the pouring block. Under intense solar radiation, the temperature variation of medium-heat concrete is more obvious than that of low-heat concrete in the same period.
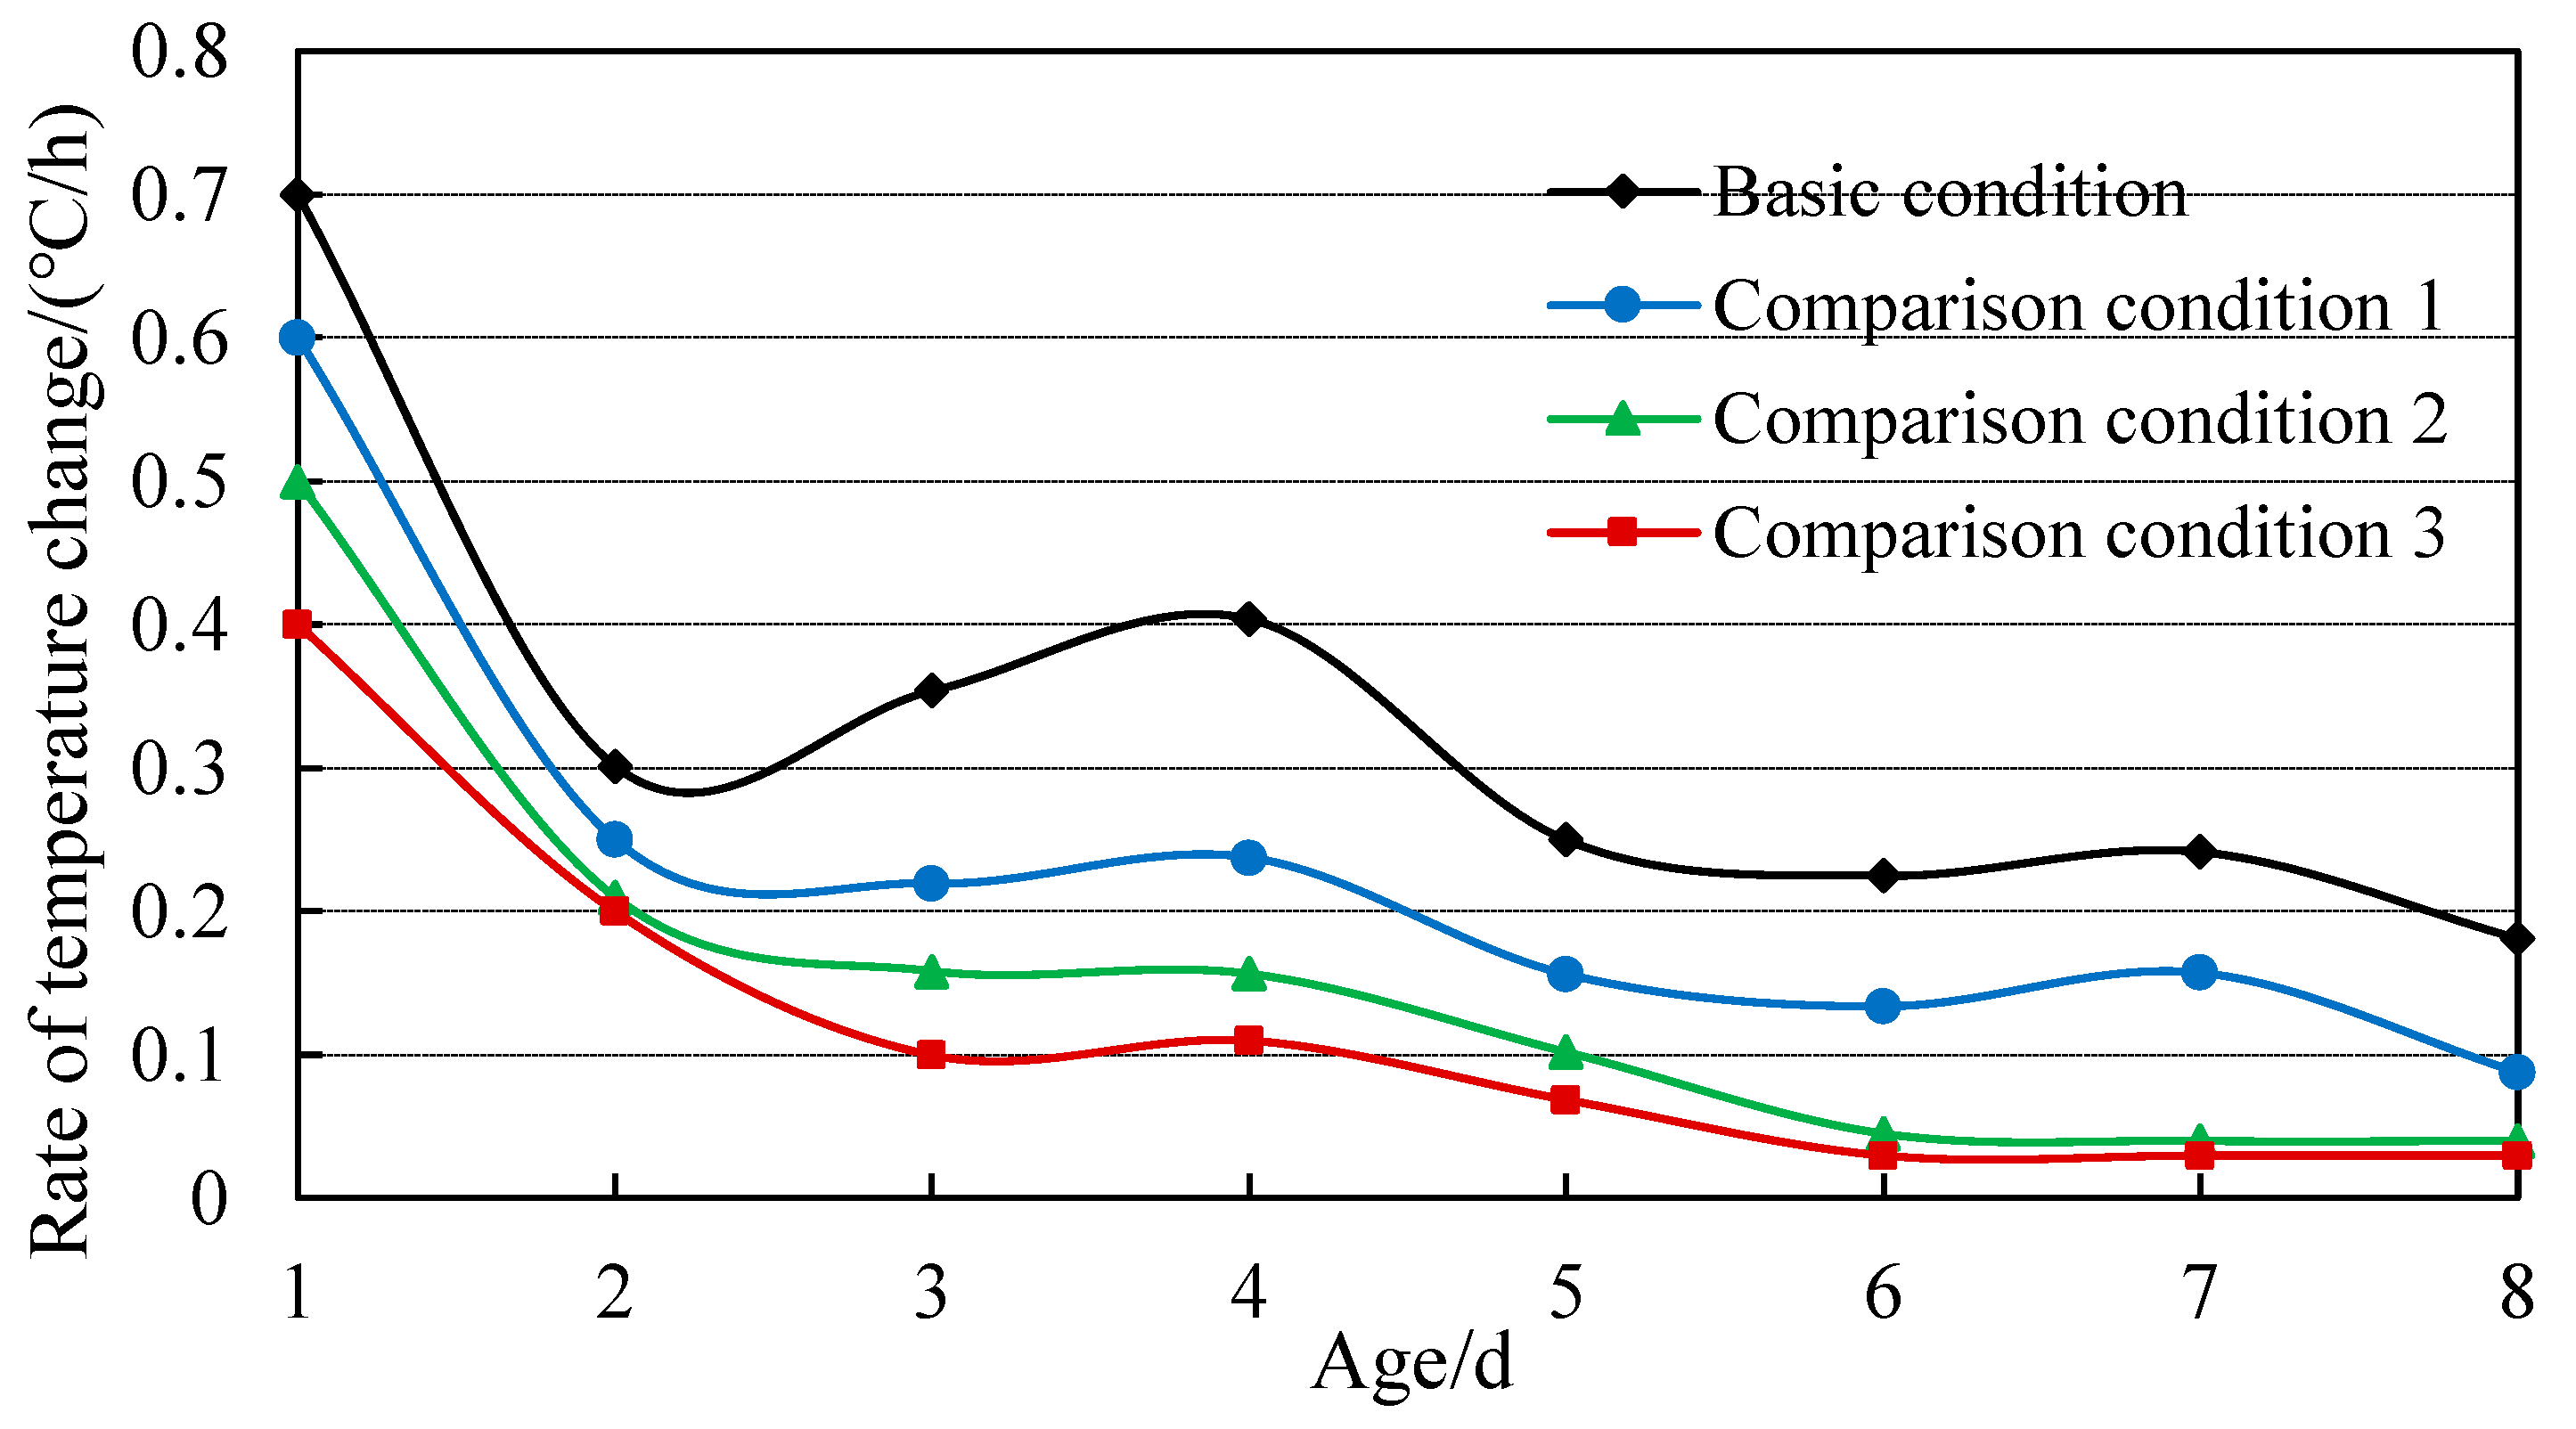
(3) The low-heat concrete on the surface of a concrete block has strong sunshine in the daytime and the temperature is above 30 °C. The top surface is covered with a 4- or 5-cenitmeter-thick polyethylene coil, and the peak elimination effect is obvious. The maximum daily variation of concrete temperature is reduced from 12.28 °C to 8.61 °C and 8.05 °C. The maximum temperature gradient is reduced from 16.6 °C·m−1 to 8.6 °C·m−1 and 7.2 °C·m−1. In an environment with a daytime temperature of about 25 °C and strong sunshine, the temperature control effect of providing coverage with 2-, 4-, and 5-centimeter-thick polyethylene sheets on the top surface is not significantly different, which can effectively reduce the influence of solar radiation heat on the surface temperature of low-heat concrete.
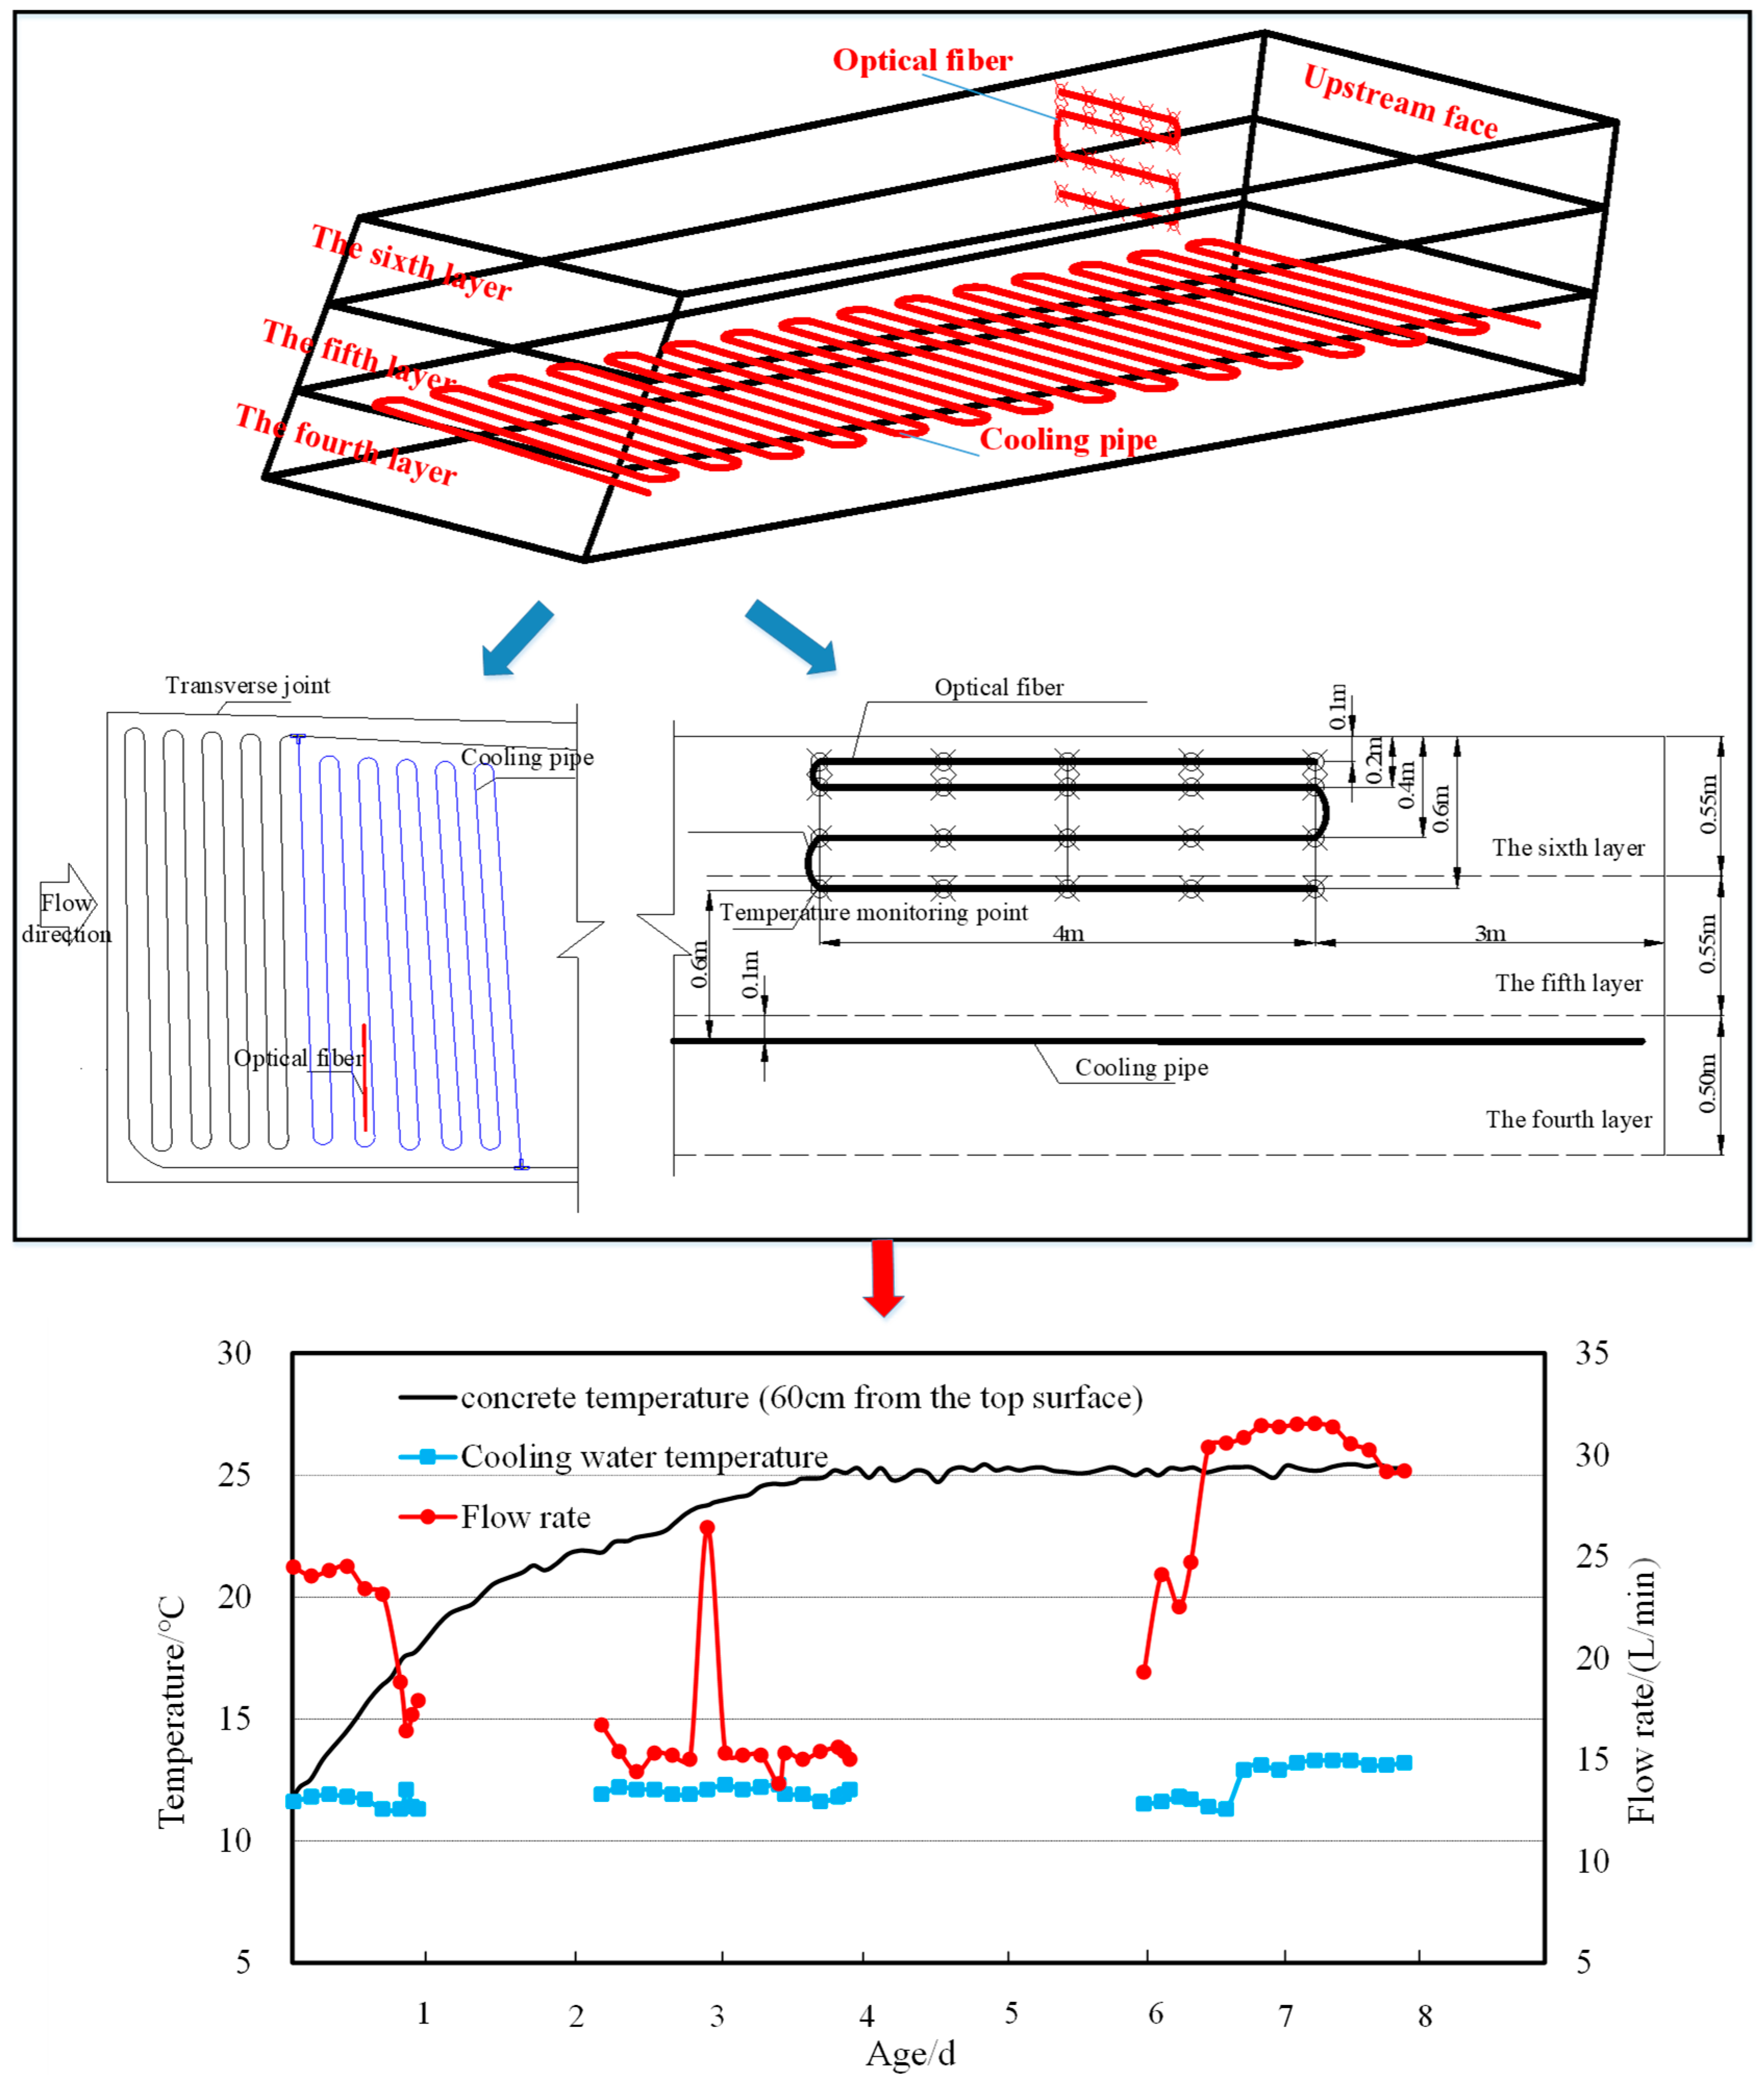
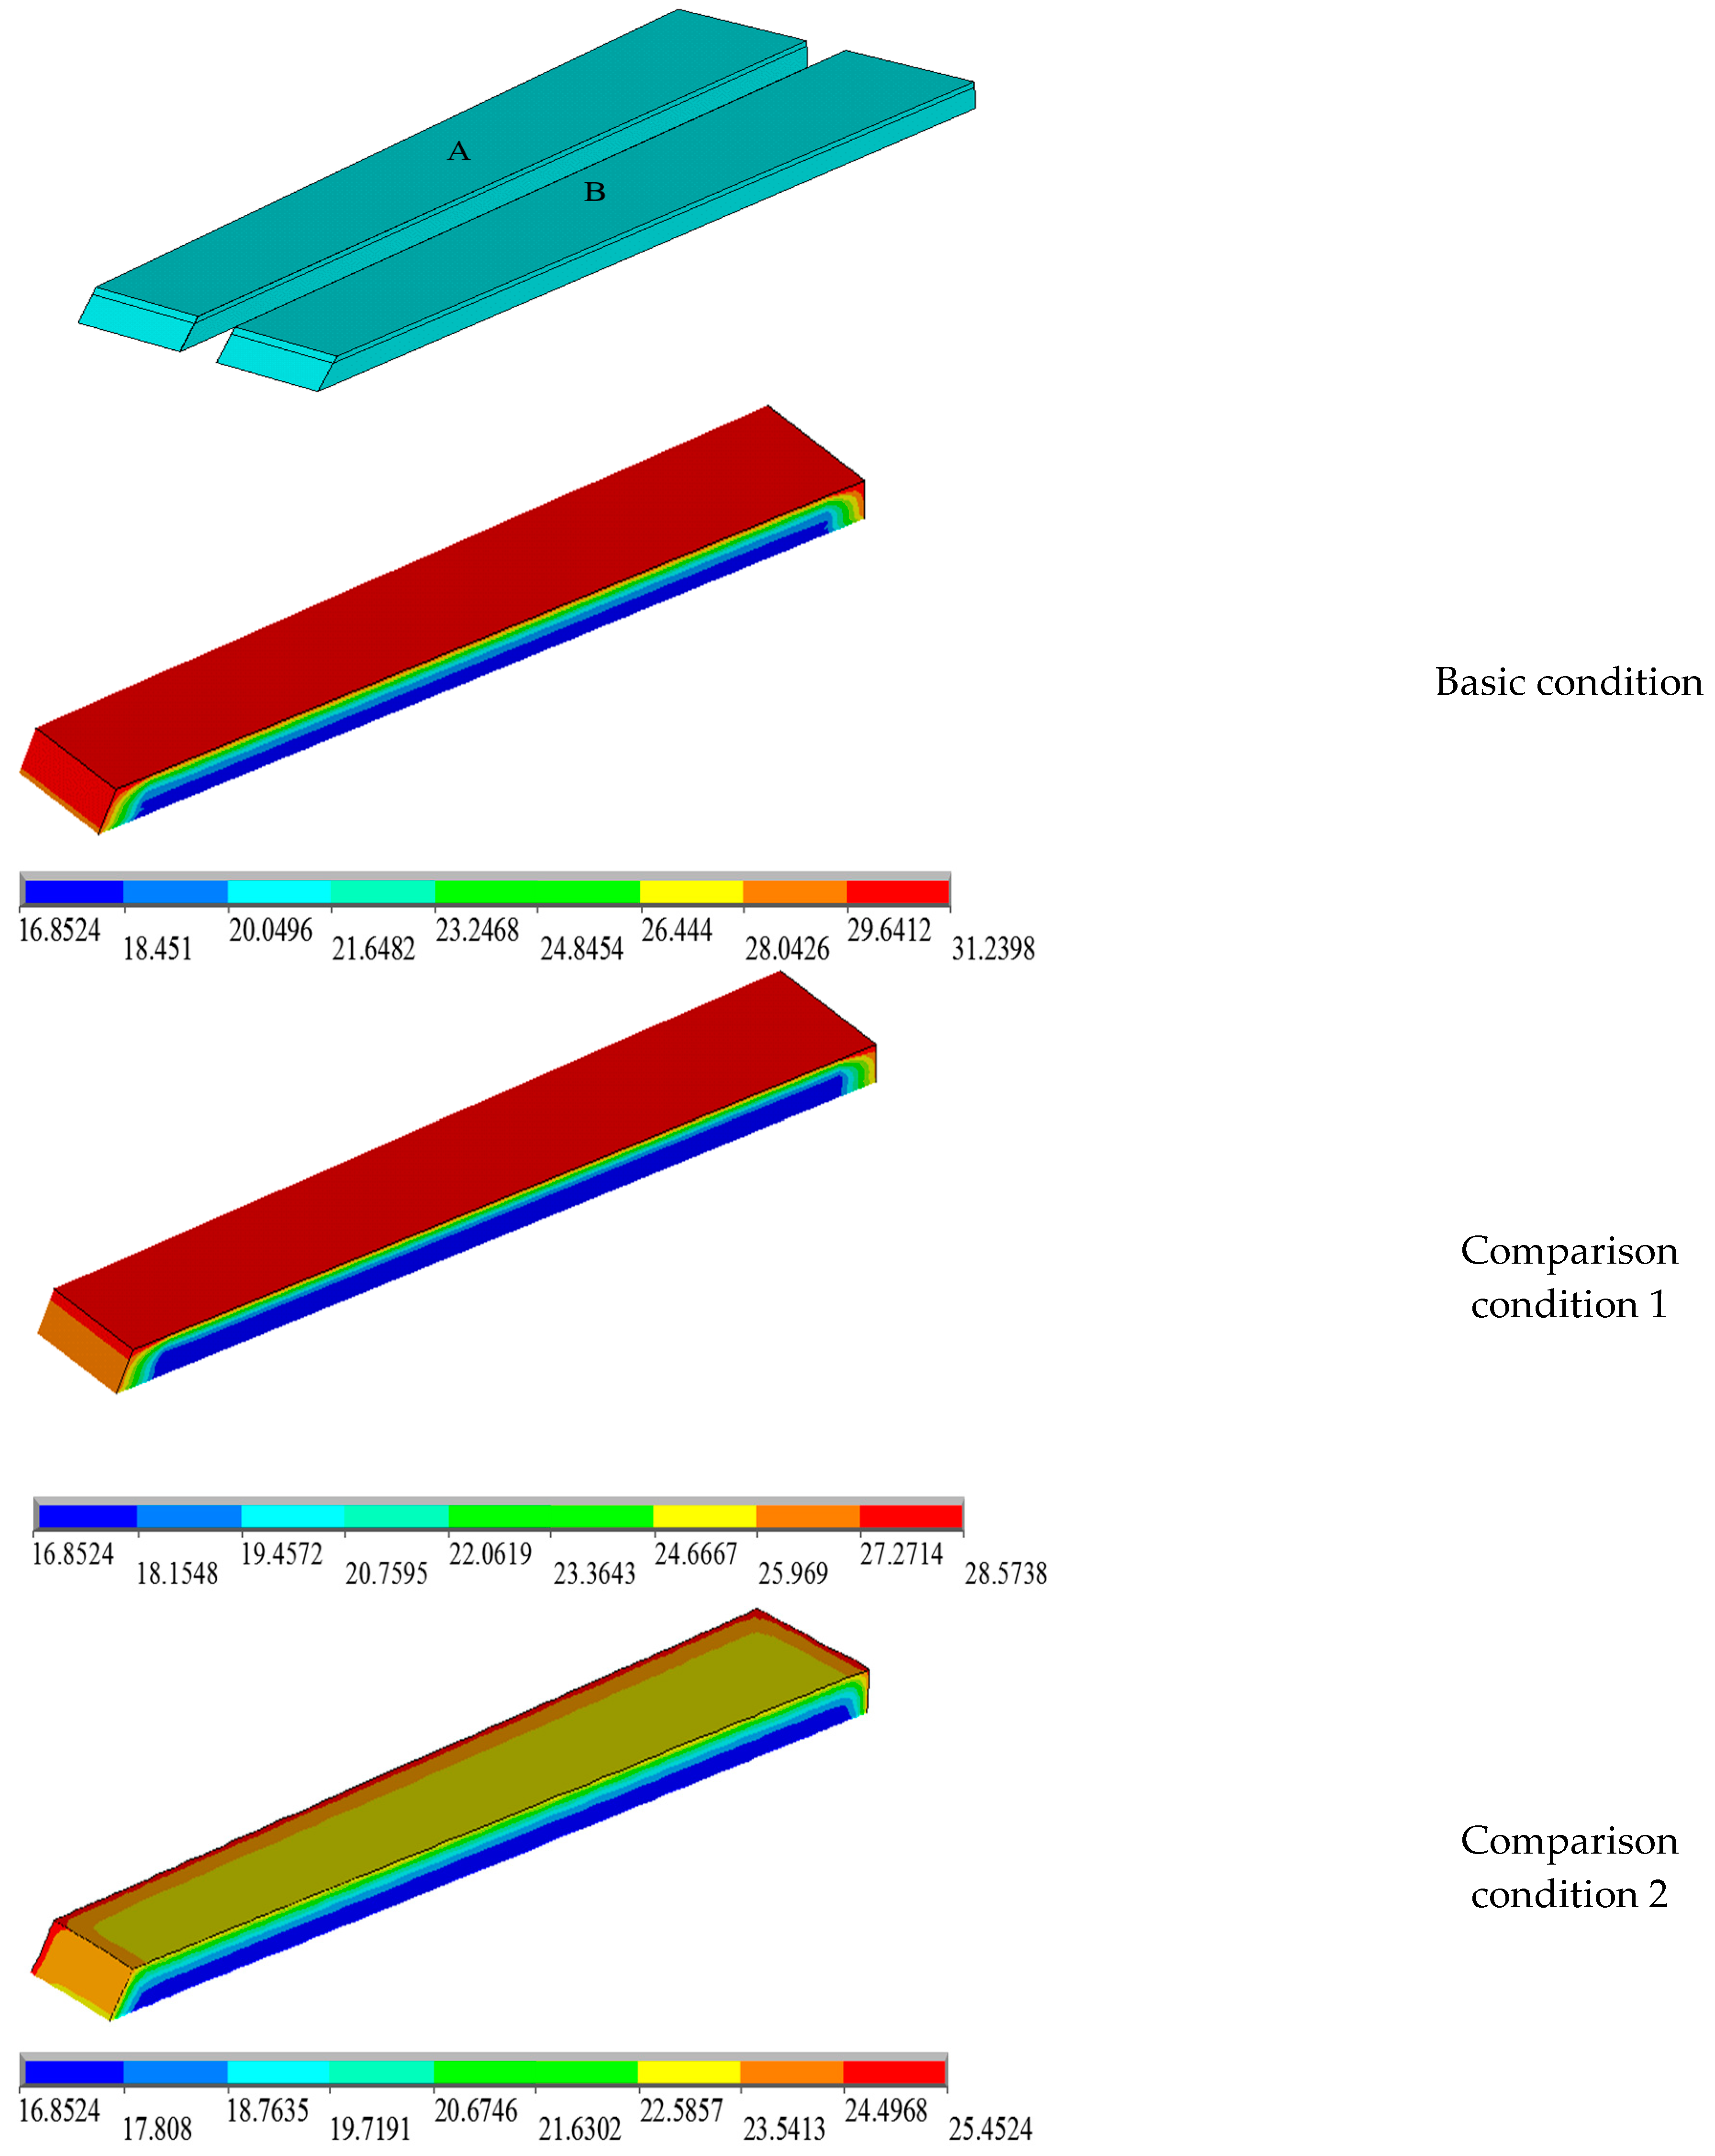
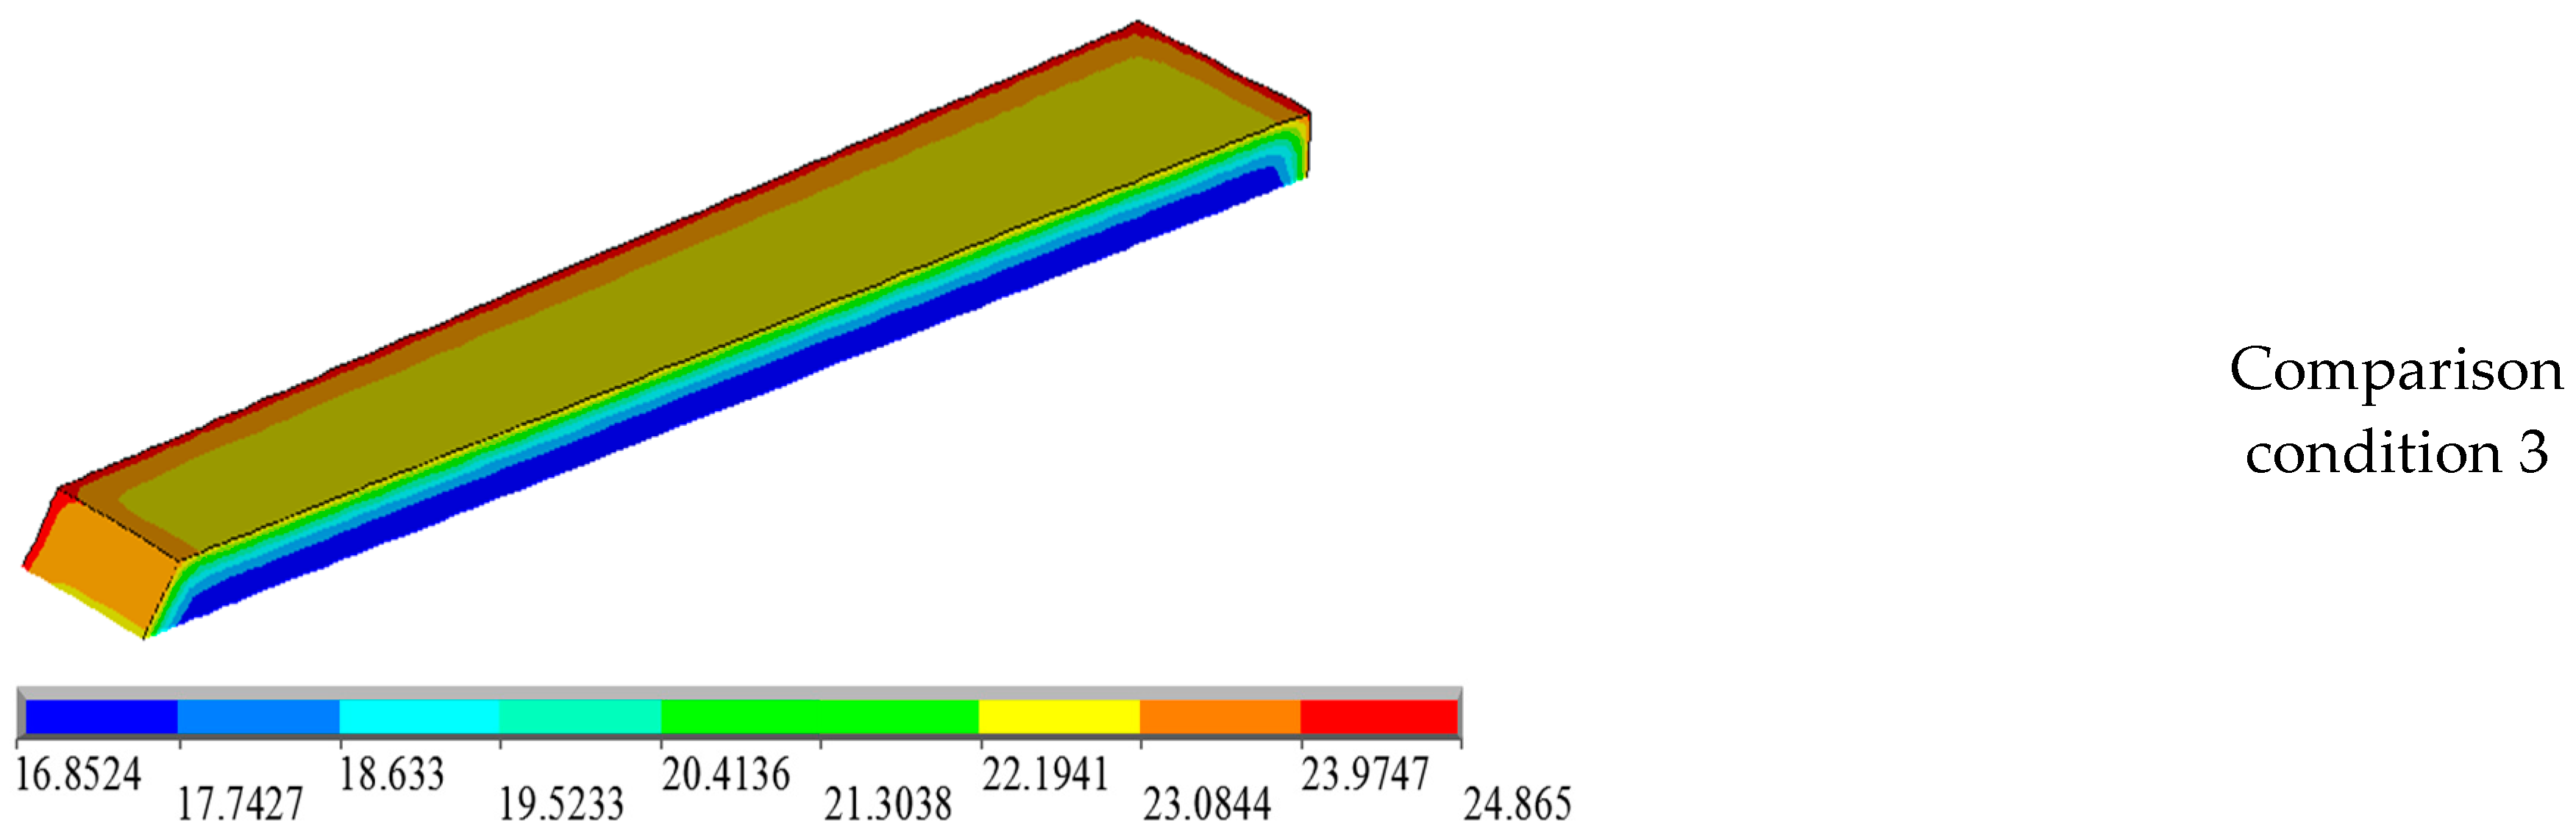
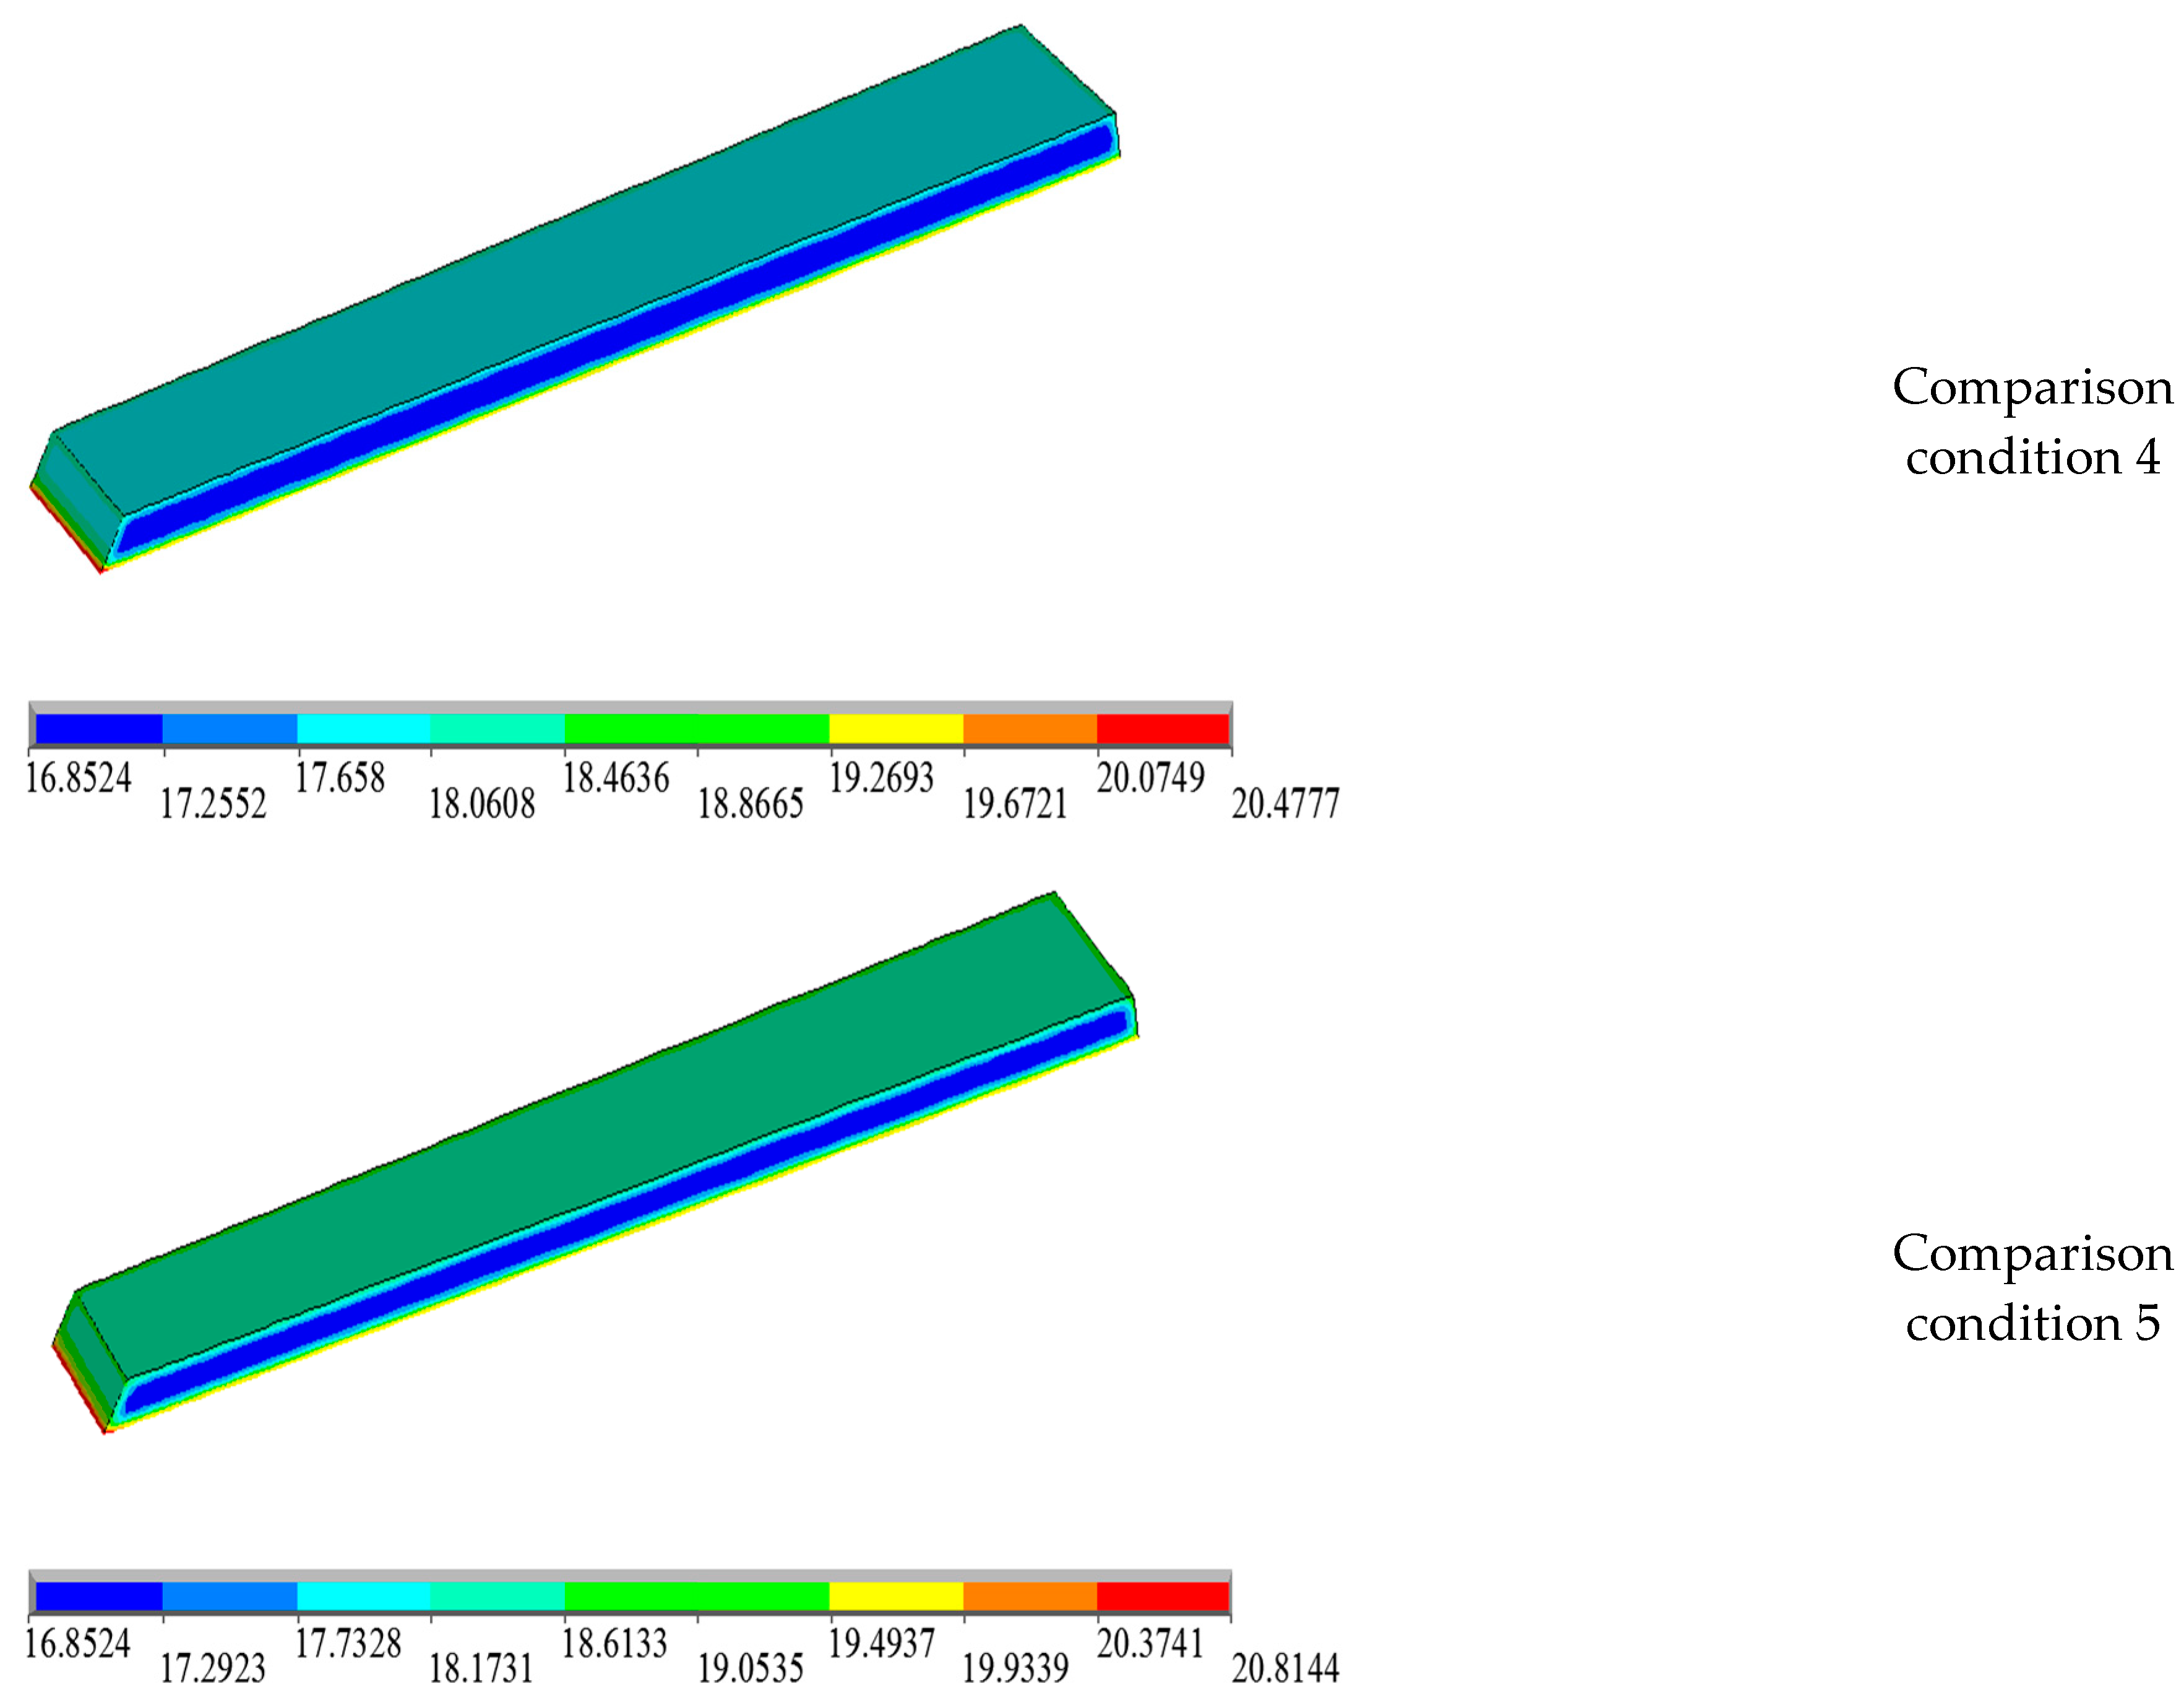
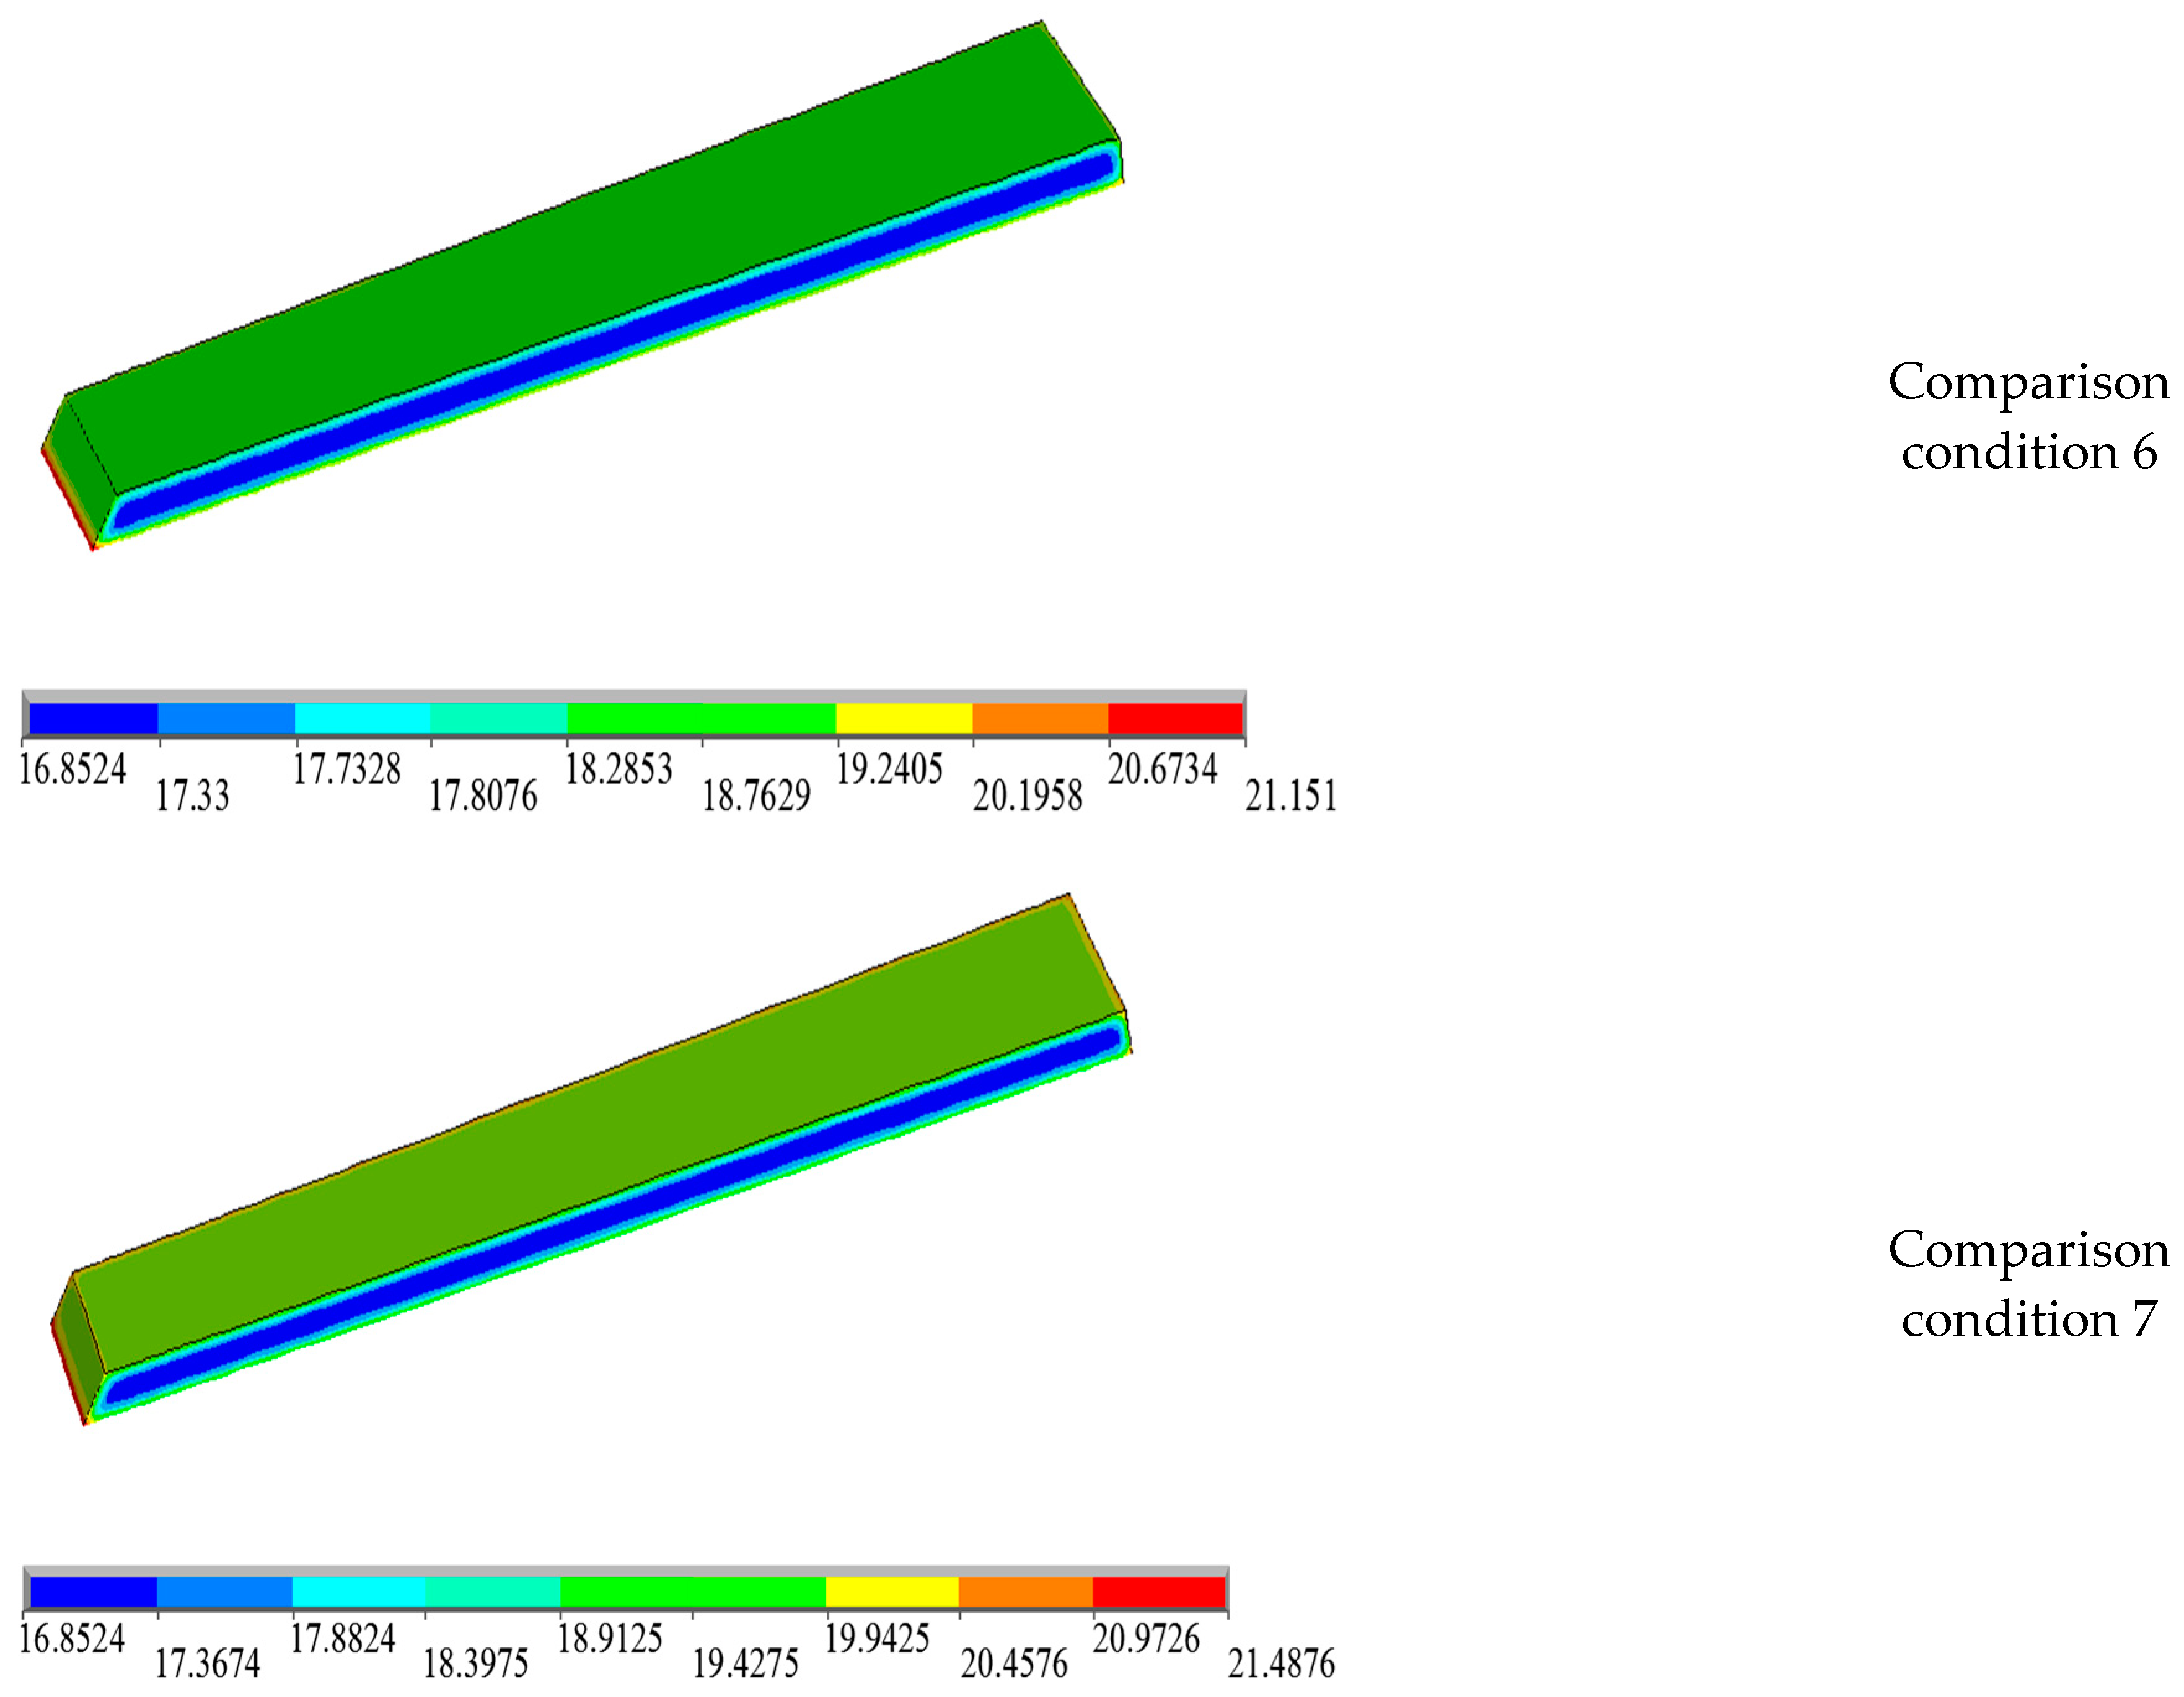
(4) Based on the finite element calculation model of a pouring block considering solar radiation heat, the temperature control effect of the top surface of the pouring block with two kinds of heat preservation measures is calculated. The first kind of heat preservation measure involves the top surface of the pouring block being covered with 2-, 4-, and 5-centimeter-thick polyethylene coils, and the second kind of heat preservation measure involves water curing at different temperatures. The calculation results show that: (1) Under the condition of strong solar radiation heat, the top surface of the pouring silo covered with 2-centimeter-thick polyethylene coils is not enough to meet the requirements of temperature control and crack prevention for early-age concrete. Coverage with 4- and 5-centimeter-thick polyethylene coils can not only prevent the surface temperature rise caused by solar radiation heat but also reduce the temperature difference from the inside to the outside of concrete caused by a large temperature difference between day and night. Therefore, considering the weather characteristics of a high temperature, strong radiation, and a large temperature difference between day and night in the Baihetan dam, it is suggested that the top surface insulation material should be mainly 4-centimeter-thick polyethylene coils from the perspective of economic practicability and an effective temperature control effect. (2) Water curing in the range of 18–24 °C during the day and coverage with 4-centimeter-thick polyethylene coils on the top surface at night can effectively reduce the temperature difference, temperature gradient, and temperature variation range of the surface concrete and reduce the influence of solar radiation heat on the temperature effect of concrete.
Therefore, from the economic point of view and the distribution range of river water temperature, it is suggested that 22–24 °C water temperature should be used for water curing in periods of high temperatures and strong solar radiation during the day, and a 4-centimeter-thick polyethylene coil should provide coverage at night. These temperature control schemes have been applied to the Baihetan arch dam and have achieved a remarkable effect.
In future research, the temperature gradient monitoring and analysis of multiple positions in the pouring block should be further carried out, and a more reasonable and accurate simulation calculation model should be combined to realize the temperature control effect evaluation and temperature control measures implementation suggestions under different temperature control measures and different solar radiation intensities for the low-heat concrete.


