Abstract
To assist in addressing the problem where an aluminum alloy formwork (AAF) deforms more greatly under the action of lateral pressure and therefore does not meet the requirements of plaster-free engineering, we propose a method for determining the geometric parameters of this formwork based on a PSO algorithm and BP neural network with ABAQUS as the platform. The influence of six geometric parameters of the formwork on the maximum deflection value of the panel under the action of lateral pressure is studied using finite element analysis. The maximum deflection value of the panel is used as the index, and the influence of each factor is analyzed with an orthogonal test, and a set of optimal geometric parameters is obtained via extreme difference analysis and analysis of variance. The sample data are obtained via finite element simulation, and the PSO-BP neural network model is established using the six factors of the orthogonal test as input values and the maximum deflection of the panel as the output value, and the optimal geometric parameters are optimized using the PSO algorithm. The results indicate that the maximum deflection for the panel in the orthogonal scheme is 1.446 mm. The PSO-BP neural network prediction model demonstrates greater accuracy and a 31.74% reduction in running time compared to the BP neural network prediction model. The optimized PSO-BP neural network prediction model scheme reveals a maximum panel deflection of 1.296 mm, a 10.37% decrease compared to the orthogonal solution. These findings offer technical guidance and a foundation for optimizing AAF designs, presenting practical applications.
1. Introduction
Cast-in-place-reinforced concrete structures account for a large proportion of modern infrastructure construction. Many experiments and simulations have been conducted by numerous scholars to ensure that the mechanical properties of concrete are within the limits through considering the mix design and maintenance conditions [1,2,3,4]. Formwork, as the basis for concrete forming, is an important component of concrete structure construction. The use of different formworks in construction leads to variations in cost, efficiency, quality, and schedule [5,6,7].
There are many types of formworks used in construction, including traditional wooden and bamboo formworks, plastic formworks, wood–plastic composite formworks, steel formworks, AAFs, etc. However, all of these formworks have certain limitations and shortcomings [8,9]. Traditional bamboo and wood formworks have the advantages of light weight, easy processing, and low cost per layer, but the formwork quality is poor, and the service life is short [10,11,12]. The surfaces of plastic formworks are smooth, have good waterproof ability, are easy to demold, and are more convenient to process, manufacture, and recycle, but plastic formworks readily age and warp, and white waste easily forms after disposal, causing serious pollution to the environment [13]. Wood–plastic composite formworks have a low Young’s modulus and stiffness, and their mechanical properties are easily reduced via the increase in temperature during construction [14,15,16]. Steel formworks have good quality and high efficiency in construction operations, but the formwork is self-reliant and dependent on lifting equipment [17]. AAFs have broad application prospects in cast-in-place-reinforced concrete structures, where they demonstrate the advantages of light quality, high corrosion resistance, green environment, and high turnover, and AAFs are more suitable for early demolition and plaster-free projects than formworks composed of other materials are [18]. However, the Young’s modulus of AAFs is approximately one-third of that of steel formworks, resulting in poor performance in terms of formwork deflection control [19].
In recent years, many scholars have conducted in-depth research and analysis on the optimization of AAF performance. E. Gallego et al. used ANSYS finite element software to simulate the force deformation of freshly mixed concrete against complex shaped formwork [20]. Hung tested AAFs coated with polyvinylidene fluoride (PVDF) and polyurethane (PU) and concluded, following comparison and analysis, that PVDF-coated formworks have higher corrosion resistance, which can reduce the viscosity of concrete and extend the service life of the formwork [21]. Yang et al. proposed a calculation method for analyzing and calculating the lateral pressure on the joints of AAFs under self-compacting concrete using the envelope curve method and optimized the design of an aluminum alloy vertical joint formwork using ANSYS analysis [22]. Shi et al. studied the mechanical properties of two kinds of wood–plastic composite formworks with an aluminum alloy frame and proposed a simplified calculation formula for the formwork based on their experimental and numerical simulation analysis results [23]. Pan Qinfeng et al. used ABAQUS to simulate and analyze the mechanical properties of AAFs by adjusting the specifications, panel thickness and thickness of transverse rib walls in addition to other parameters [24]. Wei Jia et al. analyzed the stress and deformation of the AAFs by changing the panel thickness, shape of the longitudinal rib sections, and spacing of the back flute, and obtained the optimal choice of these three parameters [25].
By referring to relevant Chinese specifications, the following information can be obtained; according to Aluminum Alloy Formwork (JG/T 522—2017) [26], the thickness of the panel should be no less than 3.5 mm, the height of the side rib should be 65 mm, the diameter of the hole should be 16.5 mm, the distance between the center of the hole and the panel should be 40 mm, and the distance between the center of the hole to the adjacent hole should be no more than 300 mm. It is stipulated in the Technical Specification for Combined Aluminum Alloy Formwork Engineering (JGJ 386—2016) [27] and Application Technical Standard of Combined Aluminum Alloy Formwork (XJJ 123—2020) [28] that the thickness of the panel with a width of 500 mm should not be less than 3.5 mm, and the wall thickness of the frame should not be less than 5 mm. According to the regulations of the Technical Code for Safety of Forms in Construction (JGJ 162—2008) [29] and Code for Construction of Concrete Structures (GB 50666—2011) [30], the cumulative deformation of formwork is 3 mm after mold removal in plastering engineering and 2 mm after mold removal in plaster-free engineering.
Many methods for parametric analysis and optimal design are available in current research. Zhang et al. integrated experimental findings with Dunn’s grey correlation theory analysis method to examine the sensitivity of four blend contents’ effects on the mechanical properties and durability of FMGM, ultimately determining the optimal mix ratio for performance [31]. Ajeet Singh Rajput et al. employed artificial neural networks to devise a technique capable of quantifying and predicting material losses due to wear and tear, along with structural improvements [32]. Jee-Heon Kim et al. utilized an ANN machine learning algorithm to model the energy consumption of chillers in HVAC systems, enhancing prediction accuracy by increasing input variables and adjusting the training data ratio [33]. Ke et al. applied a PSO-BP deep-hole blast breakage prediction model to estimate the blockage rate of optimized blast parameters, successfully lowering the blockage rate through parameter optimization [34].
Differently from the previous analysis of AAF geometrical parameters, this paper firstly analyzes the effect of changing the thickness of panels, shape of longitudinal rib sections, thickness of transverse rib walls, number of transverse ribs, thickness of side and end rib walls, and height of side and end ribs on the maximum deflection value of AAF panels under lateral pressure with the same arrangement of both pin holes and back flute restraint. Then, by discussing the influence of the six geometric parameters on the maximum deflection value of the panel under the same lateral pressure, the influence law of different geometric parameters on the mechanical properties of the AAFs of this specification and the parameters for improved performance when bearing load are obtained. By establishing the PSO-BP neural network prediction model and using the PSO algorithm to determine the optimal geometric parameters, the optimal geometric parameters are obtained and used to guide the application of this type of AAF in plaster-free projects.
2. Finite Element Model Verification
To verify the feasibility of finite element software analysis, the panel deflection data measured in the static test of AAFs were compared with the results of finite element simulation, and the error between the two results based on comparison was used to verify the effectiveness of the finite element simulation.
2.1. Static Loading Test Design
According to the static test requirements in the Aluminum Alloy Formwork, AAFs of Xinjiang Changhedaye Construction Technology Co., Ltd. with a selected specification of 1200 mm × 500 mm were used for the test. The standard brick was used as the support and load in the test. The bearing distance wass 225 mm from the outer wall of the end rib, and the width of the bearing was 115 mm. Five displacement meters for measuring deflection were equidistant between the two supports on the bottom surface of the AAF (see Figure 1). A rubber mat was placed in the center of the formwork and standard brick was placed on top of the rubber mat. A total of 30 standard bricks placed in 3 layers were of first-level load, with a total of fifth-level load, as shown in Table 1. After loading each level of load, the system was left to stand for 20 min, and the value on the displacement meter was then read after the deformation of the formwork.
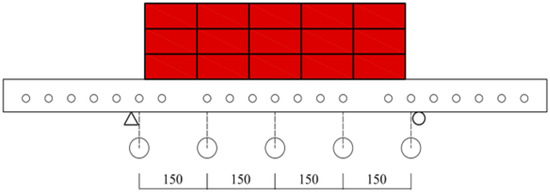

Figure 1.
Displacement meter layout (in mm).

Table 1.
Static test loading scheme.
2.2. Data Simulation
The finite element software ABAQUS was used to analyze the deformation of AAF panels. Aluminum alloy 6061-T6 was selected as the formwork material, and it was assumed that the behavior of the formwork material corresponds to an ideal elastic–plastic material. The formwork parameters were set by referring to the specification [26,27,28,29,35]. The parameters are shown in Table 2, and the model is shown in Figure 2. The thickness of panel is 3.5 mm, there are two longitudinal ribs, the shape of longitudinal rib section is T-shaped, there are two transverse ribs, the thickness of transverse rib wall is 3 mm, the thickness of side and end rib wall is 5 mm, and the height of side and end rib is 65 mm. The formwork pin hole diameter is 16.5 mm and the height is 40 mm, the spacing is set to 50 mm, and the maximum spacing is not more than 300 mm.

Table 2.
Parameters of AAFs.
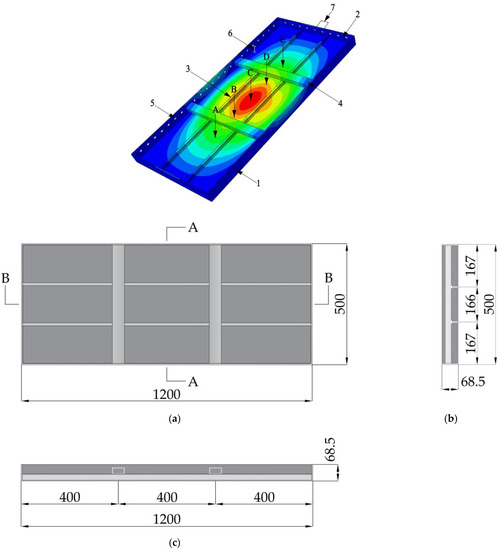
Figure 2.
AAF in ABAQUS (in mm): 1—side rib; 2—end rib; 3—longitudinal rib; 4—transverse rib; 5—pin hole; 6—pin hole height; 7—pin hole spacing; (A)—measuring point A; (B)—measuring point B; (C)—measuring point C; (D)—measuring point D; (E)—measuring point E; (a)—top view of aluminum alloy formwork; (b)—A-A sectional drawing; (c)—B-B sectional drawing.
In ABAQUS, three-dimensional solid elements are used to construct the AAF model with the given dimensions. The displacements in the X, Y, and Z directions at the bottom of the side ribs at both ends are fixed, as shown in Figure 2, to simulate support constraints. The “Surface-to-surface” option is selected for contact. Binding constraint “TIE” is employed at connection nodes between longitudinal ribs and the panel’s bottom, end ribs’ inner walls, transverse ribs’ tops, and the junction of transverse ribs’ side edges with side ribs’ inner walls. During the simulation, the number of analysis steps is set to match that in the static test, and corresponding load values are applied to each analysis step. The “Continuum” element library is chosen. The cell type is “C3D8I” (eight-node solid, non-coordinated mode) [36], with a linear geometric order. “Hex-dominated” mesh controls are selected. AAF’s overall mesh division accuracy is 10 mm, and the mesh at connection nodes of each member is set to 5 mm to account for stress concentration.
2.3. Analysis of Static Test Results
Since the dial indicator was symmetrically arranged in the test, the readings of the symmetrical measuring points were close, and the deflection values of the simulated symmetrical measuring points in the finite element software were the same, and the results for comparison between the three groups of test and simulation are listed in Table 3, where the errors of the three groups of test and simulation results were calculated using Equation (1):

Table 3.
Comparison of test and simulation results.
The comparison between the deflection values of the test and simulation results shows that the deflection errors of the test and simulation results at the measurement points A, B, and C are all within the range of 14%. From Figure 3, it can be seen that the simulated deformation and the actual deformation trend are basically the same. Therefore, the simulation in this study is feasible, and the simulation results are highly reliable.
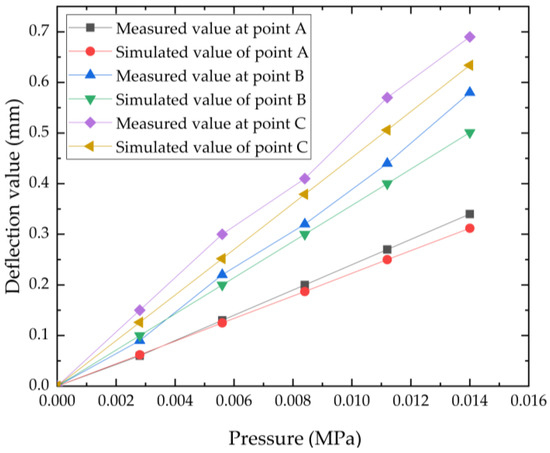
Figure 3.
Comparison of measured values of measuring points A, B, and C with simulated values.
3. Simulation Analysis of Influence of Geometric Parameters on Panel Maximum Deflection
The mechanical properties of AAFs are affected by many factors, among which the geometrical parameters have a great influence. How to improve the bearing capacity of formwork is an urgent problem that can be addressed by optimizing the geometrical parameters of the formwork. Finite element software was used to analyze the geometrical parameters of AAFs, namely the thickness of panels, shape of longitudinal rib sections, thickness of transverse rib walls, number of transverse ribs, thickness of side and end rib walls, and height of side and end ribs, and their effect on the maximum deflection of the panel under a construction load. In this paper, the AAF model size is 2700 mm × 500 mm. The six aforementioned geometric parameters of the AAF were varied, and their influence on the bending mechanical properties of the template was studied.
3.1. Parameters Setting
The lateral pressure of concrete on the AAF increases with the height of the concrete pour. When the pour height reaches a critical value, the lateral pressure no longer increases, reaching the maximum lateral pressure for the newly poured concrete. The maximum pour height at which lateral pressure is reached is called the concrete’s effective pressure head. Referring to the specifications [28,29], when using an internal vibrator, the lateral pressure of the newly poured concrete on the AAF can be calculated using Formula (2), choosing the smaller value.
In the formula, F is the maximum lateral pressure of the template, kN/m2; concrete gravity density, in kN/m3, is generally taken as 24 kN/m3; V is the speed of pouring concrete, m/h, which is taken as 1.5 m/h in the calculation; t0 is the initial setting time of concrete, h, calculated according to t0 = 200/(T + 15), where T is the temperature at the time of concrete pouring. Considering that there is a winter off-period for construction in the Xinjiang Uygur Autonomous Region, the maximum and minimum daily temperatures from April to October are taken as 18 °C, then t0 = 6.06 °C; β is the slump correction factor, taken as 1.0; H is the total height of concrete pouring, which is 3.1 m; h is the effective indenter height, h = F/γc = 2.0 m. The value of 4 kN/m2 is taken for the live load, and the constant load and live load are multiplied by the load component coefficients of 1.3 and 1.5, respectively, and then added to obtain the final load value, which is 56.67 kN/m2. The load distribution is shown in Figure 4.
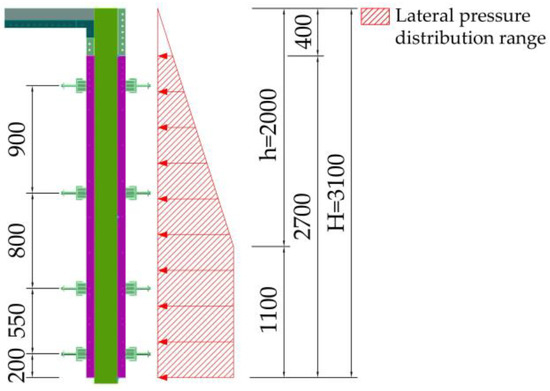
Figure 4.
Lateral pressure distribution diagram (in mm).
A finite element model was established using ABAQUS, and loads were applied to the panel with the corresponding boundary conditions at the pin hole walls and at the height of the side ribs of 200, 750, 1550, and 2450 mm (see Figure 4).
3.2. Thickness of Panel
Five different thicknesses were selected for the panel. The geometric parameter settings and finite element calculation results are shown in Table 4. The results show that when the panel thickness increases—that is, the rectangular section height of the panel increases—the bending stiffness of the AAFs can be effectively improved, and the maximum deflection value of the panel can be reduced. Therefore, the change in the panel thickness of the formwork has a greater influence on the deflection value and flexural stiffness of AAFs.

Table 4.
The effect of panel thickness on maximum panel deflection.
3.3. Shape of Longitudinal Rib Sections
The longitudinal ribs can transfer the load from the panel to the end ribs, and then from the pin holes of the end ribs to the pins and pin pieces. According to the literature [37], it is known that the number of longitudinal ribs is set to two. Referring to the specifications [26,35], there are five types of longitudinal rib section shapes used in this numerical simulation. Figure 5 shows the detailed configuration of the shape of the longitudinal rib sections.
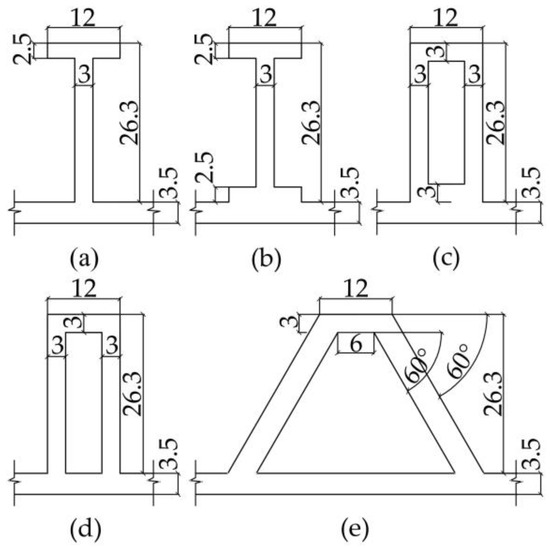
Figure 5.
The shape of longitudinal rib sections (in mm): (a) T-shaped; (b) I-shaped; (c) square-shaped; (d) box-shaped; (e) trapezoid-shaped.
The longitudinal ribs transfer the load from the panel to the end ribs, and, in turn, it is transferred to the other formwork and floor slabs via the pins and bottom-angle aluminum. In this study, based on these five types of longitudinal rib cross-sectional shapes, a formwork model with a width of 500 mm was developed with two longitudinal ribs and a spacing of 166 mm, and was uniformly distributed on the panel. The finite element simulation results for five types of longitudinal rib section shapes are shown in Table 5. Comparing the effects of the five types of longitudinal rib section shapes on the maximum deflection of the panel, it can be seen that the trapezoid-shaped section has the greatest effect on the maximum deflection of the panel, and the square-shaped and box-shaped sections also have a more significant effect on the maximum deflection of the panel than the T-shaped and I-shaped sections do, which have a relatively small effect.

Table 5.
The effect of longitudinal rib sections shape on maximum panel deflection.
3.4. Thickness of Transverse Rib Walls
The transverse ribs can not only prevent the side ribs from undergoing large deformation and thus improve the structural stability of the formwork but also facilitate transfer of the load on the longitudinal ribs to the side ribs, thereby reducing deformation of the longitudinal ribs. Therefore, it is necessary to study the degree by which the thickness of transverse rib walls influences the maximum deflection of the panel. It can be seen from Table 5 that the maximum deflection of the panel decreases with the increase in the thickness of the transverse rib walls.
According to the data analysis results in Table 6, increasing the thickness of transverse rib walls can significantly improve the flexural stiffness of the formwork. Increasing the thickness of transverse rib walls from 1.5 to 3.5 mm in an increment of 0.5 mm results in the maximum deflection of the panel being reduced by 9.19%, 15.99%, 20.93%, and 24.63%. At the same time, the stress of the AAF is mainly concentrated in the weld of the transverse ribs and side ribs, as shown in Figure 6. Increasing the thickness of transverse rib walls can increase the welding area between the transverse ribs and side ribs, making the connection firmer and reducing the stress concentration of the AAFs at the welding of the transverse and side ribs. It can be seen from the above analysis that increasing the thickness of transverse rib walls has a great influence on improving the flexural stiffness of the formwork and reducing the maximum deflection of the panel.

Table 6.
The effect of transverse rib wall thickness on maximum panel deflection.
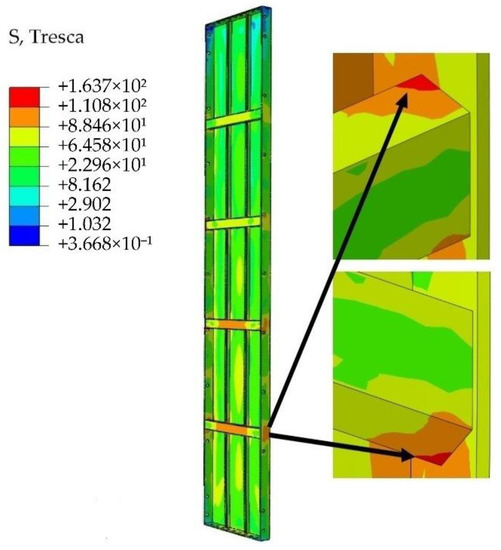
Figure 6.
Connection of AAF transverse and side ribs (in MPa).
3.5. Number of Transverse Ribs
Based on the finite element analysis, it can be concluded that when the AAF is subjected to lateral pressure perpendicular to the panel, both the panel and the transverse ribs will be bent vertically downward, and the deformation is the largest at 1/4 of the height of the AAF in a vertical position and decreases toward both sides of the rib in turn. The side and end ribs are bent and deformed in a direction perpendicular to their outer walls and outward, with less deformation than for the panel and transverse ribs. It can be seen from Table 7 that by gradually increasing the number of transverse ribs and arranging them evenly, the overall flexural stiffness of the AAF increases, and the maximum deflection of the formwork panel decreases significantly. It can be concluded that the number of transverse ribs can be increased to fully limit deformation of the AAF panel and improve its load-bearing capacity.

Table 7.
The effect of transverse rib number on maximum panel deflection.
3.6. Thickness of Side and End Rib Walls
The AAF is connected to other formworks via the pin holes on the side and end ribs, and the load is transferred to the pins and pin pieces from around the walls of the pin hole. As a result, the near wall of the pin hole may be the first place where there is deformation due to the excessive load imposed by the panel, resulting in serious consequences in terms of fracture. In accordance with the specification [26,28], five kinds of thickness of side and end rib walls were designed, and the finite element software ABAQUS was used to simulate the influence of the change of side and end rib wall thickness on the maximum deflection of the template panel, as shown in Table 8.

Table 8.
The effect of side and end rib wall thickness on maximum panel deflection.
It can be seen from the data in Table 7 that the maximum deflection of the AAF panel decreases with the increase in the thickness of side and end rib walls. Compared with the simulation results of 5 and 7 mm, the maximum deflection of the panel decreases by 11.64%, showing an obvious decreasing trend. Under the action of side pressure, due to the need for connection of the AAF system, holes are opened on the side and end ribs at a distance of 50 mm. The number of pin holes is large, and the stress around the hole wall is large, which represents the weakness of the formwork. The simulation results show that the stress around the pin hole wall can be reduced by increasing the thickness of side and end rib walls. Therefore, increasing the thickness of side and end rib walls plays a significant role in improving the tensile strength of side and end ribs and preventing the tensile fracture of pin hole walls.
3.7. Height of Side and End Ribs
In order to study the influence of the height of side and end ribs on the AAF mechanical properties, five kinds of side and end ribs were designed based on the specification requirements [26,28]. It can be seen from the results in Table 9 that the height of side and end ribs are based on 65 mm, and the heights of 5 and 10 mm are increased and decreased. There are 5 groups in total. Compared with the height of side and end ribs of 65 mm, the influence of the other 4 groups of the height of side and end ribs on the maximum deflection of the panel is less than 1.5%. In addition, because the longitudinal ribs are welded to the panel and do not exceed the height of the pin hole, the transverse ribs are located near the pin hole, and the transverse ribs and longitudinal ribs transfer the load to the side and end ribs. The load is mainly transferred to the pin by the wall of the pin hole on the side and end ribs, and only the smaller load is transferred from the side ribs to the back flute. By comparing the analysis results in Table 4, Table 5, Table 6, Table 7, Table 8 and Table 9, it can be seen that the height of side and end ribs has the least influence on the improvement of formwork stiffness and in reducing the maximum panel deflection compared with the thickness of the panels, shape of the longitudinal rib sections, thickness of the transverse rib walls, number of transverse ribs, and thickness of the side and end rib walls. Therefore, of the six geometric parameters that were studied, the height of side and end ribs is the factor that has the least influence on the maximum panel deflection.

Table 9.
The effect of side and end rib wall height on maximum panel deflection.
3.8. Single Factor Analysis
Finite element analysis of the AAF geometrical parameters shows that the number of transverse ribs have the greatest influence on the maximum deflection of the AAF, followed by the thickness of the panel and the shape of the longitudinal rib sections. The thickness of transverse rib walls and the thickness of side and end rib walls also have a certain influence on the maximum deflection of the AAF, and the height of the side and end ribs have the least influence.
4. Optimization of Geometric Parameters Based on Orthogonal Test
4.1. Overview of Orthogonal Test
Orthogonal testing is an effective method with which to study and solve multi-factor optimization problems, which can allow a reduction in the number of tests and ensure the quality of tests. During design, geometric parameter combinations satisfying orthogonality, equalization, and representativeness can be selected from all the tests, and multiple groups of geometric parameters can be tested. By analyzing the test results, the situation of the comprehensive test can be understood, and the optimal geometric parameters can be quickly obtained.
4.2. Orthogonal Test
An orthogonal test was conducted to determine the optimal set of geometric parameters for minimizing the maximum deflection of the formwork panel when the AAF is subjected to lateral pressure.
Based on the results of single-factor analysis, the six geometric parameters of the thickness of panels, shape of longitudinal rib sections, thickness of transverse rib walls, number of transverse ribs, thickness of side and end rib walls, and height of side and end ribs were selected as test factors in this experiment, and it was assumed that the test factors did not affect each other. The study factors and levels in the orthogonal test are shown in Table 10.

Table 10.
Factor level table.
The orthogonal test was designed and conducted with 6 factors and 5 level tables (L25(56)). For specific data, refer to Table 11.

Table 11.
Test arrangement and results.
4.3. Analysis Results of Orthogonal Test
In the extreme difference analysis of the orthogonal test, the differences in values in each column reflect that the selected index is differently affected by the level change of each factor. It can be seen from the comparisons between columns that the greater the extreme value, the greater the degree of influence on the selected index by the factor.
Table 12 shows that RD, RA, RB, RE, RC, and RF are obtained via six factors of extreme difference, so the factors can be ordered according to decreasing influence as D (number of transverse ribs), A (thickness of panels), B (shape of longitudinal rib sections), E (thickness of side and end rib walls), C (thickness of transverse rib walls), and F (height of side and end ribs). In order to determine the significance of the influence of these parameters on the maximum deflection value of the panel, variance analysis was conducted, and the analysis results are shown in Table 13.

Table 12.
Range analysis of maximum deflection value of panels.

Table 13.
Variance analysis of maximum deflection value of panels.
The data in Table 13 show that the influence of D (number of transverse ribs) on the maximum deflection value of panels is highly significant with 99.6% confidence, while the significance of B (shape of longitudinal rib sections), A (thickness of panels), C (thickness of transverse rib walls), and E (thickness of side and end rib walls) is lower than that of D, while F (height of side and end ribs) is not significant.
According to the results of extreme difference and variance analyses, the geometric parameters of the optimal scheme were determined as a 5.5 mm panel thickness, trapezoid-shaped longitudinal rib sections, 3 mm transverse rib wall thickness, 8 transverse ribs, 6.5 mm side and end rib wall thickness, and 60 mm side and end rib height. The numerical simulation was carried out according to the above optimal geometric parameter scheme, and the maximum panel deflection value of the AAF obtained under the action of side pressure was 1.446 mm, which meets the requirements of plaster-free engineering in the specification [27,28,38]. Without considering the interaction of geometric parameters, it can be concluded that the optimization objective was fulfilled using this optimization scheme.
5. Geometric Parameter Optimization Based on PSO-BP Neural Network Prediction Model
In order to explore whether or not the optimization scheme for the geometric parameters of AAF could be improved, a PSO algorithm and BP neural network was introduced. Due to the complex structure of AAF, it is difficult to establish an accurate mathematical model, so a neural network can be used to establish a prediction model. The nonlinear mapping relationship between the six geometric parameters—namely, the thickness of panels, shape of longitudinal rib sections, thickness of transverse rib walls, number of transverse ribs, thickness of side and end rib walls, and height of side and end ribs—and the maximum deflection of the panel was established. In this paper, the method of particle swarm optimization BP neural network is first used to predict the maximum deflection value of the panel and then combined with the particle swarm algorithm for function optimization.
5.1. Sample Creation
Neural network prediction models require a certain amount of sample data to be trained for establishing the mapping relationship between input and output. Therefore, the selection of data samples is crucial for building neural network prediction models. The data were sourced from single-factor, orthogonal test, and other finite element analyses, with a total of 106 sets of data, of which 74 were randomly selected for training samples and the remaining 32 were used for testing samples.
5.2. BP Neural Network
A BP neural network is a multi-layer feed-forward neural network that consists of a three-layer structure of input layer, implicit layer, and output layer, and it has two learning processes: forward propagation of the signal and backward propagation of the error. When the signal is propagated in the forward direction, the input layer inputs data, which are operated by the weights, thresholds, and transfer functions of each neuron node in the implicit layer, and the operation values are output from the output layer. When the error is back-propagated, the total output error is solved for the partial derivatives of the weights and thresholds between each neuron node, and the gradient descent learning algorithm is used to dynamically correct the weights and thresholds between neurons in the hidden layer. These two processes are continuously iterated with calculation until the error converges to within the set accuracy range.
In this paper, the six orthogonal test factors in Table 10 are used as the input layer of the neural network, and the maximum deflection value of the panel of AAF is the output layer of the neural network. The structure of the BP neural network prediction model is shown in Figure 7.
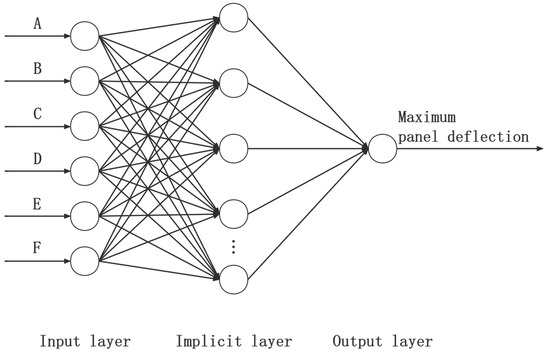
Figure 7.
BP neural network model.
5.3. PSO Algorithm
Particle swarm optimization algorithms simulate the predatory behavior of a flock of birds randomly searching for food, and are widely used in the problem of goal optimization for the advantages of simple algorithm, rapid convergence, and strong global search ability, among others, with a more significant effect. The potential outcome of each optimization problem in the algorithm is a particle in the search space, where all particles have a fitness value determined via the optimized function, and each particle has a velocity that determines the direction and distance of its “flight”. Then, the particle follows the current optimal particle in the solution space to complete the search [34,39,40,41].
In a D-dimensional search space, there are n particles forming a population, and during each iteration, the particles update their velocities and positions by individual extremes and global extremes, and the updating equations are shown in (3) and (4) [42,43,44].
In the equations, vid is the velocity of the particle; ω is the inertia weight; d = 1, 2, …, D; i = 1, 2, …, n; c1 and c2 are non-negative constants called learning factors; pid is the individual extremum; pgd is the global extremum; r1 and r2 are random numbers distributed between 0 and 1; xid is the position of the particle.
5.4. PSO Optimized BP Neural Network Prediction Model
BP neural networks perform well in pattern recognition and classification applications, but the shortcomings of their own algorithms lead to some limitations and drawbacks. However, the PSO algorithm has a simpler structure with easily tunable parameters and is suitable for use in dynamic optimization environments. PSO algorithms can be used to improve BP neural network and thus prediction accuracy. By optimizing the weights and thresholds of the BP neural network, the performance of the BP neural network is improved so that it is less likely to fall into local minima, and the generalization performance can also be enhanced to achieve prediction accuracy.
BP neural network prediction models with PSO optimization algorithms are written in MATLAB programming language [45]. The specific process is shown in Figure 8. The relevant parameters are set in the constructed PSO-BP neural network prediction model.
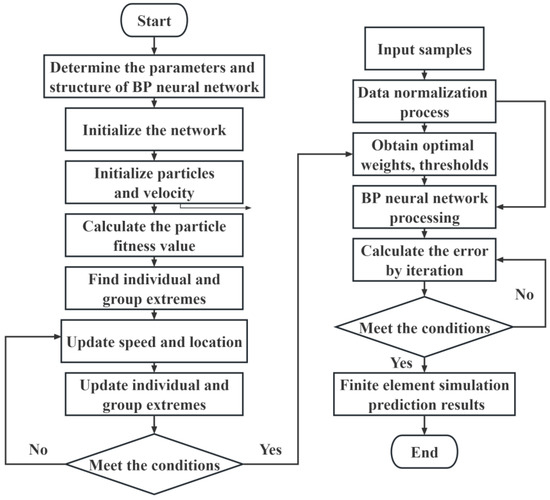
Figure 8.
PSO-BP algorithm flow chart.
The BP neural network parameters are set as follows: the number of layers of the neural network is 3, the number of input layers is 6, and the number of output layers is 1. Equation (5) is used to determine the number of nodes in the hidden layer.
In the equation, s is the number of nodes in the hidden layer; m is the number of nodes in the input layer; n is the number of nodes in the output layer; a is an integer between 1 and 10.
The number of nodes in the hidden layer is determined to be 10 based on multiple training. To eliminate the effect of differences in order of magnitude within the data on the network prediction error, the data are normalized, for which there are two common normalization processes. In this study, the maximum–minimum method is used to normalize the data, as shown in Equation (6).
In the equation, xk is the normalized combined value; x is the original value; xmin is the minimum value in the data series; xmax is the maximum value in the data series.
The “logsig” function is chosen as the transfer function for the neurons in the hidden layer of the network settings, “purelin” is chosen as the transfer function of the output layer, and the “traingdx” function is chosen for neural network training. The training target error is 0.01, the number of times the network is trained is 1000, and the output value is processed via inverse normalization at the end of the training to obtain the real data.
The PSO algorithm Is embedded in the BP neural network with a population size of 30, maximum iteration of 100, learning factor c1 = c2 = 1.5, and inertial weight particle swarm optimization algorithm with ω = 0.8.
5.5. Comparative Analysis of Two Prediction Models
To assess the prediction quality, mean absolute error (MAE) and R-squared (R2) were employed to evaluate the accuracy of the AAF panel’s maximum deflection value prediction model, while the algorithm’s average running time was used to gauge its efficiency.
The six factors of the orthogonal test were used as the initial training parameters, and the BP neural network model and PSO-BP neural network model were used for training and testing, respectively. The prediction results of the BP neural network model and PSO-BP neural network model were obtained and compared with those of the finite element simulation, and the results are shown below.
In Figure 9, the prediction curve trends for the BP neural network model and PSO-BP neural network model align with the trends for the 32 sets of simulated values from the finite element software. However, the prediction curves for the PSO-BP neural network model are closer to the simulated values. As indicated in Table 14, the MAE of the PSO-BP neural network prediction model is reduced by 0.206 and R2 is reduced by 0.0879 compared to those of the BP neural network prediction model. The PSO-BP neural network prediction model outperforms the BP neural network prediction model in both MAE and R2 performance indices. After calculating the average running time for the two algorithms over 50 runs using MATLAB R2021b, the PSO-BP neural network prediction model’s running time is 31.74% lower than the BP neural network prediction model. This analysis demonstrates that the PSO-BP neural network model has higher prediction accuracy and faster running efficiency, making the established PSO-BP neural network prediction model suitable for subsequent geometric parameter optimization.
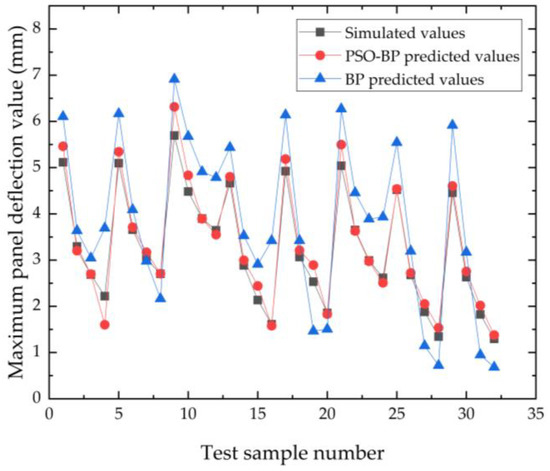
Figure 9.
Comparison of BP predicted value and simulated value before and after PSO optimization.

Table 14.
Performance comparison of two algorithms.
5.6. Geometric Parameter Optimization Based on PSO-BP Neural Network Prediction Model
The PSO-BP neural network prediction model was invoked in the PSO optimization algorithm. The PSO-BP neural network model with the maximum deflection of the panel as an indicator was used as the optimization target, and the experimental range of values of the six geometric parameters was used as the constraint. The value ranges of each geometric parameter were the thickness of panels of 3.5~5.5 mm, shape of longitudinal rib sections represented by numbers 1~5, thickness of transverse rib walls of 1.5~3.5 mm, number of transverse ribs being 4~8, thickness of side and end rib walls of 5~7 mm, and height of side and end ribs of 55~75 mm. Hence, the constraint conditions were determined as follows:
The PSO-BP neural network model was used as the fitness function of the PSO algorithm, and the minimum value of the function was the optimization objective for the thickness of panels, shape of longitudinal rib sections, thickness of transverse rib walls, number of transverse ribs, thickness of side and end rib walls, and height of side and end ribs.
The parameters of the PSO algorithm were set as follows: inertia weight of ω = 0.8, number of population particles of n = 200, c1 = c2 = 1.5, and the number of iterations of the algorithm of 100.
The PSO algorithm program was written and run using MATLAB software, with the results showing improved global convergence and convergence speed, and the global optimum sought by the particle gradually converged to the theoretical optimum as the number of iterations increased [46]. After 100 iterations of searching in optimization, the optimal individual fitness value of the PSO algorithm changed, as shown in Figure 10.
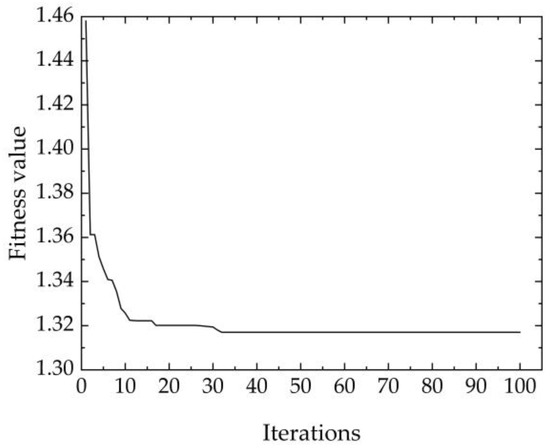
Figure 10.
The change in optimal individual fitness value of the PSO algorithm.
From Figure 10, it can be found that the objective function reached the minimum value of 1.317 mm in about 30 iterations. The corresponding geometric parameters are 5.5 mm panel thickness, trapezoid-shaped longitudinal rib sections, 3.5 mm transverse rib wall thickness, 8 transverse ribs, 7 mm side and end rib wall thickness, and 75 mm height of side and end ribs. The optimized geometric parameters were input into ABAQUS for static analysis, and the comparative analysis results are shown in Figure 11.
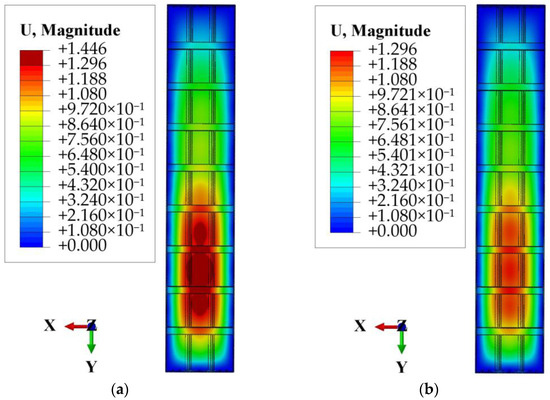
Figure 11.
Orthogonal test optimization and PSO optimization panel maximum deflection comparison chart (in mm): (a) orthogonal test optimization scheme; (b) PSO optimization scheme.
As can be seen in Figure 11, the calculated maximum panel deflection of the AAF is 1.296 mm, with an error of only 1.62%, which is small compared with the minimum value obtained via PSO algorithm optimization. The maximum deflection of the panel obtained via PSO algorithm optimization is reduced by 10.37% compared with that obtained via orthogonal test optimization.
6. Conclusions
In view of the relatively large deformation of the AAF panel under lateral pressure, the hypothesis that the geometrical parameters of the formwork affect the maximum deflection of the panel is proposed. The degree of influence of different geometric parameters of the AAF on the maximum deflection value of the panel is verified via finite element simulation. The orthogonal test was used to obtain design solutions for the geometric parameters of the AAF. Using the FEA data as samples, a PSO-BP neural network prediction model was established, and the optimal combination of geometric parameters for the AAF was obtained via an optimization search for PSO-BP neural network prediction models using the PSO algorithm. The following conclusions were obtained.
- The influence law of each factor on the maximum deflection value of AAF panel is considered separately; the number of transverse ribs has the greatest influence on the maximum deflection value of AAF panel, followed by the longitudinal rib section shape and the thickness of the panel, then the transverse rib wall thickness, and the side and end rib wall thickness, while the side and end rib height have the least influence.
- The maximum deflection value of the AAF panel was taken as the performance index for the orthogonal test analysis, and the influencing factors were the number of transverse ribs, shape of the longitudinal rib section, thickness of the panel, thickness of the transverse rib wall, thickness of the side and end rib wall, and height of the side and end ribs in decreasing order of influence. The optimal scheme includes a 5.5 mm panel thickness, trapezoid-shaped longitudinal rib sections, 3 mm transverse rib wall thickness, 8 transverse ribs, 6.5 mm side and end rib wall thickness, and 60 mm side and end rib height. In this scheme, the maximum deflection value of the panel under lateral pressure is only 1.446 mm, which satisfies the requirements for plaster-free walls in the relevant specification [27,28,38].
- The PSO algorithm was applied to determine the optimal PSO-BP neural network prediction model, and the minimum value of 1.317 mm was obtained. The corresponding optimal geometric parameters are a 5.5 mm panel thickness, trapezoid-shaped longitudinal rib sections, 3.5 mm transverse rib wall thickness, 8 transverse ribs, 7 mm side and end rib wall thickness, and 75 mm side and end rib height. After finite element simulation, the maximum deflection value of the panel was 1.296 mm, with an error of only 1.62%. Compared with the orthogonal test optimization, the maximum panel deflection was reduced by 10.37%, the PSO-BP neural network model for PSO optimization exhibited more effective prediction, and the results can serve as a reference for studying the optimization of AAF geometric parameters.
Author Contributions
Conceptualization and formal analysis, Y.C.; writing, finite element analysis and translation, Z.Q.; investigation, C.K.; programming, Y.W.; data curation, Q.D.; experiment, C.S. All authors have read and agreed to the published version of the manuscript.
Funding
This research was funded by Natural Science Foundation of Xinjiang Uygur Autonomous Region, grant number 2022D01D033, and The APC was funded by Natural Science Foundation of Xinjiang Uygur Autonomous Region.
Data Availability Statement
All data are available from the first author upon reasonable request.
Conflicts of Interest
The authors declare no conflict of interest.
References
- Zhu, Z.-F.; Wang, W.-W.; Hui, Y.-X.; Hu, S.-W. Mechanical Behavior of Concrete Columns Confined with CFRP Grid-Reinforced Engineered Cementitious Composites. J. Compos. Constr. 2022, 26, 04021060. [Google Scholar] [CrossRef]
- Bulgakov, B.I.; Nguyen, V.Q.D.; Aleksandrova, A.V.; Larsen, O.A.; Galtseva, N.A. High-performance concrete produced with locally available materials. Mag. Civ. Eng. 2023, 117, 11702. [Google Scholar] [CrossRef]
- Rashid, K.; Farooq, S.; Mahmood, A.; Iftikhar, S.; Ahmad, A. Moving towards resource conservation by automated prioritization of concrete mix design. Constr. Build. Mater. 2020, 236, 117586. [Google Scholar] [CrossRef]
- Wan, Y.; Wang, R.; Liu, Y.; Zhou, S.; Cai, H.; Gu, M.; Li, D.; Li, W. Non-fitting theoretical models for the fracture properties of concretes subjected to high temperature. J. Build. Eng. 2023, 68, 106086. [Google Scholar] [CrossRef]
- Zhou, J. Static Experiment, Numerical Simulation and Optimization Design of Aluminum Alloy Templates; Changan University: Xi’an, China, 2020. [Google Scholar] [CrossRef]
- Jiang, Y. Research on New Type of Formwork Technology in High Rise Building; Shenyang Jianzhu University: Shenyang, China, 2018; Available online: https://kns.cnki.net/kcms2/article/abstract?v=3uoqIhG8C475KOm_zrgu4lQARvep2SAkWfZcByc-RON98J6vxPv10U78oDClvLuwLw1oIx6agksiwyw5Mhk0CrIAroWEqGdP&uniplatform=NZKPT (accessed on 8 June 2022).
- Zuo, L.-L. Studies on Evaluation of Formwork Construction Based on Green Concept; Xi’an University of Architecture and Technology: Xi’an, China, 2019. [Google Scholar] [CrossRef]
- Moshan, S.-G.; Aravindan, X. A comparative study on newly emerging type of formwork systems with conventional type of form work systems. Mater. Today Proc. 2020, 38, 736–740. [Google Scholar] [CrossRef]
- Hasselhoff, J.; Cheng, L.; Waimer, F.; Gabler, M.; Knippers, J. Design, manufacturing and testing of shear-cone connectors between CFRP stay-in-place formwork and concrete. Compos. Struct. 2015, 129, 47–54. [Google Scholar] [CrossRef]
- Proske, T.; Khayat, K.H.; Omran, A.; Leitzbach, O. Form pressure generated by fresh concrete: A review about practice in formwork design. Mater. Struct. 2014, 47, 1099–1113. [Google Scholar] [CrossRef]
- Kim, T.; Lim, H.; Lee, U.-K.; Cha, M.; Cho, H.; Kang, K.-I. Advanced formwork method integrated with a layout planning model for tall building construction. Can. J. Civ. Eng. 2012, 11, 1173–1183. [Google Scholar] [CrossRef]
- Lim, H.; Kim, T.; Cho, H.; Kang, K.I. Simulation-based planning model for table formwork operation in tall building construction. J. Asian Archit. Build. Eng. 2017, 1, 115–122. [Google Scholar] [CrossRef]
- Dessi-Olive, J. Strategies for Growing Large-Scale Mycelium Structures. Biomimetics 2022, 7, 129. [Google Scholar] [CrossRef]
- Mansuri, D.; Chakraborty, D.; Elzarka, H.; Deshpande, A.; Gronseth, T. Building Information Modeling enabled Cascading Formwork Management Tool. Automat. Constr. 2017, 83, 259–272. [Google Scholar] [CrossRef]
- Kim, G.; An, S.; Cho, H.; Seo, D.; Kang, K. Improved productivity using a modified table formwork system for high-rise building in Korea. Build. Environ. 2005, 40, 1472–1478. [Google Scholar] [CrossRef]
- Libessart, L.; Djelal, C.; de Caro, P. Influence of the type of release oil on steel formwork corrosion and facing aesthetics. Constr. Build. Mater. 2014, 68, 391–401. [Google Scholar] [CrossRef]
- Li, W.; Lin, X.; Bao, D.W.; Xie, Y.M. A review of formwork systems for modern concrete construction. Structures 2022, 38, 52–63. [Google Scholar] [CrossRef]
- Zhao, R.-Q.; Zhang, H.-Q.; Zhou, Y.; Xing, H.-Y.; Jin, J.-Q. Non-plastering construction technology of aluminum alloy formwork with primary structure. Build. Struct. 2021, 51, 1835–1838. Available online: https://kns.cnki.net/kcms2/article/abstract?v=HbIh-_fAmwTJCUM-JxotrWy3JdZLyJ7uqiJynD7juYMR5KANJSyP30_n-T0HTSRzWkwPEMoGr2wq0dWPZKGuaVw6U-MMaKejL3iPYgYwsOqrdog7FLyL023UvXBBHSKC&uniplatform=NZKPT (accessed on 23 October 2022).
- Young’ s Modulus of Elasticity for Metals and Alloys. Available online: https://www.engineeringtoolbox.com/young-modulus-d_773.html (accessed on 31 July 2022).
- Gallego, E.; Fuentes, J.M.; Ramírez, A.; Ayuga, F. Computer simulation of complex-shaped formworks using three-dimensional numerical models. Automat. Constr. 2011, 20, 830–836. [Google Scholar] [CrossRef]
- Hung, F.S. Polymer Coating Effects: Study of Material Properties and Architectural Application Characteristics of Aluminum Template. Coatings 2021, 11, 240. [Google Scholar] [CrossRef]
- Yang, Y.; Ding, X.; Liu, Y.; Deng, L.; Lv, F.; Zhao, S. Lateral Pressure Test of Vertical Joint Concrete and Formwork Optimization Design for Monolithic Precast Concrete Structure. Buildings 2022, 12, 261. [Google Scholar] [CrossRef]
- Shi, K.; Xu, J.; Jiang, Z.; Lv, J.; Lu, Y. Mechanical properties of new composite wood-plastic formworks with aluminum alloy frame. Adv. Civ. Eng. 2020, 2020, 8831999. [Google Scholar] [CrossRef]
- Pan, Q.-F.; Cui, H.-H.; Cai, X.-F.; Zhuang, J.-P.; Yang, Z.-H. Exprimental research and parameter analysis of flexural behavior of aluminum alloy formwork. Ind. Constr. 2017, 47, 142–147. [Google Scholar] [CrossRef]
- Wei, J.; Yang, P.-R.; Wang, C.; Yang, T.-J.; Huang, Z.-H. Analysis on the force of aluminum alloy template based on finite element method. Build. Struct. 2021, 51, 1192–1196. [Google Scholar]
- JG/T 522—2017; Aluminum Alloy Formwork. Standards Press of China: Beijing, China, 2017.
- JGJ 386—2016; Technical Specification for Combined Aluminum Alloy Formwork Engineering. China Architecture & Building Press: Beijing, China, 2016.
- XJJ 123—2020; Application Technical Standard of Combined Aluminum alloy Formwork. Xinjiang Uygur Autonomous Region Construction Standard Service Center: Urumqi, China, 2020.
- JGJ 162—2008; Technical Code for Safety of Forms in Construction. China Architecture & Building Press: Beijing, China, 2008.
- GB 50666—2011; Code for Construction of Concrete Structures. China Architecture & Building Press: Beijing, China, 2011.
- Zhang, P.; Zhang, X.; Zhang, Y.; Zheng, Y.; Wang, T. Gray correlation analysis of factors influencing compressive strength and durability of nano-SiO2 and PVA fiber reinforced geopolymer mortar. Nanotechnol. Rev. 2022, 11, 3195. [Google Scholar] [CrossRef]
- Rajput, A.S.; Das, S. A machine learning approach to predict the wear behaviour of steels. Tribol. Int. 2023, 185, 108500. [Google Scholar] [CrossRef]
- Kim, J.H.; Seong, N.C.; Choi, W. Forecasting the energy consumption of an actual air handling unit and absorption chiller using ANN models. Energies 2020, 13, 4361. [Google Scholar] [CrossRef]
- Ke, B.; Pan, R.; Zhang, J.; Wang, W.; Hu, Y.; Lei, G.; Chi, X.; Ren, G.; You, Y. Parameter optimization and fragmentation prediction of fan-shaped deep hole blasting in Sanxin gold and copper mine. Minerals 2022, 7, 788. [Google Scholar] [CrossRef]
- GB 50429—2007; Code for Design of Aluminum Structures. China Planning Press: Beijing, China, 2008.
- Marinkovic, D.; Zehn, M. Survey of Finite Element Method-Based Real-Time Simulations. Appl. Sci. 2019, 9, 2275. [Google Scholar] [CrossRef]
- Kou, Z.-H. Static Experiment, Numerical Simulation and Optimization Design of Aluminum Alloy Template; Shandong Jianzhu University: Jinan, China, 2019; Available online: https://kns.cnki.net/kcms2/article/abstract?v=3uoqIhG8C475KOm_zrgu4lQARvep2SAkOsSuGHvNoCRcTRpJSuXuqSMLByCsKnpYvREWsKFU4bsMJzlio2O366mLt1OkpXem&uniplatform=NZKPT (accessed on 23 November 2022).
- GB 50204—2015; Code for Acceptance of Constructional Quality of Concrete Structures. China Architecture & Building Press: Beijing, China, 2015.
- Wei, W.; Shang, Y.; Peng, Y.; Cong, R. Prediction Model of Sound Signal in High-Speed Milling of Wood–Plastic Composites. Materials 2022, 11, 3838. [Google Scholar] [CrossRef]
- Wei, L.; Zhang, Y.; Ji, L.; Ye, L.; Zhu, X.; Fu, J. Pressure Drop Prediction of Crude Oil Pipeline Based on PSO-BP Neural Network. Energies 2022, 16, 5880. [Google Scholar] [CrossRef]
- Liu, X.; Liu, Z.; Liang, Z.; Zhu, S.P.; Correia, J.A.; De Jesus, A.M. PSO-BP neural network-based strain prediction of wind turbine blades. Materials 2019, 12, 1889. [Google Scholar] [CrossRef]
- Band, S.S.; Janizadeh, S.; Chandra Pal, S.; Saha, A.; Chakrabortty, R.; Shokri, M.; Mosavi, A. Novel ensemble approach of deep learning neural network (DLNN) model and particle swarm optimization (PSO) algorithm for prediction of gully erosion susceptibility. Sensors 2020, 19, 5609. [Google Scholar] [CrossRef]
- Ramírez-Ochoa, D.D.; Pérez-Domínguez, L.A.; Martínez-Gómez, E.A.; Luviano-Cruz, D. PSO, a swarm intelligence-based evolutionary algorithm as a decision-making strategy: A review. Symmetry 2022, 3, 455. [Google Scholar] [CrossRef]
- Grisales-Noreña, L.F.; Gonzalez Montoya, D.; Ramos-Paja, C.A. Optimal sizing and location of distributed generators based on PBIL and PSO techniques. Energies 2018, 4, 1018. [Google Scholar] [CrossRef]
- Wang, P.; Huang, Z.; Zhang, M.; Zhao, X. Mechanical Property Prediction of Strip Model Based on PSO-BP Neural Network. J. Iron Steel Res. Int. 2008, 15, 87–91. [Google Scholar] [CrossRef]
- Chen, W.C.; Nguyen, M.H.; Chiu, W.H.; Chen, T.N.; Tai, P.H. Optimization of the plastic injection molding process using the Taguchi method, RSM, and hybrid GA-PSO. Int. J. Adv. Manuf. Technol. 2016, 83, 1873–1886. [Google Scholar] [CrossRef]
Disclaimer/Publisher’s Note: The statements, opinions and data contained in all publications are solely those of the individual author(s) and contributor(s) and not of MDPI and/or the editor(s). MDPI and/or the editor(s) disclaim responsibility for any injury to people or property resulting from any ideas, methods, instructions or products referred to in the content. |
© 2023 by the authors. Licensee MDPI, Basel, Switzerland. This article is an open access article distributed under the terms and conditions of the Creative Commons Attribution (CC BY) license (https://creativecommons.org/licenses/by/4.0/).