Article

Psychological State and Subjective Environmental Perception of College Students Residing in Dormitories during Quarantine: A Case Study

School of Mechanical Engineering, Tongji University, Shanghai 201804, China
*
Authors to whom correspondence should be addressed.
Buildings 2023, 13(4), 1065; https://doi.org/10.3390/buildings13041065
Submission received: 17 March 2023 / Revised: 13 April 2023 / Accepted: 14 April 2023 / Published: 18 April 2023
(This article belongs to the Section Building Energy, Physics, Environment, and Systems)

Abstract

:
Quarantine is one of the effective approaches to control the spread of COVID-19. However, prolonged isolation may harm the health of residents, especially students, who are quarantined in dormitories. This study surveyed students’ behaviors, living environment, and psychological state through an online questionnaire. The results showed that during the isolation period, the participants’ discomfort mainly came from high temperatures, high humidity, loud sounds, and dark lighting. Moreover, about half of the students experienced severe anxiety or depression, with poor sleep and an unclear mind being the most common problems. Additionally, this study focused on exploring the correlations between environmental perceptions and the psychological state of isolated students, that were identified to be significant. Furthermore, as isolation time was prolonged, the psychological state of isolated students worsened, and the most significant factor changed from thermal sensations to acoustic sensations. Interestingly, the psychological state of males was worse than females, and they were more easily affected by their thermal and acoustic environments. Therefore, keeping the environment comfortable has a positive influence on maintaining the good psychological condition of people in isolation. This study can provide suggestions for the improvement of indoor environments and for the mental health of people in isolation and in other similar situations.

1. Introduction

1.1. Background

The impact of the COVID-19 outbreak was felt worldwide [1]. Many countries implemented various corresponding pandemic prevention measures [2,3,4]. To control the spread of the virus and to ensure citizens’ safety, quarantine was often adopted. For college students, the place of isolation was usually in the dormitory. The lack of space, large occupant density, incomplete supporting facilities, and inadequate lighting and ventilation conditions in dormitories all affected the satisfaction and health of residents during quarantine [5,6].

1.2. Related Work

Various indoor environmental factors, including temperature, humidity, sound, and light have a complex influence on the comfort and health of residents [7,8,9], and many previous studies [10,11,12] on indoor environmental quality have focused on these factors. The common effect of various environments takes many forms, such as independent, overlay, cooperative, and so on [13]. According to the research, when indoors, people will automatically balance their feelings for different environments, and make an overall assessment [10,14]; however, these environmental factors affect people differently [15,16]. The indoor environment can also affect the productivity and psychological state of the occupants [17,18,19]. On the one hand, there is a certain relationship between the built environment and the mental health of residents indoors [20,21]. On the other hand, the stress during quarantine may lead residents to have higher requirements for their indoor environment [22], affecting their feelings about and satisfaction with their environment.
Furthermore, under the special circumstances of COVID-19, the psychological state of those quarantined may have also changed. Anxiety, tension, depression, and other negative emotions were prevalent during the pandemic [23,24,25,26]. A large proportion of people were anxious and depressed because of the uncertainty about the pandemic and the concern that they and their families might be infected [27,28,29,30]. Static lockdown measures can inhibit the spread of the virus [31], but quarantine may harm residents’ mental health. Past studies on pandemics have shown that negative emotions, such as anxiety, anger, fear, and sadness can occur in many people during quarantine [32,33], and may also cause sleep problems [34]. Moreover, the effects might even persist long after the end of isolation [35,36,37]. Similar findings have been found for people who quarantined during the COVID-19 pandemic, suggesting that prolonged isolation might significantly increase anxiety, fear, and anger in individuals [27,38,39]. At the same time, isolated persons may also have felt the pressure, grievance, and shame of being alienated and shunned by others [40].
The impact on the psychological state of people living in isolation varies in many aspects. As for isolation methods, studies have shown that residents who were isolated in other areas (such as in hospitals or hotels) experienced worse mental health than those who were isolated in their own houses. The psychological state of isolation varied among different groups too. Females, children, and elders were more likely to experience adverse emotions during isolation [41,42,43], while middle-aged people with a higher education were less likely to feel anxiety and depression [44]. Furthermore, individuals living alone, who were extroverted and sociable, and who had preexisting symptoms of anxiety or depression, as well as those with low household incomes were more likely to develop psychological problems during isolation [45,46]. As a special group, college students, who are in the transition period from campus to society, are more generally prone to psychological problems [47]. Studies have shown that the COVID-19 pandemic had a significant negative impact on students’ physical and mental states [48]. When college students encounter public health emergencies, society, families, and colleges need to pay close attention to their mental health state, as well as provide timely psychological counseling to cope with the problems [49].
Current research has shown that various indoor environmental factors can synergistically affect the comfort of the occupants in the building [15], as well as their working performance [17,18] and mental health [50,51]. Meanwhile, it has been confirmed that quarantined people are prone to anxiety and depression during isolation. The reason for these negative emotions is related to the manner of isolation, age, gender, and other factors. College students isolated in dormitories have special characteristics. Several people need to live together in a small enclosed room, learn, play sports, and engage in other activities, so their environmental feelings and mental state are different from those of other people. However, existing studies have not paid enough attention to such a special situation as there are few studies investigating the correlation between environmental perceptions and the psychological state of isolated students.

1.3. Objectives

In this study, a survey was conducted to collect data on isolated college students’ physical feelings and psychological state to: (1) Observe the behavior and habits of isolated college students when adjusting to their environment; (2) Collect the perceptions held by the isolated college students about their environment in different weather conditions and over different periods; (3) Collect information about the mental health state of college students during the isolation period; (4) Explore the correlation between the environmental adjusting behavior, environmental sensations, and mental health state; and (5) Analyze the differences observed in the experimental results, according to gender and isolation time.

2. Materials and Methods

In April 2022, COVID-19 broke out in Shanghai. To prevent the spread of the virus, Shanghai adopted static lockdown measures according to the COVID-19 Prevention and Control Protocol. Therefore, most college students were isolated in their dormitory, and were only allowed to leave the dormitory for nucleic acid testing. To explore the living environment conditions and mental health state of college students during the isolation period, an online questionnaire was conducted.

2.1. Participants

The survey period was from 9 April to 29 April 2022, which covered the period between the 4th and 24th days of the three-month-long quarantine. Thirty healthy college students isolated in their dormitory participated in this study, including 17 males and 13 females, with an average age of 21.9 ± 0.8. During the isolation period, the subjects remained in their dormitories throughout the day. Furthermore, six months after the end of isolation, the participants completed the same survey twice, seven days apart, and these served as controls. Twenty-eight of the 30 isolated subjects participated in this follow-up study.

2.2. Survey Procedure

Each subject was asked to fill out the questionnaire at six different periods during the day (morning, forenoon, noon, afternoon, evening, and night). The weather conditions and the corresponding meteorological parameters are shown in Table 1. The participants were asked to provide information on the weather conditions for each time period, for a total of 24 questionnaires.
The rules for answering the questionnaire were explained in detail to all participants. According to the weather forecast, each subject in the group was reminded one day in advance. Under appropriate weather conditions and periods, the online questionnaire was forwarded to the subjects. One of the participants dropped out in the middle of the survey without completing all of the conditions. Upon excluding the questionnaires that were not completed within the time frame, the results were counted and analyzed. In the end, 697 valid responses were collected. Additionally, as a control group, a total of 56 responses were collected six months after the end of isolation.

2.3. Questionnaire

2.3.1. Basic Information

The questionnaire first collected the basic information on the participants, including their gender, age, and orientation of the dormitory, the number of people living in the dormitory, as well as the weather conditions and time when filling out the questionnaire.

2.3.2. Environmental Adjusting Behavior

To explore the behaviors and habits of college students while adjusting to their indoor environment in their dormitory during the isolation period, the participants were asked whether the balcony door, windows, and curtains were open, whether artificial light was used, as well as information on the color and brightness of the light source.

2.3.3. Indoor Environment Perception

This section consists of three parts. First, the subjects were asked how they felt about their current indoor environment (including temperature, humidity, sound, and lighting) on a five-point scale ranging from −2 to 2, as shown in Table 2. The second part aimed to know whether the subjects were satisfied with their indoor environment, where 0 means unsatisfied and 1 means satisfied, with regards to the four environmental factors. Finally, the subjects were asked about their expectations on changes in the four factors, as shown in Table 2.

2.3.4. Psychological State

To explore the psychological state of students during the isolation period, five questions were selected from each of the self-rating anxiety scale (SAS) and self-rating depression scale (SDS), two of which were repeated, so there were eight questions in total. The code word, content, classification, and scale of the questionnaire are shown in Table 3. Once the choices were made, the single mental state scores were calculated according to the rules. Furthermore, the total scores of the SAS and SDS were also calculated to evaluate the overall anxiety and depression levels of the participants. The higher the score, the worse the mental health in this aspect. Sleeping conditions, working efficiency, and other aspects of the questionnaire could also be listed separately for analysis.

2.4. Data Analysis

Firstly, 697 valid questionnaires, each containing 35 variables, were obtained, and questionnaires that were not answered within the specified time were excluded. Secondly, the differences in the subjective perceptions and psychological states of the participants in different groups and at different times were analyzed by classification statistics. A Pearson correlation test was then used for the correlation significance analysis. The analytical tools used in this study include Excel, SPSS, etc. The questionnaires of the control group were analyzed in the same manner.

3. Results

Unless otherwise specified, the analysis in this section is based on the survey results during the isolation period.

3.1. Sample Information

The basic information about the subjects is listed in Table 4. First, there is little difference in the number of males and females. Second, about twice as many participants lived in dormitories with windows facing south than in the other direction. In terms of age, the respondents were around 22 years old. Finally, fewer participants lived alone in the dormitory during the study period, and most of them had more than two roommates.

3.2. Participant Environment Adjusting Behavior

The environmental adjusting behaviors of the participants in different conditions were statistically analyzed. The students’ environmental adjusting behavior was selective. As shown in Figure 1a, the quarantined persons were not used to opening the balcony door during the pandemic. Only 17.9% of the respondents opened their balcony door when filling out the questionnaire, with more likely to do so between the afternoon and evening. At the same time, most people opened balcony doors on cloudy and overcast days, while on rainy days, the vast majority (89.1%) of respondents did not open the balcony door. In contrast, people in isolation were more inclined to open windows for ventilation, as shown in Figure 1b. On sunny days, cloudy days, and overcast days, most people chose to open windows starting from noon, and the overall window opening proportion could reach about 75%. However, on rainy days, presumably to keep water out of the house, the number dropped to about 55%.
The habit of using curtains (Figure 1c) shows the need for light. It turns out that more than 83% of the isolated people opened their curtains, except in the early morning, when most people were still asleep, and on rainy days when natural lighting was poor.
The survey also conducted statistics on the participants’ use of lights, as shown in Figure 1d,e. During the day, the frequency of turning on dormitory lights was generally on the increase, which was mainly to supplement natural light. The frequency in the use of lights in dormitory rooms facing south (50.2%) was significantly greater than those facing north (30.5%). On rainy days, dormitory lights were turned on extraordinarily frequently, perhaps due to the lack of natural light and the closed curtains. In addition, 80% of participants also chose to turn on a desk lamp to supplement the lighting in their area during the work phase.

3.3. Environment Perception of the Participants

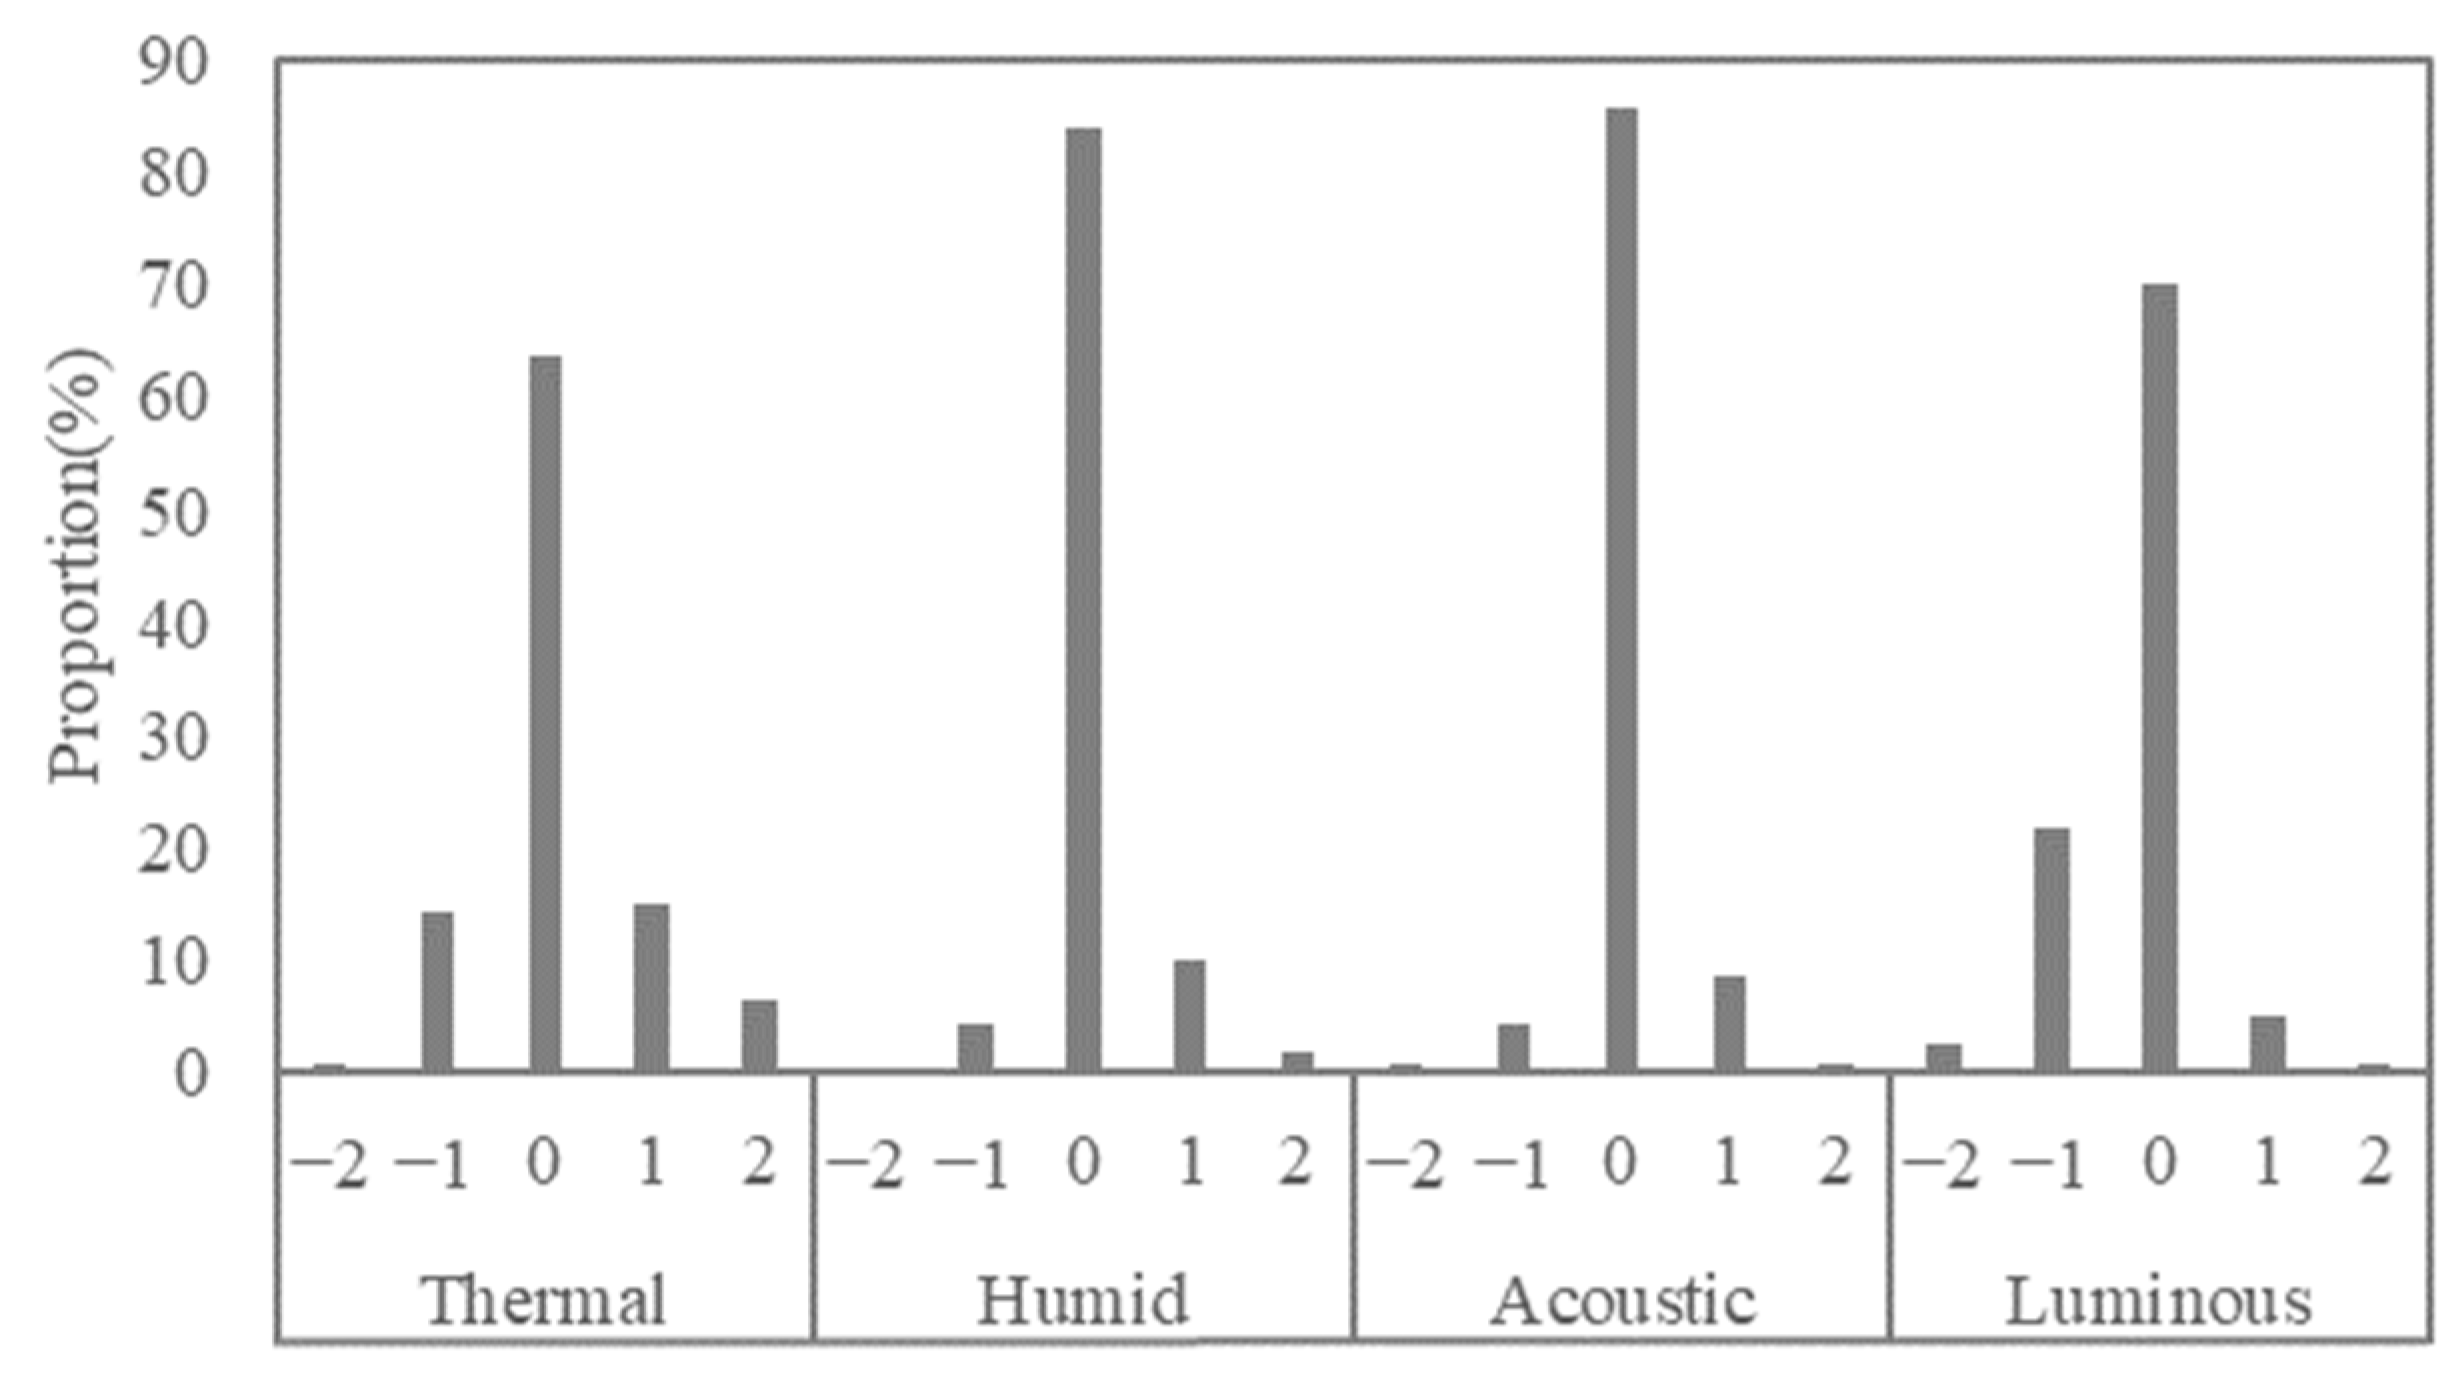
The results pertaining to the sensations felt for each environmental factor are shown in Figure 2. Overall, the participants felt more unneutral with the temperature and lighting factors. Only 63.6% of the participants felt neutral with regard to the temperature, and 70.2% to lighting, while the neutral proportion concerning humidity and sound reached as high as 84.1% and 85.7%. In addition, with regards to the results concerning lighting, the proportion of people who felt that it was dark was 20% higher than those who felt that it was bright, which shows that during the isolation period, the lighting environment of the dormitory was still a bit dark, even though the isolators had taken measures, such as opening curtains and turning on lights.
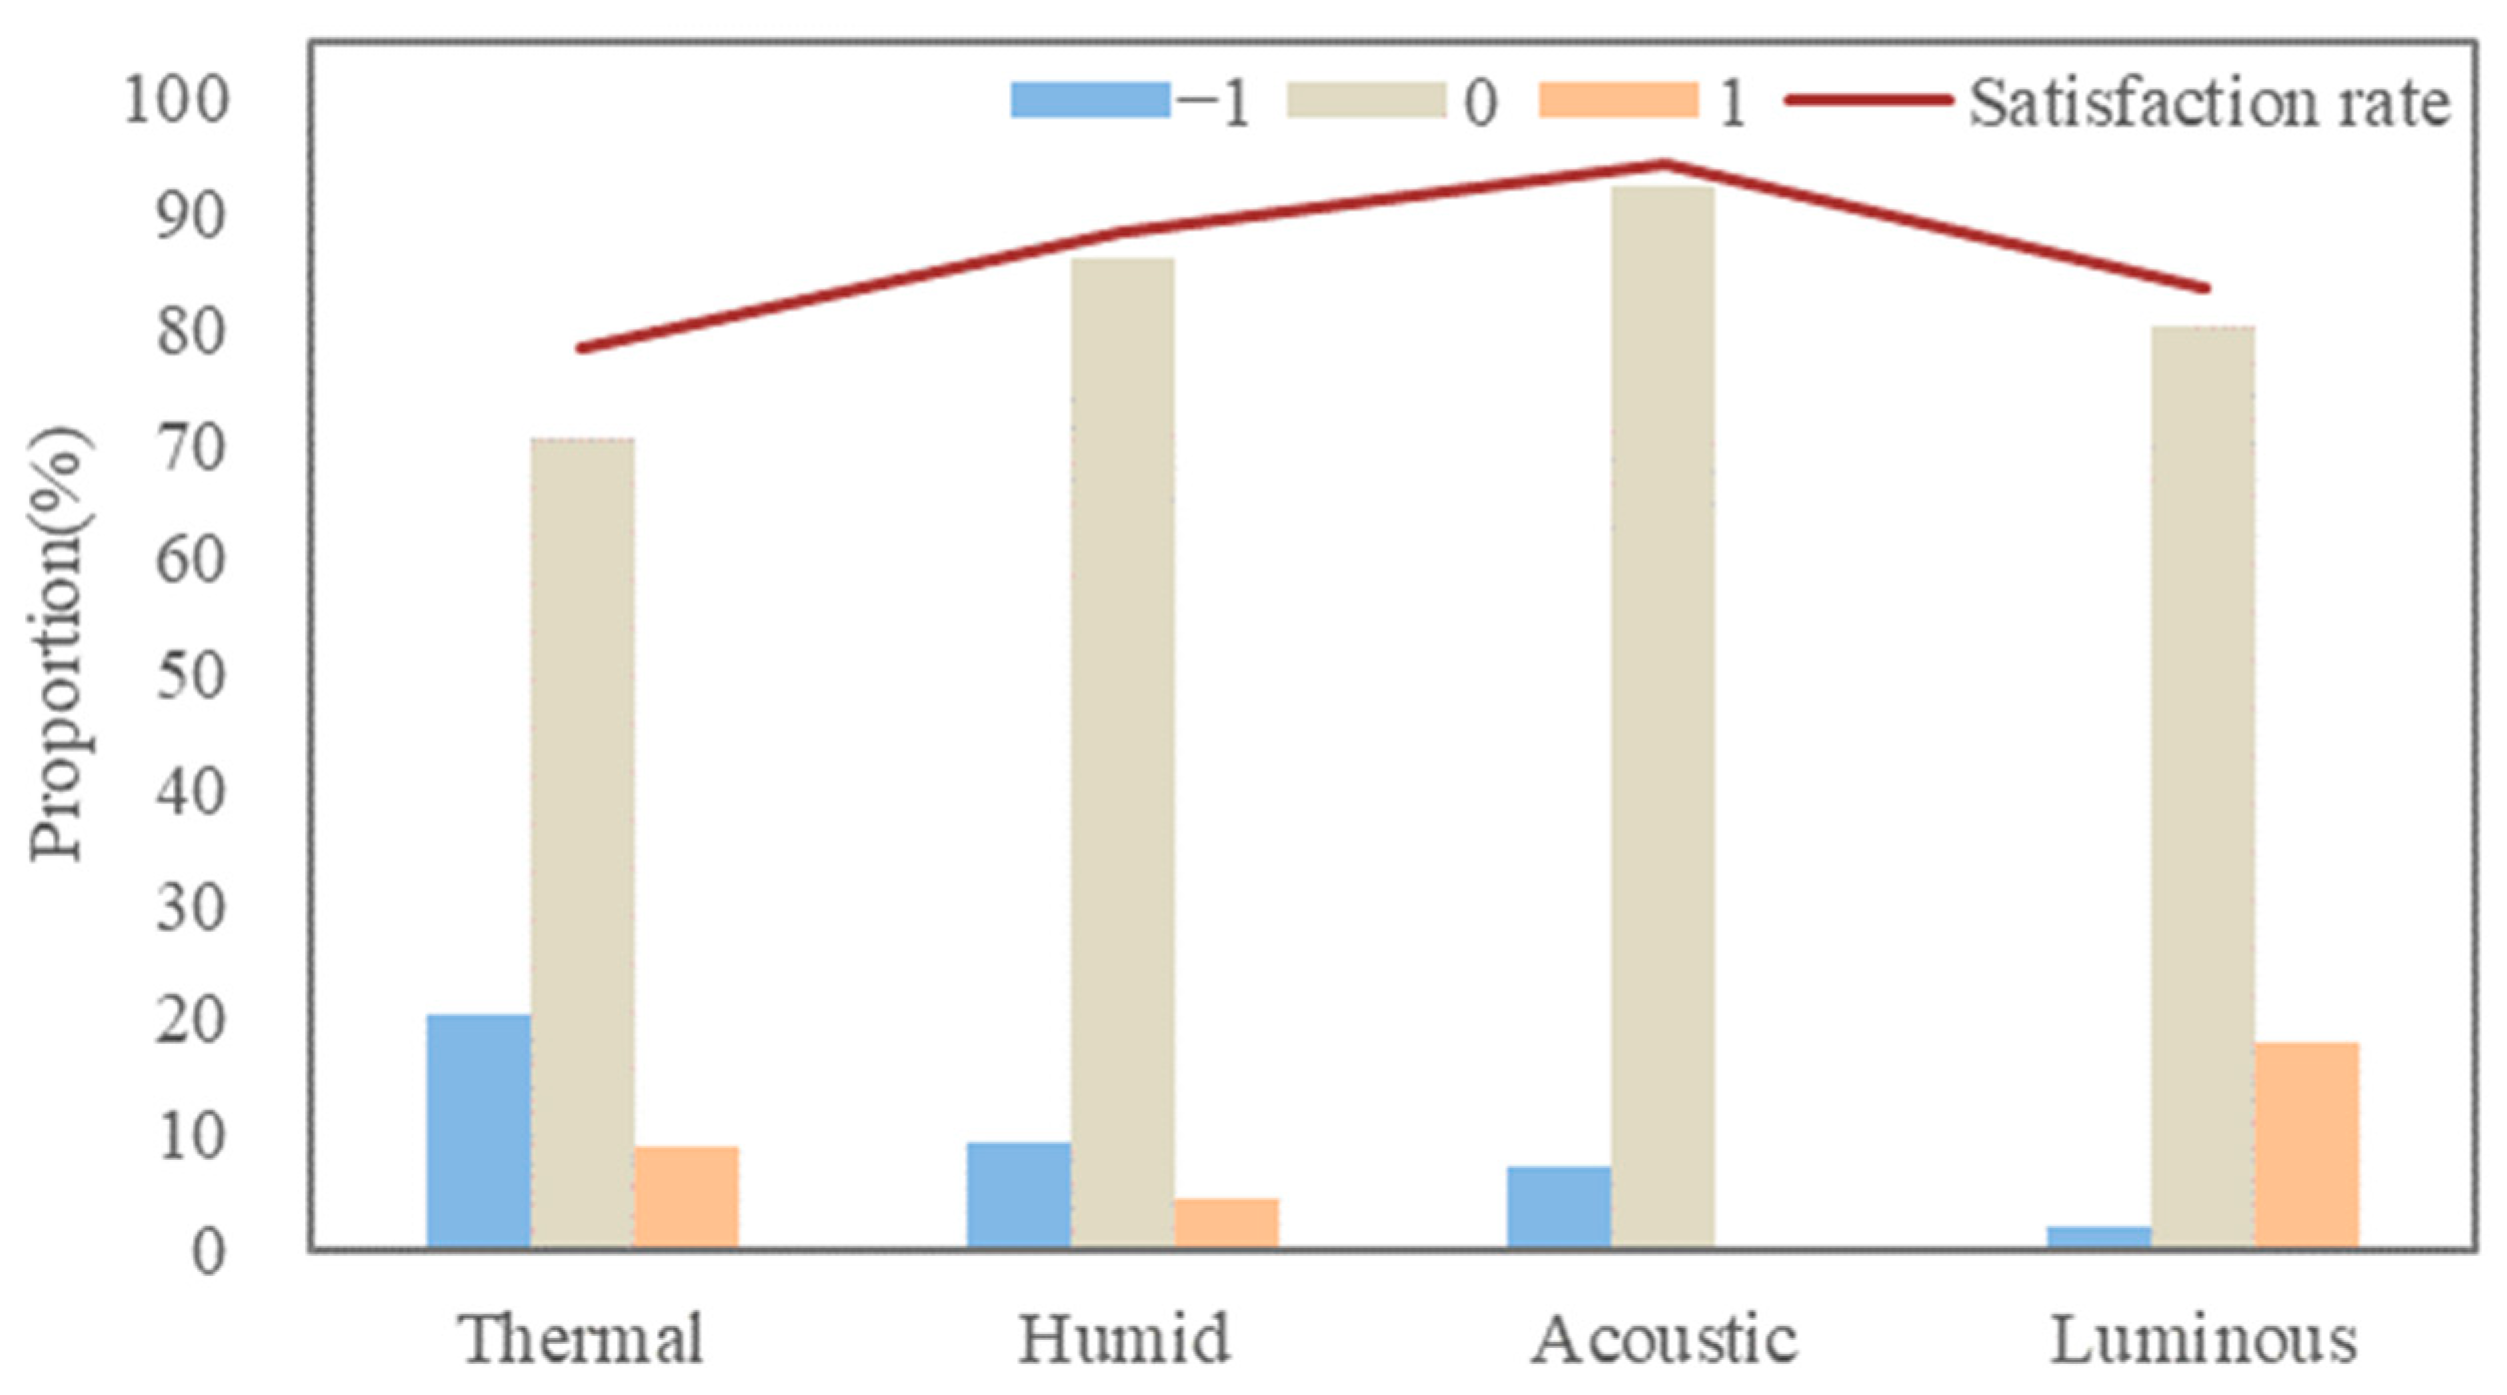
Figure 3 shows the satisfaction rate and expectation vote distribution for each environmental factor. Similar to the results of the above environmental sensations, the surveyed isolated college students had a higher satisfaction rate with the humidity and sound factors, with the satisfaction rate for sound exceeding 90%. The proportion of quarantined people who expected their environment to “remain unchanged” was slightly lower than the environmental satisfaction rate. Corresponding to the lower satisfaction rate, the isolators had a stronger willingness to change the temperature and lighting factors. In general, during the survey in April, more participants wanted the room to be cooler and brighter.

3.4. Psychological State

In order to determine the psychological state of the subjects when filling out the questionnaire, eight questions were selected by referring to the SAS and SDS. The higher the score according to the scoring method, the worse the mental health in this aspect.
The code words are used to represent different aspects of the psychological state, as shown in Table 3. The psychological state score distribution is shown in Figure 4a. By comparison, the isolated participants had more psychological problems than when they were free to move. The ratio of “Breath” and “Heart” with scores of 1 and 2 exceeded 95%, indicating that during the isolation period, the breathing and heart rate of the students hardly changed, which also shows that the physical health of the isolated students was relatively normal to a certain extent. In other aspects, the ratio of scores 1 and 2 for “Nervous”, “Glum”, and “Interest” also exceeded 80%, showing the small effect of isolation on these aspects. In contrast, people in isolation had higher levels of frailty and fatigue, from which only about half did not suffer at all, compared with about 20% who scored 3 or 4. It can be seen that although the workload decreased during the isolation period, the monotonous life could easily make people feel tired. The prevalence of mental health problems appeared in “Sleep” and “Breath”, while only about 20% of isolated college students did not suffer from poor sleep quality and unclear minds.
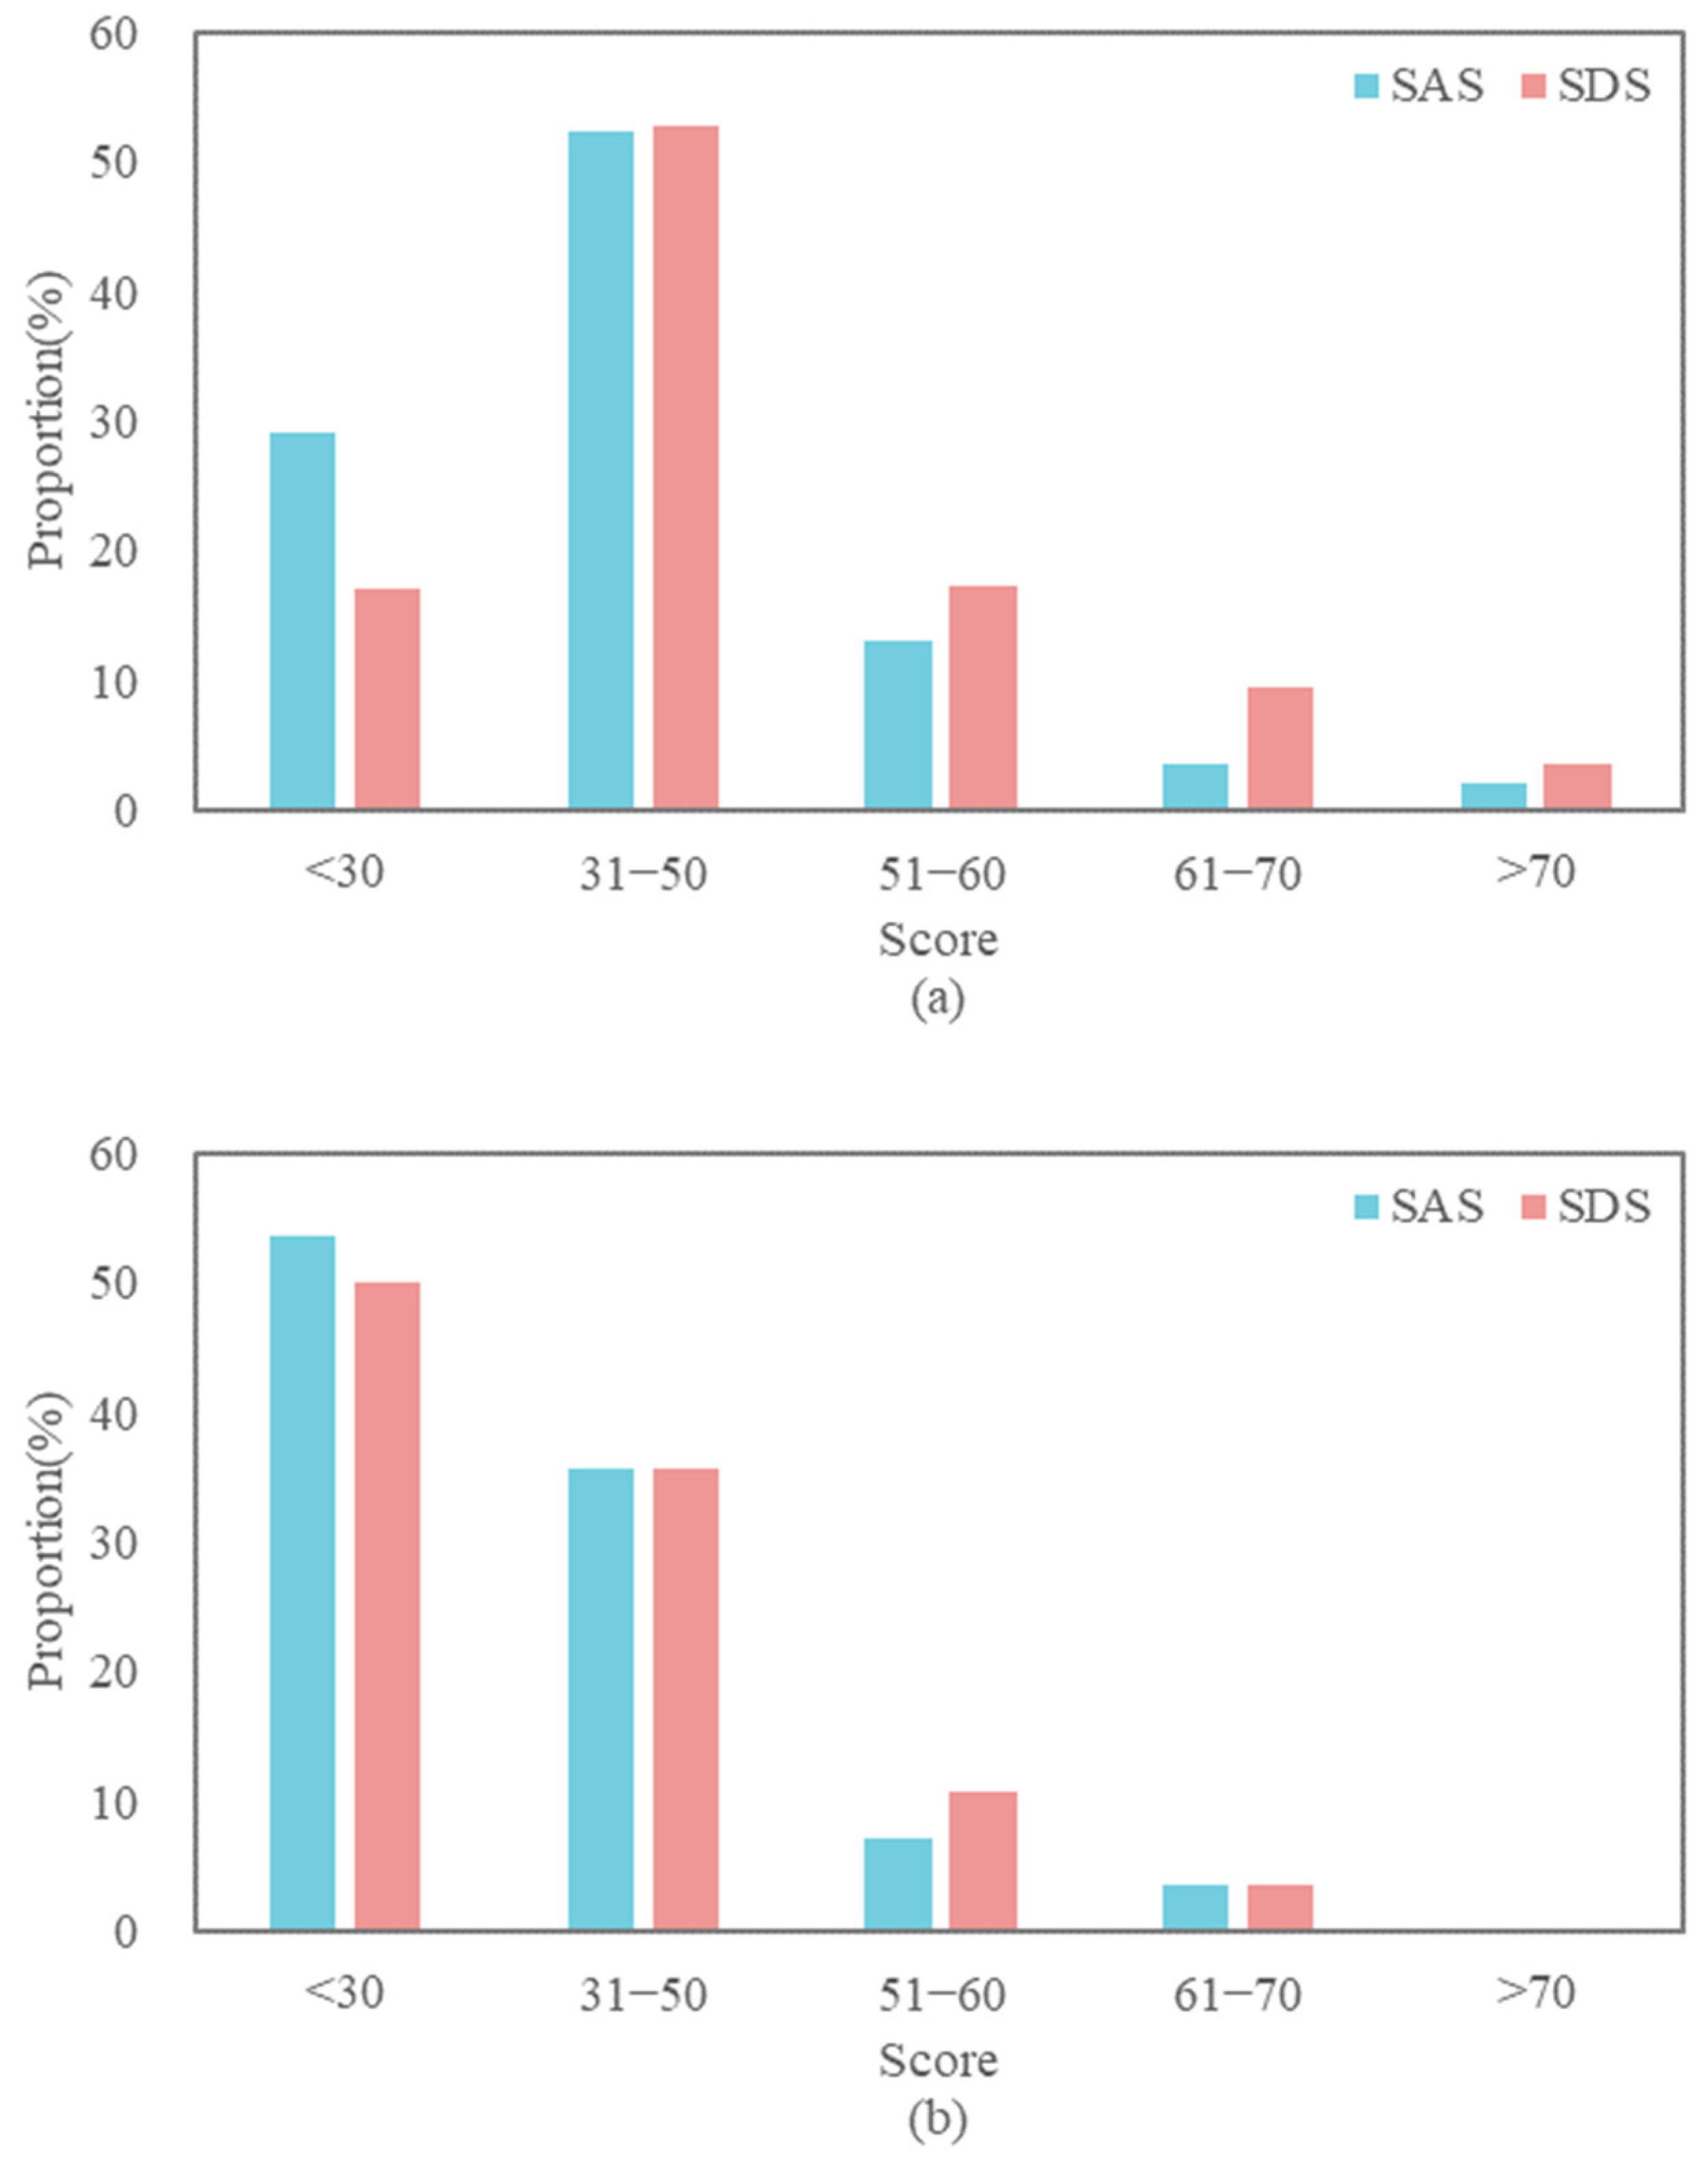
The total score distribution calculated according to the rules is shown in Figure 5. According to the scoring criteria, a score of less than 50 is considered a normal psychological state, 51–60 is considered as having mild symptoms, 61–70 is considered as having moderate symptoms, and more than 70 is considered as having severe symptoms. The results show that most of the isolated college students (SAS: 81.5%, SDS: 69.9%) were in a relatively normal state of anxiety and depression. However, the mental health problems of other students should not be ignored, with 5.5% of people in isolation affected by moderate and severe anxiety. Meanwhile, participants were more likely to suffer from depression, with moderate and severe depression rates reaching 12.9%. In contrast, more free-moving participants (SAS: 89.3%, SDS: 85.7%) were in a normal psychological state. Isolated people were more likely to suffer from anxiety and depression.

3.5. Correlation Analysis of the Environmental Regulation Behavior and Subjective Perceptions

To explore the impact of the environmental factors on the mental health state during isolation, Pearson correlation analyses were conducted between the environmental adjusting behavior (the positive direction was defined as from off to on), environmental sensation, and mental health state.
Figure 6 shows the result of the correlation analysis of the environmental adjusting behavior and subjective perceptions. In the figure, red represents a positive correlation, blue represents a negative correlation, and the depth of the color represents the magnitude of the correlation coefficient. Meanwhile, the greater the number of asterisks, the stronger the correlation significance. In addition, in the acronym, the first letter stands for the type of environment (T for temperature, H for humidity, A for sound, and L for lighting), the second letter stands for the subjective feeling (S for sensation, A for Satisfaction, P for expectation, and C for comfort), and the third letter V stands for the vote. In other figures of the same type in this article, each element has the same meaning.
There were some significant correlations between environment adjusting behavior and environmental sensation, satisfaction, and expectation. Opening the balcony door had a significant positive correlation with sound sensation, humidity satisfaction, and lighting expectation, as well as a significant negative correlation with lighting sensation, sound and lighting satisfaction, and sound expectation. Meanwhile, the opening and closing of windows had a significant positive correlation with humidity and lighting sensation, as well as a significant negative correlation with temperature and humidity satisfaction, and humidity expectation. Furthermore, there were significant positive correlations between the opened curtain condition and lighting sensation, sound satisfaction, and sound expectation, while there was a significant negative correlation between it and lighting expectation. In addition, turning dormitory lights on and off had a significant positive correlation with lighting sensation, temperature, humidity, and lighting satisfaction, and temperature and humidity expectation, and a significant negative correlation with temperature and humidity sensation. Moreover, the lit table lamp condition was positively correlated with humidity and lighting expectations, and was negatively correlated with lighting satisfaction.

3.6. Correlation between the Environmental Perception and Psychological State

As shown in Figure 7, the most obvious point is that the participants’ temperature sensation was significantly positively correlated with their psychological state, including six out of the eight psychological problems and the total score of the SAS and SDS. In other words, the hotter the participants felt, the more likely they were to develop various psychological problems. Therefore, it is very necessary to maintain a reasonable temperature for people in isolation.
In addition to temperature sensation, participants’ sensations of the humidity and lighting environments were correlated with some parts of the psychological state. Among them, there were significant positive correlations between the humidity sensation and A, F, G, and SDS scores. There were also strong negative correlations between the lighting sensation and F, G, H, and SDS scores. That is to say, when the participants’ sensation of ambient humidity changed from humid to dry, it became easier to maintain a healthy mental state. A similar effect occurred when the lighting environment was perceived to go from dark to bright.
Compared with temperature, humidity, and lighting sensations, there was no significant correlation between the participants’ sensation of the sound environment and their psychological anxiety.
Despite the environmental sensation, whether the participants were satisfied with their indoor environment was also negatively correlated with the severity of psychological problems. Especially for the temperature and humidity environments, when the participants were more satisfied with them, they had fewer psychological problems and lower SAS and SDS scores.
In terms of expectation, temperature expectation remained the most significantly negatively correlated with mental health. Furthermore, the humidity expectation and sound expectation were also related to psychological state, and most of the correlations were negative.
ASHRAE standard 55 [52] defines thermal comfort as “expressing the psychological state of satisfaction with the thermal environment”. There are two views on the relationship between temperature sensation and temperature comfort. Some studies believe that temperature sensation and temperature comfort are the same concepts, that is to say, neutral temperature sensation is temperature comfort [53,54]. However, some argue that temperature comfort is not the same as temperature sensation and that it can be affected by physical, physiological, psychological, and other factors [55,56]. The relationship between other environmental sensations and comfort is similar.
In the online questionnaire, to prevent the confusion of concepts and reduce the participants’ feelings of fatigue, only the environmental sensation vote (ESV) was set. Subsequent analyses considered the neutral feeling to be comfortable. Therefore, to explore whether mental health is related to environmental comfort, the environmental comfort vote (ECV) was converted using Equation (1). Following the treatment, the value from 0 to 2 indicates that the participant’s perception of the environment changes from comfortable to uncomfortable. The correlation analysis was conducted again, and the results are shown in Figure 8.
E C V = 0 , w h e n   E S V = + 0 ; 1 , w h e n   E S V = ± 1 ; 2 , w h e n   E S V = ± 2 .
As can be seen from the Figure, environmental comfort was strongly correlated with the psychological state. According to the correlation coefficient, it can be inferred that the more uncomfortable the participants felt about their environment, the more likely they were plagued by depression and anxiety [57]. Therefore, it is very important to create a comfortable living environment for college students during the isolation period [58].

3.6.1. The Difference in Isolation Time

The questionnaires at the beginning (around the 4th day) and the late (around the 20th day) isolation stages were selected to compare the correlation between environmental sensation and psychological state. As shown in Figure 9a, it can be seen that in the early stage of isolation, the temperature sensation had a significant impact on the psychological state of people in isolation. Therefore, to guarantee the psychological health of people living in isolation, attention should be paid to the construction of a suitable environment in the early stage of the quarantine to prevent the temperature from being too high. However, this effect was largely attenuated at the later stages [44]. On the contrary, there were significant negative correlations between sound sensation and several psychological states. Probably due to the boring life of isolation, isolated students lacked communication with the outside world, which led them to the hope of receiving auditory stimulation from their surroundings. For the sake of mental health, with the increase in isolation time, it is necessary to pay attention to the construction of an indoor sound environment [59]. Appropriate music [58] and some natural auditory elements [60,61], such as wind and birdsong, can relieve psychological tension and anxiety.

3.6.2. Gender Difference

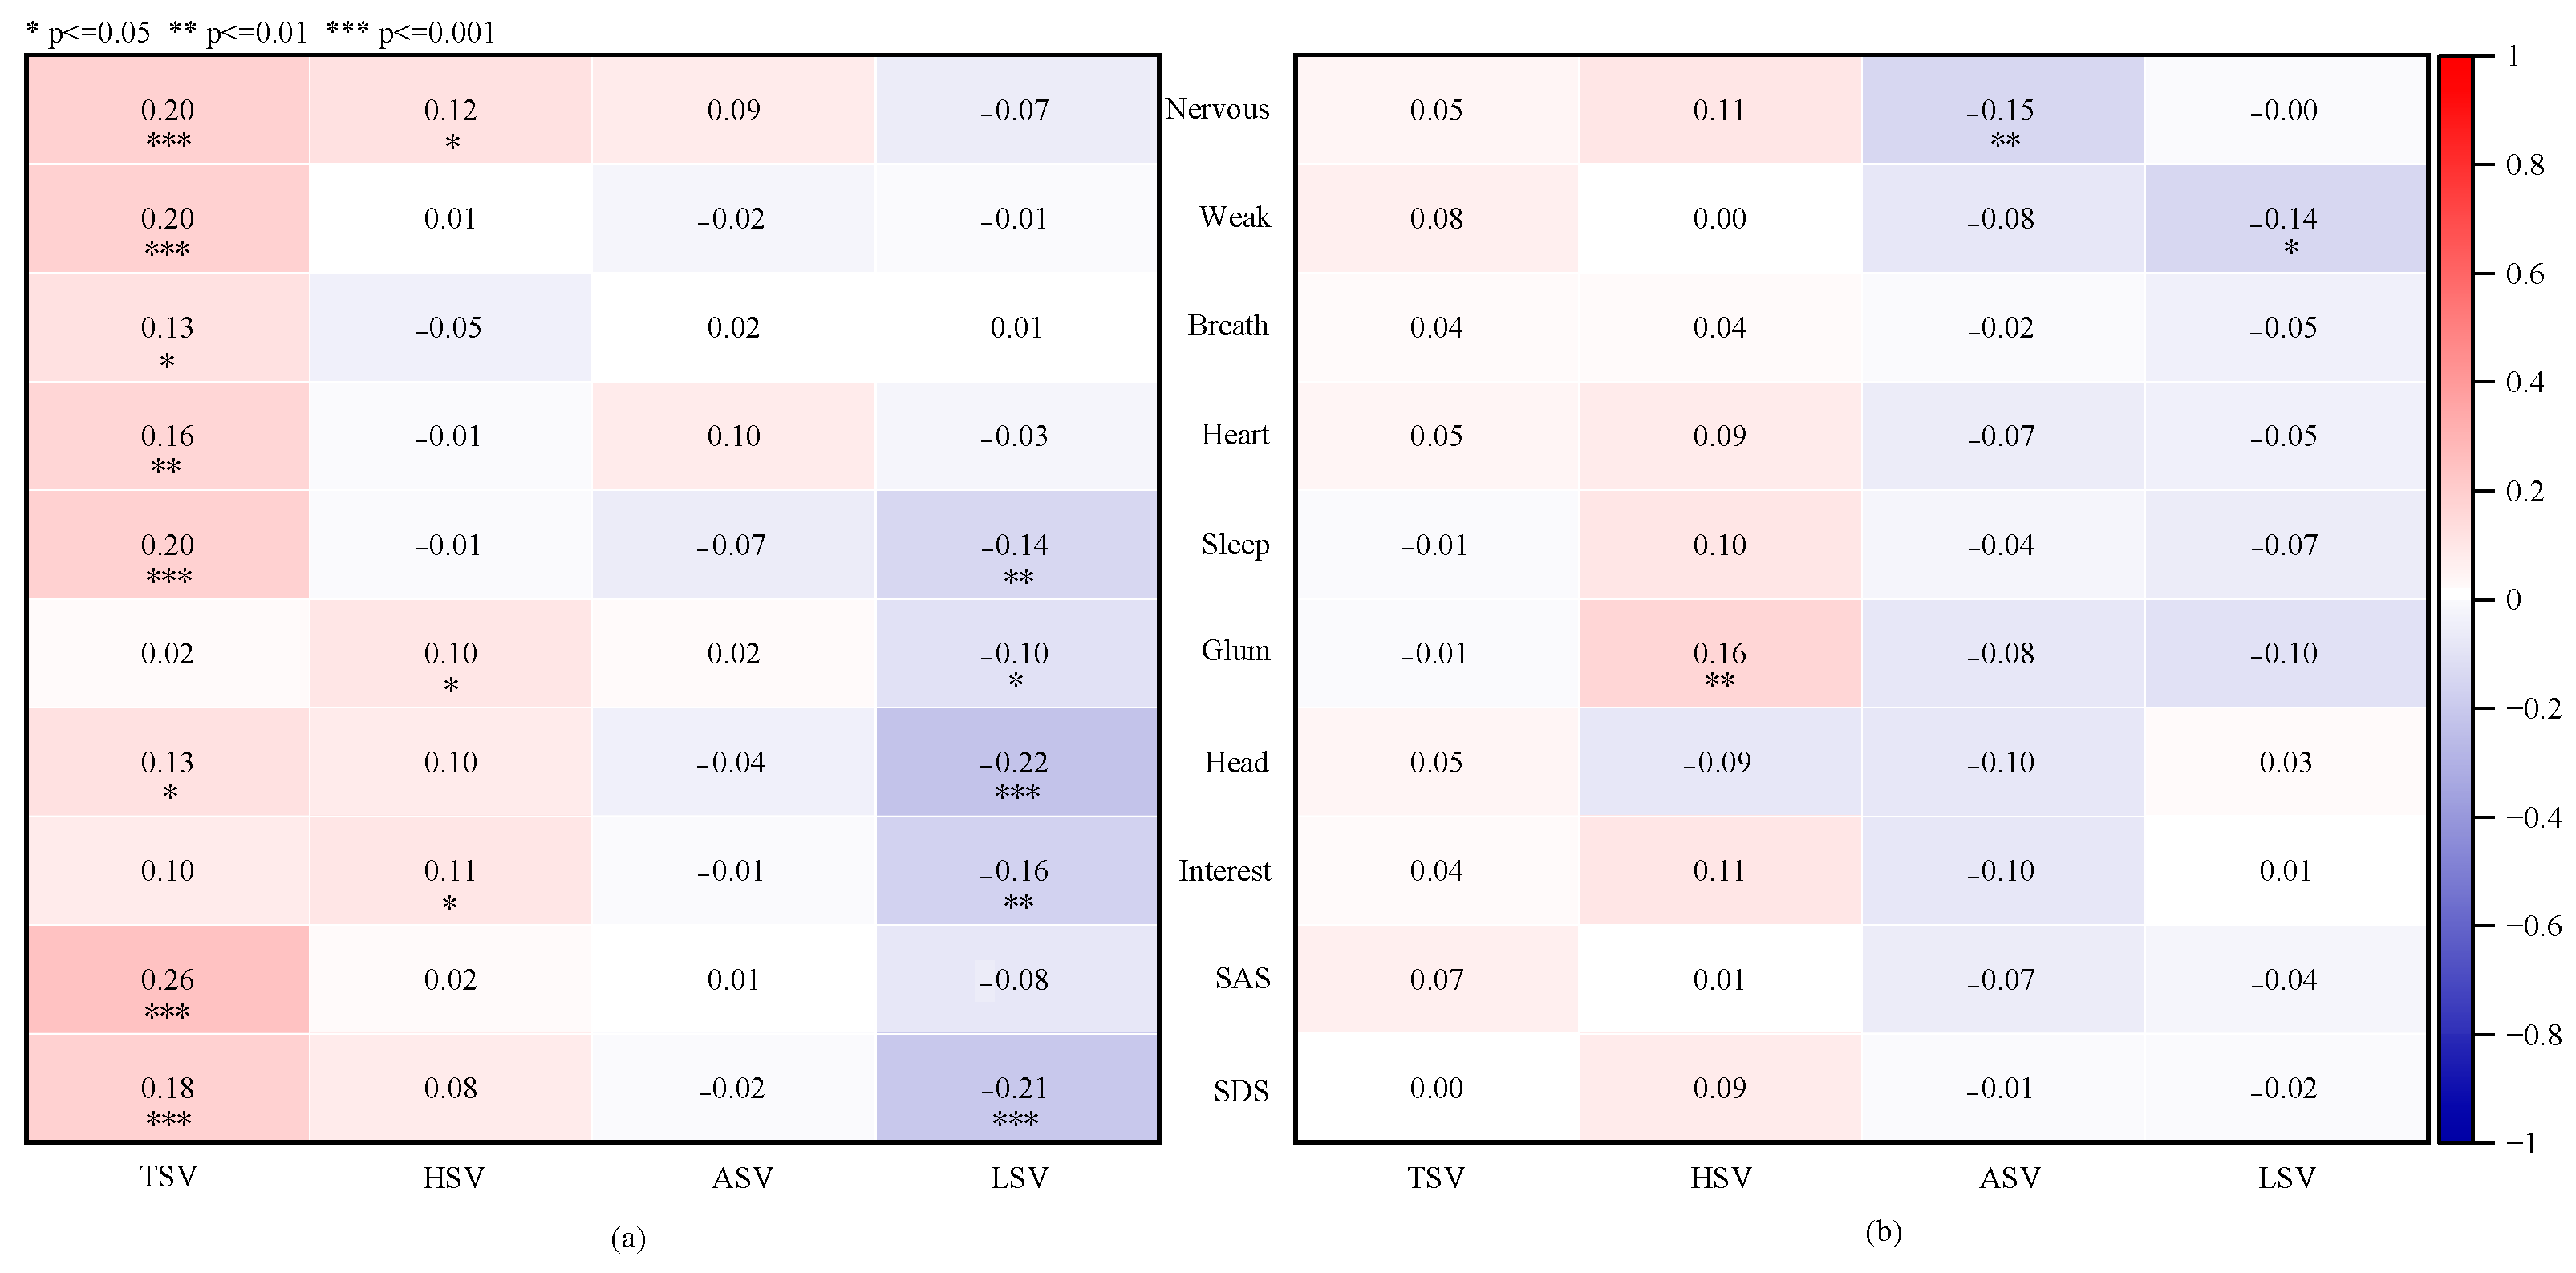
Once the questionnaire was classified according to gender, the correlation analyses of the environmental sensation and psychological state were conducted, respectively. The correlation coefficient and p-value of the two are shown in Figure 10. The male temperature sensation had highly significant positive correlations with six of the eight psychological problems, as well as the total SAS and SDS scores. In addition, there was a significant negative correlation between lighting sensation and psychological state in male participants. However, the female subjects did not show either phenomenon. It can be seen that the influences of temperature and lighting environments on male psychology were much higher than those of females. In general, the female psychological state was rarely influenced by their living environment, while the hotter and darker the male participants felt, the worse their mental health was. Therefore, it is imperative to maintain a reasonable indoor temperature and lit environment, especially for males [20]. Furthermore, according to the positive and negative properties of the correlation coefficient, it can be speculated that moderately reducing the humidity and increasing the sound levels could alleviate the psychological discomfort of people in isolation.

4. Discussion

4.1. Environment Adjusting Behavior and Purpose

The results show that, except on rainy days, when windows and doors were more often closed to prevent rainwater from entering the room, many students chose to open their windows, which was beneficial to the physical health of the residents. For the aim of the prevention and control of the virus, the timely opening of doors and windows to introduce fresh air for natural ventilation is very effective [62,63,64,65]. In contrast, balcony doors are opened less frequently than windows, which may be to reduce excess wind and prevent the temperature and humidity of the indoor environment from being too much affected by the outside world.
Observing the use of curtains among the participants, it was found that most of the isolators chose to keep the curtains opened except during sleep and on rainy days. It supports the results of the study [66,67,68] that people in isolation need more daylight and a view from the window. In addition, students may be in a better psychological state when exposed to more artwork and greenery [69,70]. Meanwhile, studies have also shown that sunlight can damage certain strains of COVID-19 [71]. Therefore, it is very beneficial to open the curtain at the right time no matter the occupant’s physical or mental health. The results of the study also show that isolated college students turned on dormitory lights and desk lamps frequently during non-sleeping hours. In addition to satisfying the comfort of the lighting environment, proper light exposure not only boosts occupants’ mood [72], but is also beneficial to their mental health.

4.2. Environmental Sensation

4.2.1. Time Difference

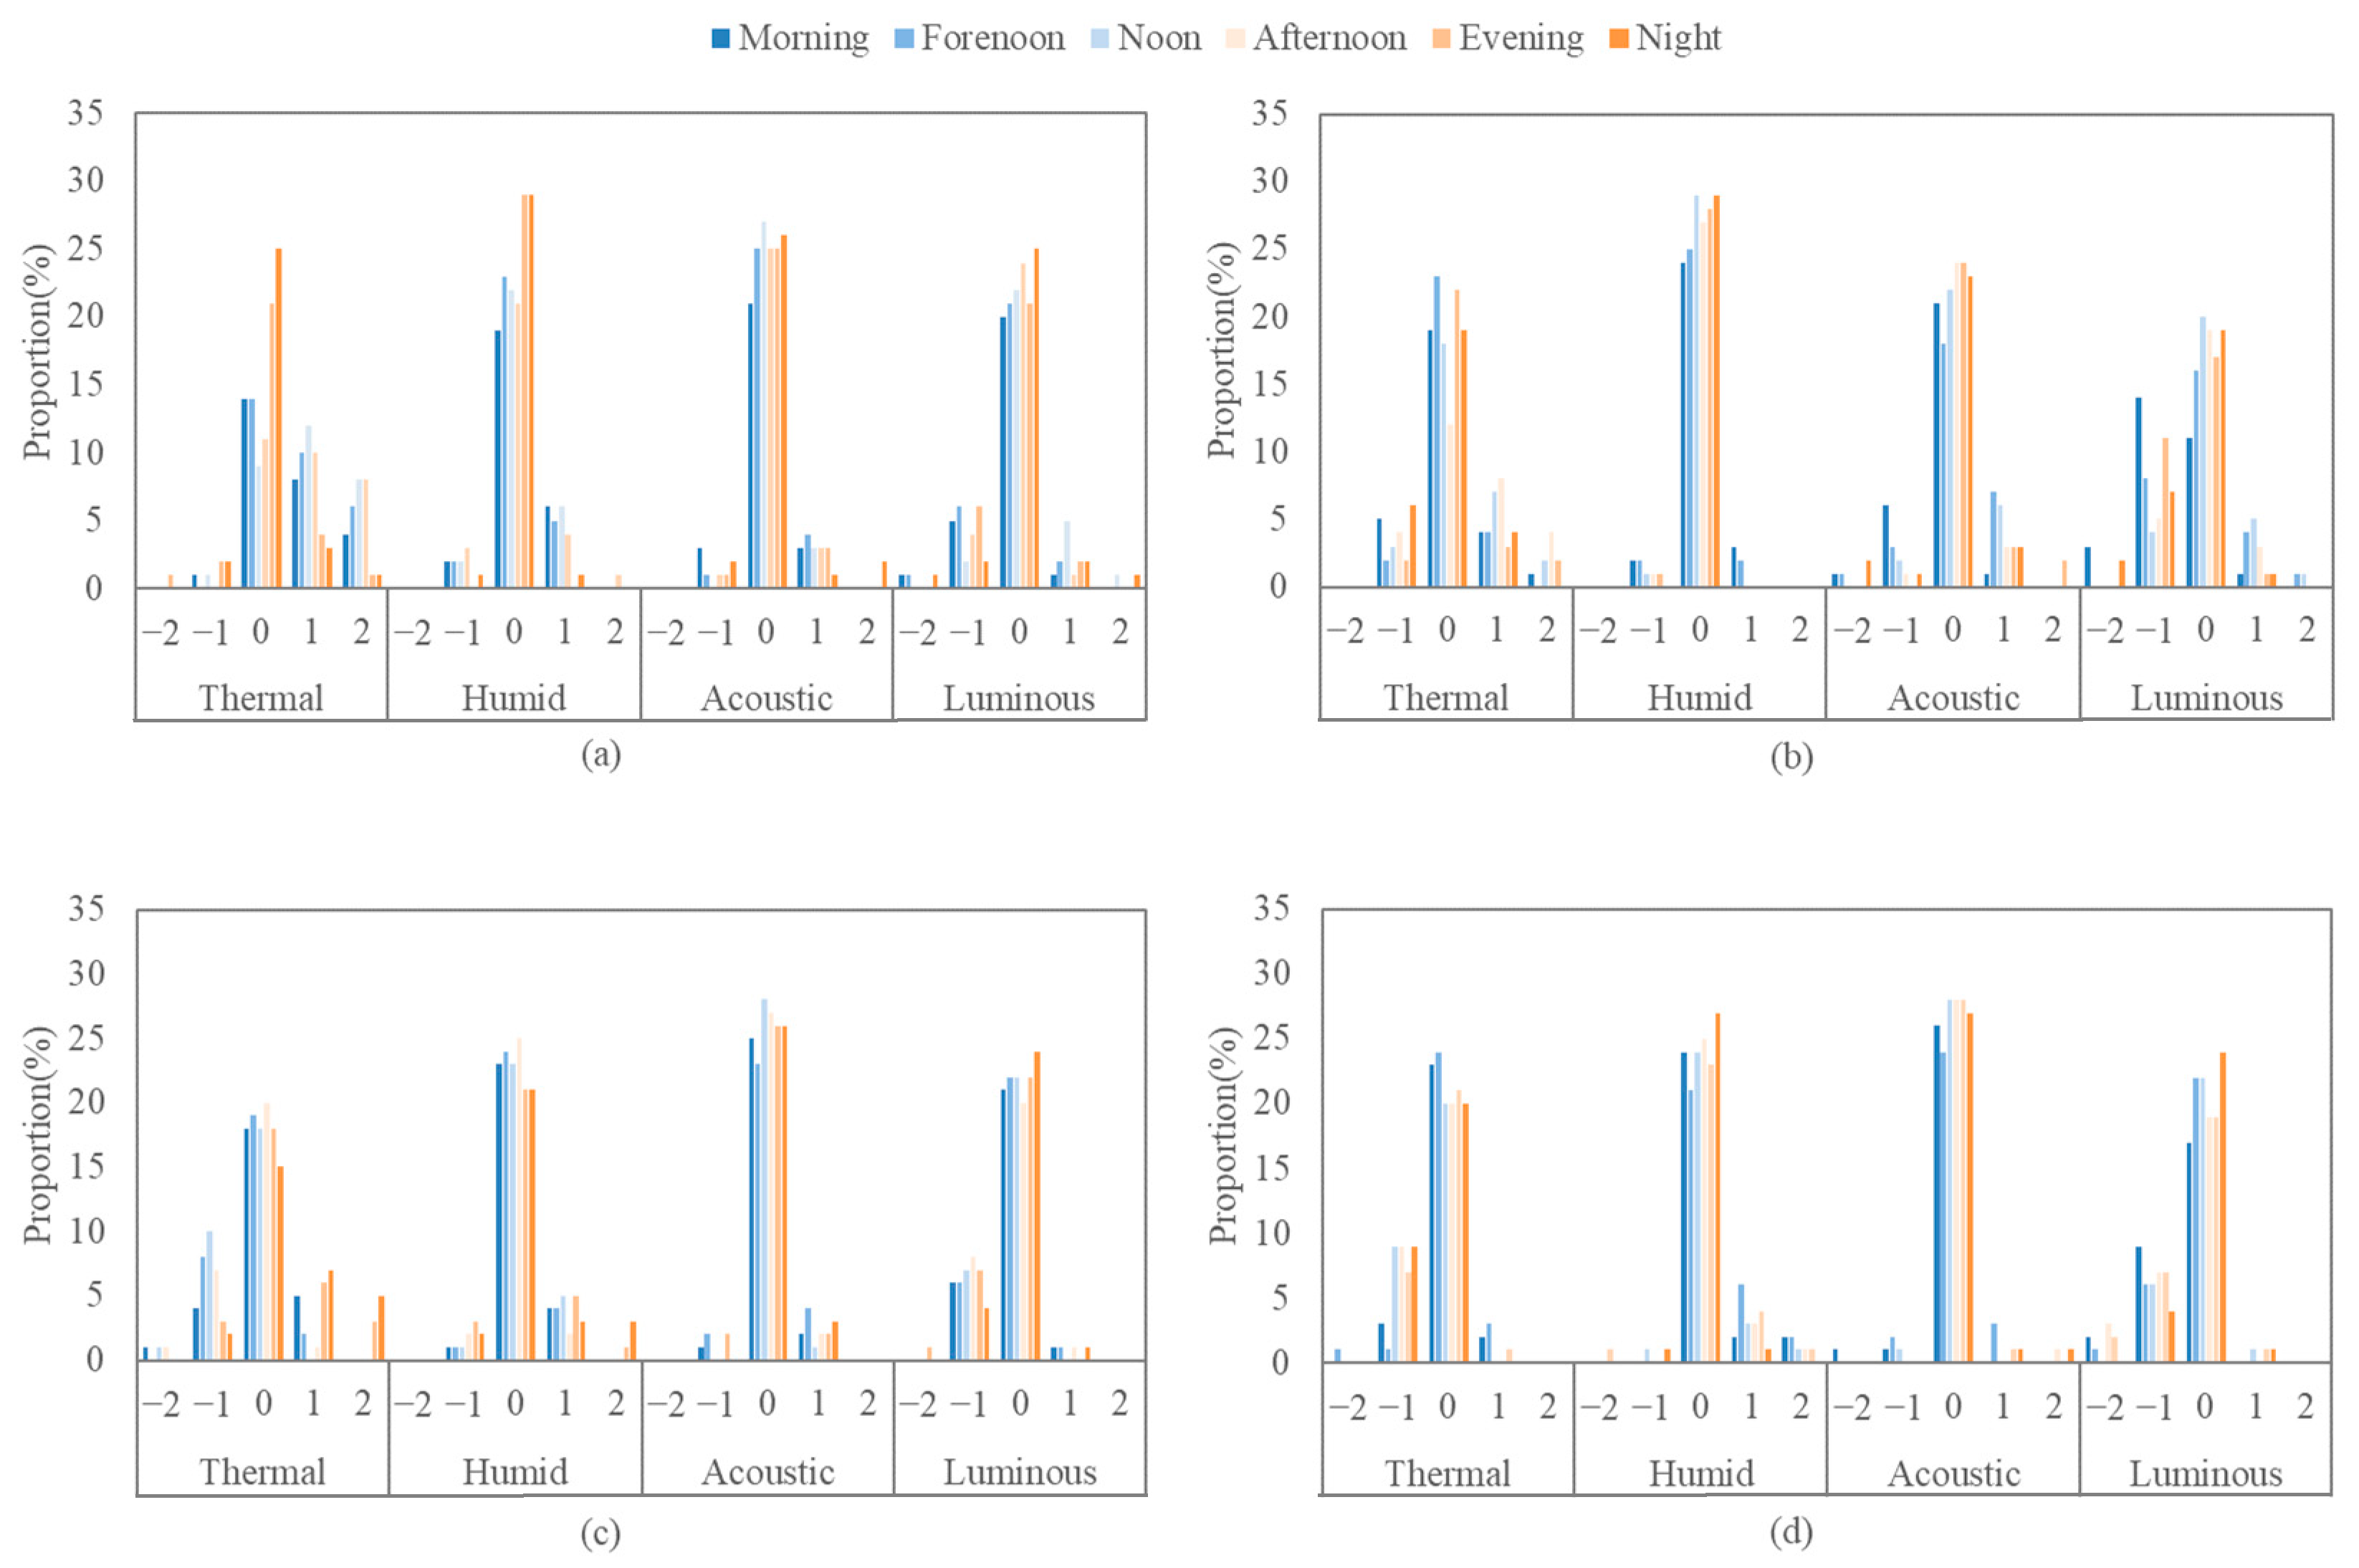
Figure 11 shows the environmental sensations of the participants at different periods under different weather conditions. It can be seen that regardless of the weather, the subjects felt more uncomfortable with the temperature factor than others, as shown by the minimum neutral voting percentage. On sunny days, more participants rated the environment as warm, while on cloudy days, more people said that the temperature was low. In addition, the lighting environment was also easy to feel unneutral, especially in weather conditions that lacked natural light. On cloudy days, overcast days, and rainy days, more participants reported darkness. Moreover, the number of votes that felt the high humidity in rainy weather was also significantly higher than others.
Comparisons were also made between periods. As can be seen from Figure 11, more subjects’ temperature sensations were not neutral at noon, afternoon, and evening, unlike in the other periods. Among them, noon time results fluctuated greatly with the change of weather. In addition to temperature, the indoor lighting sensation was also an environmental parameter that participants were prone to perceive as uncomfortable. In the morning, the number of votes perceiving the environment as dark was highest. Furthermore, there was no significant difference in the time between the participants’ humidity and sound sensations, except for a small number of isolators who thought the sound environment was noisy in the morning.

4.2.2. Gender Difference

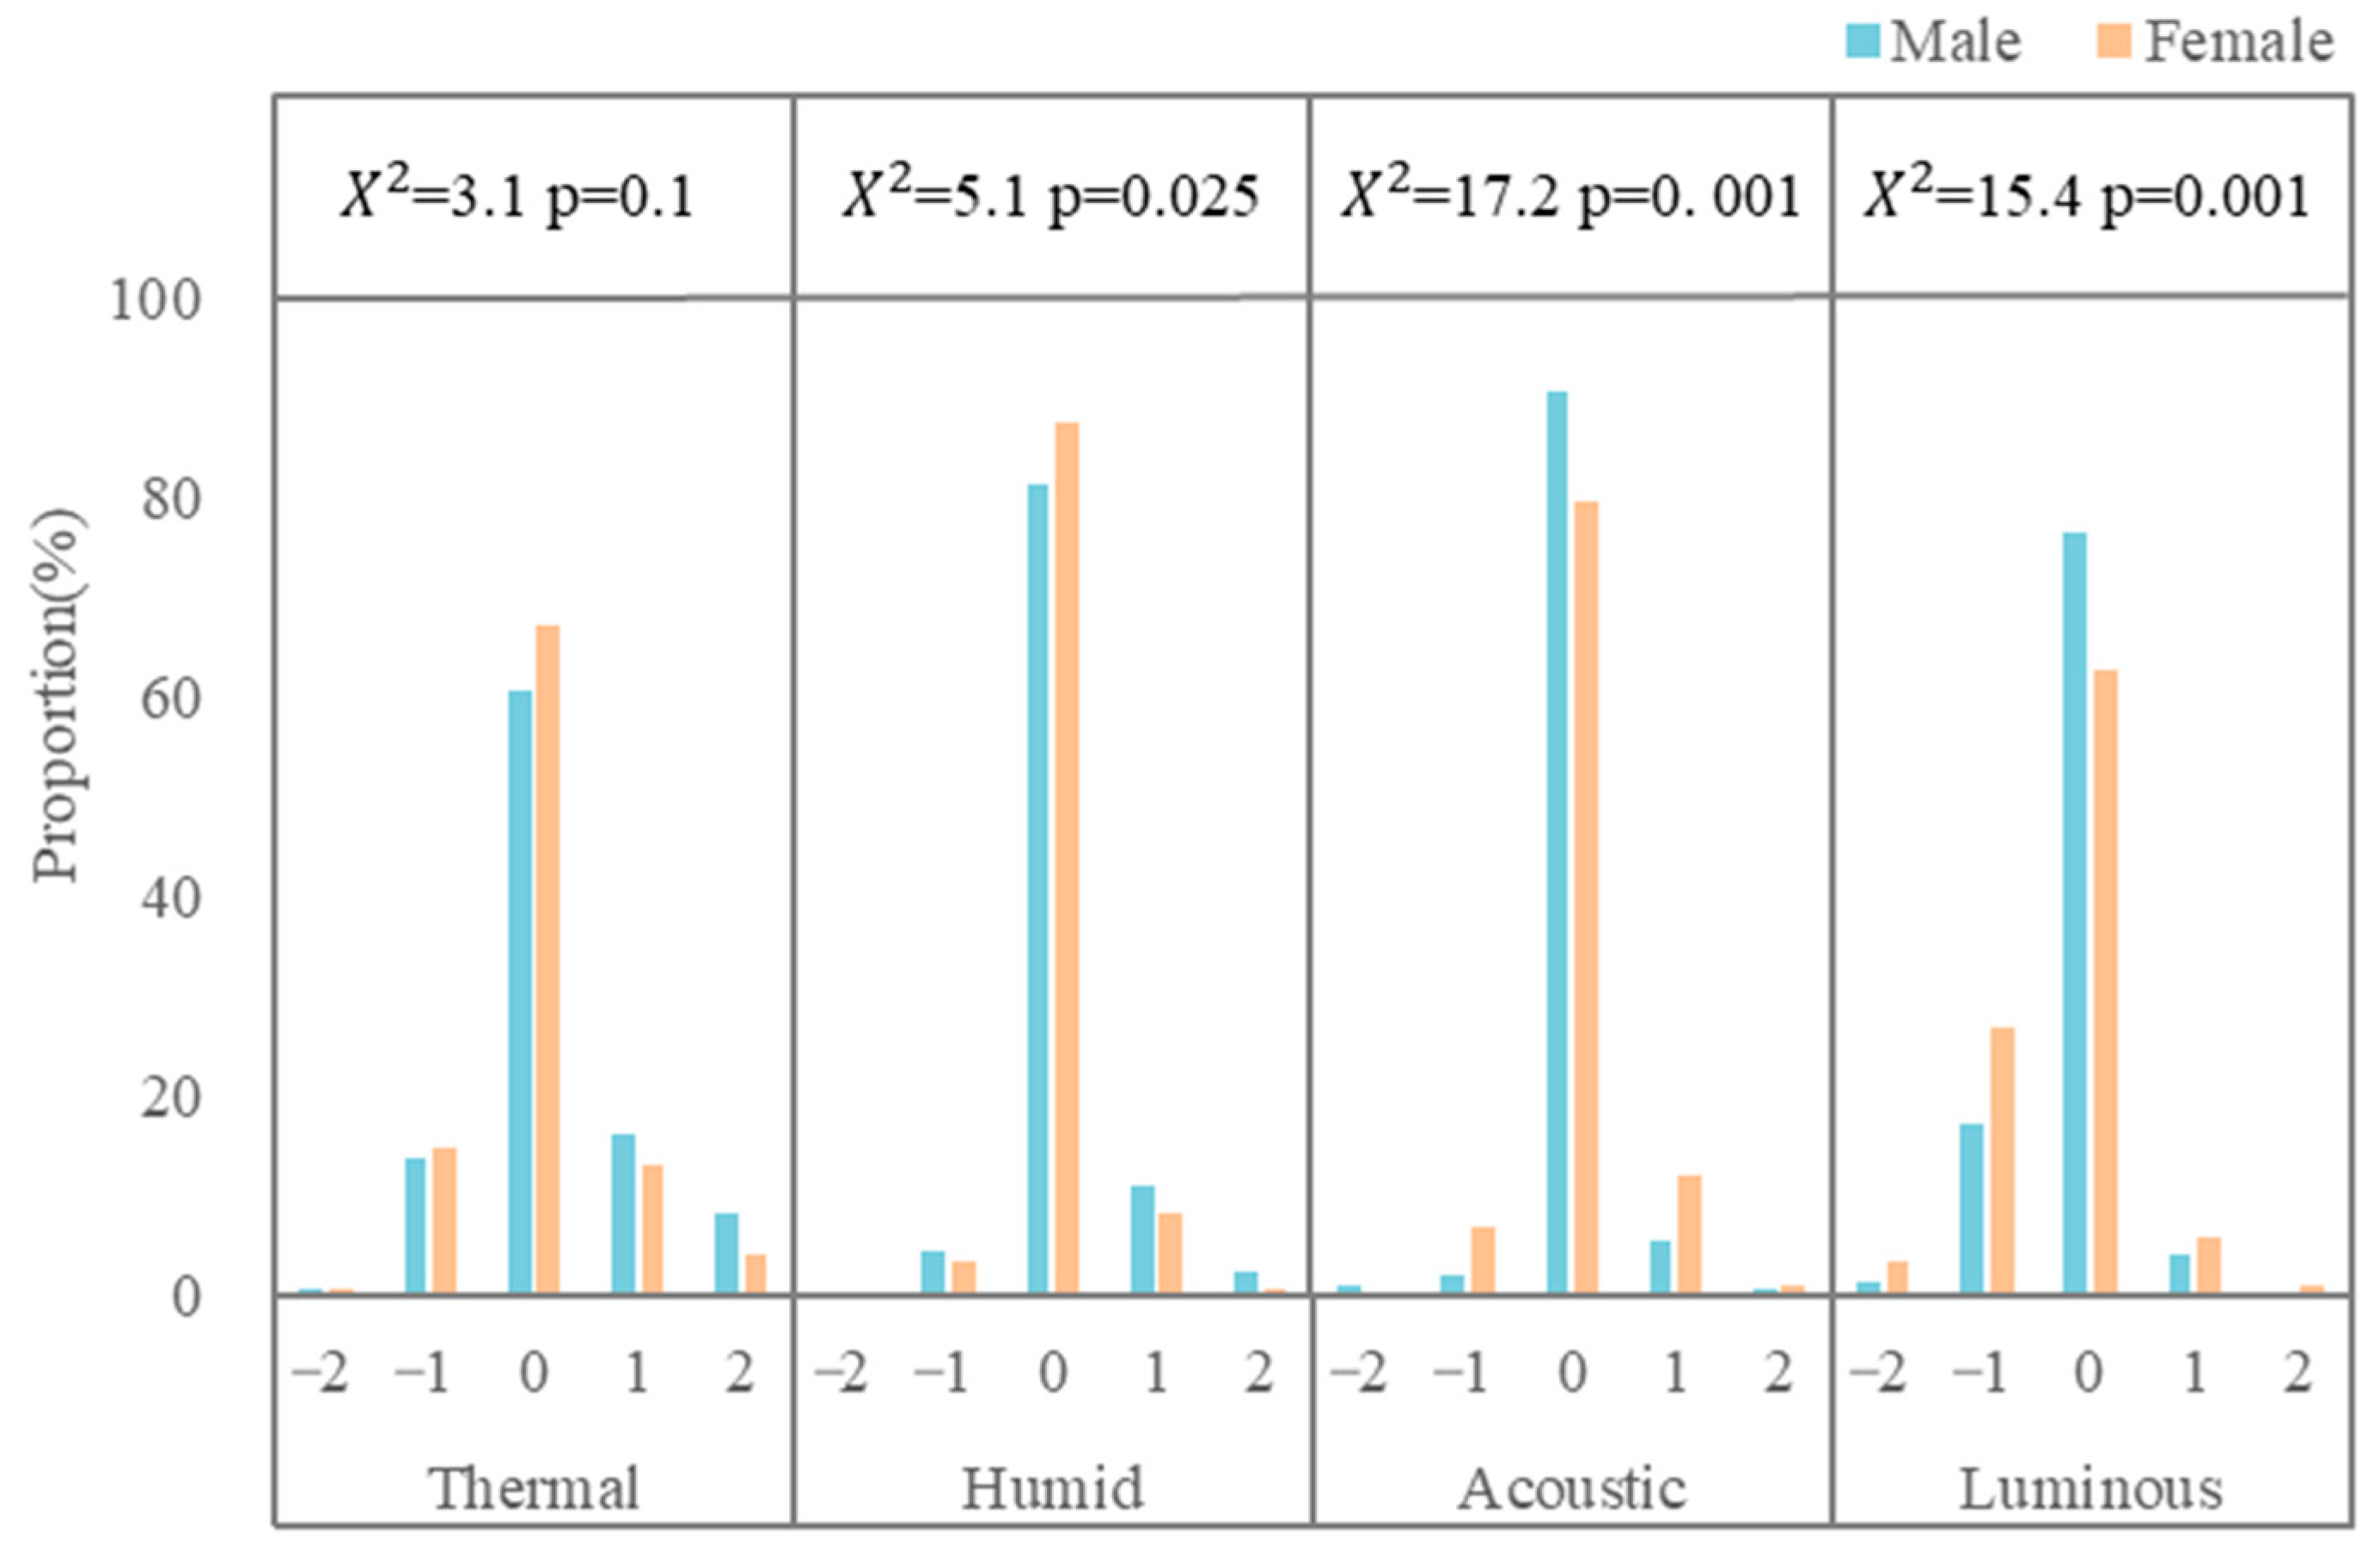
Figure 12 shows the difference in the perceived voting between male and female participants and the results of the Chi-square test. It can be seen that the proportion of voting times for neutral temperature and humidity sensations among male participants were 60.7% and 81.2%, respectively, which were lower than those among females (67.1% and 87.5%). However, the proportion of voting times with a neutral feeling for the sound and lighting environment for males was 90.6% and 76.3%, respectively, which were significantly higher (p < 0.05) than those for females (79.6% and only 62.6%). This suggests that the males in this study were more sensitive to temperature and humidity, while the females were more sensitive to sound and light.
Table 5 shows the ratio of two non-neutral sensation voting types. It can be seen that most participants’ discomfort mainly comes from high temperatures, high humidity, loud sounds, and dark lighting. Concerning the results for temperature sensation, for male and female participants, the ratios of positive and negative temperature sensation votes were 1.7:1 and 1.1:1, respectively, which shows that male participants are more sensitive to high temperatures and are more likely to feel hot in a warmer environment [73]. Similar studies have argued that the neutral temperature of male subjects is about 2.2 °C lower than females [74]. As for the lighting sensation results, for male and female participants, the ratios of positive and negative votes were 0.25:1 and 0.23:1, respectively. Therefore, most of the lighting discomfort is caused by the lack of light intensity. During the quarantine, the lighting environment should be monitored and more lighting options are needed for isolated students [10].

4.2.3. Room Orientation Difference

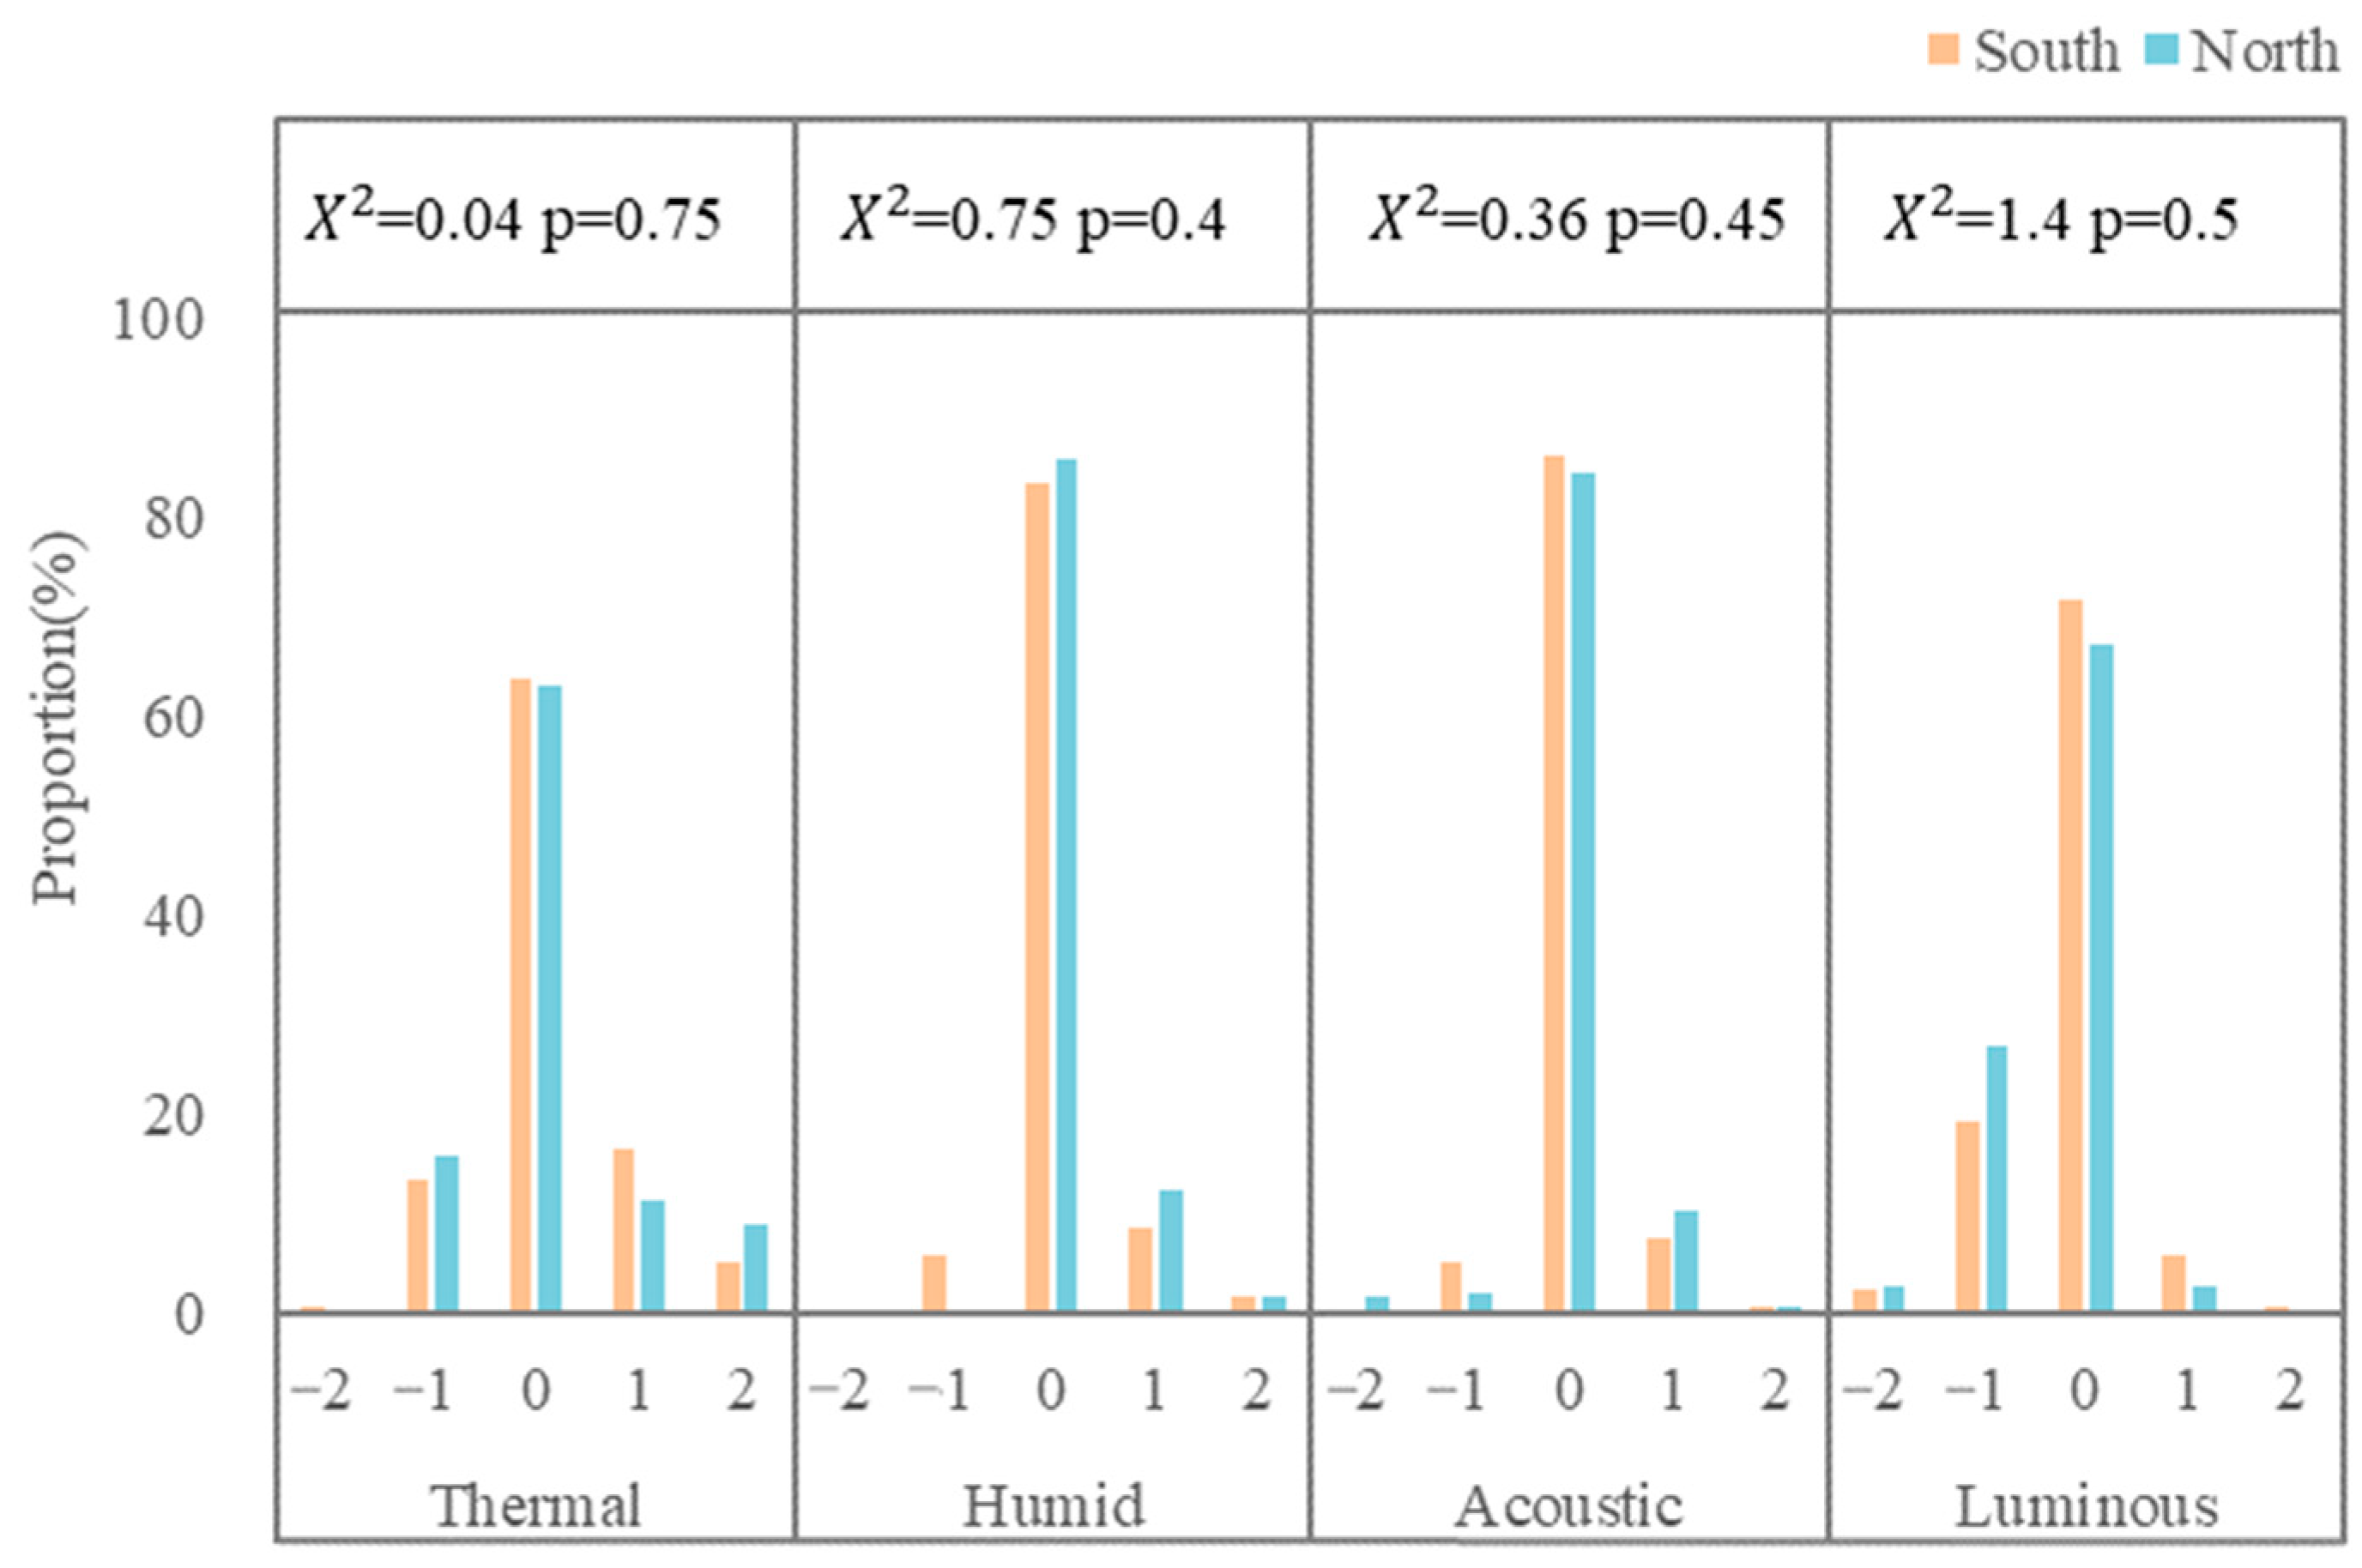
Figure 13 shows the distribution of the environmental sensation votes among participants in the dormitory with different window orientations. First of all, participants in every room orientation had a lower proportion of neutral temperature and lighting sensation votes. Secondly, regardless of the orientation, the participants’ votes for the neutral sensation of the four indoor environment factors were similar. The chi-square test results also showed no significant relationship between the neutral sensation vote proportion and the north–south orientation of the room. In addition, in terms of the unneutral vote distribution, it is obvious that participants in the north were more likely to perceive the environment as dark than those in the south, while those in the south were more likely to perceive the environment as humid than the others.

4.3. Psychological State

Poor sleep quality and the lack of mental clarity were the two most frequently reported psychological problems among isolated college students, which often happened simultaneously. There was a significant correlation (p < 0.001) between the two psychological problems, and previous studies during the pandemic had found similar results [34]. These effects may persist for a while after the end of isolation [9,36]. The negative emotions might come from various stressors in life, such as the fear of being infected and worrying about their relatives and classmates [29], the rapid increase of cases in society, the emotional and physical fatigue, as well as the fear of being alienated by others [40]. In addition, isolation also had a relatively large impact on people’s work efficiency. Therefore, it is very necessary to provide reasonable psychological counseling for college students in the process of isolation to improve their sleep quality [49], reduce the sense of fatigue, and improve work efficiency in the dormitory.
In general, although the SAS and SDS scores of most students were in a relatively normal range, there were still some isolated students whose scores fell into the range of moderate or even severe anxiety and depression. Counting the numbers of these people, it was found that over 15 people had experienced high levels of anxiety or depression, accounting for more than half of the total number. This suggests that the occurrence of anxiety and depression was not an isolated case, but a common phenomenon, which is similar to the findings of Wang et al. [27]. For this kind of student, mental health targeted psychological counseling [49] and the organization of appropriate sports activities [48] are needed to prevent the further deterioration of their mental health.

4.3.1. The Difference in Quarantine Time

The SAS and SDS scores of college students isolated in the dormitory were significantly higher than those who were isolated at home [75,76] or in hotels [77], and they were much higher than those of adults who were beyond school age [78]. To verify the impact of isolation time on the mental health of isolated college students, the SAS and SDS scores of subjects obtained at different isolation times were averaged and their trends were observed, as shown in Figure 14a, which shows an obvious upward trend. The correlation coefficients between the isolation time and the mean of the two scores are 0.921 (p = 0.026) and 0.972 (p = 0.006), respectively, showing a very significant correlation. Figure 14b shows the changes in the proportion of students suffering from moderate and severe anxiety and depression with the passage of the isolation time, which is also rising in general. Free-moving participants showed no such trend, with SAS and SDS scores of 35.6 ± 10.6 and 35.9 ± 13.1 on day 1 and 34.2 ± 13.1 and 36.3 ± 11.6 on day 7. Comparatively speaking, the increase in isolation time led to more and more serious psychological problems among college students isolated in dormitories [44,79].

4.3.2. Gender Difference

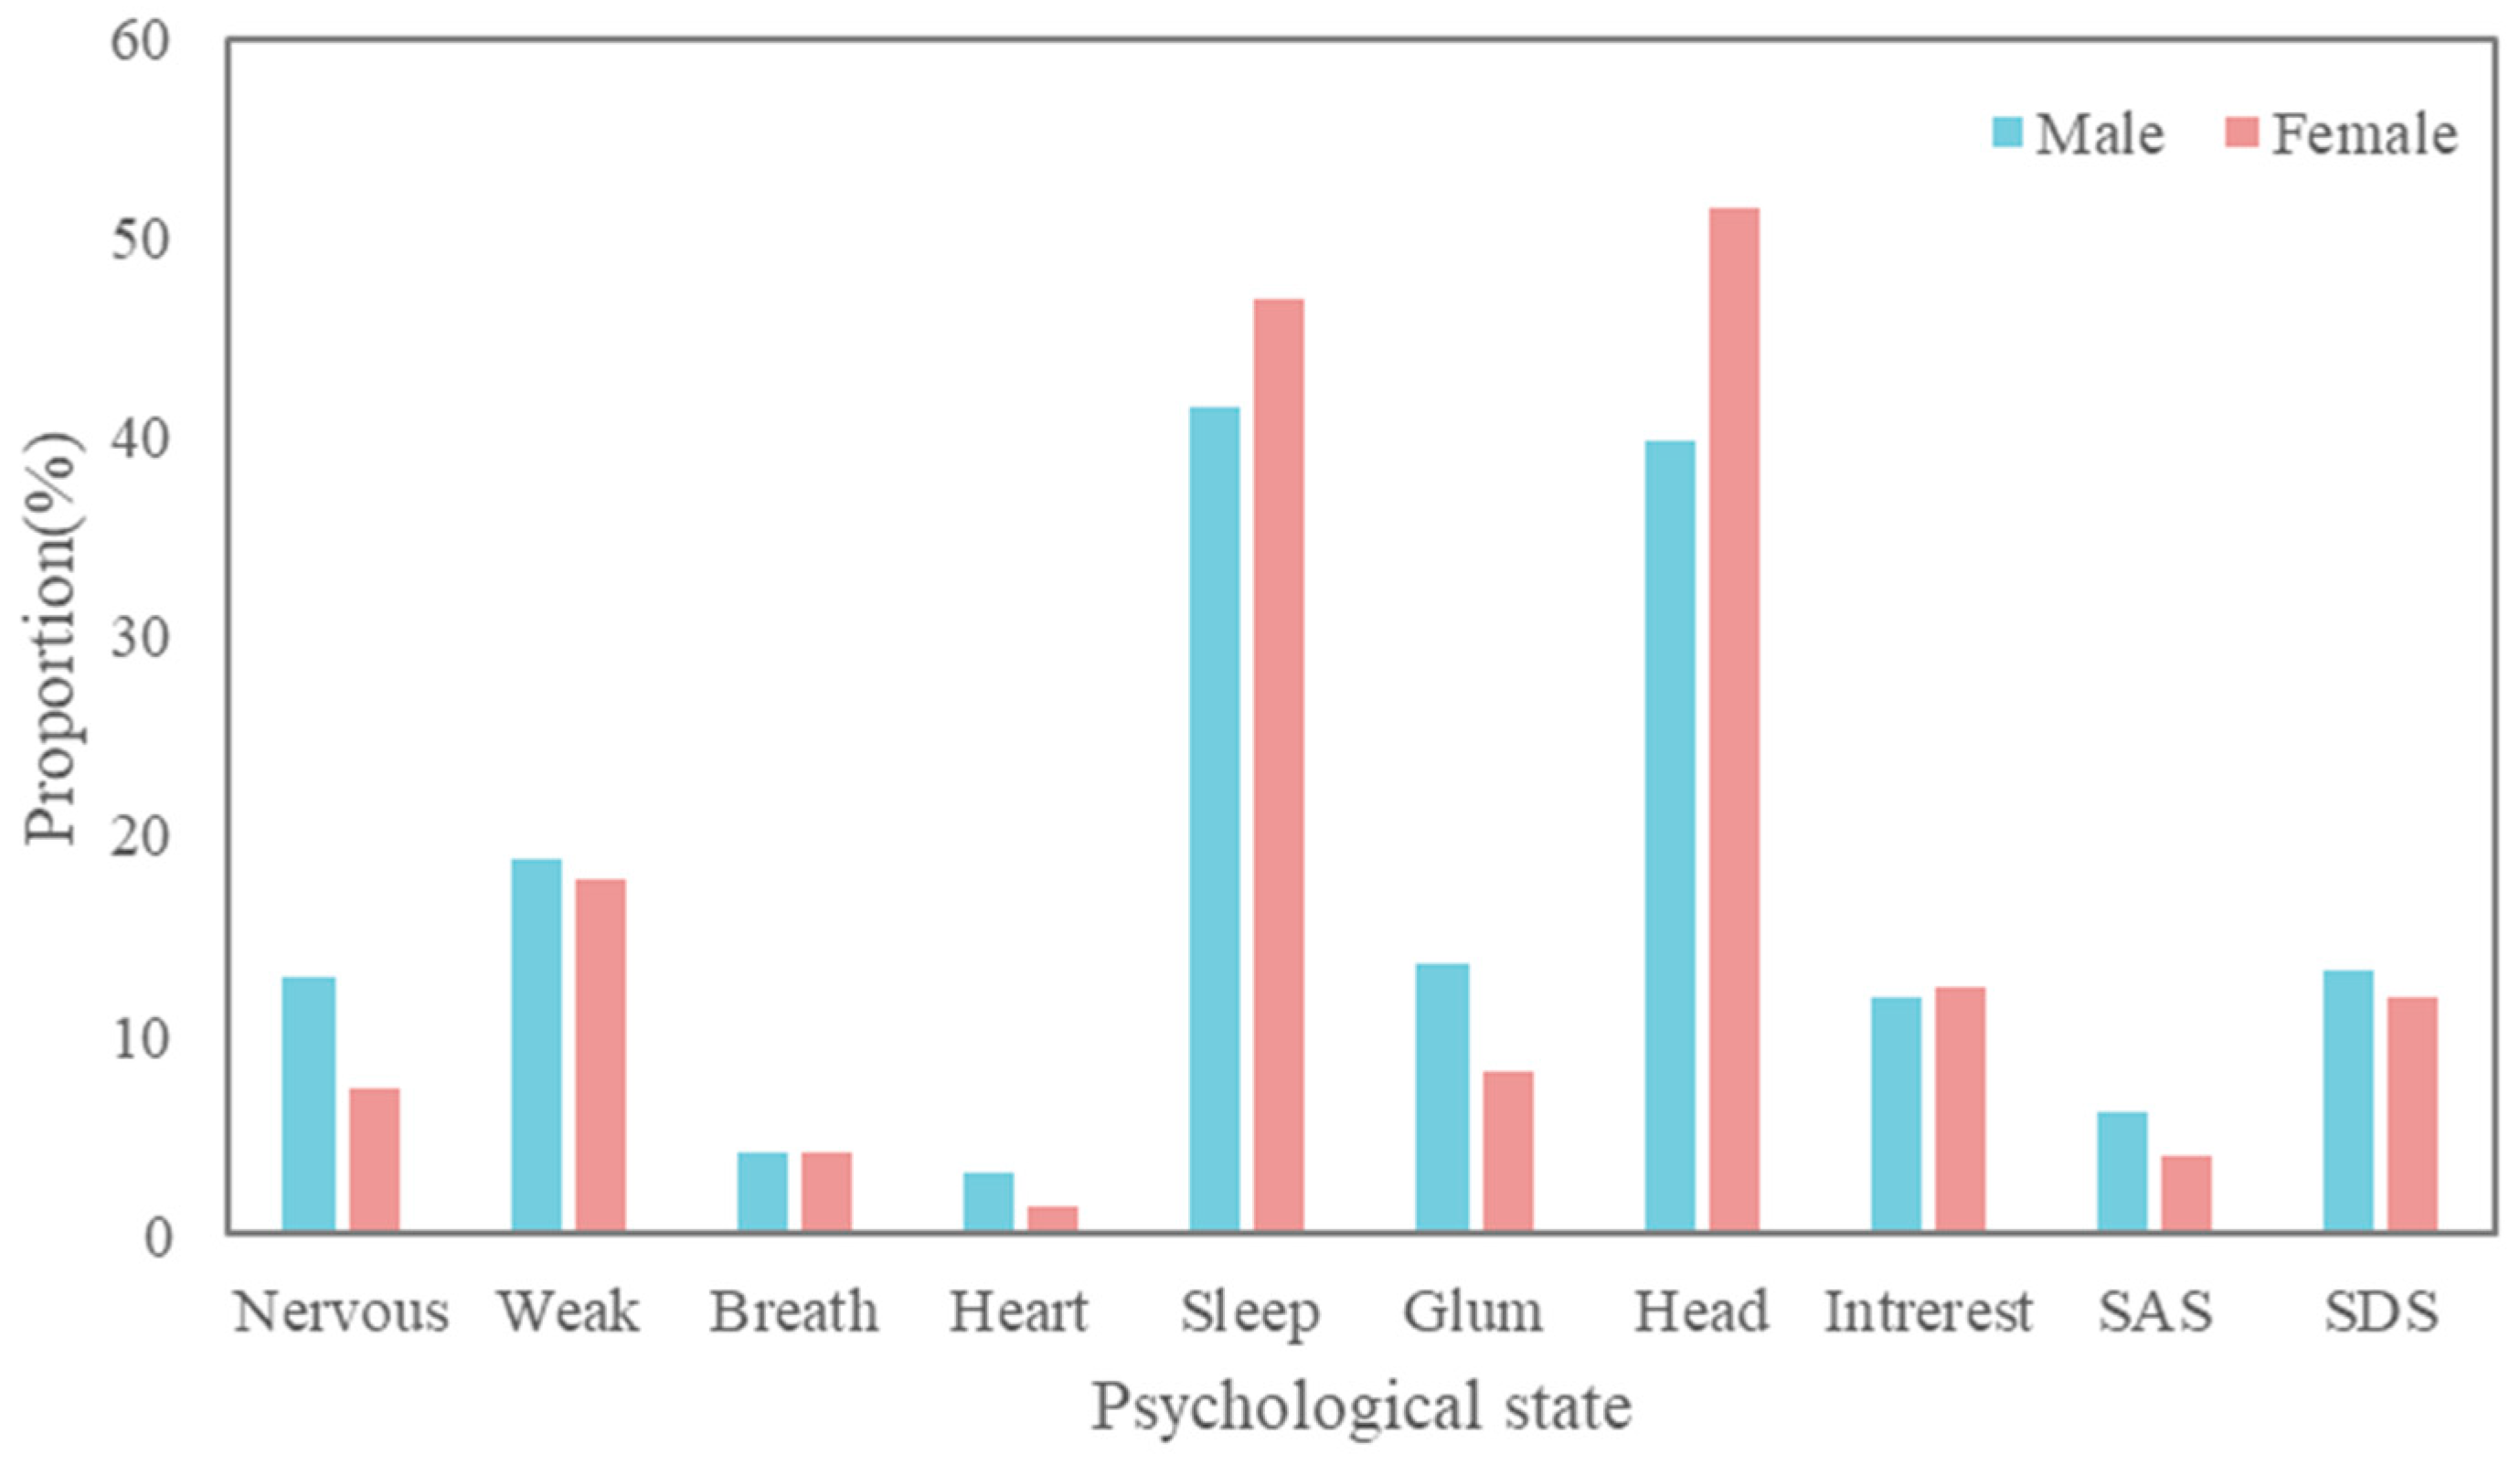
To explore the association between gender differences and mental health state, the proportion of males and females who chose “3” and “4” for each questionnaire item and whose total SAS and SDS scores were in the moderate and severe range were counted. As shown in Figure 15, males were more likely to have poor outcomes in most of the items, as well as overall scores. However, for E and F, the frequency of female unhealthy states is significantly greater than that of males, that is, females were more likely to have poor sleep quality and mental confusion. Overall, male mental health was worse than females during isolation, contrary to the results of other studies [41,42,43].

4.3.3. Weather Difference

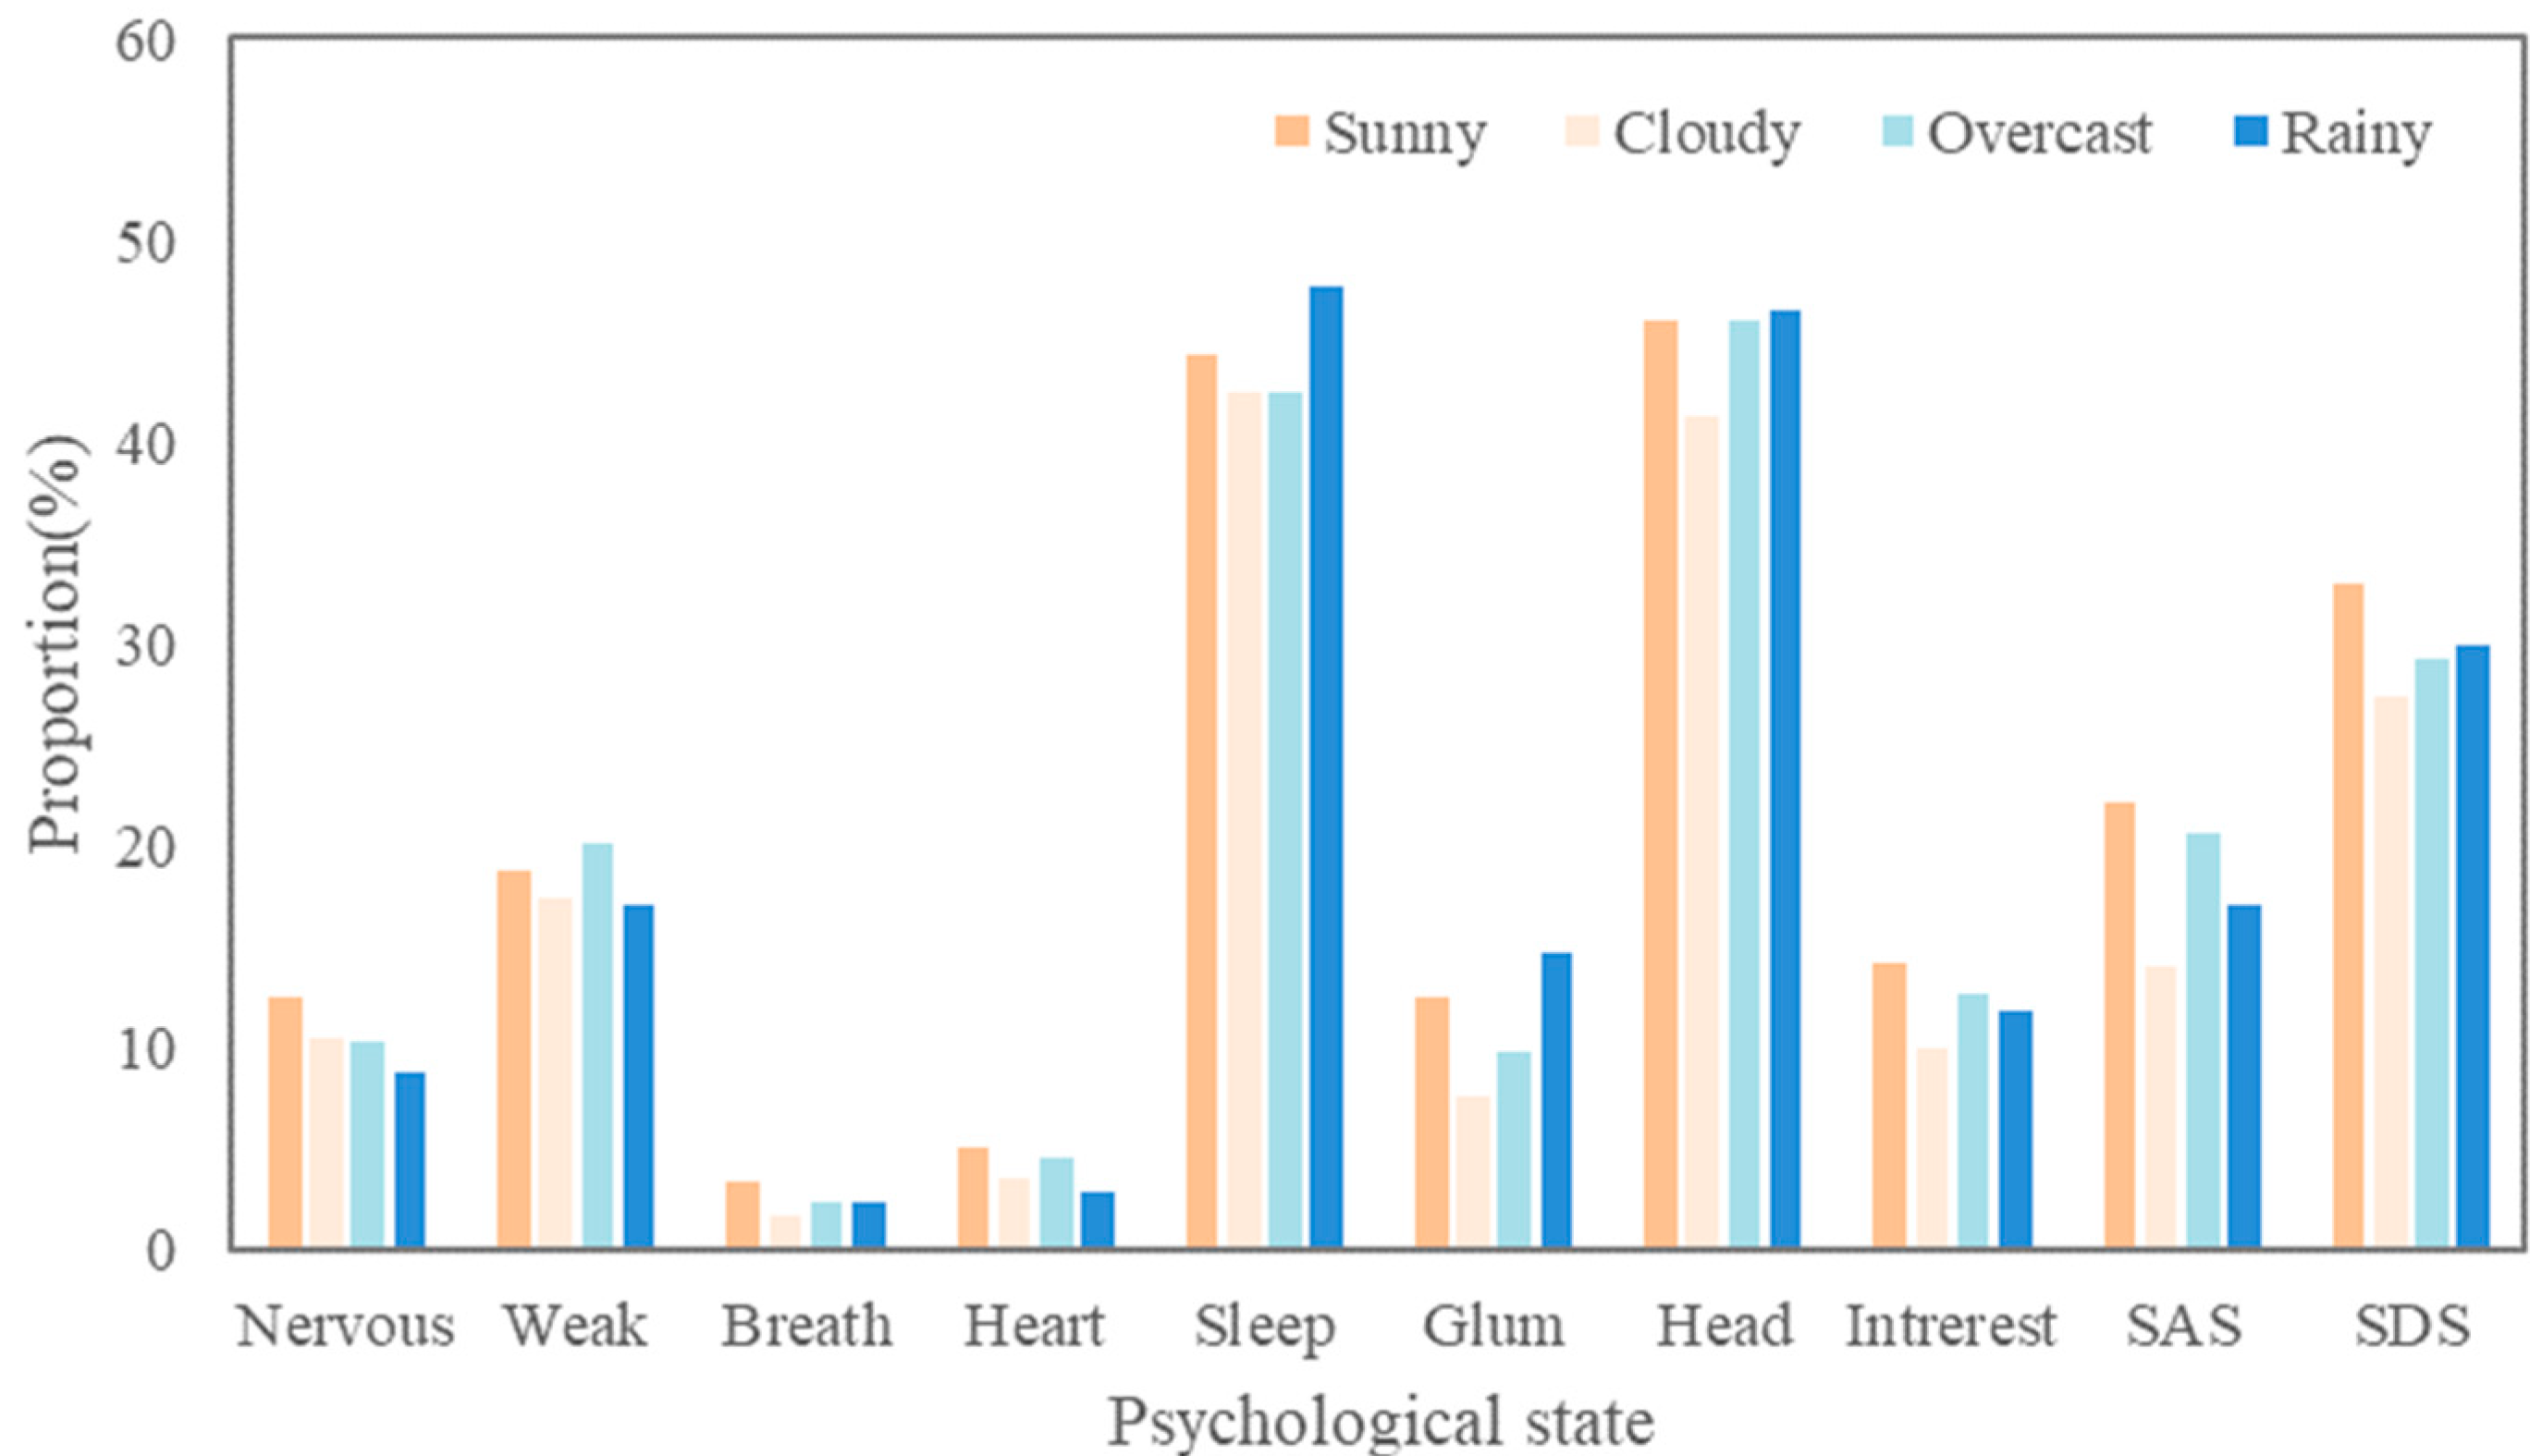
Past research [80] has shown that the weather plays a role in people’s mental health. They may be in a better mood on days with more sunlight [81]. Similar to Section 4.3.2, we have calculated the proportion of people with a poor psychological state under different weather conditions, as shown in Figure 16. However, contrary to previous studies, the results showed no significant differences and correlations (p > 0.05) in the psychological state between weather conditions. This finding is similar to Burdett’s study [82], and may be due to the fact that the students lived mostly indoors during the quarantine period and were not much affected by the weather outside.

4.4. Limitations

There are still some limitations in this study:
(1)
The study adopted the form of an online questionnaire, which made it impossible to accurately obtain various environmental parameters in the room where the subjects lived;
(2)
Correlation analysis conducted in this paper can only show linear correlation results. Therefore, this study ignored the results of the nonlinear correlation among various factors;
(3)
The study did not cover the entire quarantine period, focusing only on the first month;
(4)
The sample size of this survey was not large enough, which may lead to some differences between the research conclusion and the real situation.
The above deficiencies need to addressed in subsequent work.

5. Conclusions

In this study, through the analysis and comparison of the questionnaires collected from college students isolated in their dormitory due to the pandemic, the following conclusions were obtained:
During the isolation period, the most common environmental adjustment behavior of college students in the dormitory was to open the window and curtains, and turn on the light, to provide ventilation and supplement the light.
Isolated college students were more likely to feel unneutral in the temperature and lighting environments, for which more attention should be paid to the improvement of these two environments. The environmental sensation of isolated college students varies in many aspects, such as gender, dorm orientation, and the number of cohabiting individuals.
The most common psychological problems associated with isolation were poor sleep quality and poor mental clarity. In general, depression was more likely to appear than anxiety. With the increase in isolation time, the overall psychological state of isolated college students became worse. Compared by gender, the male psychological state during isolation was generally worse than females.
There was a strong correlation between the participant’s evaluation of the temperature and humidity environments and their psychological state. The participants’ comfort level with the indoor environment was negatively correlated with their psychological anxiety and depression. With the increase of time in isolation, the most significant factor related to mental state changed from temperature sensation to sound sensation. Furthermore, compared with females, the male psychological state was more significantly correlated with the temperature and lighting sensations.
College students isolated in their dormitory were more likely to be affected by bad emotions than others, so reasonable psychological intervention is indispensable. It is significant to create a comfortable isolated environment. Keeping the temperature, humidity, and light intensity within the comfortable range is helpful to maintain the good psychological condition of the isolation people. Meanwhile, isolated college students can relieve their bad moods by listening to music, opening windows, and listening to the sounds of nature.
This study can provide suggestions and references for the improvement of the indoor environment and mental health of people in isolation and other similar situations, such as polar researchers, space flight crew, and sailors.

Author Contributions

Conceptualization, H.M. and H.Y.; data curation, H.M.; formal analysis, Y.T.; funding acquisition, H.M. and H.Y.; investigation, L.Z.; methodology, Y.T.; resources, H.Y.; software, H.M.; supervision, H.Y.; validation, H.M., K.Z. and M.L.; visualization, K.Z.; writing—original draft, H.M.; writing—review & editing, H.Y., Y.T. and M.L. All authors have read and agreed to the published version of the manuscript.

Funding

This research was funded by Science and Technology Commission of Shanghai Municipality grant number 20dz1207201. The APC was funded by National Natural Science Foundation of China grant number 52078355 and 51578386.

Data Availability Statement

The data presented in this study are available upon request from the corresponding author.

Conflicts of Interest

The authors declare no conflict of interest.

References

  1. Jernigan, D.B. Update: Public Health Response to the Coronavirus Disease 2019 Outbreak-United States, February 24, 2020. Morb. Mortal. Wkly. Rep. 2020, 69, 216–219. [Google Scholar] [CrossRef] [PubMed]
  2. Chen, S.; Yang, J.; Yang, W.; Wang, C.; Bärnighausen, T. COVID-19 control in China during mass population movements at New Year. Lancet 2020, 395, 764–766. [Google Scholar] [CrossRef]
  3. Prem, K.; Liu, Y.; Russell, T.W.; Kucharski, A.J.; Eggo, R.M.; Davies, N.; Flasche, S.; Clifford, S.; Pearson, C.A.B.; Munday, J.D.; et al. The effect of control strategies to reduce social mixing on outcomes of the COVID-19 epidemic in Wuhan, China: A modelling study. Lancet Public Health 2020, 5, e261–e270. [Google Scholar] [CrossRef] [PubMed]
  4. Ryu, S.; Gao, H.; Wong, J.Y.; Shiu, E.; Cowling, B.J. Nonpharmaceutical Measures for Pandemic Influenza in Nonhealthcare Settings-International Travel-Related Measures. Emerg. Infect. Dis. 2020, 26, 961–966. [Google Scholar] [CrossRef] [PubMed]
  5. Dong, Z.; Zhao, K.; Ren, M.; Ge, J.; Chan, I.Y.S. The impact of space design on occupants’ satisfaction with indoor environment in university dormitories. Build. Environ. 2022, 218, 109143. [Google Scholar] [CrossRef]
  6. Ortiz, M.A.; Bluyssen, P.M. Profiling office workers based on their self-reported preferences of indoor environmental quality and psychosocial comfort at their workplace during COVID-19. Build. Environ. 2022, 211, 108742. [Google Scholar] [CrossRef]
  7. Fanger, P.O.; Breum, N.O.; Jerking, E. Can colour and noise influence man’s thermal comfort? Ergonomics 1977, 20, 11–18. [Google Scholar] [CrossRef]
  8. Wargocki, P.; Wyon, D.P.; Sundell, J.; Clausen, G.; Fanger, P.O. The effects of outdoor air supply rate in an office on perceived air quality, sick building syndrome (SBS) symptoms and productivity. Indoor Air 2000, 10, 222–236. [Google Scholar] [CrossRef]
  9. Lai, J.H.K. Perceived Importance of the Quality of the Indoor Environment in Commercial Buildings. Indoor Built Environ. 2007, 16, 311–321. [Google Scholar] [CrossRef]
  10. Ricciardi, P.; Buratti, C. Environmental quality of university classrooms: Subjective and objective evaluation of the thermal, acoustic, and lighting comfort conditions. Build. Environ. 2018, 127, 23–26. [Google Scholar] [CrossRef]
  11. Torresin, S.; Pernigotto, G.; Cappelletti, F.; Gasparella, A. Combined effects of environmental factors on human perception and objective performance: A review of experimental laboratory works. Indoor Air 2018, 28, 525–538. [Google Scholar] [CrossRef]
  12. He, Y.; Li, N.; Peng, J.; Zhang, W.; Li, Y. Field study on adaptive comfort in air conditioned dormitories of university with hot-humid climate in summer. Energy Build. 2016, 119, 1–12. [Google Scholar] [CrossRef]
  13. ASHRAE GUIDELINE 10 ADD A, B, C AND D-2014; Interactions Affecting the Achievement of Acceptable Indoor Environments. ASHRAE Inc.: Tullie Circle NE Atlanta, GA, USA, 2014.
  14. Humphreys, M.A. Quantifying occupant comfort: Are combined indices of the indoor environment practicable? Build. Res. Inf. 2005, 33, 317–325. [Google Scholar] [CrossRef]
  15. Wong, L.T.; Mui, K.W.; Hui, P.S. A multivariate-logistic model for acceptance of indoor environmental quality (IEQ) in offices. Build. Environ. 2008, 43, 1–6. [Google Scholar] [CrossRef]
  16. Frontczak, M.; Schiavon, S.; Goins, J.; Arens, E.; Zhang, H.; Wargocki, P. Quantitative relationships between occupant satisfaction and satisfaction aspects of indoor environmental quality and building design. Indoor Air 2012, 22, 119–131. [Google Scholar] [CrossRef]
  17. Kim, J.; de Dear, R. Nonlinear relationships between individual IEQ factors and overall workspace satisfaction. Build. Environ. 2012, 49, 33–40. [Google Scholar] [CrossRef]
  18. Al Horr, Y.; Arif, M.; Kaushik, A.; Mazroei, A.; Katafygiotou, M.; Elsarrag, E. Occupant productivity and office indoor environment quality: A review of the literature. Build. Environ. 2016, 105, 369–389. [Google Scholar] [CrossRef]
  19. Šujanová, P.; Rychtáriková, M.; Mayor, T.S.; Hyder, A. A Healthy, Energy-Efficient and Comfortable Indoor Environment, a Review. Energies 2019, 12, 1414. [Google Scholar] [CrossRef]
  20. Hoisington, A.J.; Stearns-Yoder, K.A.; Schuldt, S.J.; Beemer, C.J.; Maestre, J.P.; Kinney, K.A.; Postolache, T.T.; Lowry, C.A.; Brenner, L.A. Ten questions concerning the built environment and mental health. Build. Environ. 2019, 155, 58–69. [Google Scholar] [CrossRef]
  21. Bluyssen, P.M.; Janssen, S.; van den Brink, L.H.; de Kluizenaar, Y. Assessment of wellbeing in an indoor office environment. Build. Environ. 2011, 46, 2632–2640. [Google Scholar] [CrossRef]
  22. Li, Z.; Zhang, Q.; Kazanci, O.B.; Fan, F.; Olesen, B.W. Investigation of group differences in human perceptions of indoor environment in open-plan offices in a severe cold region. Build. Environ. 2022, 213, 108855. [Google Scholar] [CrossRef]
  23. Mahmud, S.; Hossain, S.; Muyeed, A.; Islam, M.M.; Mohsin, M. The global prevalence of depression, anxiety, stress, and, insomnia and its changes among health professionals during COVID-19 pandemic: A rapid systematic review and meta-analysis. Heliyon 2021, 7, e07393. [Google Scholar] [CrossRef] [PubMed]
  24. Johns, G.; Samuel, V.; Freemantle, L.; Lewis, J.; Waddington, L. The global prevalence of depression and anxiety among doctors during the COVID-19 pandemic: Systematic review and meta-analysis. J. Affect. Disord. 2022, 298, 431–441. [Google Scholar] [CrossRef] [PubMed]
  25. Cénat, J.M.; Blais-Rochette, C.; Kokou-Kpolou, C.K.; Noorishad, P.-G.; Mukunzi, J.N.; McIntee, S.-E.; Dalexis, R.D.; Goulet, M.-A.; Labelle, P.R. Prevalence of symptoms of depression, anxiety, insomnia, posttraumatic stress disorder, and psychological distress among populations affected by the COVID-19 pandemic: A systematic review and meta-analysis. Psychiatry Res. 2021, 295, 113599. [Google Scholar] [CrossRef] [PubMed]
  26. Kang, L.; Li, Y.; Hu, S.; Chen, M.; Yang, C.; Yang, B.X.; Wang, Y.; Hu, J.; Lai, J.; Ma, X.; et al. The mental health of medical workers in Wuhan, China dealing with the 2019 novel coronavirus. Lancet Psychiatry 2020, 7, e14. [Google Scholar] [CrossRef]
  27. Wang, C.; Pan, R.; Wan, X.; Tan, Y.; Xu, L.; Ho, C.S.; Ho, R.C. Immediate Psychological Responses and Associated Factors during the Initial Stage of the 2019 Coronavirus Disease (COVID-19) Epidemic among the General Population in China. Int. J. Environ. Res. Public Health 2020, 17, 1729. [Google Scholar] [CrossRef]
  28. Qiu, J.; Shen, B.; Zhao, M.; Wang, Z.; Xu, Y. A nationwide survey of psychological distress among Chinese people in the COVID-19 epidemic: Implications and policy recommendations. Gen. Psychiatry 2020, 33, 3. [Google Scholar] [CrossRef]
  29. Cénat, J.M.; Dalexis, R.D. The Complex Trauma Spectrum During the COVID-19 Pandemic: A Threat for Children and Adolescents’ Physical and Mental Health. Psychiatry Res. 2020, 293, 113473. [Google Scholar] [CrossRef]
  30. Liu, Y.; Chen, H.; Zhang, N.; Wang, X.; Fan, Q.; Zhang, Y.; Huang, L.; Hu, B.; Li, M. Anxiety and depression symptoms of medical staff under COVID-19 epidemic in China. J. Affect. Disord. 2021, 278, 144–148. [Google Scholar] [CrossRef] [PubMed]
  31. Hellewell, J.; Abbott, S.; Gimma, A.; Bosse, N.I.; Jarvis, C.I.; Russell, T.W.; Munday, J.D.; Kucharski, A.J.; Edmunds, W.J.; Sun, F.; et al. Feasibility of controlling COVID-19 outbreaks by isolation of cases and contacts. Lancet Glob. Health 2020, 8, e488–e496. [Google Scholar] [CrossRef]
  32. Reynolds, D.L.; Garay, J.R.; Deamond, S.L.; Moran, M.K.; Gold, W.; Styra, R. Understanding, compliance and psychological impact of the SARS quarantine experience. Epidemiol. Infect. 2008, 136, 997–1007. [Google Scholar] [CrossRef]
  33. Maunder, R.; Hunter, J.; Vincent, L.; Bennett, J.; Peladeau, N.; Leszcz, M.; Sadavoy, J.; Verhaeghe, L.M.; Steinberg, R.; Mazzulli, T. The immediate psychological and occupational impact of the 2003 SARS outbreak in a teaching hospital. Can. Med. Assoc. J. 2003, 168, 1245–1251. [Google Scholar]
  34. Bai, Y.; Lin, C.C.; Lin, C.Y.; Chen, J.Y.; Chue, C.M.; Chou, P. Survey of stress reactions among health care workers involved with the SARS outbreak. Psychiatric Serv. 2004, 55, 1055–1057. [Google Scholar] [CrossRef] [PubMed]
  35. Jeong, H.; Yim, H.W.; Song, Y.J.; Ki, M.; Min, J.A.; Cho, J.; Chae, J.H. Mental health status of people isolated due to Middle East Respiratory Syndrome. Epidemiol. Health 2016, 38, e2016048. [Google Scholar] [CrossRef] [PubMed]
  36. Hawryluck, L.; Gold, W.L.; Robinson, S.; Pogorski, S.; Styra, R. SARS Control and Psychological Effects of Quarantine, Toronto, Canada. Emerging Infect. Dis. 2004, 10, 1206–1212. [Google Scholar] [CrossRef]
  37. Charles, S.T.; Piazza, J.R.; Mogle, J.; Sliwinski, M.J.; Almeida, D.M. The Wear and Tear of Daily Stressors on Mental Health. Psychol. Sci. 2013, 24, 733–741. [Google Scholar] [CrossRef] [PubMed]
  38. Chen, L.; Zhao, H.; Razin, D.; Song, T.; Wu, Y.; Ma, X.; HuerxidaAji; Wang, G.; Wang, M.; Yan, L. Anxiety levels during a second local COVID-19 pandemic breakout among quarantined people: A cross sectional survey in China. Psychiatry Res. 2021, 135, 37–46. [Google Scholar] [CrossRef]
  39. Gan, Y.; Ma, J.; Wu, J.; Chen, Y.; Zhu, H.; Hall, B.J. Immediate and Delayed Psychological Effects of Province-wide Lockdown and Personal Quarantine during the COVID-19 Outbreak in China. Psychol. Med. 2020, 52, 1321–1332. [Google Scholar] [CrossRef]
  40. Brooks, S.K.; Webster, R.K.; Smith, L.E.; Woodland, L.; Wessely, S.; Greenberg, N.; Rubin, G.J. The psychological impact of quarantine and how to reduce it: Rapid review of the evidence. Lancet 2020, 395, 912–920. [Google Scholar] [CrossRef]
  41. Smith, L.E.; Amlȏt, R.; Lambert, H.; Oliver, I.; Robin, C.; Yardley, L.; Rubin, G.J. Factors associated with adherence to self-isolation and lockdown measures in the UK: A cross-sectional survey. Public Health 2020, 187, 41–52. [Google Scholar] [CrossRef]
  42. Fancourt, D.; Steptoe, A.; Bu, F. Trajectories of anxiety and depressive symptoms during enforced isolation due to COVID-19 in England: A longitudinal observational study. Lancet Psychiatry 2021, 8, 141–149. [Google Scholar] [CrossRef] [PubMed]
  43. Shevlin, M.; Mcbride, O.; Murphy, J.; Miller, J.G.; Bentall, R. Anxiety, Depression, Traumatic Stress, and COVID-19 Related Anxiety in the UK General Population During the COVID-19 Pandemic. BJPsych Open 2020, 6, 158. [Google Scholar] [CrossRef]
  44. Saunders, R.; Buckman JE, J.; Fonagy, P.; Fancourt, D. Understanding different trajectories of mental health across the general population during the COVID-19 pandemic. Psychol. Med. 2021, 52, 4049–4057. [Google Scholar] [CrossRef]
  45. Juhl, A.A.; Murielle, M.; Herranz, B.J.J.; Mégane, H.; Tarik, E.A.; Maria, M. Symptoms of anxiety/depression during the COVID-19 pandemic and associated lockdown in the community: Longitudinal data from the TEMPO cohort in France. BMC Psychiatry 2021, 21, 381. [Google Scholar] [CrossRef]
  46. Sachser, C.; Olaru, G.; Pfeiffer, E.; Brähler, E.; Clemens, V.; Rassenhofer, M.; Witt, A.; Fegert, J.M. The immediate impact of lockdown measures on mental health and couples’ relationships during the COVID-19 pandemic—Results of a representative population survey in Germany. Soc. Sci. Med. 2021, 278, 113954. [Google Scholar] [CrossRef]
  47. Auerbach, R.P.; Mortier, P.; Ronny, B.; Jordi, A.; Corina, B.; Pim, C.; Koen, D.; Ebert, D.D.; Greif, G.J.; Penelope, H.; et al. WHO World Mental Health Surveys International College Student Project: Prevalence and distribution of mental disorders. J. Abnorm. Psychol. 2018, 127, 623–638. [Google Scholar] [CrossRef] [PubMed]
  48. Liu, M.; Zhao, S.; Li, J. Associations among perceived built environment, attitudes, walking behavior, and physical and mental state of college students during COVID-19. Travel Behav. Soc. 2022, 28, 170–180. [Google Scholar] [CrossRef]
  49. Cao, W.; Fang, Z.; Hou, G.; Han, M.; Xu, X.; Dong, J.; Zheng, J. The psychological impact of the COVID-19 epidemic on college students in China. Psychiatry Res. 2020, 287, 112934. [Google Scholar] [CrossRef]
  50. Klee, L.; Fabrice, A.; Eisenburger, N.; Feddern, S.; Gabriel, C.; Kossow, A.; Niessen, J.; Schmidt, N.; Wiesmüller, G.A.; Grüne, B.; et al. Coping strategies during legally enforced quarantine and their association to psychological distress level: A cross-sectional study. Public Health 2022, 209, 52–60. [Google Scholar] [CrossRef]
  51. Rajkumar, E.; Rajan, A.M.; Daniel, M.; Lakshmi, R.; John, R.; George, A.J.; Abraham, J.; Varghese, J. The psychological impact of quarantine due to COVID-19: A systematic review of risk, protective factors and interventions using socio-ecological model framework. Heliyon 2022, 8, e09765. [Google Scholar] [CrossRef] [PubMed]
  52. ANSI/ASHRAE Standard 55-2017; Thermal Environmental Conditions for Human Occupancy. ASHRAE Inc.: Tullie Circle NE Atlanta, GA, USA, 2017.
  53. Gagge, A.P. Introduction to Thermal Comfort; INSERM: Paris, France, 1997. [Google Scholar]
  54. Fanger, P.O. Assessment of man’s thermal comfort in practice. Br. J. Ind. Med. 1973, 30, 313–324. [Google Scholar] [CrossRef] [PubMed]
  55. Ogbonna, A.C.; Harris, D.J. Thermal comfort in sub-Saharan Africa: Field study report in Jos-Nigeria. Appl. Energy 2008, 85, 1–11. [Google Scholar] [CrossRef]
  56. Shahzad, S.; Brennan, J.; Theodossopoulos, D.; Calautit, J.K.; Hughes, B.R. Does a neutral thermal sensation determine thermal comfort? Build Serv. Eng. Res. Technol. 2018, 39, 183–195. [Google Scholar] [CrossRef]
  57. Morganti, A.; Brambilla, A.; Aguglia, A.; Amerio, A.; Miletto, N.; Parodi, N.; Porcelli, C.; Odone, A.; Costanza, A.; Signorelli, C.; et al. Effect of Housing Quality on the Mental Health of University Students during the COVID-19 Lockdown. Int. J. Environ. Res. Public Health 2022, 19, 2918. [Google Scholar] [CrossRef]
  58. Dalton, B.H.; Behm, D.G. Effects of noise and music on human and task performance: A systematic review. Occup. Ergon. 2007, 7, 143–152. [Google Scholar] [CrossRef]
  59. Haselhoff, T.; Lawrence, B.; Hornberg, J.; Ahmed, S.; Sutcliffe, R.; Gruehn, D.; Moebus, S. The acoustic quality and health in urban environments (SALVE) project: Study design, rationale and methodology. Appl. Acoust. 2022, 188, 108538. [Google Scholar] [CrossRef]
  60. Jiang, B.; Xu, W.; Ji, W.; Kim, G.; Pryor, M.; Sullivan, W.C. Impacts of nature and built acoustic-visual environments on human’s multidimensional mood states: A cross-continent experiment. J. Environ. Psychol. 2021, 77, 101659. [Google Scholar] [CrossRef]
  61. Dzhambov, A.M.; Lercher, P.; Stoyanov, D.; Petrova, N.; Novakov, S.; Dimitrova, D.D. University Students’ Self-Rated Health in Relation to Perceived Acoustic Environment during the COVID-19 Home Quarantine. Int. J. Environ. Res. Public Health 2021, 18, 2538. [Google Scholar] [CrossRef]
  62. Waheeb, M.I.; Hemeida, F.A. Study of natural ventilation and daylight in a multi-storey residential building to address the problems of COVID-19. Energy Rep. 2022, 8, 863–880. [Google Scholar] [CrossRef]
  63. Gil-Baez, M.; Lizana, J.; Becerra Villanueva, J.A.; Molina-Huelva, M.; Serrano-Jimenez, A.; Chacartegui, R. Natural ventilation in classrooms for healthy schools in the COVID era in Mediterranean climate. Build. Environ. 2021, 206, 108345. [Google Scholar] [CrossRef]
  64. Monge-Barrio, A.; Bes-Rastrollo, M.; Dorregaray-Oyaregui, S.; González-Martínez, P.; Martin-Calvo, N.; López-Hernández, D.; Arriazu-Ramos, A.; Sánchez-Ostiz, A. Encouraging natural ventilation to improve indoor environmental conditions at schools. Case studies in the north of Spain before and during COVID. Energy Build. 2022, 254, 111567. [Google Scholar] [CrossRef]
  65. Reshetnikov, V.; Mitrokhin, O.; Belova, E.; Mikhailovsky, V.; Mikerova, M.; Alsaegh, A.; Yakushina, I.; Royuk, V. Indoor Environmental Quality in Dwellings and Lifestyle Behaviors during the COVID-19 Pandemic: Russian Perspective. Int. J. Environ. Res. Public Health 2021, 18, 5975. [Google Scholar] [CrossRef] [PubMed]
  66. Batool, A.; Rutherford, P.; Mcgraw, P.V.; Ledgeway, T.; Altomonte, S. Window Views: Difference of Perception during the COVID-19 Lockdown. LEUKOS 2021, 17, 380–390. [Google Scholar] [CrossRef]
  67. Torresin, S.; Albatici, R.; Aletta, F.; Babich, F.; Oberman, T.; Kang, J. Associations between indoor soundscapes, building services and window opening behaviour during the COVID-19 lockdown. Build. Serv. Eng. Res. Technol. 2022, 43, 225–240. [Google Scholar] [CrossRef] [PubMed]
  68. Akbari, P.; Yazdanfar, S.-A.; Hosseini, S.-B.; Norouzian-Maleki, S. Housing and mental health during outbreak of COVID-19. J. Build. Eng. 2021, 43, 102919. [Google Scholar] [CrossRef]
  69. Dzhambov, A.M.; Lercher, P.; Browning, M.; Stoyanov, D.; Petrova, N.; Novakov, S.; Dimitrova, D.D. Does greenery experienced indoors and outdoors provide an escape and support mental health during the COVID-19 quarantine? Environ. Res. 2021, 196, 110420. [Google Scholar] [CrossRef]
  70. Spano, G.; D’Este, M.; Giannico, V.; Elia, M.; Cassibba, R.; Lafortezza, R.; Sanesi, G. Association between indoor-outdoor green features and psychological health during the COVID-19 lockdown in Italy: A cross-sectional nationwide study. Urban For. Urban Green. 2021, 62, 127156. [Google Scholar] [CrossRef]
  71. Henry, B.; Rajesh, B.; Marc, S.; Prashant, K.; Ishanki, D.M.; Panagiotis, D.; Allen, H.; Yyanis, J.; MarcoFelipe, K.; Oleksiy, K.; et al. The ventilation of buildings and other mitigating measures for COVID-19: A focus on wintertime. Proc. Math. Phys. Eng. Sci. 2021, 477, 20210855. [Google Scholar] [CrossRef]
  72. Bergefurt, L.; Weijs-Perrée, M.; Appel-Meulenbroek, R.; Arentze, T.; de Kort, Y. Satisfaction with activity-support and physical home-workspace characteristics in relation to mental health during the COVID-19 pandemic. J. Environ. Psychol. 2022, 81, 101826. [Google Scholar] [CrossRef]
  73. Wyon, D.P.; Andersen, I.; Lundqvist, G.R. Spontaneous magnitude estimation of thermal discomfort during changes in the ambient temperature. J. Hyg. 1972, 70, 203–221. [Google Scholar] [CrossRef]
  74. Nakano, J.; Tanabe, S.-I.; Kimura, K.-I. Differences in perception of indoor environment between Japanese and non-Japanese workers. Energy Build 2002, 34, 615–621. [Google Scholar] [CrossRef]
  75. Zhang, X.; Chang, W. Investigation on Home Quarantine of Students in Military Medical University During COVID-19 Outbreak. J. Chengdu Med. Coll. 2020, 15, 273–278. [Google Scholar]
  76. Khan, A.H.; Sultana, M.S.; Hossain, S.; Hasan, M.T.; Ahmed, H.U.; Sikder, M.T. The impact of COVID-19 pandemic on mental health & wellbeing among home-quarantined Bangladeshi students: A cross-sectional pilot study. J. Affect. Disord. 2020, 277, 121–128. [Google Scholar] [CrossRef] [PubMed]
  77. Huang, C.; Chen, J.; Feng, H.; Chen, W.; Chen, S.; Shan, Y.; Tang, Z. Investigation and analysis of influence of isolation mode on psychological health of COVID-19 pneumonia residents’ during epidemic prevention. China Mod. Med. 2021, 28, 195–197. [Google Scholar]
  78. Lei, L.; Huang, X.; Zhang, S.; Yang, J.; Yang, L.; Xu, M. Comparison of prevalence and associated factors of anxiety and depression among people affected by versus people unaffected by quarantine during the COVID-19 epidemic in southwestern China. Med. Sci. Monit. 2020, 26, e924609. [Google Scholar] [CrossRef]
  79. Baiano, C.; Zappullo, I.; The LabNPEE Group; Conson, M. Tendency to Worry and Fear of Mental Health during Italy’s COVID-19 Lockdown. Int. J. Environ. Res. 2020, 17, 5928. [Google Scholar] [CrossRef]
  80. Frijters, P.; Lalji, C.; Pakrashi, D. Daily weather only has small effects on wellbeing in the US. J. Econ. Behav. Organ. 2020, 176, 747–762. [Google Scholar] [CrossRef]
  81. An, M.; Colarelli, S.M.; O’Brien, K.; Boyajian, M.E. Why We Need More Nature at Work: Effects of Natural Elements and Sunlight on Employee Mental Health and Work Attitudes. PLoS ONE 2016, 11, e0155614. [Google Scholar] [CrossRef]
  82. Burdett, A.; Davillas, A.; Etheridge, B. Weather, mental health, and mobility during the first wave of the COVID-19 pandemic. Health Econ. 2021, 30, 2296–2306. [Google Scholar] [CrossRef]
Figure 1. The opening ratio of (a) a balcony door, (b) window, (c) curtain, (d) dormitory light, and (e) table lamp of people in isolation during different periods and in different weather conditions.
Buildings 13 01065 g001
Figure 2. Environmental sensation vote.
Buildings 13 01065 g002
Figure 3. Environmental satisfaction rate and environmental expectation vote distribution.
Buildings 13 01065 g003
Figure 4. Distribution of the individual psychological state scores of (a) isolated and (b) free-moving participants.
Buildings 13 01065 g004
Figure 5. SAS and SDS score distribution of (a) isolated and (b) free-moving participants.
Buildings 13 01065 g005
Figure 6. Results of the correlation analysis between the individual environmental adjusting behavior and environmental perception.
Buildings 13 01065 g006
Figure 7. Results of the correlation analysis between the environmental perception and psychological state.
Buildings 13 01065 g007
Figure 8. Results of the correlation analysis between environmental comfort and psychological state.
Buildings 13 01065 g008
Figure 9. Results of the correlation analysis between environmental sensation and psychological state during the (a) early and (b) late isolation stages.
Buildings 13 01065 g009
Figure 10. Results of the correlation analysis between the environmental sensation and psychological state of (a) males and (b) females.
Buildings 13 01065 g010
Figure 11. Environmental sensation vote in different periods on (a) sunny, (b) cloudy, (c) overcast, and (d) rainy days.
Buildings 13 01065 g011
Figure 12. Environmental sensation vote of the different genders and the chi-square test result.
Buildings 13 01065 g012
Figure 13. Environmental sensation vote of different room orientations and the chi-square test results.
Buildings 13 01065 g013
Figure 14. Isolation time differences in (a) the mean SAS and SDS scores and (b) the proportion of moderate and severe symptoms.
Buildings 13 01065 g014
Figure 15. Gender differences in psychological state.
Buildings 13 01065 g015
Figure 16. Weather differences in the psychological state.
Buildings 13 01065 g016
Table 1. Outdoor meteorological parameters (air temperature/relative humidity).
WeatherMorningForenoonNoonAfternoonEveningNight
6:00–8:008:00–11:0011:00–14:0014:00–17:0017:00–19:0019:00–22:00
Sunny33.1 °C/26%29.4 °C/40%22.4 °C/74%16.4 °C/83%17.7 °C/73%16.5 °C/80%
Cloudy28.2 °C/22%24.4 °C/32%20.5 °C/58%18.3 °C/69%17.1 °C/76%16.7 °C/78%
Overcast13.6 °C/97%12.9 °C/100%13.1 °C/93%12.6 °C/96%14.4 °C/94%14.3 °C/94%
Rainy20.9 °C/78%18.7 °C/84%13 °C/100%14.4 °C/100%13.2 °C/99%13.8 °C/94%
Table 2. Scales of the subjective perceptions.
ScaleSensationSatisfactionExpectation
TemperatureHumiditySoundLightingAllTemperatureHumiditySoundLighting
−2Very coldVery dryVery quietVery dark--
−1ColdDryQuietDark-CoolerDrierQuieterDarker
0NeutralNeutralNeutralNeutralUnsatisfiedRemain unchanged
1HotHumidNoisyBrightSatisfiedHotterMore humidNoisierBrighter
2Very hotVery humidVery noisyVery bright--
Table 3. Content and scale of the psychological questionnaire.
Code WordContentSASSDSScales
1234
Nervous I feel nervous and anxious -NeverSlightSeriousSevere
Weak I feel weak and tired at present -
Breath I feel short of breath -
Heart I feel my heart beating faster than usual
Sleep I fell asleep slowly last night and the quality of my sleep was poor
Glum I feel glum and low -
Head My head is muddier than usual -
Interest I am not interested in the things I am usually interested in -
Table 4. Sample information.
GenderOrientationNumber of Occupants
MaleFemaleSouthNorth1234
Number3843134782191123240423
Table 5. Ratio of positive and negative votes according to the different genders.
MaleFemale
Temperature1.7:11.1:1
Humidity2.8:12.5:1
Sound2:11.8:1
Lighting0.25:10.23:1
Disclaimer/Publisher’s Note: The statements, opinions and data contained in all publications are solely those of the individual author(s) and contributor(s) and not of MDPI and/or the editor(s). MDPI and/or the editor(s) disclaim responsibility for any injury to people or property resulting from any ideas, methods, instructions or products referred to in the content.