Abstract
This study investigates the affecting pattern of cooling rates on the physical and mechanical properties of granite at high temperature. The different cooling rates are realized by cooling the heated granite specimens in the air at room temperature, −60 °C, and −100 °C. Slow cooling in the unplugged furnace is also performed on an additional set of specimens as a reference group. Physical and mechanical tests are performed on the granite specimens after thermal shock treatments. The results indicate a decreasing trend of the dry density, P-wave velocity, strength, and fracture toughness, and an increasing trend of the porosity, as the heating level or the cooling rate ascends. The microscopic observation on the fracture surface of the tested specimens manifests the deteriorating effect of thermal shock with a higher cooling rate, where the transition from trans-granular and intra-granular fracturing to intergranular fracturing serves to explain the variation pattern of the properties obtained in the lab tests.
1. Introduction
In rock engineering applications in deep strata such as deep mining, geothermal exploitation, and disposal of radioactive nuclear waste, the influence of high temperature on the intactness of the load-bearing rocks cannot be neglected [1,2,3,4]. It is widely acknowledged that the thermal stress due to high temperature induces thermal cracks, which pose a threat to the safety of the surrounding rocks. So far, various efforts have been made to characterize the affecting pattern of high temperature on the rocks’ mechanical response. For example, mechanical tests have been performed on heated rock samples cooled slowly to room temperature [5] or on rock samples directly at high temperature [6,7,8,9,10]. Researchers have also adopted the test method involving cyclic heating and cooling treatments on rock samples [11,12,13], where the induced damage in this case is often attributed to the mechanism of thermal fatigue [14]. It has been found that high temperature tends to increase the rock’s porosity [15,16,17,18] and permeability [19,20,21,22,23], and decrease P-wave velocity [24,25,26,27], dry density [28], compressive/tensile strength [29,30,31], and elastic modulus [32,33,34].
In the practice of deep rock engineering, rapid temperature changes can also occur in the high-temperature rock masses. For instance, to exploit the geothermal resources, the enhanced geothermal system (EGS) is usually established, where the thermal energy is transmitted from deep strata to the ground by injecting low-temperature fluid into the hot dry rock (HDR) and pumping high-temperature fluid up after the heat exchange between them. This process involves using low-temperature fluid to fracture the hot dry rock to increase the efficiency of heat exchange in the geothermal reservoir [35]. In this process, massive heat exchange causes rapid changes in temperature in the rock mass and degrades the intactness of the rock matrix. Such events involving rapid temperature change are commonly referred to as thermal shock [14]. In recent years, the phenomenon of thermal shock has attracted attention of researchers in the field of rock mechanics. Brotons et al. [5] studied the influence of two different cooling methods (air and water) on the mechanical properties of limestone heated to temperature of 105 °C to 600 °C. Liu et al. [36] applied thermal shock treatment to granite at 800 °C by means of air cooling and water cooling. They found that the cooling rate was correlated with the compressive strength and the number of cracks inside the rock, and that rapid cooling treatment in water could significantly reduce the strength of rock and produce more cracks. Han et al. [37] performed compression tests on water-cooled sandstone samples heated at 100 °C to 800 °C. The results showed that the elastic modulus and uniaxial compressive strength did not change evidently if the heating level was below 200 °C, but they slowly decreased with the elevation in temperature from 200 °C to 500 °C, and decreased rapidly with ascending temperature from 500 °C to 800 °C. Liquid nitrogen was also adopted as a cooling medium by some researchers, and has proven to be efficient in enhancing the rock’s permeability and degrading its mechanical properties [38,39,40]. Wu et al. [41] conducted Brazilian tests on the heated granite cooled by three methods (inside the furnace, in air, and in water). The results indicated that the tensile strength decreased with the increase in heating temperature (with identical cooling rates) or the increase in cooling rate (with identical heating temperatures). Li et al. [42,43] performed quasi-static and dynamic mechanical tests on heated granite after quick cooling by air and water. The test results indicate that the mechanical properties of the water-cooled rock specimens were significantly weaker than those cooled in air.
In the previous studies, the effect of thermal shock is often compared between different methods (e.g., cooled by air and cooled by water), which tends to invite the influence of different cooling media in addition to the cooling rate. Therefore, it is desired that various cooling rates can be realized through the same cooling medium, so that only the effect of the cooling rate can be revealed without the interference from other factors. In this study, thermal shock treatments are performed using air as the only heat transfer medium, and different cooling rates are achieved by changing the air temperature. A series of experiments are performed to determine the physical properties and mechanical properties of the granite specimens influenced by the thermal shock, including dry density, P-wave velocity, porosity, tensile strength, uniaxial compressive strength, and fracture toughness. Microscopic fracture patterns are also analyzed through scanning electron microscopy (SEM), whereby the damage mechanisms of thermal shock are discussed. The content of this study can provide referential data and practical hints for the stability assessment of rock engineering projects involving high temperatures.
2. Thermal Shock Treatment
2.1. Specimen Characterization
The rock material used in the tests is medium-grained granite quarried from Hunan Province, China. Based on the thin section analysis, the granite contains quartz (45%), potassium feldspar (40%), plagioclase (7%), biotite (6%), chlorite (1%), sericite (1%), and trace amount of apatite, zircon, and opaque minerals (Figure 1). The basic properties of the granite are shown in Table 1, where the data are obtained in accordance with the recommendations of the International Society of Rock Mechanics (ISRM) [44,45,46]. The cylinder-shaped specimens (Φ50 × 100 mm) and disc-shaped specimens (Φ50 × 25 mm) are prepared for the uniaxial compression test (Figure 2a) and Brazilian test (Figure 2b), respectively. The cracked-through Brazilian discs (CSTBD) with the size of Φ75 × 25 mm are prepared for the fracture toughness tests [47,48,49,50], where a prefabricated crack of 25 mm in length and 1 mm in width is cut through the specimen along the diameter direction of the disc (Figure 2c).
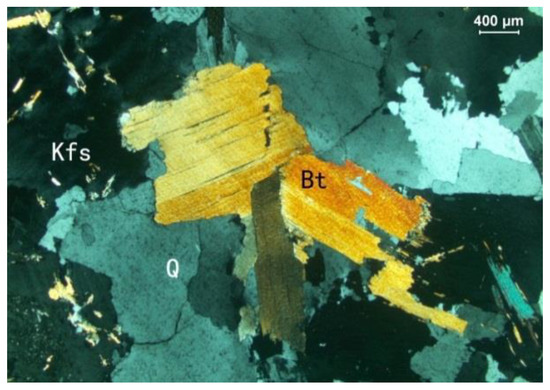
Figure 1.
Photomicrograph of the granite specimen under orthogonal polarization (Q = Quartz; Kfs = Potassium feldspar; Bt = Biotite).

Table 1.
Physical and mechanical properties obtained from granite specimens.
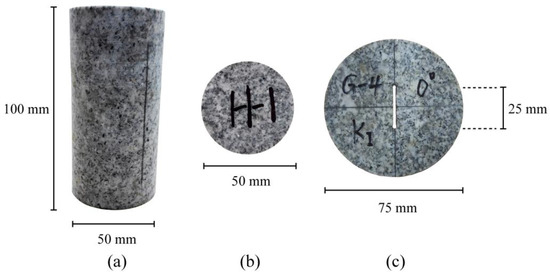
Figure 2.
Granite specimens used in the experiments: (a) cylinder specimen for uniaxial compression tests; (b) disc specimen for Brazilian tests; (c) cracked-through Brazilian discs (CSTBD) specimen for fracture toughness tests.
2.2. Thermal Shock Treatments
In this section, different thermal shock treatments are performed according to the established experimental schemes, where three specimens are used for each group of treatment. The granite specimens are first heated to the target temperatures of 200 °C and 500 °C in a box-type electric furnace (Figure 3a) at a heating rate of 5 °C/min. The preset temperature is kept constant for 2 h to ensure a uniform distribution of temperature inside the specimens. The heated specimens are then cooled in air at different rates: (a) slow cooling inside the unplugged electric furnace; (b) cooling in air at room temperature (approximately 25 °C); (c) rapid cooling at −60 °C inside the ultra-low temperature freezer (Figure 3b); (d) rapid cooling at −100 °C inside the ultra-low temperature freezer (Figure 3b). For the slowly-cooled specimens inside the furnace, the temperature data during cooling is obtained directly from the monitor of the oven. As for the specimens cooled in the open air and inside the freezer, a contact thermocouple thermometer (DT-3891G type produced by Shenzhen Huashengchang Technology Industry Co., Shenzhen, China) is utilized to measure the variation of temperature during cooling as shown in Figure 3c, where the thermocouple conductor is pressed onto the surface of the specimen by a fixing device. In addition, the variation of temperature is recorded automatically with one datum per second at a resolution up to 0.1 °C. An example of the recorded real-time temperature data is illustrated in Figure 3d. Due to the fact that the heat transfer inside the closed freezer is mainly conduction and radiation, and the actual temperature near the specimen is not necessarily precisely −60 °C or −100 °C. Therefore it should be noted that, the expression of “cooling at −60 °C” and “cooling at −100 °C” in this study only indicates that the specimen is cooled with the temperature of the freezer set at −60 °C and −100 °C.
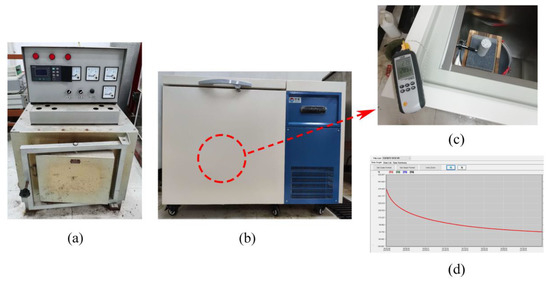
Figure 3.
Thermal shock treatments: (a) box-type electric furnace; (b) ultra-low temperature freezer; (c) cooling process inside the ultra-low temperature freezer with the specimen temperature measured by the contact thermocouple thermometer; (d) the obtained temperature data during cooling.
The obtained temperature profiles of different thermal shock treatments are shown in Figure 4. According to the curves, the cooling rate is not constant during the cooling process. Therefore, to better quantify the thermal shock process, a weighted method is adopted to obtain the average value of the cooling rate [51]:
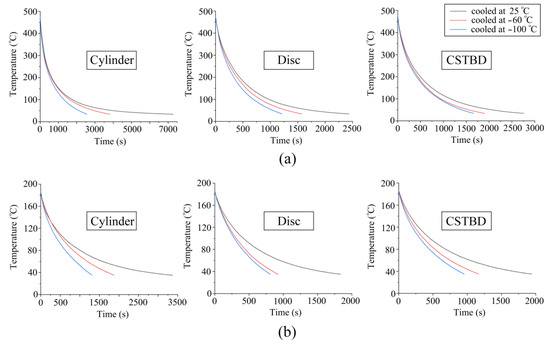
Figure 4.
Temperature profiles of granite specimens during cooling: (a) after heating at 500 °C; (b) after heating at 200 °C.
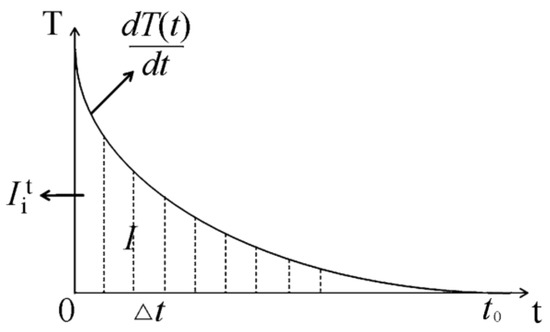
Figure 5.
Differential sketch map of the cooling process.
Table 2.
Cooling rates (°C/min) of specimens in different cooling paths.
3. Laboratory Tests
3.1. Physical Properties of Granite after Thermal Shock
In this section, the porosity, dry density, and P-wave velocity of the granite specimens after thermal shock are examined to characterize the damage to the specimen. In each experimental group, three specimens are tested and the mean value of the properties are analyzed. The P-wave velocity is measured using the SET-CWA-01 ultrasonic detector (Hunan Sine Electronic Technology), and the dry density (ρ) and porosity (n) are obtained by the buoyancy method according to the International Society of Rock Mechanics (ISRM) [44]:
where denotes the volume of the specimen; denotes the grain mass (the solid components of the specimen); denotes the saturated-surface-dry mass; and denotes the saturated-submerged mass. In addition, the porosity growth rate (PGR) is introduced to quantify the damage induced by different thermal shock processes:
where is the average porosity after thermal shock treatment; and is the average porosity before heating. Three samples are measured for each cooling method, and the averaged values of the aforementioned properties are illustrated in Figure 6. It is seen that the dry density has a descending trend as the cooling rate increases (Figure 6a,b). This can be explained that, at the same heating level, the escape of water (e.g., bound water, attached water, etc.) is the same, resulting in a nearly constant mass change [52], and the decrease in dry density is mainly caused by the increase in volume due to the generation and expansion of thermal cracks [53]. Therefore, the varying trend of dry density reflects the aggravation of damage caused by thermal cracking as the cooling rate accelerates. This notion is also in accordance with the decreasing tendency of the P-wave velocity as the cooling rate increases (Figure 6c,d): more thermal cracks are caused in the rock sample at higher cooling rate, which results in a reduced propagation velocity of P wave. According to Figure 6e,f, the porosity growth rate increases with the cooling rate for both heating levels of 500 °C and 200 °C. It is noticed that the growth rate of porosity is negative for the heating temperature of 200 °C (Figure 6f), which indicates that the pores inside the specimen are shrinking after thermal shock under this heating level. The same phenomenon is also observed by Zhang et al. [54] and Vidana et al. [55,56], and is assumed to be the result of the slight expansion of the rock crystals without inducing considerable amount of thermal cracks. Nevertheless, it is assumed that the cooling process causes the microcracks to reopen by contracting the expanded minerals, and higher cooling rates intensify this process. This is supported by the slowly increasing tendency of porosity growth rate as shown in Figure 6f.
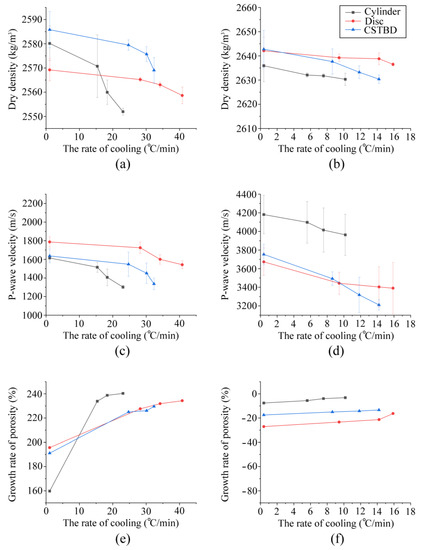
Figure 6.
Variation of physical properties of granite specimens with cooling rates: (a,c,e) after heating at 500 °C; (b,d,f) after heating at 200 °C (error bars represent standard deviation).
3.2. Mechanical Tests
The mechanical tests are executed on the heated granite specimens using the MTS322 servo-controlled rock mechanics test system shown in Figure 7, where the uniaxial compression test and Brazilian test are carried out at a loading rate of 0.15 mm/min, and the fracture toughness test is carried out at a loading rate of 0.2 mm/min. During the loading process, the disc specimens for the Brazilian test and the fracture toughness test are fixed by a clamp apparatus, which ensures the line loading condition without introducing additional external loads (Figure 7). For each experimental group, three specimens are tested and the mean value of the properties are analyzed in this section.
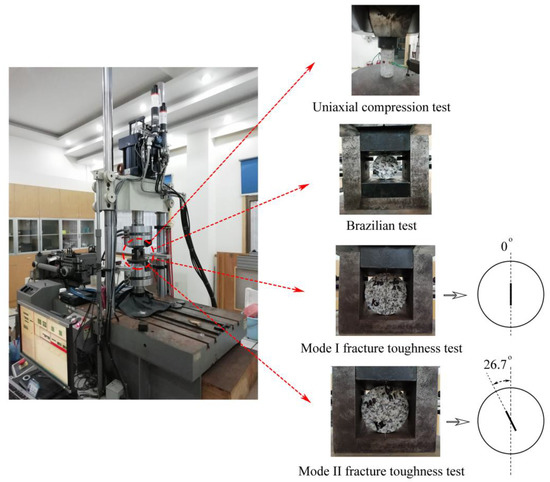
Figure 7.
Mechanical tests on the MTS322 servo-controlled rock mechanics test system.
Based on the test data, the uniaxial compressive strength and tensile strength can be obtained according to Equations (5) and (6), respectively [45,46]:
where denotes the peak compressive load; denotes the initial cross-sectional area of the cylinder specimen; denotes the peak tensile load; and D and t denote the diameter and thickness of the disc specimen, respectively. The cracked-through Brazilian disc (CSTBD) specimens are used in the fracture toughness tests, where Mode I and Mode II stress intensity factors ( and ) can be calculated by the following formulas [47,50]:
where P denotes the peak load; denotes the half-crack length; R denotes the specimen radius; B denotes the thickness of the specimen; and NI and NII are dimensionless coefficients that depend on specimen size and loading direction [57]:
where according to the geometry of the CSTBD specimen used in this study (Figure 2). The coefficients , and (j = 1, 2; i= 1, 2, … n) are given as:
where is the angle between the crack direction and loading direction. The coefficients and (j = 1, 2) are calculated according to the following formulas:
Based on the above equations, the Mode I fracture toughness can be obtained if NII = 0, which corresponds to θ = 0°; and the Mode II fracture toughness can be obtained if NI = 0, which corresponds to θ = 26.7° (Figure 7). The obtained uniaxial compressive strength, tensile strength, and fracture toughness data are listed in Table 3.
Table 3.
Mechanical test results of granite specimens after thermal shock.
The variation trend of the mechanical properties with cooling rates is also illustrated in Figure 8, Figure 9 and Figure 10. It is evidently shown that comparing with fast cooling (thermal shock condition), the slowly-cooled specimens inside the furnace (free from thermal shock) render higher strength values as indicated by Figure 8 and Figure 9. For the specimens subjected to fast cooling, the strength values decrease with the rise of the cooling rate: the uniaxial compressive strength and tensile strength are the highest for specimens cooled at room temperature, followed by those cooled at −60 °C, and the specimens cooled at −100 °C have the lowest strength values. The above pattern applies to both heating levels of 500 °C and 200 °C. It should be noted that, with the same cooling method, both the compressive and tensile strength at 500 °C are far less than 200 °C, which agrees with the previous experiments [41,58]. Similar to the compressive and tensile strength, Mode I and II fracture toughness is also negatively correlated to the cooling rate (Figure 10), where the highest fracture toughness is obtained on specimens cooled slowly in the furnace, while the lowest value is found on specimens cooled at the highest rate. Moreover, the fracture toughness values of the specimens after heating at 500 °C are significantly lower than those at 200 °C. Therefore, a general pattern can be deduced, which is that the mechanical properties of the heated granite decrease with the acceleration of cooling rate, which is in accordance with the variation pattern of physical properties introduced previously.
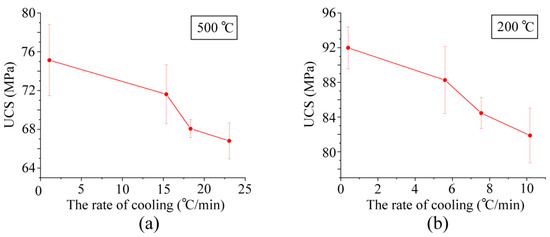
Figure 8.
Variation of uniaxial compressive strength versus cooling rates: (a) after heating at 500 °C; (b) after heating at 200 °C (Error bars denote standard deviation).
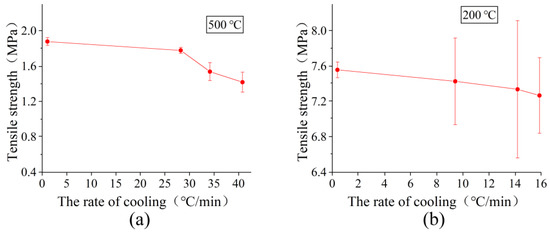
Figure 9.
Variation of tensile strength of granite samples with cooling rates: (a) after heating at 500 °C; (b) after heating at 200 °C (error bars denote standard deviation).
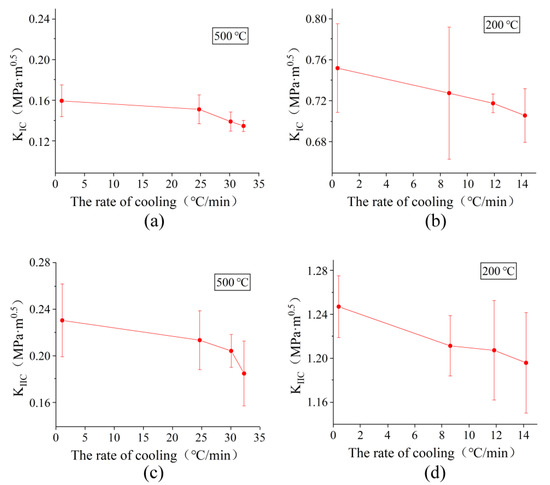
Figure 10.
Fracture toughness of granite samples at different cooling rates: (a,c): heated at 500 °C; (b,d): heated at 200 °C (error bars denote standard deviation).
3.3. SEM Observations
To evaluate the damage caused by different thermal shock processes, the microscopic fracture characteristics of the tested specimens are observed with a scanning electron microscope (SEM). As shown in Figure 11, in general, the fracture of the rock sample is relatively smooth after heating at 200 °C, which reflects the feature of trans-granular and intra-granular fractures. In contrast, after heating at 500 °C, the surface of the sample is rough, and connection of microcracks can be observed (indicated by the arrows in Figure 11). Such a grainy fracture surface reflects the feature of the intergranular fractures, which indicates the loss of bonding between the mineral grains. Therefore, a higher degree of deterioration on the rock matrix is caused at a higher heating level (such as 500 °C) compared with the lower heating level (such as 200 °C). This observation suggests that a higher heating temperature is more likely to destroy the bonding structure between mineral grains, and is in agreement with the above results showing that the physical and mechanical properties of the specimens heated at 500 °C are much more deteriorated than those at 200 °C.
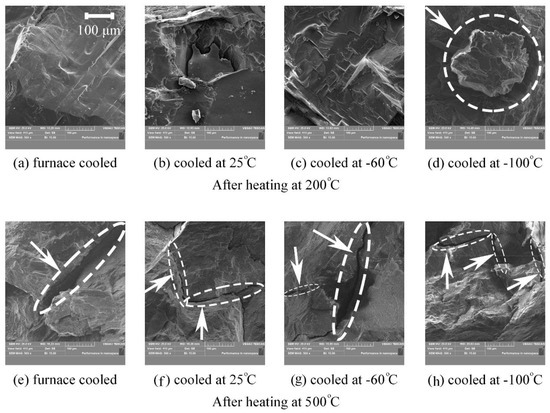
Figure 11.
SEM images illustrating fracture surfaces of granite specimens after thermal shock treatments (magnified 500 times).
It can also be observed that the fracture surface turns rougher as the temperature of the cooling medium decreases (i.e., higher cooling rates). For example, grainy features due to intergranular fractures are also observed on the specimen heated at 200 °C and cooled at air temperature of −100 °C (Figure 11d), which is hardly observed on the specimens cooled at higher temperatures (Figure 11a–c). This pattern also applies for the heating temperature of 500 °C (Figure 11e–h). Therefore, the deteriorating effect of a higher cooling rate in the thermal shock process can also be deduced: at a comparatively lower cooling rate (e.g., Figure 11b), the induced thermal stress is not sufficient to cause substantial damage on the bonding and interlocking between the minerals. As a result, under external load, the fracture can make a clean cut through the minerals, and thus a comparatively smooth fracture surface is formed. While, at a comparatively higher cooling rate (e.g., Figure 11d), the increased thermal stress has damaged the bonding condition between the minerals to an appreciable degree (in the form of microcracks). Therefore, under external load, the fracture tends to take a path through these weakened connections, and thus the grainy and rough fracture surface is formed, which corresponds to a lower level of strength and fracture toughness, as observed in the mechanical tests. This damage condition is also reflected in the fact that both the density and p-wave velocity descend, while the porosity increases at a higher heating temperature or higher cooling rate.
4. Discussion
It is widely acknowledged that a key factor for inducing thermal cracks inside rocks during thermal shock is the temperature gradient [53,59]. Due to the rock’s poor thermal conductivity, when the material near the surface of the rock specimen experiences a fast temperature drop, the material near the center will still be at a much higher temperature, and, therefore, the temperature gradient field is formed [60]. In addition, a difference in cooling rate on the specimen’s surface can induce a different temperature gradient field which corresponds to a different stress field, and thus to damage conditions. Therefore, in this study, various cooling schemes are designed to provide different cooling rates on the surface of the rock specimens. Then the degree of damage is deduced after the subsequent physical/mechanical tests and microscopic observations, and the correlation between the cooling rate and the damage conditions can be finally established. Therefore, analysis of cooling rate as an affecting factor has its novelty and importance in the pursuit of the mechanisms of thermal shock.
The importance of the cooling rate is also reflected in the assumption that it will affect the thermal stress distribution (i.e., damage condition) in the thermal shock process. Upon fast cooling, the temperature difference (temperature gradient) inside the specimen is greater if a higher cooling rate is found at the surface of the rock specimen. Since greater temperature differences can induce larger thermal stress concentrations [61] (i.e., more prone to damage), it is reasonable to deduce that a higher cooling rate tends to increase the degree of damage in the thermal shock process. The experimental results and microscopic observations of this study have successfully verified the above assumptions.
5. Conclusions
The thermal shock treatment with different cooling rates has been successfully achieved using only air as the cooling medium. Physical and mechanical tests are performed on the granite specimens after thermal shock treatments, where the variation pattern of the properties is obtained. The results suggest an evident weakening effect of higher heating temperatures and higher cooling rates on the properties of granite. The microscopic observation on the fracture surface of the heated specimens serves to explain the above variation pattern; higher heating levels tend to induce intergranular fractures by deteriorating the bonding between the minerals. Higher cooling rates can further weaken the bonding of minerals, and thus aggravate the damage within the rock matrix.
It is worth noting that the cooling rate in this study is measured at the surface of the rock specimens. A thorough characterization of the specimen’s inner temperature field is comparatively difficult to realize only through experiments due to the heterogeneous nature of rock materials. Numerical simulations are practical in analyzing the influence of the material heterogeneity and temperature gradient. Future investigations are needed to further clarify the mechanisms of thermal shock by combining efficient experimental schemes with numerical simulations. Analyses on other types of rocks such as granodiorite and sandstone are also necessary, and will be performed in the possible future works.
Author Contributions
Conceptualization, X.L. and T.Y.; methodology, X.L. and M.T.; validation, X.F. and S.H.; formal analysis, X.F.; investigation, X.L.; resources, X.L.; data curation, X.F.; writing—original draft preparation, X.L and X.F.; writing—review and editing, X.L.; visualization, X.L. and X.F.; supervision, M.T.; project administration, T.Y.; funding acquisition, X.L., M.T., and T.Y. All authors have read and agreed to the published version of the manuscript.
Funding
This paper was funded by the National Natural Science Foundation of China (grant number 52274106, 12072376 and 51774325).
Data Availability Statement
The data presented in this study are available on request from the corresponding author.
Conflicts of Interest
The authors declare no conflict of interest.
References
- Weng, L.; Huang, L.; Taheri, A.; Li, X. Rockburst characteristics and numerical simulation based on a strain energy density index: A case study of a roadway in Linglong gold mine, China. Tunn. Undergr. Space Technol. 2017, 69, 223–232. [Google Scholar] [CrossRef]
- Fox, D.B.; Sutter, D.; Beckers, K.F.; Lukawski, M.Z.; Koch, D.L.; Anderson, B.J.; Tester, J.W. Sustainable heat farming: Modeling extraction and recovery in discretely fractured geothermal reservoirs. Geothermics 2013, 46, 42–54. [Google Scholar] [CrossRef]
- Griffiths, L.; Lengliné, O.; Heap, M.J.; Baud, P.; Schmittbuhl, J. Thermal Cracking in Westerly Granite Monitored Using Direct Wave Velocity, Coda Wave Interferometry, and Acoustic Emissions. J. Geophys. Res. Solid Earth 2018, 123, 2246–2261. [Google Scholar] [CrossRef]
- Srinivasan, V.; Hasainar, H.; Singh, T. Experimental study on failure and fracturing attributes of granite after thermal treatments with different cooling conditions. Eng. Geol. 2022, 310, 106867. [Google Scholar] [CrossRef]
- Brotóns, V.; Tomás, R.; Ivorra, S.A.J.C.; Alarcón, J.C. Temperature influence on the physical and mechanical properties of a porous rock: San Julian’s calcarenite. Eng. Geol. 2013, 167, 117–127. [Google Scholar] [CrossRef]
- Yin, T.-B.; Shu, R.-H.; Li, X.-B.; Wang, P.; Liu, X.-L. Comparison of mechanical properties in high temperature and thermal treatment granite. Trans. Nonferrous Met. Soc. China 2016, 26, 1926–1937. [Google Scholar] [CrossRef]
- Shao, S.; Ranjith, P.G.; Wasantha, P.L.P.; Chen, B.K. Experimental and numerical studies on the mechanical behaviour of Australian Strathbogie granite at high temperatures: An application to geothermal energy. Geothermics 2015, 54, 96–108. [Google Scholar] [CrossRef]
- Kumari, W.G.P.; Ranjith, P.G.; Perera, M.S.A.; Shao, S.; Chen, B.K.; Lashin, A.; Al Arifi, N.; Rathnaweera, T.D. Mechanical behaviour of Australian Strathbogie granite under in-situ stress and temperature conditions: An application to geothermal energy extraction. Geothermics 2017, 65, 44–59. [Google Scholar] [CrossRef]
- Dwivedi, R.D.; Goel, R.K.; Prasad, V.V.R.; Sinha, A. Thermo-mechanical properties of Indian and other granites. Int. J. Rock Mech. Min. Sci. 2008, 45, 303–315. [Google Scholar] [CrossRef]
- Zhao, Y.; Wan, Z.; Feng, Z.; Yang, D.; Zhang, Y.; Qu, F. Triaxial compression system for rock testing under high temperature and high pressure. Int. J. Rock Mech. Min. Sci. 2012, 52, 132–138. [Google Scholar] [CrossRef]
- Khanlari, G.; Abdilor, Y. Influence of wet–dry, freeze–thaw, and heat–cool cycles on the physical and mechanical properties of Upper Red sandstones in central Iran. Bull. Eng. Geol. Environ. 2015, 74, 1287–1300. [Google Scholar] [CrossRef]
- Shi, X.; Gao, L.; Wu, J.; Zhu, C.; Chen, S.; Zhuo, X. Effects of Cyclic Heating and Water Cooling on the Physical Characteristics of Granite. Energies 2020, 13, 2136. [Google Scholar] [CrossRef]
- Yin, T.; Li, Q.; Li, X. Experimental investigation on mode I fracture characteristics of granite after cyclic heating and cooling treatments. Eng. Fract. Mech. 2019, 222, 106740. [Google Scholar] [CrossRef]
- Hall, K.; Thorn, C.E. Thermal fatigue and thermal shock in bedrock: An attempt to unravel the geomorphic processes and products. Geomorphology 2014, 206, 1–13. [Google Scholar] [CrossRef]
- Nasseri, M.; Schubnel, A.; Young, R. Coupled evolutions of fracture toughness and elastic wave velocities at high crack density in thermally treated Westerly granite. Int. J. Rock Mech. Min. Sci. 2006, 44, 601–616. [Google Scholar] [CrossRef]
- David, C.; Menéndez, B.; Darot, M. Influence of stress-induced and thermal cracking on physical properties and microstructure of La Peyratte granite. Int. J. Rock Mech. Min. Sci. 1999, 36, 433–448. [Google Scholar] [CrossRef]
- Chaki, S.; Takarli, M.; Agbodjan, W. Influence of thermal damage on physical properties of a granite rock: Porosity, permeability and ultrasonic wave evolutions. Constr. Build. Mater. 2008, 22, 1456–1461. [Google Scholar] [CrossRef]
- Reuschlé, T.; Haore, S.G.; Darot, M. Microstructural control on the elastic properties of thermally cracked granite. Tectonophysics 2003, 370, 95–104. [Google Scholar] [CrossRef]
- Rabczuk, T.; Ren, H. A peridynamics formulation for quasi-static fracture and contact in rock. Eng. Geol. 2017, 225, 42–48. [Google Scholar] [CrossRef]
- Yang, S.Q.; Hu, B. Creep and Long-Term Permeability of a Red Sandstone Subjected to Cyclic Loading After Thermal Treatments. Rock Mech. Rock Eng. 2018, 51, 2981–3004. [Google Scholar] [CrossRef]
- Yang, S.-Q.; Xu, P.; Li, Y.-B.; Huang, Y.-H. Experimental investigation on triaxial mechanical and permeability behavior of sandstone after exposure to different high temperature treatments. Geothermics 2017, 69, 93–109. [Google Scholar] [CrossRef]
- Wang, X.-Q.; Schubnel, A.; Fortin, J.; Guéguen, Y.; Ge, H.-K. Physical properties and brittle strength of thermally cracked granite under confinement. J. Geophys. Res. Solid Earth 2013, 118, 6099–6112. [Google Scholar] [CrossRef]
- Li, M.; Wang, D.; Shao, Z. Experimental study on changes of pore structure and mechanical properties of sandstone after high-temperature treatment using nuclear magnetic resonance. Eng. Geol. 2020, 275, 105739. [Google Scholar] [CrossRef]
- Gautam, P.K.; Dwivedi, R.; Kumar, A.; Kumar, A.; Verma, A.K.; Singh, K.H.; Singh, T.N. Damage Characteristics of Jalore Granitic Rocks After Thermal Cycling Effect for Nuclear Waste Repository. Rock Mech. Rock Eng. 2021, 54, 235–254. [Google Scholar] [CrossRef]
- Rong, G.; Peng, J.; Yao, M.; Jiang, Q.; Wong, L.N.Y. Effects of specimen size and thermal-damage on physical and mechanical behavior of a fine-grained marble. Eng. Geol. 2018, 232, 46–55. [Google Scholar] [CrossRef]
- Wang, F.; Frühwirt, T.; Konietzky, H. Influence of repeated heating on physical-mechanical properties and damage evolution of granite. Int. J. Rock Mech. Min. Sci. 2020, 136, 104514. [Google Scholar] [CrossRef]
- Meng, Q.-B.; Wang, C.-K.; Liu, J.-F.; Zhang, M.-W.; Lu, M.-M.; Wu, Y. Physical and micro-structural characteristics of limestone after high temperature exposure. Bull. Eng. Geol. Environ. 2019, 79, 1259–1274. [Google Scholar] [CrossRef]
- Orlander, T.; Andreassen, K.A.; Fabricius, I.L. Effect of Temperature on Stiffness of Sandstones from the Deep North Sea Basin. Rock Mech. Rock Eng. 2021, 54, 255–288. [Google Scholar] [CrossRef]
- Yin, T.; Zhang, S.; Li, X.; Bai, L. A numerical estimate method of dynamic fracture initiation toughness of rock under high temperature. Eng. Fract. Mech. 2018, 204, 87–102. [Google Scholar] [CrossRef]
- Yin, T.; Li, X.; Xia, K.; Huang, S. Effect of Thermal Treatment on the Dynamic Fracture Toughness of Laurentian Granite. Rock Mech. Rock Eng. 2012, 45, 1087–1094. [Google Scholar] [CrossRef]
- Xiao-li, X.; Zong-xin, K.; Ming, J.; Wen-xuan, G.; Jing, C. Research of microcosmic mechanism of brittle-plastic transition for granite under high temperature. Procedia Earth Planet. Sci. 2009, 1, 432–437. [Google Scholar] [CrossRef]
- Huang, S.; Xia, K. Effect of heat-treatment on the dynamic compressive strength of Longyou sandstone. Eng. Geol. 2015, 191, 1–7. [Google Scholar] [CrossRef]
- Rong, G.; Peng, J.; Cai, M.; Yao, M.; Zhou, C.; Sha, S. Experimental investigation of thermal cycling effect on physical and mechanical properties of bedrocks in geothermal fields. Appl. Therm. Eng. 2018, 141, 174–185. [Google Scholar] [CrossRef]
- Fan, L.F.; Wu, Z.J.; Wan, Z.; Gao, J.W. Experimental investigation of thermal effects on dynamic behavior of granite. Appl. Therm. Eng. 2017, 125, 94–103. [Google Scholar] [CrossRef]
- Gautam, P.K.; Verma, A.K.; Sharma, P.; Singh, T.N. Evolution of Thermal Damage Threshold of Jalore Granite. Rock Mech. Rock Eng. 2018, 51, 2949–2956. [Google Scholar] [CrossRef]
- Liu, H.; Zhang, K.; Shao, S.; Ranjith, P.G. Numerical investigation on the cooling-related mechanical properties of heated Australian Strathbogie granite using Discrete Element Method. Eng. Geol. 2019, 264, 105371. [Google Scholar] [CrossRef]
- Han, G.; Jing, H.; Su, H.; Liu, R.; Yin, Q.; Wu, J. Effects of thermal shock due to rapid cooling on the mechanical properties of sandstone. Environ. Earth Sci. 2019, 78, 146. [Google Scholar] [CrossRef]
- Wu, X.; Huang, Z.; Zhang, S.; Cheng, Z.; Li, R.; Song, H.; Wen, H.; Huang, P. Damage Analysis of High-Temperature Rocks Subjected to LN2 Thermal Shock. Rock Mech. Rock Eng. 2019, 52, 2585–2603. [Google Scholar] [CrossRef]
- Li, Q.; Yin, T.; Li, X.; Zhang, S. Effects of rapid cooling treatment on heated sandstone: A comparison between water and liquid nitrogen cooling. Bull. Eng. Geol. Environ. 2019, 79, 313–327. [Google Scholar] [CrossRef]
- Tang, Z.C.; Peng, M.H.; Xiao, S. Basic friction angle of granite fracture after heating and rapid cooling treatments. Eng. Geol. 2022, 302, 106626. [Google Scholar] [CrossRef]
- Wu, Q.; Weng, L.; Zhao, Y.; Guo, B.; Luo, T. On the tensile mechanical characteristics of fine-grained granite after heating/cooling treatments with different cooling rates. Eng. Geol. 2019, 253, 94–110. [Google Scholar] [CrossRef]
- Li, X.; Zhang, Z.; Chen, W.; Yin, T.; Li, X. Mode I and Mode II Granite Fractures after Distinct Thermal Shock Treatments. J. Mater. Civ. Eng. 2019, 31, 6019001. [Google Scholar] [CrossRef]
- Li, X.; Li, B.; Li, X.; Yin, T.; Wang, Y.; Dang, W. Thermal shock effects on the mechanical behavior of granite exposed to dynamic loading. Arch. Civ. Mech. Eng. 2020, 20, 66. [Google Scholar] [CrossRef]
- Franklin, J.; Vogler, U.; Szlavin, J.; Edmond, J.; Bieniawski, Z. Suggested methods for determining water content, porosity, density, absorption and related properties and swelling and slake-durability index properties: Part 1: Suggested methods for determining water content, porosity, density, absorption and related properties. Int. J. Rock Mech. Min. Sci. Geomech. Abstr. 1979, 16, 143–151. [Google Scholar]
- Bieniawski, Z.; Bernede, M. Suggested methods for determining the uniaxial compressive strength and deformability of rock materials: Part 1. Suggested method for determining deformability of rock materials in uniaxial compression. Int. J. Rock Mech. Min. Sci. Géoméch. Abstr. 1979, 16, 138–140. [Google Scholar] [CrossRef]
- Commission on Standardisation of Laboratory and Field Tests; International Society for Rock Mechanics. Suggested methods for determining tensile strength of rock materials. Int. J. Rock Mech. Min. Sci. Geomech. Abstr. 1978, 15, 99–103. [Google Scholar] [CrossRef]
- Liu, H.Y.; Kou, S.Q.; Lindqvist, P.-A.; Tang, C.A. Numerical Modelling of the Heterogeneous Rock Fracture Process Using Various Test Techniques. Rock Mech. Rock Eng. 2006, 40, 107–144. [Google Scholar] [CrossRef]
- Chen, C.-S.; Pan, E.; Amadei, B. Fracture mechanics analysis of cracked discs of anisotropic rock using the boundary element method. Int. J. Rock Mech. Min. Sci. 1998, 35, 195–218. [Google Scholar] [CrossRef]
- Lin, Q.; Ji, W.-W.; Pan, P.-Z.; Wang, S.; Lu, Y. Comments on the mode II fracture from disk-type specimens for rock-type materials. Eng. Fract. Mech. 2019, 211, 303–320. [Google Scholar] [CrossRef]
- Atkinson, C.; Smelser, R.E.; Sanchez, J. Combined mode fracture via the cracked Brazilian disk test. Int. J. Fract. 1982, 18, 279–291. [Google Scholar] [CrossRef]
- Tao, M.; Li, X.; Wu, C. Characteristics of the unloading process of rocks under high initial stress. Comput. Geotech. 2012, 45, 83–92. [Google Scholar] [CrossRef]
- Zhang, W.; Sun, Q.; Hao, S.; Geng, J.; Lv, C. Experimental study on the variation of physical and mechanical properties of rock after high temperature treatment. Appl. Therm. Eng. 2016, 98, 1297–1304. [Google Scholar] [CrossRef]
- Wu, X.; Huang, Z.; Song, H.; Zhang, S.; Cheng, Z.; Li, R.; Wen, H.; Huang, P.; Dai, X. Variations of Physical and Mechanical Properties of Heated Granite After Rapid Cooling with Liquid Nitrogen. Rock Mech. Rock Eng. 2019, 52, 2123–2139. [Google Scholar] [CrossRef]
- Zhang, W.; Sun, Q.; Zhu, Y.; Guo, W. Experimental study on response characteristics of micro–macroscopic performance of red sandstone after high-temperature treatment. J. Therm. Anal. Calorim. 2018, 136, 1935–1945. [Google Scholar] [CrossRef]
- Pathiranagei, S.V.; Gratchev, I. Engineering properties of sandstone heated to a range of high temperatures. Bull. Eng. Geol. Environ. 2021, 80, 2415–2432. [Google Scholar] [CrossRef]
- Pathiranagei, S.V.; Gratchev, I.; Kong, R. Engineering properties of four different rocks after heat treatment. Géoméch. Geophys. Geo-Energy Geo-Resour. 2021, 7, 16. [Google Scholar] [CrossRef]
- Dong, S.; Wang, Y.; Xia, Y. Stress intensity factors for central cracked circular disk subjected to compression. Eng. Fract. Mech. 2004, 71, 1135–1148. [Google Scholar] [CrossRef]
- Chen, Y.-L.; Wang, S.-R.; Ni, J.; Azzam, R.; Fernández-Steeger, T.M. An experimental study of the mechanical properties of granite after high temperature exposure based on mineral characteristics. Eng. Geol. 2017, 220, 234–242. [Google Scholar] [CrossRef]
- Fan, L.; Gao, J.; Du, X.; Wu, Z. Spatial gradient distributions of thermal shock-induced damage to granite. J. Rock Mech. Geotech. Eng. 2020, 12, 917–926. [Google Scholar] [CrossRef]
- Kim, K.; Kemeny, J.; Nickerson, M. Effect of Rapid Thermal Cooling on Mechanical Rock Properties. Rock Mech. Rock Eng. 2013, 47, 2005–2019. [Google Scholar] [CrossRef]
- Collin, M.; Rowcliffe, D. Analysis and prediction of thermal shock in brittle materials. Acta Mater. 2000, 48, 1655–1665. [Google Scholar] [CrossRef]


Disclaimer/Publisher’s Note: The statements, opinions and data contained in all publications are solely those of the individual author(s) and contributor(s) and not of MDPI and/or the editor(s). MDPI and/or the editor(s) disclaim responsibility for any injury to people or property resulting from any ideas, methods, instructions or products referred to in the content. |
© 2023 by the authors. Licensee MDPI, Basel, Switzerland. This article is an open access article distributed under the terms and conditions of the Creative Commons Attribution (CC BY) license (https://creativecommons.org/licenses/by/4.0/).