Article

Research on Influencing Factors and Driving Path of BIM Application in Construction Projects Based on the SD Model in China

1
Department of Civil Engineering, Xiamen University, Xiamen 361005, China
2
Xiamen Key Laboratory of Integrated Application of Intelligent Technology for Architectural Heritage Protection, Xiamen University, Xiamen 361005, China
*
Author to whom correspondence should be addressed.
Buildings 2023, 13(11), 2794; https://doi.org/10.3390/buildings13112794
Submission received: 5 September 2023 / Revised: 16 October 2023 / Accepted: 30 October 2023 / Published: 7 November 2023
(This article belongs to the Section Construction Management, and Computers & Digitization)

Abstract

:
The BIM (building information model), as an innovative architectural technology, has received sufficient attention in the AEC (architecture, engineering, and construction) industry, providing many possibilities for improving building management. Therefore, exploring the factors influencing of how BIM technology is applied has strong practical significance for promoting the application of BIM technology. Based on previous research, this article identified 16 factors that affect the application of BIM and established a relationship function between the influencing factors based on the current actual situation. A system dynamics (SD) model was constructed to analyze the mechanism of these factors and explore the key influencing factors of BIM application. The research results indicate that BIM technology maturity, the difficulty level of BIM software operation, and the degree of collaboration among various departments within an enterprise are key influencing factors. This article conducts an empirical analysis of a large project in China. Based on the research results, targeted improvement measures are proposed to improve the current level of BIM technology application and promote further development of BIM technology. However, due to the rapid development of BIM technology, the effects and weights of the influencing factors in different eras may not be consistent. The reference effect of this study’s results on era period of ten years or even longer is weakened, and scholars will need to continuously update this article in the future.

1. Introduction

1.1. Research Background

With the continuous development of the economy, people’s demands for architecture continue to increase. Therefore, in the construction process of construction projects, more and more factors are considered, and the amount of engineering information carried by the construction project itself is also increasing [1]. The traditional construction management methods of engineering projects are no longer able to meet the requirements of current construction projects. Therefore, during the construction process, due to inaccurate feedback of early construction information to the construction stage and poor management of the construction process, it is easy to cause a large number of engineering changes, resulting in the inability to achieve the quality, progress, and cost goals of the construction project. The emergence of the building information model (BIM) effectively solves this problem [2].
In the past decade, some scholars in the construction industry have also focused on the advantages, potential, and application barriers of building information modeling (BIM) [3,4]. Compared to the support of developed country governments for BIM technology, developing country governments still need to strengthen their emphasis on the application of BIM technology due to economic reasons [5]. In addition, there is relatively little research on the implementation environment in developing countries. Compared with developed Western countries, the application of BIM technology in developing countries is more practical when considering the construction environment of the economy, infrastructure, etc. [6]. The construction industry in developing countries still faces challenges such as quality issues, cost overruns, and project delays. The application of BIM technology can effectively coordinate the influencing factors of various project parties, and solve problems such as engineering cost, schedule, and quality. In this context, the study of the factors influencing BIM technology application has enormous research potential [7]. The current research mainly focuses on a single study of the factors influencing BIM technology application, without fully considering the internal connections between various influencing factors, as well as considering from the perspective of a single engineering stakeholder, lacking a global consideration of all stakeholders of the project [8]. Based on the current lack of research on the factors influencing BIM technology application and the different emphasis on the influencing factors that promote BIM technology application in different periods, this article uses system dynamics methods to analyze the influencing factors of BIM technology application and explores the internal connections between the influencing factors through quantitative methods [9,10,11]. As the application of BIM in China has gradually received government attention, the practical case in China is used as an empirical study of the influencing factors of BIM application to ensure the reliability of theoretical research results [12,13]. Using system dynamics to study the internal connections between impacts, identify key influencing factors, and promote the application of BIM technology to the greatest extent by improving several influencing factors, makes up for the shortcomings of the current research on BIM technology application. The research results provide a reference for developing countries and even elsewhere in the world to study the driving factors of BIM application.

1.2. Literature Review

To date, scholars have conducted in-depth research on BIM technology. Regarding the application advantages of BIM technology, Fargnoli et al. [1] explored the application value and potential of BIM technology for security through a review of the literature. Fernández [2] explored the advantages of virtual BIM technology in the collision inspection of engineering drawings. Eleftheriadis et al. [4] analyzed the current application status and advantages of BIM technology in various construction stages. Ghaffarianhosini et al. [5] explored the advantages of BIM application from the perspective of BIM technology application and provided suggestions for future BIM application. Regarding the methodology of BIM technology application research, Zheng et al. [6] developed a benefit-sharing model, proposing the common interests of stakeholders in BIM technology, and inferring the key to stakeholders adopting BIM cooperation from an economic perspective. Pezeshki et al. [7] reviewed the development of BIM technology through a review of the literature, pointing out the rationality of BIM technology development and its driving forces for future development. Oestereich et al. [8] used system dynamics methods to quantify the cost and benefit impact of adopting BIM technology. Belay et al. [10] used structural equation modeling to analyze the influencing factors of the application of BIM technology in Ethiopia and found a driving path to improve the performance of BIM application. Oraee et al. [14] proposed a conceptual model based on research of the literature, constructed a collaborative network of BIM application barriers, and explored the main obstacles.
In addition, extensive research has been conducted around the world on the influencing factors of BIM technology application. Oraee et al. [14] conducted interviews with BIM experts from the UK to explore current obstacles and solutions for the application of BIM technology and developed a BIM governance framework. Wu et al. [15] used a questionnaire survey method to analyze the practical experience of BIM technology application in the ACE industry in China, provided insights on the relevant risks of BIM application, identified obstacles to the application of BIM technology in China, and used factor analysis to identify key obstacles to BIM implementation. Cao et al. [16] conducted a survey and analysis of 106 projects in China that adopt BIM technology, exploring the application experience and organizational issues of BIM technology, providing a reference for the industry to better utilize BIM technology. Yuan et al. [9], from the perspective of the government, concluded that appropriate government subsidies have a promoting effect on the application of BIM technology. Tan et al. [17] used interpretive structural models to explore the key influencing factors of BIM technology application, providing a reference for the application of BIM technology in prefabricated buildings in China. Al-Ashmori et al. [18] analyzed the perspectives of various stakeholders implementing BIM technology in Malaysia through a questionnaire survey and explored the main driving factors of BIM technology. Liao et al. [19] used structural equation modeling to analyze the key influencing factors of BIM technology application in Malaysia.
At present, the research on BIM technology has reached a certain depth, from questionnaire surveys, and project summaries to expert interviews, analyzing the advantages and influencing factors of BIM application, all of which have sufficient research foundation. Although some studies use interpretive structural models, structural equation models, and system dynamics models to analyze the interactions between BIM influencing factors, they mostly consider the influencing factors of BIM application from the perspective of individual or minority stakeholders. The study of the influencing factors of BIM technology in the full lifecycle application of construction projects from the perspective of various stakeholders is mostly based on direct analysis of key influencing factors such as questionnaire surveys and project summaries, with little consideration given to the interaction relationship between the influencing factors of BIM application. There is still no in-depth research on the prediction of factor changes in future BIM technology application. Therefore, based on extensive research of the influencing factors of BIM technology application by predecessors, this article starts with questionnaire interviews, expert surveys, etc., and uses a system dynamics model to construct an interactive relationship model between the various influencing factors of BIM technology application, predict the effectiveness of BIM application factors, and quantitatively analyze the key influencing factors based on this model.

1.3. Research Method

This study uses the method of system dynamics to construct and analyze the influencing factors model of BIM technology application. System dynamics is a method of dynamically simulating the simulation system through building a model, conducting prediction analysis, and providing corresponding rationalization suggestions. By utilizing the logical relationship between the influencing factors of BIM technology application, the application level of BIM technology is constructed. By simulating a system dynamics model, corresponding improvement strategies are proposed.

2. Identification of Influencing Factors

Using the Web of Science to comprehensively search the literature based on keywords such as “BIM technology”, BIM application impact, and BIM technology improvement, 16 possible BIM application influencing factors were selected based on indicators such as occurrence frequency and impact effect, and divided into five categories, as shown in Table 1.

2.1. Economic Factors

2.1.1. BIM Personnel Costs

The cost of hiring experts to consult and solve related problems during the implementation of BIM projects, the direct and time costs of cultivating talent related to BIM technology within an enterprise, and the salary incentive measures adopted to retain BIM talent.

2.1.2. BIM Application Costs

The application of BIM technology requires the purchase of matching hardware, equipment, and software that meets the actual project requirements, and the cost of updating and maintaining equipment and models during use.

2.1.3. BIM Cost Management in Enterprises

The additional costs incurred by enterprises using BIM technology in managing various stages of project construction, such as BIM model management, and BIM data operation and maintenance.

2.1.4. Economic Benefits Provided by BIM Technology

The benefits provided by the use of BIM technology include reducing changes during the construction process through the 3D design of BIM models, rationalizing personnel arrangements on construction sites, reducing personnel costs, and accelerating project progress. BIM models and data directly operate and maintain projects.

2.2. Technical Factors

2.2.1. The Difficulty Level of BIM Software Operation

The 3D models used in BIM involve many elements of engineering materials in the modeling process, and parameterized design changes are often required for elements of different materials. The modeling process is more complex compared to traditional models.

2.2.2. Model Transmission Efficiency at Each Stage

The large amount of BIM model data generated at each stage of project construction requires integration management and data sharing through corresponding software platforms. The completeness of the platform and the cooperation of all parties affect the efficiency of BIM model data transmission.

2.2.3. BIM Technology Maturity

The current maturity of BIM technology in China is mainly reflected in its application in engineering projects, the level of BIM software developed, and the reserve of relevant BIM talent.

2.3. Organizational Factors

2.3.1. Degree of Collaboration among Various Stakeholders in the Project

During the construction process, professional personnel from all parties involved need to invest together. From the first party’s enterprise to the design unit, construction unit, and consulting unit, the application of BIM technology requires real-time sharing and updating of information among all parties. The cooperation of all parties plays a significant role in the application of BIM technology.

2.3.2. Degree of Collaboration among Various Departments within an Enterprise

The smooth implementation of the construction project cannot be separated from the cooperation between various departments within an enterprise of Party A. During the implementation process of the construction project, it is necessary to update and dynamically manage the BIM model and data, which involves dynamic real-time cooperation among various departments within an enterprise.

2.3.3. Clarity of BIM Requirements

The first party shall reasonably and clearly propose relevant BIM requirements to all participating parties during the bidding stage to promote the strengthening of the application of BIM technology in the project and drive the application of BIM technology.

2.4. Political and Legal Factors

2.4.1. The Level of Government Support for BIM

Governmental support includes the introduction of corresponding BIM application policy requirements, the application of BIM technology in government projects, and government funding support. The government’s support for BIM projects greatly affects the development of BIM application.

2.4.2. Degree of BIM Application Standards and Specifications

The degree to which BIM standards and specifications are established in the current industry affects the application of BIM technology. The current standard system is mostly focused on the design stage, with each stage being independent and not applied throughout the entire lifecycle of construction projects. Comprehensive and complete BIM application specifications have not yet been unified.

2.4.3. Clarity of Legal Liability Boundaries for BIM Application

The application of BIM technology requires a large amount of data and information integration, requiring all project participants to achieve information sharing. Due to information sharing, all participants can access project data, which greatly increases the possibility of data infringement. If the information is provided by external sources, there may be data, design ownership issues, or licensing issues, and the accuracy of the data behind the BIM model will create great risks, The responsibility for this accuracy must be supported by clear legal boundaries, corresponding disclaimers, and limited warranties.

2.5. Subjectively Cognitive Factors

2.5.1. The Acceptance of BIM Technology by All Stakeholders in the Project

Since the current application of BIM technology is not widespread, the adoption of BIM technology for communications management among project stakeholders needs to establish some new rules. This change is bound to involve some costs, progress, and other factors. Due to the different views and acceptance of BIM technology by stakeholders, the acceptance of BIM by stakeholders affects the smooth application of BIM.

2.5.2. Enterprises’ Understanding of BIM Technology

The current application examples of BIM technology are not comprehensive enough, which can be attributed to the insufficient understanding of BIM by Party A’s enterprise. Strengthening Party A’s recognition and acceptance of BIM technology can accelerate the application of BIM technology and promote its advantages.

2.5.3. BIM Technology Application Experience

At present, the application of BIM technology is mostly carried out in stages, focusing on collision inspection during the design phase, visual design, and cost and schedule control during the construction phase. There is insufficient experience in implementing coordinated management using BIM technology throughout the entire lifecycle.

3. Dynamics Model Construction

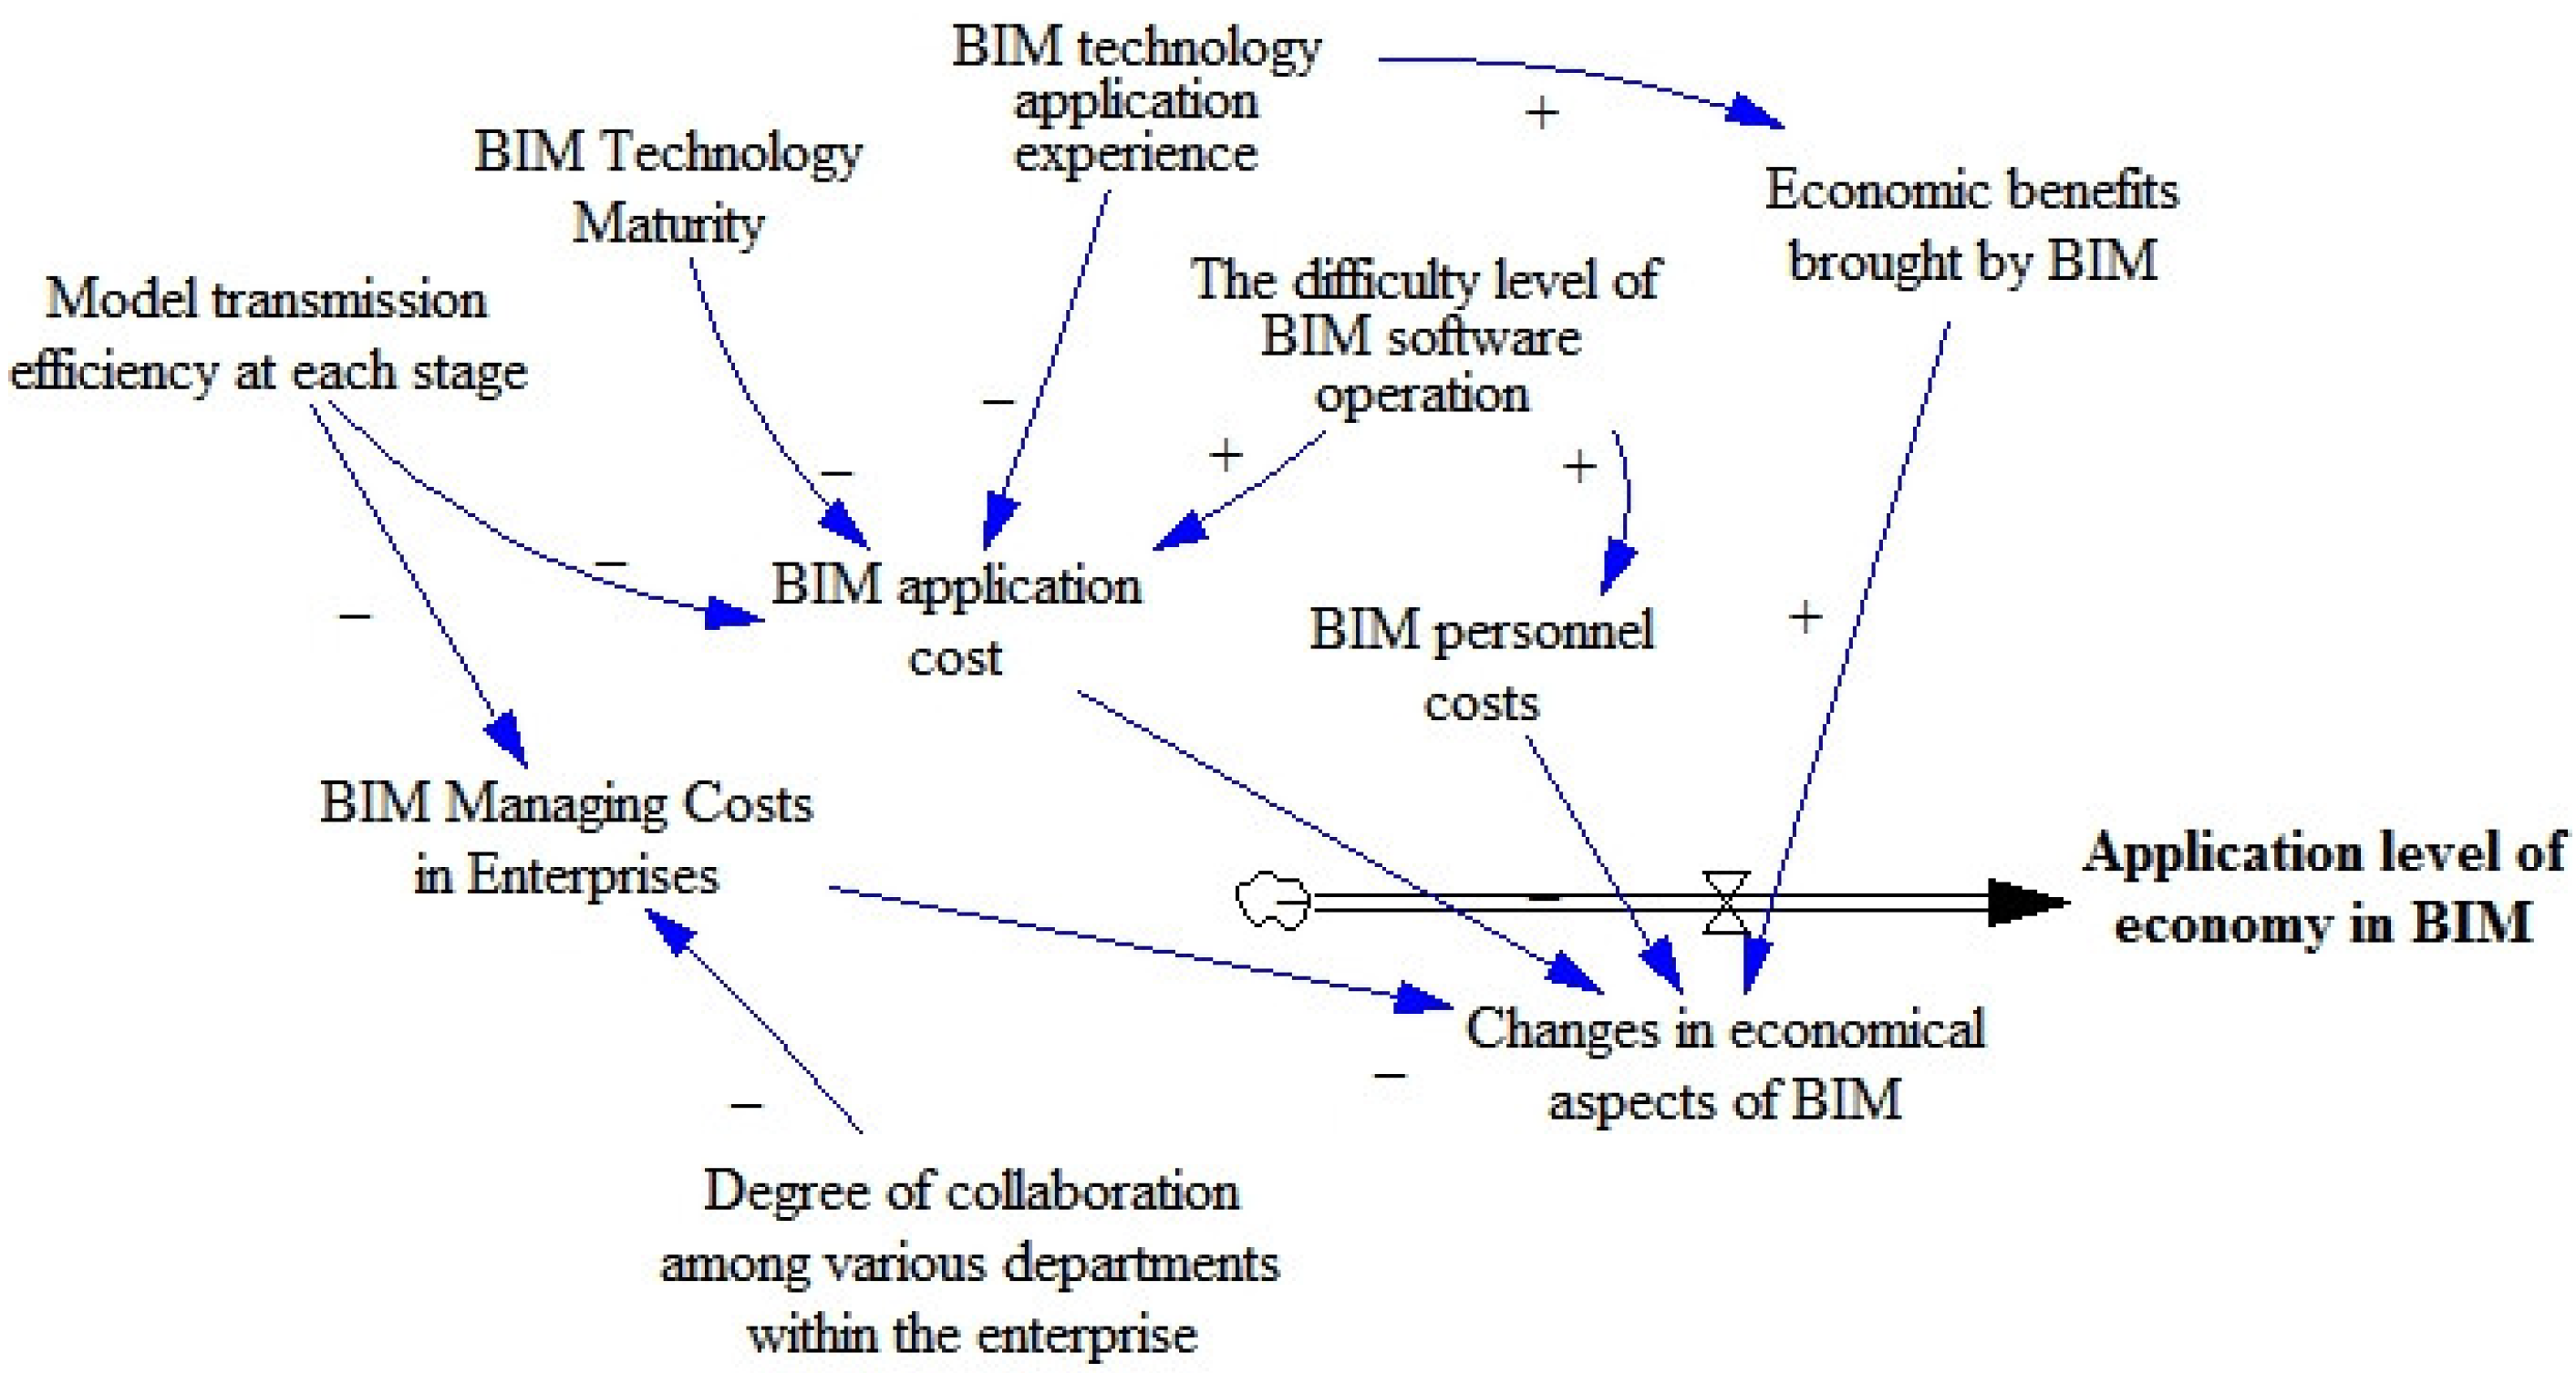
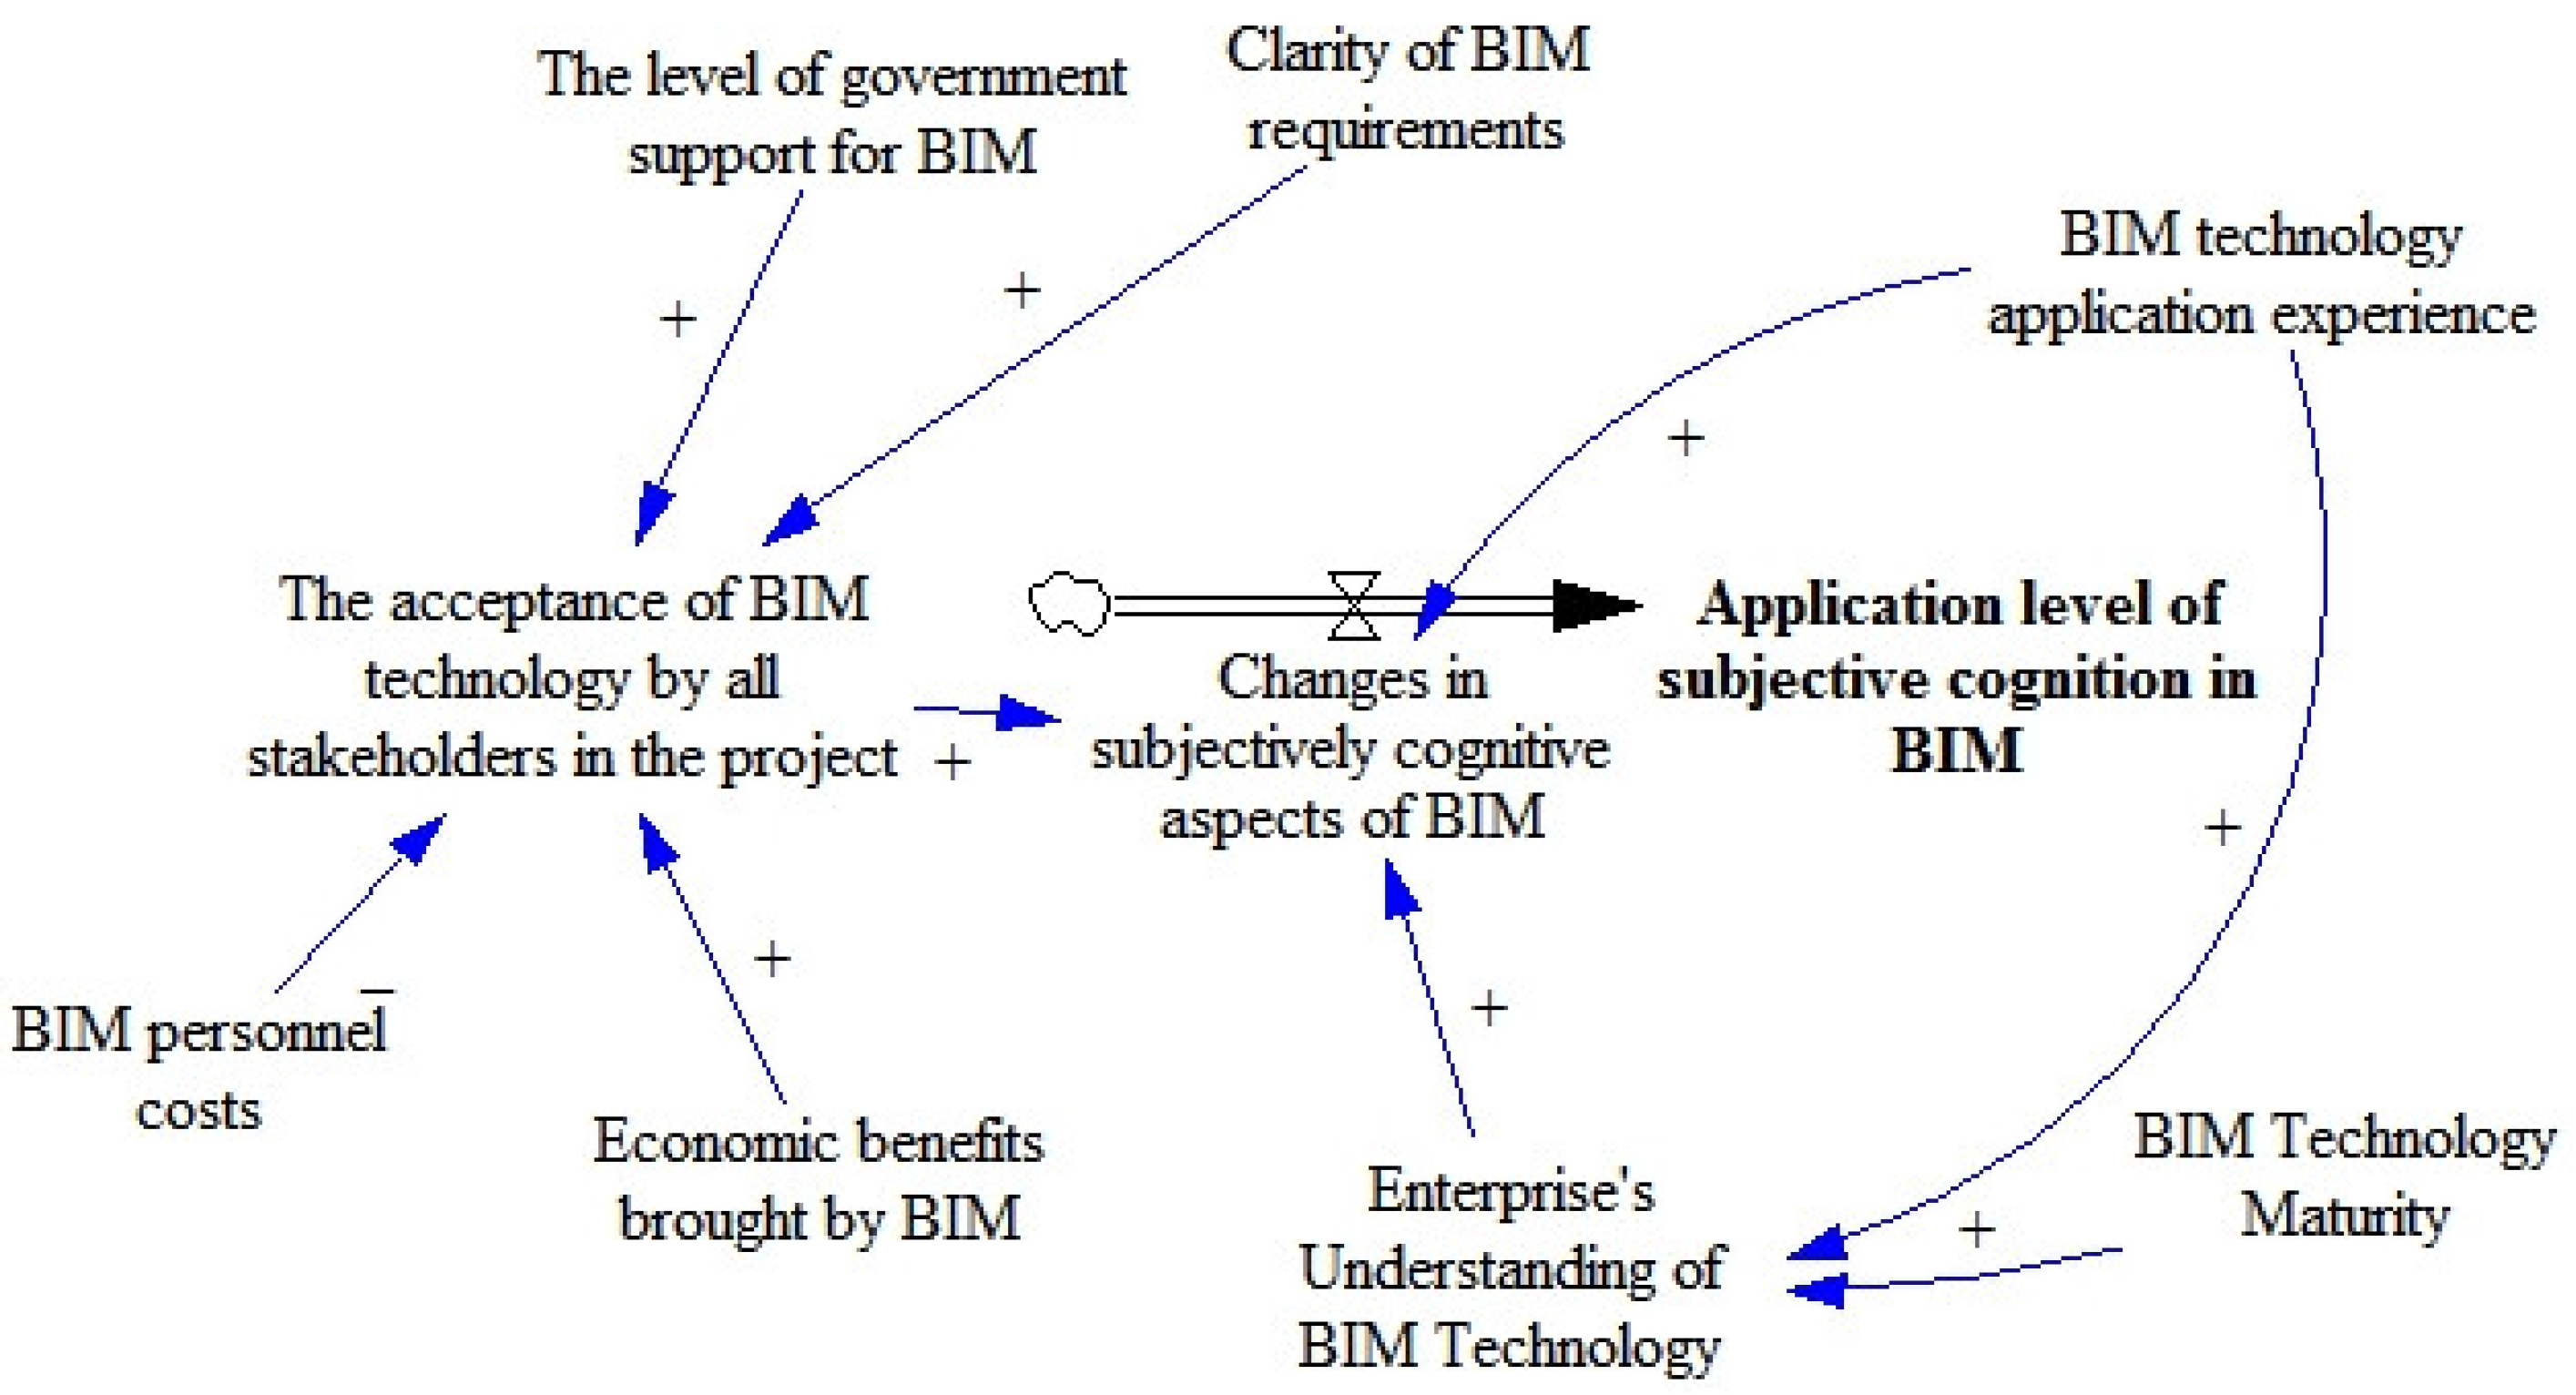
3.1. Drawing a Causal Relationship Diagram

The system dynamics indicator variables are constructed, as shown in Table 2, according to the principles and purpose of constructing a system dynamics model, combined with the identification of factors influencing the application of BIM technology in the previous chapter in drawing a causal relationship diagram.
Based on research of the literature to identify the influencing factors of BIM technology application, expert interviews were used to determine the interaction relationship between the influencing factors of BIM technology application. The expert group consists of four university lecturers with more than 10 years of experience in BIM technology-related research. The voting method was used to determine the mechanism of action between each influencing factor. When three or more experts agree on a transmission, it can be determined that the transmission is valid. According to the results of expert interviews, Vensim (v7.3.5) software was used to draw a causal relationship diagram, as shown in Figure 1. The arrows represent the interaction between factors, and the positive and negative signs represent the promotion and inhibition of the interaction between factors. All factors are transmitted layer by layer to ultimately point to the application level of BIM technology.

3.2. Determine Model Variables

The application level of BIM technology is reflected through five state variables: the level of economic application in BIM, the level of technology application in BIM, the level of organization application in BIM, the level of policy and law utilization in BIM, and the level of subjective cognition utilization in BIM. The internal factors of BIM technology application affect the level of BIM application. These internal factors correspond to intermediate variables in system dynamics, namely auxiliary variables. The same external factors can also affect the application level of BIM. External factors correspond to exogenous variables; that is, these variables are not affected by other variables. Combined with the factors in this article, the application experience of BIM technology has become more mature over time, and the government’s support for BIM technology has also developed over time. Therefore, these two factors are only related to time and are not affected by other factors, so they are exogenous variables. The variables in the model are shown in Table 3.

3.3. Flow Chart Drawing

The system dynamics flow diagram is based on the causal relationship diagram, which distinguishes the interaction relationships between various variables in the system in more detail. For quantitative research, a system dynamics subsystem and overall system flow diagram were constructed, as shown in Figure 2, Figure 3, Figure 4, Figure 5, Figure 6 and Figure 7.

3.4. Determine the Variable Equation

Variable equations are an important component of system dynamics models. Composed of state variable equations, decision variable equations, and auxiliary variable equations, they are a tool for quantitatively analyzing the interactions between various factors. Due to the changes in the application of BIM technology being represented by differences in system dynamics model parameters, it represents a trend and does not require accurate values. Therefore, it is assumed that the range of values for the SD model parameters is uniform [0, 1].
The modeling and analysis software used in this article is Vensim. We use this software to establish the required variable equations and simulate the model. Taking positive feedback as an example, when the relevant auxiliary variables in the equation have an impact on the decision variables, the decision variables will increase over time, and the corresponding state variables will also increase accordingly. In practical situations, this change is not nonlinear, and its impact on decision variables is limited. As time passes, the space for its change becomes smaller and the speed of its change gradually decreases. Therefore, within a certain period, the influence of other positive factors on the state variable shows a gradually increasing trend, and the corresponding decision variables will gradually decrease. This relationship is consistent with the flow change diagram of the first-order negative feedback system in the system dynamics model.

3.4.1. BIM Economic Application Level Equation

The changes in economic aspects of BIM directly affect the application level of the economy in BIM:
S V 1 ( t ) = S V 1 ( t 0 ) + t 0 t D V 1 ( t ) d t
where SV1(t) is the application level of the economy in BIM at time t, SV1(t0) is the initial application level of the economy in BIM, DV1(t) is the changes in economic aspects of BIM per unit time, which is related to BIM personnel costs, BIM application costs, BIM cost management in enterprises, and the economic benefits provided by BIM technology. It is expressed using a logistic growth function:
F ( t ) = K 1 + e a r t ,   K > 0 , a R , r > 0
where K is the saturation level and r is the growth rate factor. According to the research content and practical significance of this article, the value limit of the growth rate is 1, and as the variable increases, the growth rate of this variable shows a downward trend, with K = 1; when t is at [0, +∞), the value interval of F(t) is [0, 1), let a = 0, r = −1, and introduce a constant term to adjust the curve. Therefore, the mathematical model formula expression for the decision variable is:
F ( t ) = 1 1 + e t
The function image is shown in Figure 8:
The expression of the DV1(t) function for changes in the economic aspects of BIM is:
D V 1 ( t ) = 1 1 + e ( A V 4 A V 1 A V 2 A V 3 )
According to the causal diagram, BIM personnel costs are affected by the difficulty level of BIM software operation; BIM application costs are influenced by the difficulty level of BIM software operation, BIM technology application experience, and BIM technology maturity; the BIM cost management in enterprises is influenced by the degree of collaboration among various departments within an enterprise and model transmission efficiency at each stage; the economic benefits brought by BIM technology are influenced by BIM technology application experience.
Drawing inspiration from the BP neural network MIV algorithm, the calculation function of BIM application cost AV2 is set as follows:
A V 2 = 1 ( α 1 × A V 5 + α 2 × E V 2 + α 3 × A V 7 )
where α1~α5 are the weight coefficient, indicating the importance of the contribution between variables. α1 + α2 + α3 = 1.
Using function fitting as a reference, the calculation functions for BIM personnel costs AV1, BIM cost management in enterprises AV3 in BIM enterprises, and the economic benefits provided by BIM technology AV4 are set as follows:
A V 1 = 1 ( a 1 + α 4 × A V 5 )
A V 3 = 1 ( a 2 + α 5 × A V 9 )
A V 4 = a 2 + α 6 × E V 2
Among them, a1~a6 are the weight coefficients between factors and are constants.

3.4.2. BIM Technology Application Level Equation

The changes in technical aspects of BIM directly affect the application level of technology in BIM:
S V 2 ( t ) = S V 2 ( t 0 ) + t 0 t D V 2 ( t ) d t
The expression of the DV2(t) function for the changes in technical aspects of BIM is:
D V 2 ( t ) = 1 1 + e ( A V 5 + A V 6 + A V 7 )
Drawing inspiration from the BP neural network MIV algorithm, the calculation functions for model transmission efficiency (AV6) at each stage and BIM technology maturity (AV7) in each stage. are set as follows:
A V 6 = β 1 × A V 8 + β 2 × A V 9 + β 3 × A V 13
A V 7 = β 4 × E V 1 + β 5 × E V 2
where β15 are the weight coefficients, indicating the importance of the contribution between variables. β1+ β2+ β3 = 1; β4 + β5 = 1.
Using function fitting as a reference, set the calculation function of the difficulty level of BIM software operation AV5 to:
A V 5 = b 1 + β 6 × A V 7
where b1 and β6 are the weight coefficient between factors and are constants.

3.4.3. BIM Organizational Application Level Equation

The changes in organizational aspects of BIM affect the application level of the organization in BIM.
S V 3 ( t ) = S V 3 ( t 0 ) + t 0 t D V 3 ( t ) d t
The expression of the DV3(t) function for changes in organizational aspects of BIM is:
D V 3 ( t ) = 1 1 + e ( A V 8 + A V 9 + A V 10 )
Drawing inspiration from the BP neural network MIV algorithm, the calculation functions for the degree of collaboration among various stakeholders in the project (AV8), the degree of collaboration among various departments within an enterprise (AV9), and clarity of BIM requirements (AV10) are set as follows:
A V 8 = θ 1 × E V 1 + θ 2 × E V 2 + θ 3 × A V 9 + θ 4 × A V 10 + θ 5 × A V 11 + θ 6 × A V 12 + θ 7 × A V 13
A V 9 = θ 8 × E V 2 + θ 9 × A V 5 + θ 10 × A V 14
A V 10 = θ 11 × E V 1 θ 12 × A V 2 θ 13 × A V 3 + θ 14 × A V 4 + θ 15 × A V 14
where θ1~θ15 are the weight coefficients, indicating the importance of the contribution between variables. θ1 + …+ θ7 = 1; θ8+ θ9+ θ10 = 1; θ11 + …+ θ15 = 1.

3.4.4. BIM Policy and Legal Application Level Equation

The changes in the political and legal aspects of BIM directly affect the application level of policy and law in BIM.
S V 4 = S V 4 ( t 0 ) + t 0 t D V 4 ( t ) d t
The expression of the DV4(t) function for the changes in political and legal aspects of BIM is:
D V 4 ( t ) = 1 1 + e ( E V 1 + A V 11 + A V 12 )
Drawing inspiration from the BP neural network MIV algorithm, the calculation function of the degree of BIM application standards and specifications AV11 is set as follows:
A V 11 = φ 1 × E V 1 + φ 2 × A V 7 + φ 3 × A V 12 + φ 4 × A V 13
where φ1~φ4 are the weight coefficient, indicating the importance of the contribution between variables. φ1 + …+φ4 = 1.
Using function fitting as a reference, the calculation function of AV12 is set to:
A V 12 = c 1 + φ 5 × E V 1
where φ5 is the weight coefficient between factors and is a constant.
Drawing on the Gartner hype cycle released by Gartner, the changing trend of the level of government support for BIM (EV1) is divided into five stages, namely, the promotion period of birth, the peak of high expectations, the bottom period of foam and the bright period of a steady climb. Combined with the Gartner hype cycle, the level of government support for BIM is constructed according to the development of BIM technology. The curve indicates that since the gradual development of BIM technology in China, the level of government support for BIM has gradually increased. After a period of time, the popularity has reached its peak, and the construction industry has begun to transform. The industry’s pursuit of BIM technology has shifted from blind pursuit to rational choice, and the level of government support for BIM has also slightly declined. In the subsequent development, BIM technology has gradually had its own path to forge, and the level of government support for BIM has gradually stabilized in growth, and it will be maintained at the same level for a longer period of time. The support calculation equation for the level of government support for BIM is:
E V 1 = 3 × e 3 ( 1 + ( t i m e ) / 2 ) 2 × ( 1 + e 3 ( 1 + ( t i m e ) / 2 ) ) 2 + 1 1 + e ( 3 ( ( t i m e ) / 6 1 ) )

3.4.5. BIM Subjective Cognitive Application Level Equation

The changes in subjectively cognitive aspects of BIM directly affect the application level of subjective cognition in BIM.
S V 5 = S V 5 ( t 0 ) + t 0 t D V 5 ( t ) d t
The changes in subjectively cognitive aspects DV5(t) function for changes in BIM technology application is:
D V 5 ( t ) = 1 1 + e ( E V 2 + A V 13 + A V 14 )
Drawing inspiration from the BP neural network MIV algorithm, the calculation functions for the acceptance of BIM technology by all stakeholders in the project AV13 and an enterprise’s understanding of BIM technology AV14 are set as follows:
A V 13 = Ψ 1 × E V 1 + Ψ 2 × A V 1 + Ψ 3 × A V 4 + Ψ 4 × A V 10
A V 14 = Ψ 5 × E V 2 + Ψ 6 × A V 7
where Ψ1~Ψ6 are the weight coefficient, indicating the importance of the contribution between variables. Ψ1 + Ψ2 + Ψ3+ Ψ4 = 1.
Since 2003 BIM technology has gradually developed in China, and BIM technology application experience (EV2) has developed rapidly. With the advancement of time, the growth rate of BIM technology application experience has been gradually slowing down, and then gradually reaching a saturation level. The calculation equation for BIM technology application experience is:
E V 2 = 1 e ( t i m e / 10 )

3.4.6. BIM Technology Application Level Equation

Enhancing the observability of the changing trend of the level of BIM technology application is based on the average BIM technology application level equation:
S V = ( S V 1 + S V 2 + S V 3 + S V 4 + S V 5 )

4. Model Analysis

4.1. Parameter Determination

System dynamics mainly studies information feedback, and before simulating the SD model, it is necessary to assign values to the model parameters. The parameters of the SD model do not require precise numerical values, but at least they must meet the rationality and trend of the modeling.

4.1.1. Data Sources

In order to construct a system dynamics equation between the influencing factors, a functional approach was used to determine the relationship between the influencing factors. However, due to the inability to directly measure the parameters related to the model equation, this part of the data was collected through a questionnaire survey. This questionnaire is divided into two parts. The first part is basic personal information. This part aims to exclude data from personnel who are not in the construction industry or have no BIM work experience and ensure the reliability of the data results. The second part is the survey information on BIM application influencing factors. The Likert scale (1, 2, 3, 4, 5) is used to assign values to the degree of influence of factors, corresponding to ‘weak, very weak, general, very strong, strong’.
The survey questionnaire in this article is targeted, using expert interviews to discuss the selection of research subjects, and conducting research on construction professionals with experience in BIM technology through online publication. Through statistical analysis, a total of 121 questionnaires were collected, and 17 questionnaires with incomplete filling, inconsistent data, and no BIM experience, were excluded. A total of 107 valid questionnaires were gathered, with an effective rate of 88. A total of 43% of the questionnaires include personnel from construction units, construction units, government departments, and universities.

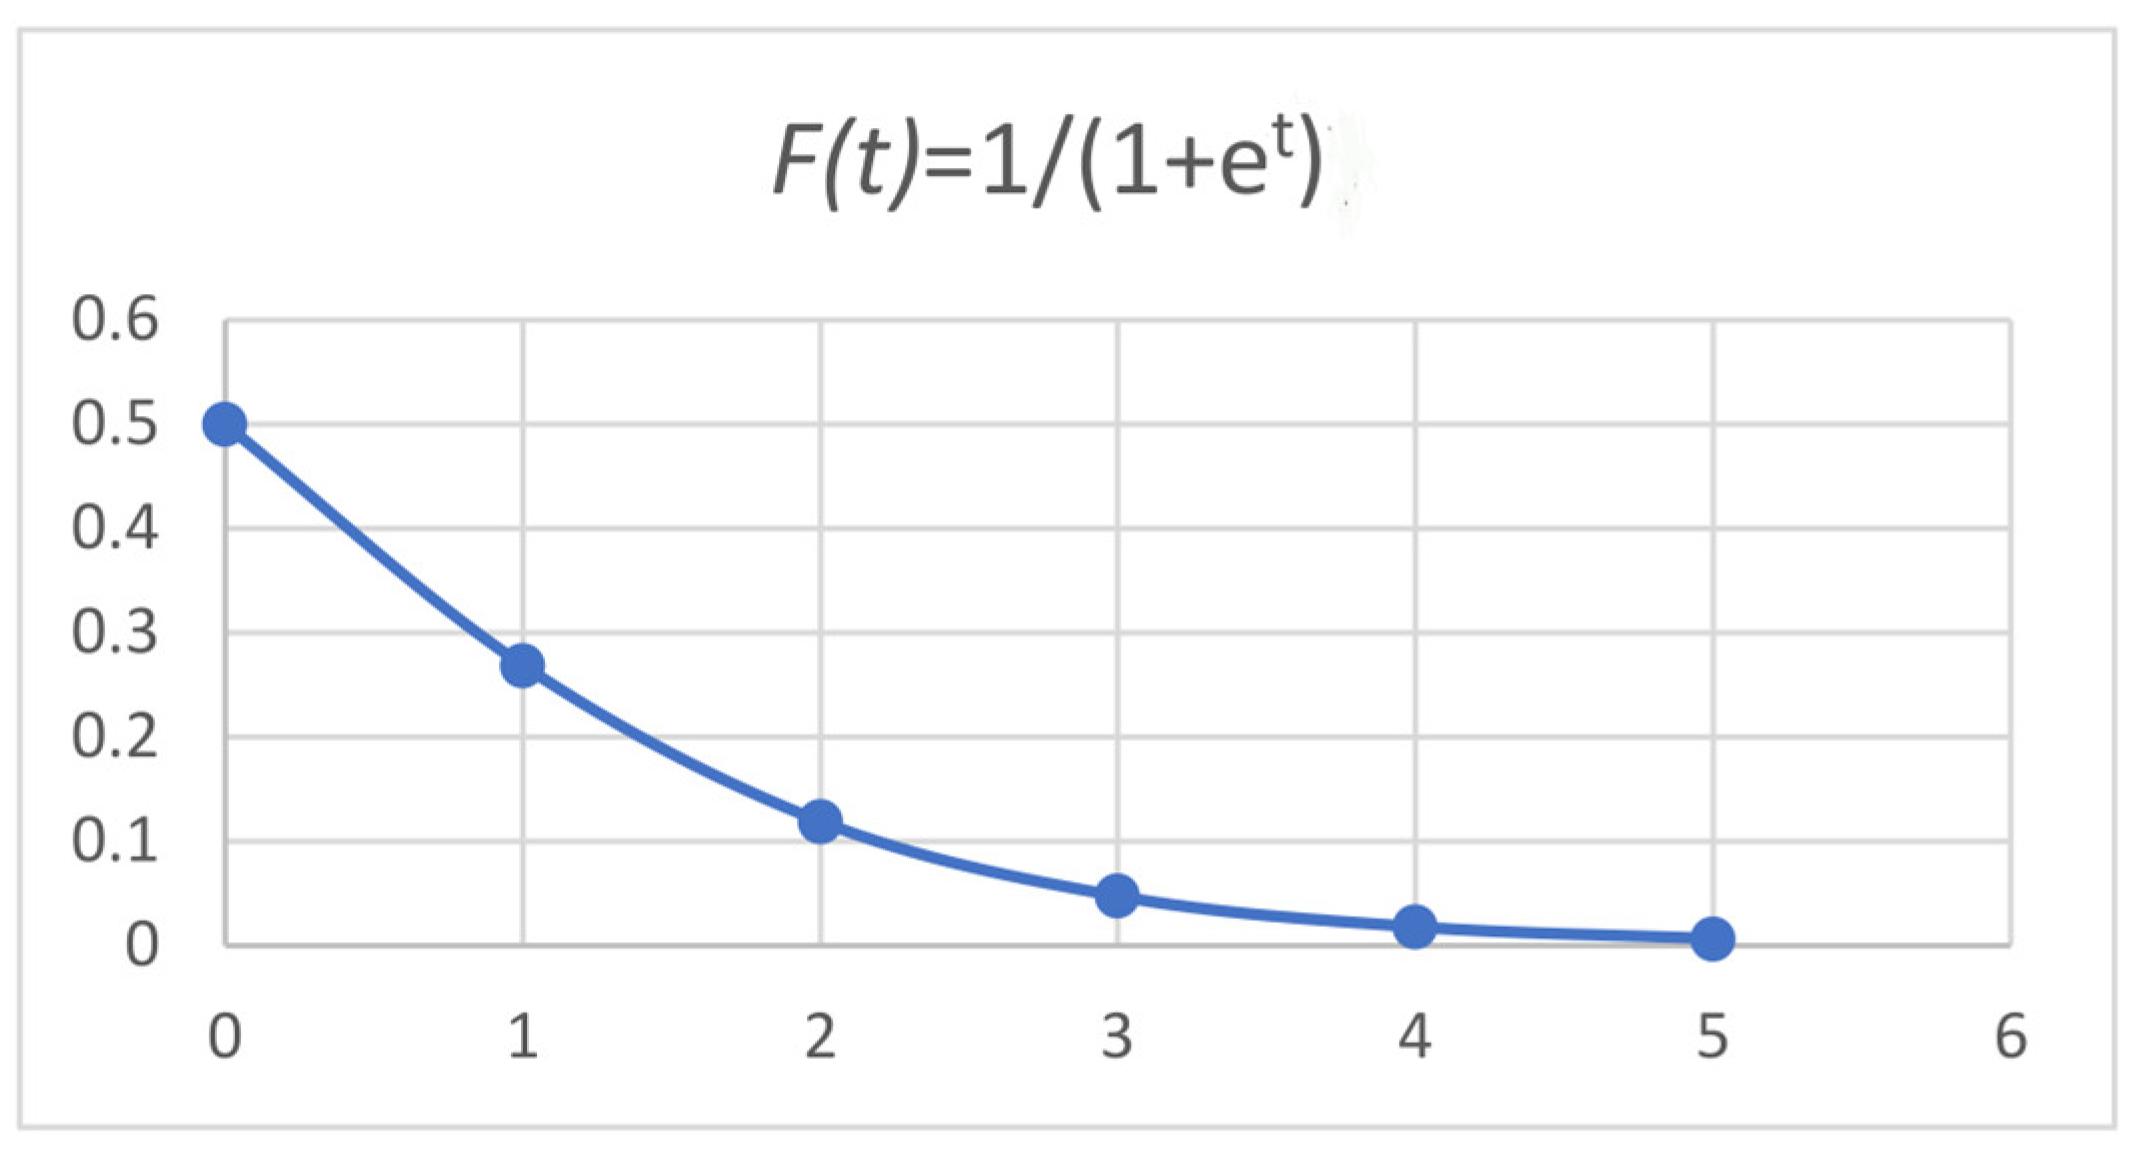
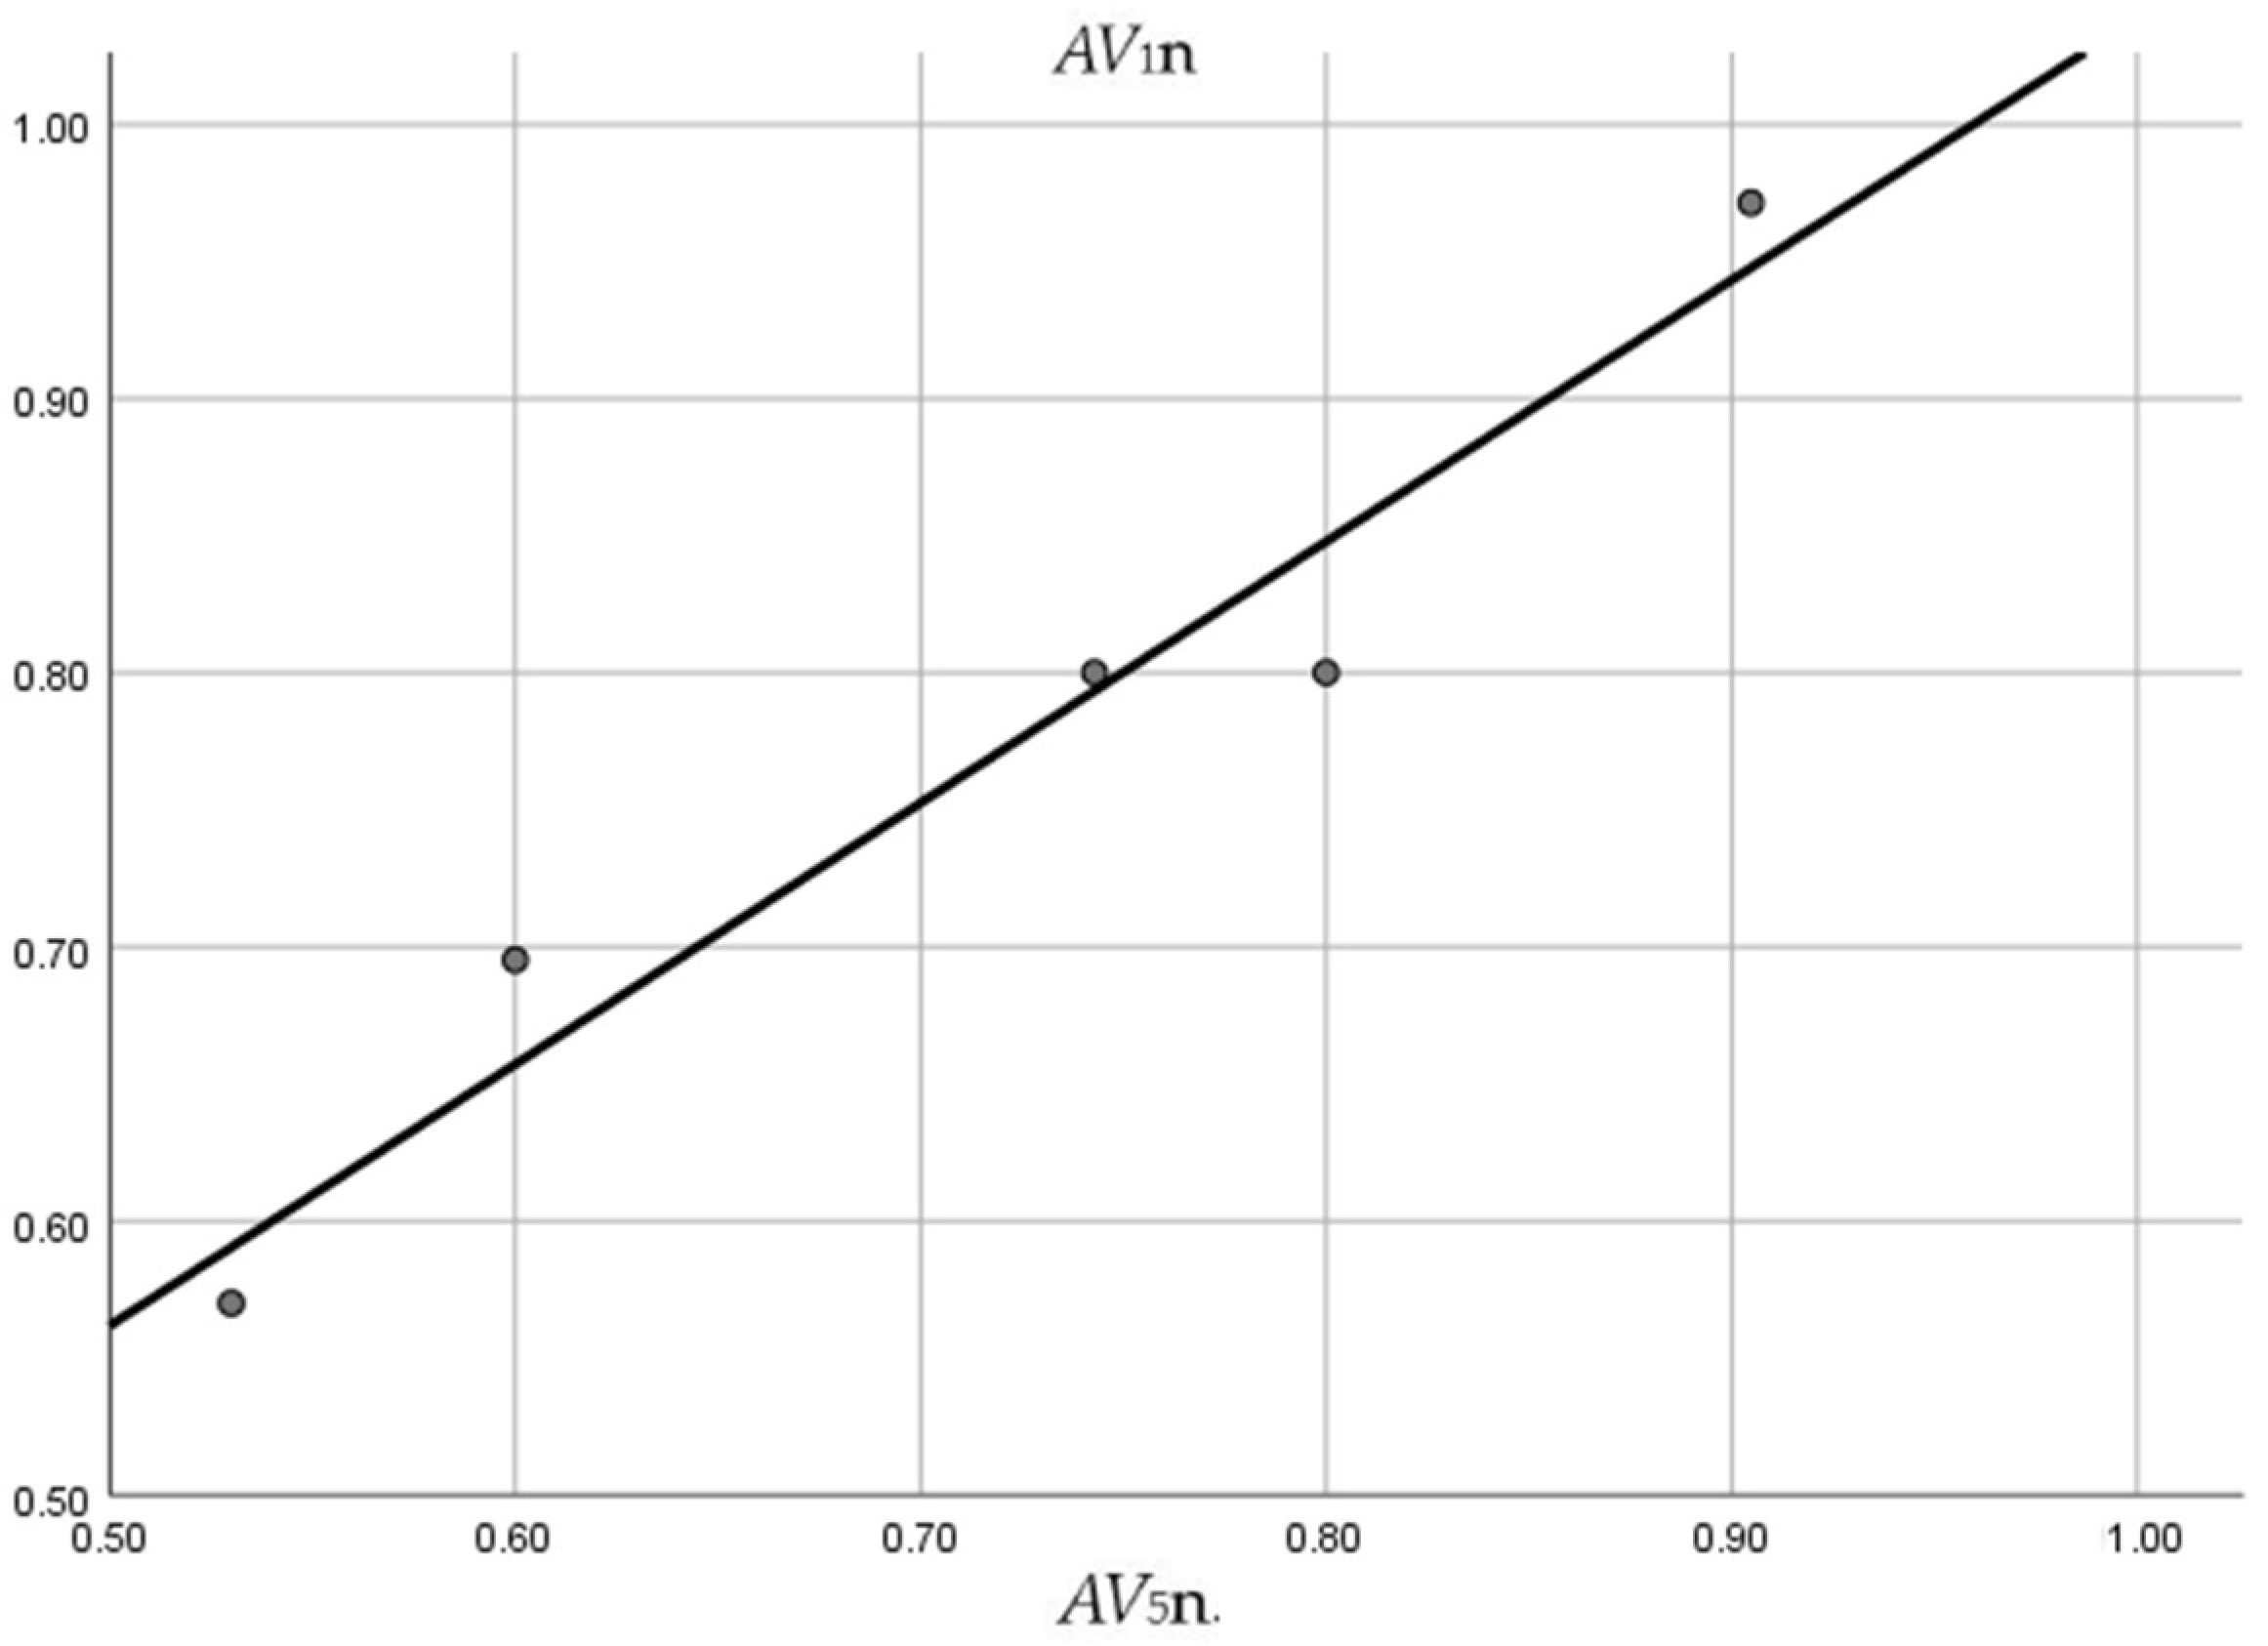
4.1.2. Determining Function Relationships Based on Function Fitting

The variable equation calculation function was determined based on the method of function fitting. Taking the fitting of the relationship between BIM personnel costs (AV1) and the difficulty level of BIM software operation (AV5) as examples, the function fitting process between variables AV1 and AV5 was calculated. Data was obtained through questionnaires, and the values of AV1 and AV5 were sorted in descending order and divided into five groups, so that AV1n and AV5n are the normalized averages of AV1 and AV5, respectively. The data processing results are shown in Table 4. The data was imported into SPSS 26 and the relationship between the variables was fitted based on the average value. The fitting results are shown in Figure 9.
The analysis results of curve estimation using SPSS 26 software show that the fit R2 of AV1 and AV5 is 0. 946, indicating a good curve fitting effect and a significant impact between variables. This is because, at the beginning of BIM development, AV1 was at a peak, with an initial value of 1. Therefore, the functional relationship between AV1 is obtained as follows:
A V 1 = 0.915 0.954 × A V 5
The fitting relationship of the other functions is shown below and will not be explained in detail. The function relationship is as follows:
A V 3 = 0.806 0.98 × A V 9
A V 4 = 0.078 + 1.0954 × E V 2
A V 5 = 0.206 + 0.772 × A V 7
A V 12 = 0.092 + 0.854 × E V 1

4.1.3. MIV Algorithm Determining Function

Based on the MIV algorithm to determine the function parameters, taking AV2 as an example, the function parameters between AV2, AV5, EV2, AV6, and AV7 was calculated. Based on the data obtained from the questionnaire among the five variables, a matrix with Input = [AV5 EV2 AV6 AV7], Output = [AV2] was constructed. Using MATLAB 2018, MIV1 = 0. 2425, MIV2 = 0. 1777, MIV3 = 0. 0657, and MIV4 = 0. 1832 were calculated, and normalized to obtain α1 = 0. 362, α2 = 0. 266, α3 = 0. 098, α4 = 0. 274. Therefore, the AV2 function relationship is:
A V 2 = 1 ( 0.353 × A V 5 + 0.64 × E V 2 + 0.007 × A V 7 )
The functional relationships of other MIV algorithms are shown below and will not be explained in detail. The calculation function relationships are as follows:
A V 6 = 0.327 × A V 8 + 0.182 × A V 9 + 0.491 × A V 13
A V 7 = 0.442 × E V 1 + 0.558 × E V 2
A V 8 = 0.087 × E V 1 + 0.018 × E V 2 + 0.19 × A V 9 + 0.211 × A V 10 + 0.193 × A V 11 + 0.141 × A V 12 + 0.16 × A V 13
A V 9 = 0.652 × E V 2 + 0.176 × A V 5 + 0.172 × A V 14
A V 10 = 0.169 × E V 1 0.081 × A V 2 0.277 × A V 3 + 0.12 × A V 4 + 0.353 × A V 14
A V 11 = 0.018 × E V 1 + 0.537 × A V 7 + 0.423 × A V 12 + 0.022 × A V 13
A V 13 = 0.052 × E V 1 0.539 × A V 1 + 0.295 × A V 4 + 0.114 × A V 10
A V 14 = 0.907 × E V 2 + 0.093 × A V 7

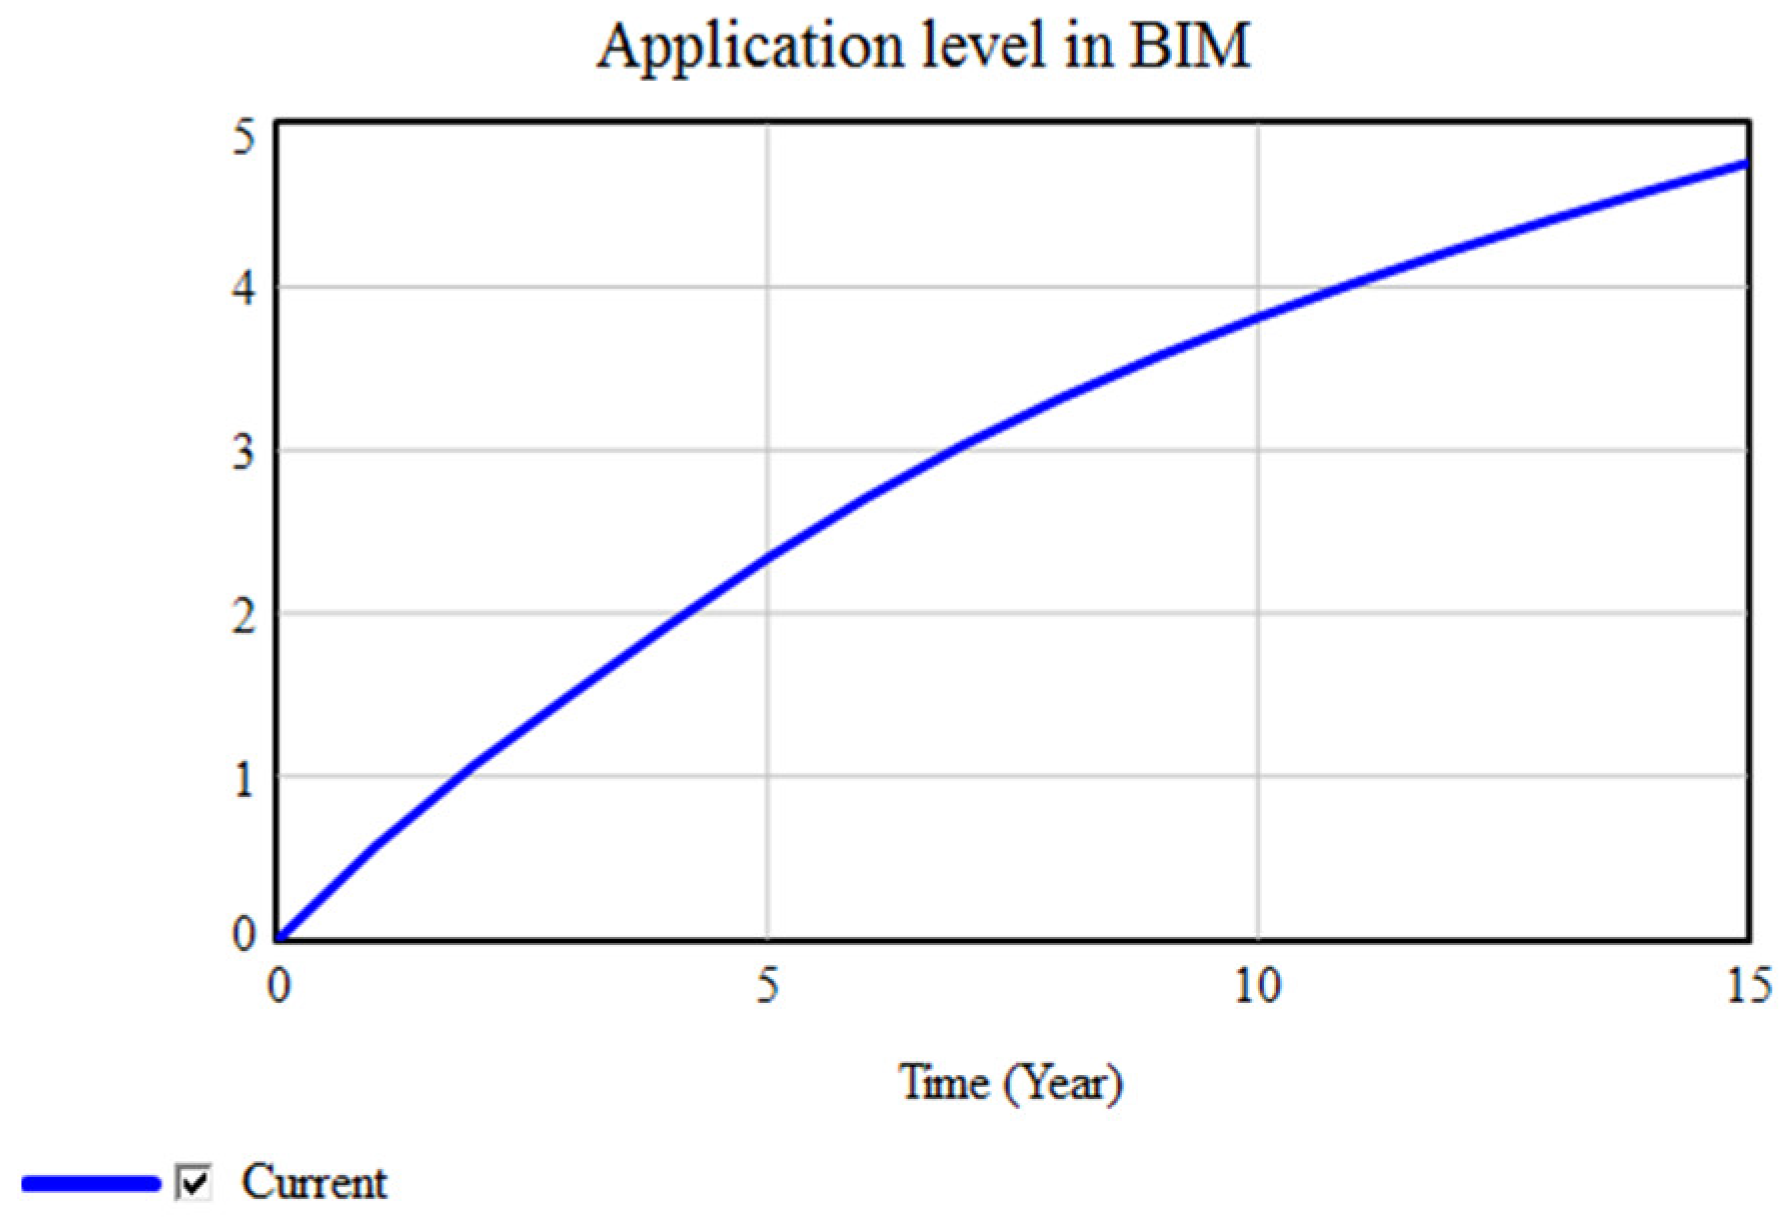
4.2. Model Verification

The various relational parameters obtained from the analysis were substituted into the Vensim software for modeling and verification of the model.
Whether the established model conforms to the actual situation was verified through model structural testing, and the established model was run to verify whether the changes in variables in the model meet the actual requirements and are consistent with expectations. The operating curves of the variables related to the system dynamics model are shown in Figure 10 and Figure 11.
After observing the operation of the model, the understanding of BIM technology by enterprises gradually increases over time, and the rate of improvement gradually slows down. This is mainly because, over time, research on BIM technology continues to deepen, practical experience on BIM projects continues to be enriched, and the understanding of BIM technology by enterprises continues to improve. This part has a saturation value, and as it approaches the saturation value, the rate of improvement in the effectiveness of its influencing factors decreases. The change in the application level of BIM technology at the organizational level affects the application level of BIM technology at the organizational level. The higher the change in the application level of BIM technology at the organizational level, the faster the improvement in the application level of BIM technology at the organizational level. Over time, it continues to decrease, and the rate continues to decrease. The main reason is that, at the beginning, the understanding of BIM technology at the organizational level is not deep enough. At this time, the application level of BIM technology at the organizational level changes relatively quickly. Over time, as the understanding of BIM technology continues to deepen, the application level of BIM technology at the organizational level will gradually flatten out and be at a higher level, at which point the application level at the organizational level will continuously decrease and tend toward a lower value. Preliminary judgments on various factors in the model were made. Overall, if the model is in line with the actual situation, further analysis can be conducted.

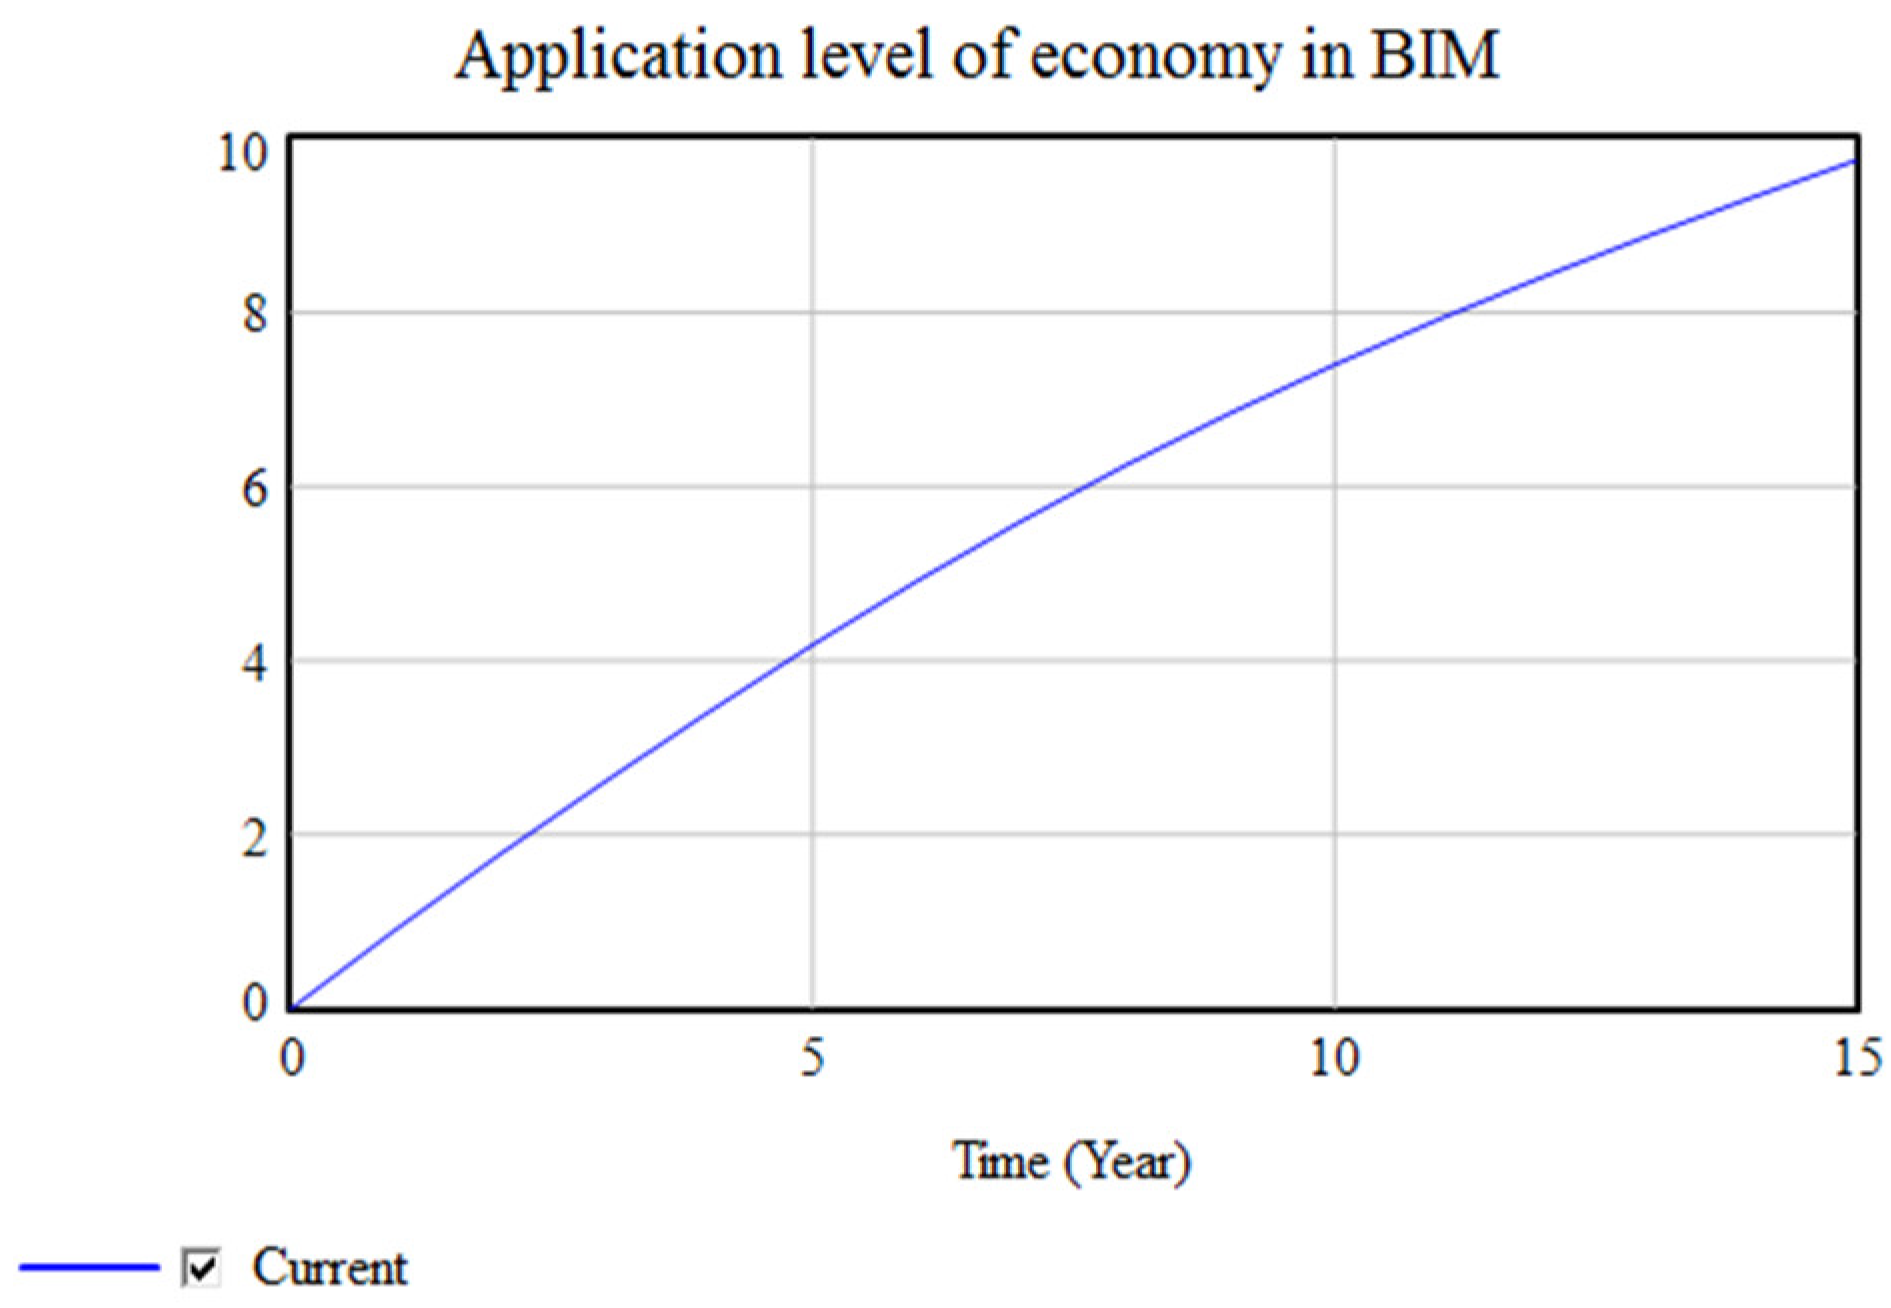
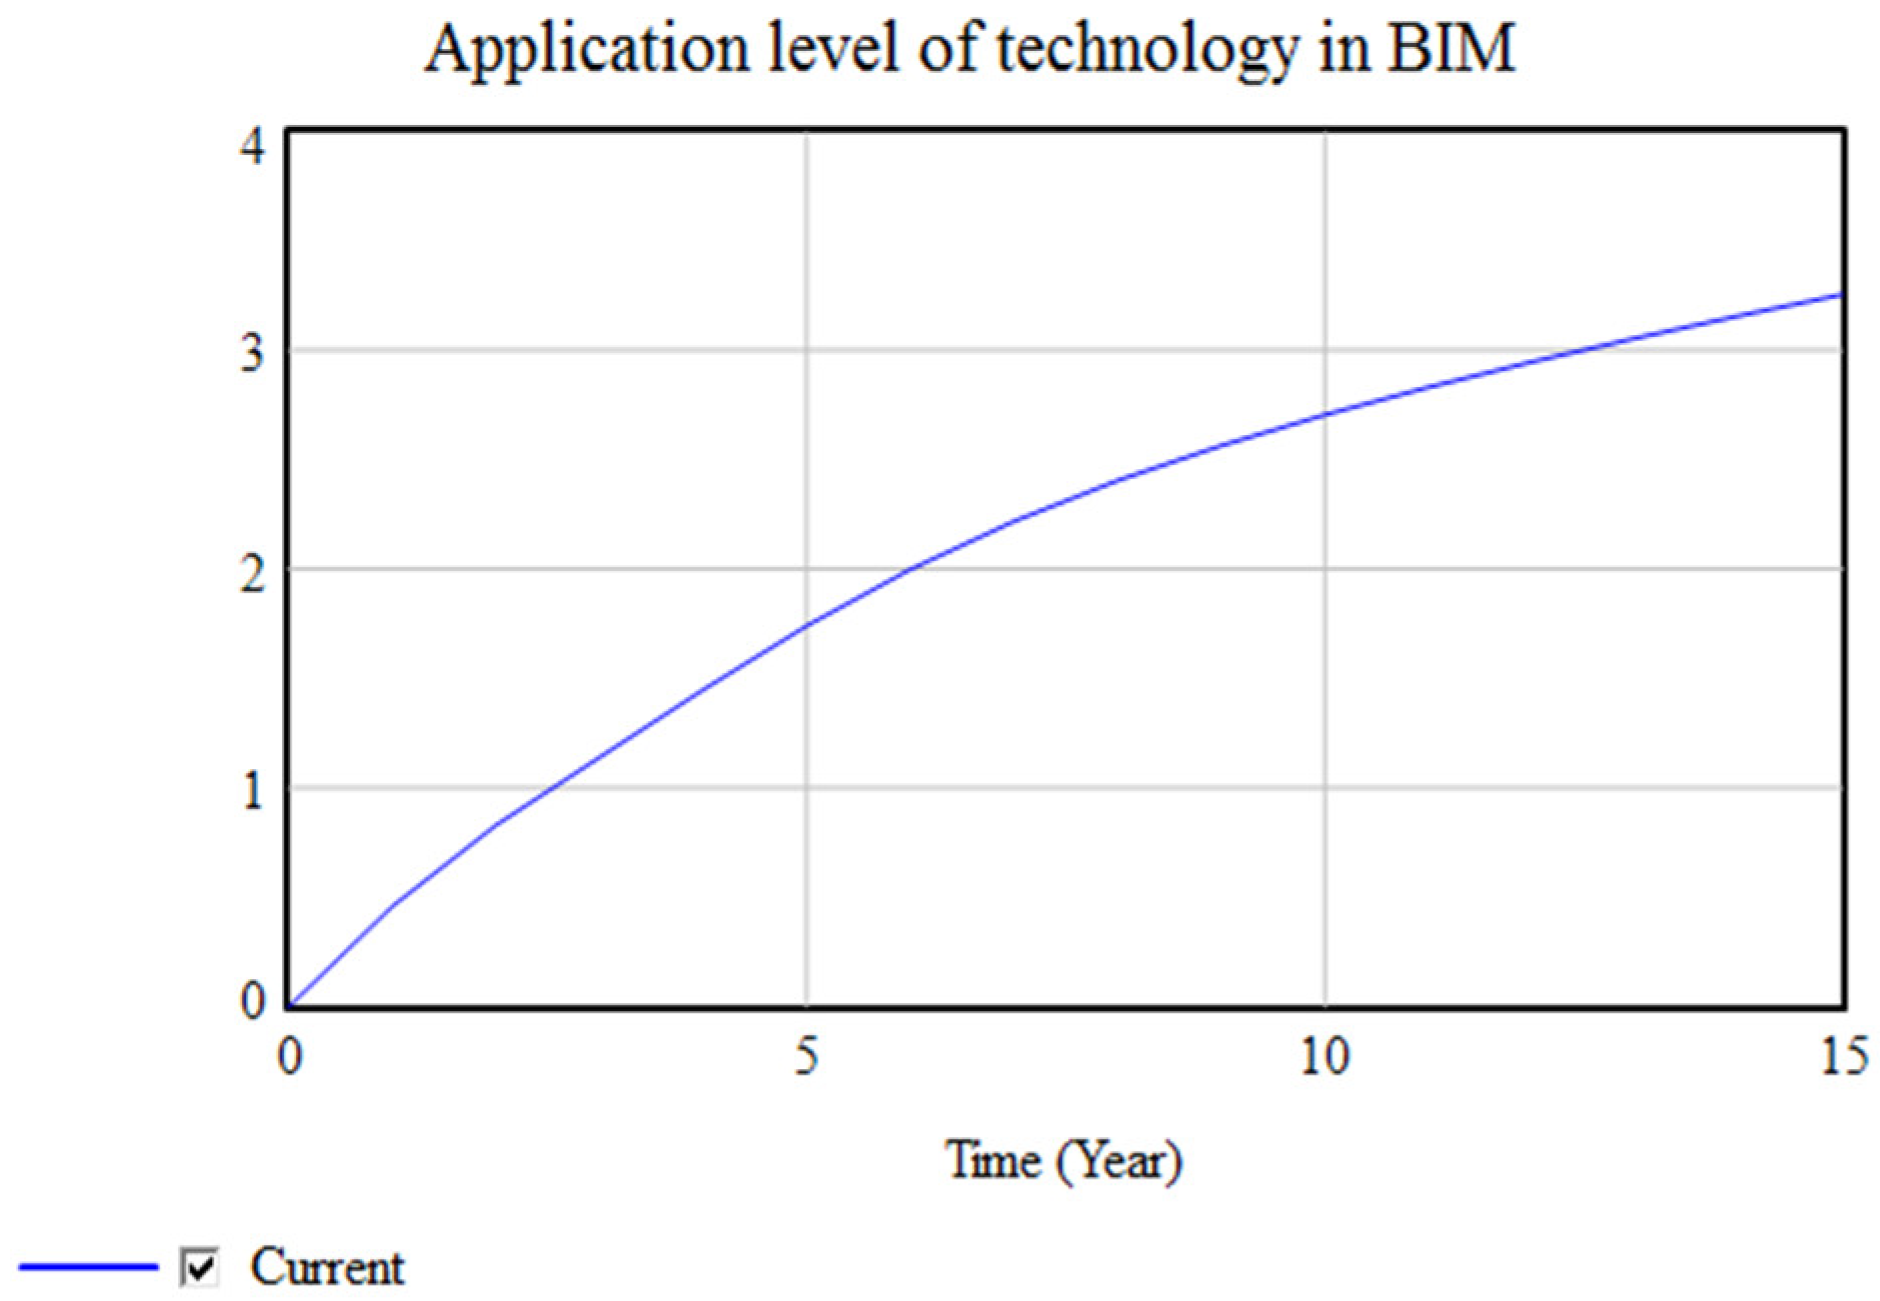
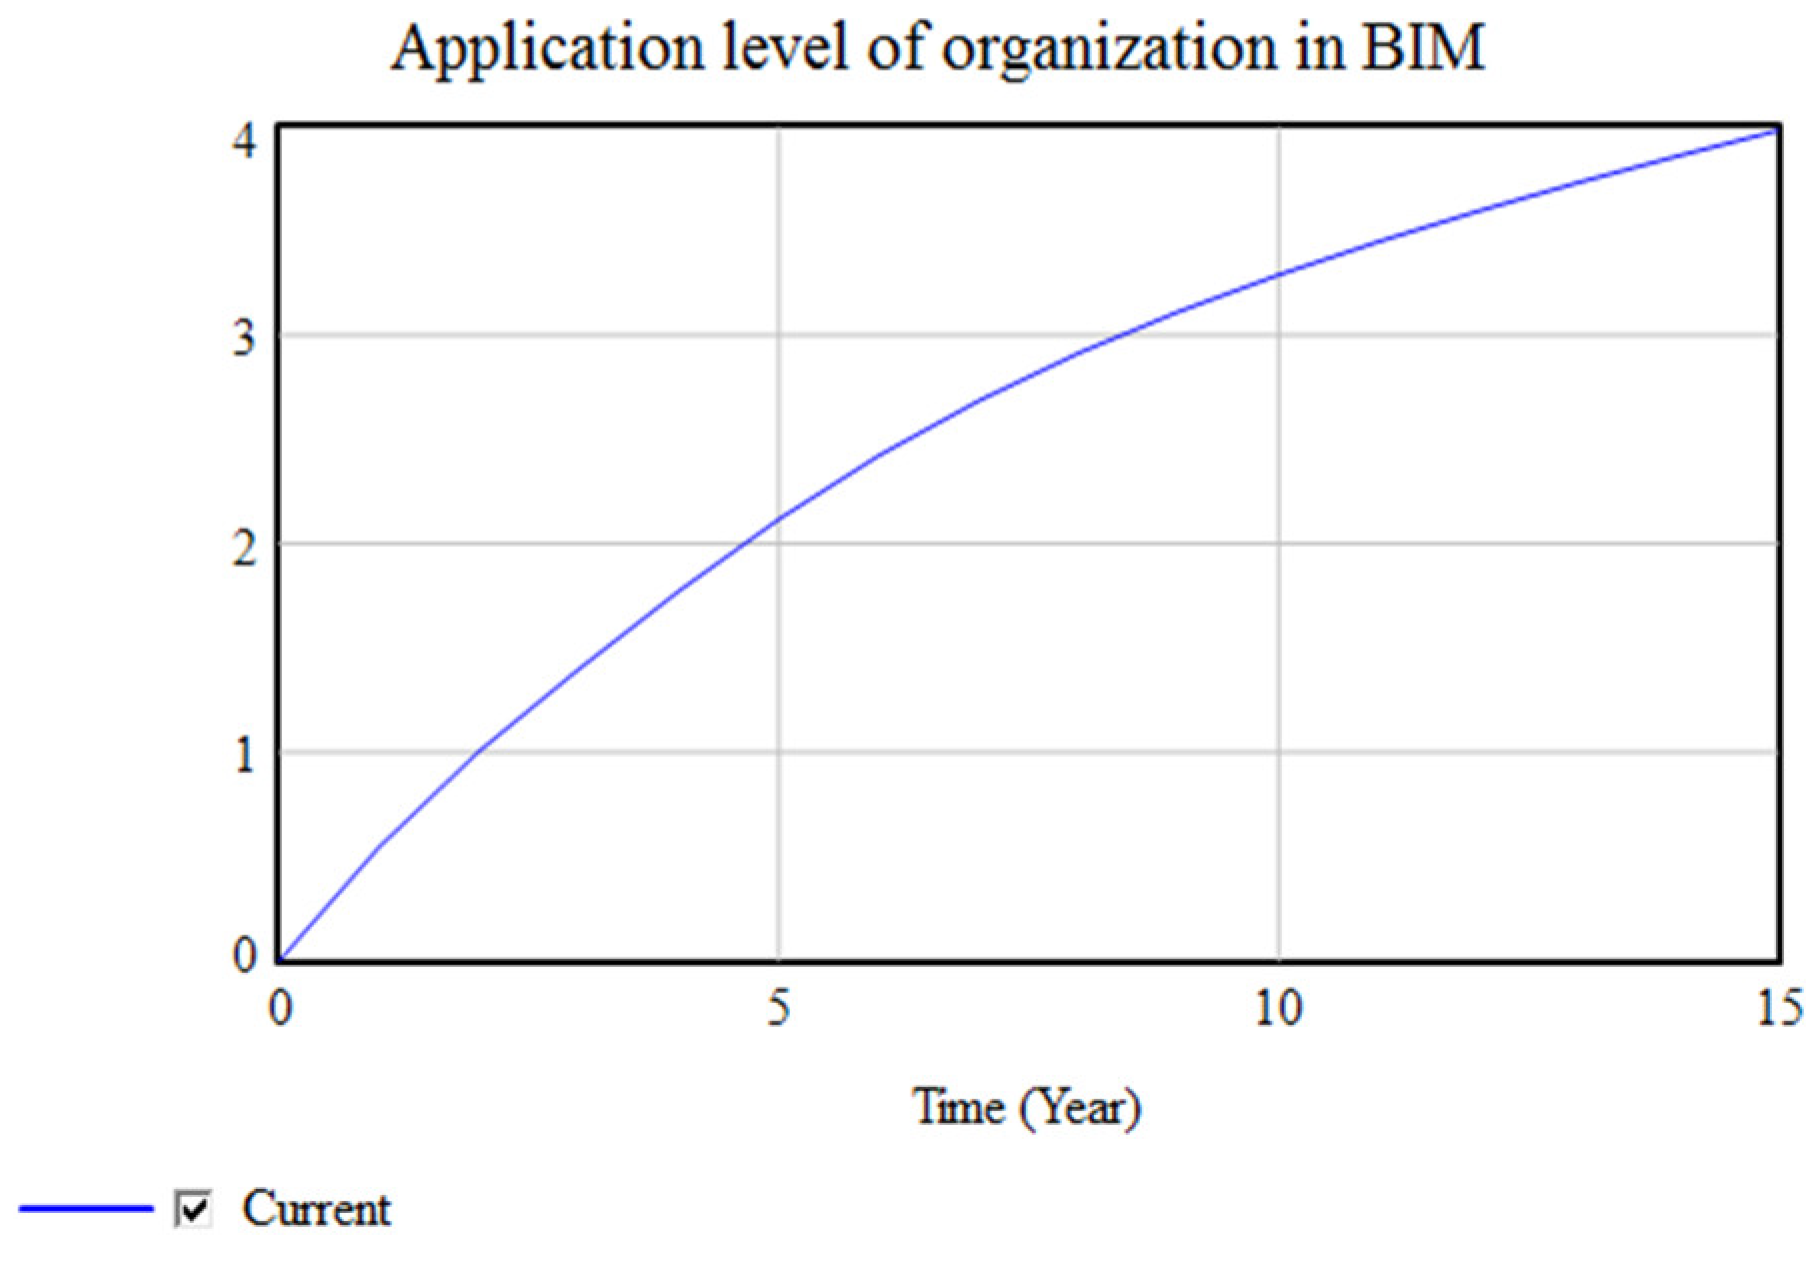
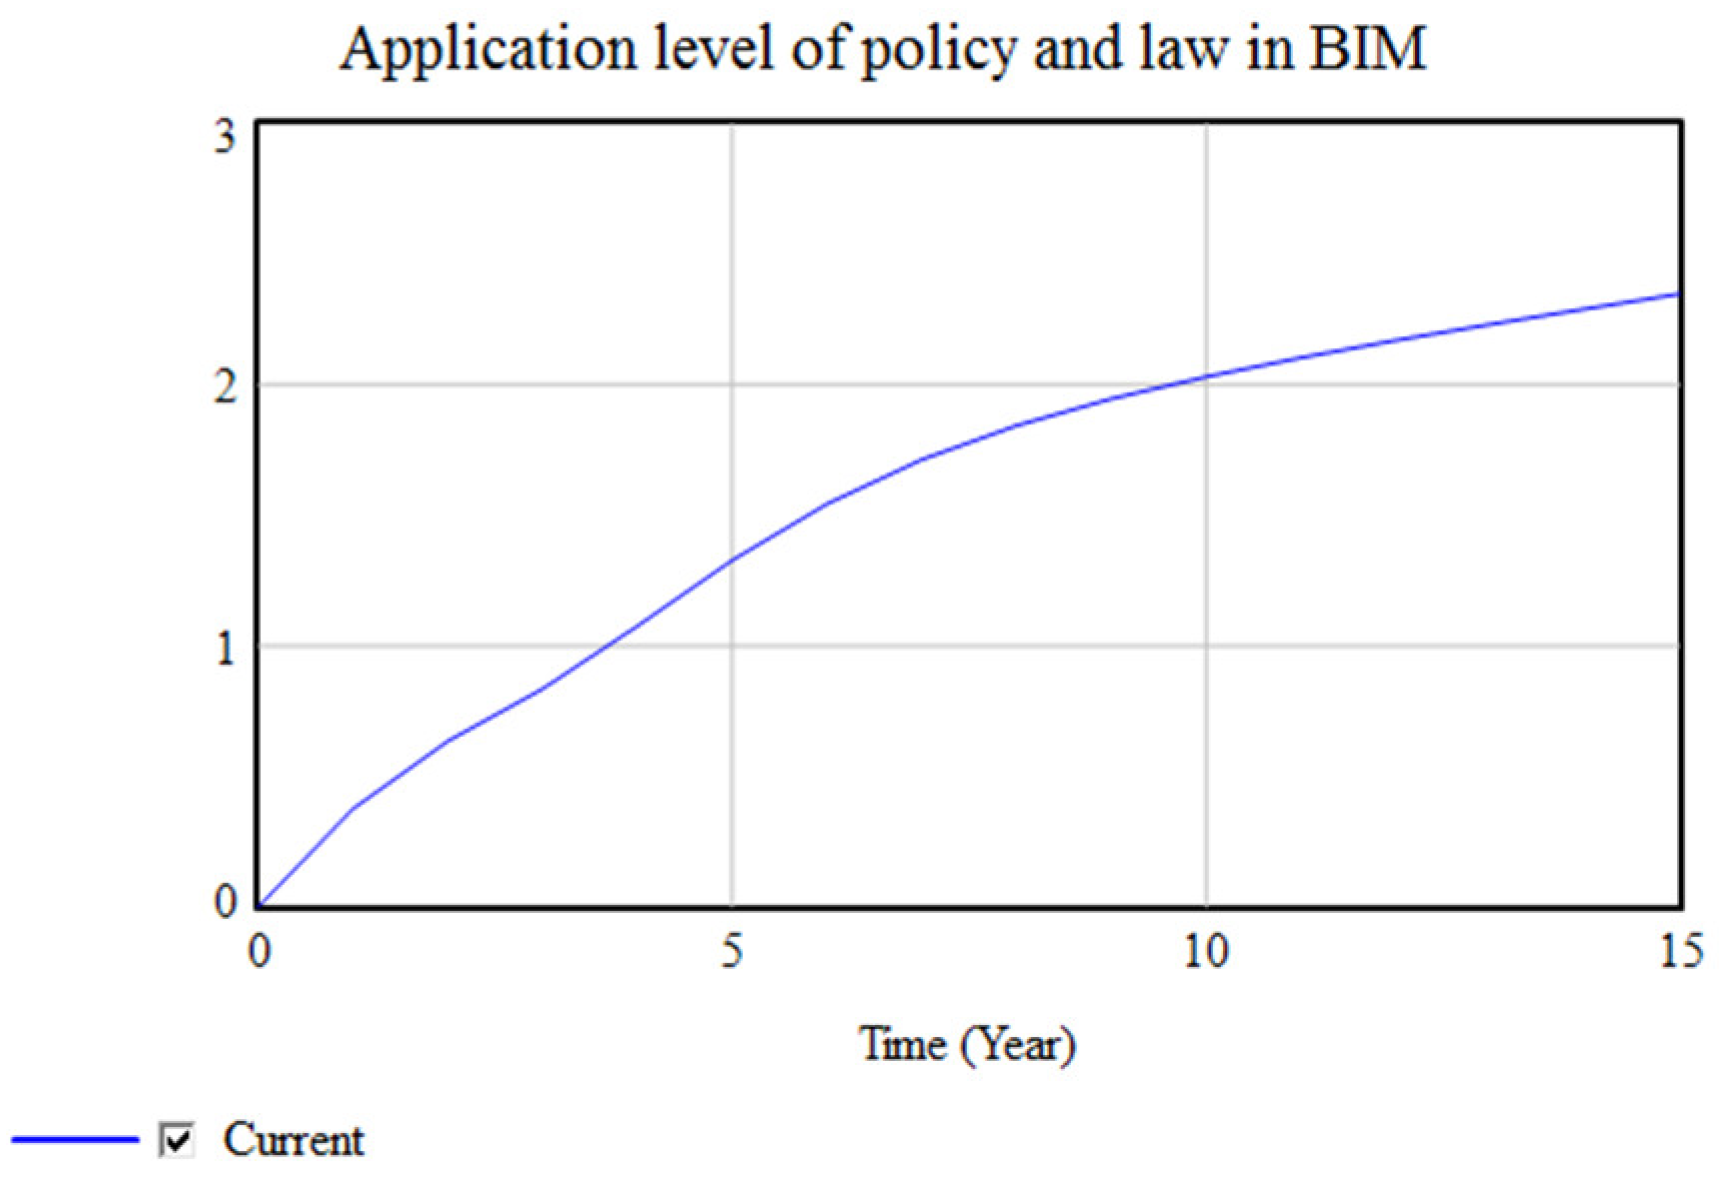
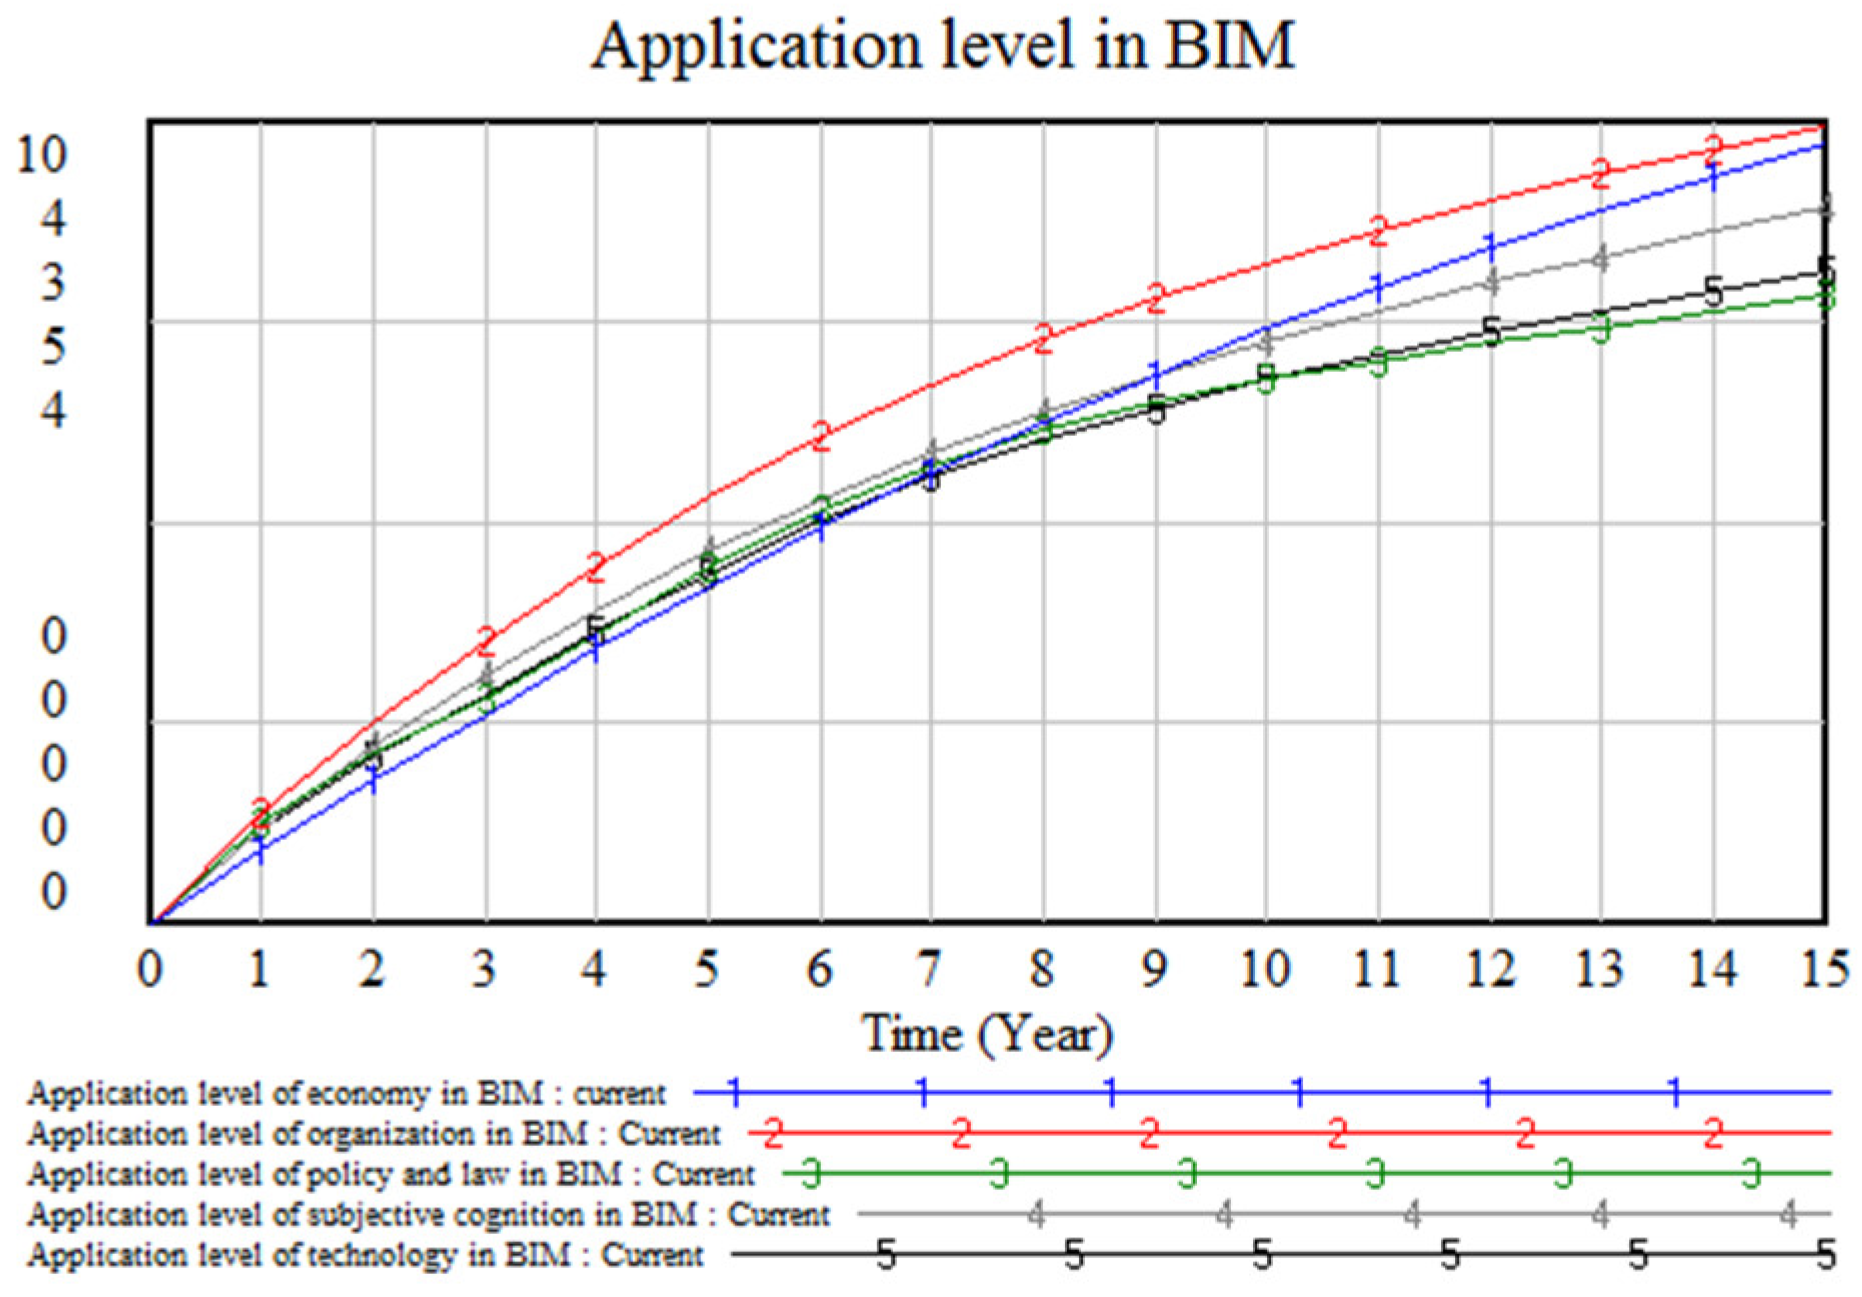
4.3. Analysis of System Dynamics Model Simulation Results

4.3.1. Analysis of the BIM Technology Application Performance Subsystem

According to the determined model parameters, each parameter was input into Vensim software to quantitatively simulate the system dynamics model. The simulation results of each subsystem obtained by running the model are shown in Figure 12, Figure 13, Figure 14, Figure 15, Figure 16 and Figure 17.
As time goes by, the application of BIM technology at various levels shows a continuous upward trend, with better and better results. However, not all of them are growing at the same rate. This is mainly because the economic benefits provided by BIM technology, the maturity of BIM technology, and the degree of collaboration among various stakeholders in projects are constantly increasing over time. Each factor is constantly maturing, and the increase in each factor is gradually slowing down over time. These factors play an important role in the application level of BIM technology at various levels, therefore, the application level of BIM technology at various levels continues to slow down over time.

4.3.2. Simulation Analysis of the BIM Application Level System

It is not enough to only simulate and analyze the operation of the BIM application performance subsystem. It is also necessary to comprehensively analyze the overall application performance of the system dynamics model, as shown in Figure 18.
The application level of BIM technology is showing a continuous upward trend, in which the application level of the economy in BIM, the application level of technology in BIM, the application level of organization in BIM, the application level of policy and law in BIM, and the application level of subjective cognition in BIM are all showing a continuous upward trend, working together for the overall application level system. If the influencing factors of a subsystem are changed, it will have an impact on the corresponding subsystem, but it will not have a significant impact on the overall application level. If a subsystem is changed, it will have a significant impact on the application level. Therefore, if we want to improve the application level of BIM technology, we not only need to focus on individual influencing factors but we also need to comprehensively observe each subsystem in order to most effectively improve the application level of BIM technology.

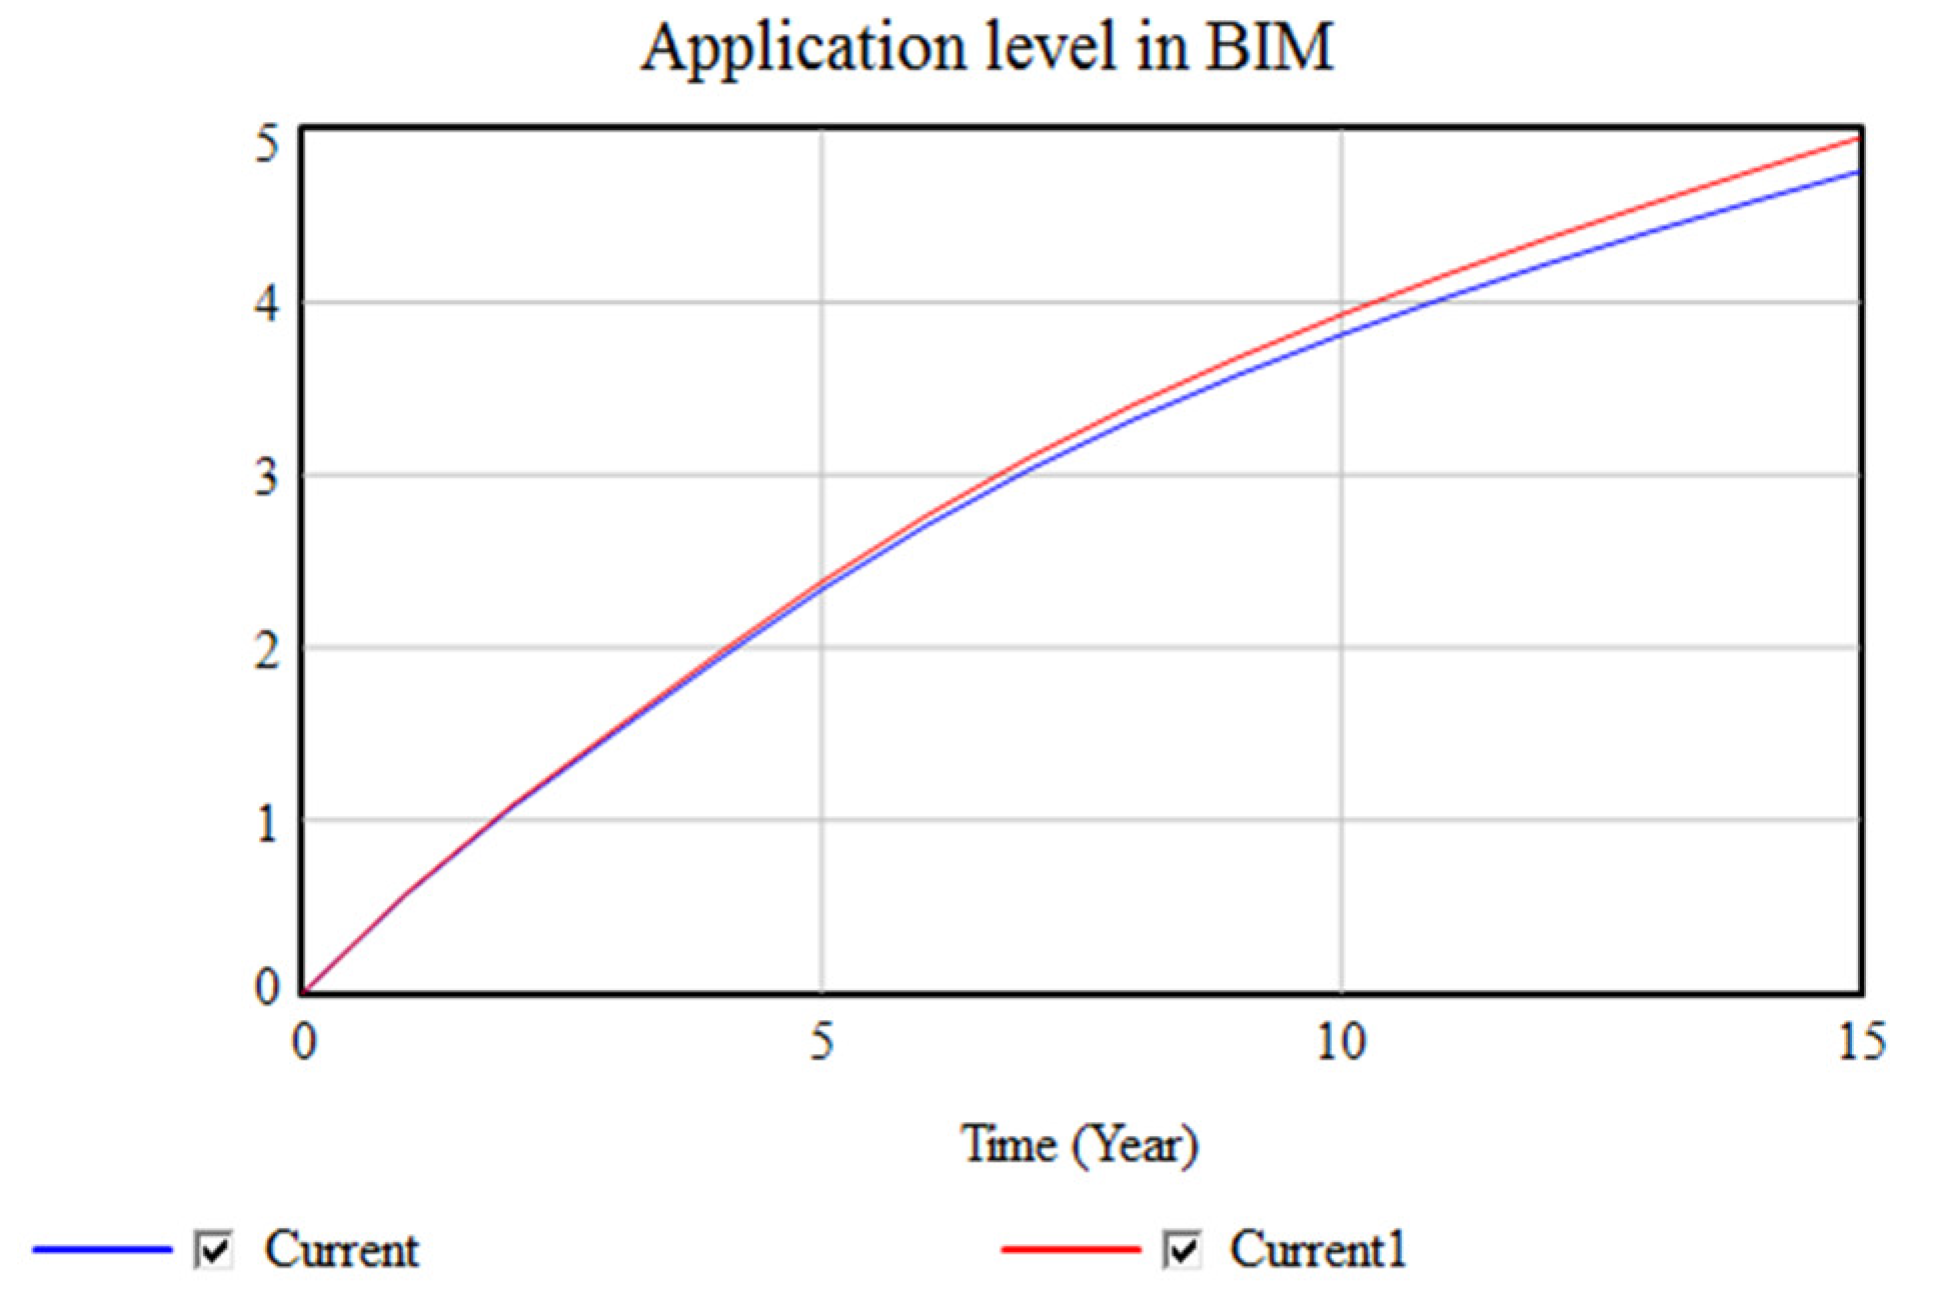
4.3.3. Single-Factor Simulation Analysis

In order to identify the key influencing factors of the application level of BIM technology, the sensitivity analysis function in the Vensim system dynamics software was used to conduct operational simulation analysis on the BIM technology application level model.
By controlling variables, the initial value of a certain variable is changed by 0.3 on the original basis, while keeping other factors unchanged. The system dynamics model is run to observe the impact of different changes in factors on the application level of BIM technology. The results of the two simulations after the change and before the change are compared, as shown in Figure 19.
Through simulation with a single variable, the application level of BIM technology has been improved to varying degrees. Due to numerous factors, the simulation diagram is not listed one by one. By changing these influencing factors, the application level of BIM technology will be correspondingly improved.
The quantitative analysis of the changes in the application level of BIM technology in Table 5 shows that the ranking of changes in the application level of BIM technology is influenced by various factors, which is a key factor affecting the application level of BIM technology. Analyzing the factors in the table, it can be found that the maturity of BIM technology, the difficulty of BIM software operation, and the degree of collaboration among various departments within an enterprise are the three most influential factors. Under the same investment of energy, the change in BIM technology maturity results is the largest change in BIM technology application level, and the order of changes is ranked later. This result provides a direction of change for the current improvement of BIM technology application. When the energy of a country or enterprise is limited, focusing on investment in BIM technology research, BIM software operation simplicity design, etc. can maximize other impacts of BIM technology application and improve the level of BIM technology application.

5. Demonstration of BIM Technology Application Cases

5.1. Case Background

The total construction cost of a certain engineering project is 1.14 billion yuan, with a total construction period of 1200 days and a total construction area of 175,000 square meters. Among the elements of the project, the office tower has a height of 185 m, with 35 floors above ground, the hotel tower has a height of 141 m, with 31 floors above ground, the podium building has a height of 25 m, with 3 floors above ground and 3 floors underground.
For the implementation and application of BIM in this project, a BIM engineering center was established at the company level, and BIM consultants provided suggestions and opinions. During the project, the person in charge of the project BIM team will set up the project BIM team, and formulate and assign BIM tasks, respectively, including responsibility for civil engineering, electromechanical installations, steel structural engineering, curtain wall installation, and other disciplines.

5.2. Application of BIM

5.2.1. Application of the BIM5D Management Platform in the Early Stages of Construction

Assistance in drawing reviewing and technical construction disclosure: Through the BIM integrated platform’s 3D visualization model, all parties involved in the construction can browse the 3D visualization model of the entire professional integrated model and check whether there are obvious unreasonable and incorrect designs for each profession.
Collision inspection and optimization can be conducted by integrating and modeling various professional models, and collision issues of the design model can be examined in the integrated model. Based on the collision inspection results, various professional participants can collaborate through the management platform.
Deepening construction design, by utilizing professional software in BIM models can achieve a deepening of secondary design, saving costs while improving work efficiency.

5.2.2. Application of the BIM5D Management Platform in the Construction Process

Track and manage construction materials: the BIM5D management platform categorizes and summarizes the management of materials and can track the usage status of construction materials through RFID feedback, and can dynamically manage various main materials during the construction process.
Quality, safety, progress, and cost management at the construction site: utilizing the BIM5D platform for quality and safety collaborative management can strictly control project quality and safety, and reduce engineering quality and safety risks.

5.2.3. Application of the BIM5D Management Platform in the Operation and Maintenance Phase

Utilizing the BIM management platform database to classify and manage the data in the database, and support preview and download of mobile, PC, and web clients, can provide traceable full lifecycle engineering project data for construction operation and maintenance.

5.2.4. Application Effectiveness of the BIM5D Management Platform

The project achieved certain results by using the BIM management platform under the collaborative work of all participants, and the specific results are as follows: building the BIM5D construction project management platform, establishing BIM models for all disciplines, assisting in the joint review of drawings and construction technology disclosure, collision inspection and optimization, deepening construction design, whole process construction simulation, construction site quality and safety, progress and cost management, and organic interaction analysis of big data for construction projects.

5.2.5. Shortcomings in the Application of the BIM5D Management Platform

The project achieved certain results in the research application of BIM technology, but due to some objective conditions and limitations regarding the level of researchers, there are also some areas that need further improvement and in-depth research:
The intelligence level of data collection on the BIM5D management platform is not high, and the construction of the BIM5D platform requires multiple specialties: the collection of multiple software supports, with each requiring continuous practice in software selection; some participating units had an insufficient understanding of the application of collaborative work on management platforms, and their enthusiasm for participation was not high enough; the accumulation of big data but the BIM management platform was insufficient; application in the operation and maintenance phase has not been validated yet, and its applicability is still difficult to evaluate; there is no comprehensive BIM usage standard, and the efficiency of data transfer among various stakeholders’ models is low.

5.3. Empirical Analysis of Factors Influencing BIM Application

To summarize, the shortcomings of BIM application in the above case, and analysis of the influencing factors of BIM technology application are shown in Table 6.
According to the analysis in Table 6, among the influencing factors that led to the insufficient application of BIM technology in the project, except for the experience factor of BIM technology application that changes over time and cannot be intervened by humans, all other influencing factors are key influencing factors analyzed using system dynamics models. Therefore, the reliability of key influencing factors is further verified through case studies.

5.4. Suggestions and Measures for Improving the Application of BIM Technology

Based on system dynamics model analysis of the influencing factors of BIM technology application and case application of the BIM technology empirical analysis, through single-factor sensitivity analysis, it can be concluded that the maturity of BIM technology, difficulty in getting started with the software, the degree of collaboration among various departments within an enterprise, and the recognition of BIM technology, as well as the acceptance of BIM technology by various stakeholders in a project, are the factors that have a significant impact on the application of BIM technology. In addition to making targeted changes to itself, based on the cause tree analysis in Vensim, as shown in Figure 20, taking the maturity of BIM technology as an example, in addition to strengthening research on related BIM technologies, the causal analysis of cause trees can also strengthen government support and the application of BIM technology in engineering projects to enhance the weight of BIM technology maturity factors. Based on the above analysis principles, the following measures and suggestions are proposed.

5.4.1. Optimize the BIM Training Mechanism and Strengthen Talent Cultivation

Strengthening the cultivation of BIM talent and improving the structure of BIM talent are key steps. From the perspective of enterprises, through the introduction of BIM talent, strengthening the enterprise’s BIM training methods, and establishing a BIM team, it becomes possible to continuously train BIM professional talent through both old and new methods and utilize mutual promotion among employees to create a BIM talent team. Resulting in economically reducing the cost of BIM application, promoting the rational updating and iteration of BIM software, promoting the development of BIM technology, improving the maturity of BIM technology, and enhancing the level of BIM technology application.

5.4.2. Strengthening the Enterprise Management Level

Enterprises still need to further improve their cultural construction, incentive and promotion mechanisms, function and responsibility allocation mechanisms, and salary optimization. The neglect of various aspects has led to shortcomings in the collaborative management of BIM technology application. Based on current development needs and resource status, it is necessary to form a sound BIM technology function system and responsibility sharing rules within an enterprise. The necessary steps include introducing BIM performance evaluation into the salary system; employee training embedded in BIM skills training; adding functional BIM management departments; improving enterprise rules and regulations; strengthening the application management of BIM technology in enterprises; and improving the level of BIM technology application.

5.4.3. The Government Strengthens the Importance of BIM and Improves the BIM Application Environment

Economically, the government plays a leading role by actively introducing BIM technology into relevant municipal projects, guiding enterprises to have a positive view of BIM technology and the positive adoption of BIM technology by all parties. In addition, it will be beneficial to introduce BIM related subsidy policies, increase the intensity and implementation details of BIM-related subsidies, reduce the cost risk of the application of BIM technology by enterprises, improve the level of adoption of BIM technology by enterprises, and promote the level of BIM technology application.
From a policy perspective, the government should improve the relevant laws and regulations as soon as possible, clarify the division of responsibilities, and formulate policies to protect BIM-related intellectual property rights. It should also establish standard specifications for the use of BIM technology, achieve the rationalization and standardization of BIM technology application, and comprehensively promote the application of BIM technology throughout the project lifecycle.

6. Conclusions

The emergence of BIM technology is an inevitable result of the continuous development of the times, and its application throughout the entire lifecycle of the construction industry is a trend. However, there are still shortcomings in the promotion and application of BIM technology in the construction industry. Currently, most research is based on the perspective of a single engineering stakeholder or does not have a clear judgment on the interaction mechanism between the factors influencing the application of BIM technology. This article uses a system dynamics model to quantitatively study the interaction mechanism between the factors influencing the application of BIM technology. Potential influencing factors of BIM application are identified through research of the literature, and the relationship between various factors is explored through expert interviews and questionnaire surveys. The MIV algorithm, function fitting method, and other methods are used to construct functional relationships between factors. Finally, the maturity of BIM technology, the difficulty of software operation, and collaboration among various departments within an enterprise have been identified as key influencing factors for BIM application. On this basis, without ensuring the reliability of the model’s research results, targeted improvement measures were proposed for key influencing factors based on empirical analysis of a large project case study in China, to improve the current level of BIM technology application and promote further development of BIM technology.
The results of this study provide ideas for improving the current application of BIM technology, but there are also some shortcomings that scholars need to pay attention to. The data sources for this study are all from China, so the research results are slightly different from the development direction of BIM technology in other countries. Due to the rapid development of BIM technology, the key influencing factors may vary in different periods, and research conclusions need to be updated frequently. This research conclusion is suitable for the current development needs of BIM technology application but may differ from the focus of BIM technology development ten years later, and further research will be needed.

Author Contributions

Conceptualization, J.D.; data curation, J.D. and X.L.; formal analysis, J.D. and J.R.; funding acquisition, J.R.; investigation, J.D. and X.L.; methodology, J.D. and X.L.; project administration, J.D. and X.L.; resources, J.D.; software, X.L.; supervision, J.D. and J.R.; validation, J.D. and X.L.; visualization, X.L. and J.R.; writing—original draft, J.D. and X.L.; writing—review and editing, J.D. and J.R. All authors have read and agreed to the published version of the manuscript.

Funding

This research was funded by the Xiamen Construction Bureau Project through project No. XJK2019-1-7 and the Xiamen Key Laboratory of Integrated Application of Intelligent Technology for Architectural Heritage Protection, Xiamen University.

Data Availability Statement

Due to the privacy aspect of the questionnaire data in the article, the data is currently not publicly available.

Conflicts of Interest

The authors declare no conflict of interest.

References

  1. Fargnoli, M.; Lombardi, M. Building information modelling (BIM) to enhance occupational safety in construction activities: Research trends emerging from one decade of studies. Buildings 2020, 10, 98. [Google Scholar] [CrossRef]
  2. Fernández Rodríguez, J.F. Implementation of BIM Virtual Models in Industry for the Graphical Coordination of Engineering and Architecture Projects. Buildings 2023, 13, 743. [Google Scholar] [CrossRef]
  3. Mancini, M.; Wang, X.; Skitmore, M.; Issa, R. Editorial for IJPM special issue on advances in building information modeling (BIM) for construction projects. Int. J. Proj. Manag. 2017, 35, 656–657. [Google Scholar] [CrossRef]
  4. Eleftheriadis, S.; Mumovic, D.; Greening, P. Life cycle energy efficiency in building structures: A review of current developments and future outlooks based on BIM capabilities. Renew. Sustain. Energy Rev. 2017, 67, 811–825. [Google Scholar] [CrossRef]
  5. Ghaffarianhoseini, A.; Tookey, J.; Ghaffarianhoseini, A.; Naismith, N.; Azhar, S.; Efimova, O.; Raahemifar, K. Building Information Modelling (BIM) uptake: Clear benefits, understanding its implementation, risks and challenges. Renew. Sustain. Energy Rev. 2017, 75, 1046–1053. [Google Scholar] [CrossRef]
  6. Zheng, L.; Lu, W.; Chen, K.; Chau, K.W.; Niu, Y. Benefit sharing for BIM implementation: Tackling the moral hazard dilemma in inter-firm cooperation. Int. J. Proj. Manag. 2017, 35, 393–400. [Google Scholar] [CrossRef]
  7. Pezeshki, Z.; Ivari, S.A.S. Applications of BIM: A Brief Review and Future Outline. Arch. Comput. Methods Eng. 2018, 25, 273–312. [Google Scholar] [CrossRef]
  8. Oesterreich, T.; Teuteberg, F. Looking at the big picture of IS investment appraisal through the lens of systems theory A System Dynamics approach for understanding the economic impact of BIM. Comput. Ind. 2018, 99, 262–281. [Google Scholar] [CrossRef]
  9. Yuan, H.; Yang, Y. BIM adoption under government subsidy: Technology diffusion perspective. J. Constr. Eng. Manag. 2020, 146, 04019089. [Google Scholar] [CrossRef]
  10. Belay, S.; Goedert, J.; Woldesenbet, A.; Rokooei, S.; Matos, J.; Sousa, H. Key BIM adoption drivers to improve performance of infrastructure projects in the Ethiopian construction sector: A Structural equation modeling approach. Adv. Civ. Eng. 2021, 2021, 1–12. [Google Scholar] [CrossRef]
  11. Xu, H.; Chang, R.; Dong, N.; Zuo, J.; Webber, R.J. Interaction mechanism of BIM application barriers in prefabricated construction and driving strategies from stakeholders’ perspectives. Ain Shams Eng. J. 2023, 14, 101821. [Google Scholar] [CrossRef]
  12. Lee, S.K.; Song, J.; Yu, J.H. Comparative Analysis of BIM Performance between Korea and China using IPA. J. Archit. Inst. Korea 2021, 37, 317–326. [Google Scholar]
  13. Ding, Z.; Zuo, J.; Wu, J.; Wang, J.Y. Key factors for the BIM adoption by architects: A China study. Eng. Constr. Archit. Manag. 2015, 22, 732–748. [Google Scholar] [CrossRef]
  14. Oraee, M.; Hosseini, M.R.; Edwards, D.J.; Li, H.; Papadonikolaki, E.; Cao, D. Collaboration barriers in BIM-based construction networks: A conceptual model. Int. J. Proj. Manag. 2019, 37, 839–854. [Google Scholar] [CrossRef]
  15. Wu, P.; Jin, R.; Xu, Y.; Lin, F.; Dong, Y.; Pan, Z. The analysis of barriers to BIM implementation for industrialized building construction: A China study. J. Civ. Eng. Manag. 2021, 27, 1–13. [Google Scholar] [CrossRef]
  16. Cao, D.; Wang, G.; Li, H.; Skitmore, M.; Huang, T.; Zhang, W. Practices and effectiveness of building information modelling in construction projects in China. Autom. Constr. 2015, 49, 113–122. [Google Scholar] [CrossRef]
  17. Tan, T.; Chen, K.; Xue, F.; Lu, W. Barriers to Building Information Modeling (BIM) implementation in China’s prefabricated construction: An interpretive structural modeling (ISM) approach. J. Clean. Prod. 2019, 219, 949–959. [Google Scholar] [CrossRef]
  18. Al-Ashmori, Y.Y.; Othman, I.; Rahmawati, Y.; Amran, Y.M.; Sabah, S.A.; Rafindadi, A.D.U.; Mikić, M. BIM benefits and its influence on the BIM implementation in Malaysia. Ain Shams Eng. J. 2020, 11, 1013–1019. [Google Scholar] [CrossRef]
  19. Liao, L.; Teo, E.A.L. Critical success factors for enhancing the building information modelling implementation in building projects in Singapore. J. Civ. Eng. Manag. 2017, 23, 1029–1044. [Google Scholar] [CrossRef]
  20. Mellado, F.; Lou, E.C.W. Building information modelling, lean and sustainability: An integration framework to promote performance improvements in the construction industry. Sustain. Cities Soc. 2020, 61, 102355. [Google Scholar] [CrossRef]
  21. Alreshidi, E.; Mourshed, M.; Rezgui, Y. Factors for effective BIM governance. J. Build. Eng. 2017, 10, 89–101. [Google Scholar] [CrossRef]
  22. Ullah, K.; Witt, E.; Lill, I. The BIM-based building permit process: Factors affecting adoption. Buildings 2022, 12, 45. [Google Scholar] [CrossRef]
  23. Zhang, W.; Li, J.; Liang, Z. Barriers to Building Information Modeling from an Individual Perspective in the Chinese Construction Industry: An Extended Unified Theory of Acceptance and Use of Technology. Buildings 2023, 13, 1881. [Google Scholar] [CrossRef]
  24. Almarri, K.; Aljarman, M.; Boussabaine, H. Emerging contractual and legal risks from the application of building information modelling. Eng. Constr. Archit. Manag. 2019, 26, 2307–2325. [Google Scholar] [CrossRef]
  25. Aljarman, M. Emerging Risk from the Application of Building Information Modelling through the Life Cycle of Projects. Ph.D. Thesis, The University of Liverpool, Liverpool, UK, 2016. [Google Scholar]
  26. Liao, L.; Teo, E.A.L.; Chang, R. Reducing critical hindrances to building information modeling implementation: The case of the Singapore construction industry. Appl. Sci. 2019, 9, 3833. [Google Scholar] [CrossRef]
  27. Olawumi, T.O.; Chan, D.W.M. Building information modelling and project information management framework for construction projects. J. Civ. Eng. Manag. 2019, 25, 53–75. [Google Scholar] [CrossRef]
  28. Deng, Y.; Rao, Z.; Cai, L. Comprehensive Evaluation of BIM Calculation Quantity in Domestic Construction Engineering Based on Fuzzy Comprehensive Evaluation. Comput. Intell. Neurosci. 2021, 2021, 3292376. [Google Scholar] [CrossRef]
  29. Phang, T.C.H.; Chen, C.; Tiong, R.L.K. New model for identifying critical success factors influencing BIM adoption from precast concrete manufacturers’ view. J. Constr. Eng. Manag. 2020, 146, 04020014. [Google Scholar] [CrossRef]
  30. Jang, S.; Lee, G. Process, productivity, and economic analyses of BIM–based multi-trade prefabrication—A case study. Autom. Constr. 2018, 89, 86–98. [Google Scholar] [CrossRef]
  31. Cui, Q.; Hu, X.; Liu, X.; Zhao, L.; Wang, G. Understanding architectural designers’ continuous use intention regarding BIM technology: A China case. Buildings 2021, 11, 448. [Google Scholar] [CrossRef]
  32. Adekunle, S.A.; Ejohwomu, O.; Aigbavboa, C.O. Building information modelling diffusion research in developing countries: A user meta-model approach. Buildings 2021, 11, 264. [Google Scholar] [CrossRef]
  33. Jin, R.; Hancock, C.M.; Tang, L.; Wanatowski, D. BIM investment, returns, and risks in China’s AEC industries. J. Constr. Eng. Manag. 2017, 143, 04017089. [Google Scholar] [CrossRef]
  34. Seyis, S. Pros and cons of using building information modeling in the AEC industry. J. Constr. Eng. Manag. 2019, 145, 04019046. [Google Scholar] [CrossRef]
  35. Oesterreich, T.D.; Teuteberg, F. Behind the scenes: Understanding the socio-technical barriers to BIM adoption through the theoretical lens of information systems research. Technol. Forecast. Soc. Chang. 2019, 146, 413–431. [Google Scholar] [CrossRef]
  36. Abbasnejad, B.; Nepal, M.P.; Ahankoob, A.; Nasirian, A.; Drogemuller, R. Building Information Modelling (BIM) adoption and implementation enablers in AEC firms: A systematic literature review. Archit. Eng. Des. Manag. 2021, 17, 411–433. [Google Scholar] [CrossRef]
Figure 1. Cause and effect diagram.
Buildings 13 02794 g001
Figure 2. Economic level application flow diagram.
Buildings 13 02794 g002
Figure 3. Technical level application flow diagram.
Buildings 13 02794 g003
Figure 4. Organizational level application flow diagram.
Buildings 13 02794 g004
Figure 5. Political and legal level application flow diagram.
Buildings 13 02794 g005
Figure 6. Subjectively cognitive level application flow diagram.
Buildings 13 02794 g006
Figure 7. BIM technology application flow diagram.
Buildings 13 02794 g007
Figure 8. The F(t) function.
Buildings 13 02794 g008
Figure 9. AV1 and AV5 curve-fitting results.
Buildings 13 02794 g009
Figure 10. Enterprise’s understanding of BIM technology.
Buildings 13 02794 g010
Figure 11. Changes in organizational aspects of BIM.
Buildings 13 02794 g011
Figure 12. Application level of the economy in BIM.
Buildings 13 02794 g012
Figure 13. Application level of technology in BIM.
Buildings 13 02794 g013
Figure 14. Application level of organization in BIM.
Buildings 13 02794 g014
Figure 15. Application level of policy and law in BIM.
Buildings 13 02794 g015
Figure 16. Application level of subjective cognition in BIM.
Buildings 13 02794 g016
Figure 17. Application level of BIM.
Buildings 13 02794 g017
Figure 18. Application level of BIM.
Buildings 13 02794 g018
Figure 19. Changes in BIM application level.
Buildings 13 02794 g019
Figure 20. Causes tree.
Buildings 13 02794 g020
Table 1. Factors affecting BIM application.
Factor CategoriesInfluence FactorReferences
Economic factorsBIM personnel costs[8,11,12,20]
BIM application costs[12,15,18,21]
BIM cost management in enterprises[9,10,20,22]
Economic benefits provided by BIM technology[1,23,24,25]
Technical factorsThe difficulty level of BIM software operation[21,22,26,27]
Model transmission efficiency at each stage[4,10,23,27]
BIM technology maturity[12,20,23,25]
Organizational factorsDegree of collaboration among various stakeholders in the project[5,20,22,28]
Degree of collaboration among various departments within an enterprise[10,15,18,29]
Clarity of BIM requirements[14,17,29,30]
Political and legal factorsThe level of government support for BIM[9,10,13,26]
Degree of BIM application standards and specifications[9,23,31,32]
Clarity of legal liability boundaries for BIM application[5,10,11,25]
Subjectively cognitive FactorsThe acceptance of BIM technology by all stakeholders in the project[3,9,31,33]
Degree of BIM application standards and specifications[15,17,34,35]
BIM technology application experience[11,27,32,36]
Table 2. System dynamics impact indicators.
SystemPrimary FactorsSecondary Factors
Application level in BIMApplication level of economy in BIMBIM personnel costs
BIM application costs
BIM cost management in enterprises
Economic benefits provided by BIM technology
Application level of technology in BIMThe difficulty level of BIM software operation
Model transmission efficiency at each stage
BIM technology maturity
Application level of organization in BIMDegree of collaboration among various stakeholders in the project
Degree of collaboration among various departments within an enterprise
Clarity of BIM requirements
Application level of policy and law in BIMThe level of government support for BIM
Degree of BIM application standards and specifications
Clarity of legal liability boundaries for BIM application
Application level of subjective cognition in BIMThe acceptance of BIM technology by all stakeholders in the project
Degree of BIM application standards and specifications
BIM technology application experience
Table 3. System dynamics variables table.
Variable (in Dimensionless Units)
State variables
(SVi)
i = 1–5, 1 represents the application level of economy in BIM, 2 represents the application level of technology in BIM, 3 represents the application level of the organization in BIM, 4 represents the application level of policy and law in BIM, and 5 represents the application level of subjective cognition in BIM.
Decision variables
(DVi)
i = 1–5, 1 represents the changes in the economic aspects of BIM, 2 represents the changes in the technical aspects of BIM, 3 represents the changes in the organizational aspects of BIM, 4 represents the changes in the political and legal aspects of BIM, and 5 represents the changes in the subjectively cognitive aspects of BIM.
Auxiliary variable
(AVi)
i = 1–14, 1 represents BIM application costs, 2 represents BIM personnel costs, 3 represents BIM cost management in enterprises, 4 represents the economic benefits provided by BIM technology, 5 represents the difficulty level of BIM software operation, 6 represents model transmission efficiency at each stage, 7 represents BIM technology maturity, 8 represents the degree of collaboration among various stakeholders in the project, 9 represents the degree of collaboration among various departments within an enterprise, 10 represents the clarity of BIM requirements, 11 represents the degree of BIM application standards and specifications, 12 represents the clarity of legal liability boundaries for BIM applications, 13 represents the acceptance of BIM technology by all stakeholders in the project, and 14 represents an enterprise’s understanding of BIM technology.
Exogenous variable
(EVi)
i = 1–2, 1 represents the level of government support for BIM, and 2 represents BIM technology application experience.
Table 4. Model description and parameter estimation.
Model DescriptionParameter
Estimation Value
EquationR2FDegree of Freedom 1Degree of Freedom 2SignificanceConstantb1
linear0. 94652. 395130. 0050. 0850. 954
Independent variable: AV5n. Dependent variable: AV1n.
Table 5. Ranking of influencing factors.
Influence FactorBIM Technology Application LevelApplication Level Change RateRanking
CurrentCurrent 1
BIM technology maturity4.7575.54516.57%1
The difficulty level of BIM software operation4.7575.37813.05%2
Degree of collaboration among various departments within an enterprise4.7575.24010.15%3
An enterprise’s understanding of BIM technology4.7575.1067.34%4
BIM personnel costs4.7575.0866.92%5
The acceptance of BIM technology by all stakeholders in the project4.7575.0476.1%6
The economic benefits provided by BIM technology4.7575.0345.82%7
Clarity of BIM requirements4.7575.0075.26%8
Table 6. Empirical analysis of key influencing factors.
Shortcomings in BIM ApplicationEmpirical Analysis of BIM Influencing Factors
Intelligence level in data collectionBIM technology maturity
Incomplete softwareThe difficulty level of BIM software operation
Insufficient understanding of collaborative work among project stakeholdersDegree of collaboration among various stakeholders in the project;
The acceptance of BIM technology by all stakeholders in the project
Insufficient data accumulation on BIM management platformBIM technology application experience
The application in the operation and maintenance phase is very lackingBIM technology application experience
Lack of comprehensive BIM usage standardsAn enterprise’s understanding of BIM technology;
Clarity of BIM requirements
Disclaimer/Publisher’s Note: The statements, opinions and data contained in all publications are solely those of the individual author(s) and contributor(s) and not of MDPI and/or the editor(s). MDPI and/or the editor(s) disclaim responsibility for any injury to people or property resulting from any ideas, methods, instructions or products referred to in the content.

