Abstract
As part of the experiments, 4-point-bending tests to investigate the shear capacity of strengthened T-beams were carried out. Thereby, 5 reference beams and 25 T-beams with carbon reinforced concrete strengthening were tested. Two different impregnated carbon grids in various strengthening configurations at the beams’ webs were checked. The number of strengthening layers was varied as well as the orientation of the grid in the strengthening layer. Furthermore, the influence of pre-damage of the RC beam before strengthening and two different shear slendernesses were investigated. A load increase of 25% to 42% compared to the unstrengthened reference specimens demonstrates the capability of carbon concrete for shear strengthening. In addition to the presentation of tested large-scale specimens, a test analysis will also be conducted, along with the derivation of a limit value for the maximum possible strengthening ratio using carbon-reinforced concrete based on the observed failure modes.
1. Introduction
In contemporary construction, many structures or components made of reinforced concrete (RC) exhibit insufficient shear capacity. This deficiency can be attributed, among other factors, to changes in building usage associated with higher live loads, increased traffic loads in road construction, or new regulatory standards compared to the time of construction [1,2]. As a result, load-bearing elements must either be replaced with new components, or targeted strengthening of these elements, such as conventionally reinforced shotcrete or innovative carbon-reinforced concrete (CRC), is required. While practical design approaches [3] and execution examples [4] for CFRP (carbon fiber-reinforced polymer) laminates are already available in Germany in accordance with an existing guideline [5], CRC for strengthening is currently only generally approved for flexural strengthening in building construction [6]. Execution examples and fundamental insights into CRC are presented in [7,8,9,10], among others.
Strengthening with CRC for concrete structures with shear load deficit is currently limited to the realm of scientific research, as seen in [11,12,13] for static loads and [14,15,16,17,18] for cyclic loads. Within the framework of the national research project C3—Carbon Concrete Composite, numerous experimental investigations on the static and cyclic shear capacity of reinforced concrete T-beams with CRC-strengthening layers were conducted in sub-projects C3-V1.2, C3-V2.7, and C3-V2.1 [19]. This publication presents the static test results, alongside a brief general overview of the shear behaviour of RC-structures with and without CRC-strengthening layers. For further information, please refer to [20,21,22,23].
Additional influencing factors (e.g., higher temperature loads) can indeed affect the load-bearing capacity of carbon concrete reinforcement, as seen in [24,25]. However, they are not within the scope of the current study and are therefore not further examined.
2. Shear Load Bearing Behavior of RC Structures
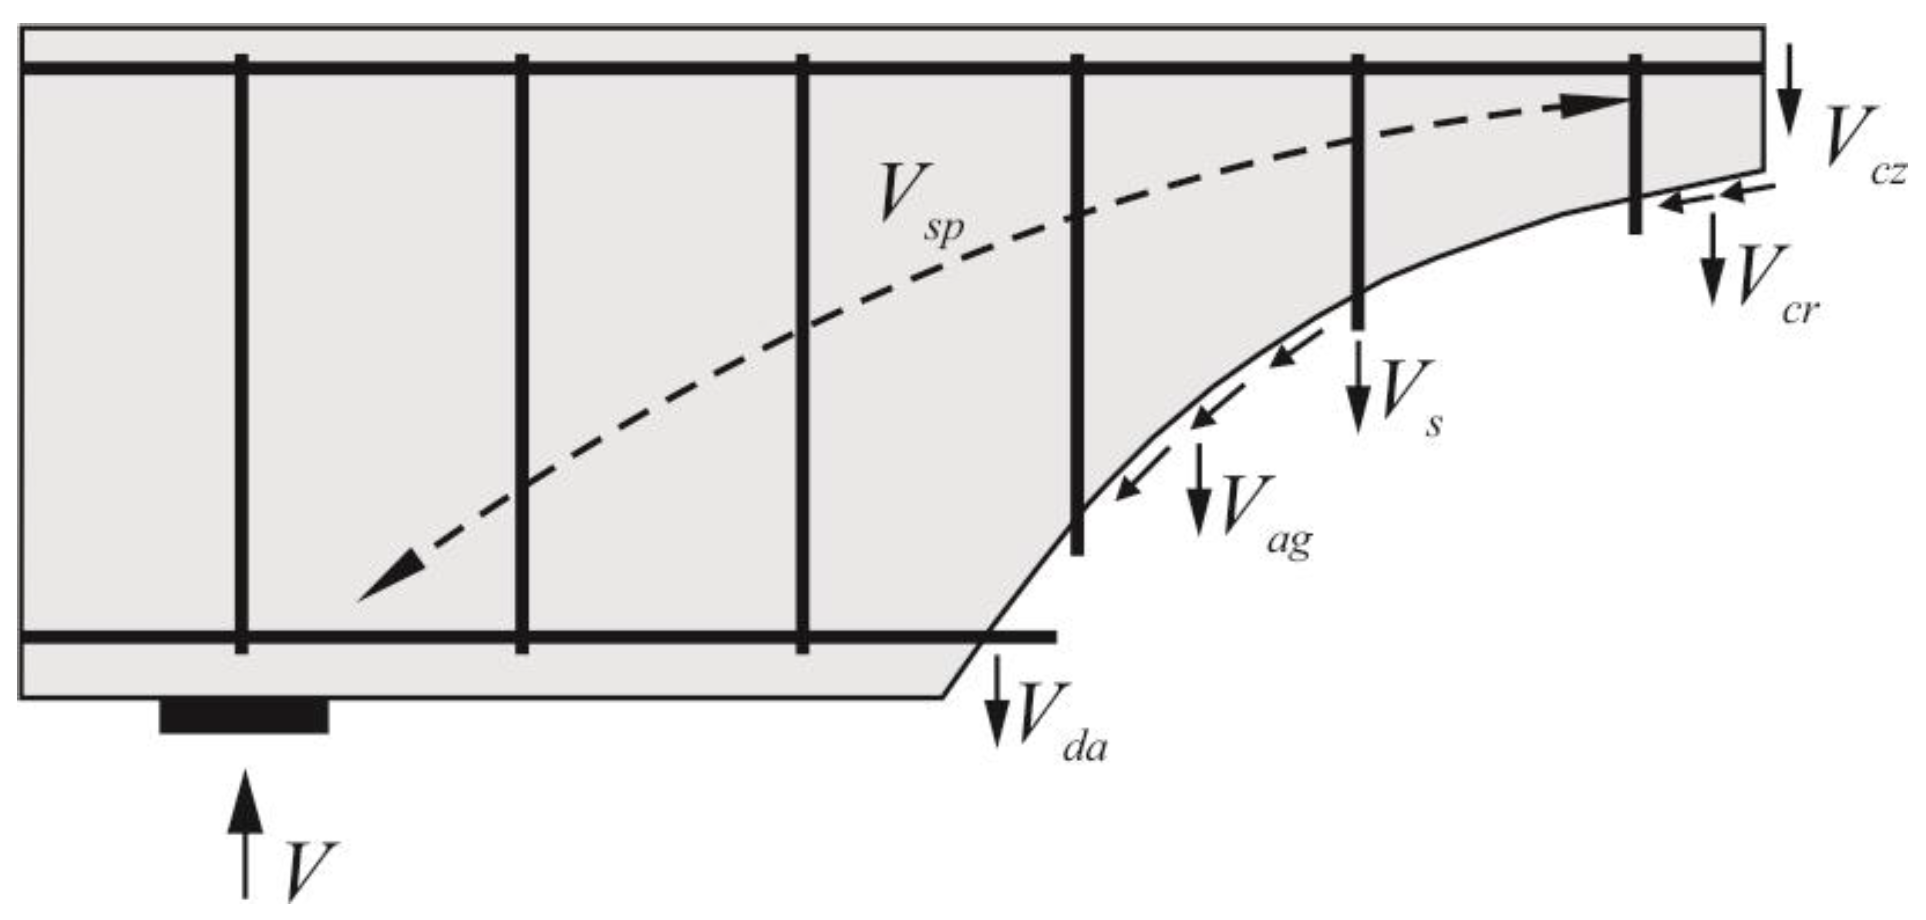
Due to the complex load-bearing mechanisms that occur after exceeding the tensile strength of concrete, the shear behavior of RC structures is still not fully understood, even today [26]. Because the various load-bearing mechanisms are currently described differently using simplified models and design approaches, there is currently no universally accepted, physically based model [26]. However, the approaches presented in [27,28] allow for a relatively accurate calculation of the shear capacity of RC structures. The load-bearing mechanisms occurring at different loading stages in the shear crack, as shown in Figure 1, are weighted differently in research.
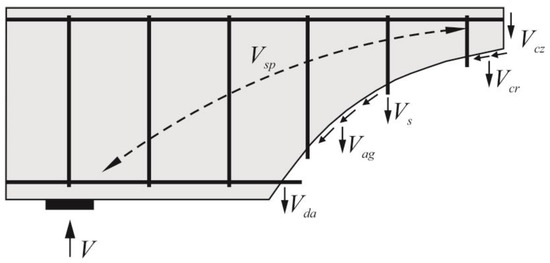
Figure 1.
Proportions of shear load in a shear crack according to [29].
These load-bearing contributions include:
- Shear stresses in the uncracked compression zone (Vcz);
- Tensile stresses across cracks in the crack process zone (Vcr);
- Shear capacity of the shear reinforcement (Vs);
- Crack friction or crack interlocking (Vag);
- Anchorage effect of the longitudinal reinforcement (Vda);
- Load transfer in concrete through direct compressive strut/arching (Vsp).
For prestressed components, the shear resistance is increased by the vertical component of the prestressing force (Vp), among other factors [27].
Significant influencing factors include the shear slenderness, the degree of longitudinal reinforcement, and the component’s geometry. More detailed information on load-bearing mechanisms and influences on the shear capacity of RC structures can be found in references such as [11,27,30,31,32].
3. Shear Strengthening with Carbon-Reinforced Concrete
Due to various shear load-bearing mechanisms, predicting the behavior of components reinforced with carbon concrete is considered even more complex. Initial investigations into the load-bearing behavior of shear strengthening with textile or carbon concrete were conducted by Brückner [11]. Further studies have been published in references such as [13,33,34,35,36,37]. The calculation approach for the shear load-bearing contribution of textile concrete reinforcement, VRd,tex, presented in [11], is based on design models for the shear capacity of concrete components with CFRP (carbon fiber-reinforced polymer) laminate reinforcement (compare [38]):
With:
Aw,t/sw,t: Cross-sectional area of the carbon grid per meter;
ftd: Design tensile strength of the carbon grid;
bw,t: Width of the tension strut;
α: Angle of the fiber strands to the specimen axis.
The shear load-bearing contribution of reinforced concrete, VRd,s, is determined in accordance with EC 2 [39] and adds to VRd,tex to provide the overall load-bearing capacity VRd of the reinforced component.
According to [11,21,33,40], the following failure modes are known for reinforced concrete components with textile/carbon concrete reinforcement at the slab beam web:
- Anchorage failure due to delamination within the plane of the carbon grid embedded in the fine concrete.
- Anchorage failure of the reinforcement by exceeding the tensile strength of the old concrete.
- Failure of the carbon grids when the tensile strength of the fiber strands is exceeded.
- Compressive strut failure of the old concrete.
4. Investigations
4.1. Extent of Testing
In preparation for the experimental program, the T-beam cross-sections used in [11] were initially analyzed numerically in project C3-V1.2 [19,21,22]. Subsequently, the specimen geometries for the new test series with current carbon grids were dimensioned.
A total of 5 unstrengthened reference-reinforced concrete structures and 25 beams strengthened with carbon CRC were planned to be tested for their shear capacity (Table 1). The following influencing factors on the load-bearing behavior were experimentally examined:

Table 1.
Configurations of the test specimens.
- Type of carbon grid. Two types of carbon grids were used.
- Geometry of the base component. Slim and compact T-beams were tested.
- Number of layers. The reinforced concrete beams were strengthened with one or two layers.
- Influence of an unreinforced fine concrete layer to assess the load-bearing contribution of the pure concrete layer in CRC-strengthening layers.
- Arrangement of the strengthening layer. The carbon grids were placed either on the sides (II) or on the sides and below (U) the web. Additionally, the fiber strands of the carbon grids were arranged parallel (0°/90°) and inclined to the stirrup reinforcement (45°/45° orientation) in the strengthening layer.
- Pre-damage of the base specimen before shear strengthening.
- Shear slenderness. Specimens with shear slenderness λ = 3.3 and 2.1 were examined.
4.2. Test Specimens
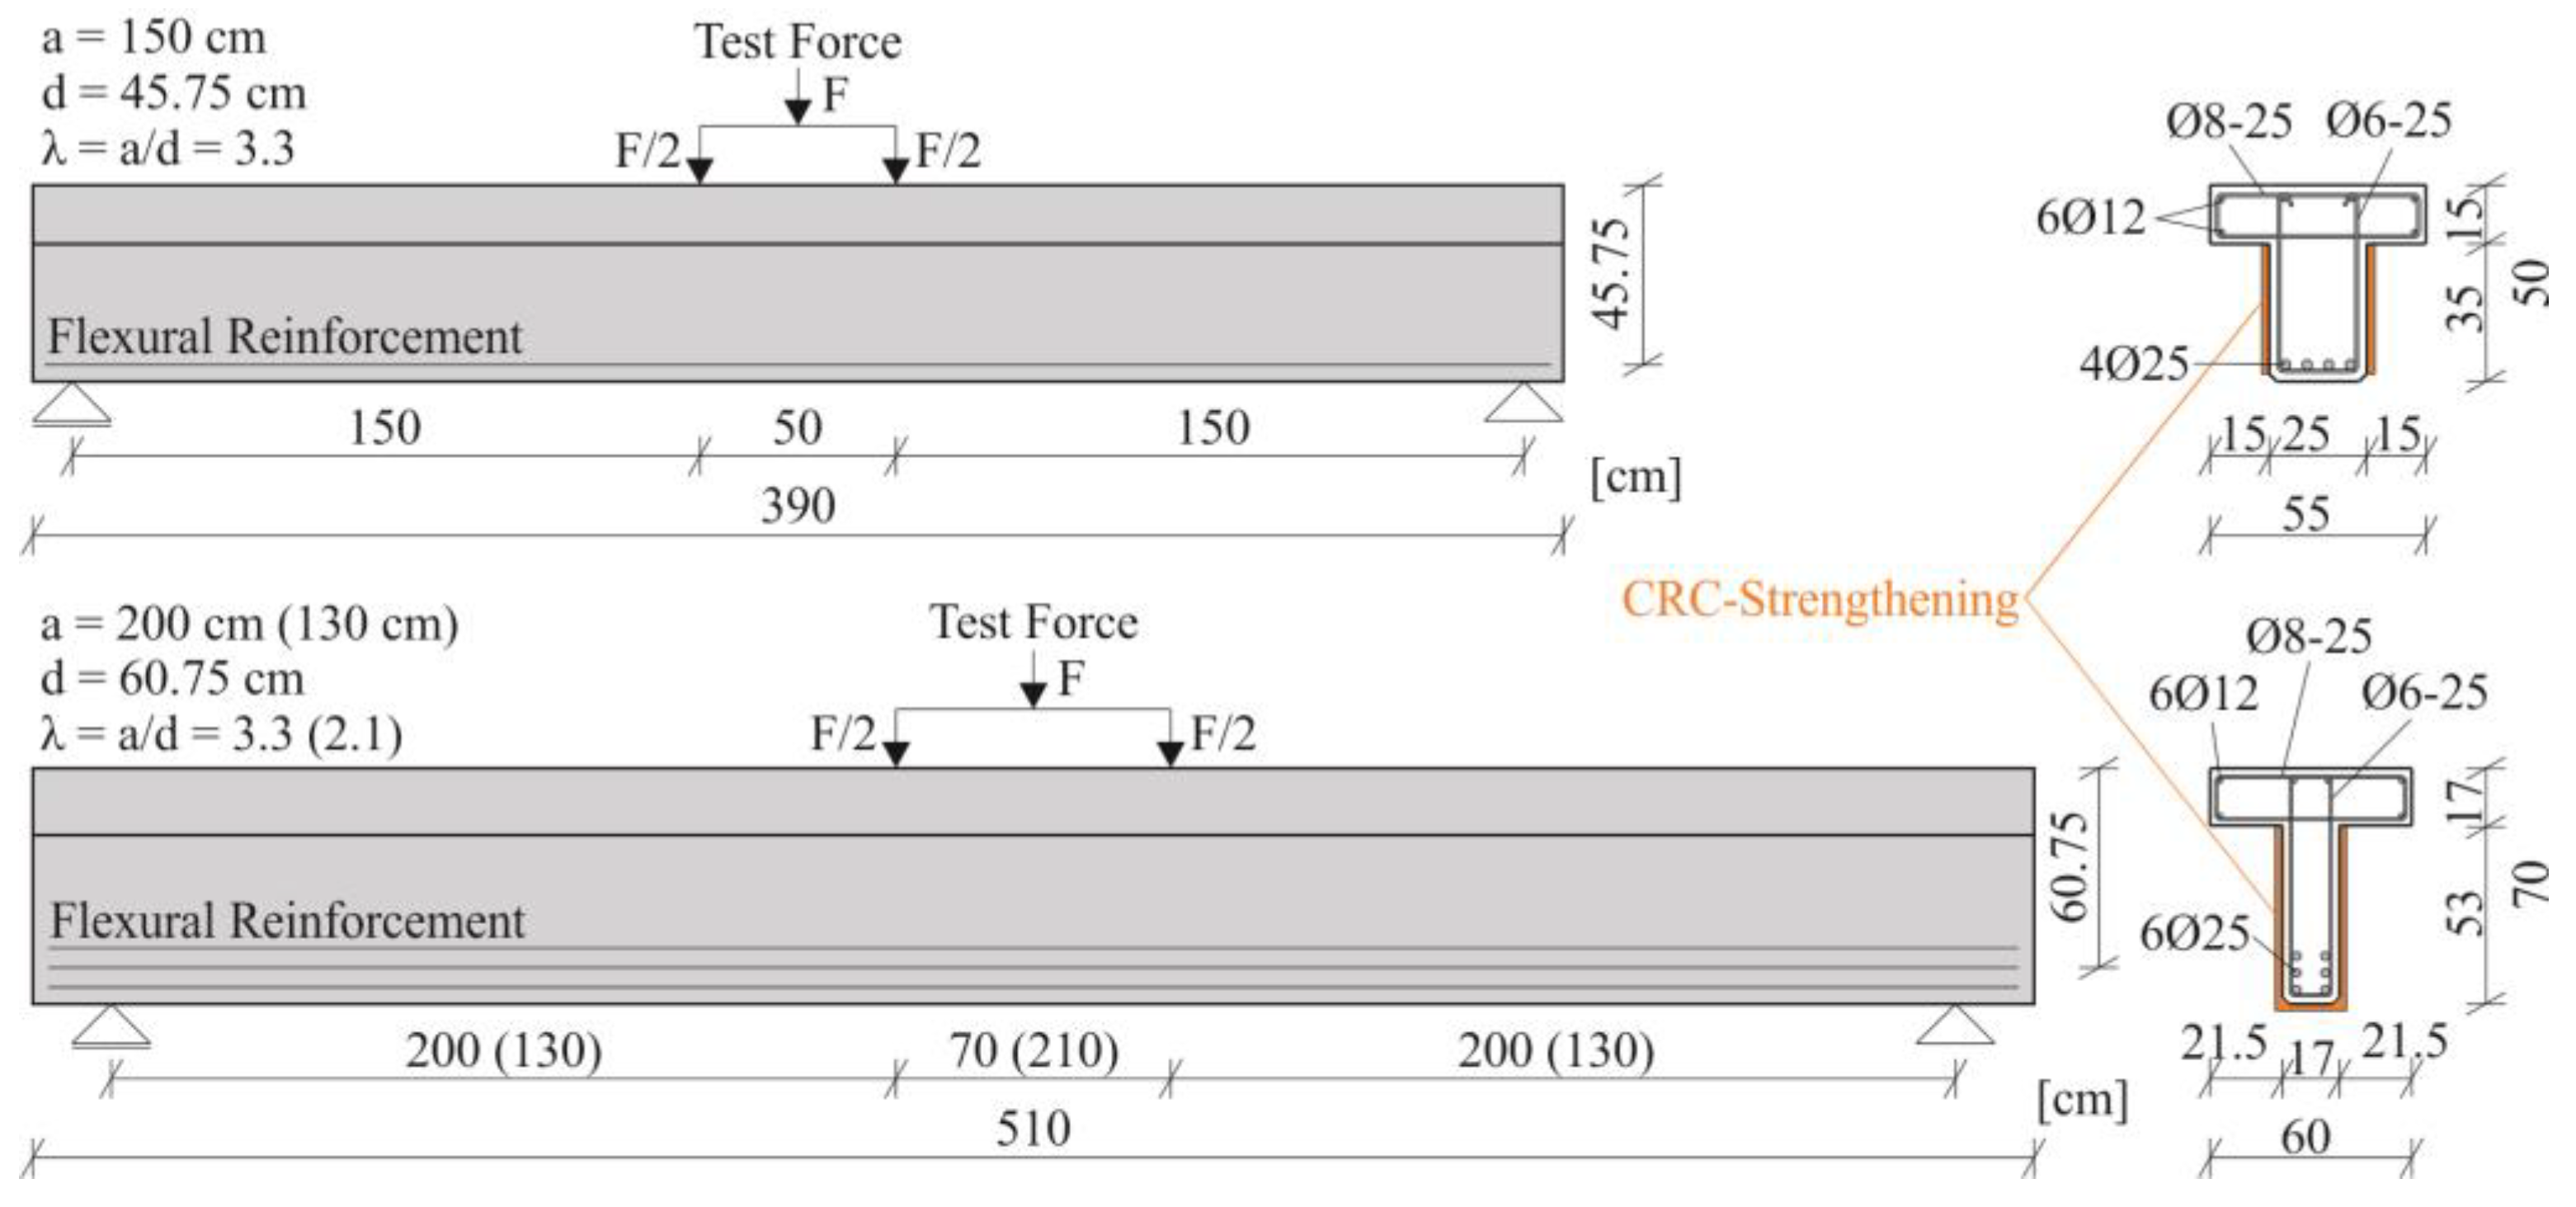
As test specimens, both a slender and a compact T-beam cross-section according to [11] were chosen (referred to as PB-S and PB-G, see Section 4.4). In contrast to [11] (stirrups Ø8–25), they were constructed using stirrups with a diameter of Ø6–25. Consequently, the shear reinforcement ratio for both test specimens, made from concrete with a strength class of C20/25, slightly exceeded the minimum reinforcement ratio ρw,min according to EC2 [39]. This was done to simulate the low shear reinforcement ratios in existing structures.
To prevent flexural failure of the strengthened specimens, the T-beams PB-S were reinforced with 6Ø25 bars in the flexural zone, and PB-G were reinforced with 4Ø25 bars in the same zone. For the PB-S series, this corresponds to a longitudinal reinforcement ratio of 2.9% with a static effective depth of 607 mm, while for PB-G, it corresponds to 1.7% and 457 mm.
The beams were manufactured at a precast concrete plant and compacted with an internal vibrator. Prior to strengthening, the surfaces of the formwork were roughened by sandblasting to achieve a mean surface roughness of 1.3 mm, measured using the method described in [41]. This roughening was deemed sufficient for strengthening with CRC, as per [6]. The strengthening of all specimens was carried out over four consecutive days under conditions like those on construction sites, following the guidelines outlined in [6], by a trained construction company. The minimum concrete cover for the carbon grids was 5 mm relative to the fiber strand axis. The thickness of a single strengthening layer was thus 10 mm, and that of a double strengthening layer was 15 mm. Subsequently, the strengthening layer was subjected to post-treatment for three days to prevent premature drying.
4.3. Materials
The RC base structures were intentionally made to mimic existing structures and were typically composed of a normal-strength concrete with a concrete strength class of C20/25 according to DIN EN 206-1 [42] or DIN 1045-2 [43]. Conventional reinforcement bars conforming to DIN 488-1 [44] were used in these specimens.
For the CRC, two types of carbon grids were used: the biaxial grid “solidian GRID Q85/85-CCE-21” [45] and the uniaxial grid “SITgrid 040”, which was developed in the C3 project V1.2 [19] by Wilhelm Kneitz Solution in Textile GmbH. Both carbon grids are suitable for flexural reinforcement [7].
The biaxial grid “solidian GRID Q85/85-CCE-21” [45] (Figure 2, left) with a maximum sheet size of 5.0 × 1.2 m has the same cross-sectional area in both fiber directions. Due to nearly identical properties in the warp and weft directions, the warp yarn was aligned with the longitudinal axis of the specimen, and the weft yarn was aligned with the stirrup direction. This allowed for the 0°/90° reinforcement without any overlap joint. Based on empirical data, an overlap joint of 35 cm for PB-S-7/-8 and 40 cm for PB-G-7/-8 was used for the 45°/45° orientation. The prefabricated form profiles for the enclosing reinforcement on the T-beam web (consisting of two overlapping L-profiles) were supplied by the manufacturer.
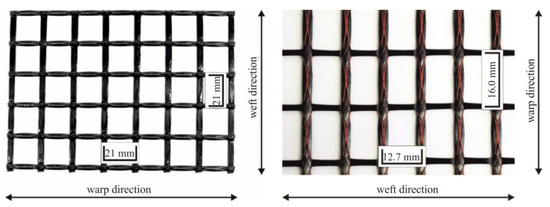
Figure 2.
Carbon grids; (left): solidian Q85; (right): SITgrid 040.
In the case of the uniaxial “SITgrid 040” (Figure 2, right), the warp direction of the grid was aligned with the stirrup direction in the strengthening layer. The grid sheet, measuring 4.0 m (warp) × 2.3 m (weft), was cut to fit the respective configuration before strengthening. The structural overlap joint of the fabric, 20 cm, was placed in the center of the field in the area of minimal shear stress.
Formularbeginn
In all experiments, the fine concrete regulated in [6] was used as the matrix for the strengthening layer.
The testing of the reinforcement bars was conducted in accordance with [46]. The compressive strength and E-modulus (Method B) of the normal concrete were determined on cylinders (Ø 150 mm, H = 300 mm) on the day of testing the specimen, following the procedure in [47]. The properties of the fine concrete were determined on prisms (H × B × L = 40 × 40 × 160 mm) according to [48] after 28 days. The preparation and storage of these samples were carried out concurrently with the casting of the beams and the strengthening process.
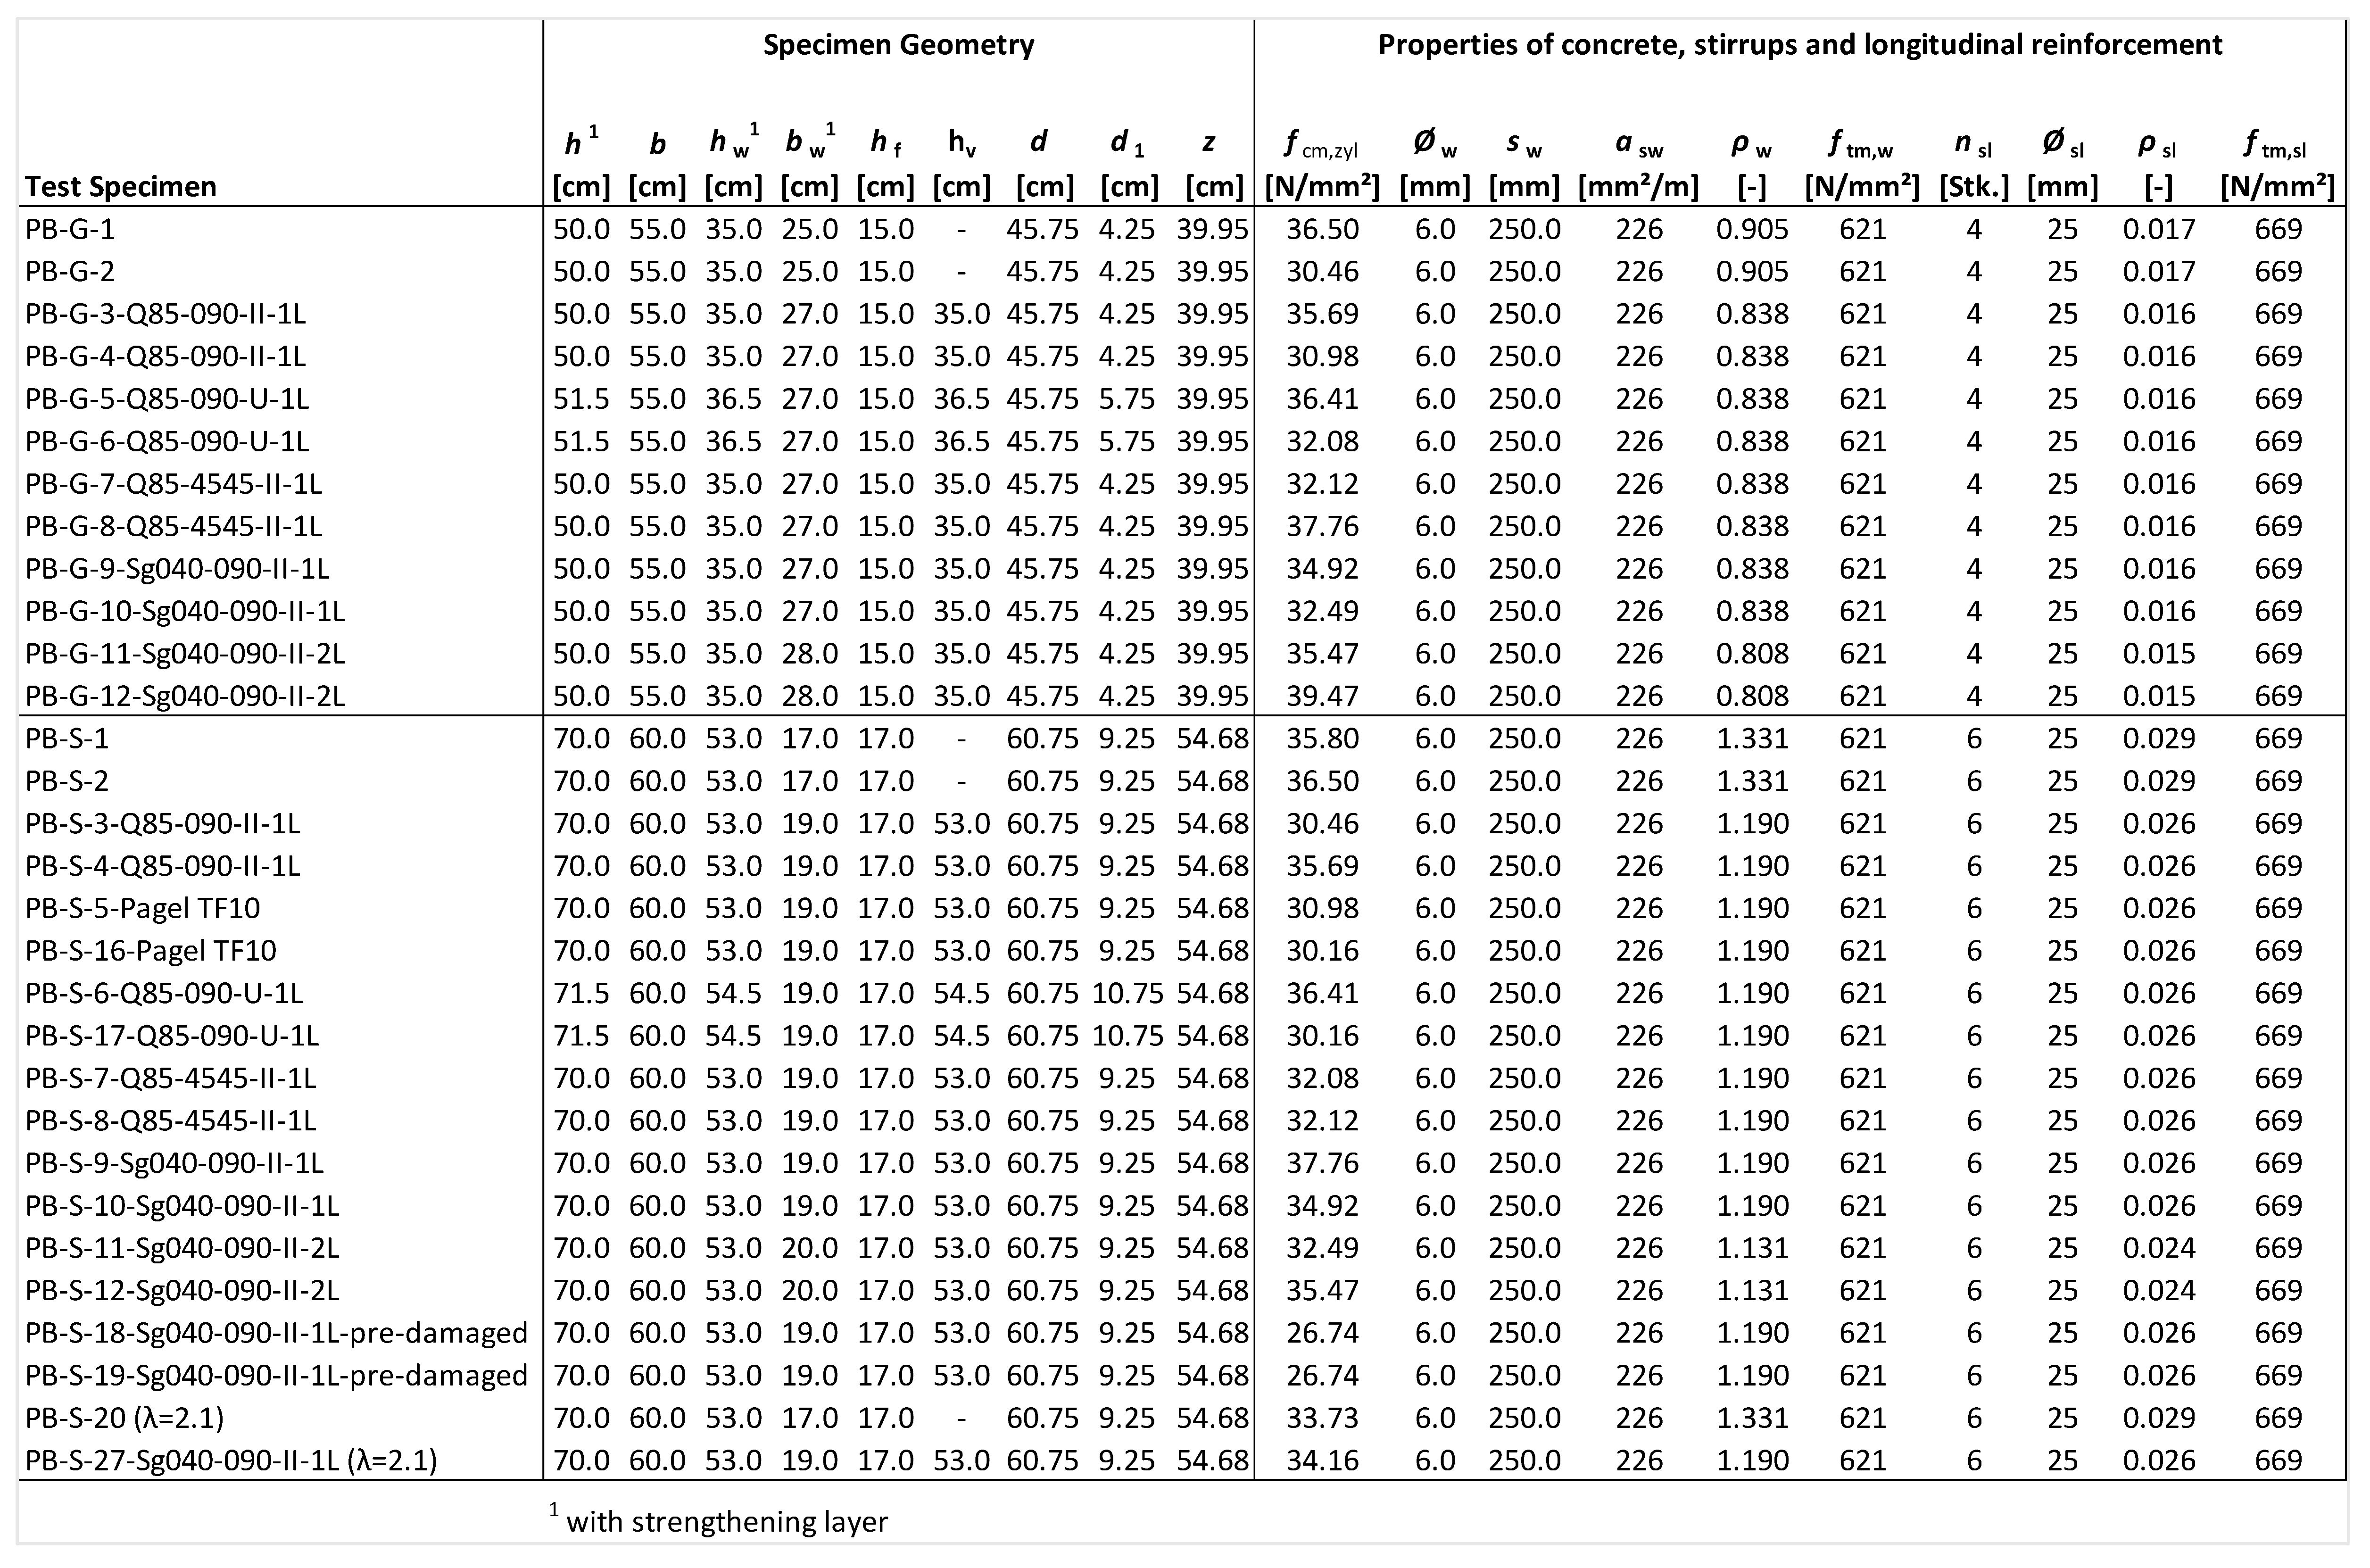
Table 2 provides the average strengths of the individual materials. The concrete properties for each T-beam are listed in Table 3 and Table 4. The tensile behavior and the modulus of elasticity (E Modulus) of the carbon grids were determined on one- and two-layered specimens (age 28 days) according to [49]. These values are based on grid samples embedded in a concrete matrix. Differences from values obtained from pure fiber strand tests cannot be ruled out, as discussed in [50]. However, the tensile specimen tests allow for a good observation of crack formation behavior, which is why this testing method was chosen. Comparative tactile tests were conducted with SITgrid 040 to assess the transferability of fiber strand and specimen values, resulting in comparable values.
Table 2.
Mean values of the materials.
Table 3.
Overview of the test results of the compact T-beams (PB-G).
Table 4.
Overview of the test results of the slender T-beams (PB-S).
4.4. Test Setup and Execution
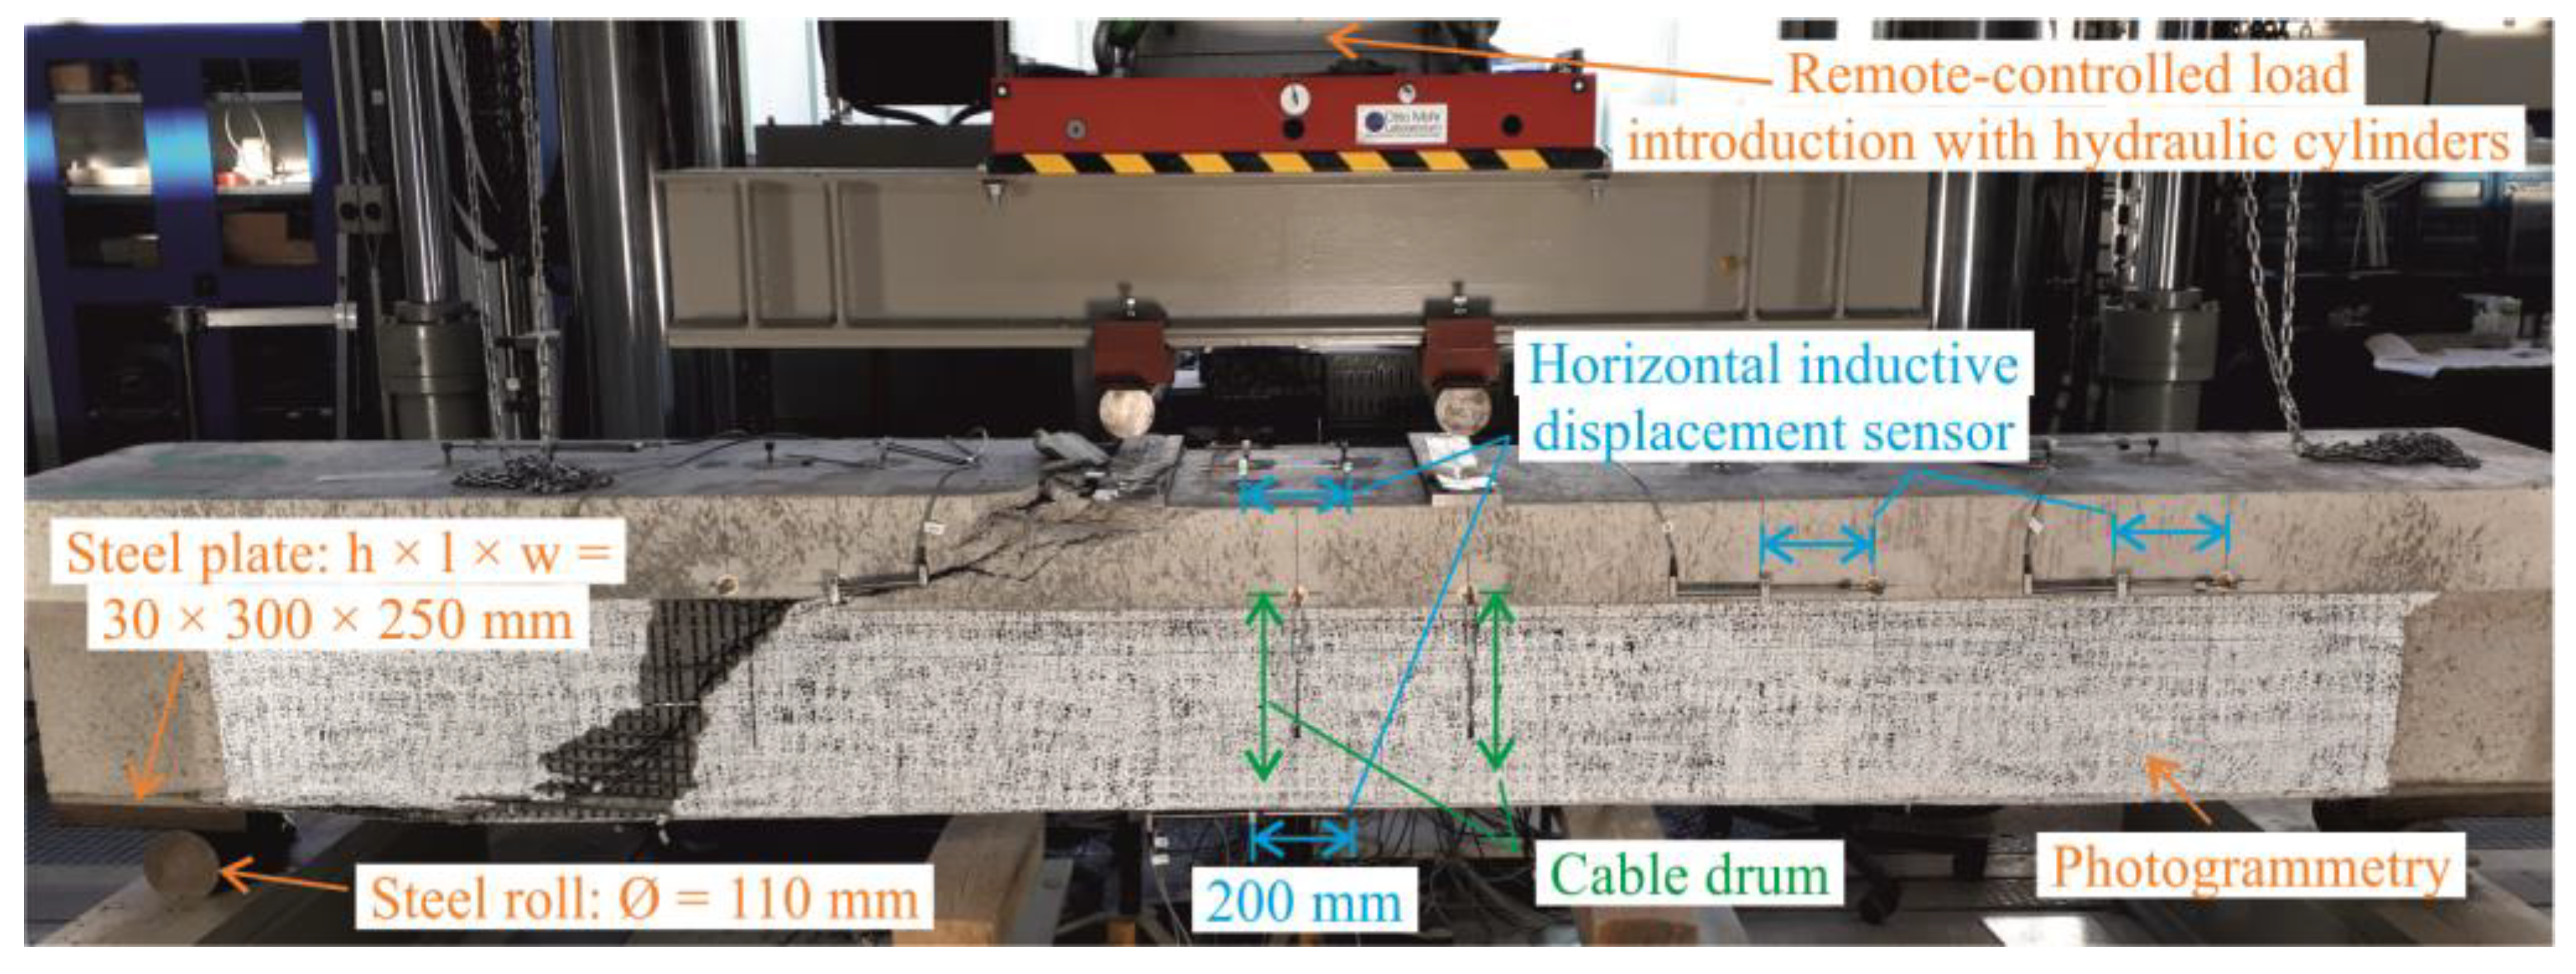
Differing from [11] (three-point bending tests), four-point bending tests were conducted to better identify the triggering failure mechanisms (Figure 3 and Figure 4). The beams were consistently reinforced in the longitudinal direction. Except for two slender T-beams, all test specimens were tested with a shear span-to-depth ratio (distance a between end supports and load application point to the static effective depth d) λ = 3.3. A shear span-to-depth ratio λ between 2.5 and 3.5 typically results in failure of the tension tie (stirrup reinforcement) of an unstrengthened RC structure. The PB-S series was supplemented with two beams with a reduced shear span-to-depth ratio of 2.1. To confirm the achieved test results, each test configuration was tested twice.
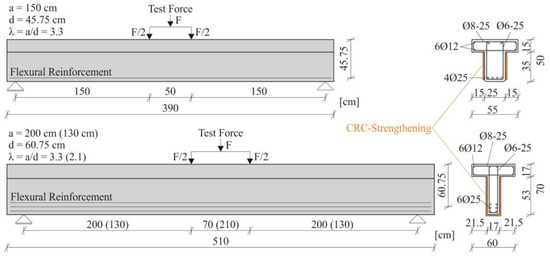
Figure 3.
Test setup: compact T-beams PB-G (above) and slender T-beams PB-S (below).

Figure 4.
4-point bending test, specimen PB-G-5.
4.5. Test Results
4.5.1. Overview
All significant test results, including the concrete properties of the existing concrete, are summarized in Table 3 and Table 4. The resulting maximum web shear stresses τExp(d) were determined at a distance d from the support, considering the static effective depth d (see Figure 3), considering the planned reinforced web width bw, and accounting for the self-weight using Equation (2):
In the following, the various influencing parameters will now be analyzed individually.
4.5.2. Unstrengthened Reference Beams
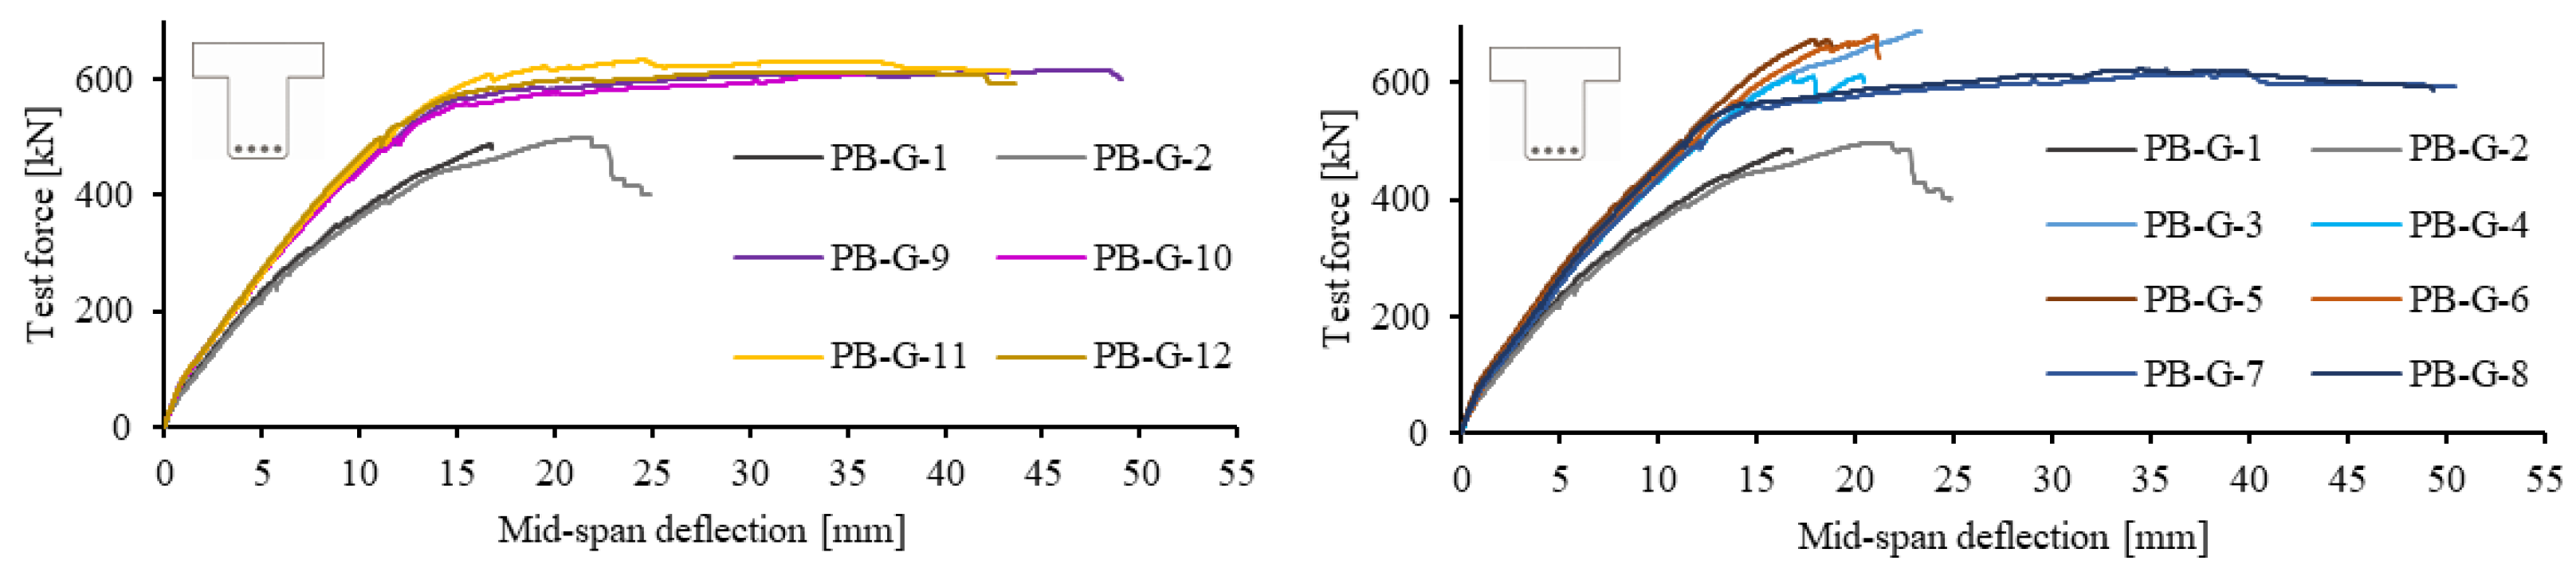
The reference specimens exhibited a typical shear behavior without a pronounced yield plateau in the load-deformation curve. All beams failed due to the rupture of the stirrup reinforcement. The slender beams PB-S-1/-2 failed on average at a test load of 600.5 kN (corresponding to a shear force of 308.6 kN, taking into account the self-weight at the distance d). The compact beams (PB-G-1/-2) failed at a test load of 492.5 kN (corresponding to a shear force of 251.7 kN). According to [39], the calculated failure loads were 242 and 194 kN, respectively (reaching the stirrup tensile strength, see Table 2).
4.5.3. Influence of Unreinforced Fine Concrete Strengthening Layer
The beams with pure fine concrete strengthening (PB-S-5/-16) also failed due to the rupture of the steel stirrups at a load of 650.5 kN, which corresponds to an increase in load of 8% compared to the reference beams. Therefore, the load-bearing capacity could be slightly increased solely by widening the structural element and using high-strength fine concrete (see Figure 5 and Figure 6).
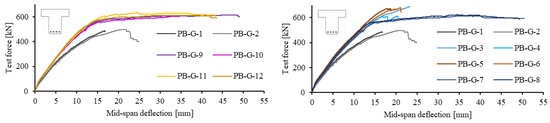
Figure 5.
Load-deflection curves of the series PB-G ((left): reference and SITgrid 040, (right): reference and solidian Q85).
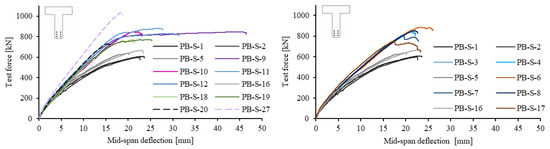
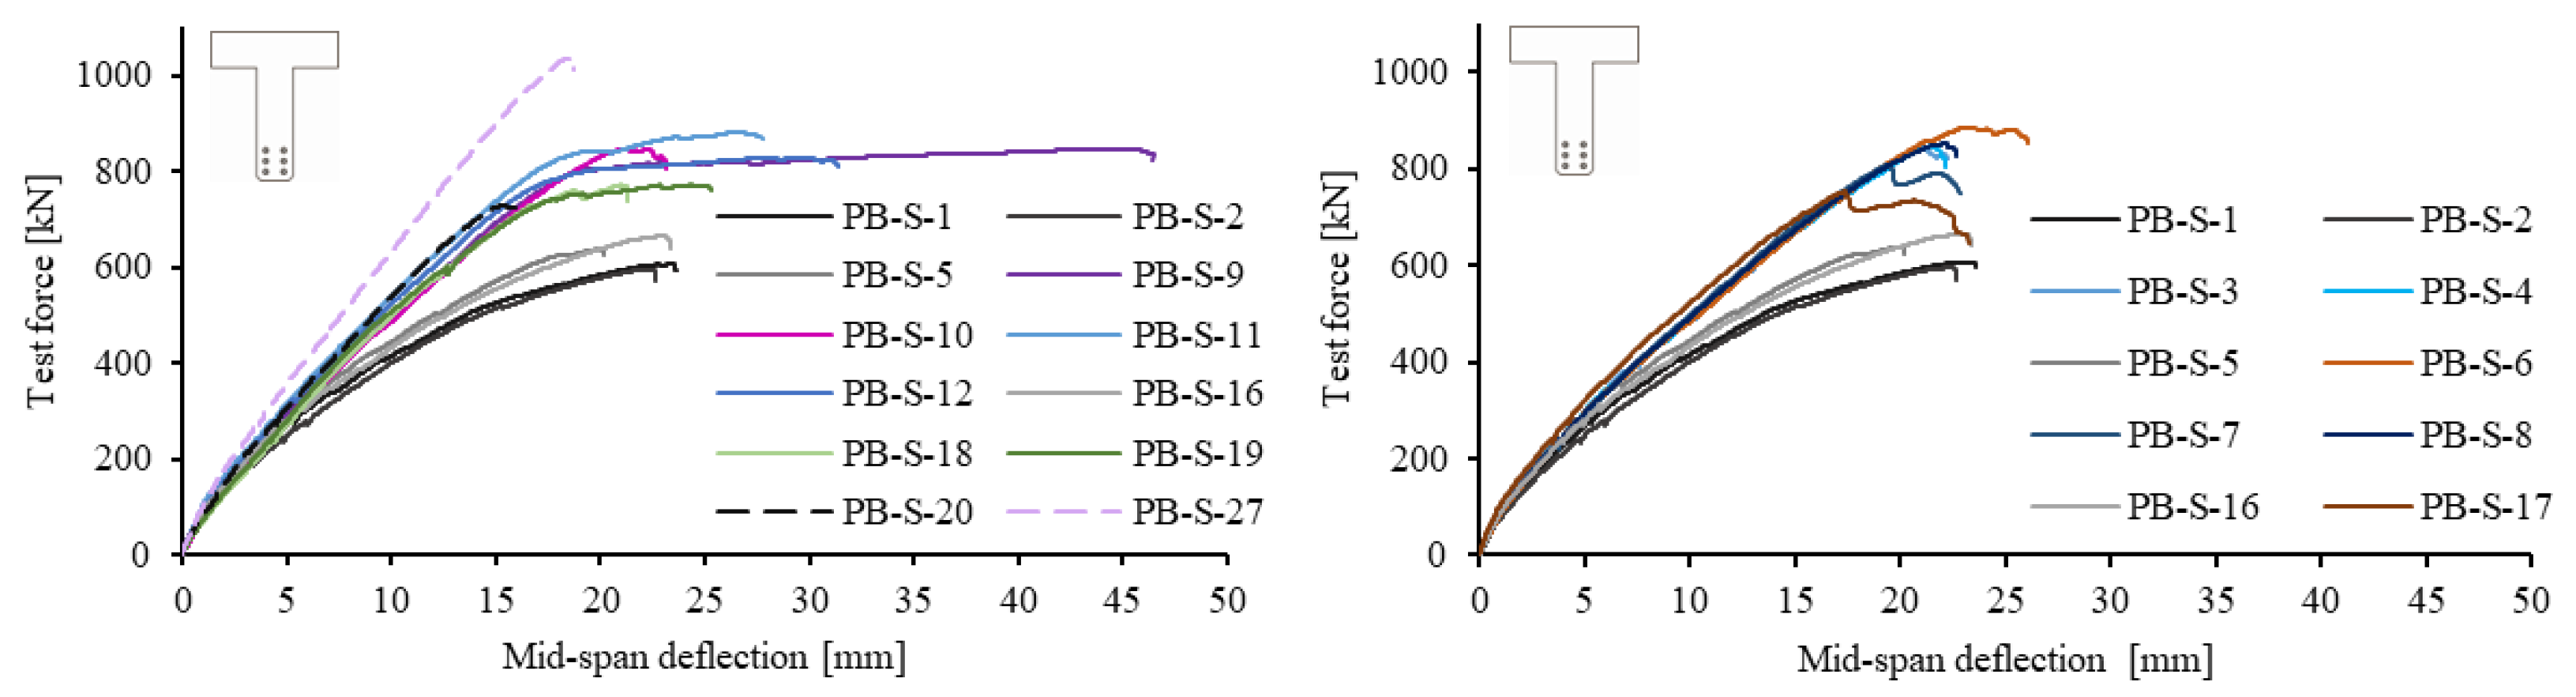
Figure 6.
Load-deflection curves of the series PB-S ((left): reference and SITgrid 040, (right): reference and solidian Q85).
4.5.4. Strengthened Specimens—One-Layer SITgrid 040
The compact beams strengthen with a single layer of SITgrid 040 (PB-G-9/-10) failed at 613.5 kN due to bending compression failure of the existing concrete (Figure 5). The load-deformation curve exhibits a distinct yield plateau at approximately 600 kN, indicating a failure precursor due to bending with flow of the longitudinal reinforcement and subsequent narrowing of the concrete compression zone. Compared to the unreinforced reference, the load-bearing capacity was increased by 25%.
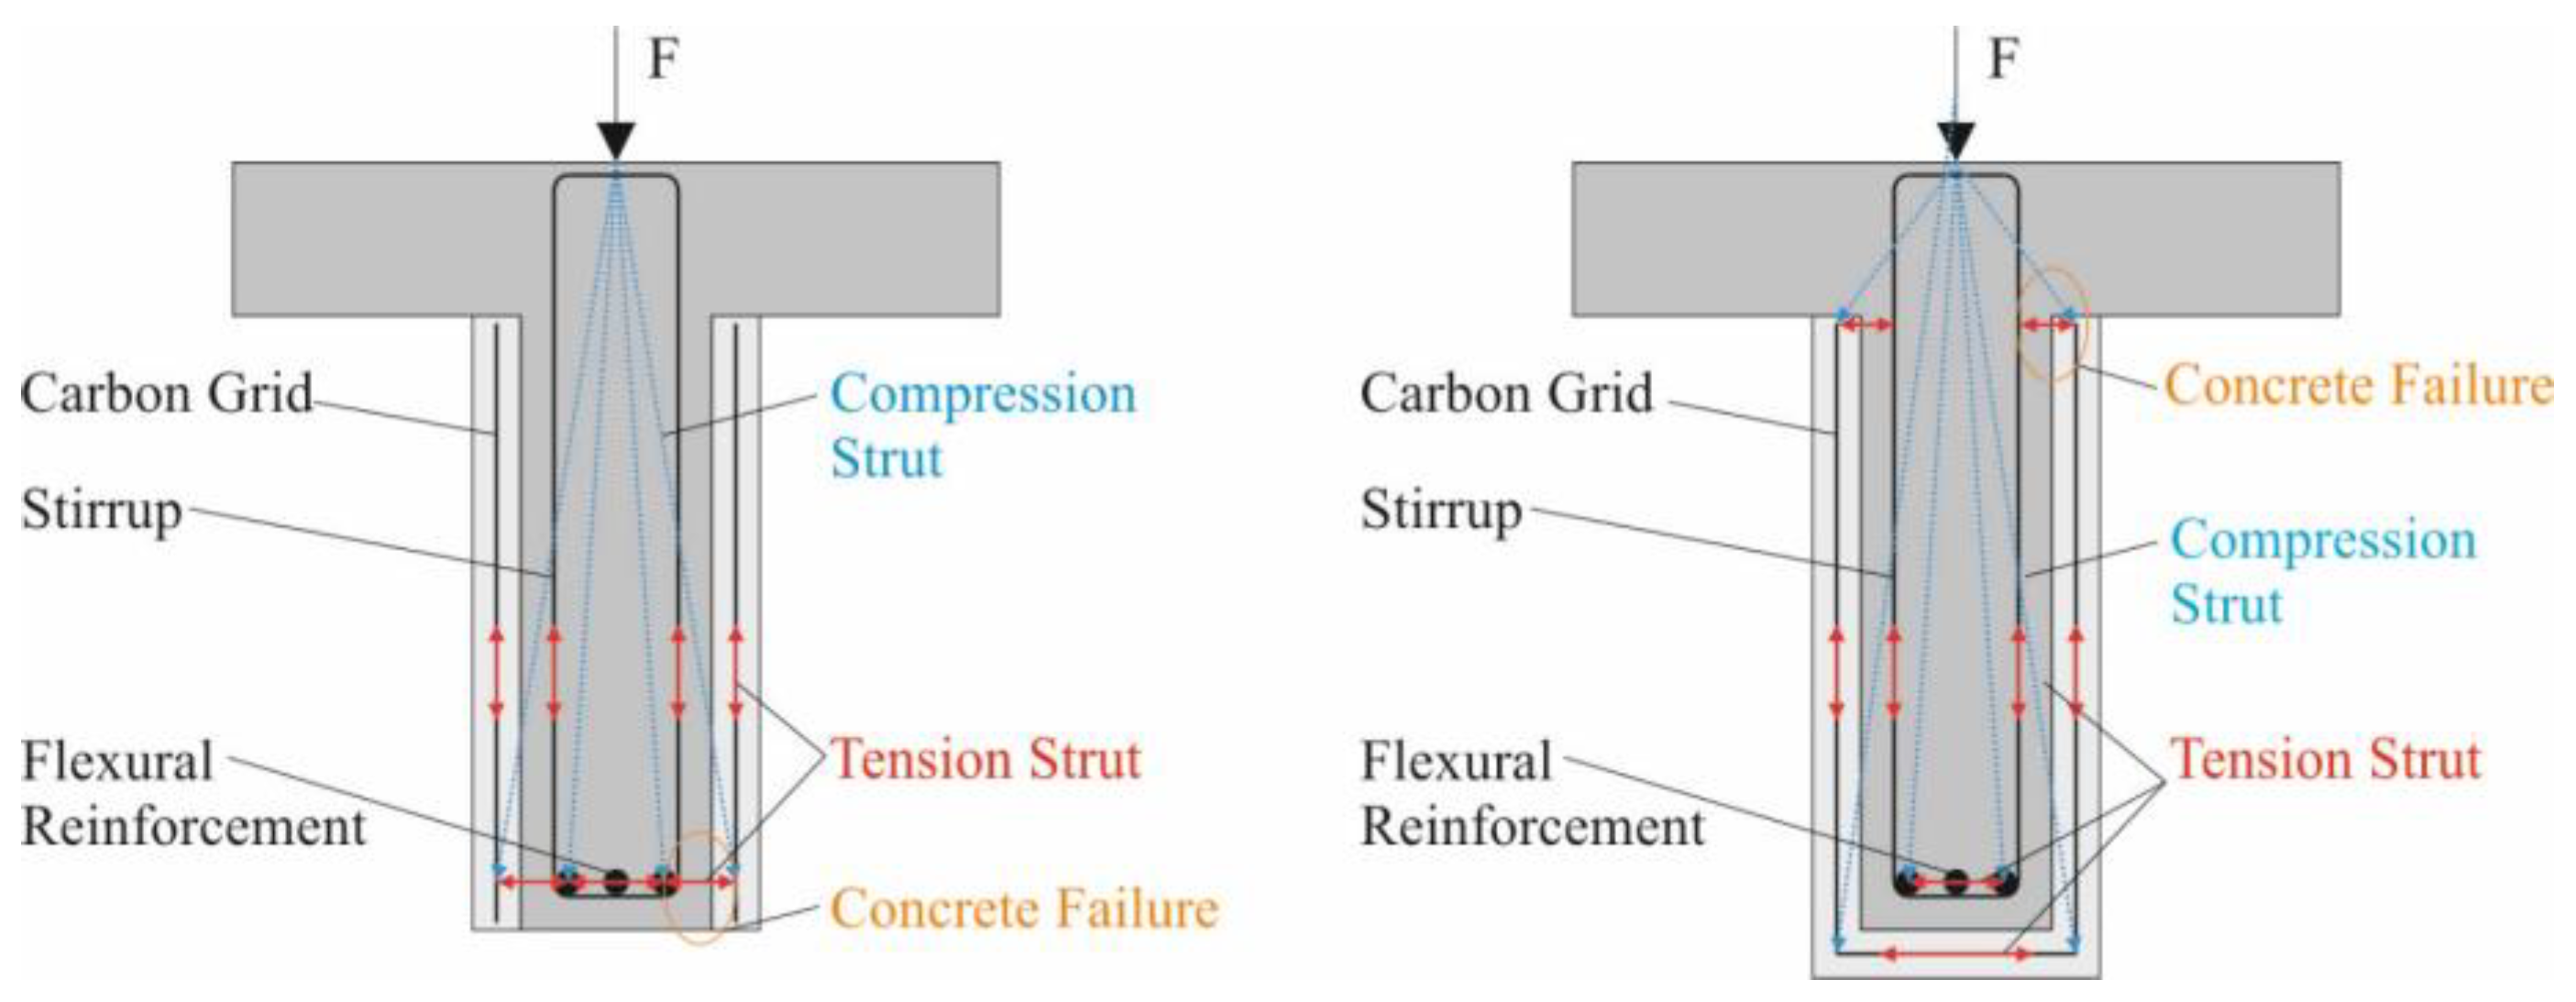
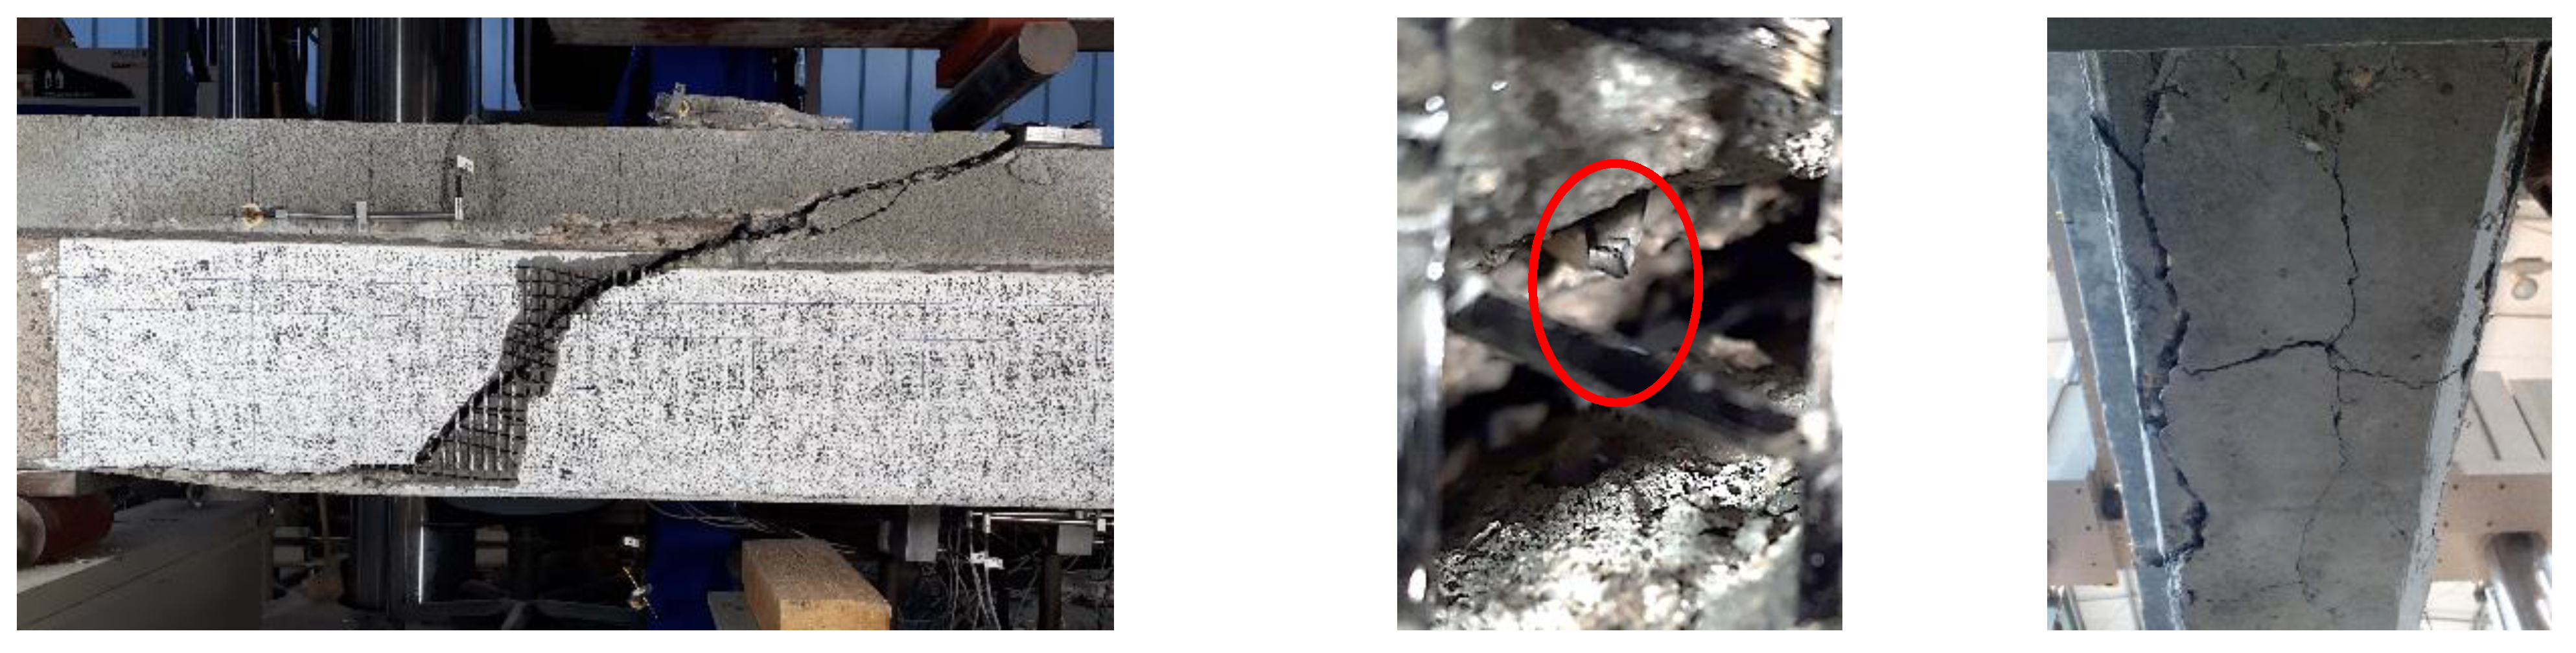
In the case of the slender beams (PB-S-9/-10), an average failure load of 846.0 kN was experimentally confirmed. Compared to the unstrengthened specimen, this represents a 41% increase in load capacity. The failure of specimen PB-S-10 occurred at a mid-span deflection of approximately 25 mm and was characterized by delamination of the strengthening layer in the lower part of the beam web, see Figure 7. No tensile failure was observed within the carbon concrete strengthening layer or in the steel stirrups. Evidence of this shear failure mode can also be found in [37], where it is defined as ‘delamination of the strengthening layer’. Transverse tensile stresses and bond stresses (see cross-sectional plane of a spatial truss in Figure 8) between the strengthening layer and the existing concrete likely triggered the failure mechanism, see e.g., [9,51].
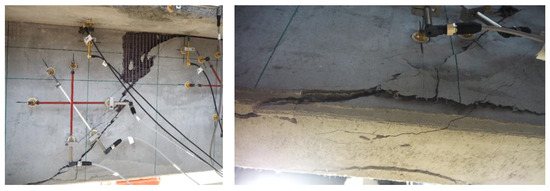
Figure 7.
Beam PB-S-10; (left): failure pattern; (right): debonding of the strengthening layer.
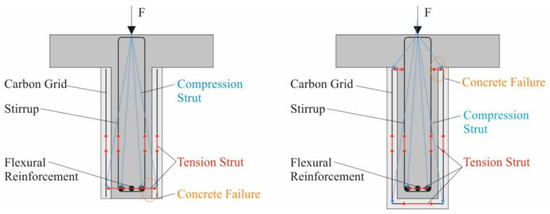
Figure 8.
Strut-and-tie models for RC components with II-shaped (left) and U-shaped strengthening (right) Formularbeginn.
The beam PB-S-9 failed between the load applications in the region of the maximum bending moment. Since both the load-deformation curve in Figure 6 up to a deflection of 25 mm and the failure load are very similar to the analogously strengthened specimen PB-S-10, and the calculated bending capacity was not yet reached, pure bending failure was ruled out, despite the apparent yield plateau. It is possible that the constructively defined overlap joint of the carbon grids has an influence on the load bearing behavior.
4.5.5. Strengthened Specimens—Two-Layer SITgrid 040
The two-layer strengthened compact beams PB-G-11/-12 did not achieve a significant increase in load capacity compared to the one-layer strengthened PB-G-9/-10. The reason for this was the mode of failure, which was similar to the one-layer strengthened components, involving a bending compression failure. In the case of the slender T-beams PB-S-11/-12, the failure was similar to that of the one-layer strengthened beam PB-S-10, with a splitting crack formation on the underside of the web and delamination of the strengthening layer (failure in RC structure) at a comparable load level.
4.5.6. Strengthened Specimens—One-Layer Solidian (0°/90°; II-Strengthening)
The one-layer strengthened compact beams PB-G-3/-4 with strengthening on the web side faces (II) and fiber strand direction at 0°/90° to the component’s longitudinal axis achieved an average failure load of 650.5 kN, which is 32% higher compared to the unstrengthened reference. In both cases, failure occurred due to the yielding of the stirrups and the development of concrete cracks on the underside of the web (see Figure 9). In comparison to the PB-G-9/-10 strengthened with SITgrid 040, the mode of failure changed from flexural to shear failure. This material-dependent change can be attributed, among other factors, to the geometry and the reinforcement ratio of the biaxial carbon grid solidian GRID Q85/85-CCE-21. This biaxial grid not only strengthened the shear capacity but also the flexural capacity. Consequently, the biaxial carbon grid led to a change in the plane of deformation throughout the cross-section height and increased the flexural capacity.
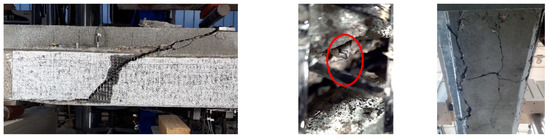
Figure 9.
Beam PB-G-4; (left): shear failure; (middle): rupture of the stirrup; (right): cracks at the bottom of the web.
The one-layer strengthened slender T-beams PB-S-3/-4 achieved a failure load of 843 kN, representing a 40% increase in load-bearing capacity. Similar to beam PB-S-10 (SITgrid 040), failure in these beams was characterized by longitudinal cracks on the underside of the web.
4.5.7. Strengthened Specimens—One-Layer Solidian (0°/90°; U-Strengthening)
In comparison to the beams PB-G-3/-4, which were strengthened only on the sides, there were no significant load increases observed in the case of the beams PB-G-5/-6, which were strengthened both on the sides and on the bottom of the web. Hence, there was no noticeable positive effect from the strengthening applied around the web. The same situation applies to the slender T-beams PB-S-6/-17 compared to PB-S-3/-4; in both cases, there was no increase in the test load capacity.
However, there was no delamination of the strengthening layer in the lower section of the web. The detachment at the web occurred at the upper end of the strengthening layer, at the connection between the web and the flange, probably due to the transverse tensile stresses that occurred in that area between the strengthening layer and the existing concrete (also refer to [9] and Figure 8).
4.5.8. Strengthened Specimens—One-Layer Solidian (45°/45°; II-Strengthening)
Neither in the case of the slender (PB-S-7/-8) nor the compact (PB-G-7/-8) specimens could a positive influence of a grid orientation of 45°/45° be observed compared to an orientation of 0°/90°. Since both series of tests failed due to shear crack formation on the lower side of the web (PB-S-7/-8) or bending (PB-G-7/-8), an optimally designed strengthening arrangement for shear behavior did not increase the load-bearing capacity.
4.5.9. Strengthened Specimens—One-Layer SITgrid 040 (Pre-Damaged)
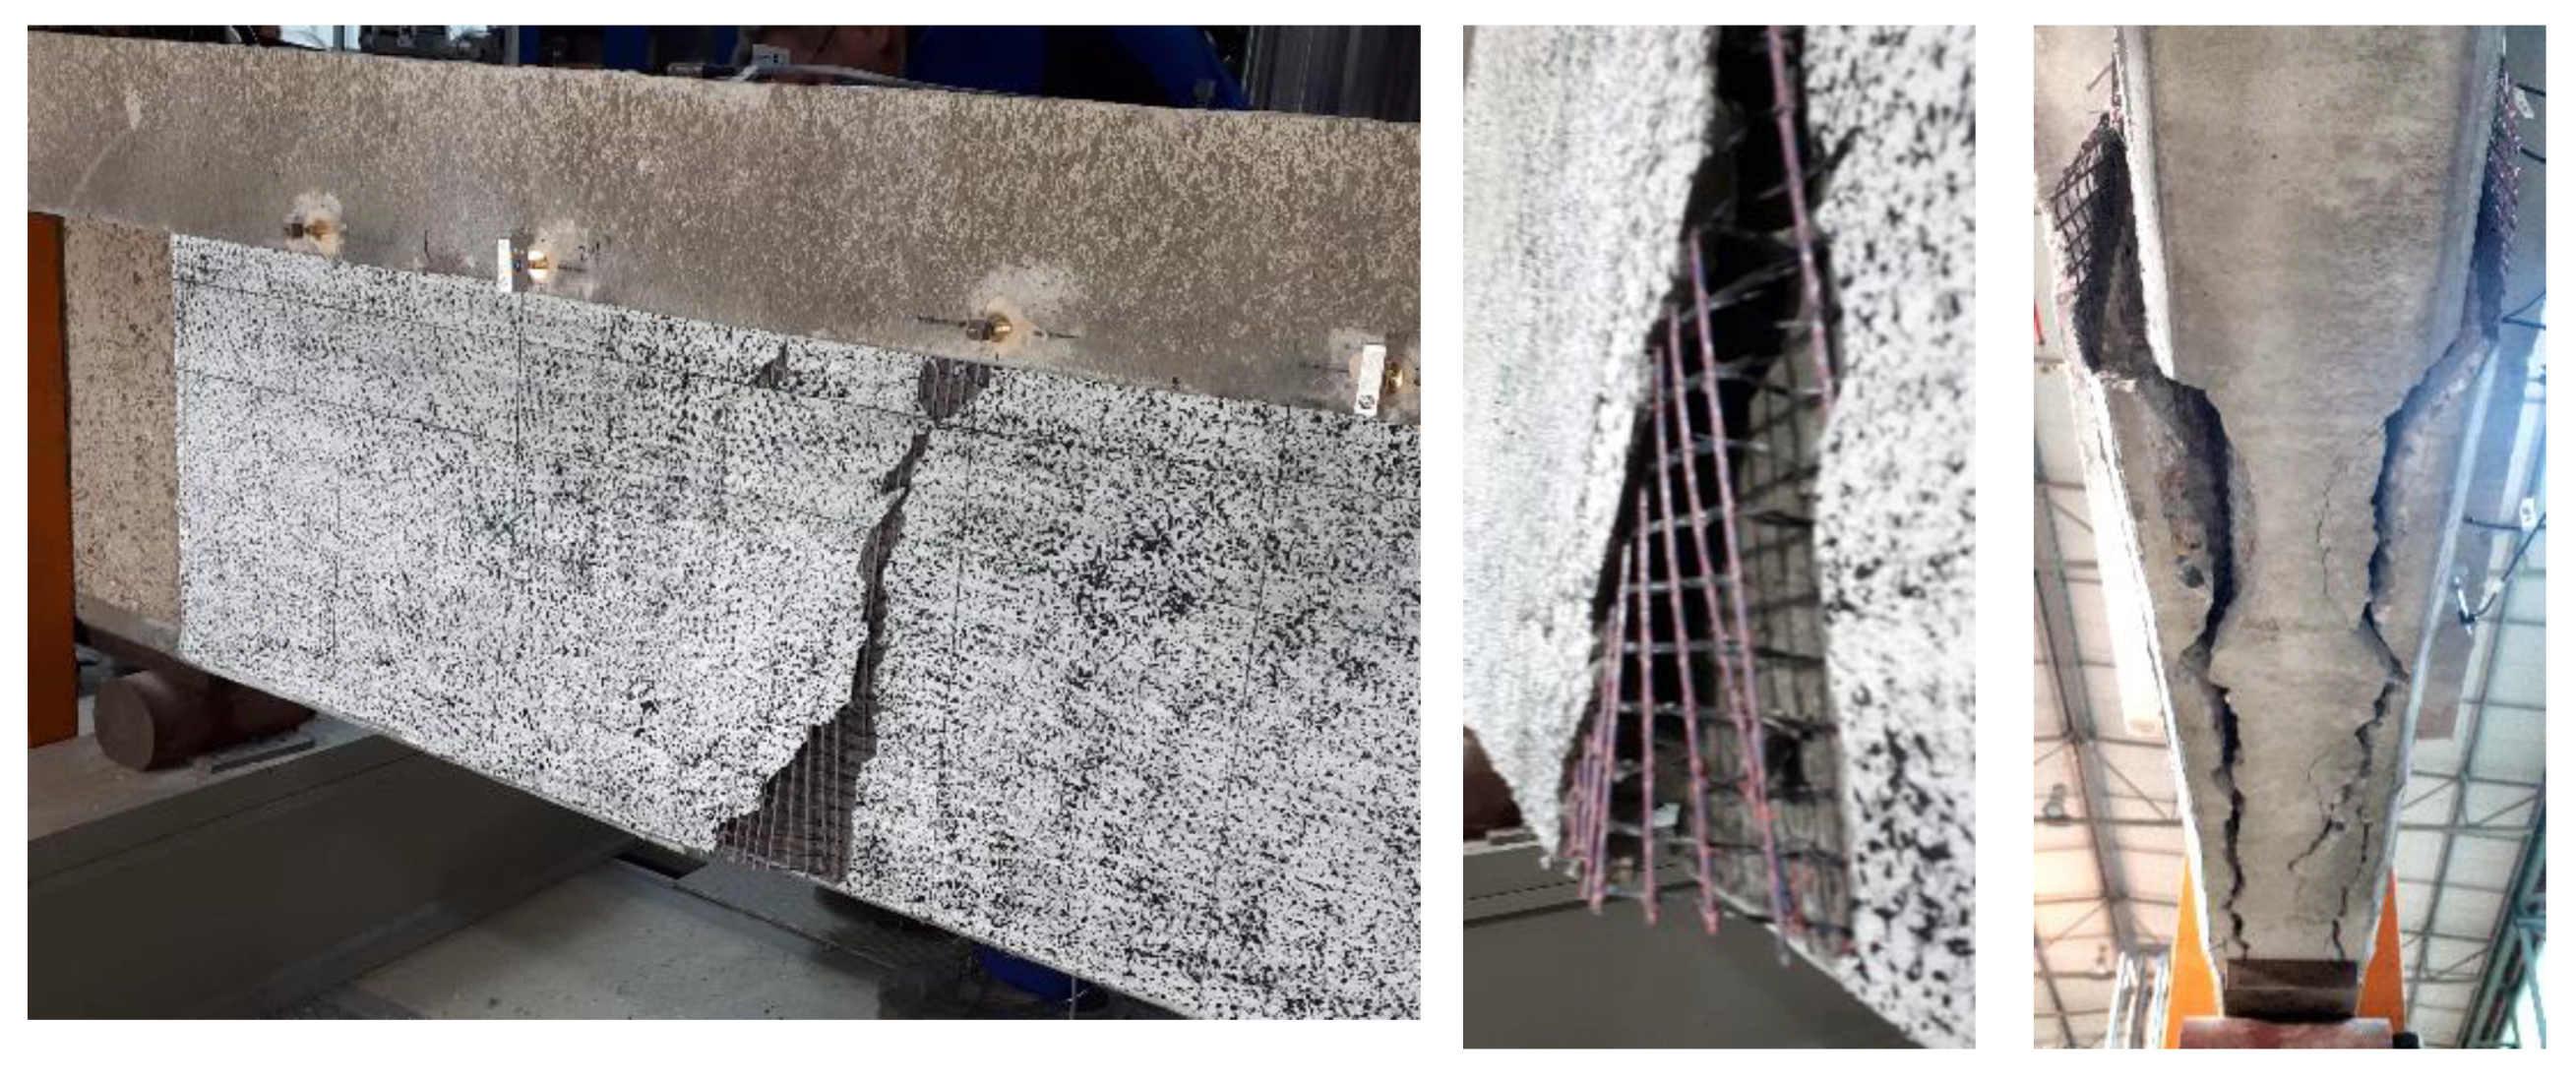
The beams PB-S-18 and PB-S-19, which had their base structures preloaded until the yield strength of the shear reinforcement and then subsequently unloaded before applying the strengthening, both achieved the same ultimate load of 771 kN. This corresponds to a 129% increase compared to the unstrengthened reference structures PB-S-1 and PB-S-2. However, this increase was 10% lower compared to the non-preloaded, strengthened structures PB-S-9 and PB-S-10. These results indicate that pre-damage, characterized by pronounced shear fields and yielding of shear reinforcement, reduces the effectiveness of shear strengthening with CRC. The relatively high level of preloading used in these tests may not be representative of common structural behavior in practice. Further research is necessary to more definitively assess the impact of preloading on the shear-carrying capacity of CRC-strengthened structures under more realistic pre-damage conditions. Figure 10 displays the failure modes of beam PB-S-18.
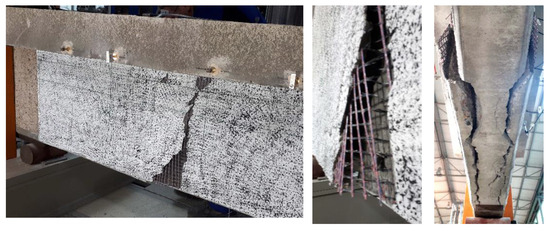
Figure 10.
Beam PB-S-18; (left): failure pattern; (middle,right): debonding of the strengthening layer and splitting crack formation of the web at the bottom.
4.5.10. Specimens with Different Shear Slenderness
The unstrengthened test specimen PB-S-20, which was tested with a reduced shear slenderness ratio of 2.1, failed at an ultimate load of 728 kN due to the tensile failure of the stirrups. Compared to the unstrengthened specimens with a shear slenderness ratio of 3.3, the ultimate load was 21% higher.
The singly strengthened test specimen PB-S-27 with a shear slenderness of 2.1 failed at an ultimate load of 1036 kN, representing a load increase of 42% compared to the unstrengthened test specimen PB-S-20. Two distinct failure mechanisms were observed, although it was not possible to differentiate them chronologically. Similar to the other slender T-beams tested, there were shear cracks originating from the supports on the underside of the web. After exposing the stirrups and longitudinal reinforcement in the shear zone, the failure of the steel reinforcement was ruled out. However, some slipping between the longitudinal reinforcement and the concrete, as well as slight tilting of the stirrups, was observed, as shown in Figure 11. This suggests a failure in the connection between the tension chord and the web. The extent to which there is a correlation between the shear crack formation on the underside due to shear stress and the previously mentioned failure mechanism still needs further investigation.
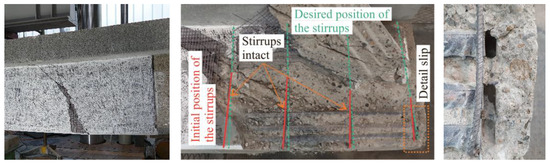
Figure 11.
Beam PB-S-27; (left): failure pattern; (middle): bared reinforcement in the area of failure; (right): slip of the bending reinforcement at the support.
4.5.11. Comparison between Shear Stress and Concrete Tensile Strength
In the initial analysis, the achieved shear stresses (see Table 3 and Table 4) were compared with the uniaxial concrete tensile strength f1,ctm* of the entire cross-section. The use of uniaxial concrete tensile strength, instead of splitting tensile strength, is in accordance with the approach outlined in reference [52]. The uniaxial concrete tensile strength f1,ctm,AB for the existing concrete can be determined relative to the average splitting tensile strength fctm,sp (as shown in Table 3 and Table 4) using the following equation, as outlined in reference [39]:
The uniaxial concrete tensile strength f1,ctm,VS of the strengthening layer was calculated according to [53]:
The average flexural tensile strength fctm,fl of the fine concrete in the strengthening layer, determined on the 40 mm high prism, was 5.79 N/mm2.
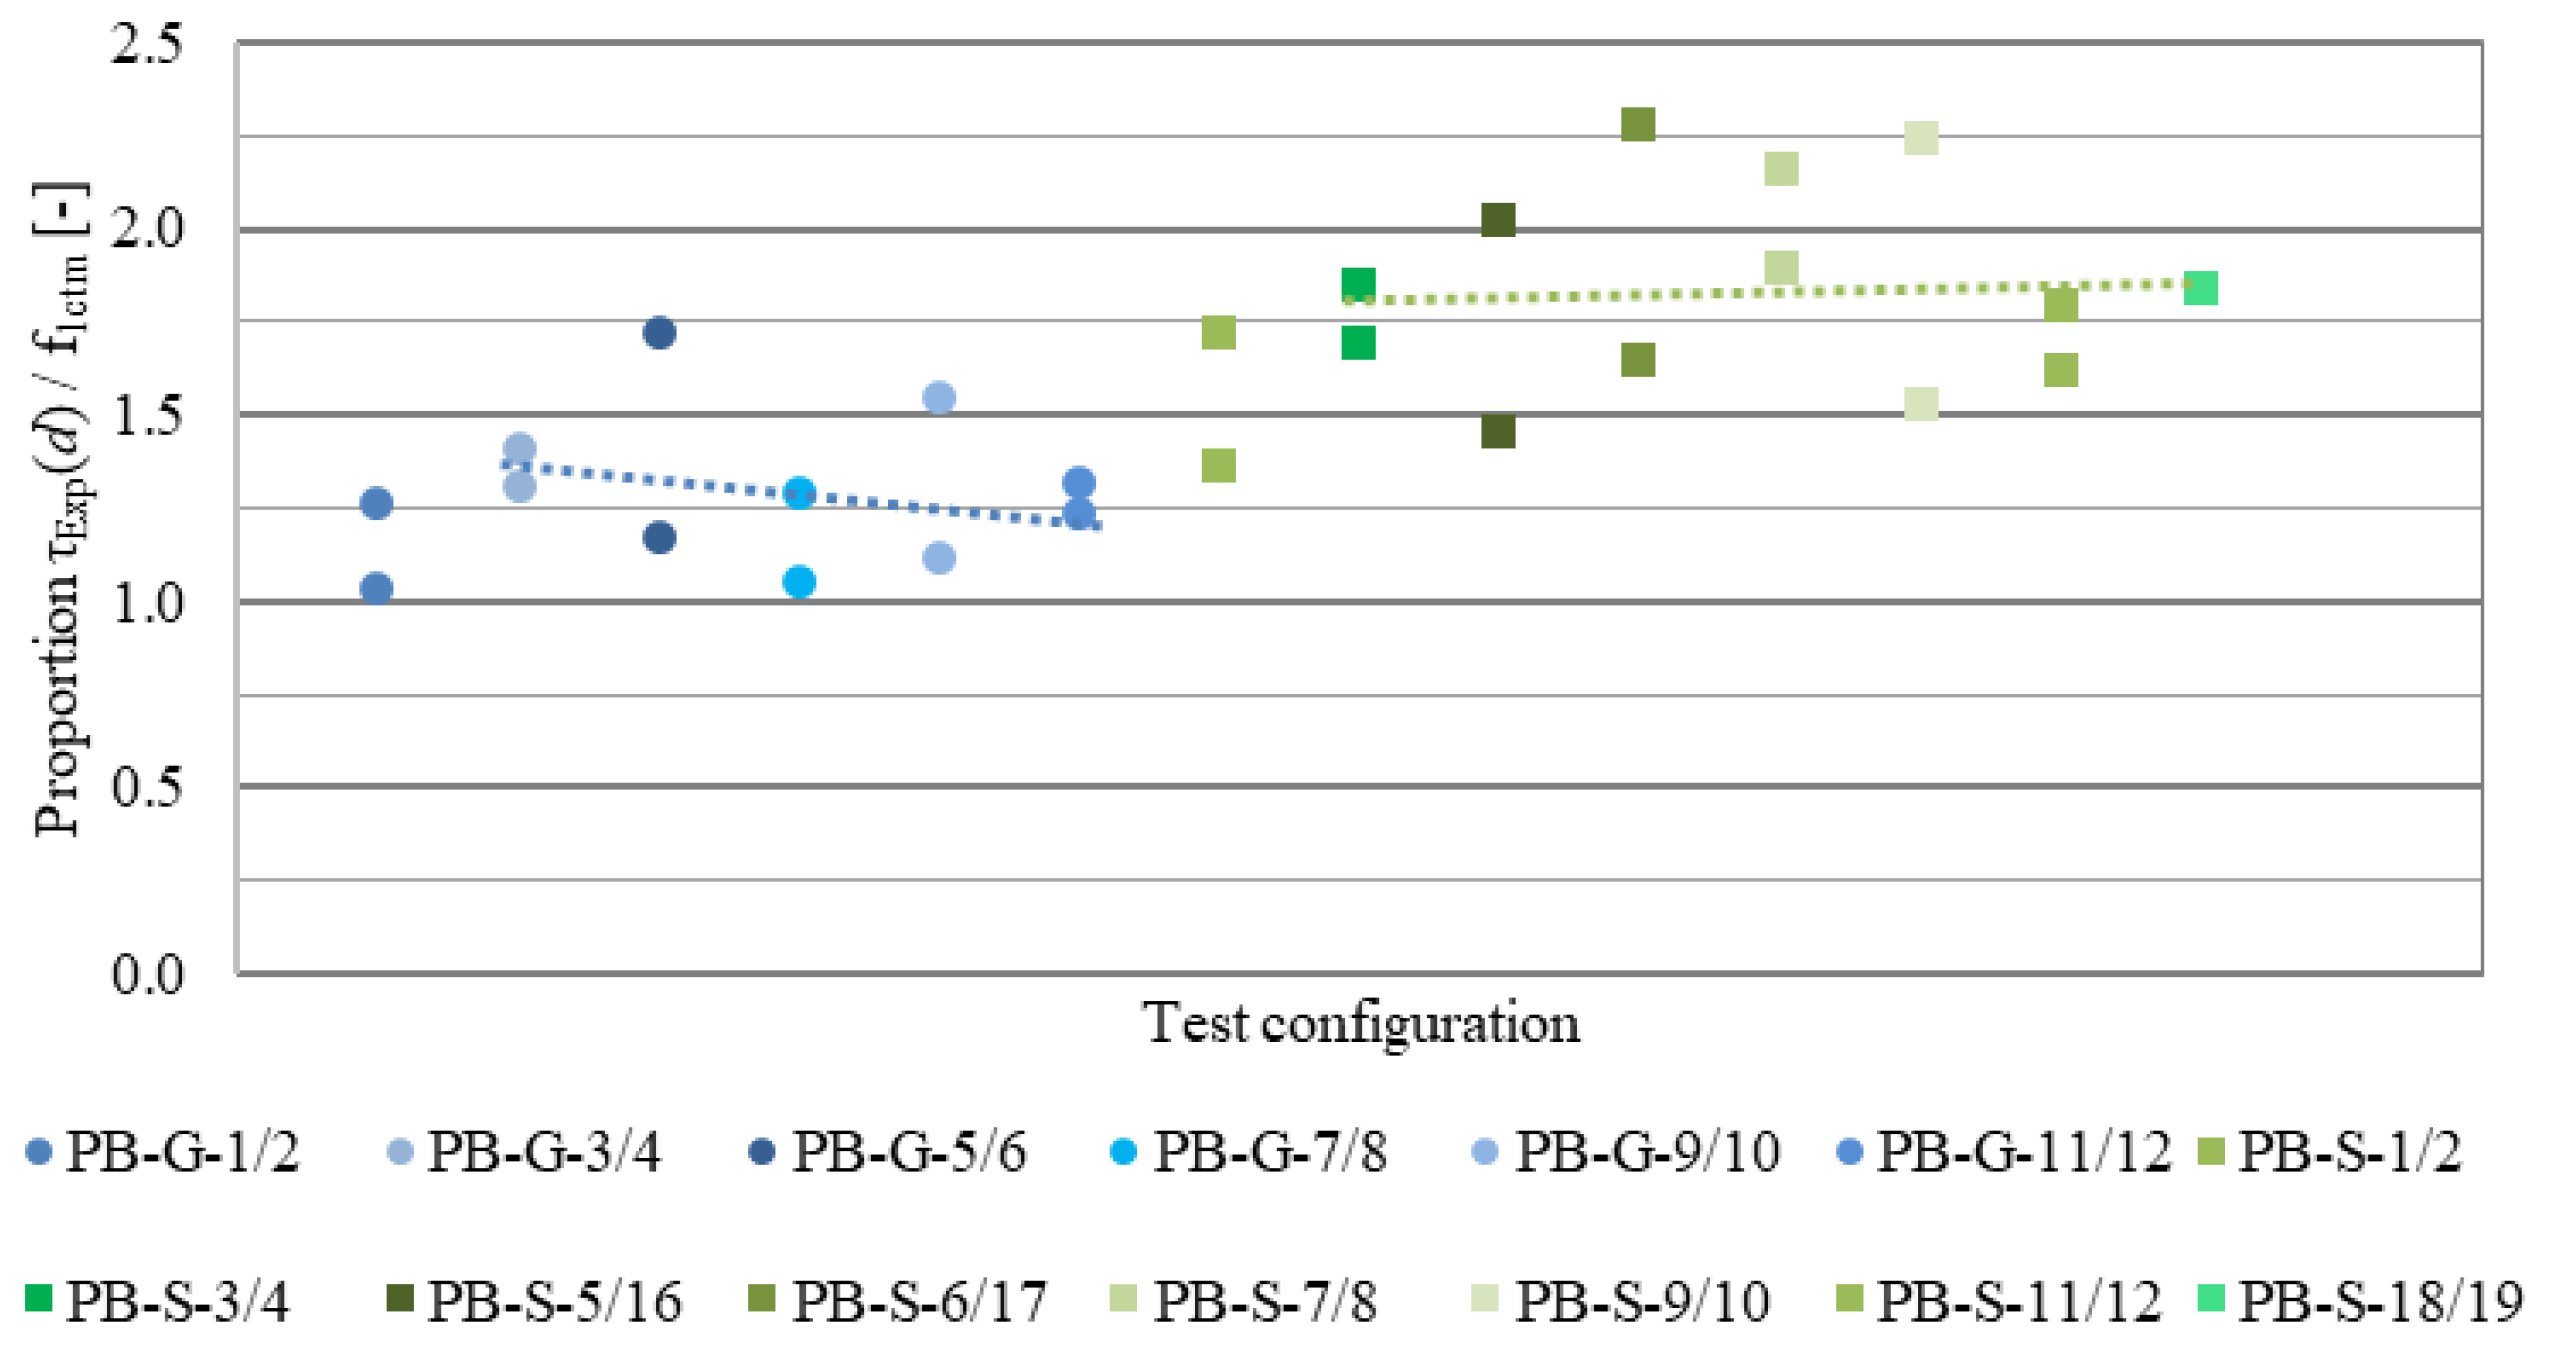
In Figure 12, the ratio of the shear stress τExp(d) to the uniaxial concrete tensile strength f1ctm* of the entire cross-section is depicted, with a shear slenderness λ of 3.3. To do this, the uniaxial concrete tensile strength was proportionally added across the width of the concrete layers—web width bw and strengthening layer tm—on the entire cross-section as follows:
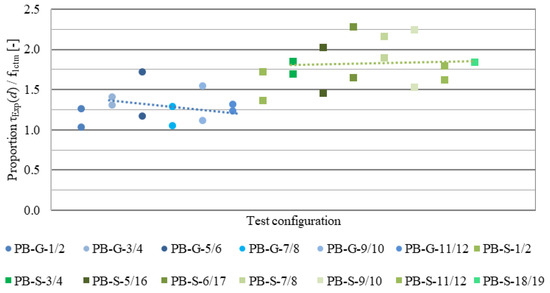
Figure 12.
Experimental shear stress τExp(d) referred to the axial concrete tensile strength f1,ctm* of the total cross-section with a shear slenderness of λ = 3.3.
It is worth noting that the shear stresses τExp(d) in the PB-G series are approximately 1.3 times the respective uniaxial concrete tensile strength f1,ctm*. For the PB-S components, the data points for shear stresses to be approximately 1.85 times above the related concrete tensile strength. Based on the observed failure mechanisms in the experiments, it is suspected that the maximum shear stress-carrying capacity is dependent on the concrete tensile strength of the existing concrete. Due to the different component geometries (scale effect), the trend lines are at different levels. The extent to which this approach can explain the observed failure by delamination of the strengthening layer at the side of the web and potentially derive a limit for the achievable shear stress in strengthened components is the subject of current investigations.
5. Experimental Verification
5.1. Unstrengthened Specimen with EC2
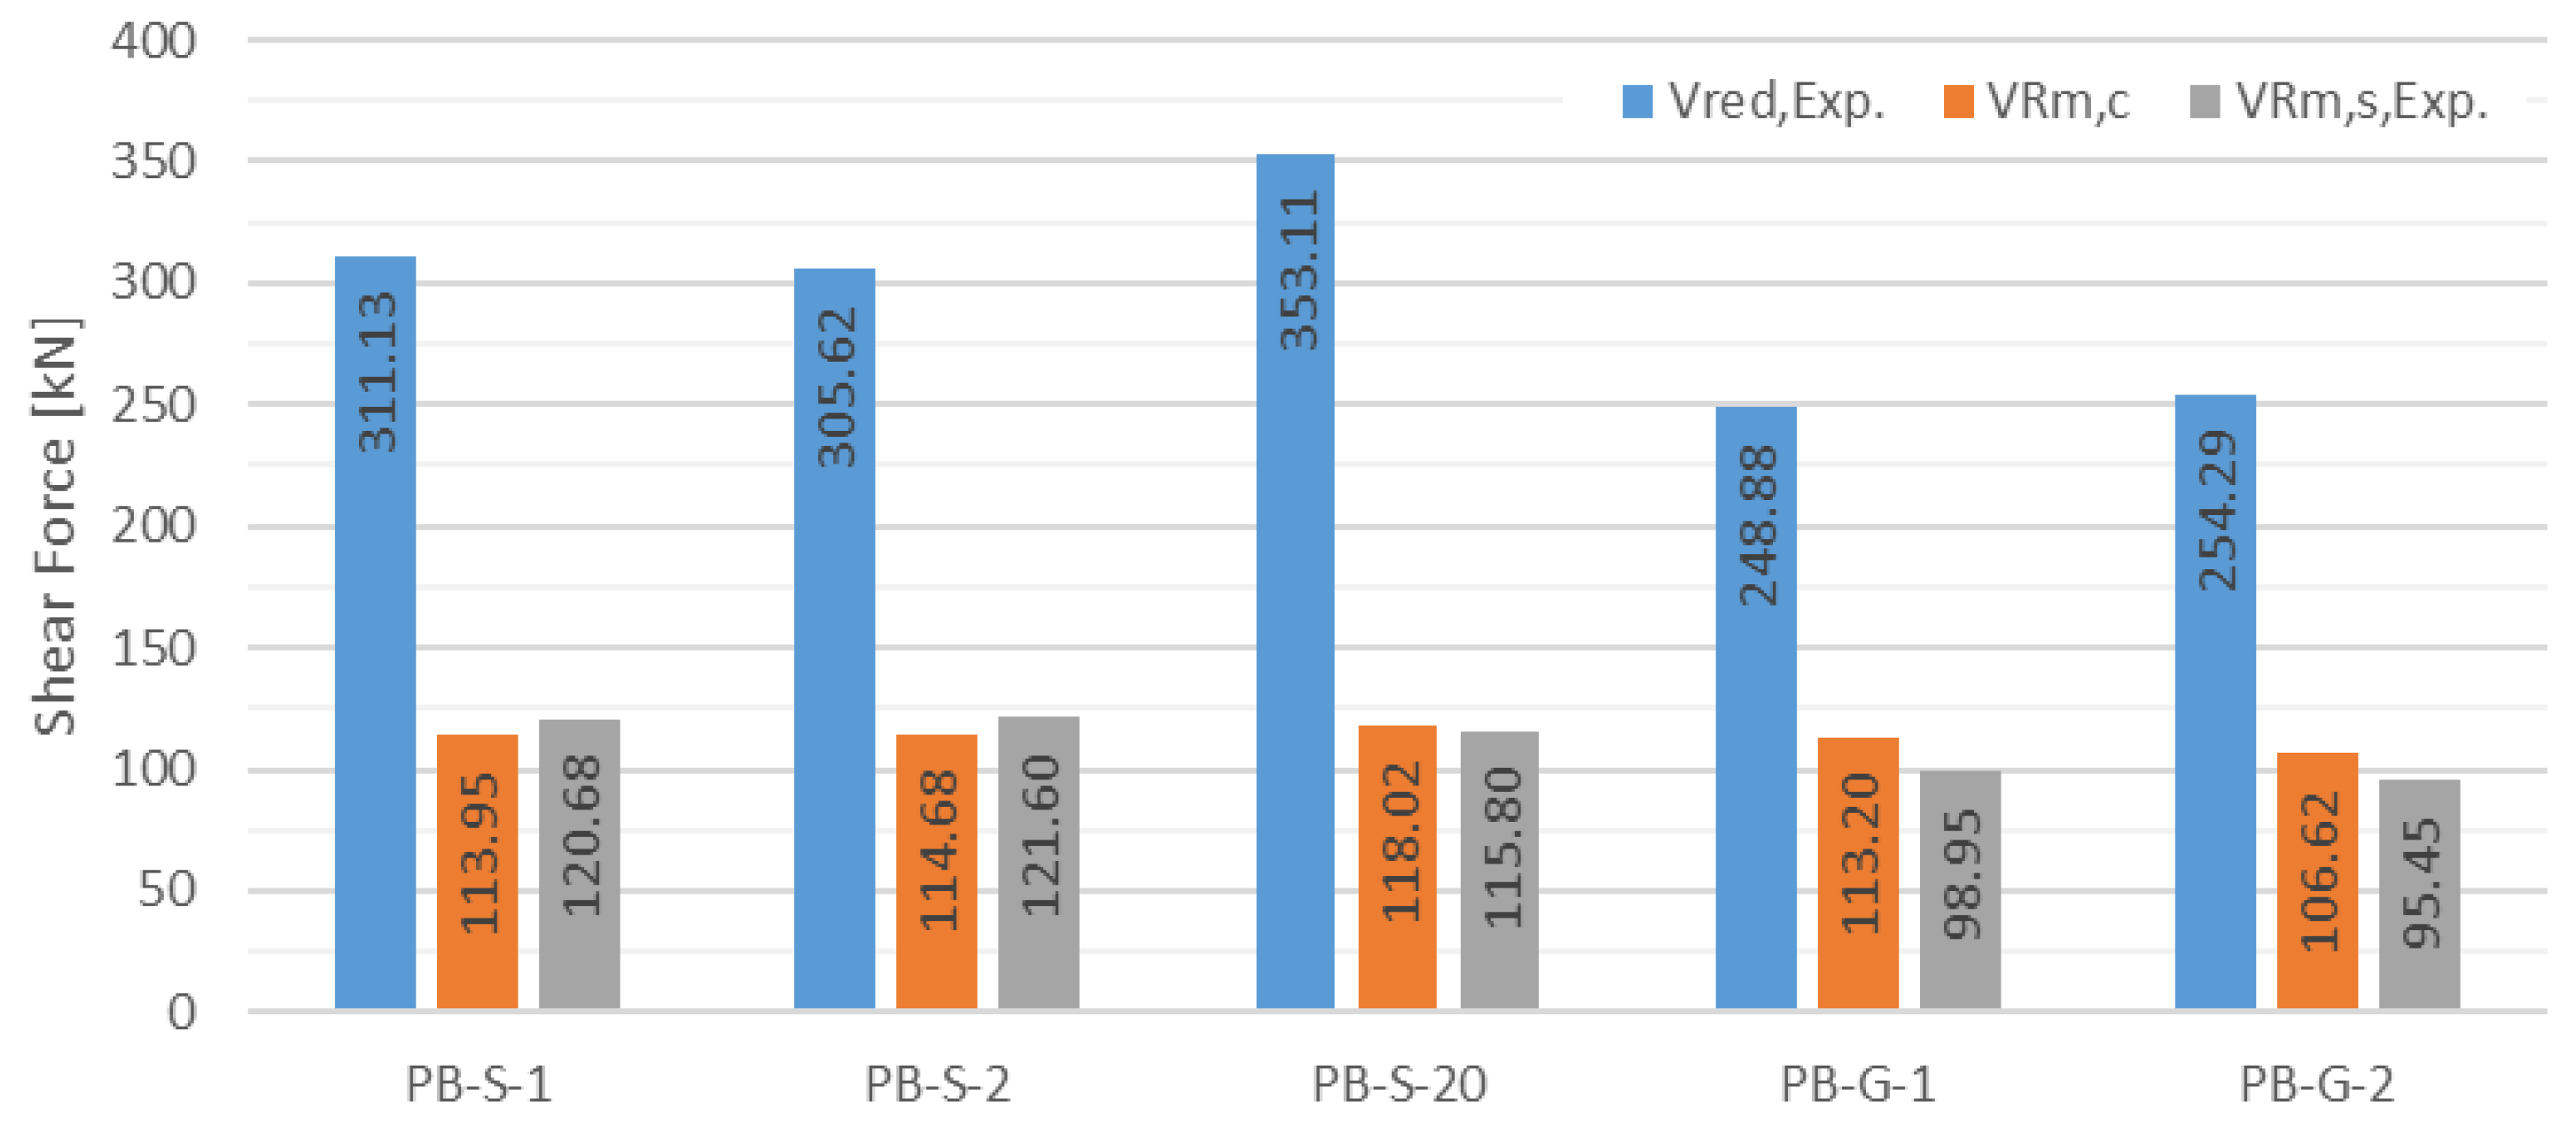
The verification of the shear resistance of the reference specimens is carried out in accordance with EC2 [39] and the specifications of Brückner [11]. The following Figure 13 provides a comparison of the experimentally obtained shear capacities Vred,Exp with the calculated shear resistances. The calculated shear resistances without transverse reinforcement are represented by VRm,c. The shear resistances of the transverse reinforcement or the shear crack angle θ were determined based on the failure load (VRd,s = Vred,Exp) using VRm,s,Exp.
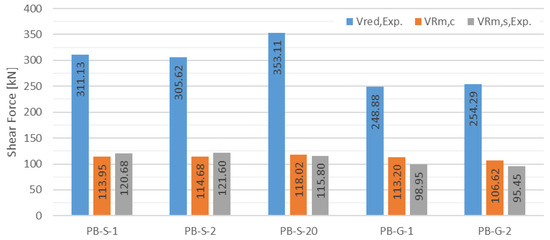
Figure 13.
Comparison of the experimental shear capacity with the calculated shear resistances according to EC2 [39] (Load-carrying capacity of PB-S-20 calculated with coefficient β).
In conclusion, it can be noted that for the tested structural configurations, there are no theoretical predictions of the experimental load-carrying capacities using the shear model according to EC2 [39].
5.2. Strengthened Specimen with Brückner and Escrig
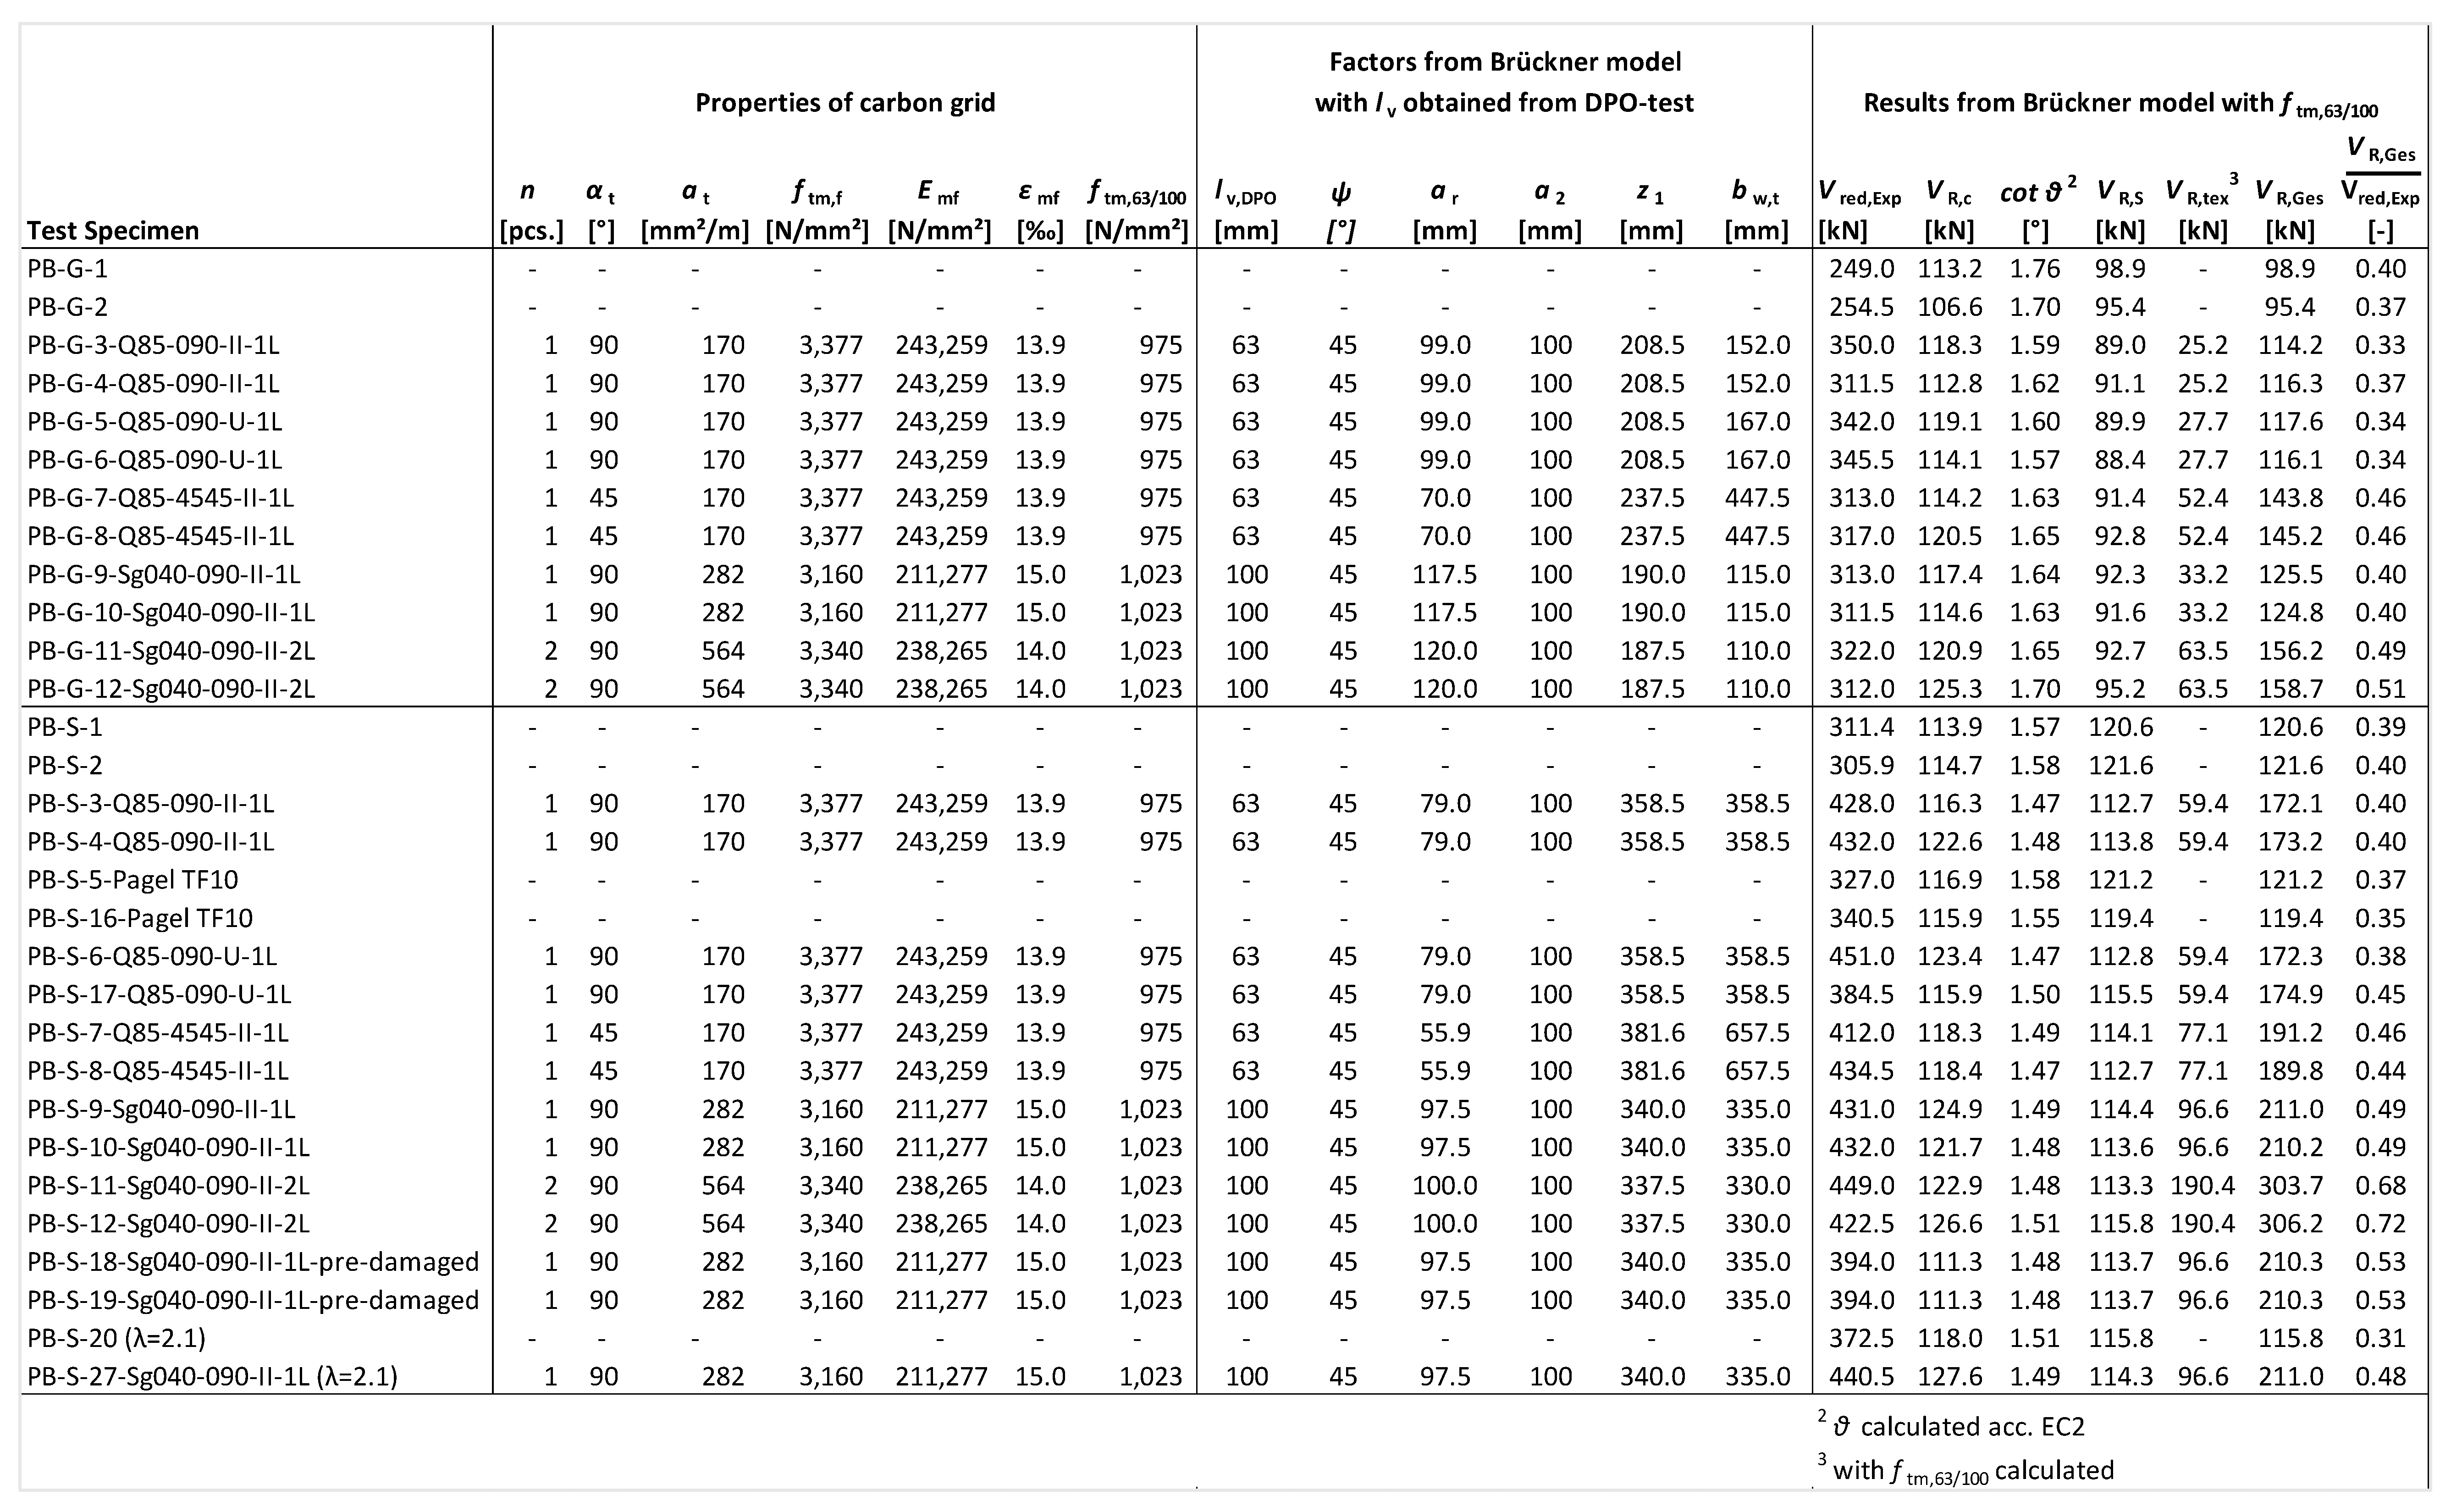
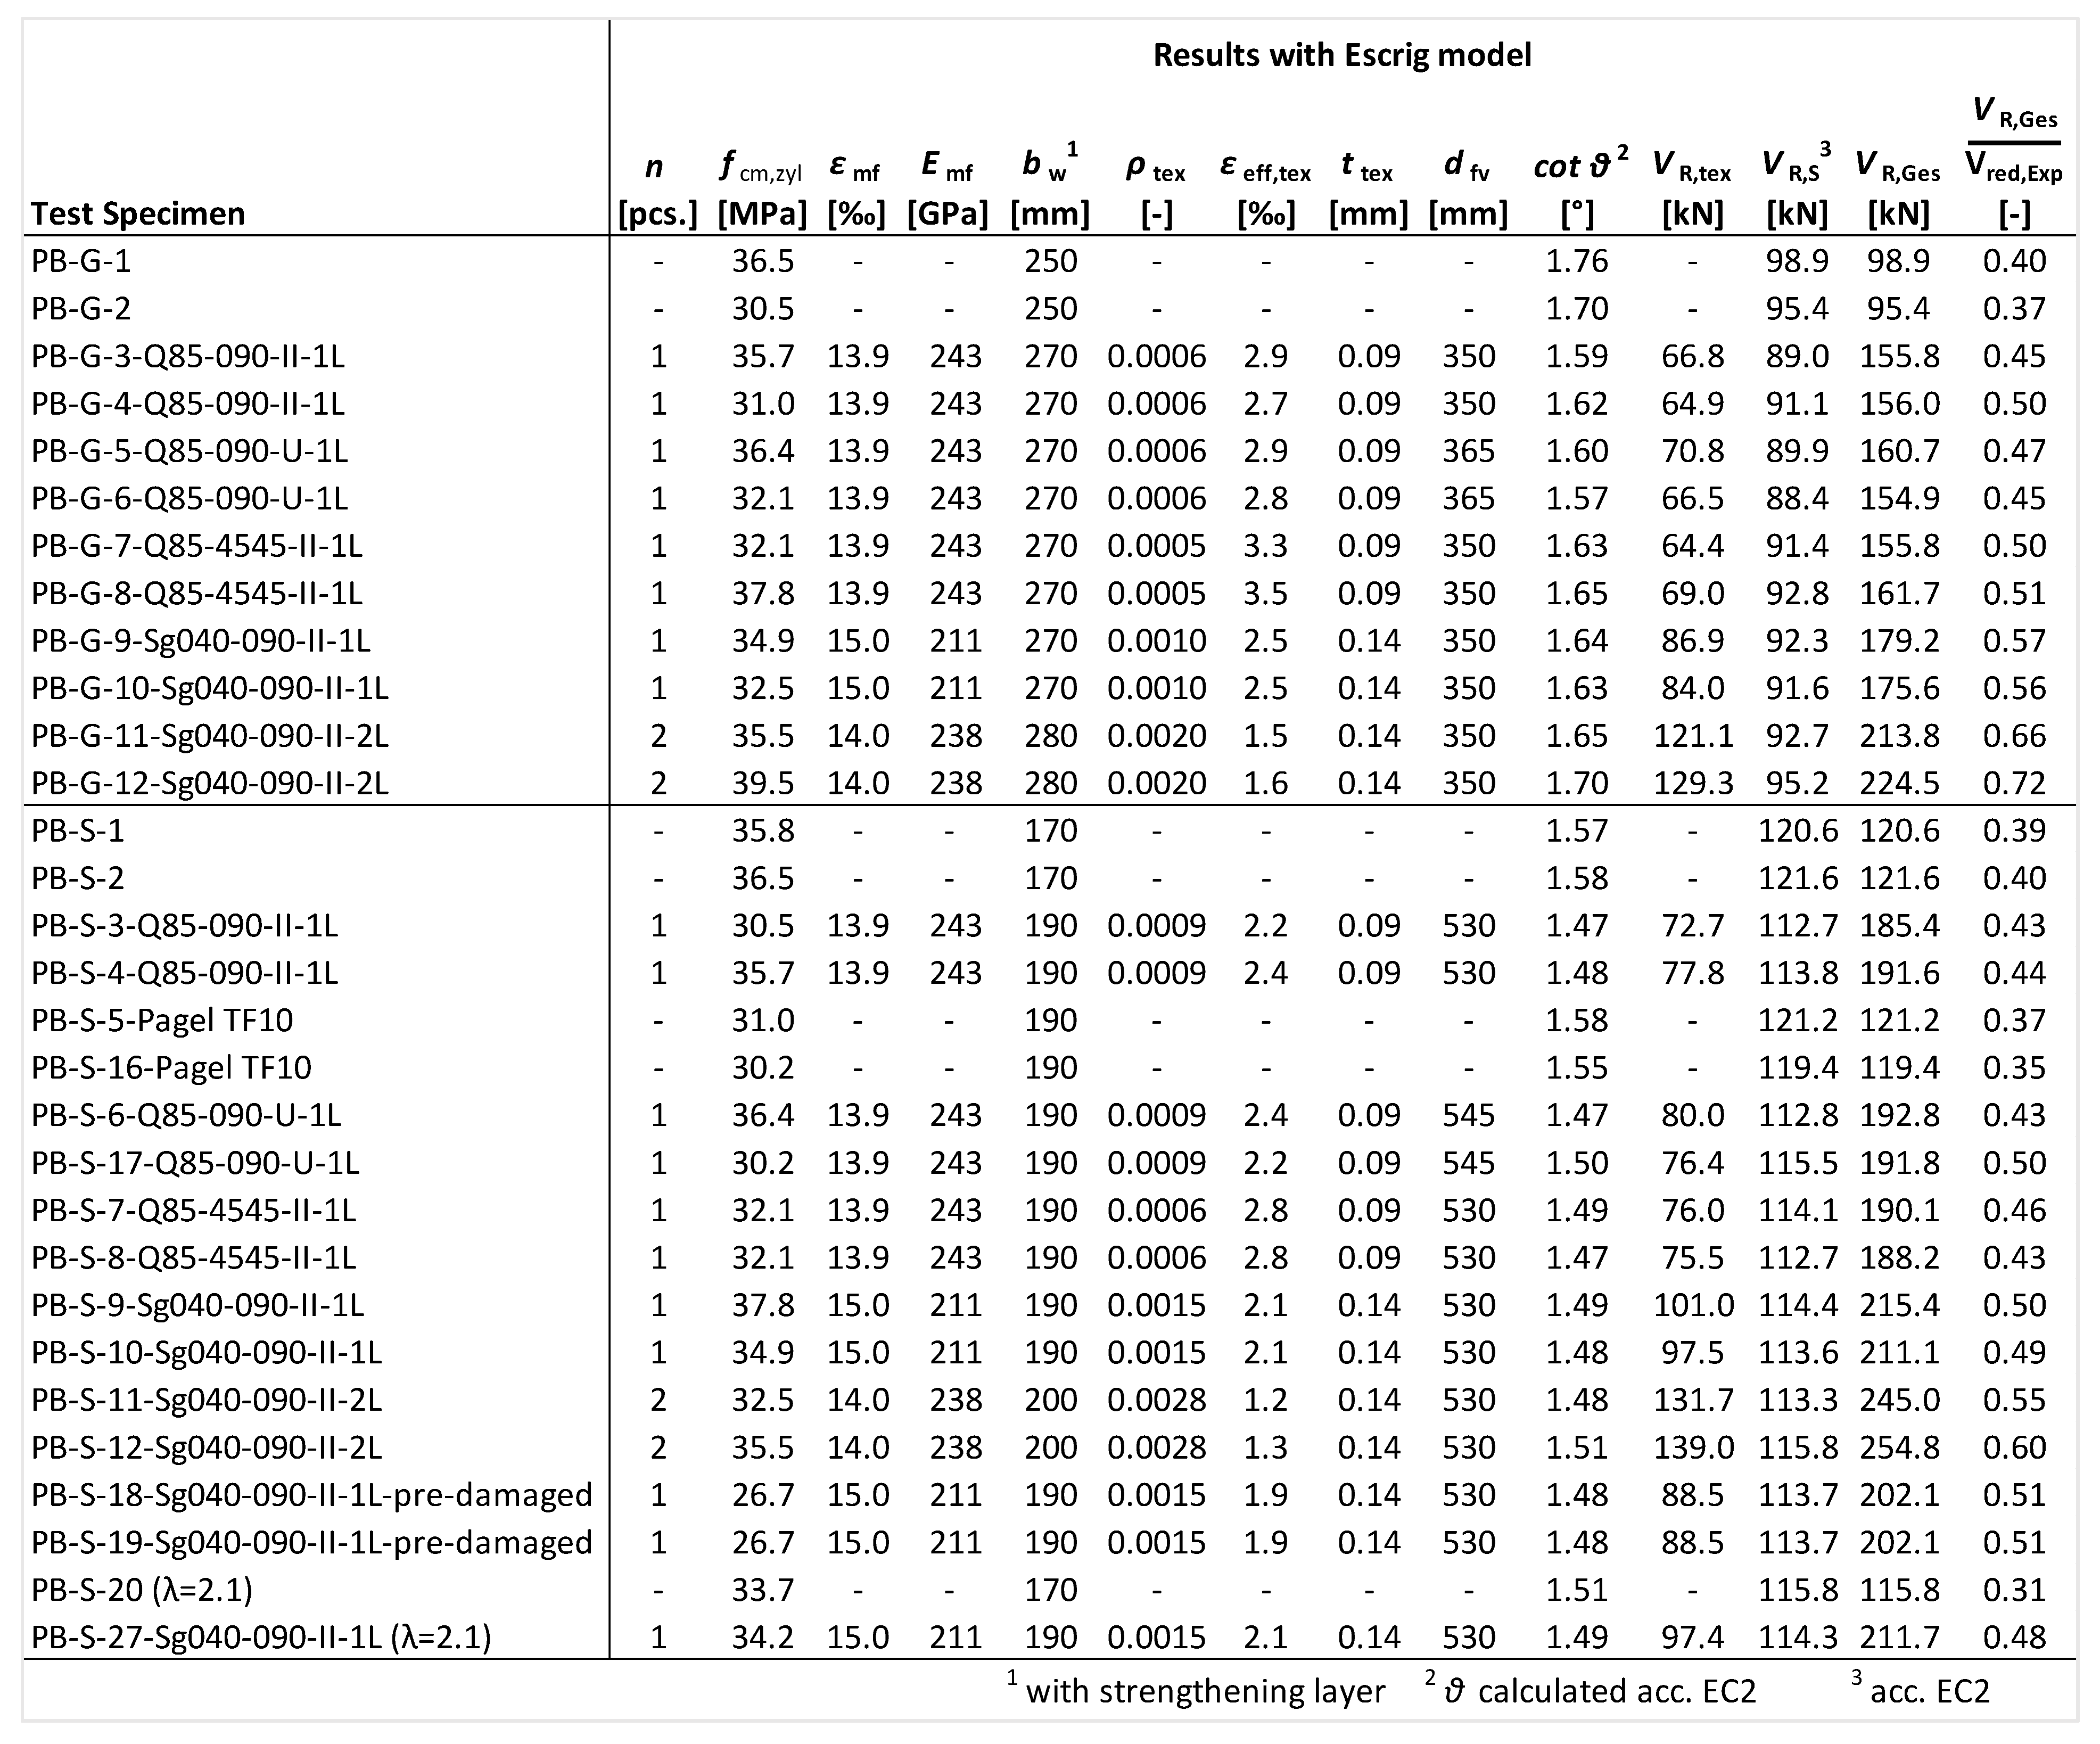
In this section, the static components strengthened with CRC are recalculated based on the approaches of Brückner [11] and Escrig [34]. However, it should be noted that both models and their results should be questioned in advance based on the findings and insights from Section 4.5. The model of Brückner [11] is shown in Section 3. Information and the model of Escrig are given in [34] and in Appendix A.
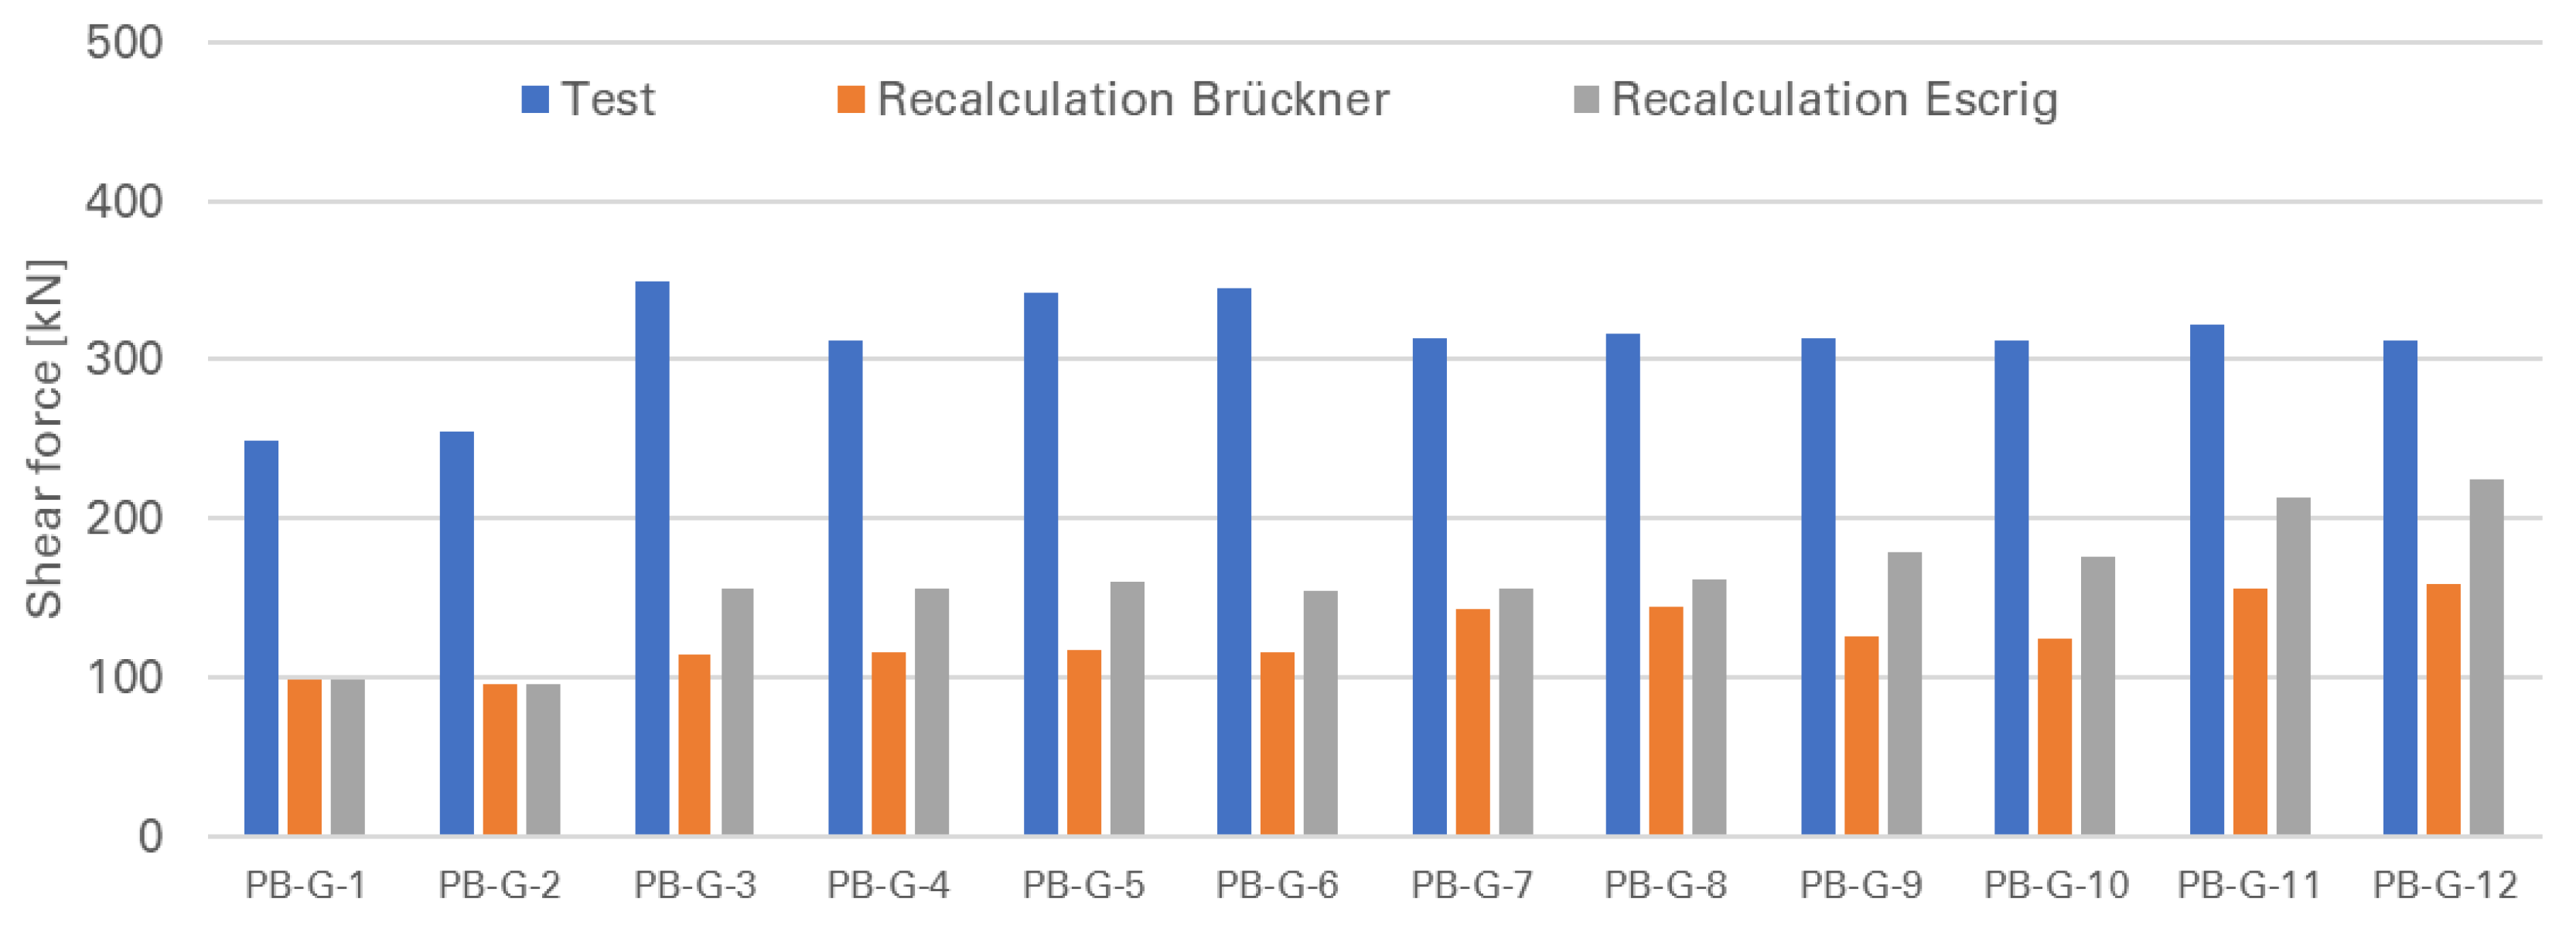
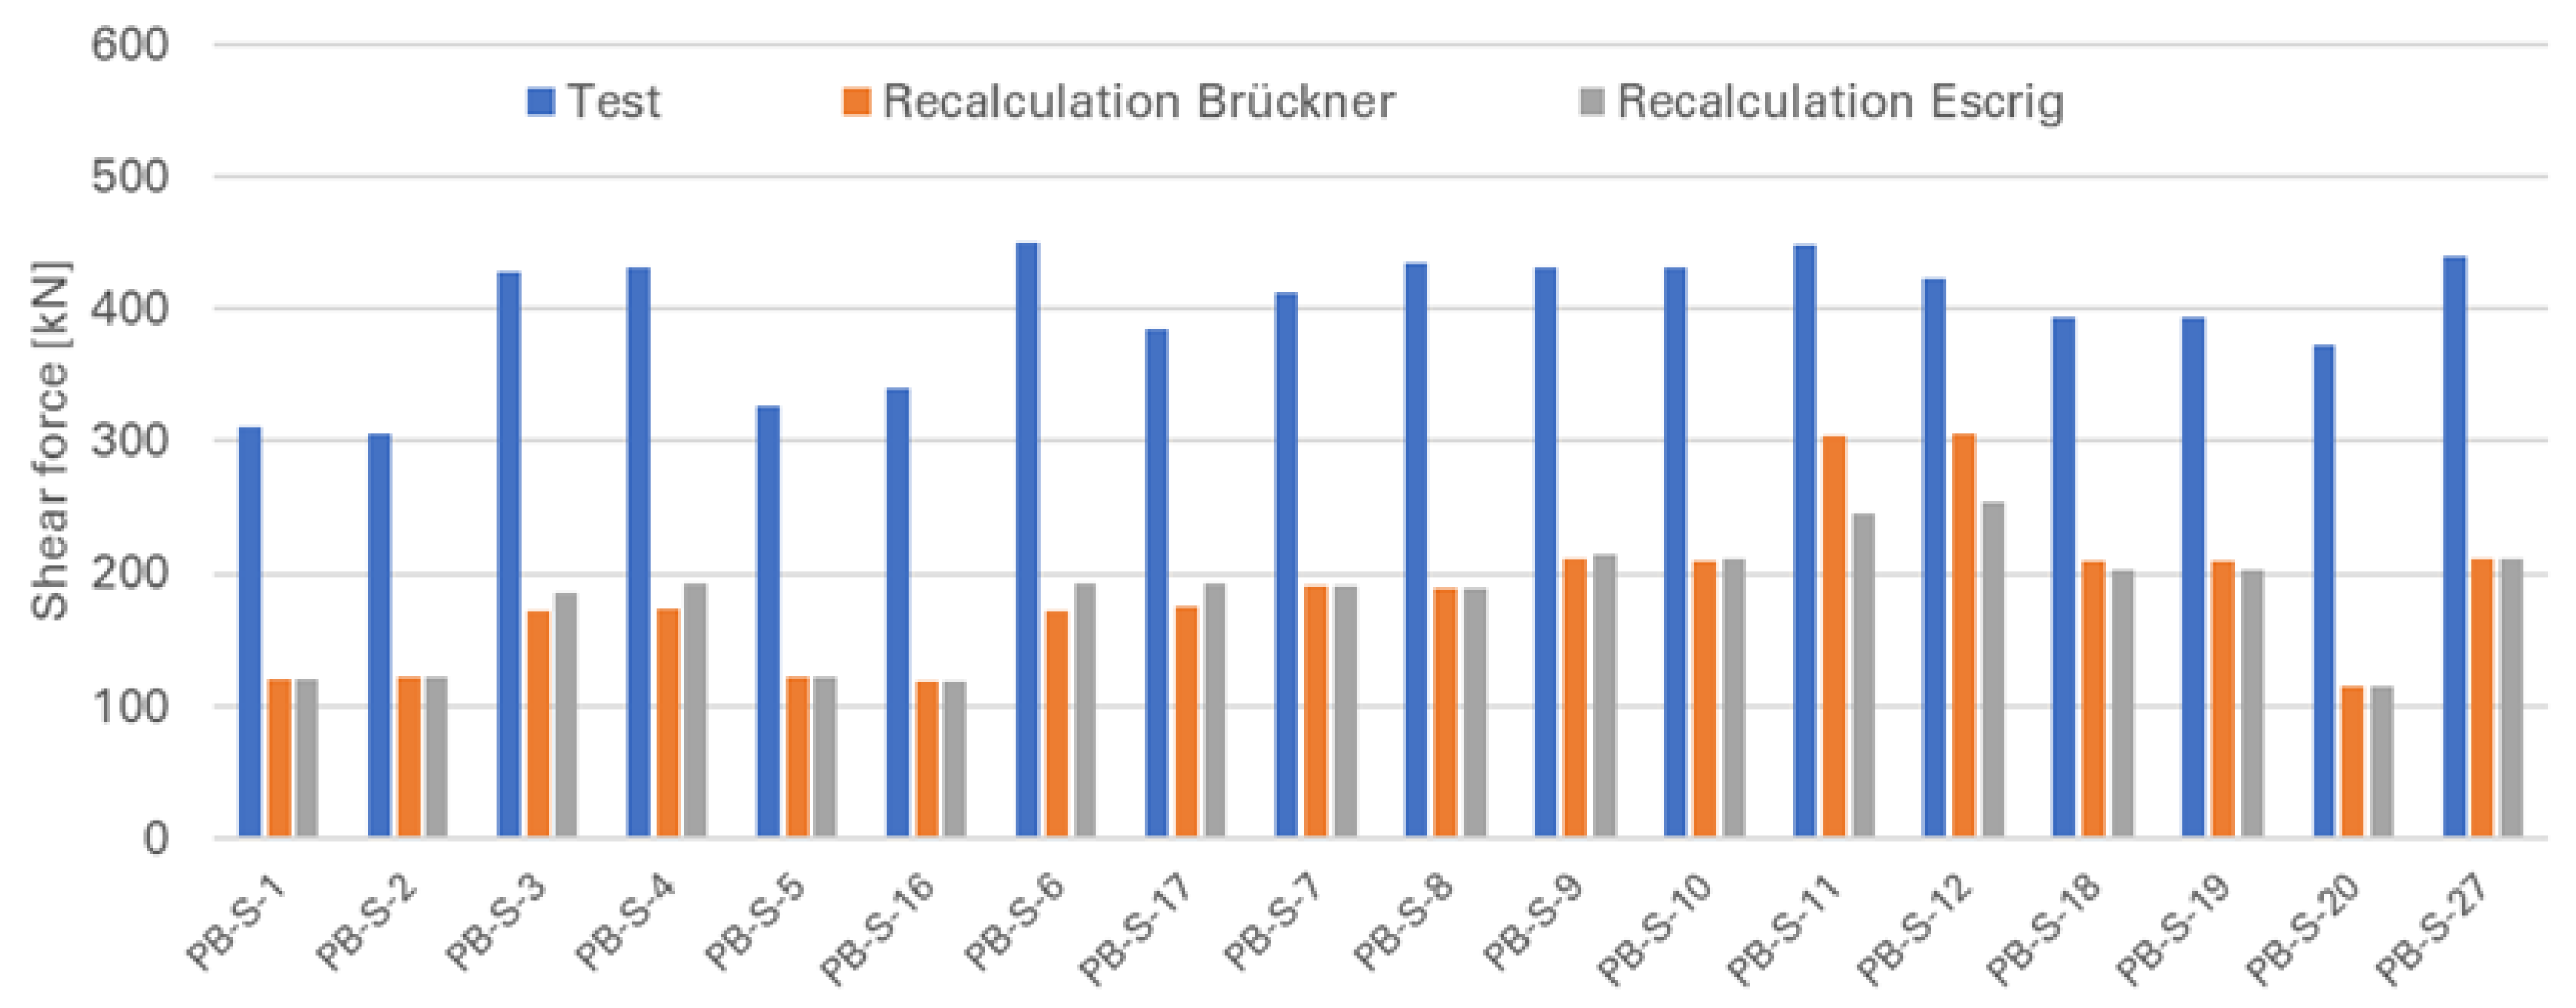
In Figure 14 (PB-G) and Figure 15 (PB-S), the experimental and calculated shear capacities according to Brückner [11] and Escrig [34] are presented. It should be noted that the approach described by [34] allows for higher load-bearing capacities in the strengthened components of the PB-G series. For the PB-S series, the calculated load capacities are generally at a similar level, with the exception of the two-layer strengthened components PB-S-11/-12. In the case of the two-layer test configuration, lower load capacities are achieved using the Escrig [34] approach. Both models significantly underestimate the experimental shear capacities.

Figure 14.
Comparison of the experimental and calculated shear capacities using the Brückner [11] and Escrig [34] approaches for the PB-G series.
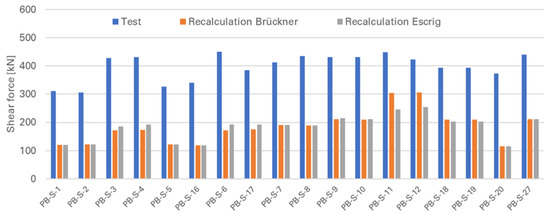
Figure 15.
Comparison of the experimental and calculated shear capacities using the Brückner [11] and Escrig [34] approaches for the PB-S series.
The recalculation of the components using the approaches according to Brückner [11] and Escrig [34] are performed in Appendix B and Appendix C.
The determination of the load-bearing portion of the unstrengthened and strengthened T-beams were carried out according to Brückner’s approach [11] using the EC2 [39] model. This load-bearing portion of the shear reinforcement is also used for the Escrig approach [34]. The shear load-bearing portion of the CRC strengthening layer cannot be accurately represented for both approaches, as the shear capacity for the RC base structure according to EC2 [39] is significantly underestimated. For the tested and recalculated specimens with strengthening, an overestimation of both models [11,34] was observed. This is best observed in the beams of the PB-S series with one-layer (PB-S-9/-10) and two-layer (PB-S-11/-12) strengthening. In the experiment, the components failed at a similar load level, with the strengthening layer detaching from the structural body. According to the recalculation using [11,34], the two-layer strengthening should have achieved higher load-bearing capacities.
Both models essentially reflect the shear capacity of the strengthened tension strut and are based on the tensile failure of the carbon grid. Premature failure due to the withdrawal or splitting of the carbon grids in the strengthening layer, as well as bond failure between the old concrete and the strengthening layer, are not considered in these approaches. The observed failure mechanisms involving delamination and detachment of the strengthening layer and the longitudinal cracks on the underside of the web are also not taken into account. From this perspective, both models are unsuitable for predicting the load-bearing capacity of shear strengthened R structures with CRC.
6. Summary and Outlook
The experimental investigations on the shear reinforcement of strengthened RC structures with CRC using next-generation carbon grids show a significant increase in load-carrying capacity of up to 42% compared to the reference specimens. These results confirm previous findings on the potential for load increases (e.g., [11,13,40]) and demonstrate the potential of this shear strengthening method. However, an apparent limit regarding the maximum strengthening ratio was also observed, depending on the existing concrete tensile strength, as the failure modes suggest that the strengthening layer may detach from the existing concrete section due to tensile stresses. Failures occurred at the interface between the existing concrete and the fine concrete as well as within the existing concrete. To precisely assess the results, further investigations, such as analyzing the measured shear crack angles and crack and failure patterns, are needed, in addition to verification with approaches from [11,34,54]. Due to the complexity of the shear behavior of reinforced concrete elements strengthened with carbon-reinforced concrete, further fundamental experimental and theoretical research is required.
Author Contributions
Conceptualization, S.M. and A.S.; methodology, S.M.; software, A.S.; validation, S.M. and A.S.; formal analysis, S.M.; investigation, S.M.; resources, S.M. and A.S.; data curation, S.M.; writing—original draft preparation, S.M.; writing—review and editing, A.S.; visualization, S.M.; supervision, A.S.; project administration, S.M.; funding acquisition, A.S. All authors have read and agreed to the published version of the manuscript.
Funding
This research was funded by Federal Ministry of Education and Research Germany (BMBF), grant numbers 03ZZ0312A (C3-V1.2), 03ZZ0321A (C3-V2.1) and 03ZZ0327 (C3-V2.7).
Data Availability Statement
Data available in a publicly accessible repository that does not issue DOIs Publicly available datasets were analyzed in this study. This data can be found here: Projekt-Schlussbericht Zwanzig20-Carbon Concrete Composite-C3, V1.2: Nachweis und Prüfkonzepte für Normen und Zulassungen, Teilvorhaben V1.2-III: Projektlaufzeit: 01.01.2016 bis 30.04.2019 (tib.eu).
Conflicts of Interest
The authors declare no conflict of interest.
Appendix A. Model of Escrig [34]
With:
n: The number of layers of reinforcement at the web,
εeff,tex: Effective strain of the textile reinforcement,
Ef: Young’s modulus of the fiber strand,
ttex: Equivalent width of the textile reinforcement,
df: Effective depth of the strengthening,
α: Angle of the fiber strand with respect to the component axis and
: Shear crack angle.
- Circumferentially closed strengthening: A = 0.035 B = 0.65
- Lateral or U-shaped strengthening: A = 0.020 B = 0.55
Appendix B. Recalculation with Brückner [11]
Appendix C. Recalculation with Escrig [34]
References
- Hegger, J.; Marzahn, G.; Teworte, F.; Herbrand, M. Principal tensile stress criterion for the shear assessmentof existing concrete bridges. Beton-Und Stahlbetonbau 2015, 110, 82–95. [Google Scholar] [CrossRef]
- Fischer, O.; Gehrlein, S.; Schram, N.; Nowak, M. Nachrechnungsdefizite bei Massivbrücken—Ein Problem der Tragfähigkeit oder [doch nur] der Modellvorstellung? In 29. Dresdner Brückenbausymposium—Planung, Bauausführung, Instandsetzung und Ertüchtigung von Brücken; Curbach, M., Ed.; Curbach: Dresden, Germany, 2019; pp. 129–146. [Google Scholar]
- Zilch, K.; Niedermeier, R.; Finckh, W. Praxisgerechte Bemessungsansätze für das wirtschaftliche Verstärken von Betonbauteilen mit geklebter Bewehrung—Querkrafttragfähigkeit. In Schriftenreihe des DAfStb, Heft 594; Deutscher Ausschuss für Stahlbeton, Ed.; Beuth Verlag: Berlin, Germany, 2012. [Google Scholar]
- Schnellenbach-Held, M.; Welsch, T.; Fickler, S.; Hegger, J.; Reißen, K. Verstärkungen Älterer Beton- und Spannbetonbrücken; Erfahrungssammlung Dokumentation, Projekt FE 15.0570/2012/NRB; Bundesanstalt für Straßenwesen (BASt): Bergisch Gladbach, Germany, 2016; 288p. [Google Scholar]
- Deutscher Ausschuss für Stahlbeton (Ed.) Richtlinie Verstärken von Betonbauteilen Mit Geklebter Bewehrung; Beuth Verlag: Berlin, Germany, 2012. [Google Scholar]
- CARBOCON GMBH: National Technical Approval (abZ) and General Construction Technique Permit (aBG) Z-31.10.-182: CARBOrefit®—Verfahren zur Verstärkung von Stahlbeton mit Carbonbeton; Printout; CARBOCON GMBH: Dresden, Germany, August 2023.
- Müller, E.; Schmidt, A.; Schumann, A.; May, S.; Curbach, M. Flexural strengthening with carbon reinforced concrete—Tests with new carbon reinforcements. Beton Und Stahlbetonbau 2020, 115, 758–767. [Google Scholar] [CrossRef]
- Hentschel, M.; Schumann, A.; Ulrich, H.; Jentzsch, S. Retrofitting of the Hyparshell in Magdeburg. Bautechnik 2019, 96, 25–30. [Google Scholar] [CrossRef]
- Scheerer, S.; Zobel, R.; Müller, E.; Senckpiel-Peters, T.; Schmidt, A.; Curbach, M. Flexural strengthening of RC structures with TRC—Experimental Observations, Design Approach and Application. Appl. Sci. 2019, 9, 1322. [Google Scholar] [CrossRef]
- Erhard, E.; Weiland, S.; Lorenz, E.; Schladitz, F.; Beckmann, B.; Curbach, M. Applications of textile reinforced concrete strengthening—Restoration and strengthening of built constructions with textile reinforced strengthening. Beton-Und Stahlbetonbau 2015, 110, 74–82. [Google Scholar] [CrossRef]
- Brückner, A. Shear Strengthening of Structural Members with Textile Reinforce Concrete. Ph.D. Thesis, TU Dresden, Dresden, Germany, 2011. [Google Scholar]
- Brückner, A.; Ortlepp, R.; Curbach, M. Textile reinforced concrete for strengthening in bending and shear. Mater. Struct. 2006, 39, 741–748. [Google Scholar] [CrossRef]
- Triantafillou, T.C.; Papanicolaou, C.G. Shear strengthening of reinforced concrete members with textile reinforced mortar (TRM) jackets. Mater. Struct. 2007, 39, 93–103. [Google Scholar] [CrossRef]
- Herbrand, M.; Adam, V.; Classen, M.; Kueres, D.; Hegger, J. Strengthening of Existing Bridge Structures for Shear and Bending with Carbon Textile-Reinforced Mortar. Materials 2017, 10, 1099. [Google Scholar] [CrossRef]
- Herbrand, M.; Classen, M.; Hegger, J. Shear tests on prestressed concrete beams strengthened with carbon textile reinforced spray mortar under cyclic loading. Beton-Und Stahlbetonbau 2016, 111, 576–587. [Google Scholar] [CrossRef]
- Brückner, A.; Wellner, S.; Ortlepp, R.; Scheerer, S.; Curbach, M. T-beams strengthened with TRC under non predominantly static loading. Beton-Und Stahlbetonbau 2013, 108, 169–178. [Google Scholar] [CrossRef]
- May, S.; Schumann, A.; Schütze, E.; Curbach, M. Querkraftverstärkung aus Carbonbeton unter zyklischer Beanspruchung. In Tagungsband zum 4. Brückenkolloquium—Fachtagung für Beurteilung, Planung, Bau, Instandhaltung und Betrieb von Brücken; Foster, F., Gilbert, R., Mendis, P., Al-Mahaidi, R., Millar, D., Eds.; Technischen Akademie Esslingen: Ostfildern, Germany, 2020; pp. 643–650. [Google Scholar]
- El Ghadioui, R.; Wagner, J.; Klein, J.; Proske, T.; Curbach, M.; Graubner, C. RC members with a flexural-strengthening layer of CFRP textile-reinforced concrete under monotonic and cyclic long-term loading. Struct. Concr. 2022, 23, 939–953. [Google Scholar] [CrossRef]
- Homepage Projekt C3—Carbon Concrete Composite: C3—Carbon Concrete Composite: C3–Carbon Concrete Composite–Carbonbeton–Die Zeit ist jetzt!–Neubau, Instandsetzung, Schulung, Zulassung rund um das Thema Carbonbeton. Available online: https://carbon-concrete.org (accessed on 6 October 2023).
- May, S.; Schumann, A.; Bergmann, S.; Curbach, M.; Hegger, J. Shear Strengthening of Reinforced Structures with Carbon Reinforced Concrete. In Proceedings of the Concrete—Innovations in Materials, Design and Structures, 2019 fib Symposium, Krakow, Poland, 27–29 May 2019; pp. 1563–1570. [Google Scholar]
- May, S.; Schumann, A.; Curbach, M. Shear strengthening of structures with carbon reinforced concrete. In Proceedings of the 12th fib International PhD Symposium in Civil Engineering, Prague, Czech Republic, 29–31 August 2018; pp. 879–885. [Google Scholar]
- Schumann, A.; Zobel, R.; Curbach, M. Finite element research of reinforced concrete structures strengthened with textile reinforced concrete (TRC). In Computational Modelling of Concrete Structures; Meschke, G., Pichler, B., Rots, J.G., Eds.; CRC Press: Boca Raton, FL, USA, 2018; pp. 829–837. [Google Scholar]
- Bergmann, S.; May, S.; Hegger, J.; Curbach, M. Shear strengthening of reinforced concrete T-beams using carbon reinforced concrete. Spec. Publ. 2020, 345, 169–184. [Google Scholar]
- Mazzuca, P.; Ombres, L.; Guglielmi, M.; Verre, S. Residual Mechanical Properties of PBO FRCM Composites after Elevated Temperature Exposure: Experimental and Comparative Analysis. J. Mater. Civ. Eng. 2023, 35, 04023383. [Google Scholar] [CrossRef]
- Holz, K.; Curbach, M. Carbon reinforced concrete exposed to high temperatures. Struct. Concr. 2023, 3178–3190. [Google Scholar] [CrossRef]
- Adam, V.; Herbrand, M.; Claßen, M. Experimental Investigations on the Influence of the Slab Width and the Moment-Shear-Ratio on the Shear Capacity of RC Slabs without Shear Reinforcement. Bauingenieur 2018, 93, 37–45. [Google Scholar] [CrossRef]
- Herbrand, M. Shear Strength Models for Reinforced and Prestressed Concrete Members. Ph.D. Thesis, RWTH Aachen University, Aachen, Germany, 2017. [Google Scholar]
- Classen, M. Shear Crack Propagation Theory (SCPT)—The mechanical solution to the riddle of shear in RC members without shear reinforcement. Eng. Struct. 2020, 210, 110207. [Google Scholar] [CrossRef]
- Ruiz, M.F.; Muttoni, A.; Sagaseta, J. Shear strength of concrete members without transverse reinforcement: A mechanical approach to consistently account for size and strain effects. Eng. Struct. 2015, 99, 360–372. [Google Scholar] [CrossRef]
- Schacht, G. Experimental Evaluation of the Shear Bearing Safety. Ph.D. Thesis, TU Dresden, Dresden, Germany, 2014. [Google Scholar]
- Hegger, J.; Sherif, A.; Görtz, S. Shear Capacity of Beams made of High Performance Concrete. In Proceedings of the ACI’s 7th International Symposium on Utilization of High-Strength/High-Performance Concrete, Kassel, Germany, 13–15 September 2004. [Google Scholar]
- Huber, P.; Huber, T.; Kollegger, J. Investigation of the shear behavior of RC beams on the basis of measured crack kinematics. Eng. Struct. 2016, 113, 41–58. [Google Scholar] [CrossRef]
- Al-Salloum, Y.A.; Elsanadedy, H.M.; Alsayed, S.H.; Iqbal, R.A. Experimental and Numerical Study for the Shear Strengthening of Reinforced Concrete Beams Using Textile-Reinforced Mortar. J. Compos. Constr. 2012, 16, 74–90. [Google Scholar] [CrossRef]
- Escrig, C.; Gil, L.; Bernat-Maso, E.; Puigvert, F. Experimental and analytical study of reinforced concrete beams shear strengthened with different types of textile reinforced mortar. Constr. Build. Mater. 2015, 83, 248–260. [Google Scholar] [CrossRef]
- Müller, E.; Scheerer, S.; Curbach, M. Strengthening of existing concrete structures: Design models. In Textile Fibre Composites in Civil Engineering; Triantafillou, T.C., Ed.; Woodhead Publishing/Elsevier: Amsterdam, The Netherlands, 2016; pp. 323–359. [Google Scholar] [CrossRef]
- Gonzalez-Libreros, J.H.; Sneed, L.H.; D’Antino, T.; Pellegrino, C. Behaviour of RC beams strengthened in shear with FRP and FRCM composites. Eng. Struct. 2017, 150, 830–842. [Google Scholar] [CrossRef]
- Tetta, Z.C.; Koutas, L.; Bournas, D.A. Shear strengthening of concrete members with TRM jackets: Effect of shear span-to-depth ratio, material and amount of external reinforcement. Compos. Part B 2018, 137, 184–201. [Google Scholar] [CrossRef]
- Zilch, K.; Niedermeier, R.; Finckh, W. Strengthening of Concrete Structures with Adhesively Bonded Reinforcement; John Wiley & Sons: Hoboken, NJ, USA, 2014. [Google Scholar]
- DIN EN 1992-1-1; Eurocode 2: Design of Concrete Structures—Part 1-1: General Rules and Rules for Buildings. German Version. Beuth Verlag: Berlin, Germany, 2011.
- Koutas, L.N.; Tetta, Z.; Bournas, D.A.; Triantafillou, T.C. Strengthening of Concrete Structures with Textile Reinforced Mortars: State-of-the-Art Review. J. Compos. Constr. 2019, 23, 03118001. [Google Scholar] [CrossRef]
- Kaufmann, N. The sand patch test. Straßenbautechnik 1971, 24, 131–135. [Google Scholar]
- DIN EN 206; Concrete—Specification, Performance, Production and Conformity. German Version. Deutsche Institut für Normung e.V.: Berlin, Germany, 2017.
- DIN 1045-2; Concrete, Reinforced and Prestressed Concrete Structures—Part 2: Concrete—Specification, Properties, Production and Conformity—Application Rules for DIN EN 206-1. Deutsche Institut für Normung e.V.: Berlin, Germany, 2008.
- DIN 488-1; Reinforcing Steels—Part 1: Grades, Properties, Marking. Deutsche Institut für Normung e.V.: Berlin, Germany, 2009.
- Solidian GmbH: Technisches Datenblatt: Solidian GRID 85/85_CCE-21. 1 February 2023. Available online: https://solidian.com/wp-content/uploads/solidian-GRID-Qxx-CCE-xx-Technical-Product-Data-Sheets-v2302.pdf (accessed on 13 October 2023).
- DIN EN ISO 15630-1; Steel for the Reinforcement and Prestressing of Concrete—Test Methods—Part 1: Reinforcing Bars, Rods and Wire (ISO 15630-1:2019). German Version. Deutsche Institut für Normung e.V.: Berlin, Germany, 2019.
- DIN EN 12390; Testing Hardened Concrete. German Version. Deutsche Institut für Normung e.V.: Berlin, Germany, 2012.
- DIN EN 196-1:2016; Methods of Testing Cement—Part 1: Determination of Strength. German Version. Deutsche Institut für Normung e.V.: Berlin, Germany, 2016.
- Schütze, E.; Bielak, J.; Scheerer, S.; Hegger, J.; Curbach, M. Uniaxial tensile test for carbon reinforced concrete with textile reinforcement. Beton-Und Stahlbetonbau 2018, 113, 33–47. [Google Scholar] [CrossRef]
- Wendler, J.; Hahn, L.; Farwig, K.; Nocke, A.; Scheerer, S.; Curbach, M.; Cherif, C. Analysis of the tensile mechanical characteristics of flexible carbon fibre strands and development of a novel test method. Bauingenieur 2020, 95, 325–334. [Google Scholar] [CrossRef]
- Brückner, A.; Ortlepp, R.; Curbach, M. Anchoring of shear strengthening for T-beams made of TRC. Mater. Struct. 2008, 41, 407–418. [Google Scholar] [CrossRef]
- Reineck, K.-H.; Kuchma, D.A.; Fitik, B. Erweiterte Datenbank zur Überprüfung der Querkraftbemessung für Konstruktionsbetonbauteile mit und ohne Bügel. In Schriftenreihe des DAfStb, Heft 597; Deutscher Ausschuss für Stahlbeton, Ed.; Beuth Verlag: Berlin, Germany, 2012. [Google Scholar]
- International Federation for Structural Concrete (Ed.) Fib MC 2010: Fib Model Code for Concrete Structures 2010; Structural Concrete: Lausanne, Switzerland, 2013. [Google Scholar]
- May, S. Experimental Investigations to the Shear Load-Bearing of Strengthen Reinforced Concrete Structures with Carbon Reinforced Concrete under Static and Dynamic Load. Ph.D. Thesis, TU Dresden, Dresden, Germany, 2023. submitted. [Google Scholar]


Disclaimer/Publisher’s Note: The statements, opinions and data contained in all publications are solely those of the individual author(s) and contributor(s) and not of MDPI and/or the editor(s). MDPI and/or the editor(s) disclaim responsibility for any injury to people or property resulting from any ideas, methods, instructions or products referred to in the content. |
© 2023 by the authors. Licensee MDPI, Basel, Switzerland. This article is an open access article distributed under the terms and conditions of the Creative Commons Attribution (CC BY) license (https://creativecommons.org/licenses/by/4.0/).