Abstract
To examine the vertical shear behavior of narrow-width steel box-UHPC (Ultra-High Performance Concrete) composite beams with partial filling under negative bending moments, a total of six test beams were created and constructed in this study. The variables considered during the design and fabrication process included the flange thickness of UHPC, the amount of steel fibers in UHPC, and the height of the concrete filling. Reverse static concentration loading was applied to the beams. Compared to the C40 concrete flange, the cracking load of the 1/2 plate thickness UHPC flange and pure UHPC flange increased by 55.6% and 66.7%, respectively. The yield load witnessed a rise of 17.3% and 22.7%, while the ultimate load experienced an increase of 7% and 13.1%. This suggests that incorporating steel fibers can regulate the formation of cracks, enhance the flexibility of the flanges, and improve the overall shear capacity of the composite beams. When steel fibers were used in the amount of 2% of the concrete volume, the cracking resistance of the flange plate was increased by 16.7%. Partially filled and fully filled composite beams exhibited a 7.7% and 30.8% augmentation in cracking load, a 35.3% and 49.9% increase in yield load, and a 41% and 83.2% elevation in ultimate load when contrasted with composite beams devoid of concrete infusion within the steel box. The above observation implies that the incorporation of concrete within the steel box significantly improves the yield strength and ultimate shear capacity of the composite beams. The shear strength of the narrow-width steel box-UHPC composite beams, which are partially filled, shows a significant relationship with the experimental results when applying the principle of component superposition.
1. Introduction
Steel–concrete composite beam bridges, also known as bridge structures, employ shear connectors to join concrete flanges and lower steel beams, allowing them to work together as a unified entity to withstand loads. Steel–concrete composite beam bridges offer advantages such as extensive span, superior rigidity, and exceptional load-bearing capacity due to their ability to effectively utilize the compressive strength of concrete and the tensile strength of steel, in contrast to conventional steel beam bridges and concrete beam bridges [1,2,3]. They can meet various engineering requirements and adapt to complex on-site construction conditions. In China, these bridge structural forms have become a popular area of research, as they effectively address the gap in bridge design. Tang et al. [4] used the ABAQUS finite element modeling software to examine how the degree of shear connection, strength of concrete, and dimensions of the concrete flange affect the vertical shear performance of the negative moment region section. They also proposed simplified design calculation formulas. In order to investigate the shear failure mechanisms of composite beams subjected to negative bending moments, Xue et al. [5,6] conducted a series of loading tests on three steel–concrete composite beams. The researchers conducted a comparative analysis to examine how various designs and levels of shear connectors affect the ultimate shear resistance and failure modes. Additionally, they aimed to elucidate the factors underlying the increased vertical shear capacity observed in composite beams compared to steel beam webs. Liao et al. [7] conducted reverse loading tests on six composite beams that had holes in the net of the negative bending moment area. The objective was to investigate how the strength of composite beams in shear is influenced by the thickness of the concrete flange and the reinforcement ratio. The findings of this study can serve as valuable references for future research.
Negative bending moments can cause tensile cracking in the support zone of continuous composite beam bridges due to the restricted mechanical characteristics of conventional concrete materials. This leads to the infiltration of harmful ions, such as Cl− and S2−, into the flanges [8], ultimately resulting in the corrosion of the reinforcement. Insufficient strength in the support zone’s cross-sectional area compromises the composite section’s load-bearing capacity, hindering the bridge’s intended functionality by notwithstanding bending and shear forces adequately. Therefore, enhancing fracture management and the load-bearing capability inside the support zone have emerged as paramount technical challenges in the deployment of composite beam bridges.
Extensive research on concrete materials [9,10,11,12,13,14] has led to a rapid advancement of UHPC in the field of civil engineering, emerging as a new and highly efficient material. UHPC is formulated based on the Danish DSP system, which follows the principle of achieving maximum packing density [15]. UHPC significantly enhances tensile strength and deformation resistance compared to traditional concrete materials. It exhibits merits, including elevated, commendable ductility, substantial density, and resistance to high temperatures [16]. Numerous researchers have put forward the idea of steel-UHPC composite structures and examined their shear performance, owing to the exceptional mechanical properties of UHPC. Zhu et al. [17] conducted loading tests on six large steel-UHPC waffle composite bridge beams to investigate the shear performance of the structures, examining the influence of shear span, rib depth, slab thickness, and flange width. The researchers clarified the correlation between load transfer mechanisms and load deflection. Additionally, they successfully developed and verified a theoretical calculation model to determine shear carrying capacity. Shao et al. [18,19] fabricated four HRSS-UHPC composite beams, each featuring distinct ratios of shear span to depth. Through a series of loading experiments, we systematically examined the failure mechanisms of these composite beams and analyzed the spatial distribution characteristics of inclined shear fractures. The discussion also involved the influence of shear span-to-depth ratios on the ductility factor, secant rigidity, and shear capacity of the composite beams. Although there is a vast amount of research on the shear performance of composite beams made of steel and concrete, the focus of most studies has primarily been on steel beams with T-shaped or I-shaped cross-sections. Nevertheless, there is a shortage of studies on the shear behavior of novel partially filled slender steel box-UHPC composite beams subjected to negative bending moments.
The primary objective of this investigation is to assess the capacity of partially filled narrow-width steel box-UHPC composite beams to withstand vertical shear within the negative bending moment region under static loading conditions. Shear performance tests were conducted on six narrow-width steel box-UHPC composite beams with varying UHPC steel fiber content, concrete filling height, and UHPC flange thickness. The research is concentrated on investigating the load-bearing mechanism, failure pattern, and load-bearing capacity of composite beams under different parameters. This achievement was realized through a comprehensive analysis of the failure process, load–deflection curves, and strain distribution patterns observed in the composite beams. The proposition of a calculation formula to determine the shear capacity of narrow-width steel box-UHPC composite beams with partial filling provides valuable references for both practical engineering applications and academic research.
2. Experimental Method
2.1. Experimental Beam Design
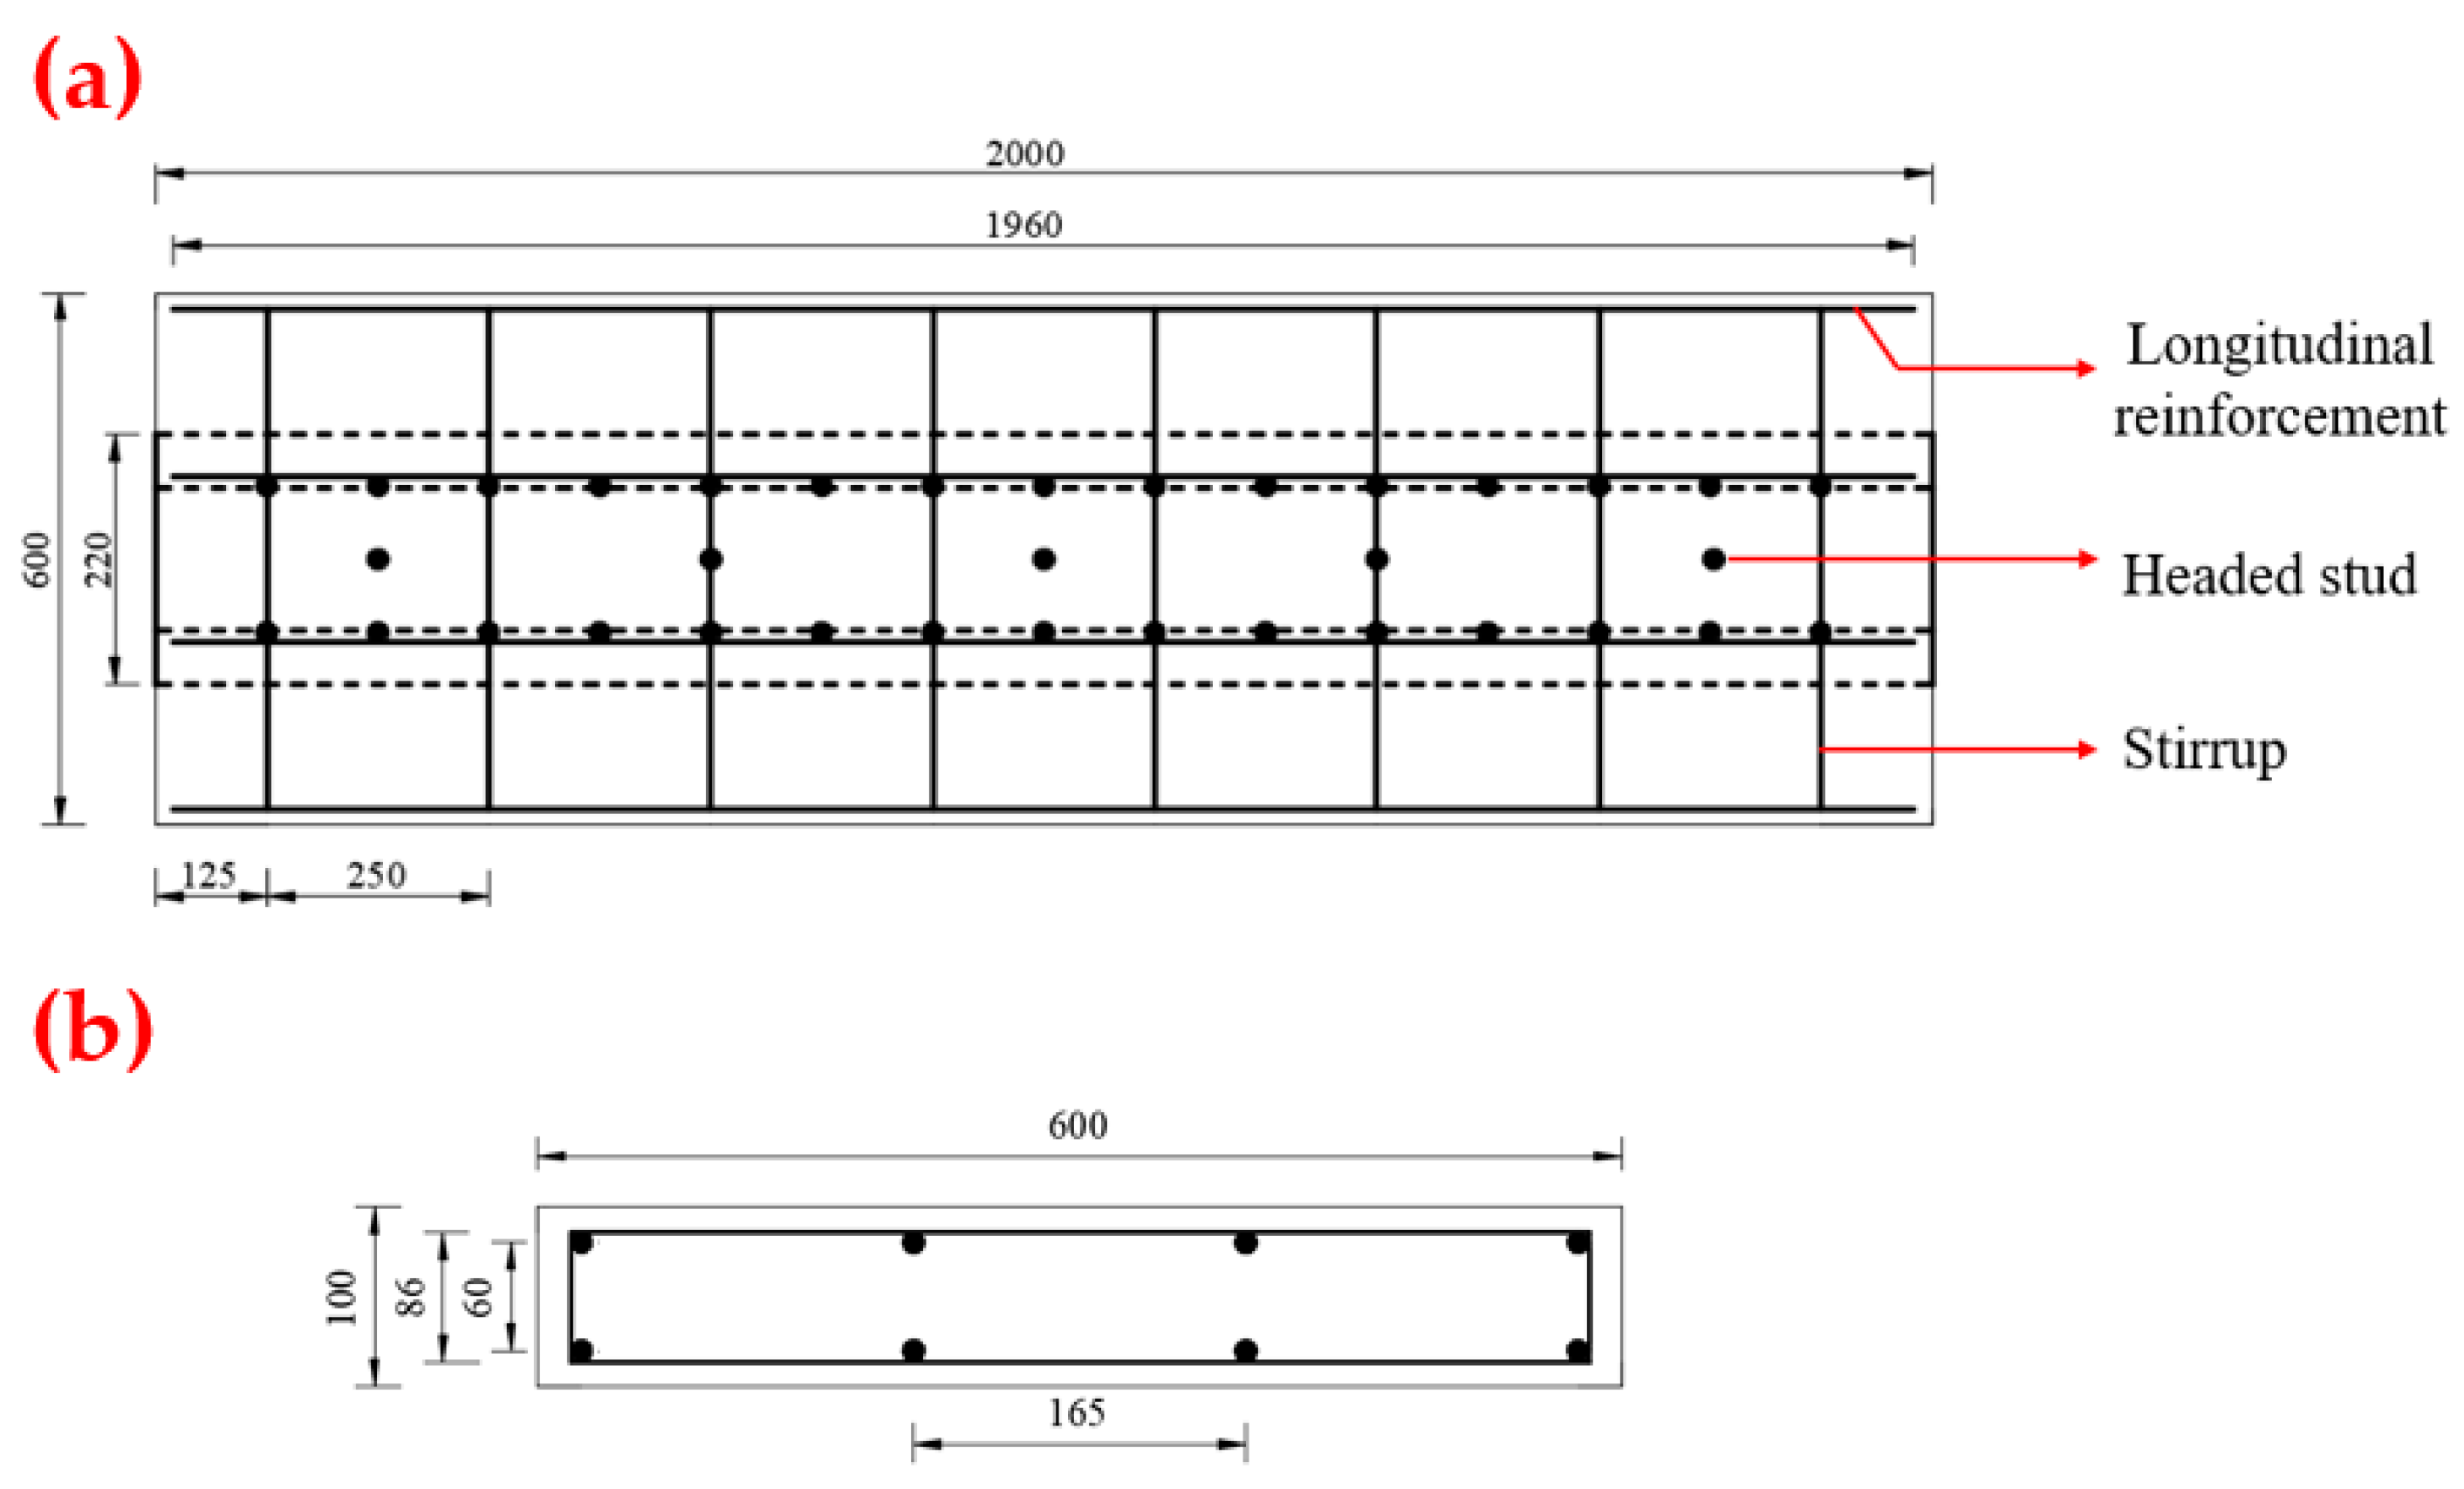
To elucidate the internal force transmission mechanism and shear characteristics of narrow-width steel box-UHPC composite beams with partial filling under negative bending moments, a set of six composite beams was designed and constructed as simply supported structures, maintaining a shear span-to-depth ratio of 2.13. These beams were identified as SUCB-1 to SUCB-6. Figure 1 illustrates the test beams’ geometric layout. The test beams consisted of UHPC flanges, C40 flanges, stirrups, longitudinal reinforcement, headed studs, steel boxes, and concrete filled inside the steel boxes. In addition, the test beam had a length of 2000 mm. A steel container was built using Q235 steel sheets that had a vertical measurement of 310 mm. The bottom plate had dimensions of 10 mm in thickness and 220 mm in breadth. The bearing plate measured 60 mm in width and had a thickness of 20 mm. The gap between the webs measured 160 mm, with the webs having a thickness of 6 mm. The transverse partition had a width of 148 mm and a thickness of 6 mm. Welded ribs, each with a thickness of 10 mm, were affixed at the center and two neighboring support locations. The width of the flange was 600 mm, and the thickness was 100 mm. The C40 grade concrete flange had a thickness of 50 mm, while the UHPC flange with different steel fiber content also had a thickness of 50 mm. To ensure the overall performance of the flange, during the pouring of the lower flange, the surface of the flange was subjected to “scuffing” treatment to increase the contact area with the upper flange, thereby enhancing the frictional force between the flanges. The UHPC filling’s height in the bottom of the steel box equaled half of the steel box’s total height. The primary factors under investigation in this experiment included the steel fiber content in the UHPC flanges, the ratio of UHPC layer thickness to flange thickness, and the height of UHPC filling in the lower section of the steel box. The primary design parameters of the test beams are shown in Table 1.
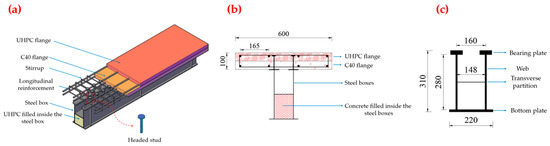
Figure 1.
The measurements of the test beams’ geometric properties (unit: mm). (a) Test beam viewed from the axial perspective. (b) Cross-section perspective of the experimental beam. (c) Dimensions of the metal container.

Table 1.
Main parameters for the design of specimens.
The UHPC filled inside the steel box was poured through the holes reserved in the transverse partition, with a hole diameter of 100 mm. Two symmetrical rows of headed studs were welded to the bearing plate of the steel box beam, connecting it to the flanges. The studs, measuring 13 mm in diameter and 90 mm in height, were spaced horizontally at 160 mm intervals. The studs were added at the middle positions of the composite beams, respectively, at distances of 250 mm, 625 mm, 1000 mm, 1375 mm, and 1750 mm from the beam end. The horizontal spacing between the bolt pins was 80 mm. Figure 2 illustrates the strengthening of the flanges.
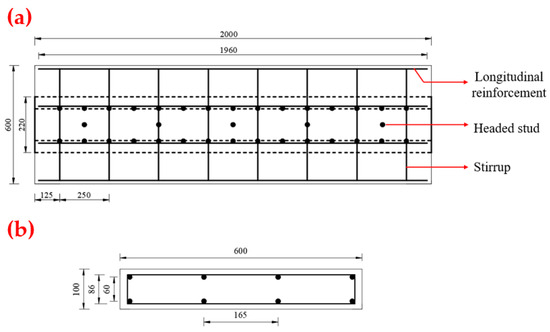
Figure 2.
Flange reinforcement details (unit: mm). (a) Bird’s eye view. (b) Cross-sectional perspective.
2.2. Material Properties
Mechanical property testing was conducted on the steel utilized in the test beams, following the guidelines of Chinese code GB/T 13239 [20]. Table 2 displays the specifications of the steel utilized. This experiment employed a mixture of coarse sand, medium sand, fine sand, silica fume, water reducer, cement, water, and steel fibers to create the UHPC material. A total of 156 kg of steel fibers were used, comprising 2% of the content. Table 3 displays the ratios of the remaining substances. Table 4 shows the relevant mechanical parameters of the steel fibers used for the test.
Table 2.
The parameters and mechanical properties of the steel used in the test beams.
Table 3.
The material mass ratio of UHPC.
Table 4.
Basic performance parameters of steel fiber for testing.
During the UHPC pouring process into the steel box, three standard 100 mm cubic specimens were concurrently set aside for material property measurements under the same curing conditions as the experimental beams. Amidst the flange casting procedure, three 150 mm C40 cubic specimens were reserved to measure their compressive strength. Depending on the different steel fiber content, we prepared a total of six 100 mm UHPC cubic specimens and two standard ‘dog bone’ tensile specimens to measure their compressive and tensile strengths. It is noteworthy that the mechanical properties of UHPC were evaluated according to the current Chinese standard GB/T 31387-2015 [21]. The mechanical properties of C40 were evaluated according to the current Chinese standard GB 50010-2010 [22]. In light of the impact of side effects on the strength of concrete test specimens and for the sake of standardization, this study transformed the compressive strength results of C40 test specimens with a side length of 150 mm obtained from the experiment to correspond to the compressive strength of C40 test specimens with a side length of 100 mm. This conversion was performed in accordance with the current Chinese standard GB/T 50107-2010 [23]. The conversion factor was 0.95. The obtained concrete performance parameters from the tests are shown in Table 5. All these values meet the requirements of the design strength grade.
Table 5.
Concrete material performance parameters.
2.3. Experimental Loading and Testing System
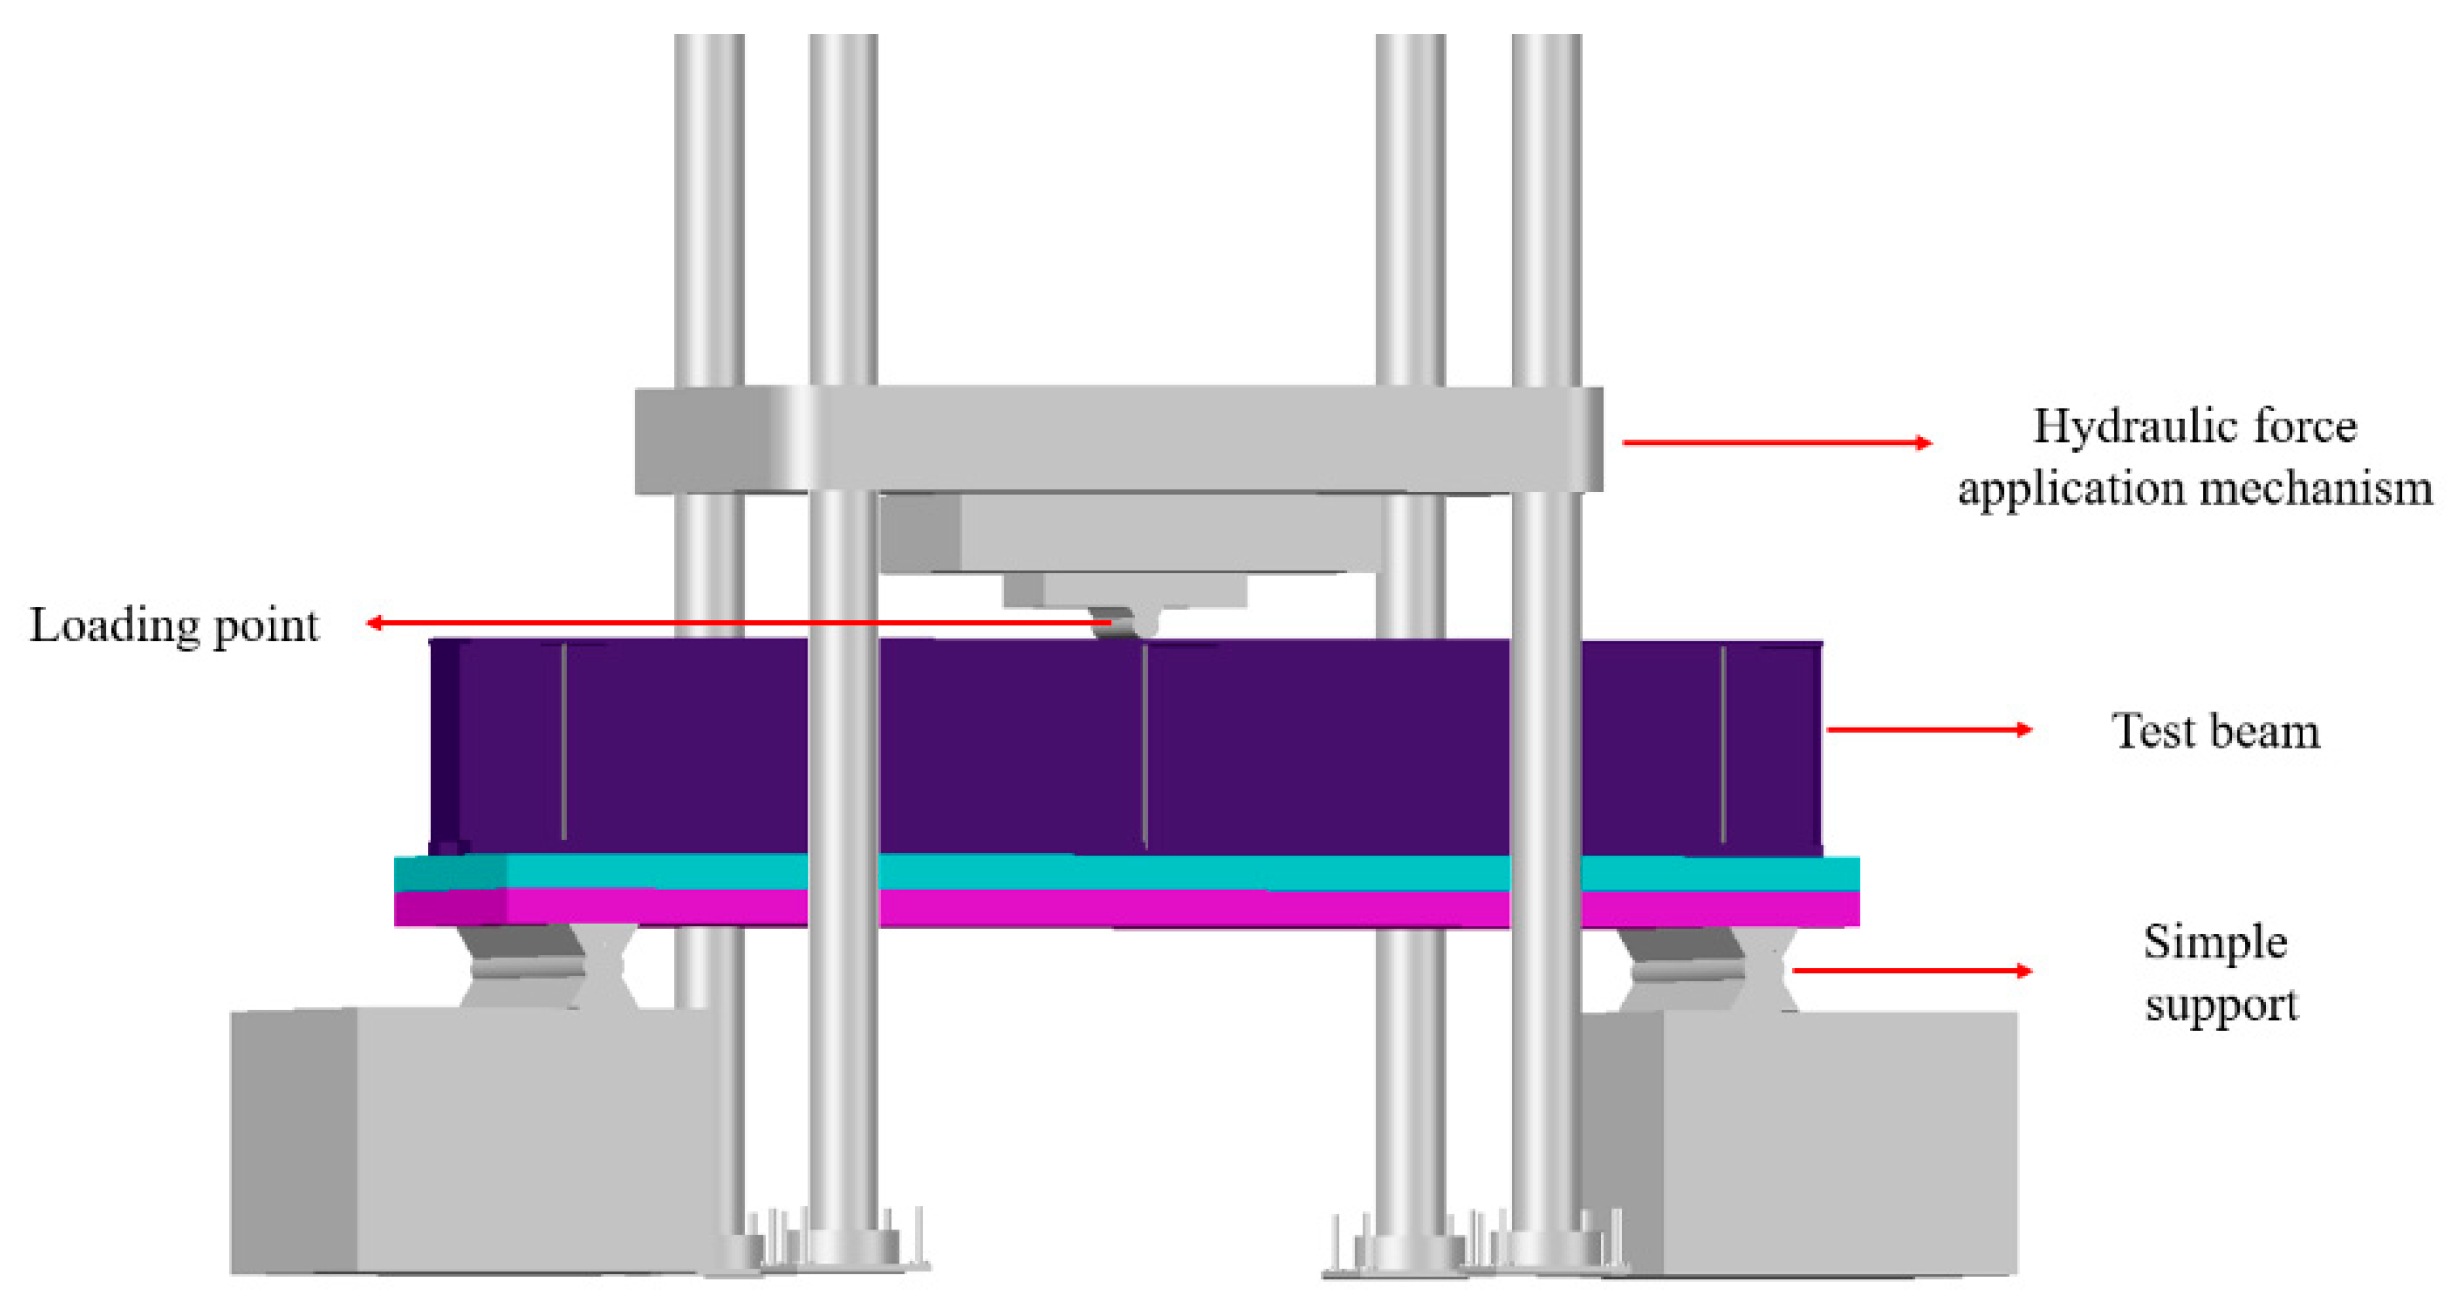
Figure 3 illustrates the loading process of the test beam. In order to replicate the conditions prevalent within the negative bending moment region of the composite beam, the test specimen is exposed to reverse loading. This involves the application of a concentrated load at its central point through the utilization of a hydraulic power press. During the elastic stage, a force-controlled loading technique is employed, incrementally increasing by 10 kilonewtons per level. After transitioning into the elastic–plastic stage, the load is incrementally increased by 50 kilonewtons per level. This process lasts until the test beam manifests substantial bending and overt indicators of structural collapse, whereupon the loading ceases. To improve the stress dispersion within the immediate vicinity of the test beam, 10 mm thick ribbed stiffeners are placed at the span center and two support positions. Dial gauges are installed at the support and mid-span positions of the test beam to measure deflection deformations. Dial gauges are placed at the end plates and the junction of the steel beam and end plates of the test beam to assess relative slip. Strain gauges for measuring linear strain and three-directional strain rosettes are installed on the reinforcing bars of the mid-span flange plate, as well as on the top, side, and bottom surfaces of the flange plate and the side of the steel box beam. According to the loading condition of the test beam, the mid-span region of the test beam is the negative bending moment region. Therefore, strain gauges are installed at the mid-span to measure the strain of the reinforcing bars, concrete flange, and steel box. Three-directional strain rosettes are also installed at the mid-span to measure the principal compressive strain inclination of the steel box web plate. Figure 4 shows the arrangement of dial gauges, strain gauges, and three-directional strain rosettes.

Figure 3.
Load diagram of the test beam.
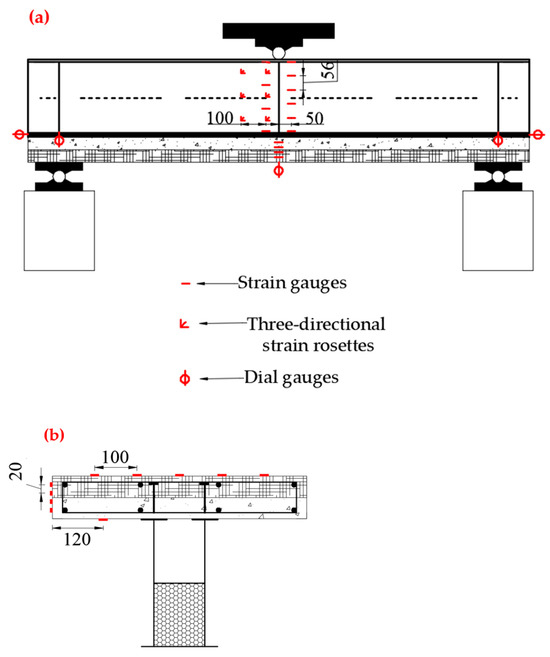
Figure 4.
Layout diagram of measurement points on the test beams (unit: mm). (a) The positioning of measuring instruments as seen from the side. (b) Arrangement of strain gauges on the mid-span section of the test beam.
3. Test Process and Phenomenon
3.1. Final Failure Mode of the Test Beams
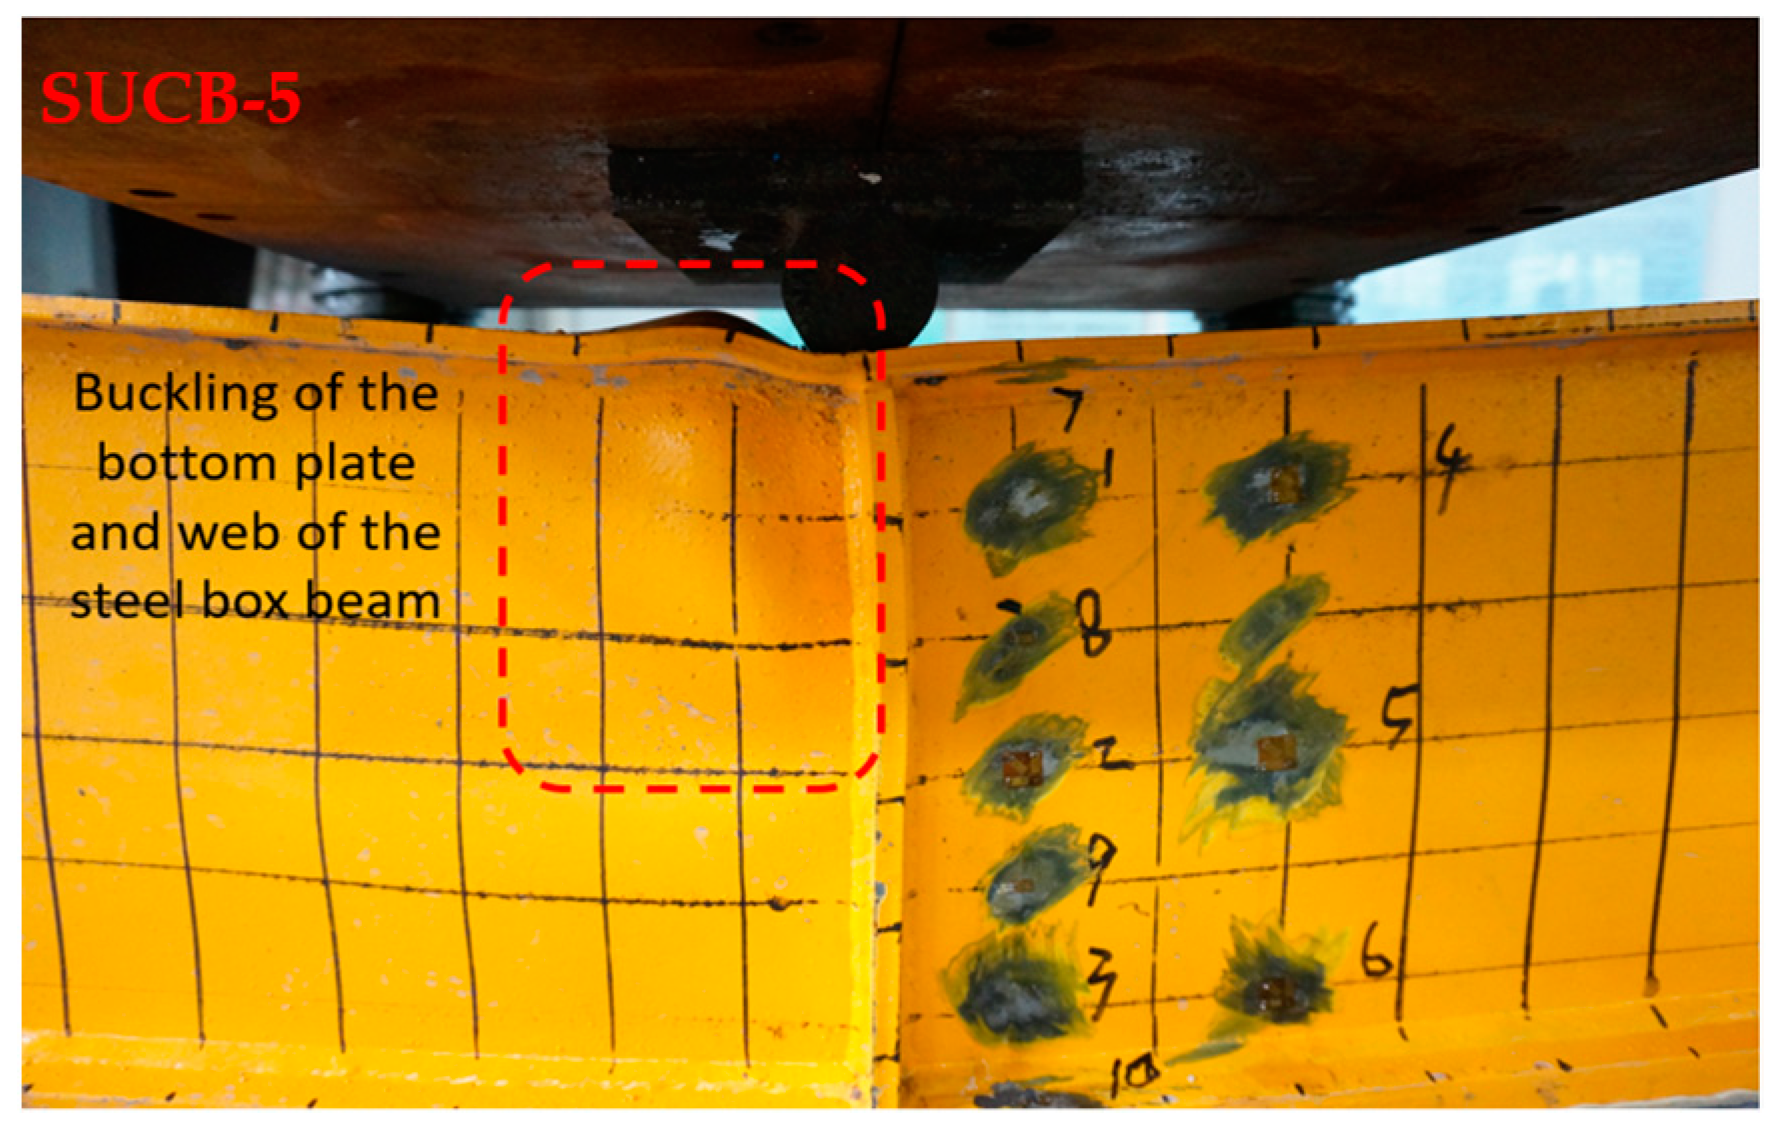
The final failure modes of test beams SUCB-1 to SUCB-6 are illustrated in Figure 5. The primary fracture, which spans across the flanges, is observed on the vulnerable surface positioned at the midpoint of the test beams, showcasing a significant resemblance in the ultimate failure mechanisms witnessed in the six test beams. The steel filaments in the UHPC layer were extracted, and a delamination occurrence was observed between the flanges and the steel reinforcement at the location of the crack. Longitudinal cracks and delamination occur between the UHPC layer and the C40 layer of the flanges due to relative displacement, and diagonal cracks appear on the sides of the flanges. Overall, the test beam exhibited typical tensile fracture characteristics, such as local buckling in the lower section of the steel box beams and observable shear deformation.
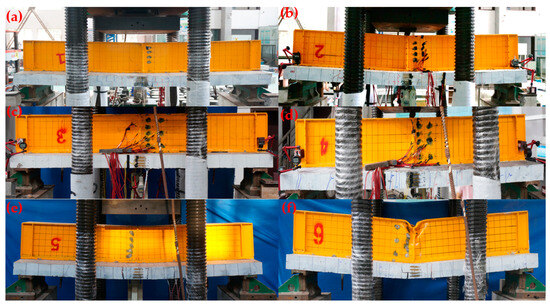
Figure 5.
Diagram illustrating the failure modes of the test beams: (a) SUCB-1; (b) SUCB-2; (c) SUCB-3; (d) SUCB-4; (e) SUCB-5; (f) SUCB-6.
3.2. Failure Phenomena and Analysis of the Test Beams
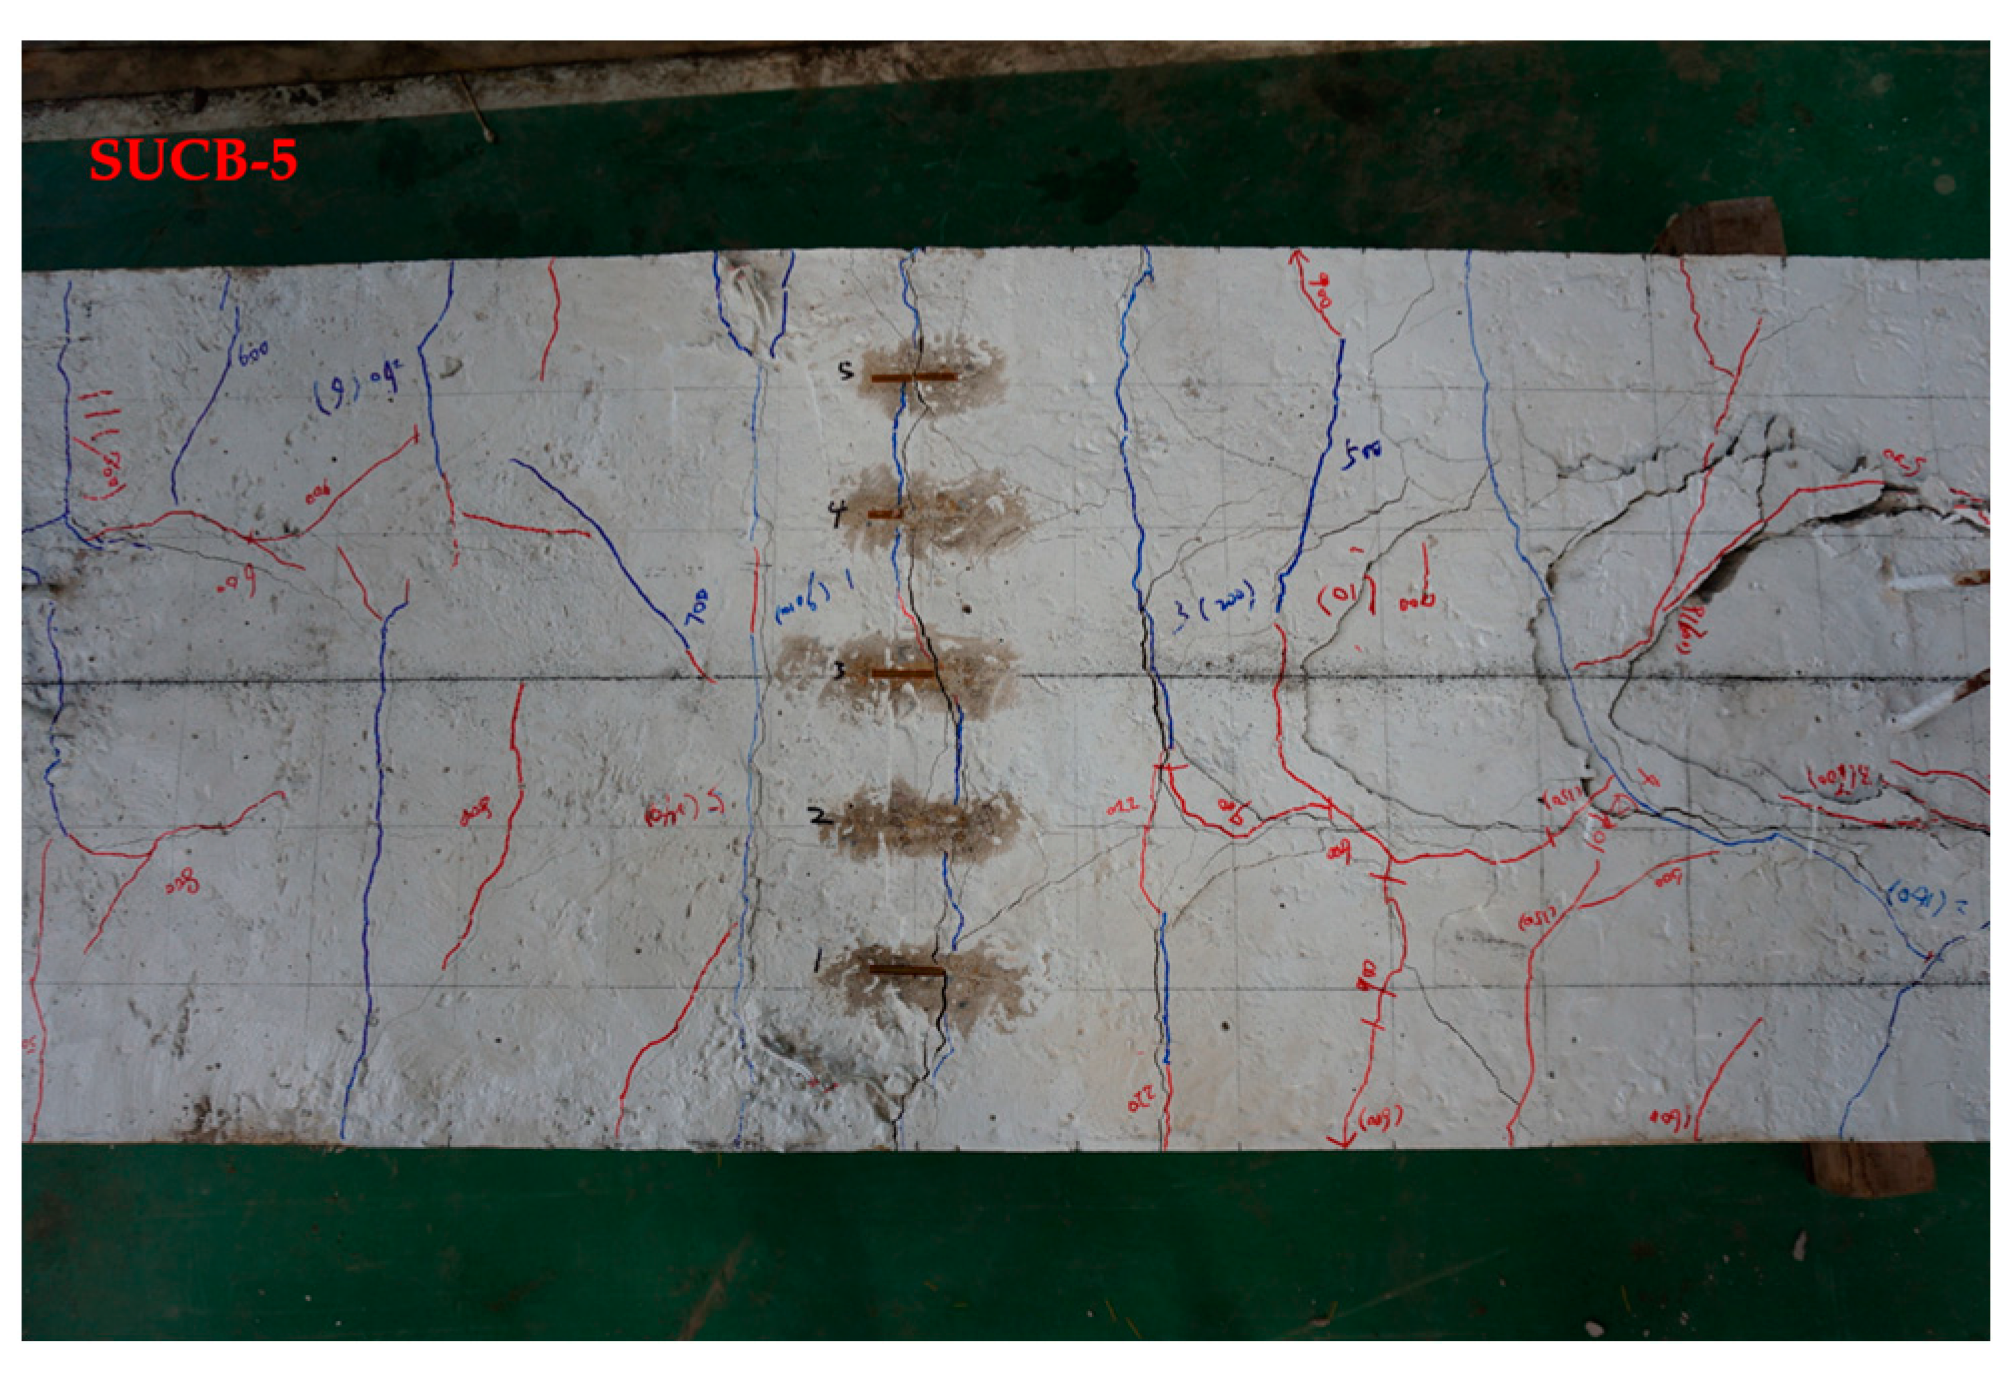
This study investigates the events occurring during the failure process of the test beam, with SUCB-5 serving as a case study. Figure 6a displays the distribution of cracks in the test beam. Cracking was initiated in the test beam at a load corresponding to 0.13 of the beam’s ultimate capacity. As soon as the load reached 0.2 of the beam capacity, cracks emerged on the underside of the concrete flange. As the load progressively increased, the cracks expanded towards the flange’s edges, resulting in diagonal cracks accompanied by the audible extraction of steel fibers, as depicted in Figure 6b. At a load of 0.52 times the beam’s capacity, cracks reached the flange’s edge in Figure 6c. Subsequently, at a load of 0.59 of the beam capacity, the fractures on the upper surface expanded to the flange’s edge, intersecting with the fractures on the flange’s side and covering the entire side of the flange, as depicted in Figure 6d. At this point, the top part of the flange showed multiple diagonal and longitudinal fractures, with a primary crack appearing at a particular angle. A significant extension of cracks occurred on both the lateral side and the upper surface of the flange upon reaching the maximum load. Figure 6e shows the emergence of longitudinal cracks between the UHPC layer and the C40 layer of the flange. As a result of the anchoring impact caused by the headed studs, the flanges’ end surfaces encountered a failure that can be described as ‘conical’. At the midpoint of the composite beam, there was a significant and rapid increase in deflection, leading to the partial visibility of certain steel fibers. The steel box beam experienced localized buckling in its web and bottom plate, leading to shear failure during the test.
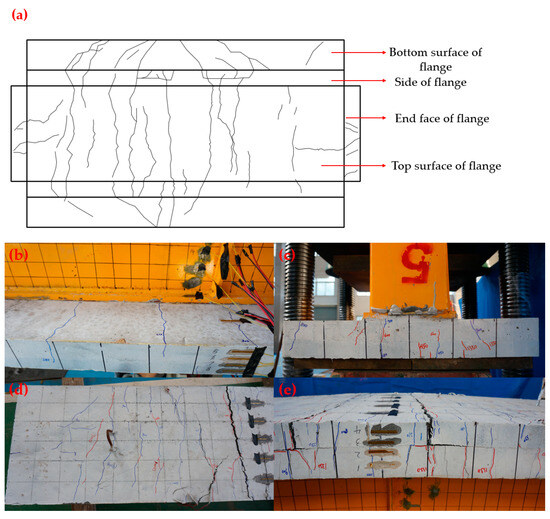
Figure 6.
Crack distribution diagram of SUCB-5: (a) The flange’s cracks were distributed overall. (b) The cracks on the bottom surface of the flange were distributed. (c) The cracks on the end face of the flange. (d) Distribution of cracks on the top surface of the flange. (e) Distribution of cracks on the side of the flange.
The addition of steel fibers to the flange had a notable influence on the shear strength and experimental findings [24,25,26]. When cracks were initiated within the flange, the steel fibers embedded in the UHPC material with diverse orientations exhibiting a ‘bridging effect’, effectively mitigating the propagation of cracks. Following the occurrence of flange cracking, a multitude of secondary cracks ensued simultaneously, accompanied by the emergence of numerous small microcracks surrounding the primary cracks. The formation of microcracks occurred because the tensile strength of the UHPC in the tension zone was lower than the primary tensile stress it encountered. The steel fibers transferred the stress generated by these microcracks to the flange. When steel fibers exceed their maximum bond strength at a specific microcrack, they deform and are extracted, leading to concentrated crack development at that location and the eventual formation of the primary crack. The incorporation of steel fibers endowed the UHPC with the capacity to exhibit strain-hardening characteristics, consequently augmenting the ductility and deformation resistance of the composite beam to a specific extent.
4. Processing and Analyzing the Test Results
4.1. Curve Depicting the Relationship between Load and Deflection, As Well As the Relationship between Load and Strain
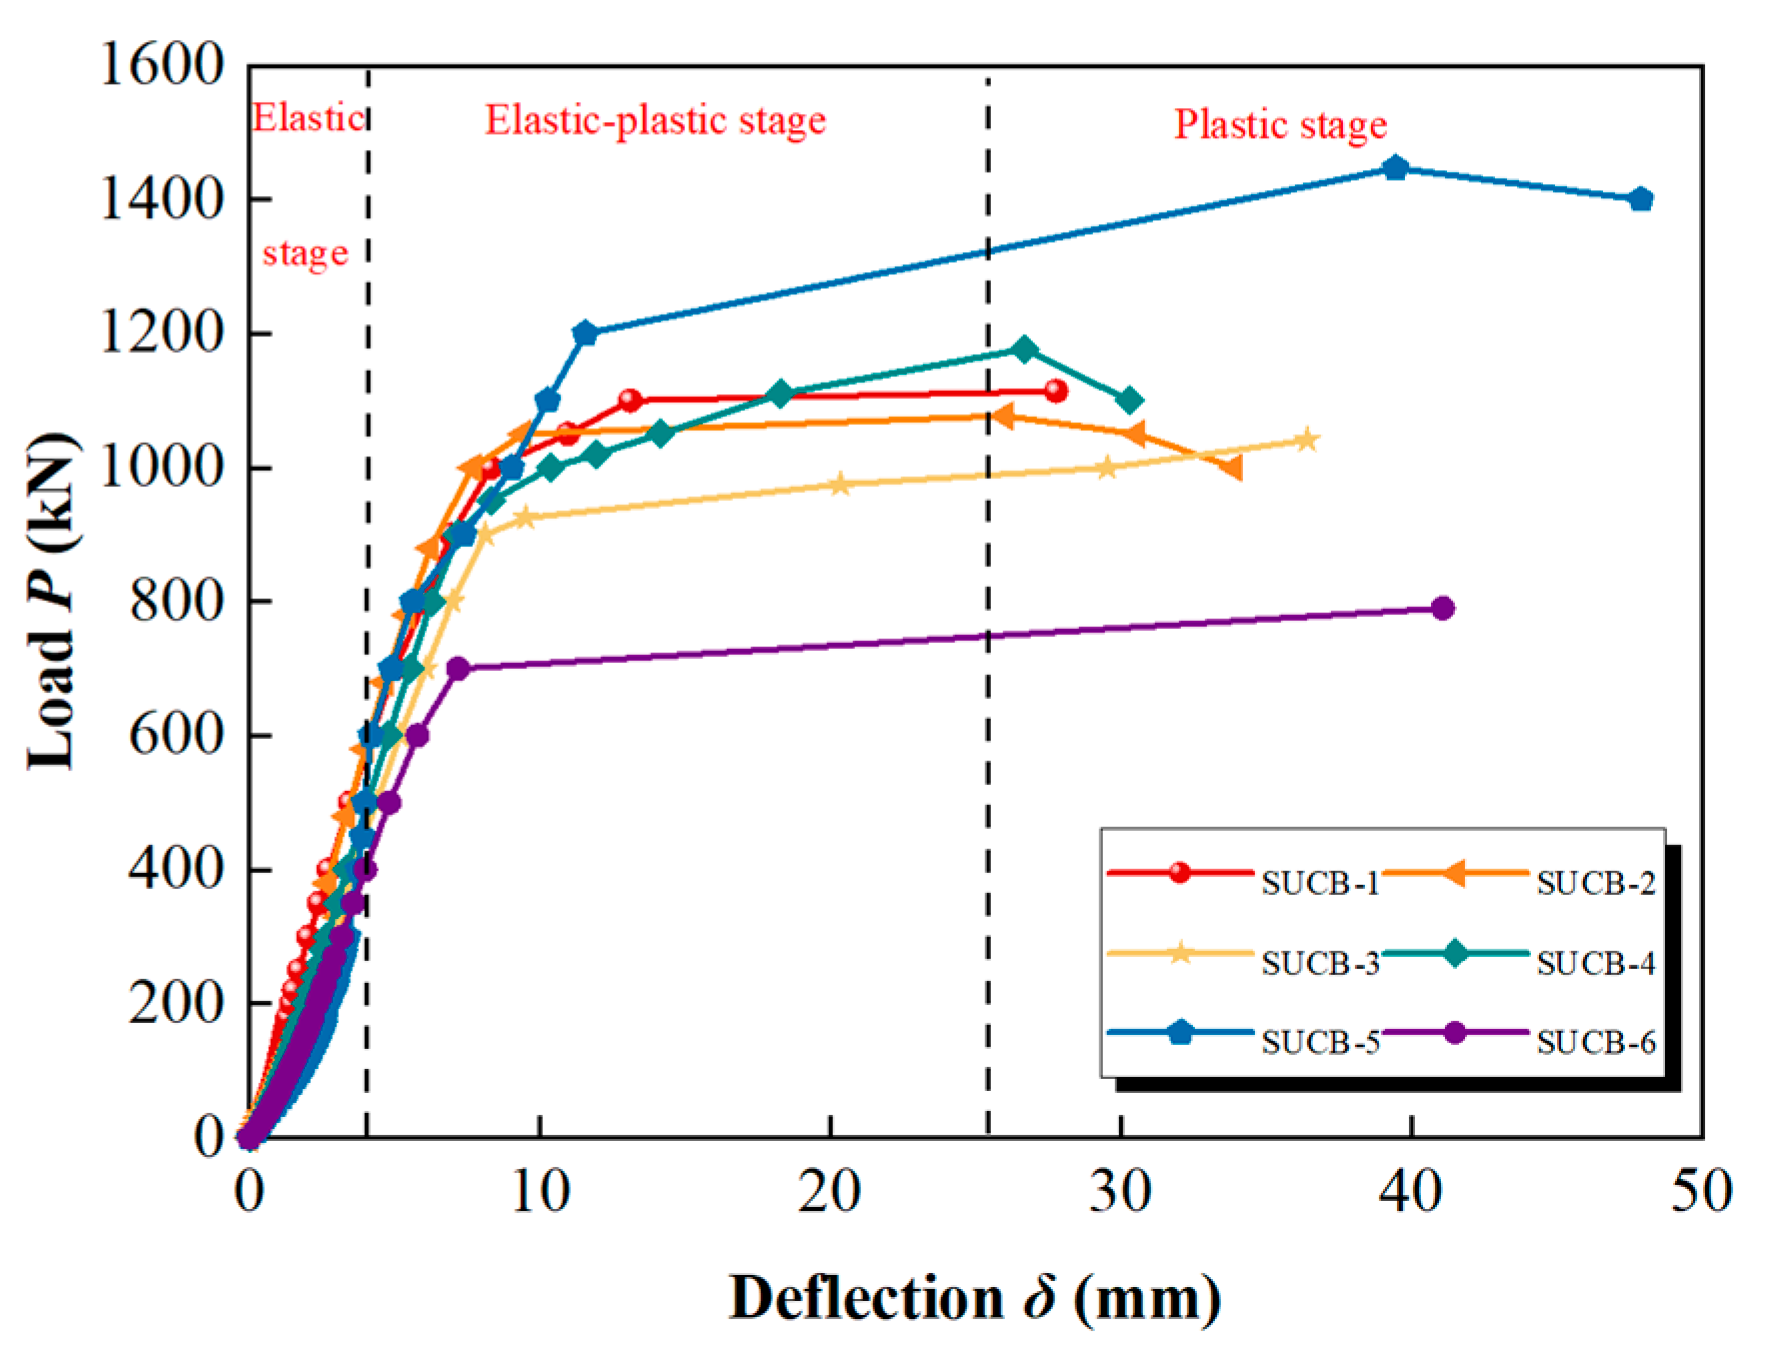
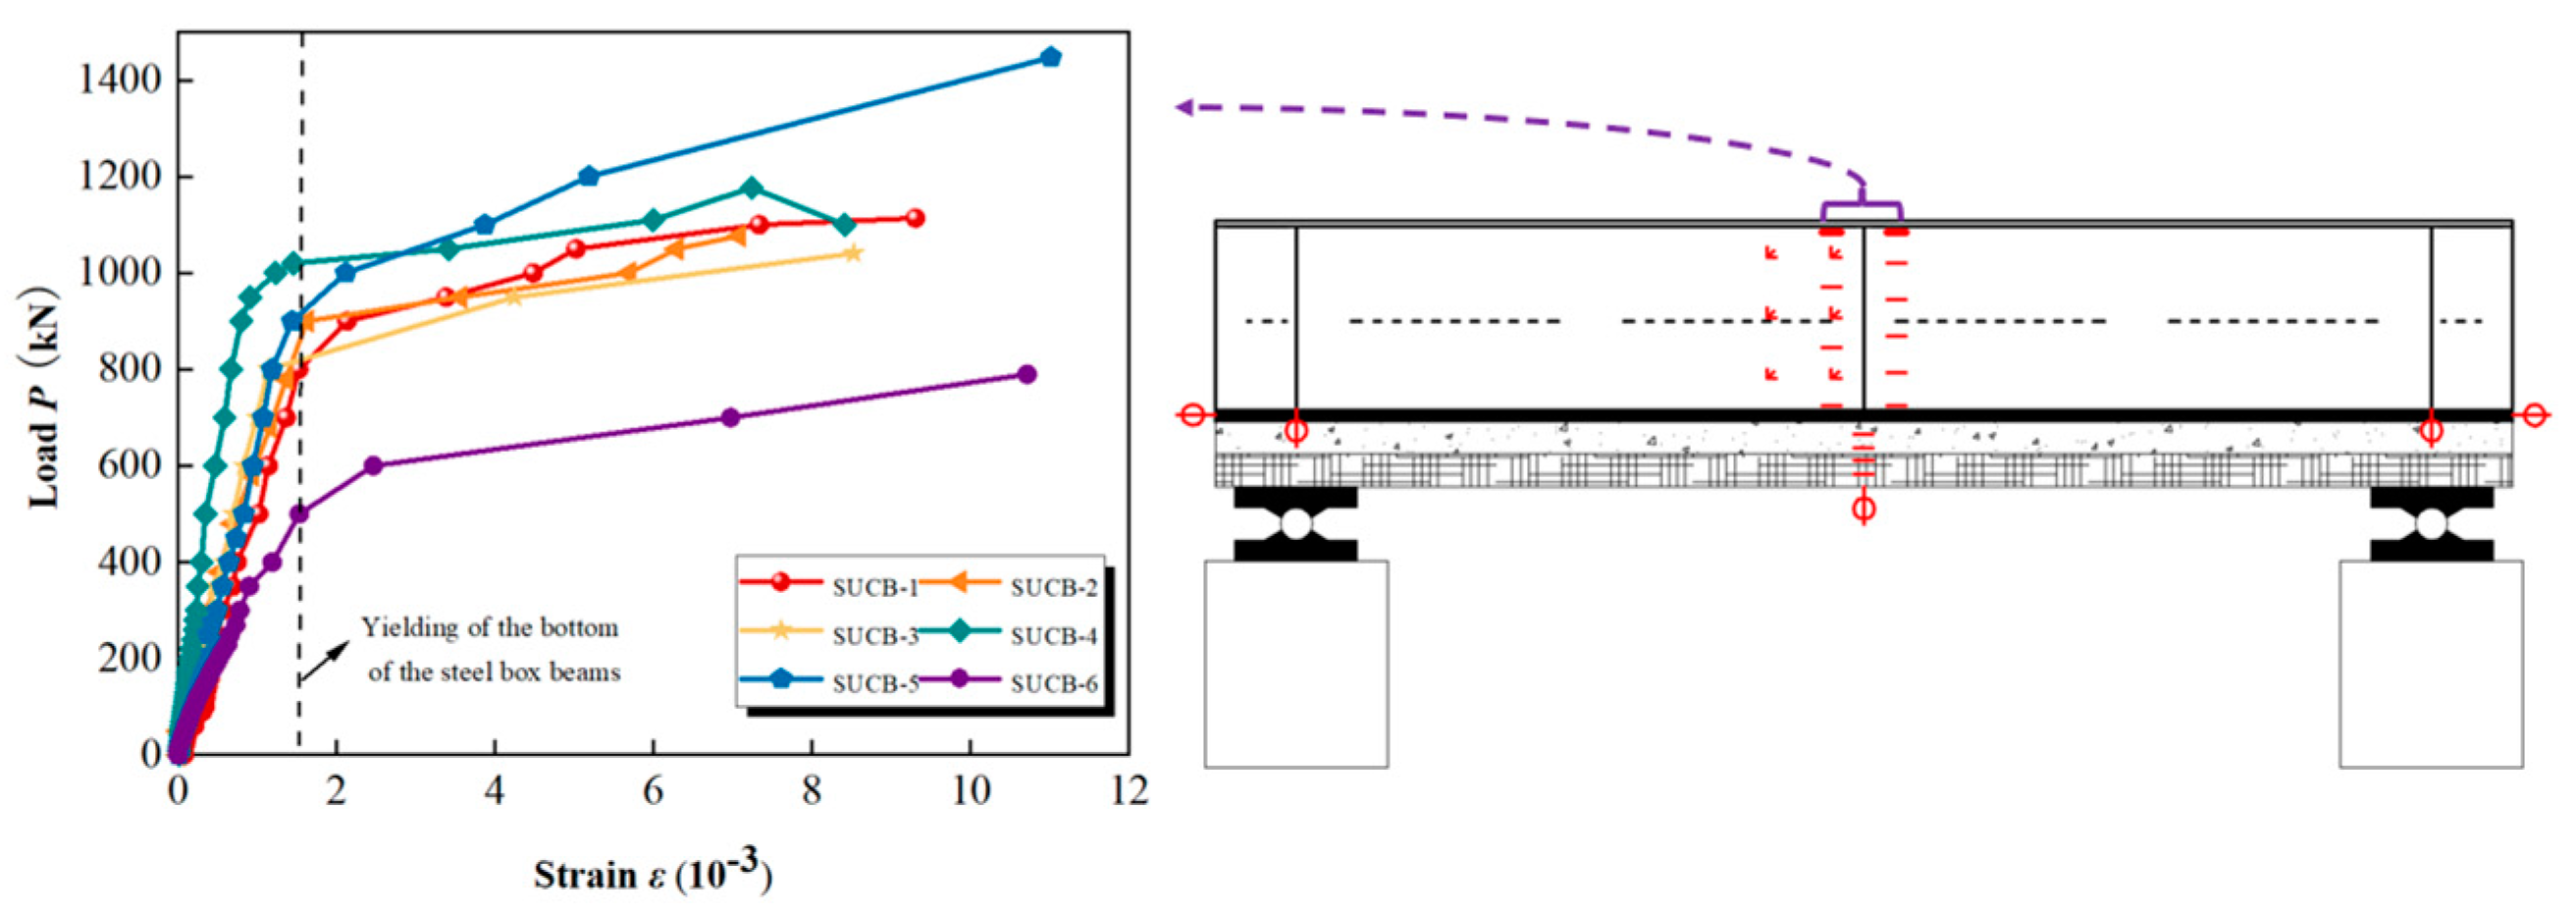
The load–deflection relationship curve of the test beams is shown in Figure 7, and these beams can be categorized into three primary loading stages. The initial phase is the elastic stage, commencing with the formal loading and continuing until the steel box reaches its yield point. In this phase, there were no visible cracks in the concrete flanges. Both the steel box beams and the flanges contributed to the stiffness of the test beams. The relationship between load and deflection follows a straight line. The elastic–plastic stage, which begins at the yield point of the steel box and continues until the composite beams reach their ultimate load, represents the second stage. During this phase, cracks initiate in the flanges, including the formation of transverse cracks on the lower surface of the flanges, followed by the successive emergence of substantial cracks that penetrate through the flanges. Longitudinal through-cracks occurred at the locations corresponding to bolted or welded connections, intersecting with the transverse cracks to form an H-shaped shear crack pattern. As the load increased, the number of cracks progressively grew, and additional cracks emerged amidst the primary ones, leading to a gradual reduction in the gap between the cracks. The rigidity of the middle part was reduced, leading to a reorganization of internal forces in that section. The deflection at the midpoint exhibited a quick development, accompanied by an increased prominence of the nonlinear properties of the curve. In the plastic stage, denoting the third phase, the load–deflection curve exhibited either a near-flat trajectory or a descent, accompanied by a marginal reduction in load-carrying capacity. Upon reaching their maximum shear carrying capacity, the composite beams experienced shear failure, resulting in the extraction of certain steel fibers from the UHPC. The main crack exhibited a substantial increase in width, as depicted in Figure 8. Ultimately, both the web and bottom plate of the steel box beams exhibited local buckling, as depicted in Figure 9. The maximum load that could be carried continued to decline until the loading test was finished.

Figure 7.
The load–deflection curve of the test beams.
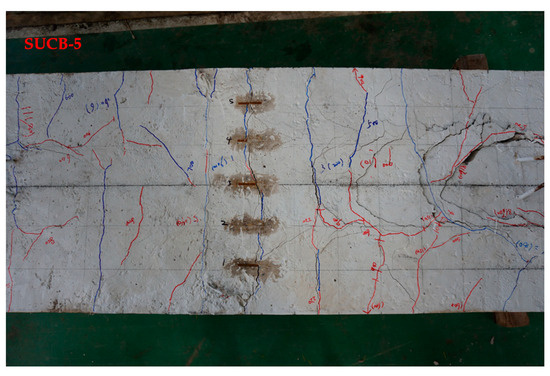
Figure 8.
Depicting the shear failure diagram of the experimental beam.
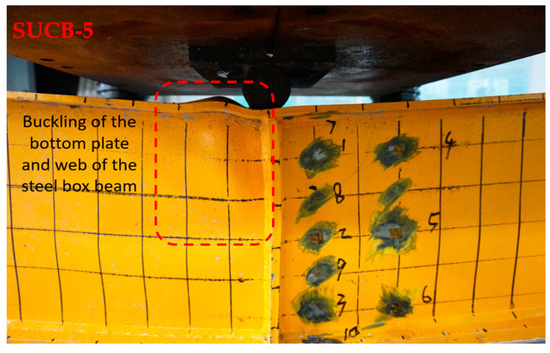
Figure 9.
The diagram illustrating the deformation of the steel box beam under compression.
In order to examine if there was any occurrence of bending failure alongside shear failure in the test beams, the load-span bottom strain curve of the test beam was graphed, as depicted in Figure 10. The figure revealed that, once the tested steel box beams reached their ultimate shear carrying capacity, they all exhibited yielding and transitioned into the hardening stage. They still shared the load with the UHPC flanges that had cracks. Hence, apart from shear failure, this trial also witnessed flexural failure, and the yielding of the underside of the steel box beam under the maximum load condition was regarded as a sign of the manifestation of flexural failure in the composite beam.

Figure 10.
The strain curve at the bottom of the load-span for the tested beams.
Based on the data presented in Table 6, it is evident that each of the six test beams encountered failure due to the combined effects of shear and bending. When the test beams failed, they all exhibited good ductility characteristics. According to the data presented in Table 4, it can be inferred that UHPC flanges containing 2% steel fibers show a 16.7% increase in cracking load compared to UHPC flanges without any steel fibers. The yield capacity increases by 3%, and the ultimate capacity rises by 3.4%. This discovery suggests that the inclusion of steel fibers can significantly enhance the cracking stress of the flanges. However, increasing the amount of steel fibers has a minimal impact on both the load at which the beam starts to deform and the maximum load it can withstand. The cracking loads of the 1/2-plate-thick UHPC flange and the pure UHPC flange increased by 55.6% and 66.7%, respectively, compared to the flange made of pure C40 concrete. The yield capacities rose by 17.3% and 22.7%, respectively, while the ultimate loads experienced respective increases of 7% and 13.1%. This suggests that incorporating UHPC material can significantly improve the crack resistance capabilities of the composite beam. The cracking loads of the partially filled composite beam and the fully filled composite beam exhibited increments of 7.7% and 30.8%, respectively, compared to the composite beam lacking concrete infill within the enclosed box chamber. The yield capacities rose by 35.3% and 49.9%, respectively, while the ultimate capacities surged by 41% and 83.2%, respectively. This observation suggests that the presence of concrete infill in the box chamber significantly improves both the yield degree and the ultimate shear-carrying capacity of the composite beam.
Table 6.
The test beams’ mid-span deflections and the corresponding loads are presented in the table of characteristic loads.
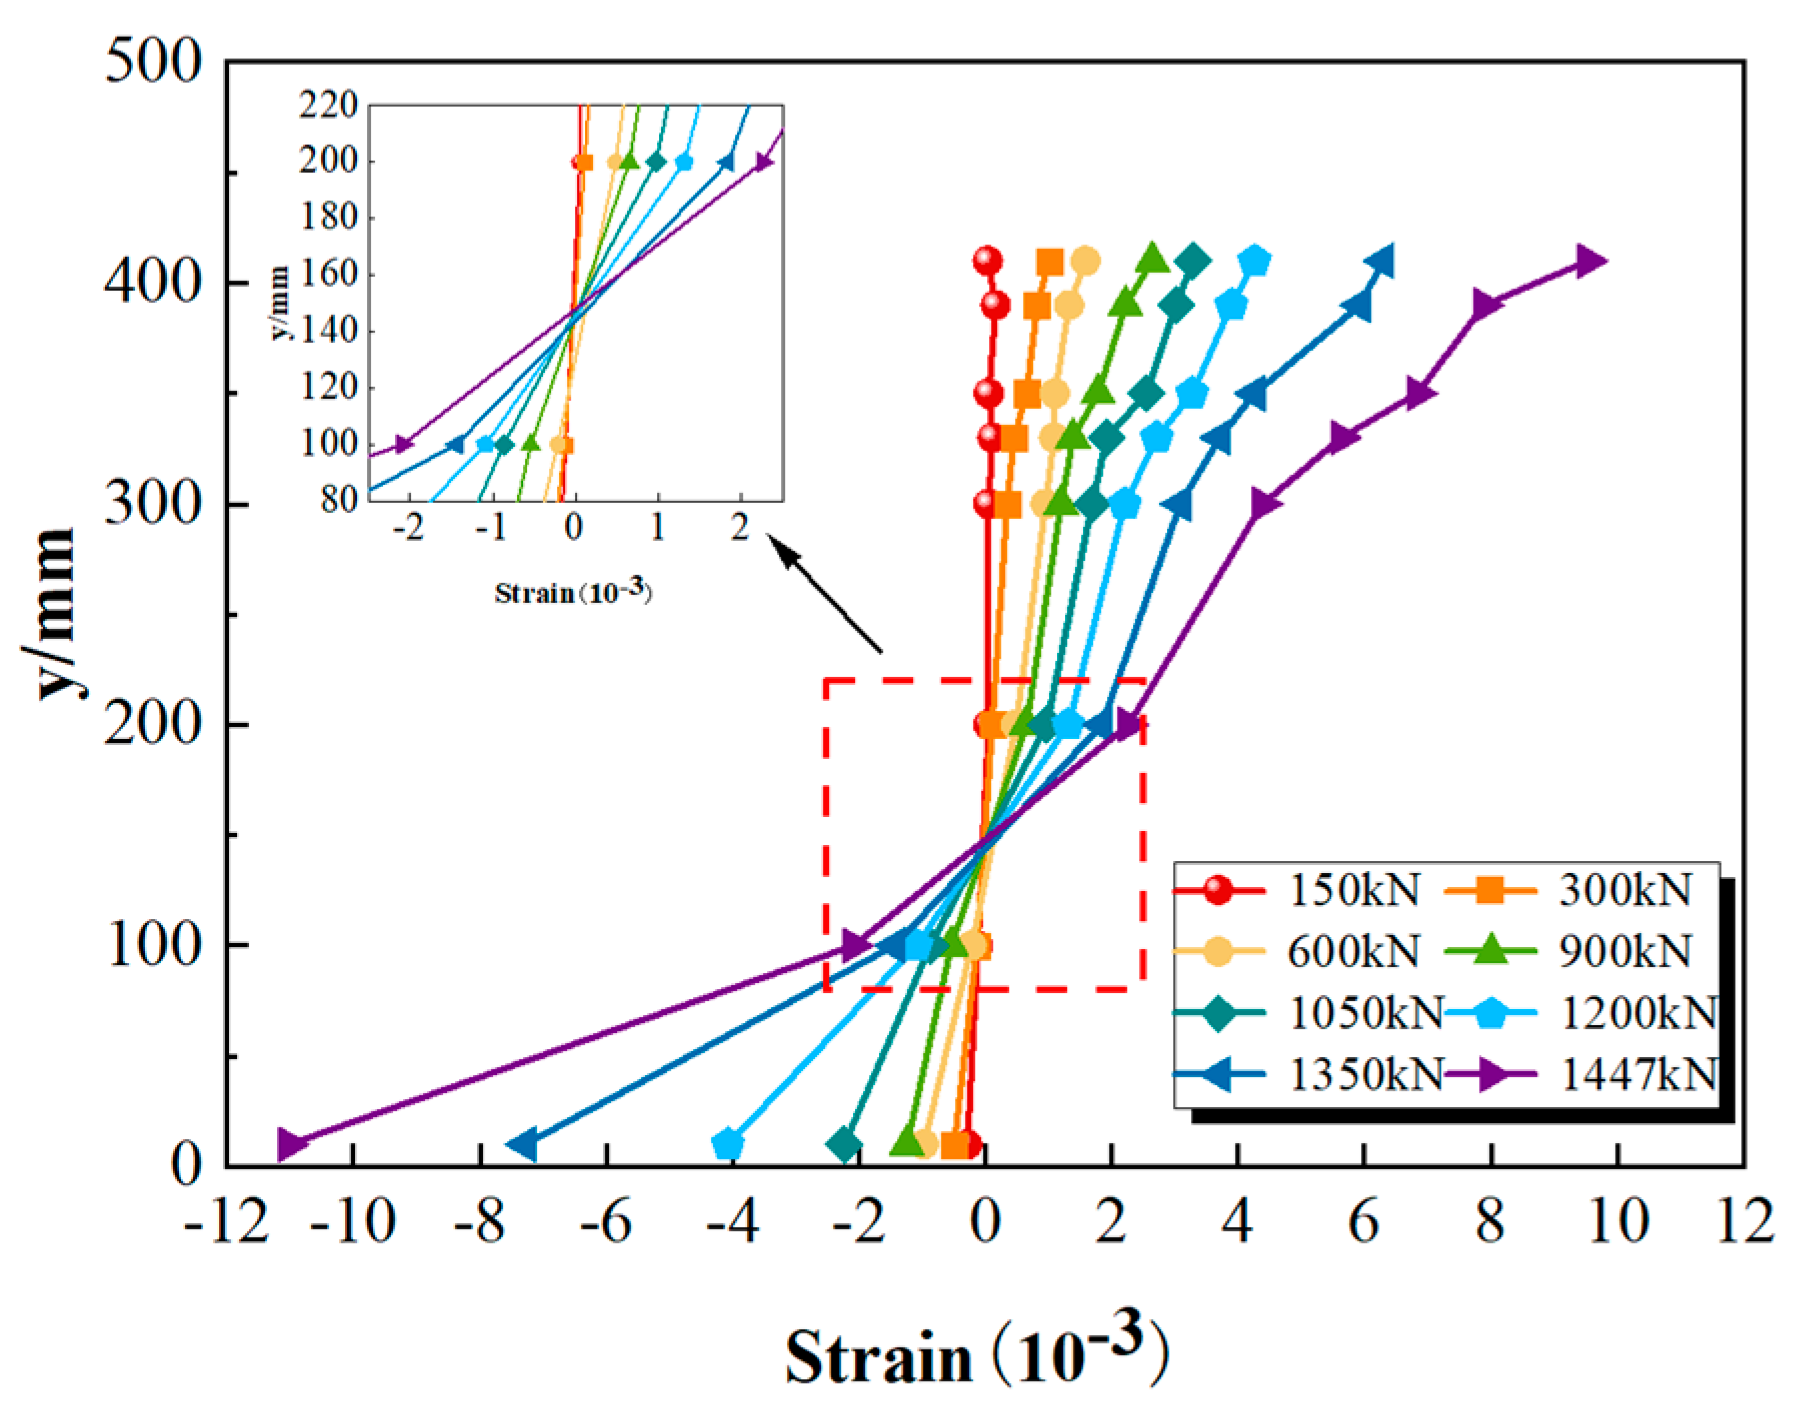
4.2. The Strain Distribution Curve at the Mid-Span Section along the Height of the Beam
Generally, the strain distribution curves for the mid-span section of the six test beams exhibit similarities concerning the beam height. Figure 11 shows the strain distribution along the beam height at the mid-span section of the flange, reinforcement, and steel box, using SUCB-5 as a case study, which exhibits the highest ultimate load capacity.
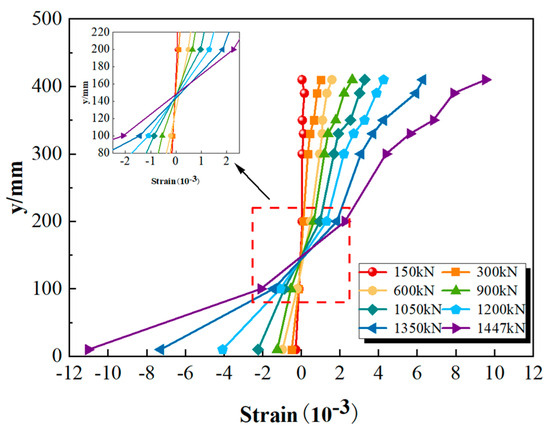
Figure 11.
Diagram illustrating the distribution of strain along the height of the beam at the mid-span section.
In Figure 11, y denotes the vertical distance from the beam’s base. At the initial stage of loading the test beam, the stress distribution in the vertical orientation of the middle section exhibited an almost straight pattern, confirming the accuracy of assuming a flat section. As the load increased, the flange cracked, causing the neutral axis to shift downward. Upon additional loading, the composite beam transitioned into the elastic–plastic stress phase, resulting in a reconfiguration of internal forces within the section, consequently leading to an upward deflection of the neutral axis. Upon reaching its maximum load capacity, the composite beam experienced local buckling within the steel box beam, leading to a sudden rise in strain and ultimately causing the shear failure of the test beam.
4.3. Distribution of Shear Strain in the Steel Box Web
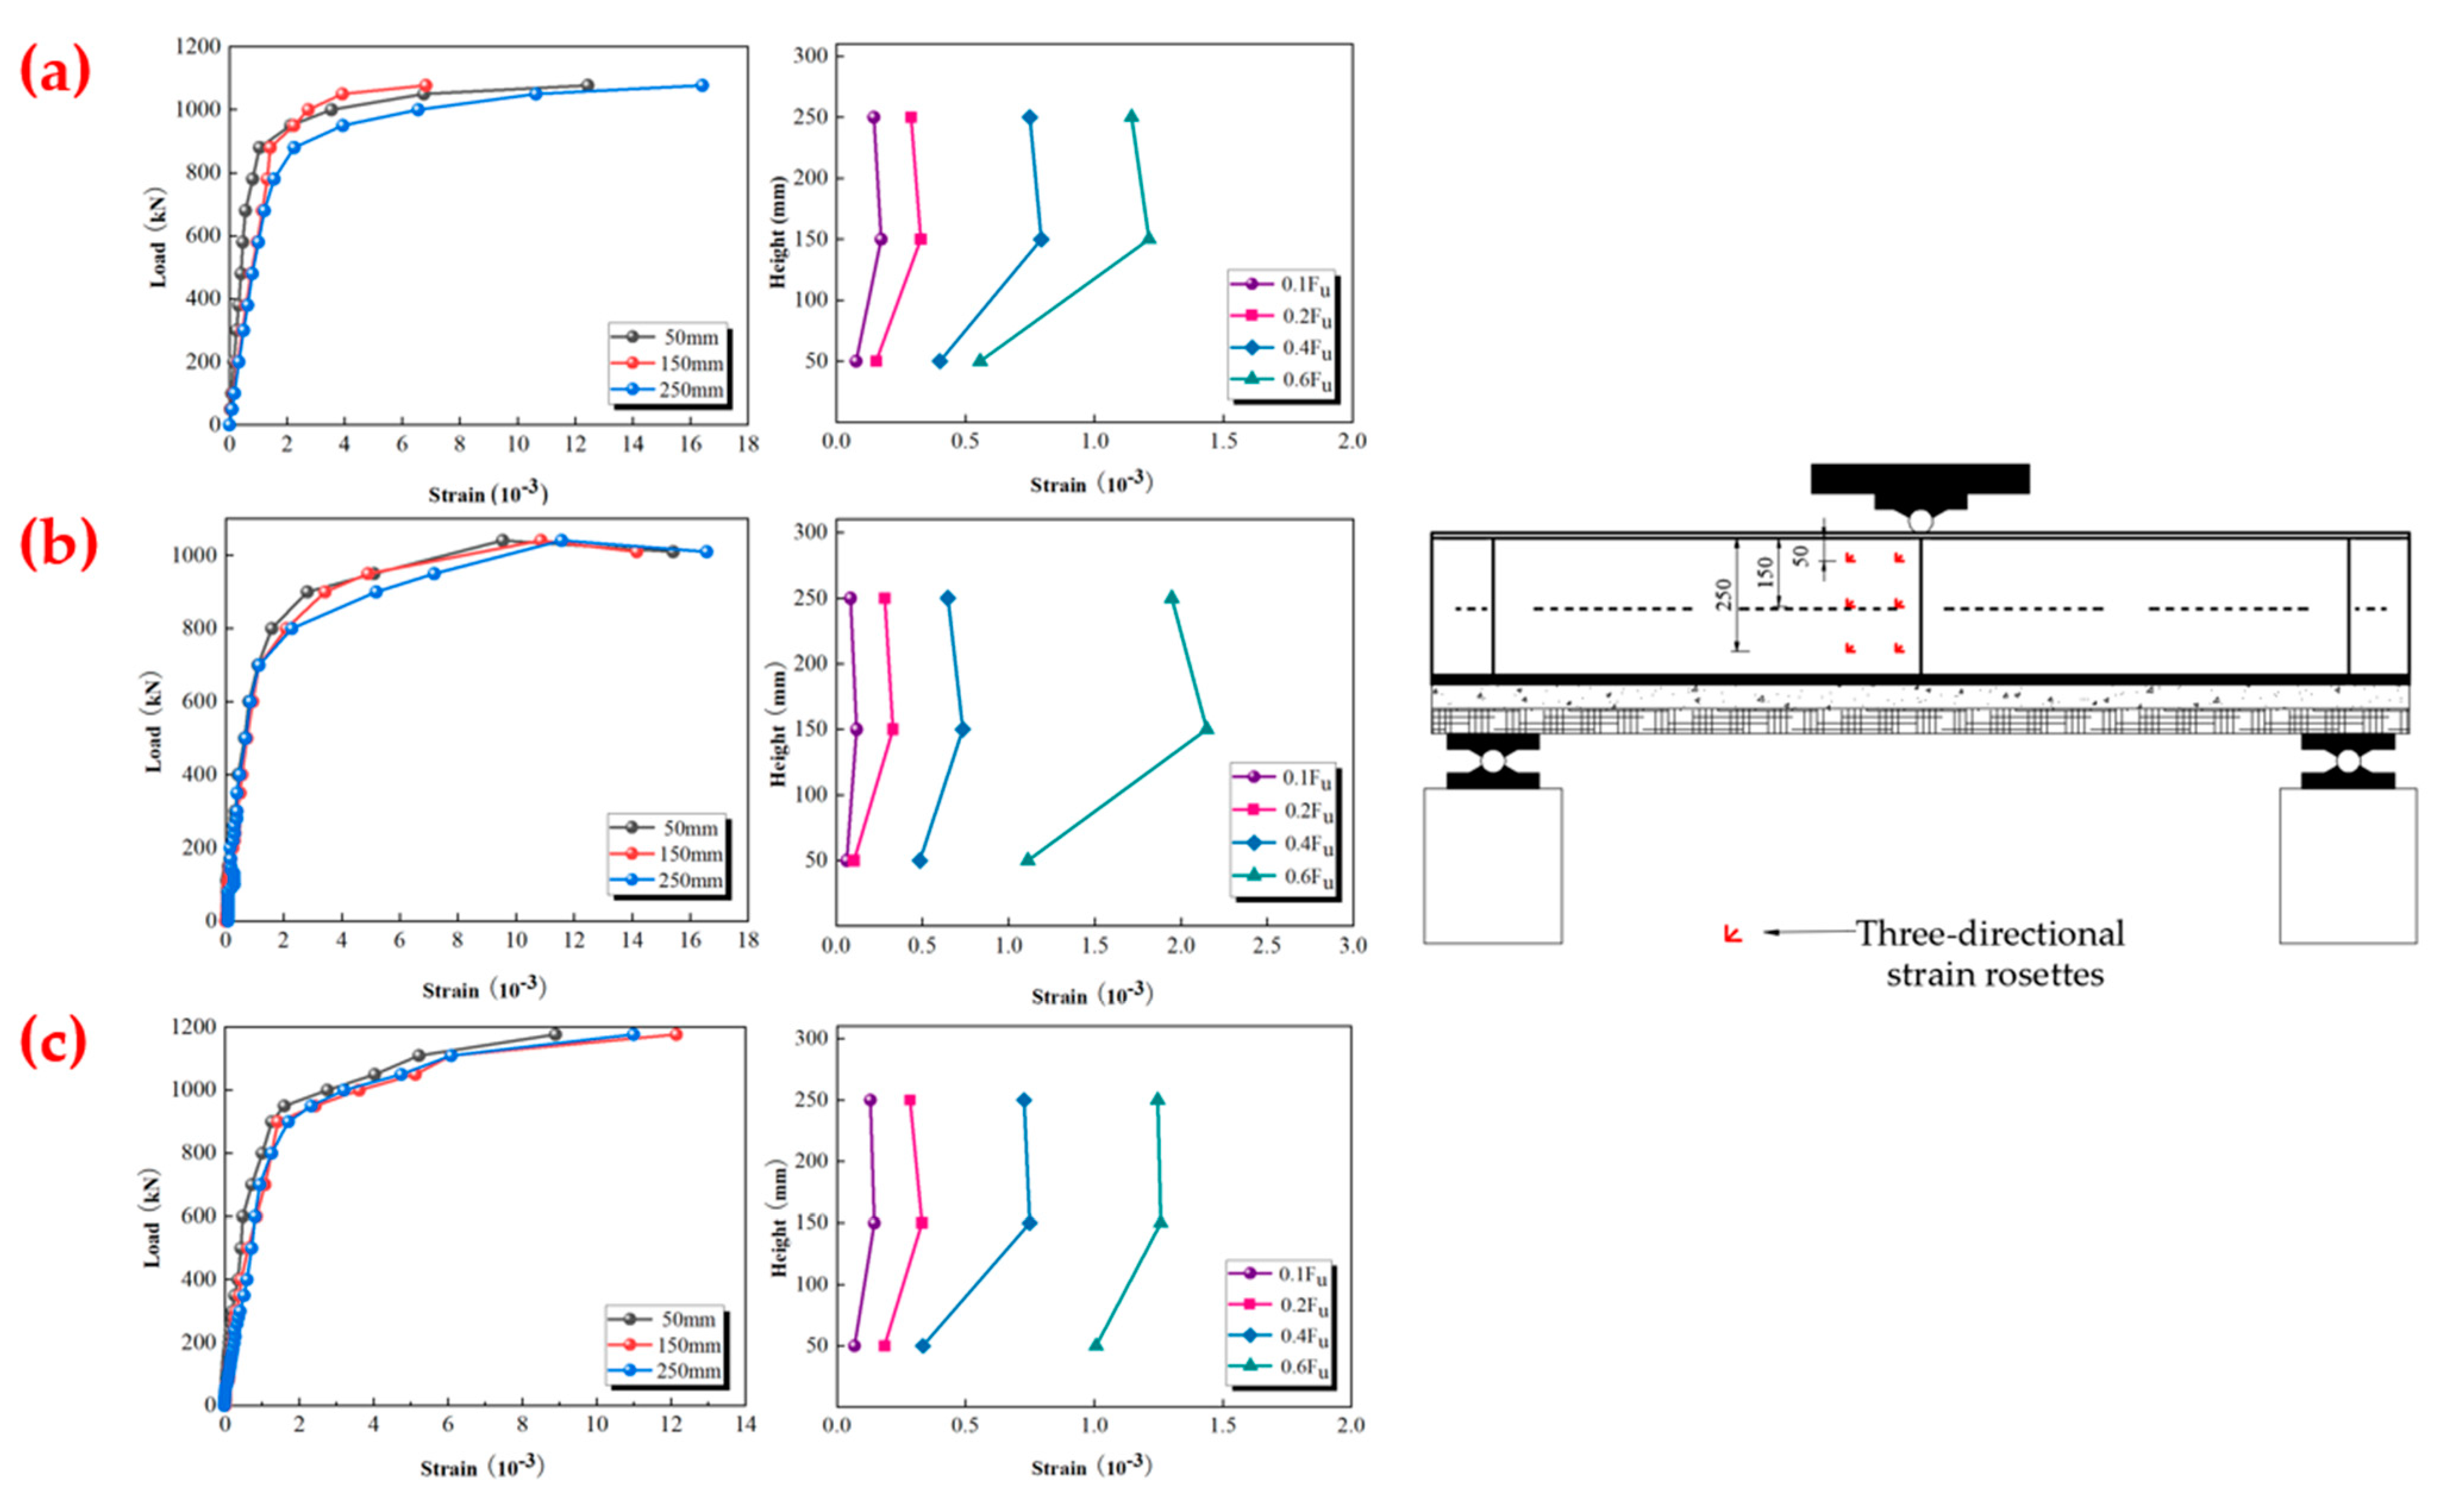
Three-directional strain rosettes were positioned at intervals of 50 mm, 150 mm, and 250 mm from the lower surface of the steel box web. Equation (1) was used to calculate the shear strain of the web of the steel box. Here, and denote the strains measured along the beam’s long and short sides, respectively, whereas represents the strain measured in the direction of 45°.
Figure 12 shows the strain of the steel box web under different load levels, using SUCB-2, SUCB-3, and SUCB-4 as illustrations. As observed, the shear strain in the web directly correlates with the load until the web buckles. Subsequently, following web buckling, the rate of shear strain development accelerates, ultimately causing all measurement points to reach the yield state. The shear strain variation in partially filled narrow-width steel box-UHPC composite beams appears to be similar to that observed in regular composite beams. Furthermore, the deformation ratio attains its maximum value at the neutral axis and progressively diminishes toward both extremities. With the increase in load, the shear strain on the web also increases. Compared to the upper chamber, the lower chamber displays a more pronounced variation in shear strain.
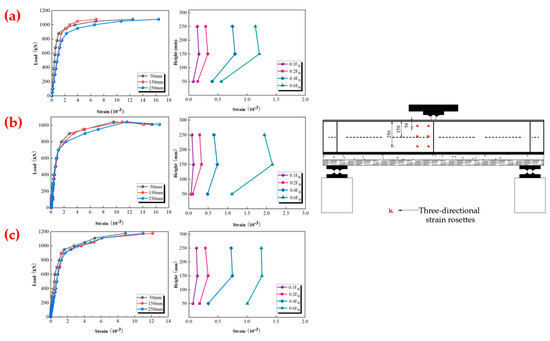
Figure 12.
The steel box web’s shear strain curve (unit: mm). (a) SUCB-2; (b) SUCB-3; (c) SUCB-4.
4.4. Angle of Inclination of the Steel Box Web’s Principal Compressive Strain
The principal compressive strain inclination angle is a crucial parameter for describing the strain state of calculation points during the shear deformation of composite beams. Equation (2) can be employed for its computation.
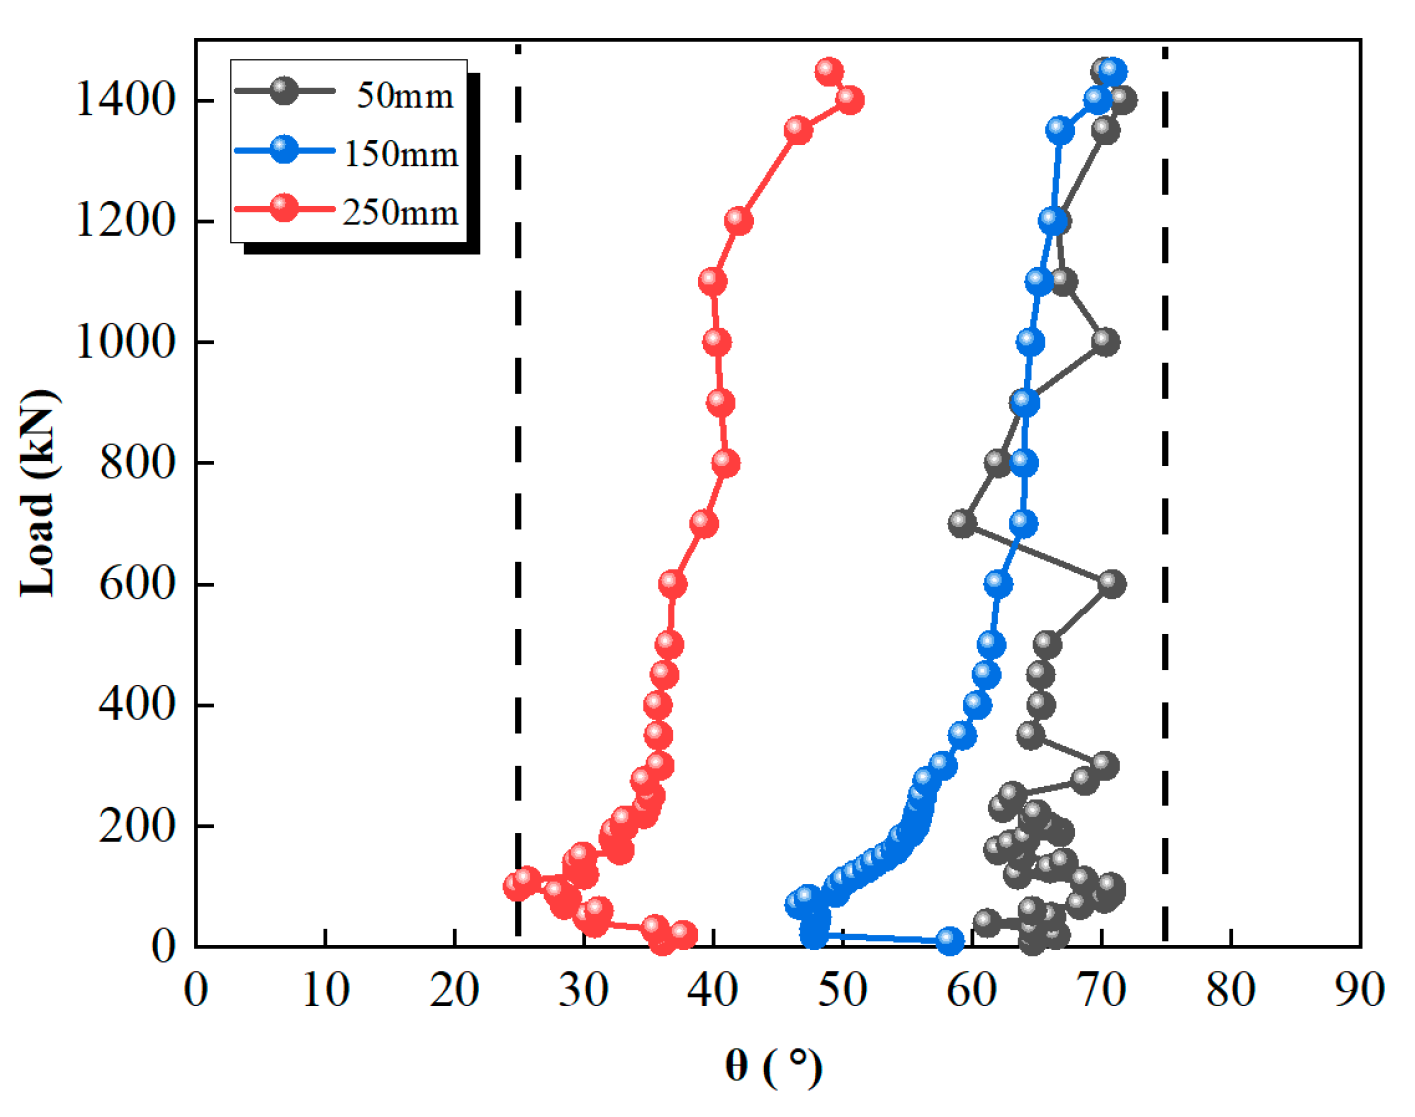
The strain rosettes measure the strain in three directions. The calculation is performed to determine the principal compressive strain inclination angle of the steel box web at distances of 50 mm, 150 mm, and 250 mm from the bottom plate of the SUCB-5 steel box. The variation of θ with the applied load on the composite beam is depicted in Figure 13.
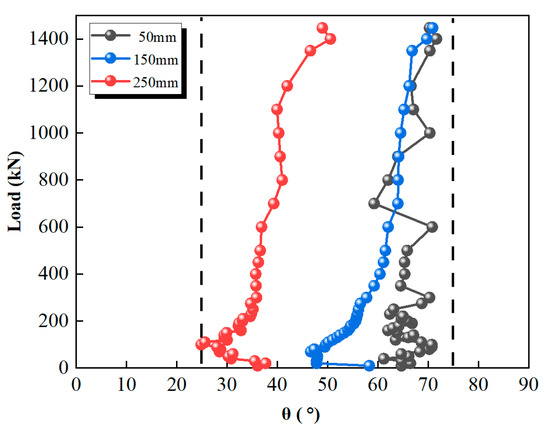
Figure 13.
The angle at which the steel box web in SUCB-5 experiences the greatest compression strain.
The chart displays a noticeable trend in the distribution of the angle of inclination between the primary compressive strain and the longitudinally anchored reinforcement within the web of the beams under examination. The principal compressive strain inclination angle gradually decreases as the distance from the beam bottom increases. When the test beam approaches the cracking load, it experiences an abrupt transition, followed by a steady reduction in the magnitude of this transition as the load increases. The measured inclination angle of the primary compressive strain at each measurement point exhibits a robust correlation with the observed buckling angle in the test beams.
5. Shear Capacity Calculation of Composite Beam
The previous experimental results show a definite connection between adding concrete to the steel box and a significant enhancement in the overall shear strength of composite beams. The aim of this investigation is to propose an equation for evaluating the shear strength of steel box-UHPC composite beams with limited concrete filling. By employing the principle of partial superposition, we formulated an equation for the numerical assessment of the influence of concrete filling on shear capacity.
The shear capacity calculation of flange concrete [27]:
The symbols in Equation (3) are as follows: the shear strength of the wing slab’s concrete is indicated by and the reduction coefficient considers the influence of concrete cracking in the region where negative bending moments occur. Its value is designated as 0.05. The coefficient indicates the impact of longitudinal reinforcement on shear capacity, and its value is . The symbol denotes the reinforcement ratio of the flange. We refer to the UHPC flange’s tensile strength, denoted as , and its area, denoted as . Similarly, the tensile strength of the C40 flange is represented as , with indicating its surface area. The shear capacity calculation of filled UHPC is as follows:
The symbols in Equation (4) are as follows: the shear strength of filled UHPC is represented by ; the calculated value of the filled UHPC’s axial compressive strength is ; and is the area of filled UHPC.
The shear capacity calculation of a steel box web plate is as follows:
The symbols in Equations (5) and (6) are as follows: The shear strength of the steel box web plate is indicated by . To align the formula with the shear capacity test results of the steel box girder, especially using SUCB-5 as the established standard, we introduce a conversion coefficient . The specified value for is 0.18. Furthermore, signifies the yield strength of the steel substance. The represents the cross-sectional area of the web plate in the steel box. The variable represents the distance or spacing between adjacent vertical stiffeners. The variable represents the height of the web plate. The shear coefficient, denoted as , measures the shear within a given system. The symbol represents Young’s modulus of the steel material. The shear buckling coefficient pertaining to the web plate of the steel box girder, herein designated as , has been ascertained to be 10.08 [27]. The parameter representing the thickness of the web plate is denoted by . A visual depiction of the calculation methodology is provided in Figure 14.
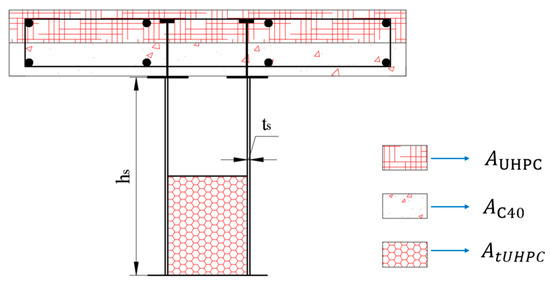
Figure 14.
Sketch of ultimate shear capacity calculation.
We followed the procedure below to determine the shear strength of partially filled narrow-width steel box-UHPC composite beams.
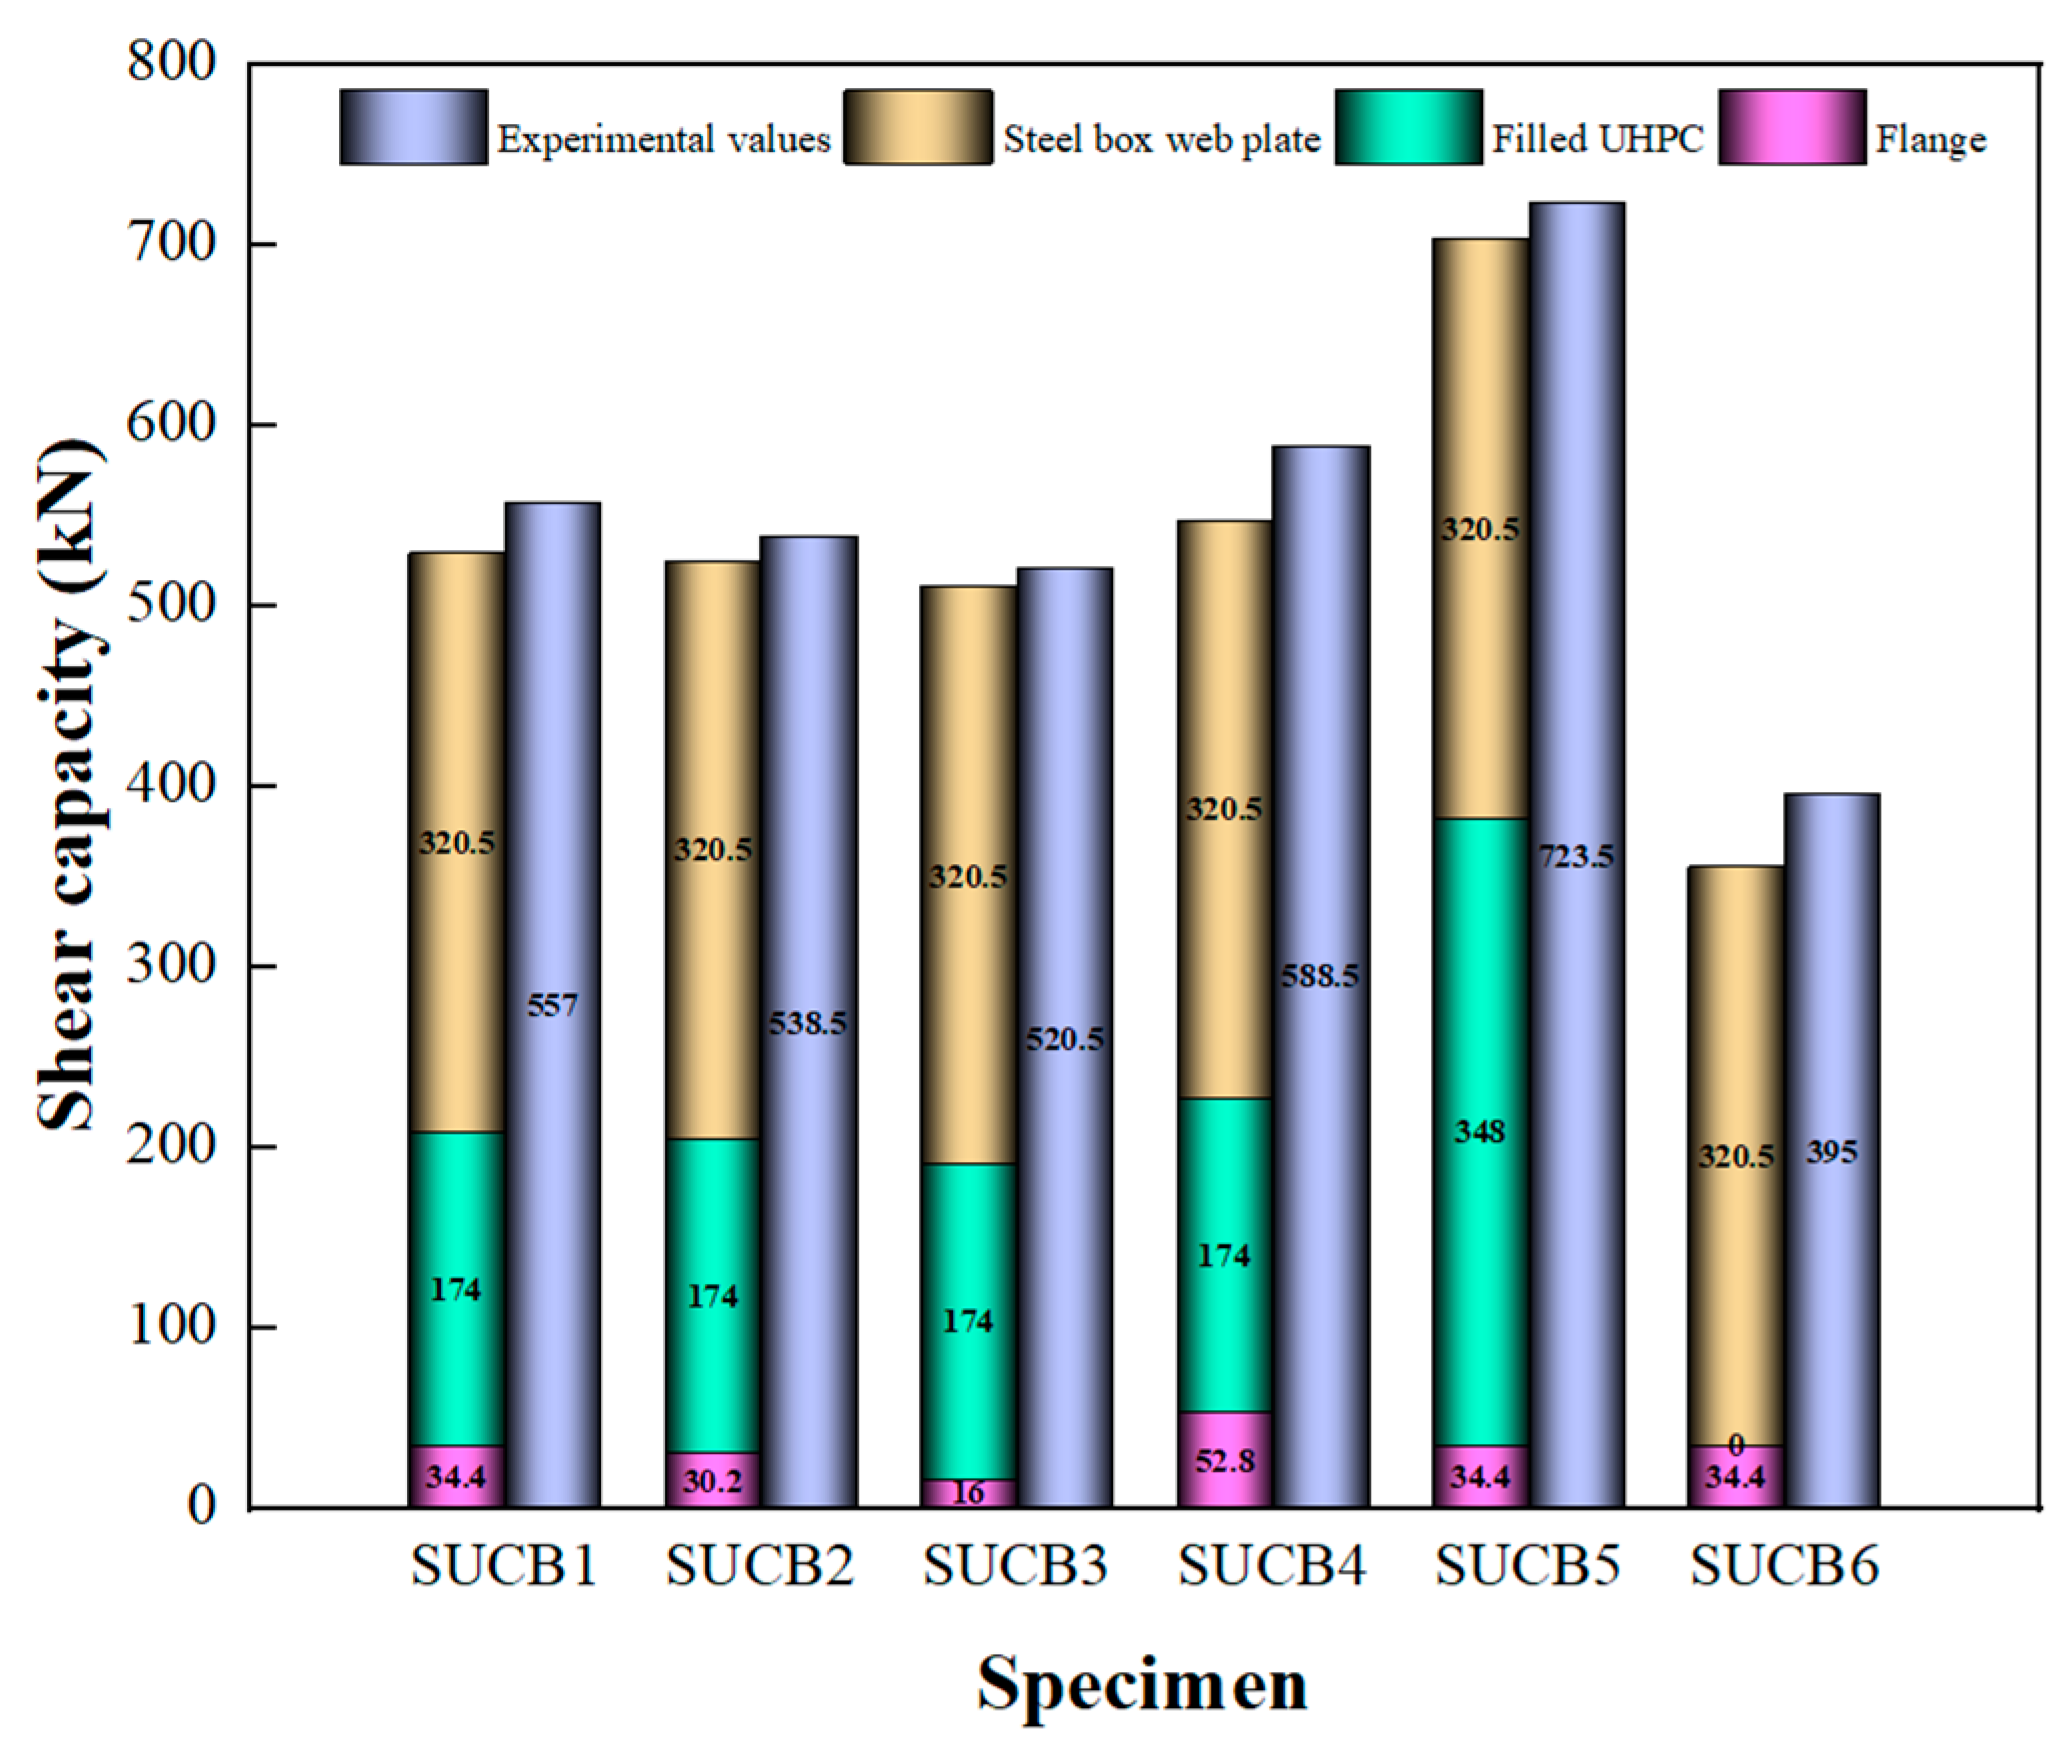
The shear capacity of the composite beam obtained through experimentation is compared to the shear capacity calculated using Equation (7), as illustrated in Figure 15 and Table 7. Upon comparison, it becomes evident that the shear strength of the composite beam, as determined by Equation (7) presented in this research article, exhibits a slightly lower value in contrast to the experimental data. The average accuracy of this calculation is approximately 0.95. Hence, it can be inferred that the proposed computational approach for determining the shear strength of partially filled narrow-width steel box-UHPC composite beams in this study is highly suitable. Moreover, the integration of solid concrete within the steel enclosure significantly enhances the shear force resistance of the composite beam, representing a substantial portion, approximately between 33% and 50%, of the overall contribution. The shear strength of the fully filled concrete composite beam demonstrates a 33% enhancement in comparison to the partially filled concrete composite beam. Furthermore, the completely filled concrete composite beam enhances the overall shear capacity of the composite beam by an additional 52%. The shear strength of the steel box girder, referred to as , makes up a substantial portion, varying from 90% to 98%, of the total shear strength . This indicates that, during the later stages of loading, the shear strength of the composite beam primarily depends on the steel box and the concrete filling inside. The presence of the cracking and subsequent removal of the concrete flanges significantly diminishes their ability to contribute to the shear strength of the composite beams.

Figure 15.
The graph compares the calculated shear capacity values of different parts of the test beams.
Table 7.
Table of comparison of the calculated shear capacity and experimental values.
6. Conclusions
This paper presented several innovations. Firstly, it proposed the novel structural form of narrow-width steel box-UHPC composite beams with partial filling. Secondly, it presented in-depth research on the shear behavior of this structural form, filling a research gap in this field. Additionally, six specimens were subjected to static loading tests. The analysis included the examination of the failure modes and shear failure processes of narrow-width steel box-UHPC composite beams that were partially filled, considering both qualitative and quantitative perspectives. The objective of this study was to investigate the influence of various factors, such as the amount of steel fibers in the flange layer of UHPC, the height of concrete filling in the steel box, and the thickness of the UHPC flange, on the shear behavior of composite beams. Moreover, a calculation approach was introduced to determine the maximum shear strength of partially filled narrow-width steel box-UHPC composite beams. Based on the existing corpus of studies, several conclusions were obtained:
- Typically, the composite beams experience three stages: elastic, elastic–plastic, and plastic, ultimately displaying the characteristic shear-bending failure.
- The ‘bridging effect’ of steel fibers within the UHPC material led to smaller and more concentrated crack widths observed in the UHPC flange, in contrast to a pure C40 flange. Moreover, the strain-hardening characteristics of UHPC greatly enhance the flexibility and ability to withstand the deformation of the composite beam. The impact of incorporating UHPC steel fibers on the cracking load, yield load, and ultimate load of the composite beam differs, with the cracking load showing the most significant enhancement. Furthermore, the incorporation of cast concrete into the steel container results in a substantial improvement in both shear resistance and the overall strength of the composite beam.
- This research demonstrated that the shear strain fluctuation pattern of narrow-width steel box-UHPC composite beams, which were partially filled, resembles that of regular composite beams. Additional assessments demonstrated that the concrete filling within the steel box can contribute up to 50% of the shear capacity of the composite beams. Fully filled concrete composite beams demonstrated a 33% higher shear capacity compared to partially filled concrete composite beams, leading to a 52% greater contribution to shear capacity. Additionally, during the later stages of loading, the steel container and its enclosed concrete contributed to over 90% of the composite beam’s shear capacity, whereas the concrete flange only made a negligible contribution to the shear capacity.
- The shear strength of the partially filled steel box-UHPC composite beams with narrow width, determined through the sub-assemblage method, shows a high degree of agreement with the experimental results, with an average precision of 95%. This suggests that the proposed calculation model in this research holds a certain degree of significance.
- Further investigation can be carried out to explore the impact of substituting the UHPC material in the steel box with C40 material on the shear behavior of partially filled narrow-width steel box-UHPC composite beams, given that the concrete inside the steel box primarily undergoes compression.
Author Contributions
Conceptualization, S.L., Y.Z. and S.M.; methodology, S.L., Y.Z. and S.M.; validation, S.L., Y.Z., S.M., B.W., Q.Z. and P.Z.; formal analysis, S.L., Y.Z. and S.M.; investigation, S.L., Y.Z., S.M., B.W. and Q.Z.; resources, S.L., Y.Z. and S.M.; data curation, S.L., Y.Z. and S.M.; writing—original draft preparation, S.L.; writing—review and editing, S.L., Y.Z., S.M., B.W. and Q.Z.; supervision, Y.Z. and S.M.; project administration, Y.Z. and S.M. All authors have read and agreed to the published version of the manuscript.
Funding
This research was funded by The Project of Guangxi Key Laboratory of Green Building Materials and Construction Industrialization, grant number 22-J-21-1; The Science and Technology Agency in Guangxi Province: The Mechanical Properties of Prestressed Steel-UHPC-NC Composite Beams Under Hogging Moment, grant number 2021GXNSFAA220101; The National Nature Science Foundation of China: the composite mechanism of UHPC-NC flange partially concrete filled narrow steel box composite beams under hogging moment, grant number 52068012.
Data Availability Statement
Data sharing is not applicable to this article.
Conflicts of Interest
The authors declare no conflict of interest.
References
- Nie, J.G.; Tao, M.X.; Wu, L.L.; Nie, X.; Li, F.X.; Lei, F.L. Advances of research on steel-concrete composite bridges. China Civ. Eng. J. 2012, 45, 110–122. [Google Scholar]
- Zhu, J.W.; Wang, C.S.; Zhai, X.L. Experimental research on the mechanical properties of steel and concrete composite girders with circle tubular up-flange under negative bending. Eng. Mech. 2018, 35, 124–133. [Google Scholar]
- Chen, B.; Mu, T.; Chen, Y.; Huang, J. State-of-the-art of research and engineering application of steel-concrete composite bridges in China. J. Build. Struct. 2013, 34, 1–10. [Google Scholar]
- Tang, L.; Nie, J.G. Vertical shear strength of composite beams with compact steel sections. Part II: Composite beams subjected to hogging moment. China Civ. Eng. J. 2008, 41, 15–20. [Google Scholar]
- Xue, J.Y.; Cheng, G.; Zhao, H.T.; Fu, G. Experimental study on shear behavior of steel-concrete composite beams under negative moment. J. Build. Struct. (Suppl. Issue) 2008, 29 (Suppl. S1), 83–87. [Google Scholar]
- Cheng, G. Experimental Study on Shear Behavior of Steel-ConcreteComposite Beams under Negative Moment. Master’s Thesis, Xi’an University of Architecture and Technology, Xi’an, China, 2007. [Google Scholar]
- Liao, W.Y.; Zhou, D.H.; Li, L.Q.; Han, C.X.; Yao, K.C. Experimental Study on Shear Behavior of Composite Beams with Web Opening Under Negative Moment. J. Sichuan Univ. (Eng. Sci. Ed.) 2014, 46, 46–52. [Google Scholar]
- Zhu, J.S.; Wang, Y.G.; Guo, X.Y.; Gao, C.E. Experimental Study on Shear Behaviors of Steel-UHPCComposite Beams with Waffle Slab. China J. Highw. Transp. 2020, 33, 169–181. [Google Scholar]
- Du, J.; Meng, W.; Khayat, K.H. New development of ultra-high-performance concrete (UHPC). Compos. Part B Eng. 2021, 224, 109220. [Google Scholar] [CrossRef]
- Abdal, S.; Mansour, W.; Agwa, I.; Nasr, M.; Abadel, A.; Onuralp Özkılıç, Y.; Akeed, M.H. Application of Ultra-High-Performance Concrete in Bridge Engineering: Current Status, Limitations, Challenges, and Future Prospects. Buildings 2023, 13, 185. [Google Scholar] [CrossRef]
- Bajaber, M.A.; Hakeem, I.Y. UHPC evolution, development, and utilization in construction: A review. J. Mater. Res. Technol. 2021, 10, 1058–1074. [Google Scholar] [CrossRef]
- Xue, J.; Briseghella, B.; Huang, F. Review of ultra-high performance concrete and its application in bridge engineering. Constr. Build. Mater. 2020, 260, 119844. [Google Scholar] [CrossRef]
- Abdul Sahib, M.Q.; Farzam, M.; Sukkar, K.A. Development and Performance Evaluation of UHPC and HPC Using Eco-Friendly Additions as Substitute Cementitious Materials with Low Cost. Buildings 2023, 13, 2078. [Google Scholar] [CrossRef]
- Shao, X.D.; Qiu, M.H.; Yan, B.F.; Luo, J. A Review on the Research and Application of Ultra-high Performance Concrete in Bridge Engineering Around the World. Mater. Rep. 2017, 31, 33–43. [Google Scholar]
- Zhao, Y. Review of UHPC Reinforcement Technology in Reinforcement Concrete Beams. In Proceedings of the 7th International Conference on Architecture, Materials and Construction: ICAMC 2021, Lisbon, Portugal, 27–29 October 2021; Springer International Publishing: Cham, Switzerland, 2022; pp. 204–212. [Google Scholar]
- Li, X.; Hu, Z. Cracking Resistance of UHPC-NC Structure in Negative Moment Zone of Prestressed Concrete Beam Bridges. Arab. J. Sci. Eng. 2023, 48, 4795–4804. [Google Scholar] [CrossRef]
- Zhu, J.S.; Wang, Y.G.; Yan, J.B. Shear behaviour of steel-UHPC composite beams in waffle bridge deck. Compos. Struct. 2020, 234, 111678. [Google Scholar] [CrossRef]
- Zhao, X.; Shao, X.; Cao, J. Experimental studies on shear behavior of steel-UHPC composite beam with hot rolled shape steel. Eng. Struct. 2023, 274, 115160. [Google Scholar] [CrossRef]
- Shao, X.; Zhao, X.; Liu, Q. Design and experimental study of hot rolled shape steel-ultrahigh performance concrete composite beam. Eng. Struct. 2022, 252, 113612. [Google Scholar] [CrossRef]
- GB/T 13239-2006; Metallic Materials—Tensile Testing at Low Temperature. China Standards Press: Beijing, China, 2006.
- GB/T 31387-2015; Reactive powder concreteStandardization Administration of the People’s Republic of China. China Standards Press: Beijing, China, 2015.
- GB 50010-2010; Code for Design of Concrete Structures. China Architecture & Building Press: Beijing, China, 2012.
- GB/T 50107-2010; Standard for Evaluation of Concrete Compressive Strength. China Architecture & Building Press: Beijing, China, 2010.
- Qi, J.; Ma, Z.J.; Wang, J. Shear strength of UHPFRC beams: Mesoscale fiber-matrix discrete model. J. Struct. Eng. 2017, 143, 04016209. [Google Scholar] [CrossRef]
- Lin, Y.; Yan, J.; Cao, Z. Ultimate strength behaviour of S-UHPC-S and SCS sandwich beams under shear loads. J. Constr. Steel Res. 2018, 149, 195–206. [Google Scholar] [CrossRef]
- Zheng, H.; Fang, Z.; Liu, M. Experimental study on shear behavior of prestressed reactive powder concrete box girders. China Civ. Eng. J. 2015, 48, 51–63. [Google Scholar]
- Men, P.F. Study on Shear Performance and Shear Capacity Calculation Method of Steel-Concrete Composite Girders in Negative Moment Regions. Ph.D. Thesis, Chongqing University, Chongqing, China, 2021. [Google Scholar]


Disclaimer/Publisher’s Note: The statements, opinions and data contained in all publications are solely those of the individual author(s) and contributor(s) and not of MDPI and/or the editor(s). MDPI and/or the editor(s) disclaim responsibility for any injury to people or property resulting from any ideas, methods, instructions or products referred to in the content. |
© 2023 by the authors. Licensee MDPI, Basel, Switzerland. This article is an open access article distributed under the terms and conditions of the Creative Commons Attribution (CC BY) license (https://creativecommons.org/licenses/by/4.0/).