Article

Identifying Façade Orientations with Closely Similar Thermal Performance for Unifying Façade Design Features in Hot Arid Climate

Department of Architecture, The American University in Cairo, AUC Avenue, P.O. Box 74, New Cairo 11835, Egypt
*
Author to whom correspondence should be addressed.
Buildings 2023, 13(10), 2639; https://doi.org/10.3390/buildings13102639
Submission received: 13 August 2023 / Revised: 16 September 2023 / Accepted: 18 September 2023 / Published: 19 October 2023
(This article belongs to the Section Building Energy, Physics, Environment, and Systems)

Abstract

:
Large-scale residential projects require architects to balance energy efficiency, thermal comfort, and cost-effectiveness in designing building units distributed in different orientations. Applying a single design to all orientations may not result in comfort conditions and energy efficiency; meanwhile, creating a unique design solution for each orientation can be time-consuming and costly to implement. Despite numerous studies recommending design alternatives for particular orientations, the ranges where orientation changes do not demand a change in the façade design still need to be determined. This research aims to identify ranges for which changes in building orientation do not necessitate changes in the façade design. It involves conducting parametric energy and thermal comfort simulations in a test room and testing the findings using real-life datasets from a large-scale residential project. Glass type, window-to-wall ratio (WWR), and utilization of shading devices were among the design parameters investigated. Results show that for all-year-round occupancy projects, a common solution can be applied for orientation changes between 0° to 10° from the north, −10° from the south, and ±5° from east and west for WWR of less than 50% in hot arid climates. These ranges can increase for small WWRs and when reflective glazing or shading devices are applied. This helps streamline design and construction processes, lower costs, and save energy in large-scale residential projects.

1. Introduction

Buildings are responsible for around 40% of worldwide carbon emissions [1]. According to the United Nations Environment Programme (UNEP) global status report for buildings and construction for 2022, the CO2 emissions from building operations, which includes emissions from heating and cooling, have surged to a record high of roughly 10 GtCO2, which is a 5% increase from 2020 and is 2% higher than the previous peak in 2019 [2]. This research has also highlighted that building performance modeling should be used as early as possible in the design process to maximize its impact on crucial design decisions [3]. According to de Wilde [4] and Lin et al. [5], 57% of energy-saving measures should be considered at the schematic design phase, as this is when the building shape, orientation, and skin begin to take shape. The potential for energy savings decreases as the design phases proceed, and the prices for the same energy-saving benefits rise [4,5]. Despite the growing interest in urban building energy modeling in large-scale master plan projects, there is still a need to introduce relevant tools at various stages of the planning and design processes, as well as to explore to what extent these tools might assist stakeholders in making decisions [6]. Hemsath [7] shows that individual home orientation has minimal cost implications, whereas the aggregated suburban community house orientation has more significant total annual energy costs.
To curb the existing trend of the unsustainable surge in energy demand, energy-efficient techniques for the residential sector need to be continuously developed as the energy consumption from residential structures is expected to increase by more than eight times by 2050 [8]. Over the past few decades, myriad studies have tackled the optimization of building performance, with energy consumption being considered the most common optimization objective. A study by Evins [9] reveals that more than 60% of the literature tackled energy consumption compared to other objectives such as cost, comfort, daylight performance, and CO2 emissions. Proper building orientation can contribute to significant energy savings throughout a building’s life cycle [10]. The impact of building orientation on energy savings is addressed in a study by Ruiz and Bandera [11]. The authors state that the influence of orientation on energy demand can be attributed to the correlation between building orientation and important environmental factors such as incident solar radiation and wind exposure [11]. The residential sector’s energy usage is also influenced by the building envelope and user behavior, while the most important factors impacting the thermal comfort and lighting energy requirements inside a building are the building design, orientation, and window-to-wall ratio [12]. A recent study by Alsaadani [13] provides a synthesis and thorough literature review on the research conducted to enhance building energy performance, particularly in the Egyptian Residential Sector. The author provided a breakdown of the various variables, methodologies, analysis types, performance objectives, and geographical locations of studies conducted over the past few decades. Alsaadani [13] pinpointed the gaps and overlaps in the literature, highlighting the fact that three climatic zones in Egypt are understudied, including the “East Coast Climatic Zone”, which is one of the reasons why the selected apartment prototype on the Red Sea Coast was chosen for this study.
Numerous studies have examined the impact of building orientation in different climatic zones on buildings’ thermal load and energy consumption, including Al-Tamimi et al. [14] for non-air-conditioned buildings in hot, humid climates and Morrissey et al. [15] for the temperate oceanic climate of Melbourne, Australia. Furthermore, Belmahdi et al. [16] investigated the impact of building orientation on energy consumption in the Mediterranean climate of Tetouan city. The analysis indicated that taking building orientation into account when designing allows for the lowest energy consumption needed to reach thermal comfort [16]. Renuka et al. [8] investigated the impact of building location and orientation on energy efficiency. The analysis was conducted on house models in Mumbai, Shillong, Delhi, and Chennai. The results of the analysis indicate that if the optimal parameters are implemented, the highest decrease in energy consumption percentage is when the building is facing north in both Delhi and Chennai [8]. Similarly, Elghamry and Azmy [17] explored the impact of building orientation on energy consumption for a domestic unit in Cairo, Egypt. The results of the analysis show that the energy use intensity of the north–south façades is nearly 10% less than that of the east–west façades and is the best orientation for the least energy consumption [17]. A study by Elhadad et al. [18] also discussed the impact of building orientation on energy performance for a residential unit in New Minia City, Egypt. The authors highlighted that the energy demand could be reduced by 5.8% if the building is oriented towards the north direction [18]. The location of the actual building has a noticeable effect on the energy consumption by up to 67% in the investigated case [18].
Meanwhile, Aydin et al. [19] explored the optimum shading devices to decrease energy consumption on a hypothetical building oriented toward the cardinal directions. The two main parameters investigated in this study are the width of the shading device and the angle between the shading device and the window. The results indicate that a 50 cm-sized shading device is better than a 25 cm shading device width and that the best angle between the window and shading device for the southwest, southeast, and north façades is 90°; for the east and west zones façade 30°, south zone façade 75°, northeast zone façade 45°, and finally, for the northwest zone façade 15° [19]. In addition, El-Deeb et al. [20] highlighted that building forms with large aspect ratios are highly sensitive to orientation changes, especially in desert locations. Sherif et al. [21] have conducted a study to examine the optimum solar screen opening proportions for balancing energy and daylight performance in different orientations in desert environments. While a 1:1 proportion was recommended for the southern orientation, screen opening proportions from 1:1 to 18:1 [Horizontal: Vertical] improve daylight performance in northern orientations [21]. Likewise, a study by Kim et al. [22] looks at how the size, position, and orientation of windows all affect the energy load. In this study, the authors highlighted that the window position has the biggest influence when WWR is 20% [22]. Alghoul et al. [23] conducted a study to investigate the influence of window-to-wall ratio (WWR) and window orientation (WO) on cooling, heating, and total energy consumption for a small office space in the city of Tripoli, Libya. Walls with WWR between 0 and 0.9 and with orientation varied in steps of 45° were considered [23]. The authors deduced that the cooling energy consumption is substantially higher than heating energy consumption; however, when adding windows to southern walls, cooling consumption drastically increases, while heating energy consumption decreases to zero due to passive solar heating [23]. The effects of various façade design elements on the interior air temperatures and cooling loads in residential buildings in temperate climates were also studied by Tong et al. [24]. The authors concluded that full-height clear glazing and unshaded facades exhibit the worst performance [24]. They also noted that lowering the WWR to 40% and lowering the glass’s solar heat gain coefficient from 0.82 to 0.47, or adding a 1.5-m horizontal overhang above the window, can significantly lower indoor air temperatures and cooling loads [24]. Yu et al. [25] classified and examined the ideas, metrics, approaches, and factors needed to achieve thermal–daylighting balance. The authors emphasized that a suitable base plan width-to-depth (e.g., 1:1), window–wall ratio typically around 30%, high transparency and thermal insulation glazing, adjustable shading with control, and efficient lighting equipment were recommended to achieve that balance between thermal comfort, reduction in energy use, and proper daylighting [25]. The best ways to attain that balance vary depending on the location and climate [25].
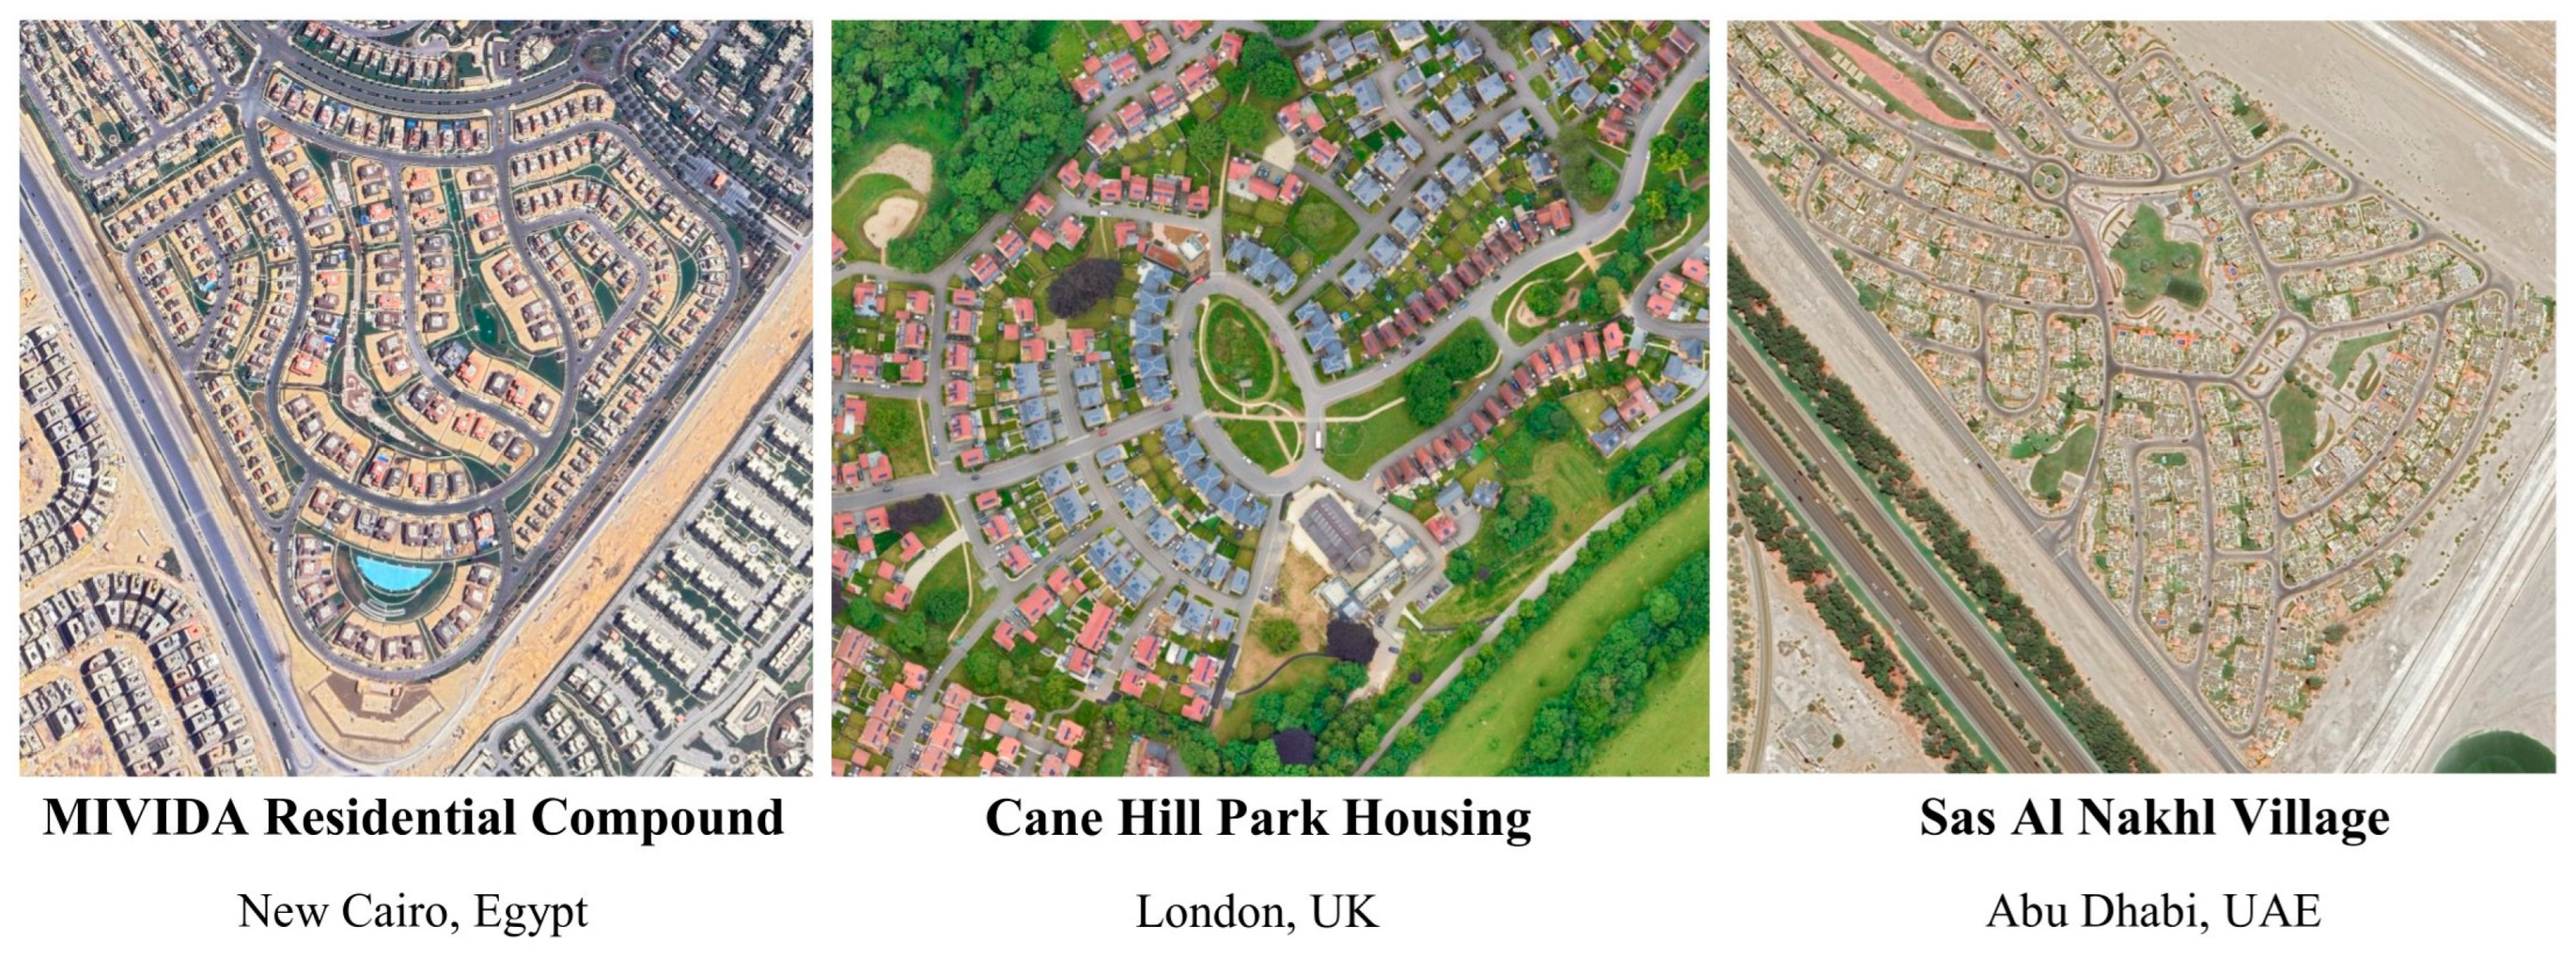
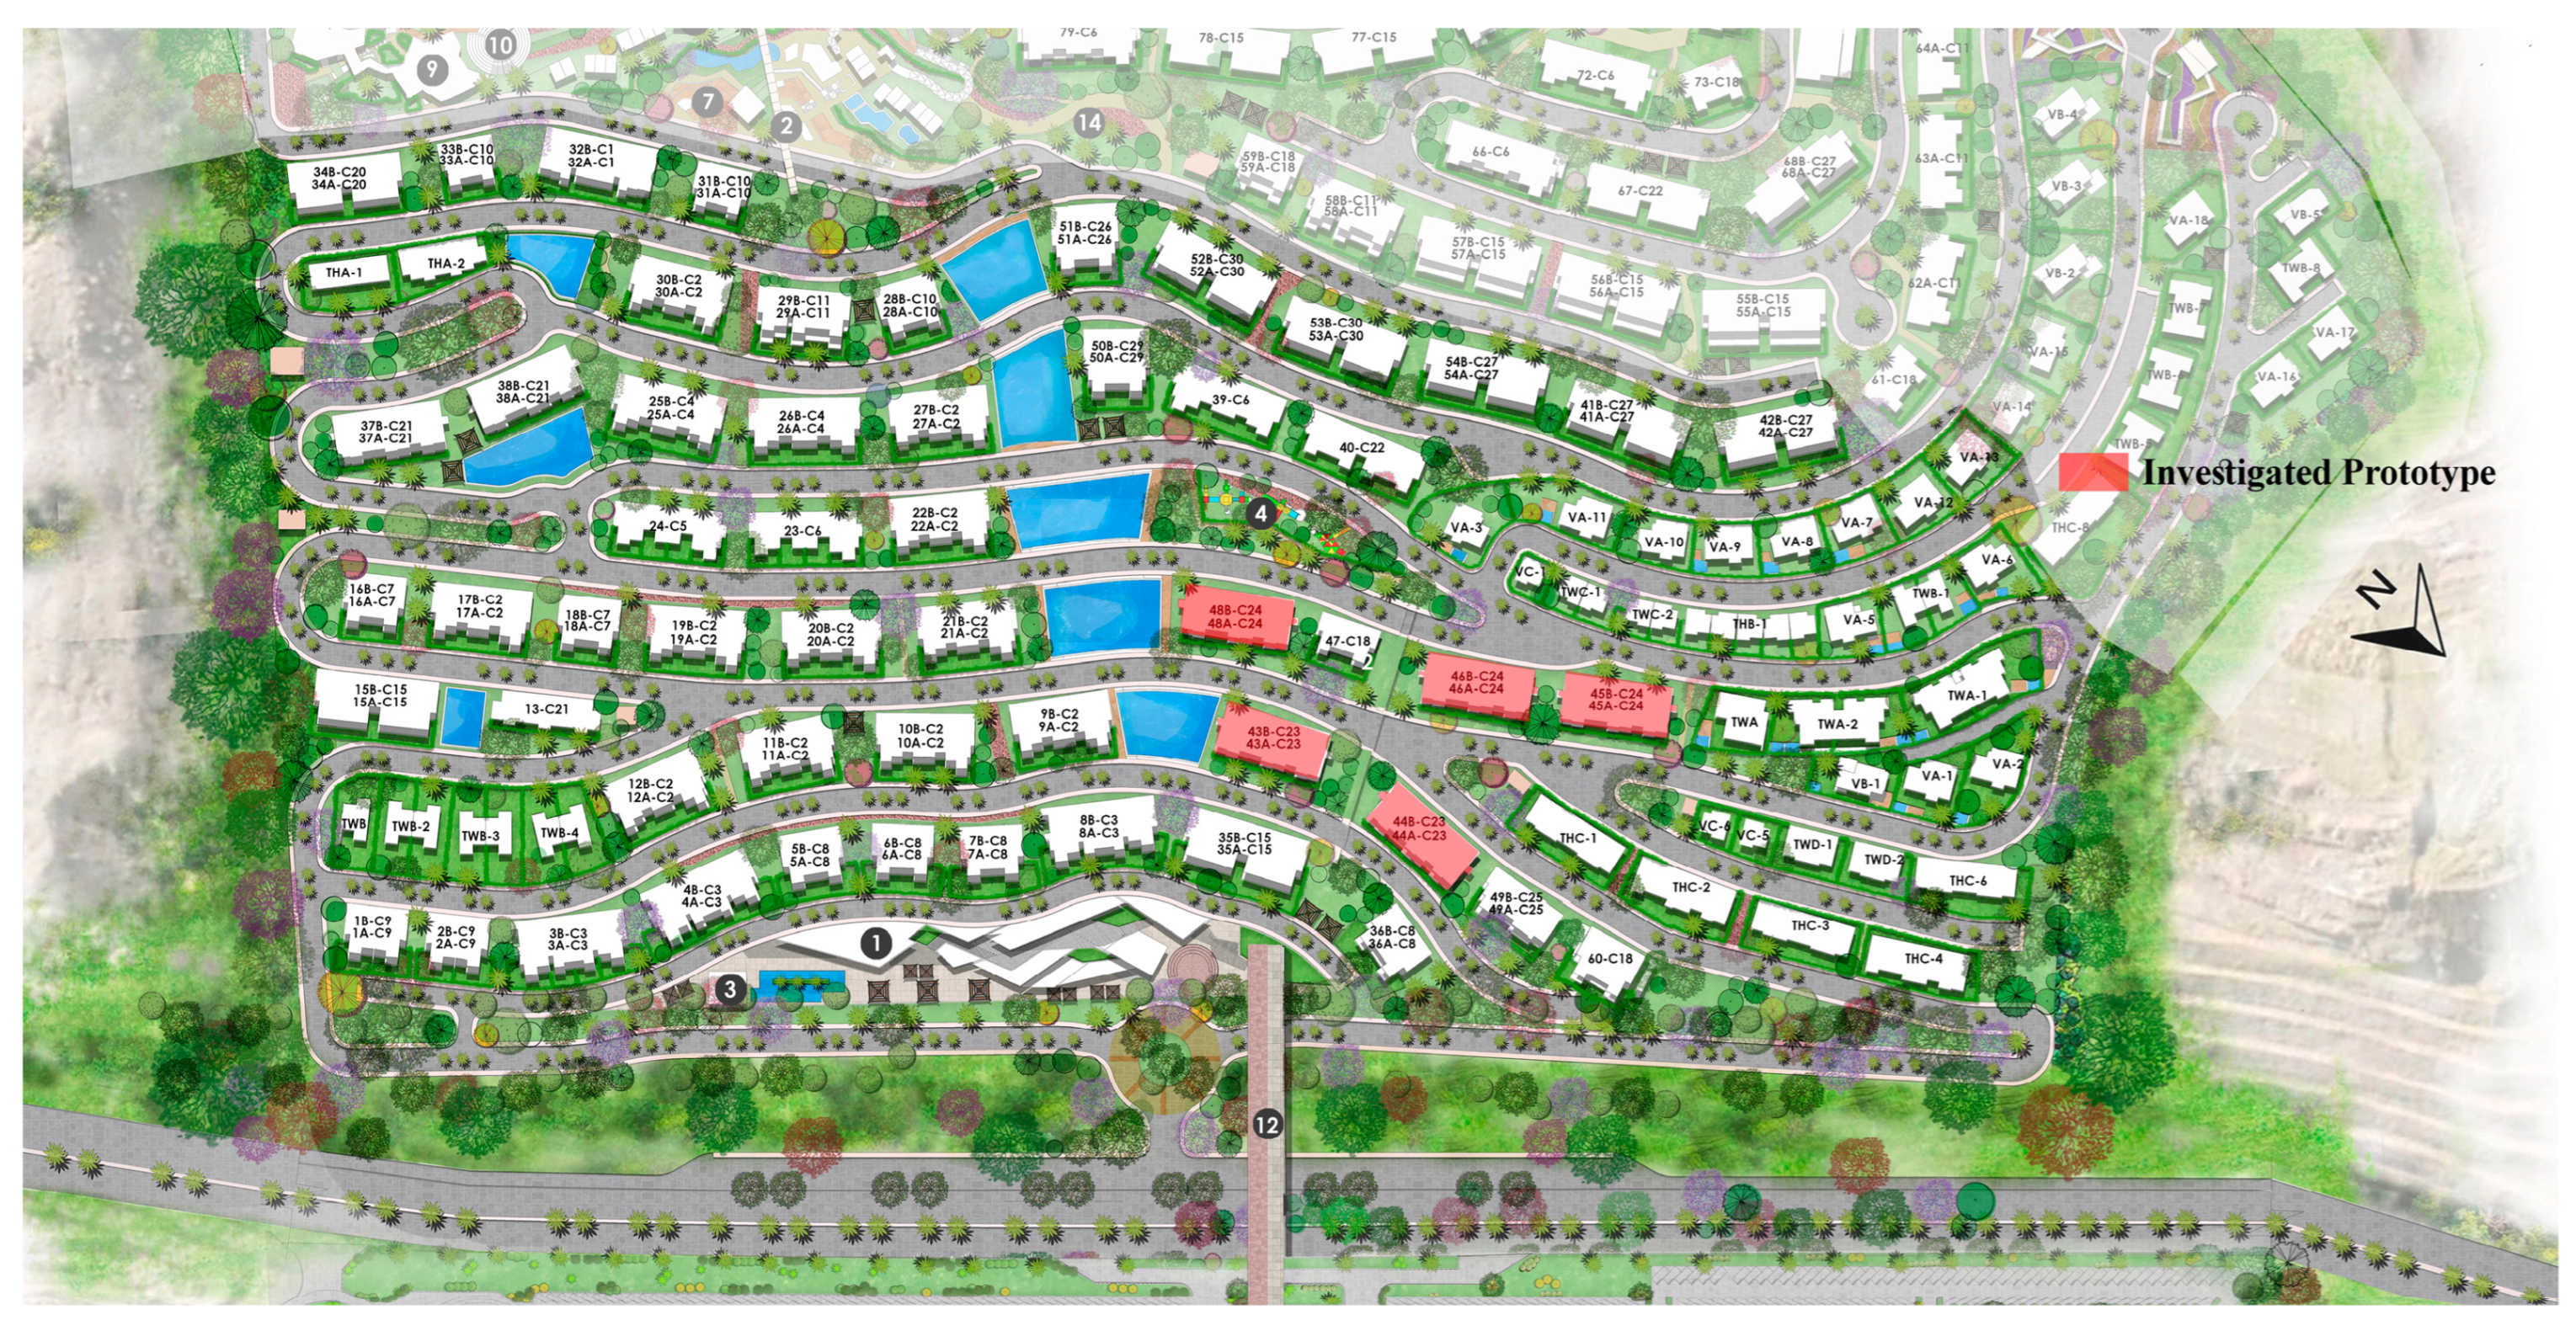
While most of the literature focuses on the optimal design treatment for specific orientations or determining the building orientation with the lowest energy consumption, choosing the building orientation is not always an option in real-world projects. One of the main challenges that planners and architects face today in large-scale residential projects is that the same building unit can have various orientations in the same master plan. Figure 1 illustrates the master plan of some of these projects. Façades of a similar building can face either north, east, south, west, or any angle in between. Designers must decide whether to optimize the energy consumption and thermal comfort of these units by finding a design solution for the façade of each unique orientation, which is time-consuming, unpractical, and costly in construction or simply applying one design solution for the same façade in all orientations, which becomes optimized for a certain orientation and unoptimized for others. It would be useful if one façade treatment would successfully work for a range of orientations, thus reducing the number of design alterations between one orientation and the other. The goal of this research is to identify ranges for which changes in building orientation do not necessitate a change in the façade design solution because, within those angles, the changes in building loads or comfort hours are marginal. This will help simplify the construction process of the repeated prototype developments and reduce construction costs. It will also shorten the optimization time, which is typically long in multi-objective simulation and complex energy models used in large-scale projects, thus giving master plan developers and designers more time to tap into additional energy efficiency potentials that could be very useful when defining performance and carbon footprint targets. This research is split into two phases. The first part involves testing the process on a single (3 m × 3 m × 3 m) residential bedroom model, and the second phase involves application on a real project in Ain Sokhna, Red Sea Coast, Suez, Egypt. The façade design features examined in this research include changing the window glass type, window-to-wall ratio, and the design of the window shading device.

2. Materials and Methods

The research method used in this study aims to identify the ranges of building orientations where the changes in building performance, specifically thermal loads and comfort, are marginal, thus allowing for the unified façade design solutions to be applied in large-scale residential projects. To achieve this goal, parametric energy simulation and thermal comfort analysis, including the use of real-life data sets for simulations, were employed. For the first stage, the analysis was conducted on a generic residential bedroom. Meanwhile, for the second stage, this study was conducted on a real-life apartment building prototype. The parametric modeling and analysis were conducted using the DesignBuilder software program (version 7.0.0.096, 2021). It utilizes Energy Plus 9.4 software as an engine for simulation. Energy Plus was validated by a large number of studies [26,
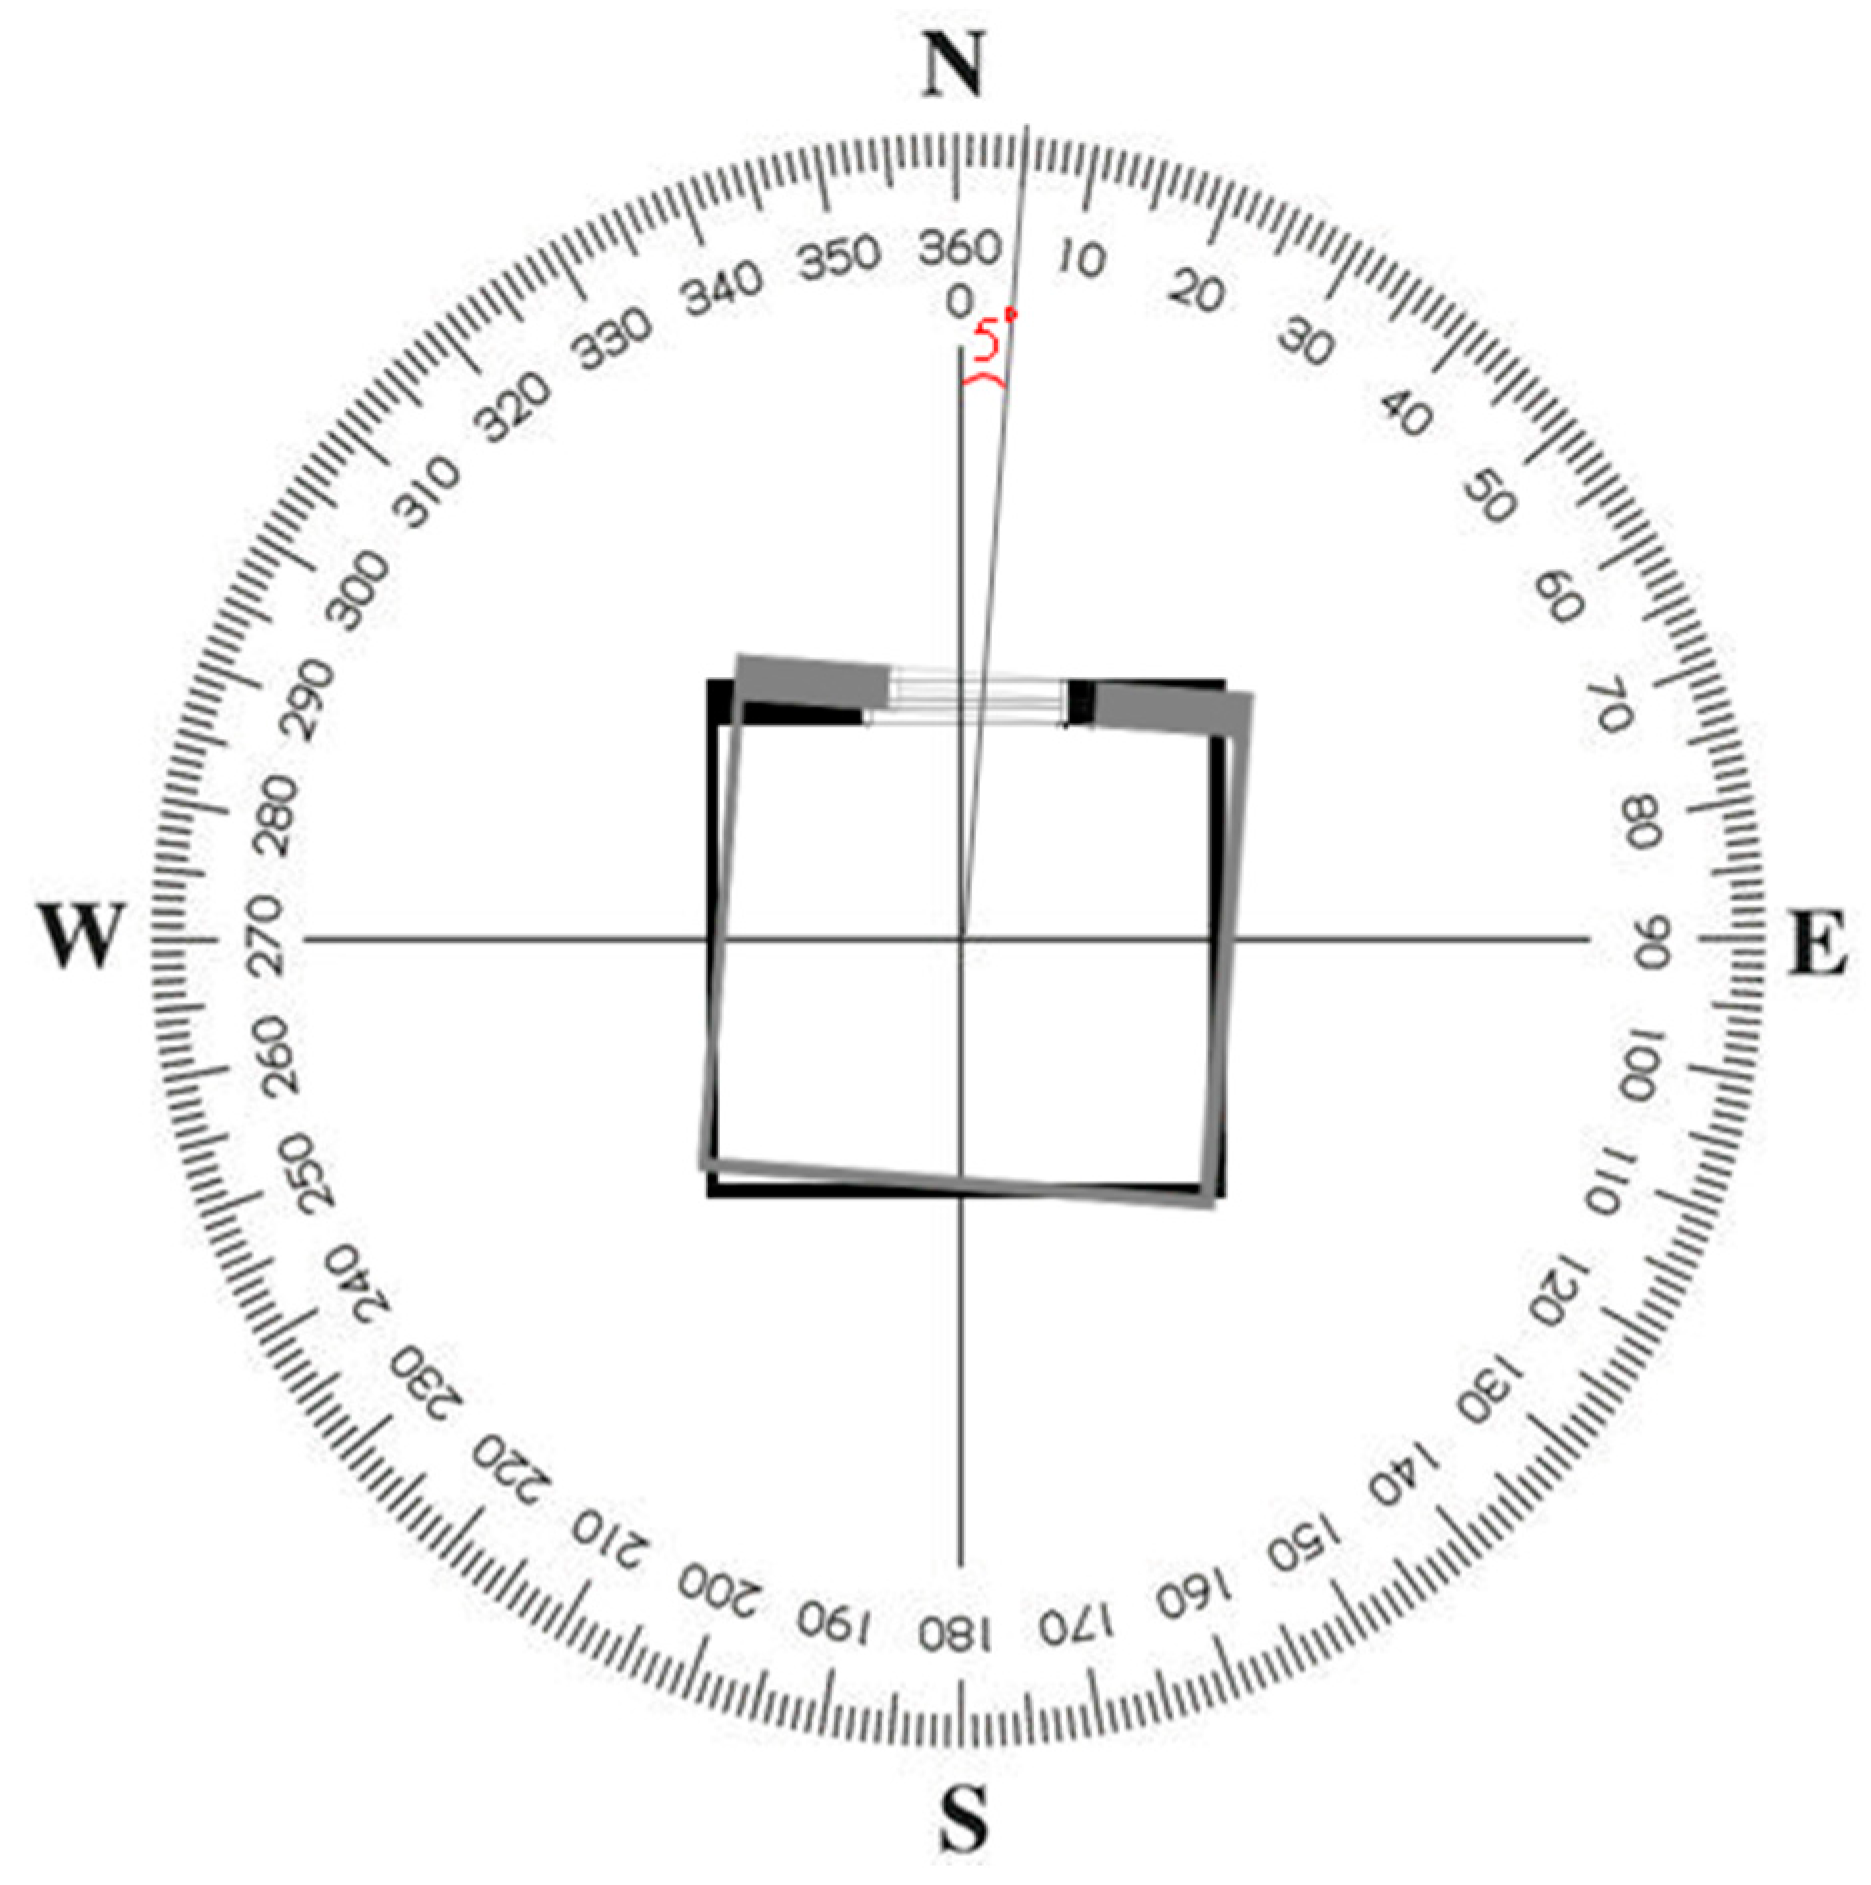
27]. In stage 1, the analysis was conducted on the generic residential bedroom model twice, once with the assumption that the room combined the use of natural ventilation with the use of air conditioning when and where essential. The second time, the room was assumed to be only naturally ventilated. In the first analysis (Scenario A), where air conditioning systems were used, the thermal loads were calculated for different façade designs when the room occupied different orientations. The HVAC system used in this study is a split AC system that consists of two main components, an indoor unit, and an outdoor unit. The indoor unit contains the evaporator coil and the blower fan, while the outdoor unit contains the compressor and the condenser coil. For the second test (Scenario B), where the room was assumed to have no HVAC system, the occupiable comfort hours were calculated according to the ASHRAE 55 adaptive comfort model. The different facade design alternatives tested in this analysis include the impact of glazing type, window-to-wall ratios, and shading devices since aperture treatments have a significant impact on buildings’ lighting, heating, and cooling systems as well as their relationship to the outside world in terms of daylighting, ventilation, and vistas. The effect of implementing these features on the thermal loads (heating and cooling) and comfort hours in different orientations was tested. The results were calculated for façade orientations starting from 0° (north) to 355°, at 5° increments shown in Figure 2. The angle ranges where changes in the building orientation did not necessitate a change in the façade design feature were identified. It should be noted that residential projects can be occupied seasonally or all year round. The results showcased were for all-year-round, summer season (i.e., from 21 June to 21 September), and winter season (i.e., from 21 December to 21 March) analyses.
In this stage, the design of one of the façades of a generic (3 m × 3 m × 3 m) residential bedroom was tested. Three walls, along with the floor and the roof, were defined as adiabatic surfaces. This ensured that any heat gain and/or loss only occurred from the tested non-adiabatic room surface. The external non-adiabatic wall was made of 25 cm solid cement bricks, which is a commonly used building material in Egypt, and coated with 2 cm of cement mortar on both sides. The U-value of the external wall cross section is 2.474 W/m2.K, which is typical for external walls in Egypt, as indicated in numerous pieces of literature, including Attia et al. [28] and Gamaleldien et al. [
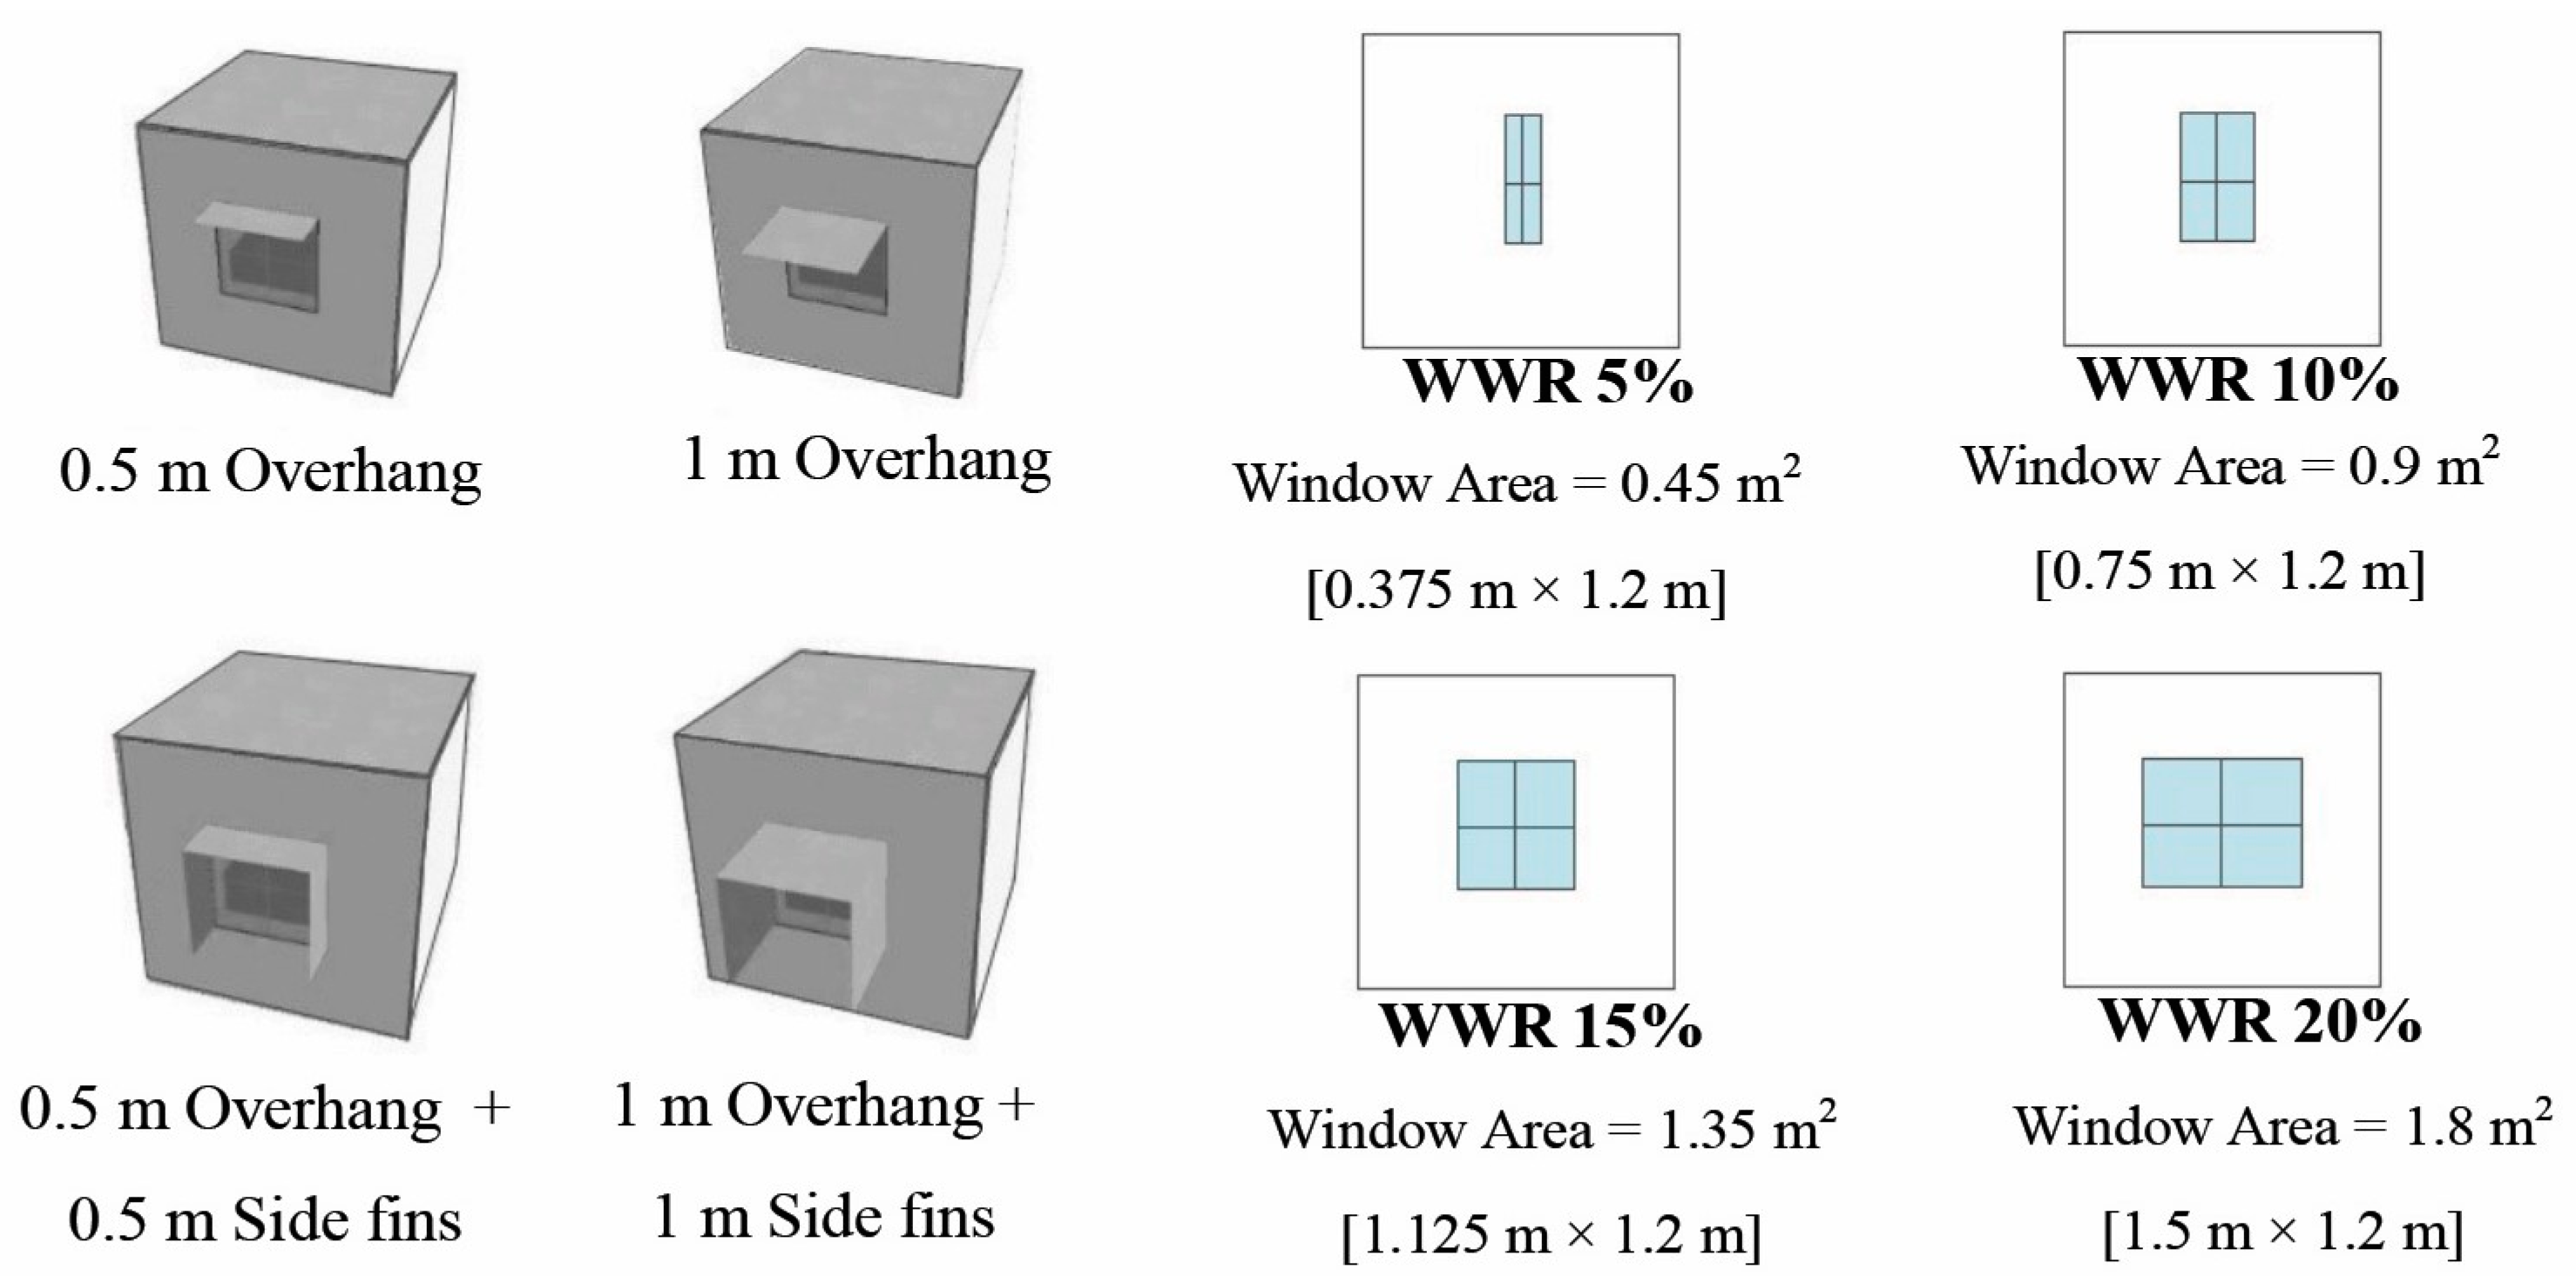
29]. Initially, the test room had 30% WWR, i.e., a 2.25 m × 1.2 m window with the sill allocated 1 m above the floor level, as indicated in Figure 3. The reason for selecting a room with 30% WWR is because, according to the literature, a façade window–wall ratio of around 30% is recommended for balancing daylight energy saving and thermal comfort [25,30]. The analysis was later repeated but using different WWRs to investigate how the ranges that could have a unified façade design differed once the WWR% was changed. The simulation was conducted for the city of Suez on the Red Sea, located in the East Coast climatic zone of Egypt. It is characterized by a hot desert climate according to the Köppen–Geiger climate classification [31].
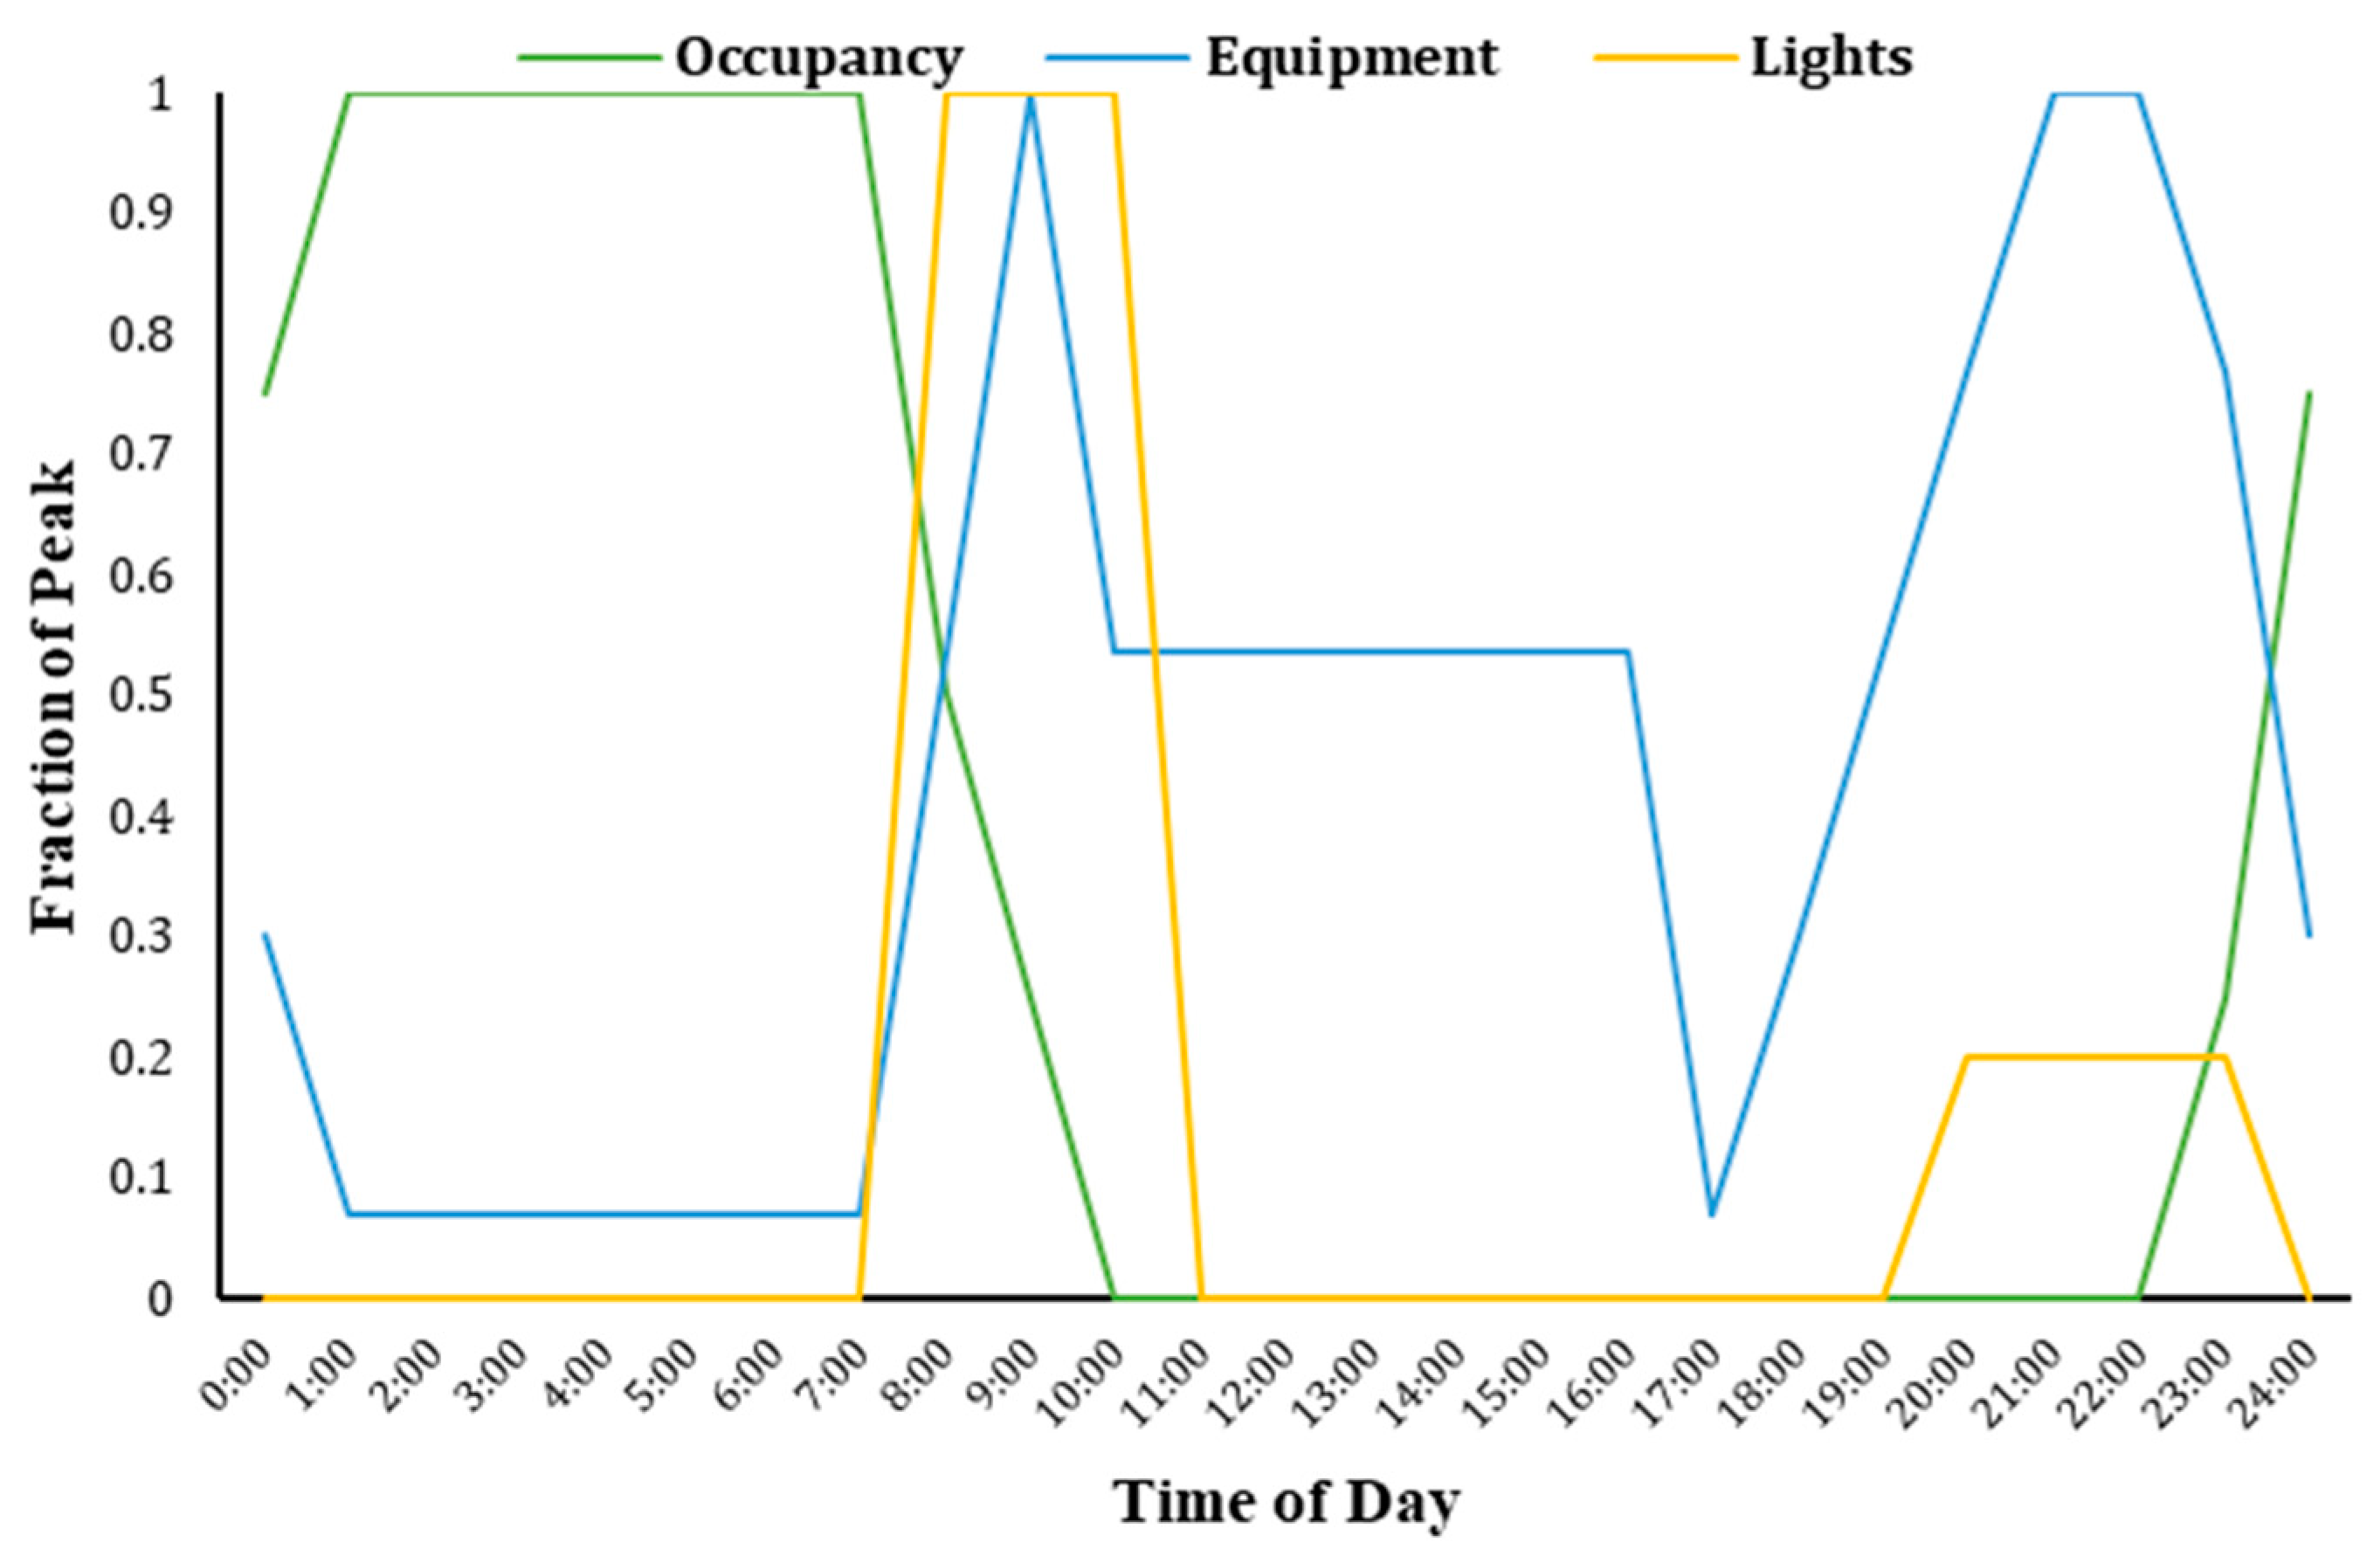
Table 1 summarises the model inputs. The Egyptian Residential Buildings Energy Code (ERBEC) [32], along with the ASHRAE standards [33], were used to define those inputs. The operation and occupancy schedules used in the model are depicted in Figure 4.
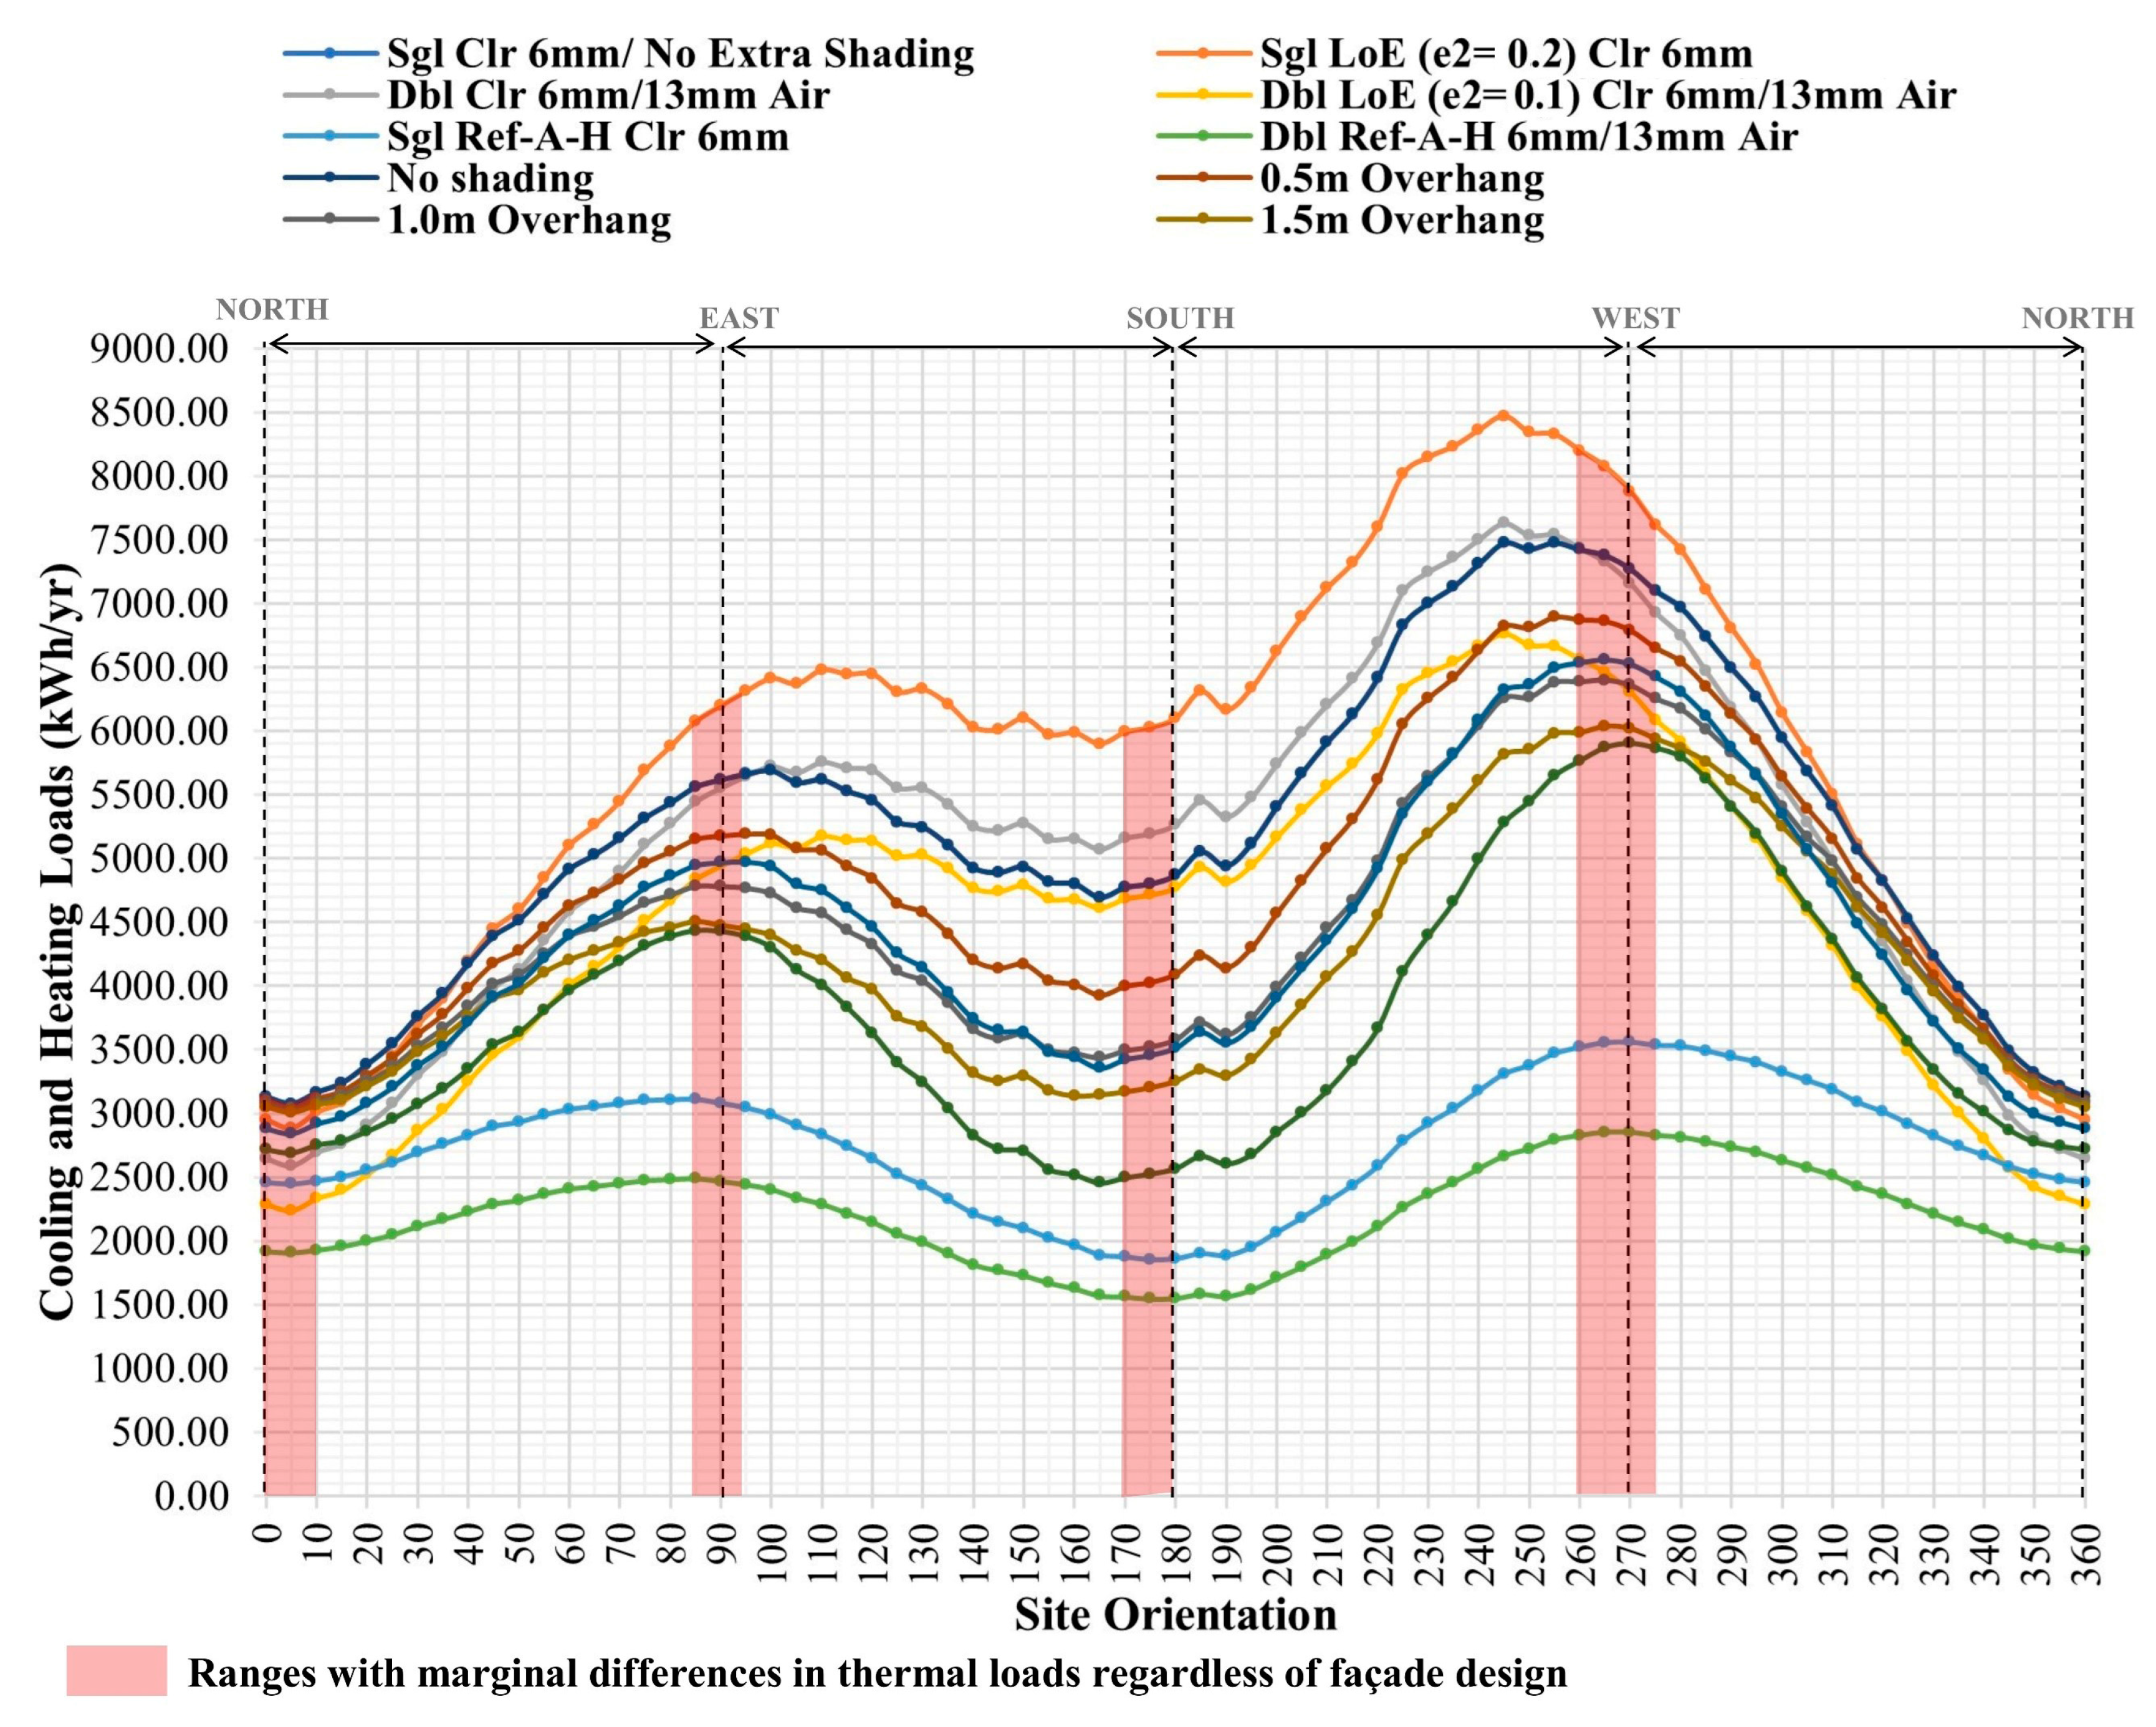
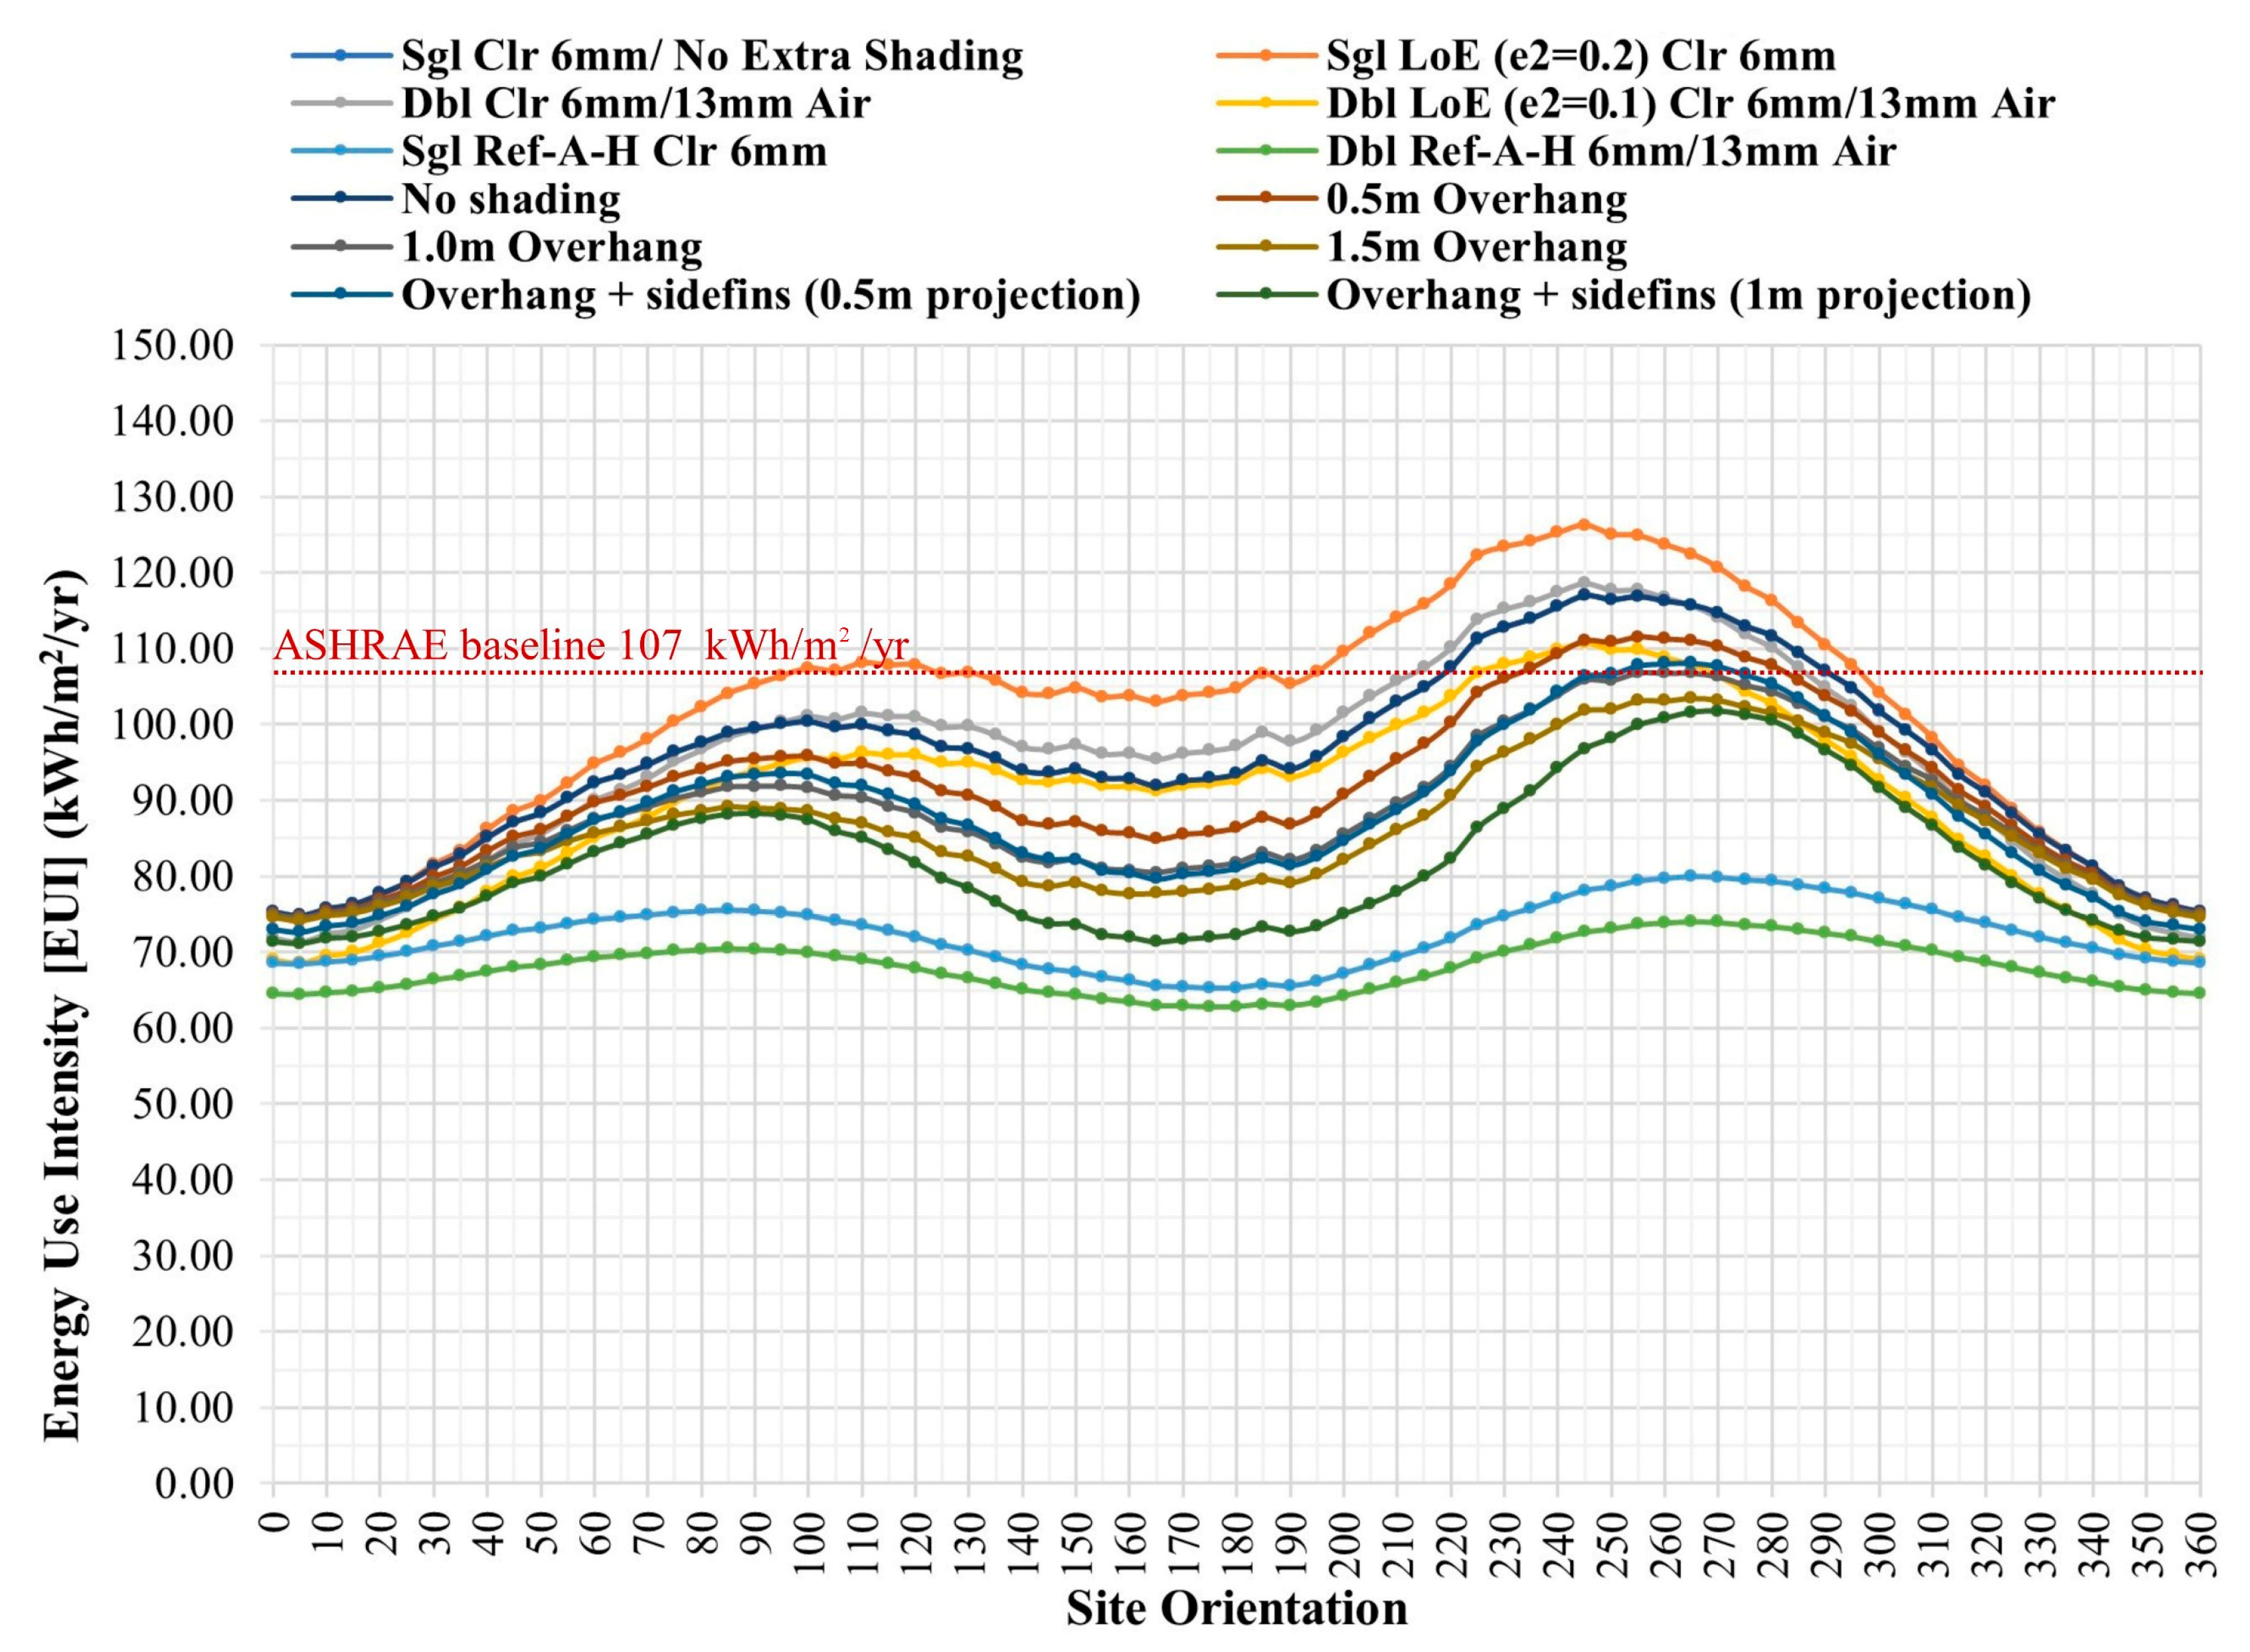
Six different types of window glass were tested as aperture treatments: single; single low-e; single reflective; double; double low-e; and double reflective glass. The properties of the glass types examined in this study are listed in Table 2. The thermal transmittance of the glass types is inserted as is in the simulation engine, and it inherently considers these convective heat transfer coefficients. The thermal properties of the examined glass types are based on the glazing options built-in DesignBuilder materials library. These analysis settings allowed for the creation of design curves showing the energy consumption associated with each design option when the site orientation is changed from 0° to 355° with a 5° step change in the orientation during each run.
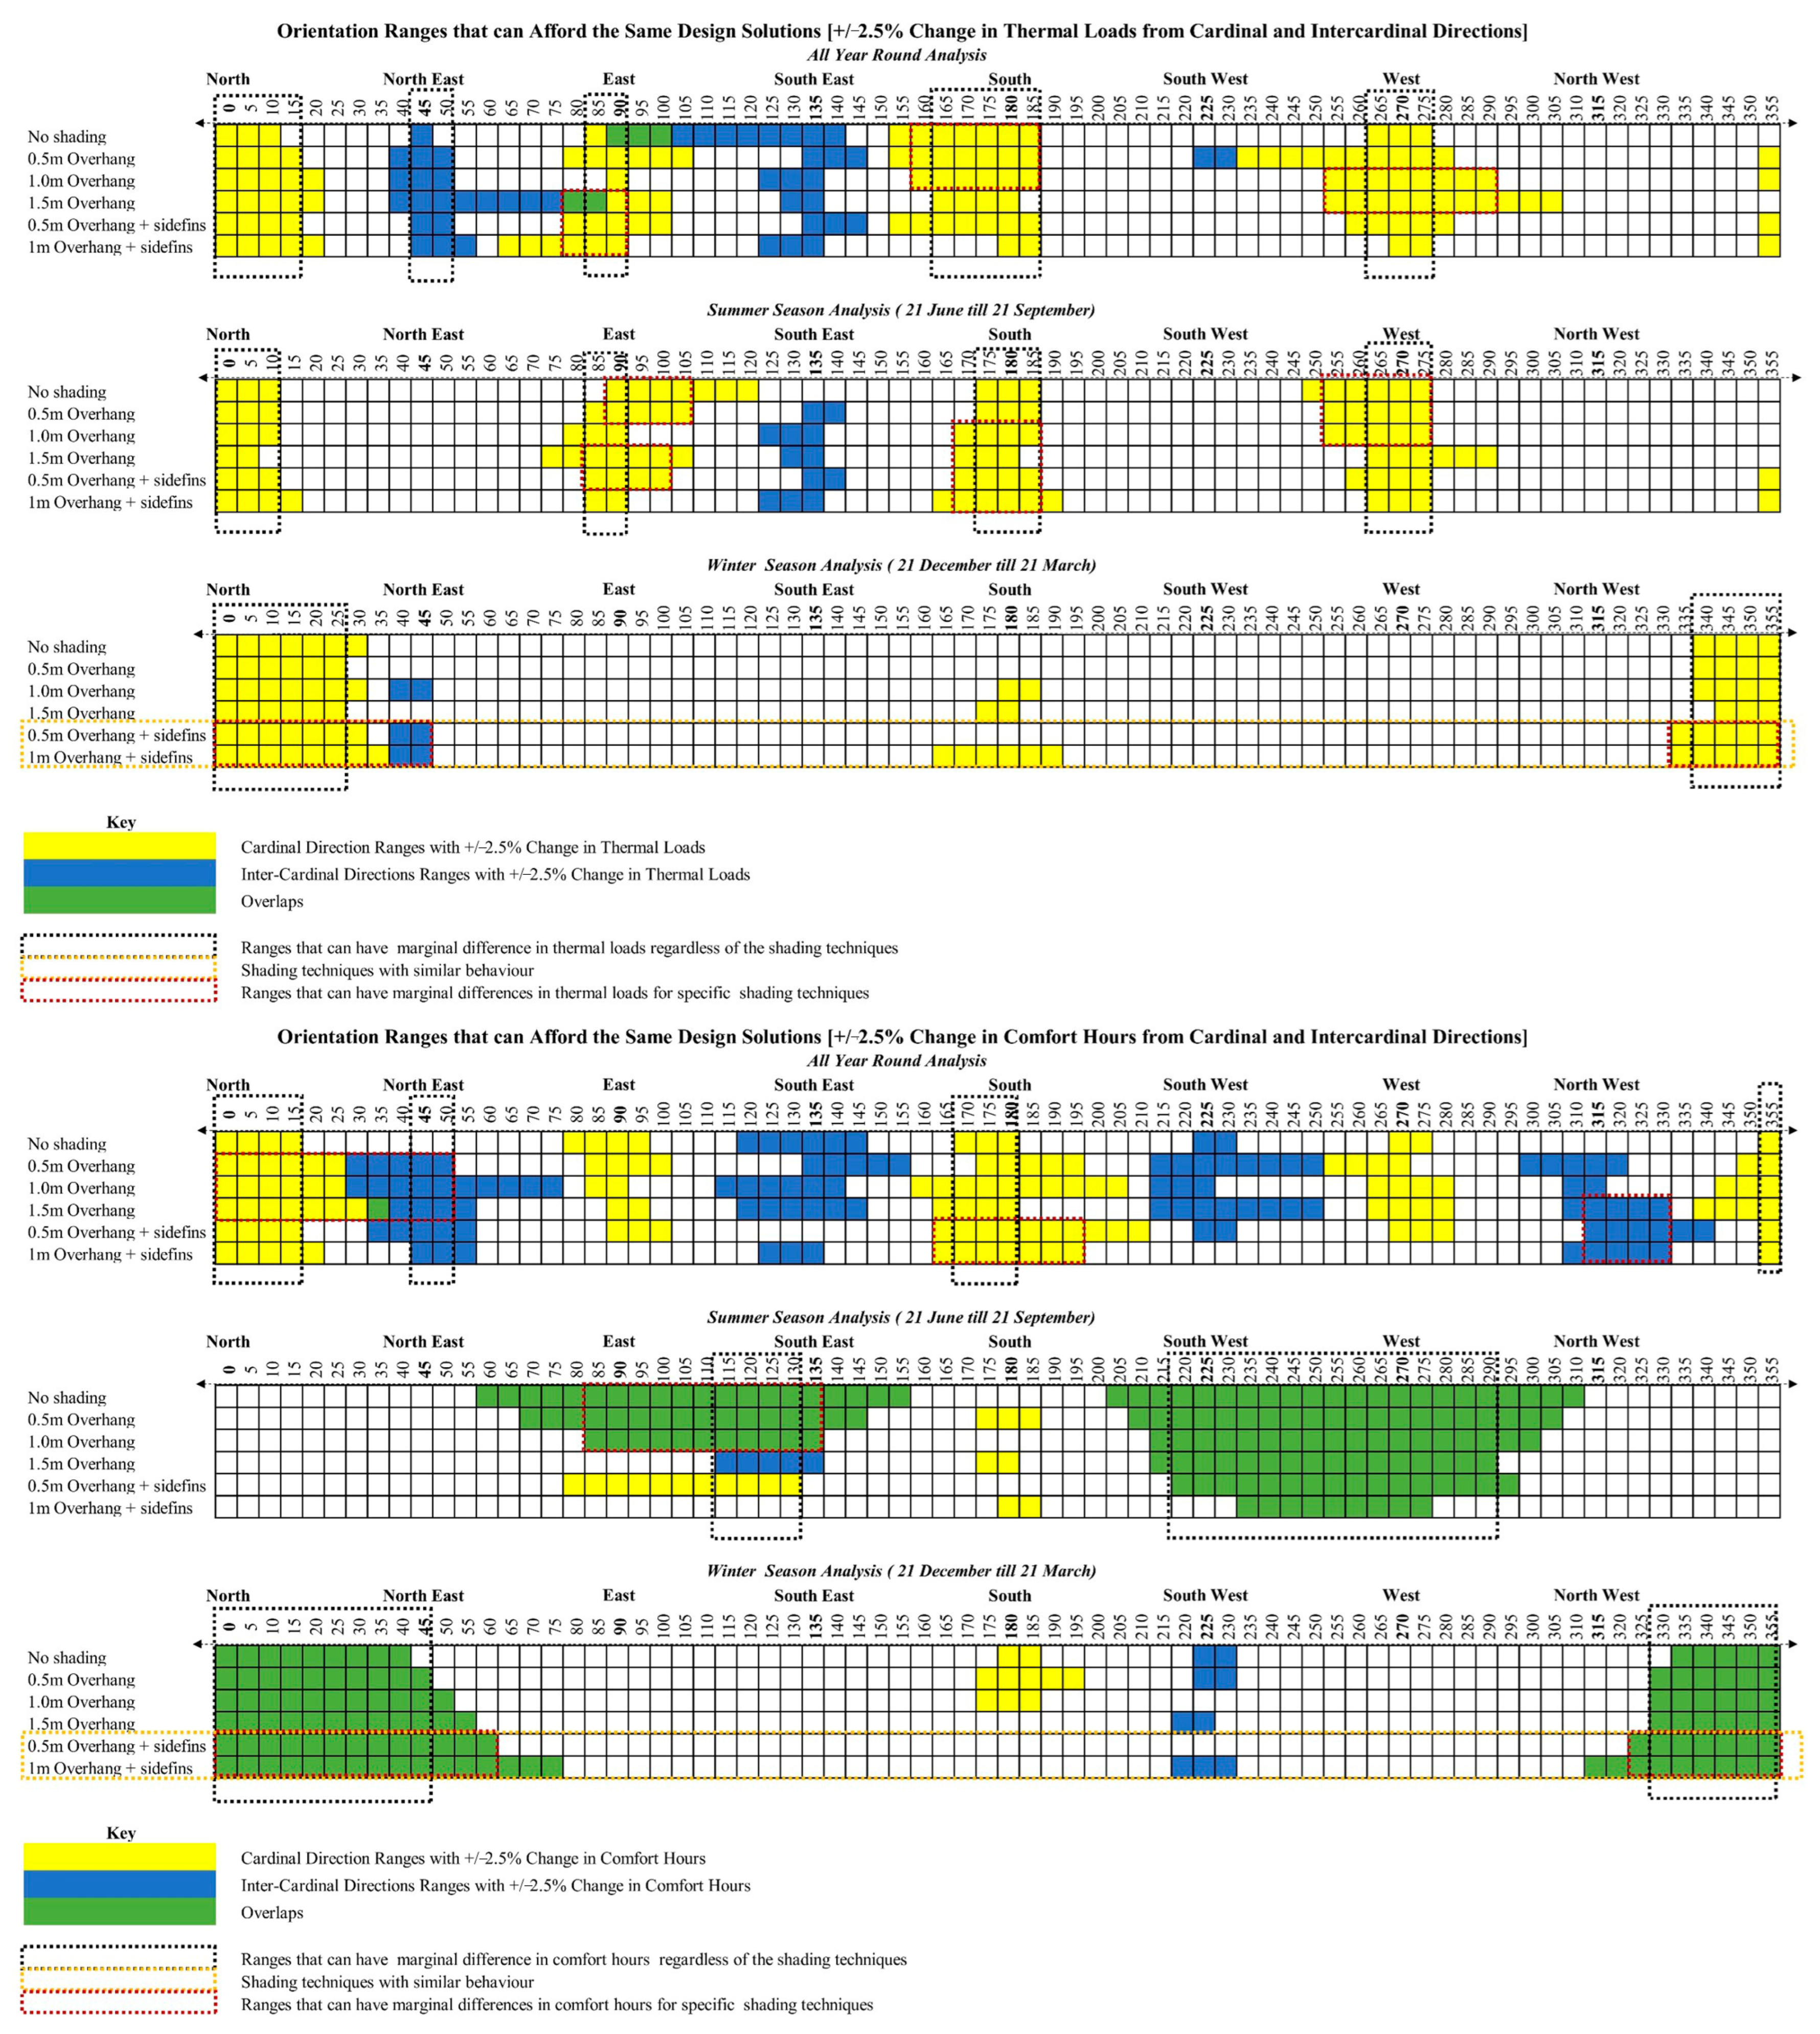
Similarly, various shading devices were tested for different façade orientations, including 0.5 m, 1 m, and 1.5 m window overhangs, as well as 0.5 m and 1 m overhangs with side fins. These are illustrated in Figure 5.
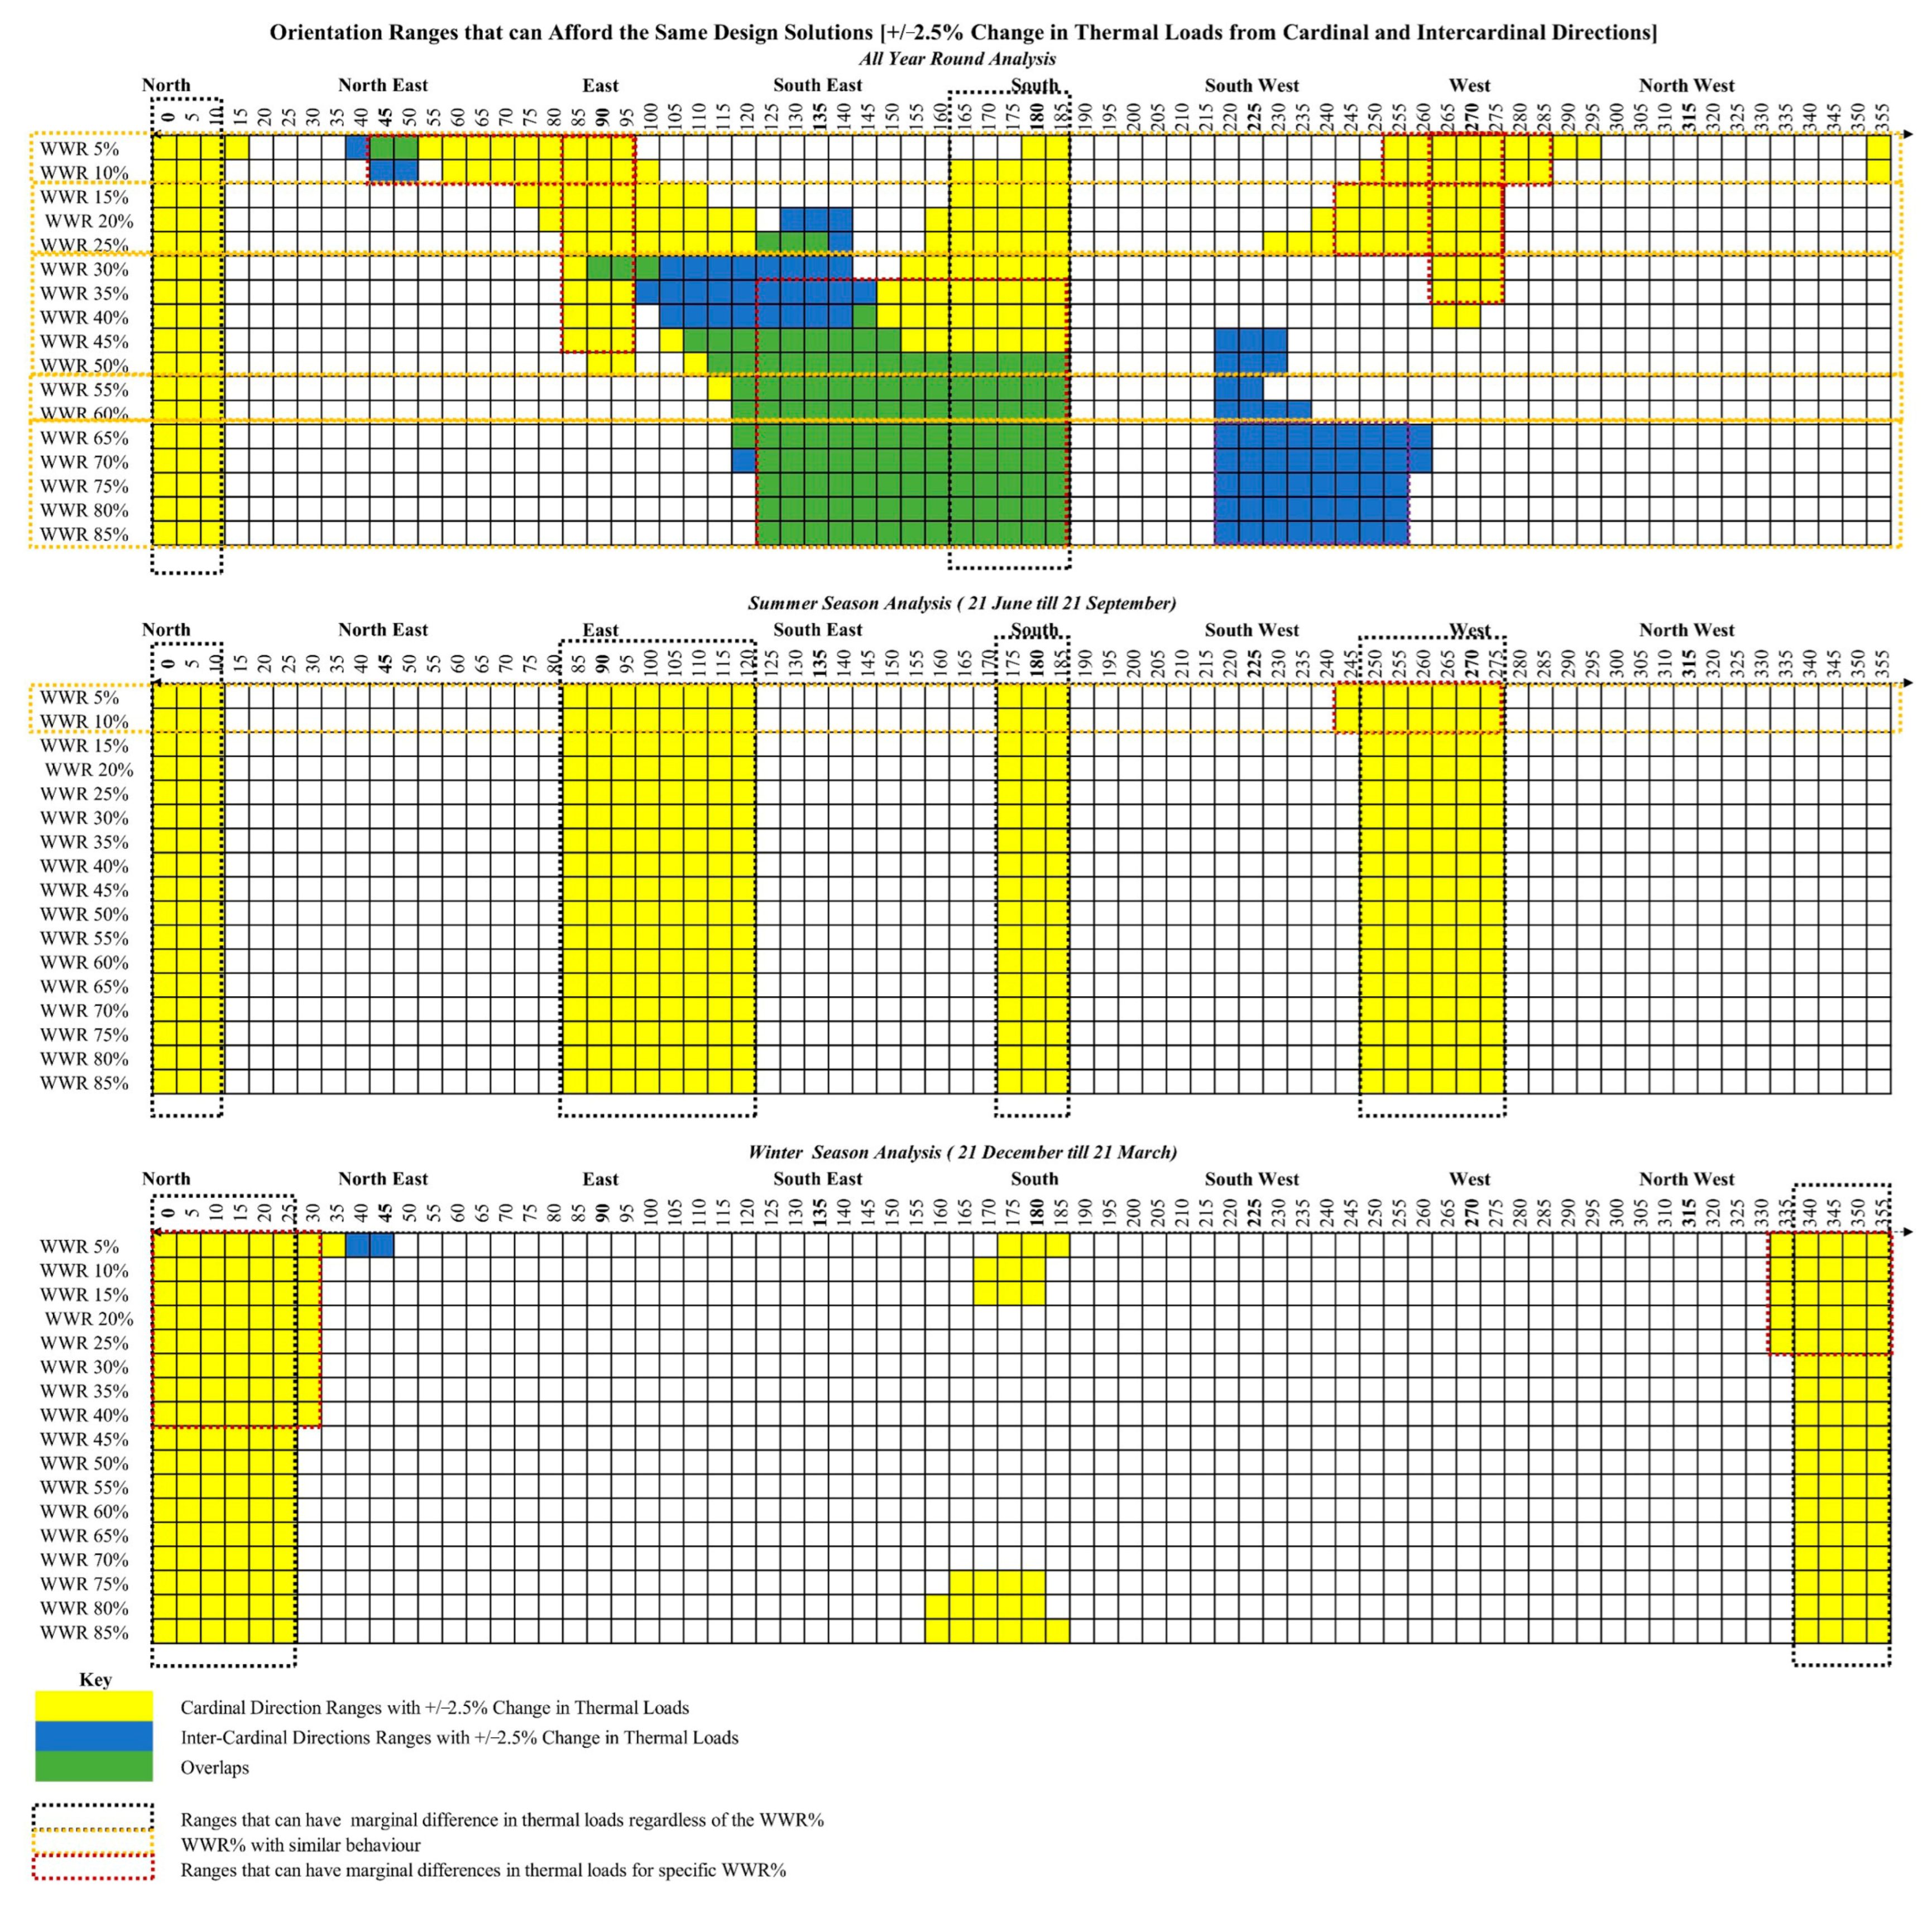
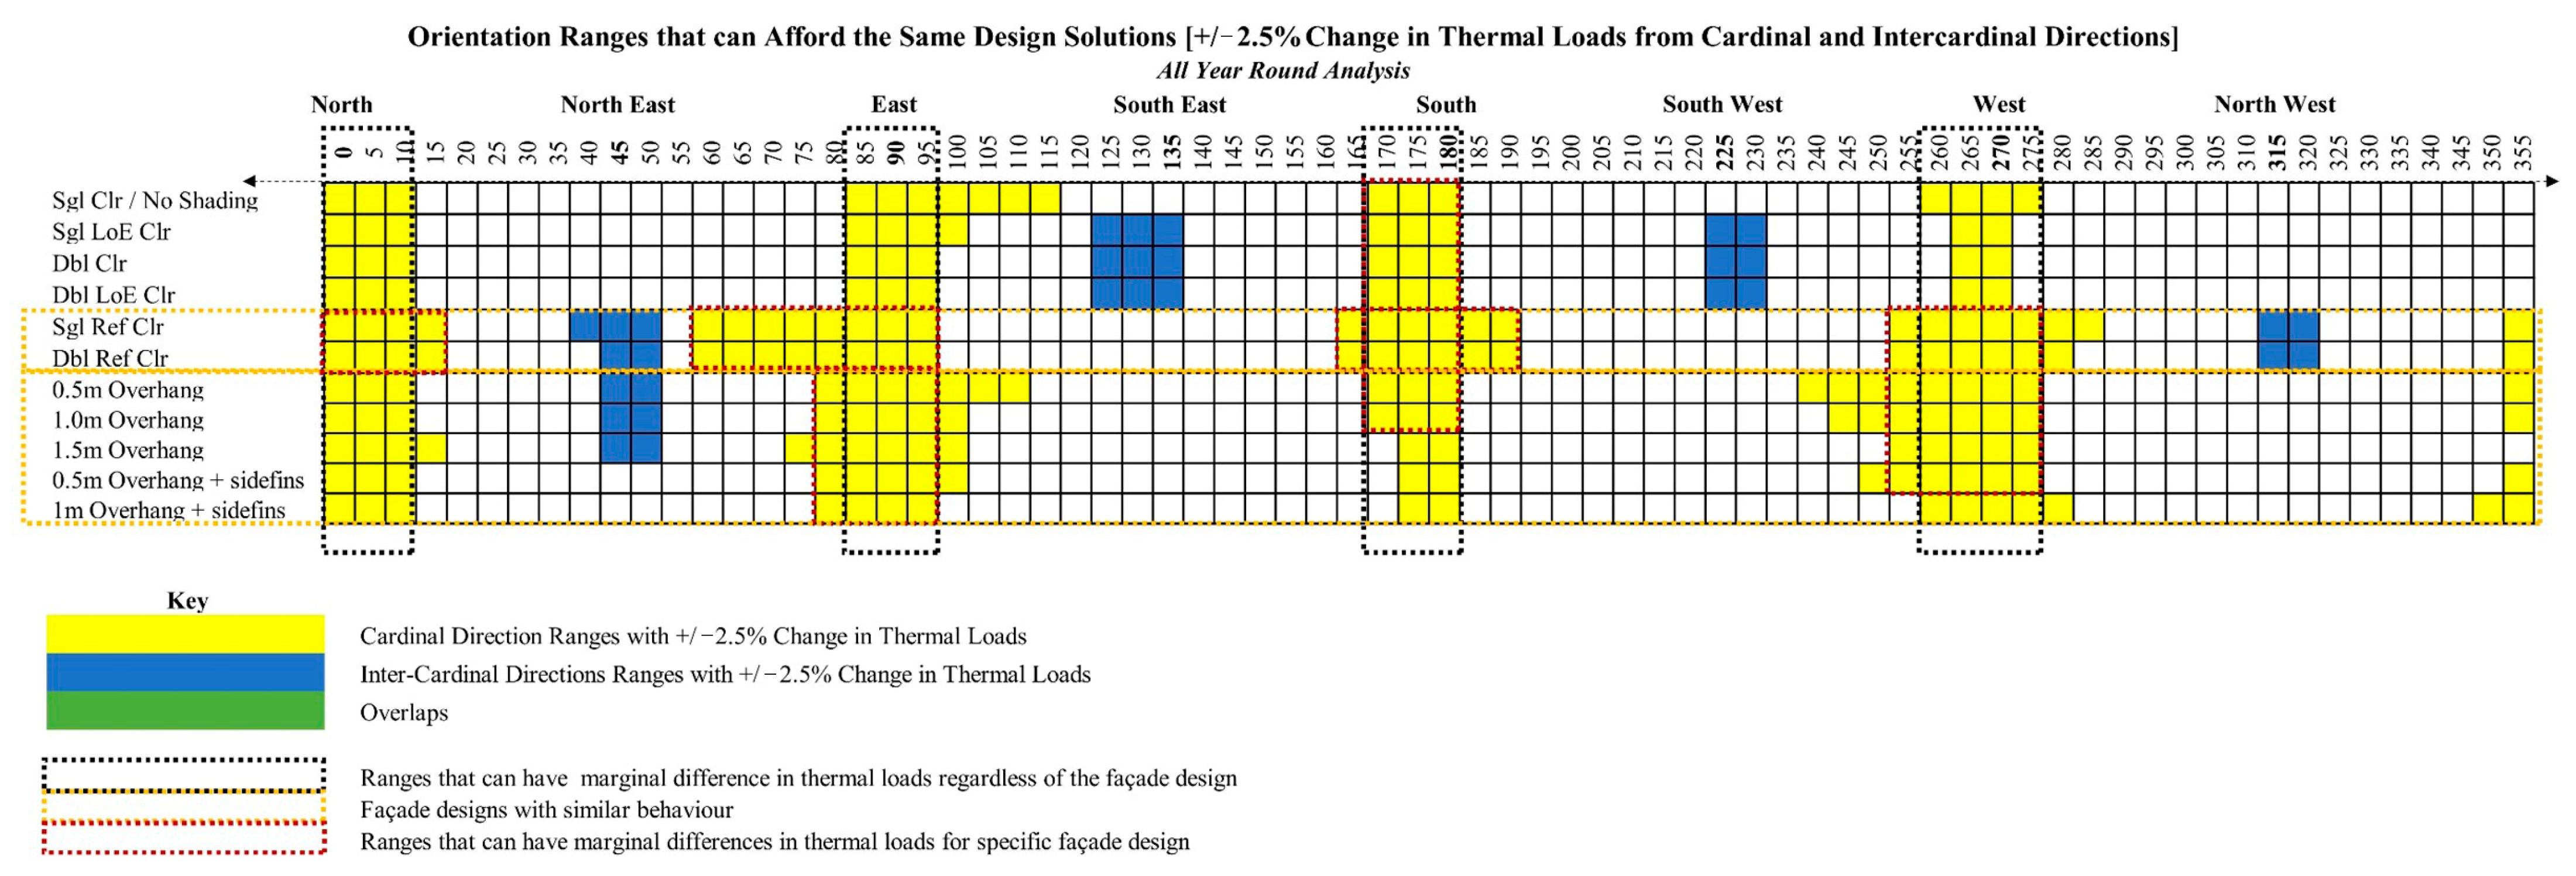
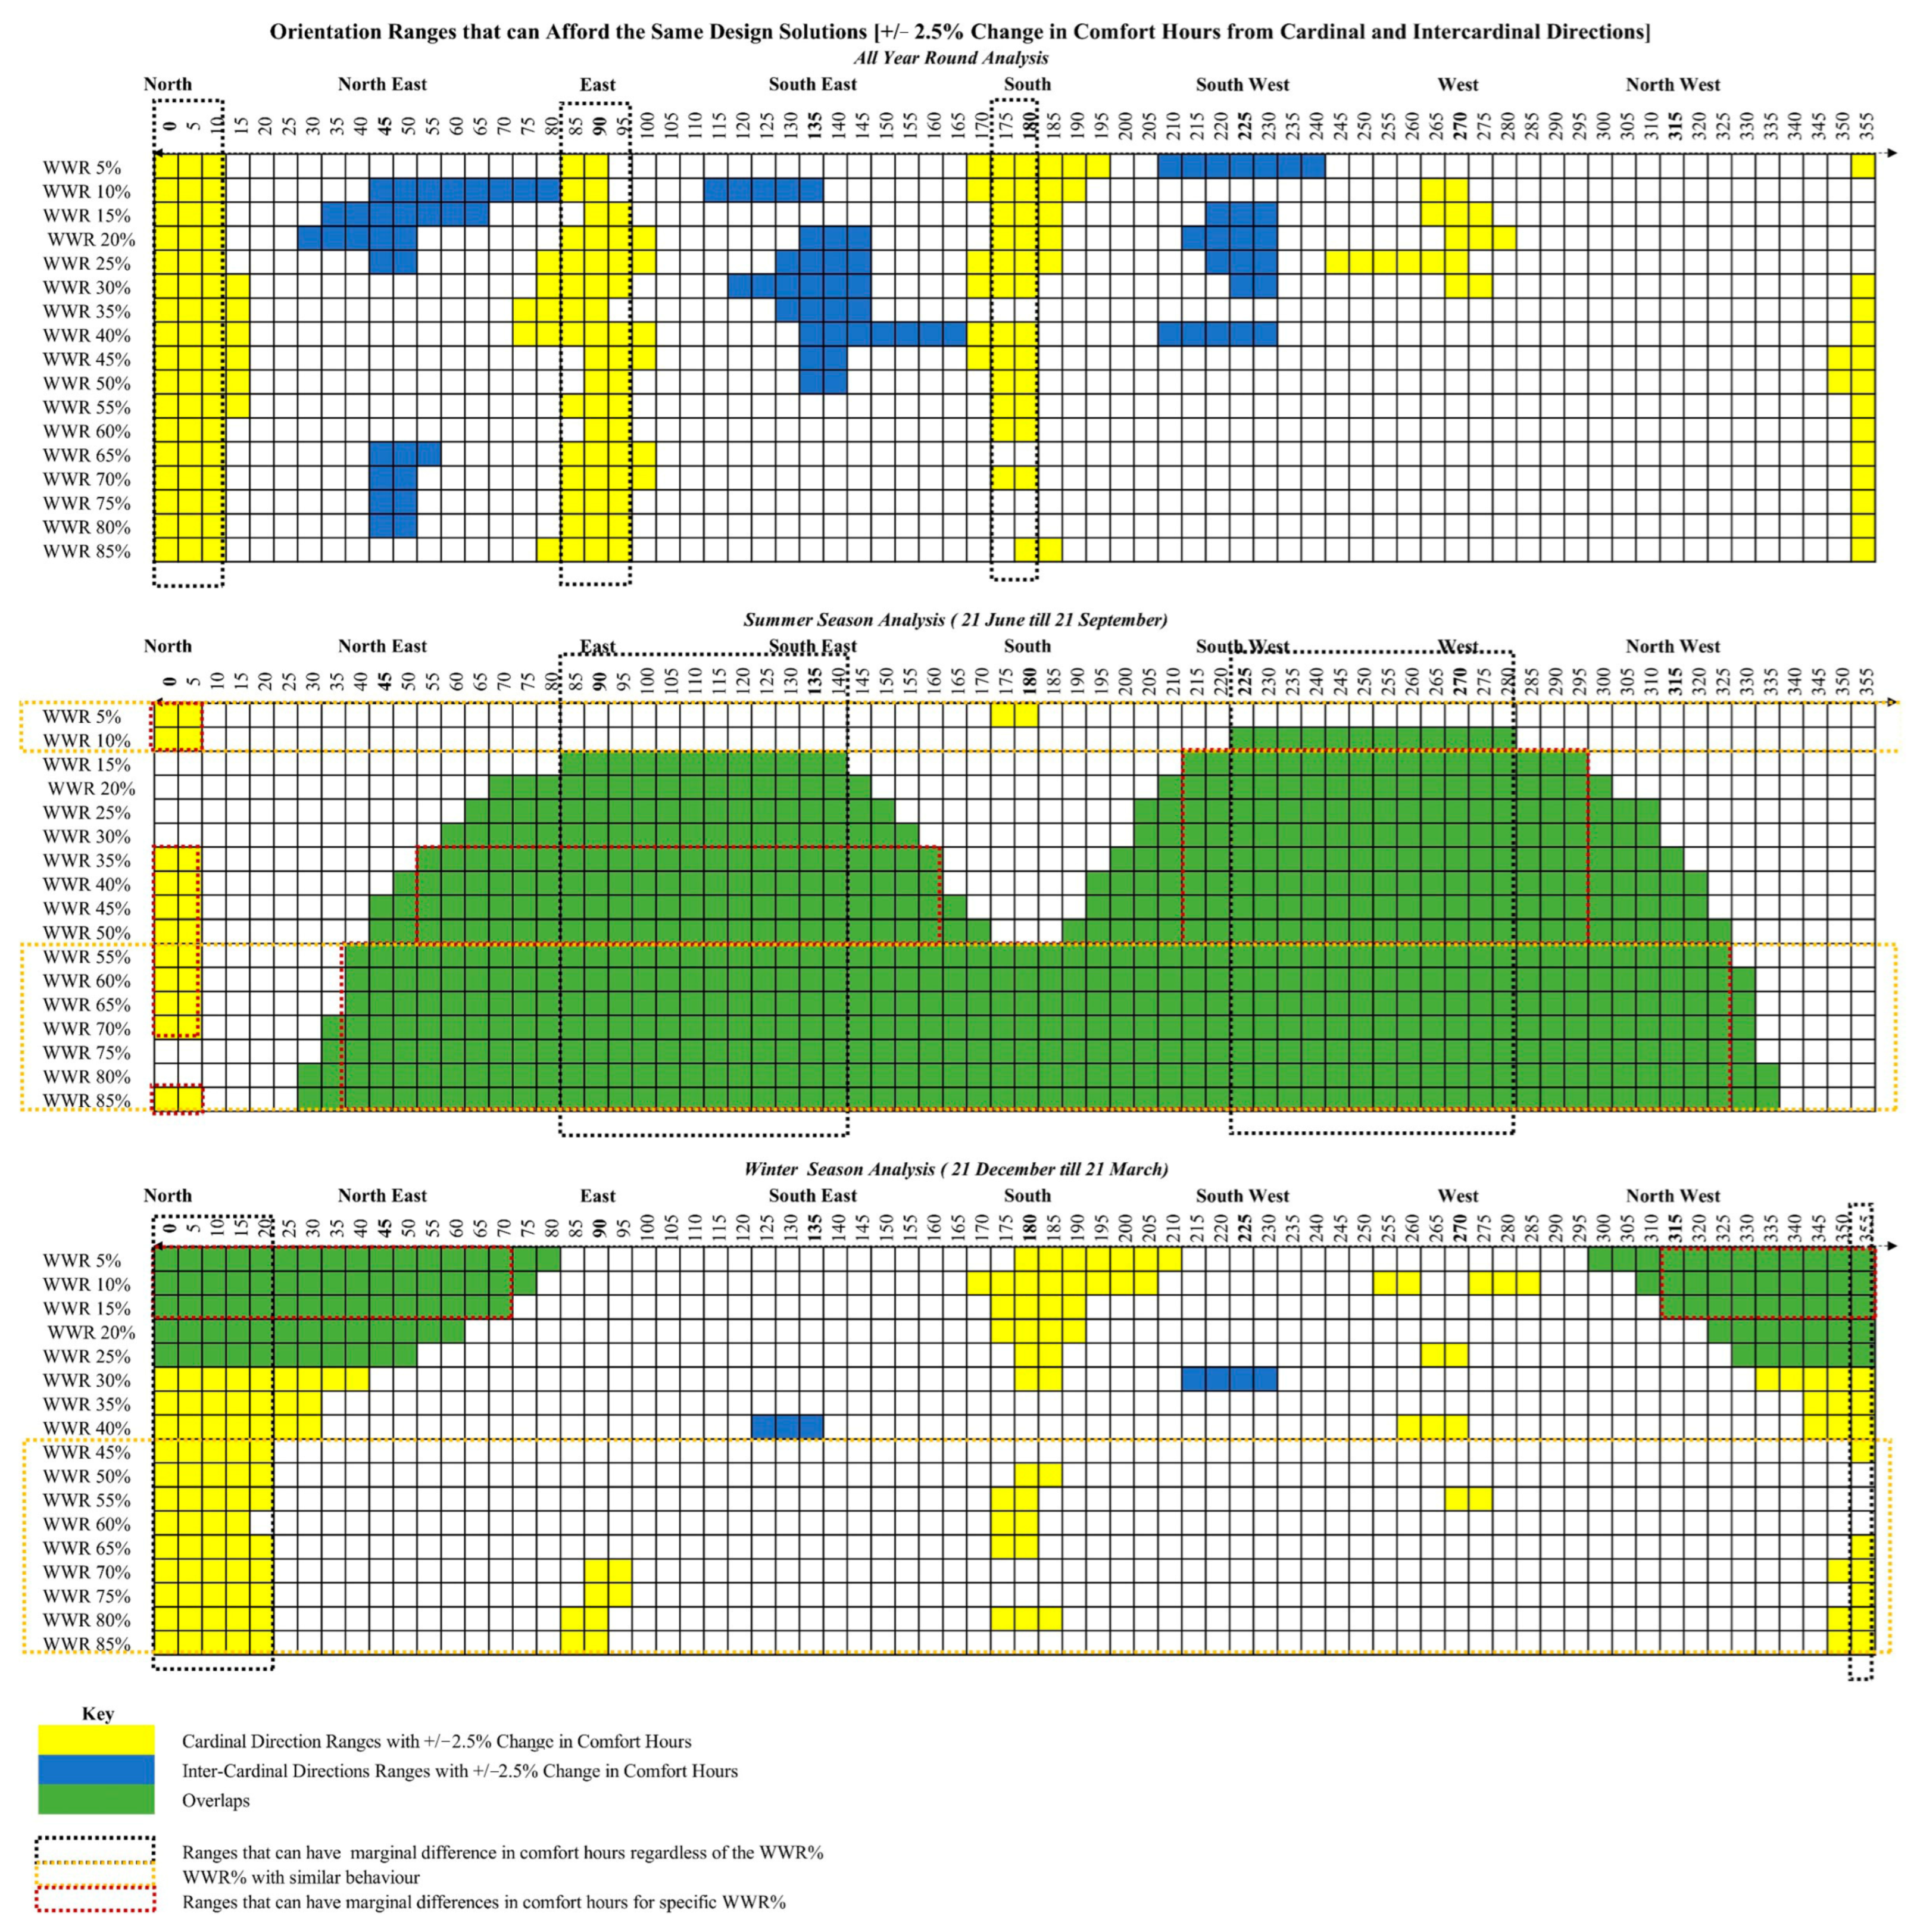
To arrive at the range of orientations where the difference in the thermal loads can be considered marginal, a 5% difference in total load values was considered acceptable. The 5% deviation value was based on Haves et al.’s [37] conclusion that there was a 5% difference between the Energy Plus thermal load predictions and the real-life measurements of the FLEXLAB test facility of the Lawrence Berkeley National Laboratory for daytime averages and most of the energy load in the hot arid climate of this study is for cooling during daytime hours. A similar percentage was also depicted by Eskin and Türkmen [38] when it came to comparing simulated cooling loads of office buildings with actual measurements of an existing edifice located in Istanbul. In the following sections, the orientations where the change in thermal loads is ±2.5% from cardinal and intercardinal directions, which can add up to the acceptable 5% difference between the Energy Plus thermal load predictions and the real-life measurements, were determined. This assists in highlighting the ranges that have relatively similar thermal loads as well as the orientations ranges that can afford the same design solutions. The same logic was used to arrive at the range of orientations where the difference in comfort hours was marginal if the room was naturally ventilated. It should be noted that the ASHRAE 55 adaptive comfort model is based on the relationship between the outdoor mean prevailing temperatures and the operative temperature of a space and is used in this part of the analysis to define acceptable thermal environments only when no mechanical cooling or heating systems are used and when occupants’ metabolic rates are between 1.0 and 1.3 and are free to dress according to indoor and/or outdoor thermal conditions within a range of least as wide as from 0.5 to 1.0 [
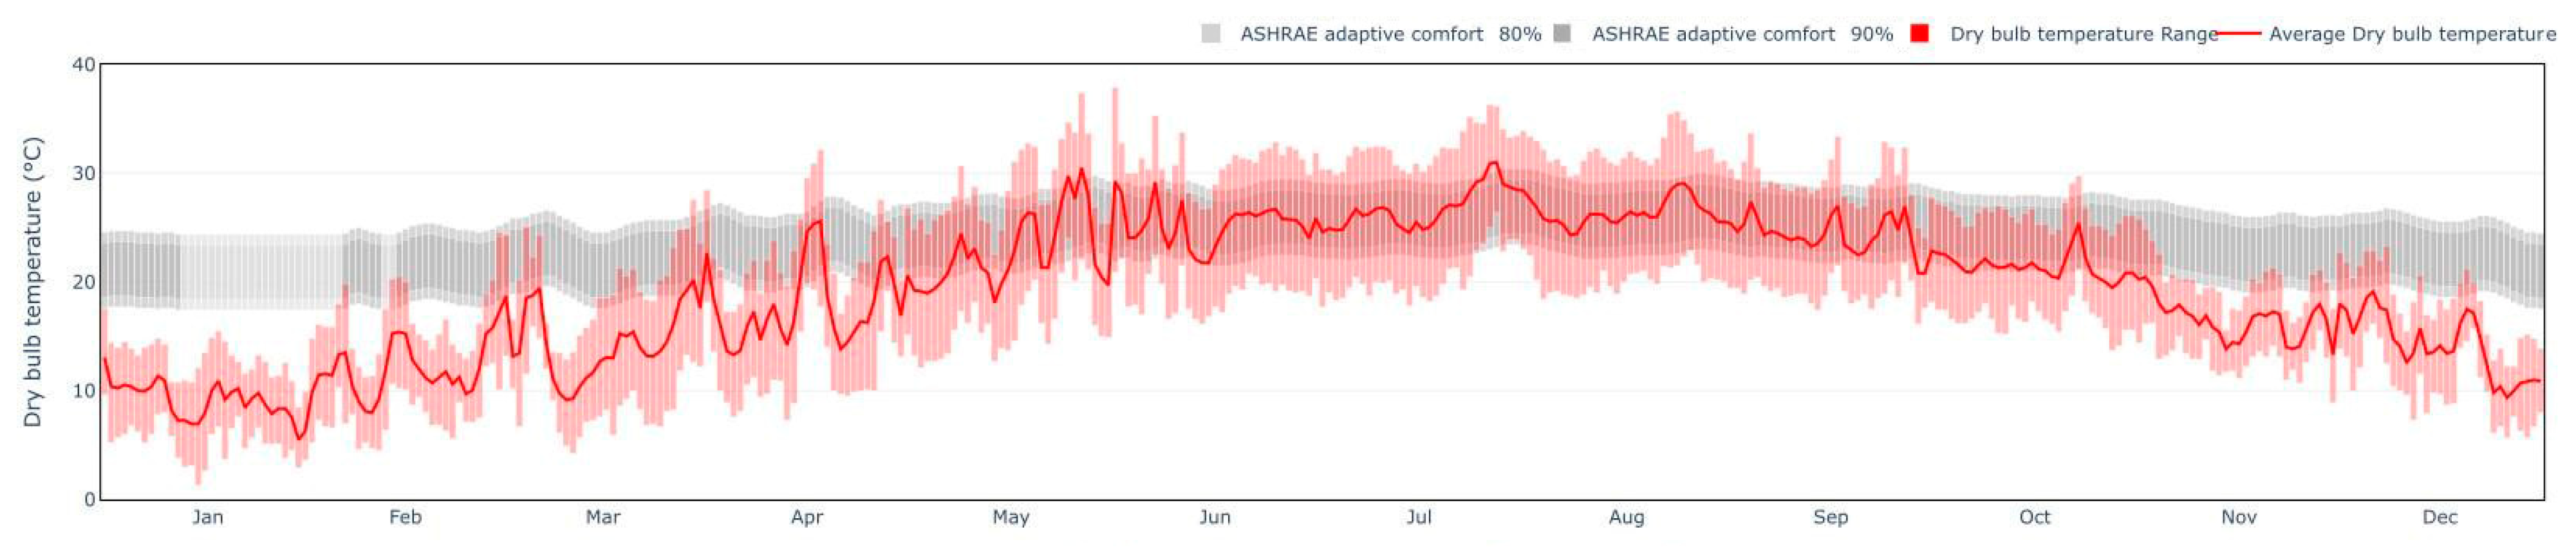
39]. Moreover, only when the average outdoor temperature is greater than 10 °C and lower than 33.5 °C thermal comfort hours are calculated [39]. Figure 6 shows the temperature difference between outdoors and comfort conditions for the examined climate.
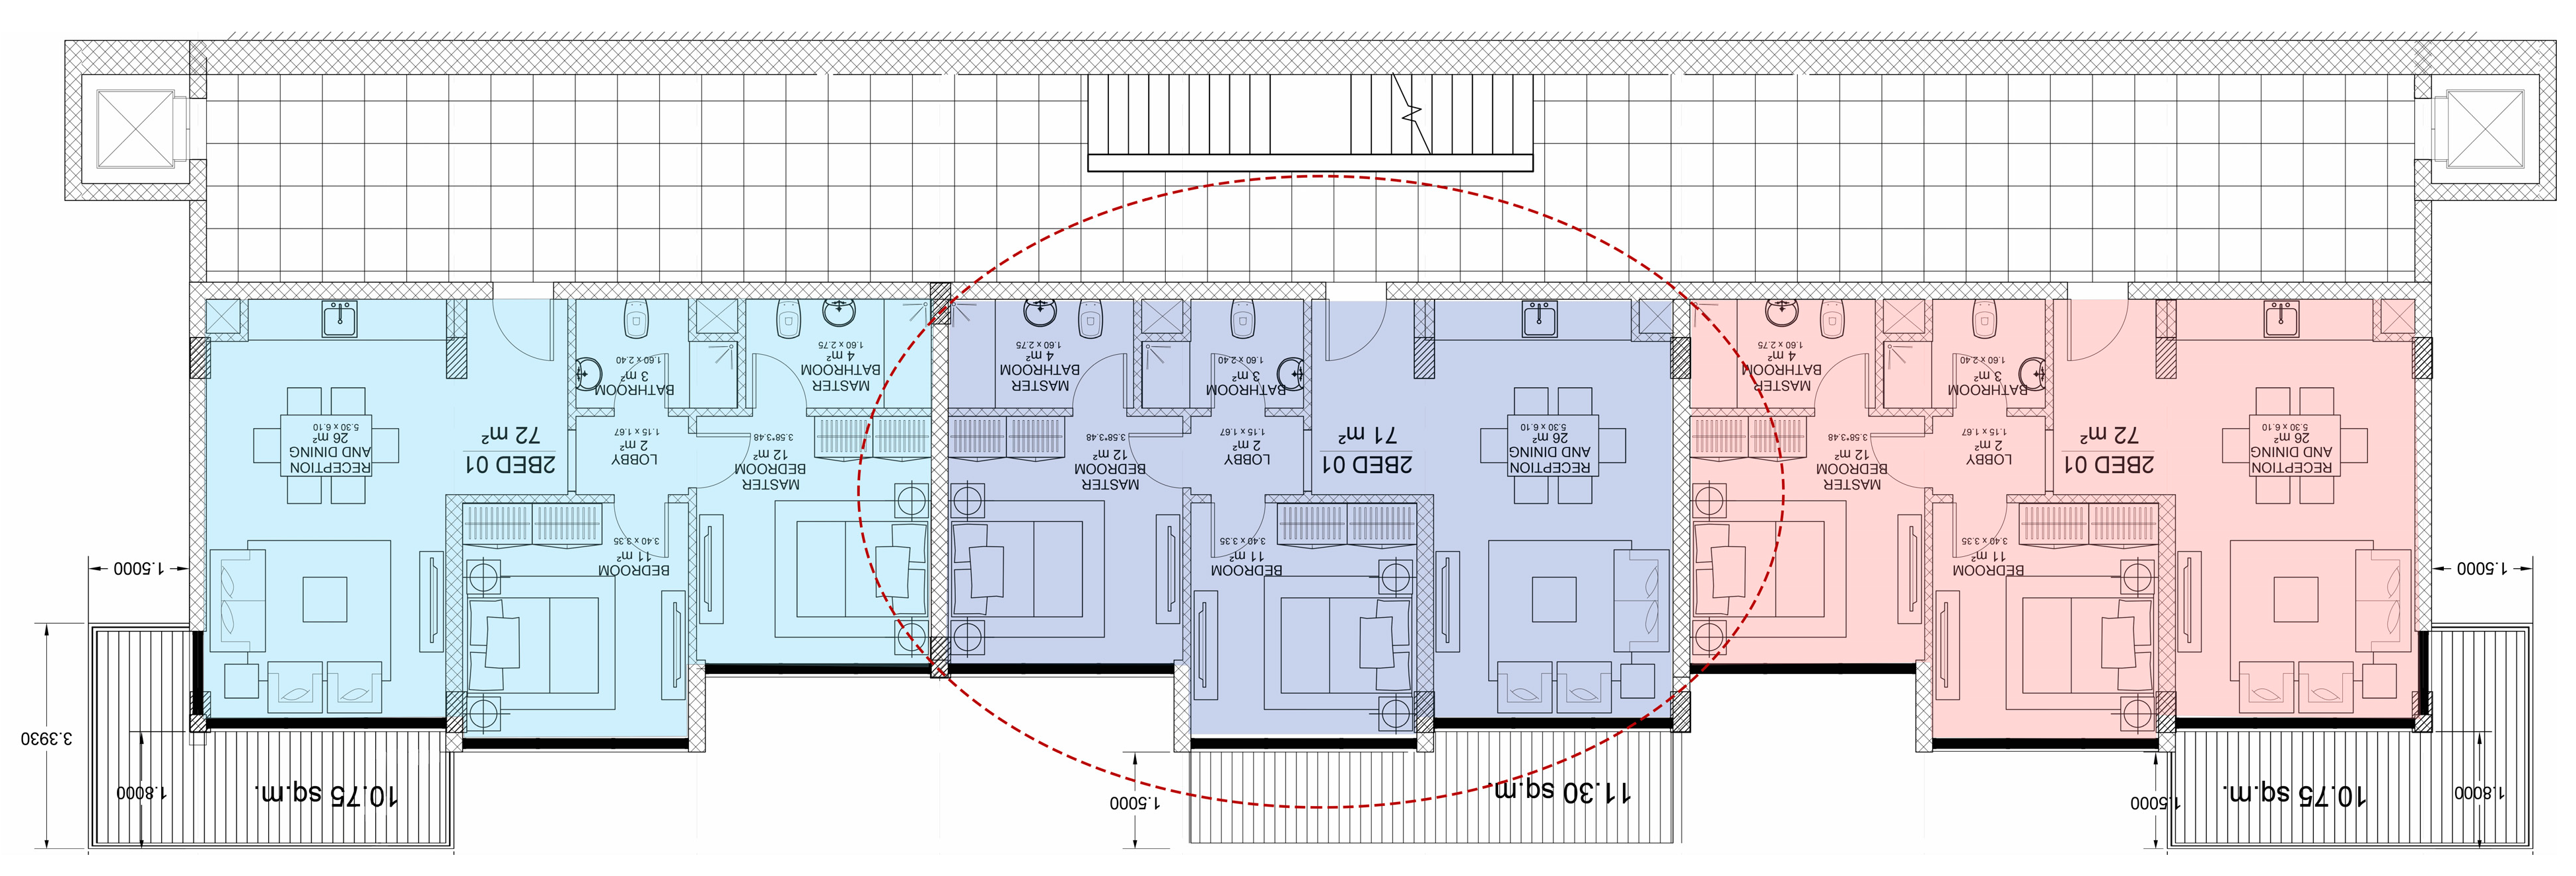
In stage 2, the same analysis was conducted using the data set of a real residential project undergoing construction along the coast of the Red Sea in Egypt. The analysis was conducted on an apartment building prototype, as seen in Figure 7. The typical floor plan of the building is illustrated in Figure 8. Apartment 2 on level 2 was used for further investigation. The apartment was chosen since it had 5 adiabatic facades similar to the room tested in stage 1 of this study. Meanwhile, the gross WWR ratio for the whole apartment was 68.35%. The glazing of the base case was assumed to be single glazing. According to the project master plan, the same prototype has been repeated with slight changes in the orientation from the north direction, as seen in Figure 9. The Energy Use Intensity (EUI) of the apartment when different apertures designs were applied was calculated and compared to the ASHRAE baseline indicated for single-family attached units/apartments (5+ units building), which was equal to 385 MJ/m2/year or 107 kWh/m2/year [40].
The same simulation inputs and weather files, indicated in Table 1, were used to run the analysis on the apartment building in Stage 2. The apartment building investigated applied a mixed ventilation approach where both natural ventilation and HVAC were used. The project was designed with the intention that it would attract occupants all year round and not seasonally. The research stages and framework used in this study in both stage 1 and stage 2 are summarized in the diagram illustrated in Figure 10.

3. Results

The results of the parametric analysis performed in stages 1 and 2 of this research are presented in this section. Thermal loads and comfort hours for a 3 m × 3 m × 3 m room were determined in stage 1. When natural ventilation was insufficient for human comfort in scenario A, mechanical ventilation was implemented, and the thermal loads for the inspected room were recorded. Only natural ventilation was used in scenario B, and the comfort hours were noted. This study was carried out under three different occupancy scenarios: year-round, summer season, and winter season. Thermal loads and comfort hours were plotted against various orientations, and the impact of various façade treatments on the thermal performance of the examined room was evaluated. In stage 2, the same analysis was applied using data from a real-life case study, and the results from both stages 1 and 2 were compared. The real-life case study provided valuable insights into actual buildings’ thermal performance, allowing us to validate our findings from stage 1.

3.1. Stage 1 Analysis Results for the Typical 3 m × 3 m × 3 m Room

3.1.1. Glazing Variations

The thermal loads (heating and cooling) associated with different glazing types at different orientations when the occupancy is all year round are illustrated in Figure 11. The figure illustrates that the highest thermal load values are mostly in the southwest direction regardless of the glazing type. It also highlights that there are marginal changes in thermal loads from 0° to 10°. This range extends from 355° to 10° for reflective glazing. This is because the thermal load changes are within ±2.5% from the north direction. When the façade orientation was within 85–100°, the thermal loads changed by ±2.5% or less from the east direction for all glazing types. This means that there is a marginal difference in the thermal performance of each of the investigated glazing types between −5° and +10° from the east direction. This range extends to −30° to +10° from east [60–100°] when reflective glazing is implemented. The range could also be from 85° to 140° (i.e., −5° from east to +5° from southeast) for non-reflective glazing. Looking at the south direction, it was noted that when the façade orientation was within 170–185°, the thermal loads changed by ±2.5% or less for all types of glazing. This also means that the same glazing type can effectively work within −10° to +5° from the south direction with a marginal difference in performance. The range increased from −25° to +5° from the south direction for non-reflective glazing [155–185°], as illustrated in Figure 12. The same trend also appears within −5° to +5° from the west direction [265–275°] and extends from 255° to 285° for reflective glazing. It could also be deduced that the range of angles that can have the same façade design is larger when reflective glazing is implemented. Out of the investigated glazing types, the double reflective glazing offered the best solution to reducing the investigated room thermal loads when the occupancy and operation of the room are all year round.
The shape of the plotted curves for the cooling loads during the summer season analysis mimics that of the all-year-round thermal loads. This is justified by the fact that in the hot, dry climate of Suez City, most of the thermal loads come from the energy needed to cool the buildings during the summer. Like all year-round simulations, out of the examined glass types, reflective glazing was the most effective in reducing the cooling loads in all the tested orientations during the summer season; they are also the least effective when it comes to cutting down the heating loads during the winter. Figure 12 highlights that the changes in cooling loads are less than ±2.5% from the cardinal or non-cardinal direction when the orientation changes are +10° from the north, from −5° to +30° from the east, ±5 from the south, and from −20° to +5° from the west for a seasonal project that is mostly occupied during the summer. Architects can provide one effective façade design solution without worrying about re-running the analysis for each change in orientations within the following ranges: [0–10°]; [85–120°]; [175–185°]; and [250–275°]. Figure 11 and Figure 12 also show that the heating loads are at their maximum for the investigated test room when the orientation is close to the north. The changes in heating loads for all the tested glazing types are less than ±2.5% between 340° and 30°. This means that one glazing type can effectively work within −20° and +30° from the north with a marginal difference in thermal loads.
Moreover, Figure 11 illustrates the comfortable occupied hours according to the ASHRAE 55 adaptive comfort model when different glazing types are applied if the test room is assumed to be naturally ventilated. For the examined scenario, single reflective glazing is the most effective regardless of the orientation if the objective is to achieve the best comfort all year round. Both single and double reflective glazing can also result in thermal comfort regardless of the orientation during the summer scenario and are also effective during the winter only for orientations between 175 and 200°. The percentage change in the comfort hours for the whole year analysis was less than ±2.5%, +10° from the north, −10° from the east, ±5° from the southeast, and −10° from the south regardless of the glazing type, which means that within the following ranges: [0–10°]; [80–90°]; [130–140°]; and [170–180°], one safe façade design for each range can be applied without worrying about redesigning the façade to achieve thermal comfort all year round for any changes within these orientations. These ranges can change if the designers intend to unify façade design for seasonal residential projects. A case in point is that there is a marginal difference in comfort hours for the following ranges: [0–5°]; and [225–275°], i.e., from −45° from the west to +5° for all glazing types for summer analysis. Meanwhile, marginal changes in comfort hours are noted for ranges between 335° and 40°, i.e., from −25° to +40° from the north for the winter analysis.

3.1.2. Shading Variations

The analysis was also conducted for alternative shading variations. The thermal loads associated with alternative shading techniques at different orientations are illustrated in Figure 13. The figure illustrates that the highest thermal loads are in the southwest and west directions. The diagram further highlights that for the all-year analysis, the percentage change in thermal loads from the north within the ranges of [0–15°] was less than ±2.5% regardless of the shading type used. This range extends from −5° to +20° from the north when overhangs larger than or equal to 1 m are implemented. A detailed examination of the thermal load values revealed that small diversions in the façade orientation resulted in marginal load changes. In the east direction, when the façade orientation was within 85–90°, the thermal loads changed by ±2.5%. This means that the same façade design can effectively work within −5° from the east direction with a marginal difference in performance. Looking at the south direction, it was noted that when the façade orientation was within 165–185°, the thermal loads changed by ±2.5% or less from the south for all the suggested shading techniques. This also means that the same shading system can effectively work within −15° to +5° from the south direction with a marginal difference in performance. The same trend was further noted from 265° to 275°, i.e., from −5° to +5° from the southwest direction as indicated in Figure 14. When it comes to the summer analysis, the cooling load graphs for the different shading options take a similar shape to the all-year analysis graph, where the cooling loads are also the highest in the southwest and west directions. The graph further indicates that there is a marginal change in the cooling loads for all the investigated shading variations within the following orientations of [0–10°], [85–90°], [175–185°], and [265–275°]. It should be noted that within those ranges, the percentage change in cooling load was less than ±2.5% from cardinal directions; thus, the best solution in each of those ranges can be unified without worrying about re-running the analysis. Meanwhile, for the winter season, the maximum heating loads needed are in the north direction and are least required in the south. The performance of all the investigated shading techniques is similar, specifically near the north. The percentage change in heating loads was less than ±2.5% for angles between 340° and 25°, which means that the heating loads for the buildings, whether they had shading or no shading, were marginal for orientations that were from −20° to +20° from the north.
When only natural ventilation was applied, the comfort hours for the different shading devices were investigated. The larger the overhang, the more comfort hours are recorded for the year-round and summer analyses. The opposite is true for the winter analysis, where the highest comfort hours for all the investigated shading techniques are in the south. The comfort hours during the summer season for all orientations are very few. Consequently, one can deduce that most of the comfort hours recorded in the all-year-round analysis most likely occur during the spring and autumn seasons. Upon examining the orientations that can have marginal differences in the comfort hours for each of the investigated shading techniques, it can be determined that the comfort hour changes were lower than ±2.5% from cardinal and intercardinal directions for all the investigated shading techniques between ranges of 355° and 15°, 45° and 50°, and 170° and 180°. As for summer analysis, orientations angles between [115–130°] and [220–290°] have marginal changes in cooling loads for each of the investigated shading techniques. This means that the best shading technique in each of those ranges can be unified. Similarly, during the winter season, the heating load changes were lower than ±2.5% from the north direction within the ranges [330–45°], which means that regardless of the shading technique applied, there is a marginal difference in comfort hours within those ranges.

3.1.3. WWR Variations

The thermal loads associated with different WWRs at different orientations are illustrated in Figure 15. This figure demonstrates that the lowest load values for most WWRs were in the north-facing façade except when the WWR was lower than or equal to 10%. On the contrary, the highest loads were associated with the southwest direction. It became clear that some type of solar control method was needed for large WWRs% in all orientations except the north façade (the equatorial façade), which has low thermal loads regardless of aperture size. This can be achieved by the use of different glazing materials, sun shading systems, etc. These design interventions will be extremely beneficial, specifically in the southwest orientation associated with the highest thermal loads. This could be attributed to the harsh desert climate of Egypt (BWh), according to the updated world map of the Köppen–Geiger climate classification, where solar penetration generates excessive cooling loads [42].
Figure 16 elucidates the orientations where the change in thermal loads is ±2.5% from cardinal and intercardinal directions, which can add up to the acceptable 5% difference between the Energy Plus thermal load predictions and the real-life measurements, thus highlighting the ranges that have relatively similar thermal loads, as well as the orientations, ranges that can afford the same design solutions. It was observed that when the façade orientation was between 0° and 10°, the thermal loads changed by ±2.5% or less from the north direction for all WWRs. This means that the same façade design solution can effectively work from 0° up to +10° from the north orientation for all tested WWRs, and thus, all building facades falling within this range can have one common façade design. This range extends from 355° to 10° for WWRs less than or equal to 10%. It could also be noted that this trend of having consistent thermal loads for a range of orientations where the same façade design solution could be applied ceases to exist around the northeast and northwest orientations. When the façade orientation was within [85–90°], the thermal loads changed by ±2.5% or less from the east direction for all WWRs% less than or equal to 50%. This means that the one solution can effectively be applied for angles from −5° to +5° from the east direction for each of the aforementioned WWRs%. This range extends from 45° to 95° for WWRs% of less than or equal to 10%. Moreover, the same façade design solution can also be applied for each of the investigated WWRs in ranges between 165° and 185° (i.e., from −20° to +5° from the south direction). This range extends from 125° to 185° for WWRs% from 35% to 85%. When the façade orientation was within [265–275°], the thermal loads changed by ±2.5% or less from the west direction for WWR% lower than or equal to 35%. This range extends from [255–285°] for WWR% lower than or equal to 10% and from 245° to 275° for WWRs% from 15 to 25%. Consequently, the smaller the WWR, the wider the range of façade orientation angles for each of the investigated WWRs that can have the same façade design treatment as the values for cooling and heating loads for those orientations increase. It could also be deduced that the thermal performance trend across the different orientations when the occupancy is assumed to be all-year-round is similar from WWRs form 0–10%, 15–25%, 30–50%, 55–60%, and 65–85%.
The cooling loads are at their peak during the summer analysis in the southeast and southwest orientations. The percentage change in cooling loads was less than ±2.5% from cardinal and intercardinal directions for the following orientations ranges: [0–10°]; [85–120°]; [175–185°]; and [250–275°]. This means that for any of the investigated WWRs, there is a marginal difference in the thermal performance within those orientations during the summer season. The highest heating loads during the winter season are in the north direction, and the lowest are in the south. The changes in the heating loads for all WWR% are marginal, i.e., less than ±2.5%, when the orientation ranges between 340° and 25°. This means that applying one façade design for each WWR within those orientations can be achieved.
The comfort hours in case the room was only naturally ventilated were investigated in different seasons, as shown in Figure 16 and Figure 17. For all-year-round occupancy scenarios, the highest comfort hours take on two different forms. The first pattern is for WWRs of less than 40%, where the maximum comfort hours are around the south, followed by the north direction. The second pattern is for WWRs greater than or equal to 40%, where the maximum comfort hours are in the north. For all-year-round occupancy, there are marginal differences in the performance of all WWR% around 0° to +20° from the north direction. There are no other orientation ranges where the changes in comfort hours remain marginal regardless of the WWR%. The smaller the WWR, the better the comfort levels in all orientations when the objective is to improve all year round. Comfort hours during the summer season are at their peak in the north direction for all WWRs and in the south direction for WWRs of less than or equal to 25%. Larger WWRs have much lower comfort hours in all directions due to the increased heat gain that comes with the increased window area during the summer season. There is a marginal change in the performance of all the WWRs when it comes to comfort hours in the natural ventilation scenario in the following orientations during the summer season [85–140°] and [225–280°]. If the room has any window-to-wall ratio (WWR), a unified façade treatment can be used for repeated units on a masterplan if orientation changes are within the given ranges. The smallest WWRs have the highest comfort hours in all seasons, regardless of the WWR. The winter season analysis indicated the highest comfort hours for naturally ventilated buildings in the investigated climate are in the southeast direction for WWR% greater than 20% and the south direction for WWRs of less than or equal to 20%. The changes in the comfort hours were less than ±2.5% from the north direction for angles between 0° and 20°, regardless of the investigated WWR%, which means that there is a marginal difference in the performance of the WWR% in enhancing the comfort levels for naturally ventilated buildings during the winter season within those ranges. This range can extend from −25° to +25° from the north for WWRs of less than 35%. If the intended occupancy, in the examined climate, is mainly going to be during the winter season, it is recommended for architects to orient their buildings toward the southeast orientation for WWRs greater than 20% and the south for WWRs of less than or equal to 20%. WWRs of around 20% work best for increasing comfort during the winter in the south direction; meanwhile, larger WWRs perform better in the southeast and southwest orientations during the winter season.

3.2. Stage 2: Analysis Results for the Existing Apartment Prototype

This section presents the results of the analysis conducted using actual data from an existing apartment unit situated on the Red Sea coast in Egypt. The weather data used in this analysis were for Egypt’s East Coast climatic zone. In this study, the impact of shading and different glazing types on thermal loads for different building orientations was examined. The impact of changing the WWR was excluded from this study because the developer wanted solutions that did not affect the existing design, especially the size of the windows, since vast views of the sea were one of the main selling points of the residential units. The focus of the analysis was on examining the thermal loads and EUI of the investigated apartment unit all year round since the project is intended to attract occupants all year and is not seasonal. Split HVAC systems are installed in the examined unit. The highest thermal loads recorded are in the southwest and west directions, as indicated in Figure 18. Having the highest thermal loads near the west orientation shows parallels to results obtained by Elghamry and Azmy [17].
The energy use intensity of the selected apartment was compared to the ASHRAE guidelines range for energy consumption in the examined climatic zone. The EUI was within the acceptable range except in the southwest and west directions for the majority of the façade design solutions except when reflective glazing, 1.5 m horizontal overhangs, or 1m overhangs and side fins were applied. For these design options, the EUI was within the acceptable range for all orientations. Both the single and double reflective glazing investigated in this study resulted in consistently lower thermal loads and EUI compared to other façade designs. It could also be deduced that the single low-e glazing was the most problematic with EUI more than acceptable range in the east, southeast, south, southwest, and west orientations. If one were to look at the current building orientations on the master plan, the current apartment design is not problematic since the repeated building prototype orientations are between the north and east directions. In addition, a large portion of the glazing, especially that of the reception and the guest bedroom, is shaded by the upper-floor balcony.
Upon plotting the thermal loads in Figure 19, the results highlighted that there was a marginal difference in thermal loads for all the tested facade designs from 0° to +10° from the north direction. This range extends from 355° to 15° for reflective glazing and 1.5 m horizontal overhangs. All building façades falling within this range can have one common façade design. A similar observation was noted in the east direction. When the façade orientation was within [85–95°], the thermal loads changed by ±2.5% from the east direction. In Figure 20, it was noted that when the façade orientation was within [170–180°], the thermal loads changed by ±2.5% or less for all the investigated façade designs. This also means that the best façade design for any of those angles can effectively work from −10° to 0° from the south direction with a marginal difference in performance. It was also observed that when the façade orientation was within [260–275°], the thermal loads changed by ±2.5% from the west direction. This range extends from 255° to 280° for reflective glazing and from 245° to 275° for horizontal overhangs between 0.5 and 1 m. These results show parallels to the previous analysis conducted on the single 3 m × 3 m × 3 m room.

4. Discussion

The growing interest in developing large-scale residential and hospitality projects has resulted in a clear need for methods and tools that can assist designers at various stages of project planning and design. One of the main challenges planners and architects have when working on large-scale residential projects is that the same building unit would typically have several orientations within the same master plan. Although myriad studies have focused on identifying optimal façade design treatments for different orientations and determining the building orientation with the lowest energy consumption, choosing the building orientation is not always an option in real-world projects, and designing and applying specific façade treatments for each change in the building orientation can be expensive and time-consuming. When it comes to minimizing energy consumption for the units of these projects, identifying the range of façade orientations with closely comparable energy and thermal comfort performance can help in reducing simulation time as it assists in highlighting the orientation angles that can have a unified façade design feature which is the main contribution of this research. This streamlines the design as well as the construction processes for these large-scale developments, thus reducing cost and time.
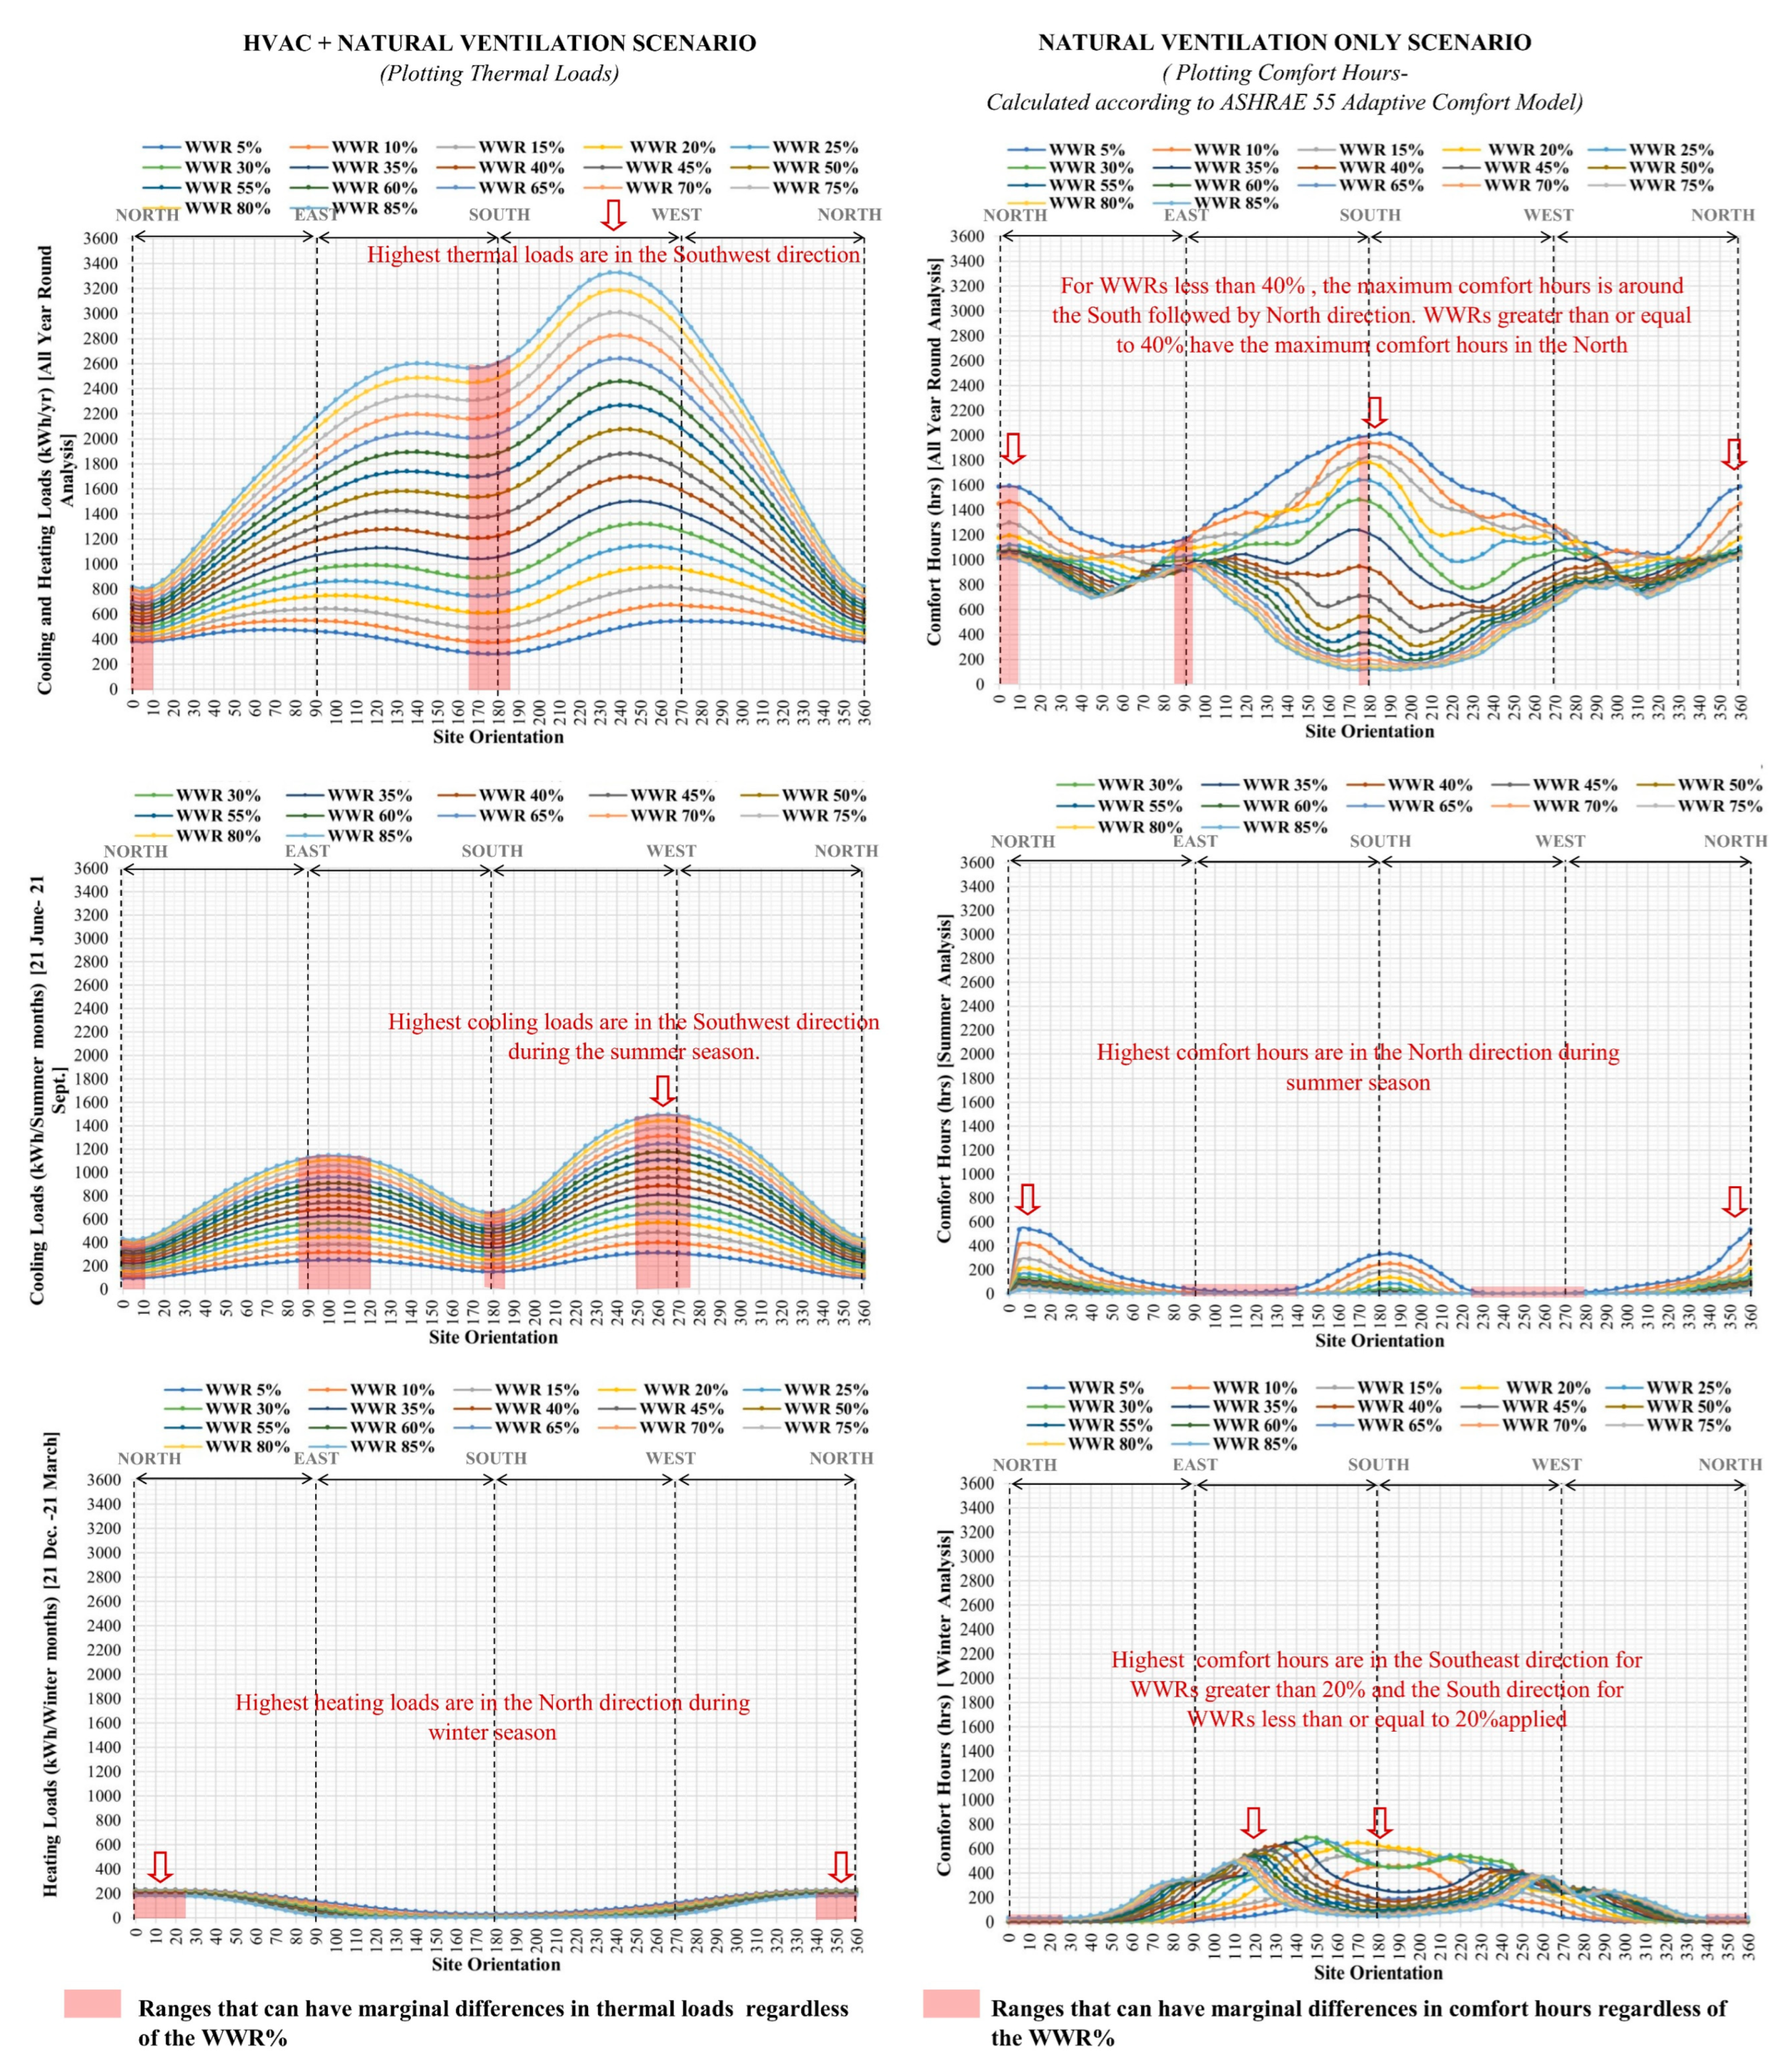
Results show that the choice of a unified façade treatment for different ranges of changes depends largely on the architect’s or designer’s objective. If the goal is to achieve the lowest energy consumption and maintain human comfort for buildings that are occupied throughout the year or in specific seasons, then the façade design plays a significant role if the building is to be occupied all year round. The most effective façade treatment for each of the following ranges can be safely applied without worrying about the orientation changes on the investigated building thermal loads. These angles are as follows: 0° to +10° change from the north [0–10°]; ±5° from the east [85–95°] for WWR of less than 50%; ±5° from the south [170–180°]; and ±5° from the west for WWR of less than 40% [265–275°]. These ranges can increase for WWRs that are less than 50% or when reflective glazing or large shading devices are applied. For these ranges, the changes in comfort hours, if the building was only naturally ventilated, were marginal as well. It could also be noted that this phenomenon ceases to exist in both the northeast and northwest, where any changes in the orientations from those intercardinal directions require the architect to find the best design solution for each change in orientation since the changes in thermal performance could be significant. The ranges of changes that allow for a unified façade design to be applied can differ when the occupancy is not all year round, and the objective is to reduce energy consumption and improve thermal comfort for a specific season. A case in point is that during the winter season, the heating loads and comfort hours were marginal between 340° and 25° for each of the façade design treatments investigated. It should also be noted that during the summer season, the ranges that had marginal changes in thermal performance mimicked that of the all-year analysis and were as follows: [0–5°]; [85–95°]; [175–185°]; and [265–275°]. When it comes to all-year-round and summer occupancy scenarios, the small WWR, the use of reflective glazing, or large overhangs with 1 m side fins were the best solutions for reducing cooling loads, as highlighted in Table 3. If the occupancy is mainly going to be during the winter season, the most problematic orientation is the north, where the highest heating loads occur, and the most effective solution of the investigated façade design treatments is the use of double, double low-e glazing, or increasing the WWR percentage.
The main finding of this research is that one design solution can be safely applied to certain ranges of building orientations, which can simplify the design process and reduce costs in large-scale residential projects. This implies that architects and planners can benefit from this research by applying the same façade treatment to multiple orientations within a master plan without compromising on energy efficiency. For each change in orientation outside those ranges, the analysis should be repeated to find the best design solutions since the best design solution for one of those angles might not necessarily be the best solution for other angles. While it could be deduced that the ranges where marginal changes occur in the thermal performance of buildings regardless of the investigated façade treatments are not vast, as indicated in Table 3, it is still valuable for architects to identify those ranges and acknowledge how they could be extended. A case in point is when reflective glazing or overhangs are implemented. The range of angles around the south, east, and west directions where the thermal performance is comparable increased, as highlighted in Figure 12, Figure 14 and Figure 20. This allows for the most effective façade design within each of those ranges to be unified.

5. Conclusions

This research aims to identify the range of façade orientations with closely comparable energy and thermal comfort performance, thus aiding architects and planners working on large-scale projects to reduce simulation time and costs and streamline the decision-making process. This study was divided into two stages to determine the variety of orientations that can have the same façade treatment. The process was initially tested on a single (3 m × 3 m × 3 m) residential bedroom model, and then it was applied to a real project in Ain Sokhna, along Egypt’s Red Sea Coast, during the second phase. The analysis was carried out using DesignBuilder software. This study looked at several design options, including modifying the glass type, changing the window-to-wall ratio, and using shading devices.
The results of the analysis indicated that if the building was to be occupied all year round, the most effective façade treatment for each of the following ranges could be safely unified without worrying about the orientation changes on the investigated building thermal loads and comfort hours. These angles are as follows: 0° to +10° change from the north [0–10°]; ±5° from the east [85–95°] for WWR of less than 50%; −10° from the south [170–180°]; and ±5° from the west for WWR of less than 40% [265–275°]. It could also be noted that this phenomenon ceases to exist in both the northeast and northwest, where any changes in the orientations from those intercardinal directions require the architect to re-run the analysis since the best design solution for one of those angles might not necessarily be the best solution for other angles. These ranges, where unified façade design can be applied, differ if the occupancy is not all year long and the objective is to reduce energy consumption and improve thermal comfort for a specific season.
The limitation of this study is that it was conducted on only one building use and typology. The majority of the thermal comfort runs were also tested on one single test room as opposed to the thermal load analysis calculated for the HVAC scenario and tested using real-life project data. The impact of the surrounding context on thermal loads and comfort hours was not addressed in this research. This research focused primarily on seasons that have the highest thermal loads, both heating and cooling. Further research is needed to examine behavior in transitional seasons. Future research can also expand on the above analysis by including other design features related to changes in building shape and volume, along with combining different design solutions. The same analysis could also be replicated using different weather data from other locations, both local and global, to examine whether the angles that can have a unified design in this study also work in climatic zones other than hot, arid climates.

Author Contributions

Conceptualization, A.S. and M.A.; methodology, A.S. and M.A; software, I.M. and M.A.; writing—original draft preparation, M.A.; writing—review and editing, A.S., K.T. and I.M.; visualization, M.A.; supervision, A.S., K.T. and I.M.; project administration, A.S., K.T. and I.M.; funding acquisition, A.S. and K.T. All authors have read and agreed to the published version of the manuscript.

Funding

This research work was financially supported by MAVEN Developments, grant number: [SSE–ARCH–K.T.–FY21-FY22]. The article processing charge (APC) was funded by the American University in Cairo.

Data Availability Statement

The data presented in this study are available on request from the corresponding author.

Acknowledgments

Some of the figures and data used in this study were provided by Maven Developments as a part of a collaborative project with the American University in Cairo aiming at delivering sustainability and accessibility recommendations for Baymount project in Ain Sokhna, Egypt.

Conflicts of Interest

The authors declare no conflict of interest.

References

  1. Zheng, L.; Mueller, M.; Luo, C.; Menneer, T.; Yan, X. Variations in Whole-Life Carbon Emissions of Similar Buildings in Proximity: An Analysis of 145 Residential Properties in Cornwall, UK. Energy Build. 2023, 296, 113387. [Google Scholar] [CrossRef]
  2. United Nations Environment Programme (UNEP). 2022 Global Status Report For Buildings and Construction; United Nations Environment Programme (UNEP): Nairobi, Kenya, 2022. [Google Scholar]
  3. Dogan, T.; Saratsis, E.; Reinhart, C. The Optimization Potential of Floor-Plan Typologies in Early Design Energy Modeling. In Proceedings of the 14th International Conference of IBPSA—Building Simulation 2015, BS 2015, Hyderabad, India, 7–9 December 2015; pp. 1853–1860. [Google Scholar]
  4. De Wilde, P. Computational Support for the Selection of Energy Saving Building Components. Energy Build. 2004, 36, 749–758. [Google Scholar] [CrossRef]
  5. Lin, B.; Yu, Q.; Li, Z.; Zhou, X. Research on Parametric Design Method for Energy Efficiency of Green Building in Architectural Scheme Phase. Front. Archit. Res. 2013, 2, 11–22. [Google Scholar] [CrossRef]
  6. Hao, S.; Hong, T. The Application of Urban Building Energy Modeling in Urban Planning. In Rethinking Sustainability towards a Regenerative Economy; Springer International Publishing: Cham, Switzerland, 2021; pp. 45–63. [Google Scholar] [CrossRef]
  7. Hemsath, T.L. Housing Orientation’s Effect on Energy Use in Suburban Developments. Energy Build. 2016, 122, 98–106. [Google Scholar] [CrossRef]
  8. Renuka, S.M.; Maharani, C.M.; Nagasudha, S.; Raveena Priya, R. Optimization of Energy Consumption Based on Orientation and Location of the Building. Mater. Today Proc. 2022, 65, 527–536. [Google Scholar] [CrossRef]
  9. Evins, R. A Review of Computational Optimisation Methods Applied to Sustainable Building Design. Renew. Sustain. Energy Rev. 2013, 22, 230–245. [Google Scholar] [CrossRef]
  10. Abanda, F.H.; Byers, L. An Investigation of the Impact of Building Orientation on Energy Consumption in a Domestic Building Using Emerging BIM (Building Information Modelling). Energy 2016, 97, 517–527. [Google Scholar] [CrossRef]
  11. Ruiz, R.; Bandera, F. Importance of Orientation in Building Energy-Savings. In Proceedings of the World Sustainable Building Conference 14 Barcelona, Barcelona, Spain, 28–30 October 2014; pp. 327–334. [Google Scholar]
  12. Pathirana, S.; Rodrigo, A.; Halwatura, R. Effect of Building Shape, Orientation, Window to Wall Ratios and Zones on Energy Efficiency and Thermal Comfort of Naturally Ventilated Houses in Tropical Climate. Int. J. Energy Environ. Eng. 2019, 10, 107–120. [Google Scholar] [CrossRef]
  13. Alsaadani, S. A Statistical Review of a Decade of Residential Energy Research in Egypt. Energy Rep. 2022, 8, 95–102. [Google Scholar] [CrossRef]
  14. Al-Tamimi, N.A.M.; Fadzil, S.F.S.; Harun, W.M.W. The Effects of Orientation, Ventilation, and Varied WWR on the Thermal Performance of Residential Rooms in the Tropics. J. Sustain. Dev. 2011, 4, 142. [Google Scholar] [CrossRef]
  15. Morrissey, J.; Moore, T.; Horne, R.E. Affordable Passive Solar Design in a Temperate Climate: An Experiment in Residential Building Orientation. Renew. Energy 2011, 36, 568–577. [Google Scholar] [CrossRef]
  16. Belmahdi, B.; Louzazni, M.; El Bouardi, A. Orientation Effect on Energy Consumption in Building Design. In Proceedings of the 2021 3rd International Sustainability and Resilience Conference: Climate Change, Sakheer, Bahrain, 15–16 November 2021; pp. 474–478. [Google Scholar] [CrossRef]
  17. Elghamry, R.; Azmy, N. Buildings Orientation and Its Impact on the Energy Consumption; AEIC: Tanta, Egypt, 2017. [Google Scholar]
  18. Elhadad, S.; Baranyai, B.; Gyergyák, J. The Impact of Building Orientation on Energy Performance: A Case Study in New Minia, Egypt. Pollack Period. 2018, 13, 31–40. [Google Scholar] [CrossRef]
  19. Aydin, E.E.; Kaya, H.O.; Kahraman, İ. Effects of Optimizing the Shading Device Orientation to Energy Consumption in Office Buildings. In Proceedings of the CLIMA 2016—Proceedings of the 12th REHVA World Congress, Aalborg, Denmark, 22–25 May 2016. [Google Scholar]
  20. El-Deeb, K.; El-Zafarany, A.; Sherif, A. Effect of Building Form and Urban Pattern: On Energy Consumption of Residential Buildings in Different Desert Climates. In Proceedings of the 28th International PLEA Conference on Sustainable Architecture + Urban Design: Opportunities, Limits and Needs—Towards an Environmentally Responsible Architecture, PLEA 2012, Lima, France, 1–7 November 2012. [Google Scholar]
  21. Sherif, A.; Sabry, H.; El-Zafarany, A.; Arafa, R.; Rakha, T.; Anees, M. Balancing the Energy Savings and Daylighting Performance of External Perforated Solar Screens: Evaluation of Screen Opening Proportions. In Proceedings of the PLEA 2011—Architecture and Sustainable Development, Conference Proceedings of the 27th International Conference on Passive and Low Energy Architecture; Louvain-la-Neuve, Belgium, 13–15 January 2011, pp. 807–812.
  22. Kim, S.; Zadeh, P.A.; Staub-french, S.; Froese, T.; Cavka, B.T. Assessment of the Impact of Window Size, Position and Orientation on Building Energy Load Using BIM Assessment of the Impact of Window Size, Position and Orientation on Building Energy Load Using BIM. Procedia Eng. 2016, 145, 1424–1431. [Google Scholar] [CrossRef]
  23. Alghoul, S.K.; Rijabo, H.G.; Mashena, M.E. Energy Consumption in Buildings: A Correlation for the Influence of Window to Wall Ratio and Window Orientation in Tripoli, Libya. J. Build. Eng. 2017, 11, 82–86. [Google Scholar] [CrossRef]
  24. Tong, S.; Wen, J.; Wong, N.H.; Tan, E. Impact of Façade Design on Indoor Air Temperatures and Cooling Loads in Residential Buildings in the Tropical Climate. Energy Build. 2021, 243, 110972. [Google Scholar] [CrossRef]
  25. Yu, F.; Wennersten, R.; Leng, J. A State-of-Art Review of Concepts, Criteria, Methods and Factors for Reaching ‘Thermal-Daylighting Balance’. Build. Environ. 2020, 186, 107330. [Google Scholar] [CrossRef]
  26. Witte, M.J.; Henninger, R.H.; Glazer GARD Analytics, J.; Crawley, D.B. Testing and Validation of a New Building Energy Simulation Program. In Proceedings of the the Seventh International IBPSA Conference, Rio de Janeiro, Brazil, 13–15 August 2001; pp. 353–360. [Google Scholar]
  27. Pereira, W.; Bögl, A.; Natschläger, T. Sensitivity Analysis and Validation of an EnergyPlus Model of a House in Upper Austria. Energy Procedia 2014, 62, 472–481. [Google Scholar] [CrossRef]
  28. Attia, S.; Evrard, A.; Gratia, E. Development of Benchmark Models for the Egyptian Residential Buildings Sector. Appl. Energy 2012, 94, 270–284. [Google Scholar] [CrossRef]
  29. Gamaleldine, M.; Corvacho, H. Compliance with Building Energy Code for the Residential Sector in Egyptian Hot-Arid Climate: Potential Impact, Difficulties, and Further Improvements. Sustainability 2022, 14, 3936. [Google Scholar] [CrossRef]
  30. Alwetaishi, M.; Benjeddou, O. Impact of Window to Wall Ratio on Energy Loads in Hot Regions: A Study of Building Energy Performance. Energies 2021, 14, 1080. [Google Scholar] [CrossRef]
  31. Climate-Data.org. Climate: Suez Governorate. Available online: https://en.climate-data.org/africa/egypt/suez-governorate-1639/ (accessed on 5 June 2022).
  32. ERBEC. The Egyptian Residential Buildings Energy Code; Housing and Building National Research Center: Cairo, Egypt, 2006. [Google Scholar]
  33. ASHRAE. ASHRAE Technical FAQ; ASHRAE: Peachtree Corners, GA, USA, 2011; Volume 80. [Google Scholar]
  34. ASHRAE 169-2013; Climatic Data for Building Design Standards. ASHRAE: Peachtree Corners, GA, USA, 2020; Volume 8400.
  35. Zhang, C.; Kazanci, O.B.; Levinson, R.; Heiselberg, P.; Olesen, B.W.; Chiesa, G.; Sodagar, B.; Ai, Z.; Selkowitz, S.; Zinzi, M.; et al. Resilient Cooling Strategies—A Critical Review and Qualitative Assessment. Energy Build. 2021, 251, 111312. [Google Scholar] [CrossRef]
  36. ASHRAE 90.1-2016; Energy Standards for Buildings Except Low Rise Residential Buildings. ASHRAE: Peachtree Corners, GA, USA, 2016; p. 301.
  37. Haves, P.; Ravache, B.; Fergadiotti, A.; Kohler, C.; Yazdanian, M. Accuracy of HVAC Load Predictions: Validation of EnergyPlus and DOE-2 Using an Instrumented Test Facility. In Proceedings of the Building Simulation Conference Proceedings, Rome, Italy, 2–4 September 2019; Volume 6, pp. 4329–4336. [Google Scholar] [CrossRef]
  38. Eskin, N.; Türkmen, H. Analysis of Annual Heating and Cooling Energy Requirements for Office Buildings in Different Climates in Turkey. Energy Build. 2008, 40, 763–773. [Google Scholar] [CrossRef]
  39. ANSI/ASHRAE Standard 55-2013; Thermal Environmental Conditions for Human Occupancy. ASHRAE: Atlanta, GA, USA, 2013.
  40. ANSI/ASHRAE/IES Standard 100-2018; Energy Efficiency in Existing Buildings. ASHRAE: Atlanta, GA, USA, 2018; p. 14.
  41. Maven. Mavent Developments Baymount Sokhna. Available online: https://mavendevelopments.com/baymount (accessed on 26 June 2022).
  42. Peel, M.C.; Finlayson, B.L.; McMahon, T.A. Updated World Map of the Köppen-Geiger Climate Classification. Hydrol. Earth Syst. Sci. 2007, 11, 1633–1644. [Google Scholar] [CrossRef]
Figure 1. Different housing projects from Egypt, the UK, and the UAE where the same residential unit is repeated in different orientations on the masterplan [Image Source: Google Earth].
Buildings 13 02639 g001
Figure 2. Tested façade orientations increment with 0° representing the north direction.
Buildings 13 02639 g002
Figure 3. Diagram illustrating the model used for the first stage of the analysis.
Buildings 13 02639 g003
Figure 4. Operation and occupancy schedules used in energy modeling.
Buildings 13 02639 g004
Figure 5. Examples of different WWRs and shading options are examined in this study.
Buildings 13 02639 g005
Figure 6. The temperature difference between outdoors and comfort conditions for examined climate. (Source: https://clima.cbe.berkeley.edu/ (accessed on 12 August 2023)).
Buildings 13 02639 g006
Figure 7. Render of the examined apartment building prototype. Image source: Maven Development [41].
Buildings 13 02639 g007
Figure 8. Floor plan of the investigated apartment prototype. Image Source: Maven Developments [41].
Buildings 13 02639 g008
Figure 9. Orientations for the examined apartment building. Image Source: Maven Developments [41].
Buildings 13 02639 g009
Figure 10. Research Stages and Framework.
Buildings 13 02639 g010
Figure 11. Thermal loads and comfort hours at different orientations for various glazing types.
Buildings 13 02639 g011
Figure 12. Orientation ranges that have marginal changes in thermal performance regardless of glazing type investigated.
Buildings 13 02639 g012
Figure 13. Thermal loads and comfort hours at different orientations for various shading techniques.
Buildings 13 02639 g013
Figure 14. Orientation ranges have marginal changes in thermal performance regardless of the shading technique applied.
Buildings 13 02639 g014
Figure 15. Thermal loads and comfort hours at different orientations for various WWRs.
Buildings 13 02639 g015
Figure 16. Orientation ranges that have marginal changes in thermal loads for all the investigated WWR%.
Buildings 13 02639 g016
Figure 17. Orientation ranges that have marginal changes in comfort hours for all the investigated WWR%.
Buildings 13 02639 g017
Figure 18. Energy use intensity for the selected apartment prototype in different orientations when different façade designs are applied.
Buildings 13 02639 g018
Figure 19. Cooling and heating loads for the apartment in various orientations when different façade designs are applied.
Buildings 13 02639 g019
Figure 20. Orientation ranges have marginal changes in thermal performance regardless of the façade design for the examined apartment prototype.
Buildings 13 02639 g020
Table 1. Building simulation model inputs.
ParametersData Input
Activity ClassificationDomestic Bedroom
Location/Weather DataAin El Sokhna/Suez Weather file i
ASHRAE Climatic Zone: 2 B ii
Latitude: 29.29°
Longitude: 32.25°
Cooling Setpoint25 °C iii
Heating Setpoint18.3 °C iv
HVAC TypeSplit AC
Natural Ventilation SettingsMinimum outdoor temperature limits: 18.3 °C
Maximum outdoor temperature limits: 28 °C v
Lighting Power Density7.53 W/m2 vi
Equipment Power Density3.58 W/m2 vii
Occupancy Density0.0229 People/m2 viii
i Source: ECMWF/ERA https://re.jrc.ec.europa.eu/pvg_tools/en/#MR (accessed on 30 December 2022); ii [34,35]; iii [32] (p. 9); iv [32] (p. 9); v [33]; vi [32,36] (p. 54, p. 301); vii Based on default DesignBuilder lighting loads for domestic bedrooms (Source: UK NCM); viii Based on default DesignBuilder equipment loads for domestic bedrooms (Source: UK NCM).
Table 2. Properties of the tested glass types.
Glazing TypeThicknessLight Transmission ValueSolar Heat Gain CoefficientThermal Transmittance W/m2.K
Single Clear Glazing6 mm0.8810.8195.778
Single Low-E Glazing6 mm0.8110.7203.779
Single Reflective Glazing6 mm0.2010.3214.975
Double Clear Glazing6 mm/13 mm Air0.7810.7032.665
Double Low-E Glazing6 mm/13 mm Air0.7450.5681.761
Double Reflective Glazing6 mm/13 mm Air0.1810.2342.412
Table 3. Analysis results summary.
Project Operation/Occupancy ScenarioOrientations with Similar Thermal Performance for All Investigated Façade TreatmentsEffective Solutions for Low Thermal Loads and High Comfort Hours in the Investigated Climate
All Year Round[0–10°]
[85–95°] for WWR less than 50%
[170–180°]
[265–275°] for WWR less than 40%
Reflective Glazing
OR
Overhangs with side fins of at least 1 m
OR
Small WWR%
Summer (21 June–21 September)[0–5°]
[85–95°]
[175–185°]
[265–275°]
Reflective glazing
Or
Overhangs with at least 1 m side fins
Or
Small WWR%
Winter (21 December–21 March)[355–20°]Double glazing
Or
Double Low-e glazing
Or
Large WWR%
Disclaimer/Publisher’s Note: The statements, opinions and data contained in all publications are solely those of the individual author(s) and contributor(s) and not of MDPI and/or the editor(s). MDPI and/or the editor(s) disclaim responsibility for any injury to people or property resulting from any ideas, methods, instructions or products referred to in the content.

