
Meeting User Needs through Building Automation and Control Systems: A Review of Impacts and Benefits in Office Environments


Abstract
:1. Introduction
2. Materials and Methods
2.1. Nomenclature
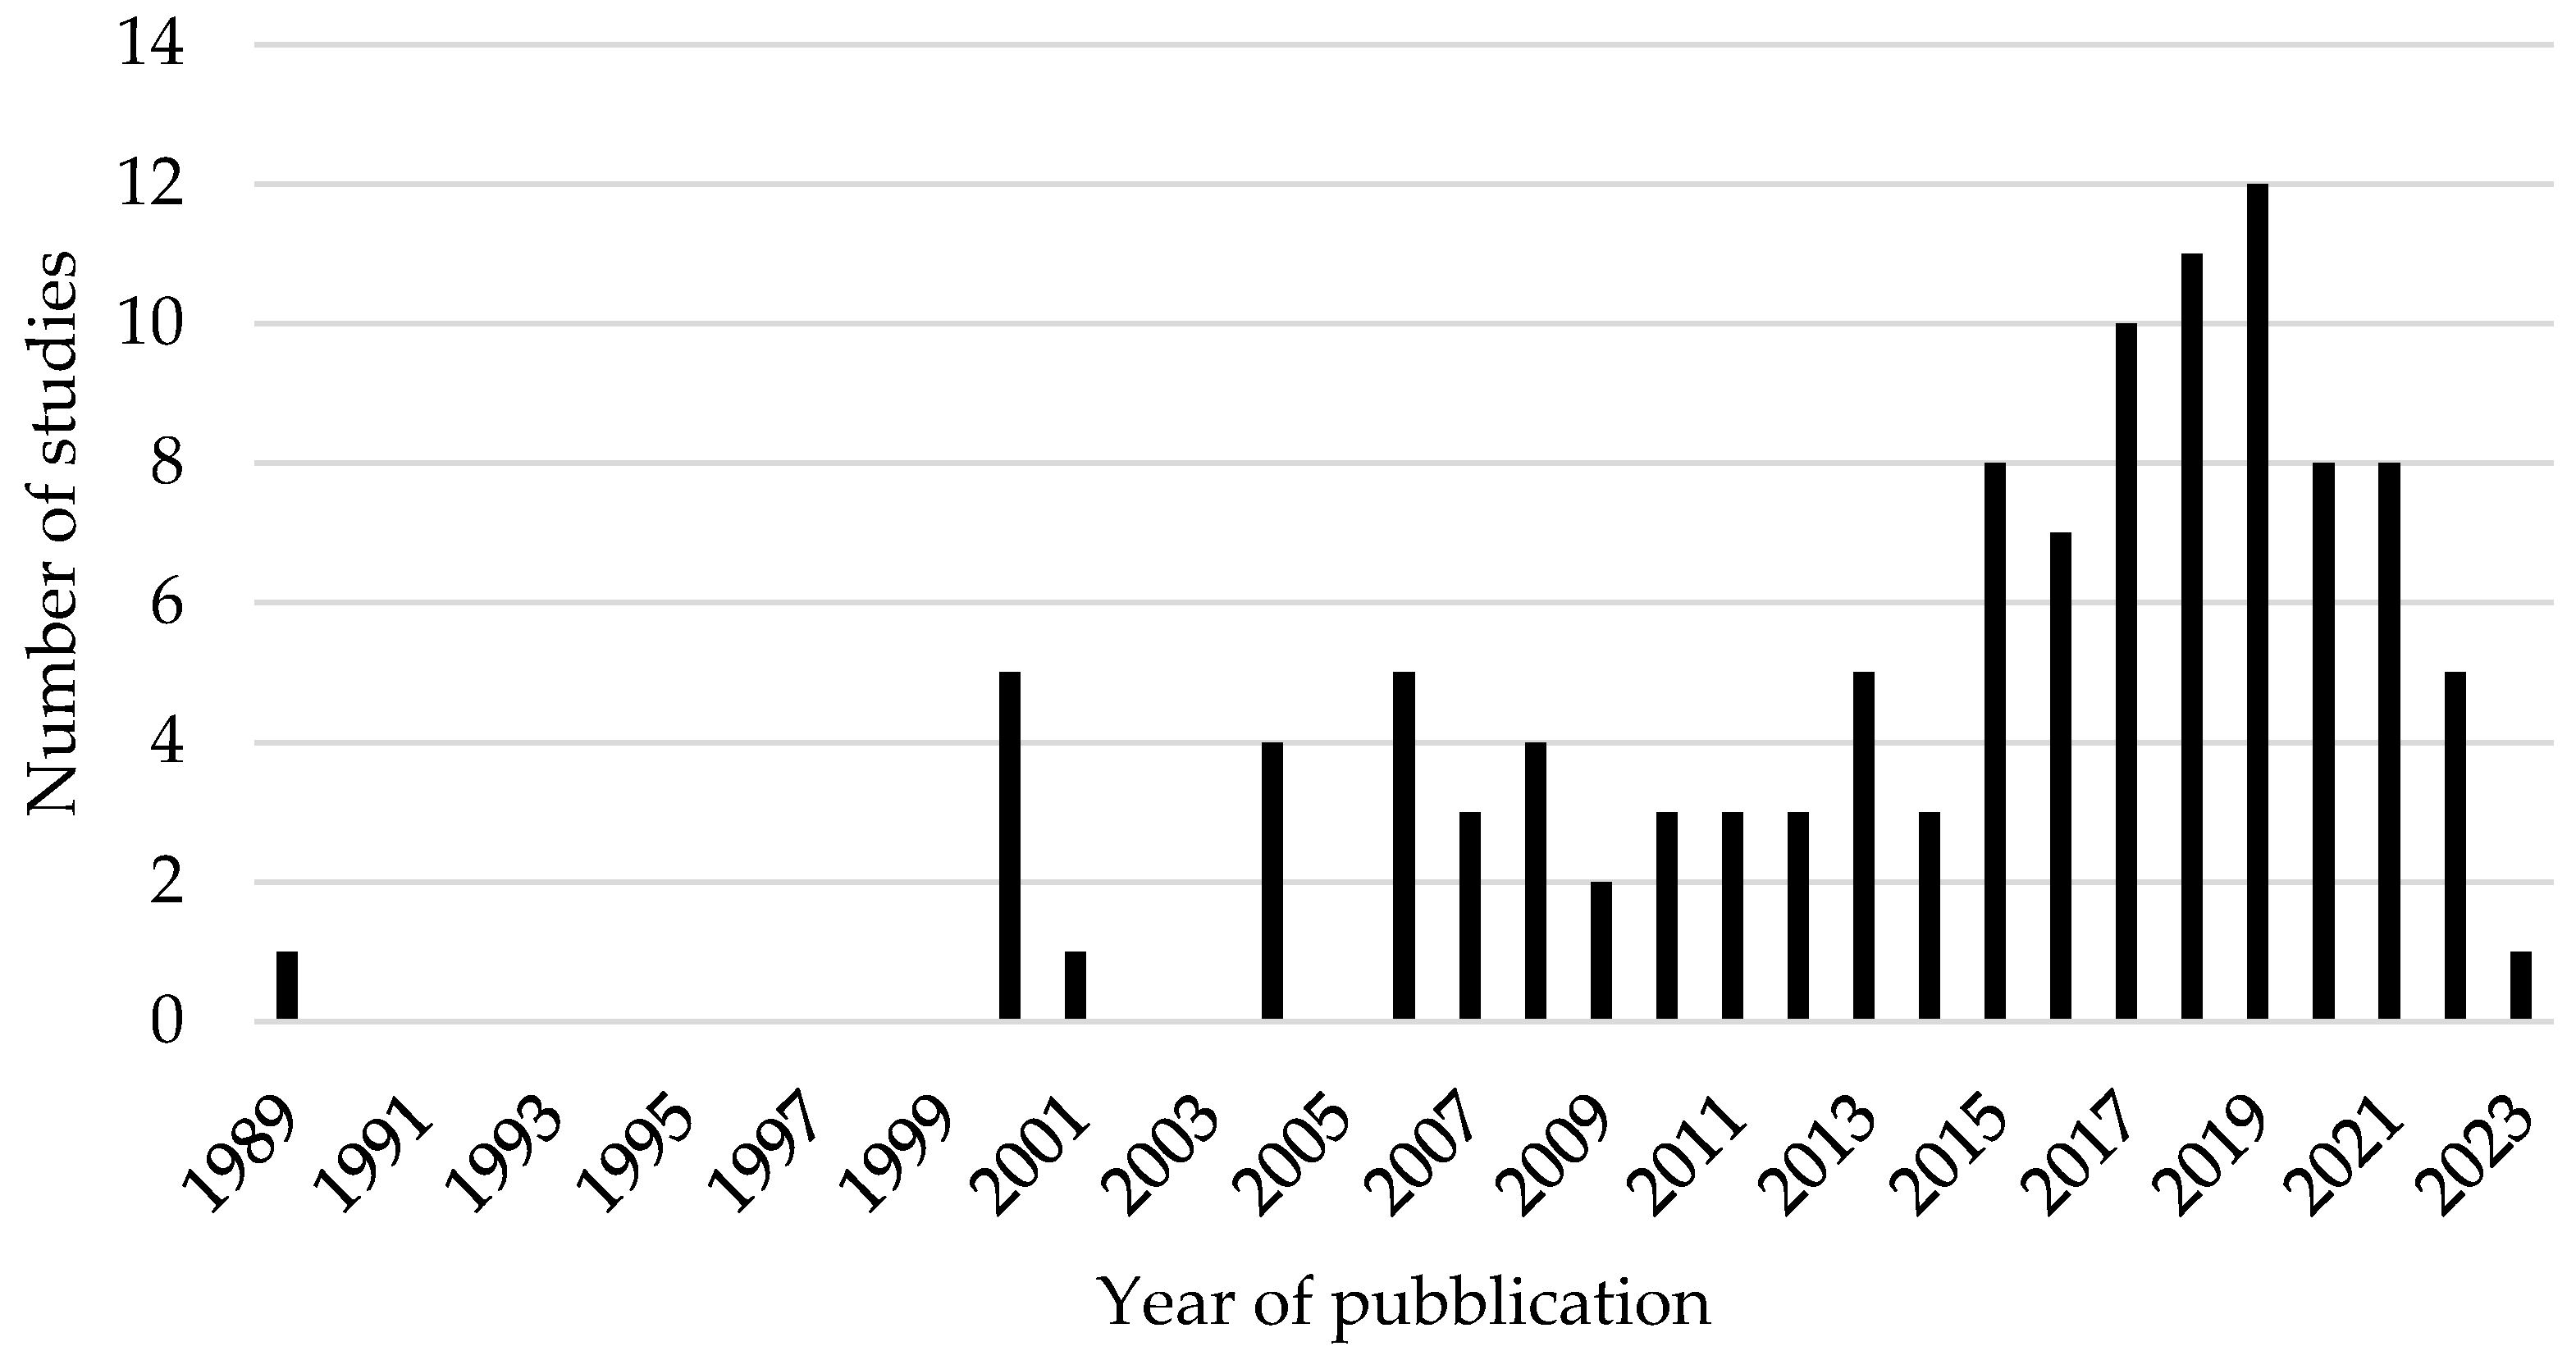
2.2. Literature Search
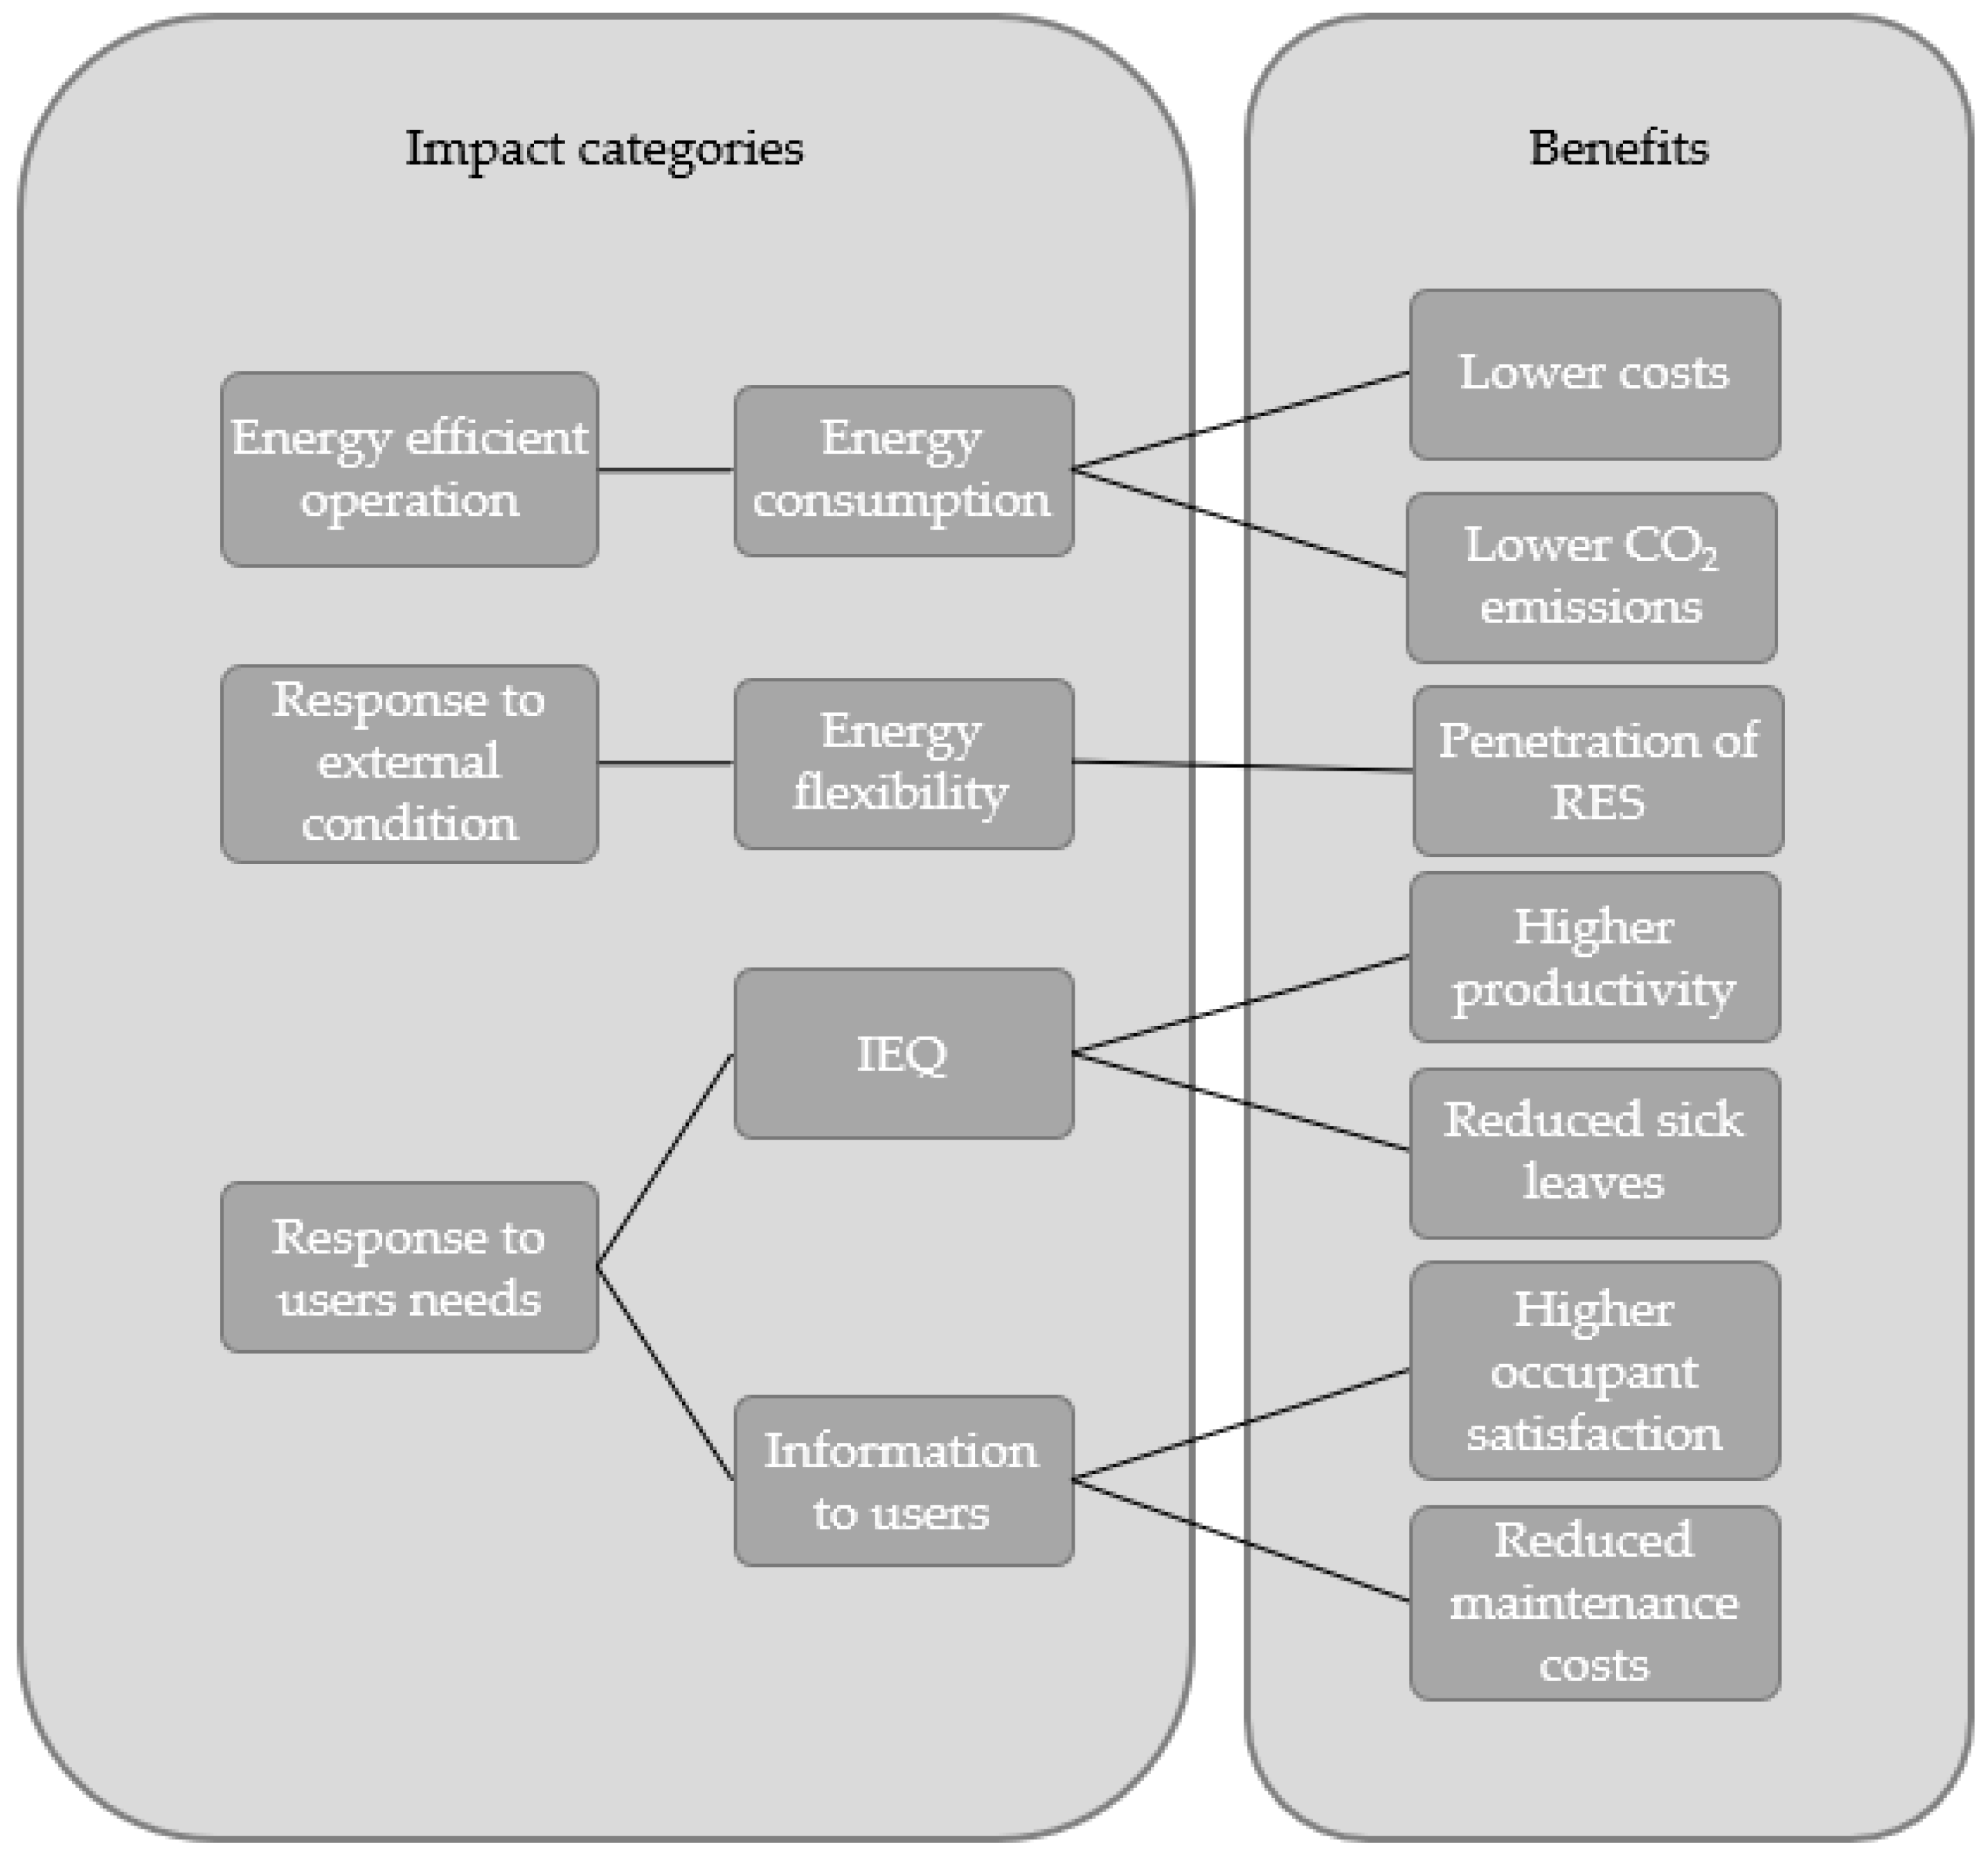
3. BACS Impacts
3.1. Energy Efficient Operation
3.2. Response to the External Condition
3.3. Response to User Needs
3.3.1. Thermal Comfort
3.3.2. Visual Comfort
3.3.3. Indoor Air Quality
3.3.4. Information to the Users
4. Benefits
4.1. Productivity
4.2. Health and Well-Being
5. Discussion
6. Conclusions
Author Contributions
Funding
Data Availability Statement
Conflicts of Interest
References
- Markets and Markets. Smart Buildings Market by Component, Building Type, and Region (2022–2026). Available online: https://www.marketsandmarkets.com/Market-Reports/smart-building-market-1169.html (accessed on 24 April 2023).
- Reuter, M.; Patel, M.K.; Eichhammer, W.; Lapillonne, B.; Pollier, K. A comprehensive indicator set for measuring multiple benefits of energy efficiency. Energy Policy 2020, 139, 111284. [Google Scholar] [CrossRef]
- Recast, E. Directive 2010/31/EU of the European Parliament and of the Council of 19 May 2010 on the energy performance of buildings (recast). Off. J. Eur. Union 2010, 18, 2010. [Google Scholar]
- Weiß, T.; Pernetti, R.; Garzia, F.; Köhler, B.; Stobbe, M.; Meier, K.; Berggren, B. Life cycle cost reduction and market acceleration for new nearly zero-energy buildings. IOP Conf. Ser. Earth Environ. Sci. 2019, 323, 12002. [Google Scholar] [CrossRef]
- Berggren, B.; Wall, M.; Weiss, T.; Garzia, F.; Pernetti, R. (Eds.) LCC Analysis of a Swedish Net Zero Energy Building—Including Cobenefits. In Proceedings of the International Sustainable Energy Conference, Graz, Austria, 3–5 October 2018. [Google Scholar]
- Directive (EU) 2018844 of the European Parliament and of the Council of 30 May 2018 Amending Directive 201031EU on the Energy Performance of Buildings and Directive 201227EU on Energy Efficiency. Available online: https://eur-lex.europa.eu/legal-content/EN/TXT/?uri=uriserv%3AOJ.L_.2018.156.01.0075.01.ENG (accessed on 6 April 2023).
- European Union. Commission Delegated Regulation (EU) 2020/2155 of 14 October 2020 Supplementing Directive (EU) 2010/31/EU of the European Parliament and of the Council by Establishing an Optional Common European Union Scheme for Rating the Smart Readiness of Buildings (Text with EEA Relevance). No. 32020R2155. Official Journal of the European Union, L431. 2020, pp. 9–24. Available online: https://eur-lex.europa.eu/legal-content/EN/TXT/?uri=CELEX:32020R2155 (accessed on 24 April 2023).
- European Union. Commission Implementing Regulation (EU)…/… of 14 October 2020 Detailing the Technical Modalities for the Effective Implementation of an Optional Common Union Scheme for Rating the Smart Readiness of Buildings. CEN: Brussels, Belgium, 2020. Available online: https://eur-lex.europa.eu/legal-content/EN/TXT/?uri=CELEX%3A32020R2156 (accessed on 6 April 2023).
- Domingues, P.; Carreira, P.; Vieira, R.; Kastner, W. Building automation systems: Concepts and technology review. Comput. Stand. Interfaces 2016, 45, 1–12. [Google Scholar] [CrossRef]
- Aste, N.; Manfren, M.; Marenzi, G. Building Automation and Control Systems and performance optimization: A framework for analysis. Renew. Sustain. Energy Rev. 2017, 75, 313–330. [Google Scholar] [CrossRef]
- Al Dakheel, J.; Del Pero, C.; Aste, N.; Leonforte, F. Smart buildings features and key performance indicators: A review. Sustain. Cities Soc. 2020, 61, 102328. [Google Scholar] [CrossRef]
- O’Grady, T.; Chong, H.-Y.; Morrison, G.M. A systematic review and meta-analysis of building automation systems. Build. Environ. 2021, 195, 107770. [Google Scholar] [CrossRef]
- Hoskins, A.B.; US Department of Labor/Bureau of Labor Statistics. Occupational injuries, illnesses and fatalities among nursing, psychiatric, and home health aides, 1995–2004. 2006. Available online: https://www.bls.gov/opub/mlr/cwc/occupational-injuries-illnesses-and-fatalities-among-nursing-psychiatric-and-home-health-aides-1995-2004.pdf (accessed on 21 June 2023).
- McArthur, J.J.; Powell, C. Health and wellness in commercial buildings: Systematic review of sustainable building rating systems and alignment with contemporary research. Build. Environ. 2020, 171, 106635. [Google Scholar] [CrossRef]
- Potrč Obrecht, T.; Kunič, R.; Jordan, S.; Dovjak, M. Comparison of Health and Well-Being Aspects in Building Certification Schemes. Sustainability 2019, 11, 2616. [Google Scholar] [CrossRef]
- Gevorgian, A.; Pezzutto, S.; Zambotti, S.; Croce, S.; Oberegger, U.F.; Lollini, R.; Kranzl, L.; Müller, A. European Building Stock Analysis A Country by Country Descriptive and Comparative Analysis of the Energy Performance of Buildings; Eurac Research: Bolzano, Italy, 2021. [Google Scholar]
- Alker, J.; Malanca, M.; Pottage, C.; O’Brien, R. Health, Wellbeing & Productivity in Offices: The Next Chapter for Green Building; World Green Building Council. 2014. Available online: https://worldgbc.org/wp-content/uploads/2022/03/compressed_WorldGBC_Health_Wellbeing__Productivity_Full_Report_Dbl_Med_Res_Feb_2015-1.pdf (accessed on 21 June 2023).
- Wyon, D.P. (Ed.) Enhancing Productivity While Reducing Energy Use in Buildings; Rand: Santa Monica, CA, USA, 2000. [Google Scholar]
- Burge, P.S. Sick building syndrome. Occup. Environ. Med. 2004, 61, 185–190. [Google Scholar] [CrossRef]
- ISO. ISO 16484-2:2004 Building Automation and Control Systems (BACS)—Part 2: Hardware. 2018. Available online: https://www.iso.org/standard/29682.html (accessed on 20 June 2023).
- Ryan, L.; Campbell, N. Spreading the Net: The Multiple Benefits of Energy Efficiency Improvements. 2012. Available online: https://www.oecd-ilibrary.org/content/paper/5k9crzjbpkkc-en (accessed on 5 June 2023).
- Bleyl, J.; Bareit, M.; Casas, M.; Coolen, J.; Bruyn, B.D.; Hulshoff, A.; Robertson, M. (Eds.) Building Deep Energy Retrofit: Using Dynamic Cash Flow Analysis and Multiple Benefits to Convince Investors. In Proceedings of the ECEEE Summer Study Proceedings, Hyeres, France, 29 May–3 June 2017; p. 1130. [Google Scholar]
- EPA OA. Assessing the Multiple Benefits of Clean Energy: A Resource for States|US EPA ARCHIVE DOCUMENT. 2011. Available online: https://policycommons.net/artifacts/2411694/assessing-the-multiple-benefits-of-clean-energy/3433222/ (accessed on 22 May 2023).
- Ferreira, M.; Almeida, M. Benefits from Energy Related Building Renovation Beyond Costs, Energy and Emissions. Energy Procedia 2015, 78, 2397–2402. [Google Scholar] [CrossRef]
- Almeida, M.G.D.; Ferreira, M.A.P.S.; Rodrigues, A.; Höfler, K.; Maydl, J.; Venus, D.; Sedlák, J.; Struhala, K.; Mørck, O.C.; Østergaard, I. Co-Benefits of Energy Related Building Renovation: Demonstration of Their Impact on the Assessment of Energy Related Building Renovation (Annex 56); Universidade do Minho: Braga, Portugal, 2017. [Google Scholar]
- Jakob, M. Marginal costs and co-benefits of energy efficiency investments: The case of the Swiss residential sector. Energy Policy 2006, 34, 172–187. [Google Scholar] [CrossRef]
- Younger, M.; Morrow-Almeida, H.R.; Vindigni, S.M.; Dannenberg, A.L. The built environment, climate change, and health: Opportunities for co-benefits. Am. J. Prev. Med. 2008, 35, 517–526. [Google Scholar] [CrossRef] [PubMed]
- International Energy Agency. World Energy Balances, 2020 IEA World Energy Statistics and Balances (Database). 2019. Available online: https://www.iea.org/data-and-statistics/data-product/world-energy-balances (accessed on 21 June 2023).
- Nguyen, T.A.; Aiello, M. Energy intelligent buildings based on user activity: A survey. Energy Build. 2013, 56, 244–257. [Google Scholar] [CrossRef]
- Rottondi, C.; Duchon, M.; Koss, D.; Palamarciuc, A.; Pití, A.; Verticale, G.; Schätz, B. An Energy Management Service for the Smart Office. Energies 2015, 8, 11667–11684. [Google Scholar] [CrossRef]
- Ock, J.; Issa, R.R.A.; Flood, I. Smart Building Energy Management Systems (BEMS) Simulation Conceptual Framework. In Proceedings of the 2016 Winter Simulation Conference (WSC), Washington, DC, USA, 11–14 December 2016; pp. 3237–3245. [Google Scholar] [CrossRef]
- Engvang, J.A.; Jradi, M. Auditing and design evaluation of building automation and control systems based on eu.bac system audit—Danish case study. Energy Built Environ. 2021, 2, 34–44. [Google Scholar] [CrossRef]
- Sturzenegger, D.; Gyalistras, D.; Morari, M.; Smith, R.S. Model Predictive Climate Control of a Swiss Office Building: Implementation, Results, and Cost–Benefit Analysis. IEEE Trans. Control. Syst. Technol. 2016, 24, 1–12. [Google Scholar] [CrossRef]
- Wang, H.; Olesen, B.W.; Kazanci, O.B. Using thermostats for indoor climate control in offices: The effect on thermal comfort and heating/cooling energy use. Energy Build. 2019, 188, 71–83. [Google Scholar] [CrossRef]
- Krarti, M. Energy performance of control strategies for smart glazed windows applied to office buildings. J. Build. Eng. 2022, 45, 103462. [Google Scholar] [CrossRef]
- de Bakker, C.; Aries, M.; Kort, H.; Rosemann, A. Occupancy-based lighting control in open-plan office spaces: A state-of-the-art review. Build. Environ. 2017, 112, 308–321. [Google Scholar] [CrossRef]
- Sakaci, F.H.; Cetiner, E.; Chaouch, H.; Yener, S.C. Smart Office for Managing Energy of Lighting Control System. In Proceedings of the 2018 6th International Istanbul Smart Grids and Cities Congress and Fair (ICSG), Istanbul, Turkey, 25–26 April 2018; pp. 101–104. [Google Scholar] [CrossRef]
- Roisin, B.; Bodart, M.; Deneyer, A.; D’herdt, P. Lighting energy savings in offices using different control systems and their real consumption. Energy Build. 2008, 40, 514–523. [Google Scholar] [CrossRef]
- Williams, A.; Atkinson, B.; Garbesi, K.; Page, E.; Rubinstein, F. Lighting Controls in Commercial Buildings. Leukos 2012, 8, 161–180. [Google Scholar] [CrossRef]
- Chen, Y.; Chen, Z.; Xu, P.; Li, W.; Sha, H.; Yang, Z.; Li, G.; Hu, C. Quantification of electricity flexibility in demand response: Office building case study. Energy 2019, 188, 116054. [Google Scholar] [CrossRef]
- Aduda, K.O.; Labeodan, T.; Zeiler, W. Towards critical performance considerations for using office buildings as a power flexibility resource-a survey. Energy Build. 2018, 159, 164–178. [Google Scholar] [CrossRef]
- Lin, Y.; Barooah, P.; Mathieu, J.L. Ancillary Services to the Grid from Commercial Buildings through Demand Scheduling and Control. In Proceedings of the 2015 American Control Conference (ACC), Chicago, IL, USA, 1–3 July 2015; pp. 3007–3012. [Google Scholar] [CrossRef]
- Aduda, K.O.; Labeodan, T.; Zeiler, W.; Boxem, G.; Zhao, Y. Demand side flexibility: Potentials and building performance implications. Sustain. Cities Soc. 2016, 22, 146–163. [Google Scholar] [CrossRef]
- Aduda, K.O.; Labeodan, T.; Zeiler, W.; Boxem, G. Demand side flexibility coordination in office buildings: A framework and case study application. Sustain. Cities Soc. 2017, 29, 139–158. [Google Scholar] [CrossRef]
- Labeodan, T.; Aduda, K.; Boxem, G.; Zeiler, W. On the application of multi-agent systems in buildings for improved building operations, performance and smart grid interaction–A survey. Renew. Sustain. Energy Rev. 2015, 50, 1405–1414. [Google Scholar] [CrossRef]
- Zhan, S.; Dong, B.; Chong, A. Improving energy flexibility and PV self-consumption for a tropical net zero energy office building. Energy Build. 2023, 278, 112606. [Google Scholar] [CrossRef]
- Wargocki, P.; Wei, W.; Bendžalová, J.; Espigares-Correa, C.; Gerard, C.; Greslou, O.; Rivallain, M.; Sesana, M.M.; Olesen, B.W.; Zirngibl, J.; et al. TAIL, a new scheme for rating indoor environmental quality in offices and hotels undergoing deep energy renovation (EU ALDREN project). Energy Build. 2021, 244, 111029. [Google Scholar] [CrossRef]
- Abouleish, M.Z. Indoor air quality and COVID-19. Public Health 2021, 191, 1. [Google Scholar] [CrossRef]
- Klepeis, N.E.; Nelson, W.C.; Ott, W.R.; Robinson, J.P.; Tsang, A.M.; Switzer, P.; Behar, J.V.; Hern, S.C.; Engelmann, W.H. The National Human Activity Pattern Survey (NHAPS): A resource for assessing exposure to environmental pollutants. J. Expo. Sci. Environ. Epidemiol. 2001, 11, 231–252. [Google Scholar] [CrossRef] [PubMed]
- Kontes, G.D.; Giannakis, G.I.; Horn, P.; Steiger, S.; Rovas, D.V. Using Thermostats for Indoor Climate Control in Office Buildings: The Effect on Thermal Comfort. Energies 2017, 10, 1368. [Google Scholar] [CrossRef]
- Awada, M.; Becerik-Gerber, B.; White, E.; Hoque, S.; O’Neill, Z.; Pedrielli, G.; Wen, J.; Wu, T. Occupant health in buildings: Impact of the COVID-19 pandemic on the opinions of building professionals and implications on research. Build. Environ. 2022, 207, 108440. [Google Scholar] [CrossRef]
- Karmann, C.; Schiavon, S.; Arens, E. Percentage of Commercial Buildings Showing at Least 80% Occupant Satisfied with their Thermal Comfort. In Proceedings of the Windsor Conference, Windsor, UK, 12–15 April 2018. [Google Scholar]
- Huizenga, C.; Abbaszadeh, S.; Zagreus, L.; Arens, E.A. Air Quality and Thermal Comfort in Office Buildings: Results of a Large Indoor Environmental Quality Survey. Proc. Healthy Build. 2006, III, 393–397. [Google Scholar]
- Paul, W.L.; Taylor, P.A. A comparison of occupant comfort and satisfaction between a green building and a conventional building. Build. Environ. 2008, 43, 1858–1870. [Google Scholar] [CrossRef]
- Altomonte, S.; Schiavon, S.; Kent, M.G.; Brager, G. Indoor environmental quality and occupant satisfaction in green-certified buildings. Build. Res. Inf. 2019, 47, 255–274. [Google Scholar] [CrossRef]
- ANSI/ASHRAE Standard 55; Thermal Environmental Conditions for Human Occupancy. American Society of Heating, Refrigerating and Air-Conditioning Engineers (ASHRAE): Atlanta, GA, USA, 2013. Available online: https://www.ashrae.org/technical-resources/bookstore/standard-55-thermal-environmental-conditions-for-human-occupancy (accessed on 30 May 2023).
- Li, P.; Parkinson, T.; Schiavon, S.; Froese, T.M.; Dear R de Rysanek, A.; Staub-French, S. Improved long-term thermal comfort indices for continuous monitoring. Energy Build. 2020, 224, 110270. [Google Scholar] [CrossRef]
- Park, J.Y.; Nagy, Z. Comprehensive analysis of the relationship between thermal comfort and building control research—A data-driven literature review. Renew. Sustain. Energy Rev. 2018, 82, 2664–2679. [Google Scholar] [CrossRef]
- Carli, R.; Cavone, G.; Dotoli, M.; Epicoco, N.; Scarabaggio, P. Model Predictive Control for Thermal Comfort Optimization in Building Energy Management Systems. In Proceedings of the 2019 IEEE International Conference on Systems, Man and Cybernetics (SMC), Bari, Italy, 6–9 October 2019; pp. 2608–2613. [Google Scholar] [CrossRef]
- Alamin, Y.I.; Del Castilla, M.M.; Álvarez, J.D.; Ruano, A. An economic model-based predictive control to manage the users’ thermal comfort in a building. Energies 2017, 10, 321. [Google Scholar] [CrossRef]
- Marvuglia, A.; Messineo, A.; Nicolosi, G. Coupling a neural network temperature predictor and a fuzzy logic controller to perform thermal comfort regulation in an office building. Build. Environ. 2014, 72, 287–299. [Google Scholar] [CrossRef]
- Isaia, F.; Fiorentini, M.; Serra, V.; Capozzoli, A. Enhancing energy efficiency and comfort in buildings through model predictive control for dynamic façades with electrochromic glazing. Journal of Building Engineering 2021, 43, 102535. [Google Scholar] [CrossRef]
- Khatami, N.; Hashemi, A. Improving thermal comfort and indoor air quality through minimal interventions in office buildings. Energy Procedia 2017, 111, 171–180. [Google Scholar] [CrossRef]
- Zhang, W.; Liu, F.; Fan, R. Improved thermal comfort modeling for smart buildings: A data analytics study. Int. J. Electr. Power Energy Syst. 2018, 103, 634–643. [Google Scholar] [CrossRef]
- Tardioli, G.; Filho, R.; Bernaud, P.; Ntimos, D. An Innovative Modelling Approach Based on Building Physics and Machine Learning for the Prediction of Indoor Thermal Comfort in an Office Building. Buildings 2022, 12, 475. [Google Scholar] [CrossRef]
- Kim, J.; Schiavon, S.; Brager, G. Personal comfort models–A new paradigm in thermal comfort for occupant-centric environmental control. Build. Environ. 2018, 132, 114–124. [Google Scholar] [CrossRef]
- EN 12665:2018; Light, C.E. Lighting—Basic Terms and Criteria for Specifying Lighting Requirements. CEN: Brussels, Belgium, 2018.
- Yun, G.Y.; Kong, H.J.; Kim, H.; Kim, J.T. A field survey of visual comfort and lighting energy consumption in open plan offices. Energy Build. 2012, 46, 146–151. [Google Scholar] [CrossRef]
- Gou, Z.; Lau, S.S.-Y.; Ye, H. Visual alliesthesia: The gap between comfortable and stimulating illuminance settings. Build. Environ. 2014, 82, 42–49. [Google Scholar] [CrossRef]
- Wei, W.; Wargocki, P.; Zirngibl, J.; Bendžalová, J.; Mandin, C. Review of parameters used to assess the quality of the indoor environment in Green Building certification schemes for offices and hotels. Energy Build. 2020, 209, 109683. [Google Scholar] [CrossRef]
- Gunay, H.B.; O’Brien, W.; Beausoleil-Morrison, I.; Gilani, S. Development and implementation of an adaptive lighting and blinds control algorithm. Build. Environ. 2017, 113, 185–199. [Google Scholar] [CrossRef]
- Iwata, T.; Taniguchi, T.; Sakuma, R. Automated blind control based on glare prevention with dimmable light in open-plan offices. Build. Environ. 2017, 113, 232–246. [Google Scholar] [CrossRef]
- Singh, R.; Lazarus, I.J.; Kishore, V.V. Uncertainty and sensitivity analyses of energy and visual performances of office building with external venetian blind shading in hot-dry climate. Appl. Energy 2016, 184, 155–170. [Google Scholar] [CrossRef]
- Yeon, S.; Yu, B.; Seo, B.; Yoon, Y.; Lee, K.H. ANN based automatic slat angle control of venetian blind for minimized total load in an office building. Sol. Energy 2019, 180, 133–145. [Google Scholar] [CrossRef]
- Aries, M.B.C.; Veitch, J.A.; Newsham, G.R. Windows, view, and office characteristics predict physical and psychological discomfort. J. Environ. Psychol. 2010, 30, 533–541. [Google Scholar] [CrossRef]
- Carli M de Giuli V de Zecchin, R. Review on visual comfort in office buildings and influence of daylight in productivity. Indoor Air 2008, 2008, 17–22. [Google Scholar]
- Xie, J.; Sawyer, A.O.; Karaguzel, Ö.T. (Eds.) Glare-Based Control Strategies for Automated Roller Shades and Blinds in Office Buildings: A Literature Review. In Proceedings of the BSO-V 2020, 5th Building Simulation and Optimization Virtual Conference, Loughborough, UK, 21–22 September 2020. [Google Scholar]
- Yun, G.; Yoon, K.C.; Kim, K.S. The influence of shading control strategies on the visual comfort and energy demand of office buildings. Energy Build. 2014, 84, 70–85. [Google Scholar] [CrossRef]
- Lolli, N.; Nocente, A.; Brozovsky, J.; Woods, R.; Grynning, S. Automatic vs Manual Control Strategy for Window Blinds and Ceiling Lights: Consequences to Perceived Visual and Thermal Discomfort. J. Daylighting 2019, 6, 112–123. [Google Scholar] [CrossRef]
- Sundell, J. On the history of indoor air quality and health. Indoor Air 2004, 14, 51–58. [Google Scholar] [CrossRef]
- Tham, K.W. Indoor air quality and its effects on humans—A review of challenges and developments in the last 30 years. Energy Build. 2016, 130, 637–650. [Google Scholar] [CrossRef]
- EN CS. 16798-1; Energy Performance of Buildings—Ventilation for Buildings—Part 1: Indoor Environmental Input Parameters for Design and Assessment of Energy Performance of Buildings Addressing Indoor Air Quality; Thermal Environment, Lighting and Acoustics—Module M1-6. ISO: Geneva, Switzerland, 2019.
- World Health Organization. WHO Guidelines for Indoor Air Quality: Selected Pollutants; World Health Organization, Regional Office for Europe: Geneva, Switzerland, 2010. [Google Scholar]
- Dodd, N.; Cordella, M.; Traverso, M.; Donatello, S. Level (s)–A Common EU Framework of Core Sustainability Indicators for Office and Residential Buildings; Publications Office of the European Union: Luxembourg, 2017. [Google Scholar]
- Kumar, P.; Martani, C.; Morawska, L.; Norford, L.; Choudhary, R.; Bell, M.; Leach, M. Indoor air quality and energy management through real-time sensing in commercial buildings. Energy Build. 2016, 111, 145–153. [Google Scholar] [CrossRef]
- Laverge, J.; van den Bossche, N.; Heijmans, N.; Janssens, A. Energy saving potential and repercussions on indoor air quality of demand controlled residential ventilation strategies. Build. Environ. 2011, 46, 1497–1503. [Google Scholar] [CrossRef]
- Merema, B.; Delwati, M.; Sourbron, M.; Breesch, H. Demand controlled ventilation (DCV) in school and office buildings: Lessons learnt from case studies. Energy Build. 2018, 172, 349–360. [Google Scholar] [CrossRef]
- Afroz, Z.; Higgins, G.; Shafiullah, G.M.; Urmee, T. Evaluation of real-life demand-controlled ventilation from the perception of indoor air quality with probable implications. Energy Build. 2020, 219, 110018. [Google Scholar] [CrossRef]
- Aryal, A.; Becerik-Gerber, B.; Anselmo, F.; Roll, S.C.; Lucas, G.M. Smart Desks to Promote Comfort, Health, and Productivity in Offices: A Vision for Future Workplaces. Front. Built Environ. 2019, 5, 76. [Google Scholar] [CrossRef]
- Brager, G.; Zhang, H.; Arens, E. Evolving opportunities for providing thermal comfort. Build. Res. Inf. 2015, 43, 274–287. [Google Scholar] [CrossRef]
- Hellwig, R.T. Perceived control in indoor environments: A conceptual approach. Build. Res. Inf. 2015, 43, 302–315. [Google Scholar] [CrossRef]
- Hellwig, R.T.; Boerstra, A. Personal Control over indoor climate disentangled. Part 2. REHVA J. 2018, 2018, 20–23. [Google Scholar]
- Kwon, M.; Remøy, H.; van den Dobbelsteen, A.; Knaack, U. Personal control and environmental user satisfaction in office buildings: Results of case studies in the Netherlands. Build. Environ. 2019, 149, 428–435. [Google Scholar] [CrossRef]
- Yun, G.Y. Influences of perceived control on thermal comfort and energy use in buildings. Energy Build. 2018, 158, 822–830. [Google Scholar] [CrossRef]
- Vischer, J.C. The effects of the physical environment on job performance: Towards a theoretical model of workspace stress. Stress Health J. Int. Soc. Investig. Stress 2007, 23, 175–184. [Google Scholar] [CrossRef]
- Tamas, R.; Ouf, M.M.; O’Brien, W. A field study on the effect of building automation on perceived comfort and control in institutional buildings. Archit. Sci. Rev. 2020, 63, 74–86. [Google Scholar] [CrossRef]
- Day, J.K.; O’Brien, W. Oh behave! Survey stories and lessons learned from building occupants in high-performance buildings. Energy Res. Soc. Sci. 2017, 31, 11–20. [Google Scholar] [CrossRef]
- Brown, Z.; Cole, R.J. Influence of occupants’ knowledge on comfort expectations and behaviour. Build. Res. Inf. 2009, 37, 227–245. [Google Scholar] [CrossRef]
- Liu, X.; Lee, S.; Bilionis, I.; Karava, P.; Joe, J.; Sadeghi, S.A. A user-interactive system for smart thermal environment control in office buildings. Appl. Energy 2021, 298, 117005. [Google Scholar] [CrossRef]
- Akerstream, T.; Knirsch, A.; Pauls, M. Manitoba Hydro Place: Energy Efficiency 2.0. ASHRAE Trans. 2013, 119, 1–8. [Google Scholar]
- Mallory-Hill, S.; Gorgolewski, M. Mind the Gap: Studying Actual Versus Predicted Performance of Green Buildings in Canada. In Building Performance Evaluation: From Delivery Process to Life Cycle Phases; Preiser, W.F., Hardy, A.E., Schramm, U., Eds.; Springer International Publishing: Cham, Switzerland, 2018; pp. 261–274. [Google Scholar] [CrossRef]
- Gawande, S.; Tiwari, R.R.; Narayanan, P.; Bhadri, A. Indoor Air Quality and Sick Building Syndrome: Are Green Buildings Better than Conventional Buildings? Indian J. Occup. Environ. Med. 2020, 24, 30–32. [Google Scholar] [CrossRef] [PubMed]
- Osma, G.; Amado, L.; Villamizar, R.; Ordoñez, G. Building Automation Systems as Tool to Improve the Resilience from Energy Behavior Approach. Procedia Eng. 2015, 118, 861–868. [Google Scholar] [CrossRef]
- Kunicina, N.; Zabasta, A.; Koldisevs, K.; Patlins, A.; Kondratjevs, K. Sensor Networking and Signal Processing Applications for Heating Efficiency Maintenance in High-Rise Apartment Buildings. In Proceedings of the 2017 IEEE 58th International Scientific Conference on Power and Electrical Engineering of Riga Technical University (RTUCON), Riga, Latvia, 10 December 2017; pp. 1–6. [Google Scholar] [CrossRef]
- Novak, T.; Gerstinger, A. Safety- and Security-Critical Services in Building Automation and Control Systems. IEEE Trans. Ind. Electron. 2010, 57, 3614–3621. [Google Scholar] [CrossRef]
- Woods, J.E. Cost avoidance and productivity in owning and operating buildings. Occup. Med. (Phila. Pa.) 1989, 4, 753–770. [Google Scholar]
- Kaushik, A.; Arif, M.; Tumula, P.; Ebohon, O.J. Effect of thermal comfort on occupant productivity in office buildings: Response surface analysis. Build. Environ. 2020, 180, 107021. [Google Scholar] [CrossRef]
- Fisk, W.J. Health and productivity gains from better indoor environments and their relationship with building energy efficiency. Annu. Rev. Energy Environ. 2000, 25, 537–566. [Google Scholar] [CrossRef]
- Veitch, J.A.; Charles, K.E.; Newsham, G.R.; Marquardt, C.J.G.; Geerts, J. Environmental Satisfaction in Open-Plan Environments: 5. Workstation and Physical Condition Effects; NRC Institute for Research in Construction: Ottawa, ON, Canada, 2003; Available online: https://www.researchgate.net/profile/Jennifer-Veitch-2/publication/44077602_Environmental_Satisfaction_in_Open-Plan_Environments_5_Workstation_and_Physical_Condition_Effects/links/0912f50742f20d15d9000000/Environmental-Satisfaction-in-Open-Plan-Environments-5-Workstation-and-Physical-Condition-Effects.pdf (accessed on 13 May 2014).
- Soto Muñoz, J.; Trebilcock Kelly, M.; Flores-Alés, V.; Ramírez-Vielma, R. Understanding the perceived productivity of office occupants in relation to workspace thermal environment. Build. Res. Inf. 2022, 50, 152–170. [Google Scholar] [CrossRef]
- Tanabe, S.; Haneda, M.; Nishihara, N. Workplace productivity and individual thermal satisfaction. Build. Environ. 2015, 91, 42–50. [Google Scholar] [CrossRef]
- Leardini, P.M.; Toftum, J. (Eds.) Practical Application of a New Method for the Assessment of Comfort, Health and Productivity in Offices. In Proceedings of the SB07 Auckland: Transforming our Built Environment, Auckland, New Zealand, 14–16 November 2007. [Google Scholar]
- Seppänen, O.; Fisk, W.J.; Faulkner, D. Control of Temperature for Health and Productivity in Offices; Lawrence Berkeley National Laboratory: Berkeley, CA, USA, 2004. [Google Scholar]
- Seppänen, O.; Fisk, W.J.; Lei, Q.H. Room Temperature and Productivity in Office Work; Lawrence Berkeley National Lab. (LBNL): Berkeley, CA, USA, 2006. [Google Scholar]
- Lan, L.; Wargocki, P.; Lian, Z. Quantitative measurement of productivity loss due to thermal discomfort. Energy Build. 2011, 43, 1057–1062. [Google Scholar] [CrossRef]
- Kaushik, A.; Arif, M.; Ebohon, O.J.; Arsalan, H.; Rana, M.Q.; Obi, L. Effect of indoor environmental quality on visual comfort and productivity in office buildings. J. Eng. Des. Technol. 2021. [Google Scholar] [CrossRef]
- Leccese, F.; Salvadori, G.; Öner, M.; Kazanasmaz, T. Exploring the impact of external shading system on cognitive task performance, alertness and visual comfort in a daylit workplace environment. Indoor Built Environ. 2019, 29, 942–955. [Google Scholar] [CrossRef]
- Turan, I.; Chegut, A.; Fink, D.; Reinhart, C. The value of daylight in office spaces. Build. Environ. 2020, 168, 106503. [Google Scholar] [CrossRef]
- Markussen, S.; Røed, K. Daylight and absenteeism–evidence from Norway. Econ. Hum. Biol. 2015, 16, 73–80. [Google Scholar] [CrossRef]
- Wolkoff, P. Indoor air pollutants in office environments: Assessment of comfort, health, and performance. Int. J. Hyg. Environ. Health 2013, 216, 371–394. [Google Scholar] [CrossRef] [PubMed]
- Park, J.S.; Yoon, C.H. The effects of outdoor air supply rate on work performance during 8-h work period. Indoor Air 2011, 21, 284–290. [Google Scholar] [CrossRef] [PubMed]
- Federspiel, C.C.; Fisk, W.J.; Price, P.N.; Liu, G.; Faulkner, D.; Dibartolomeo, D.L.; Sullivan, D.P.; Lahiff, M. Worker performance and ventilation in a call center: Analyses of work performance data for registered nurses. Indoor Air 2004, 14. [Google Scholar] [CrossRef]
- Wargocki, P.; Wyon, D.P.; Fanger, P.O. The performance and subjective responses of call-center operators with new and used supply air filters at two outdoor air supply rates. Indoor Air 2004, 14, 7–16. [Google Scholar] [CrossRef]
- Wargocki, P.; Wyon, D.P.; Sundell, J.; Clausen, G.; Fanger, P.O. The effects of outdoor air supply rate in an office on perceived air quality, sick building syndrome (SBS) symptoms and productivity. Indoor Air 2000, 10, 222–236. [Google Scholar] [CrossRef]
- Seppänen, O.; Fisk, W.J.; Lei, Q.H. Ventilation and Work Performance in Office Work; Lawrence Berkeley National Laboratory: Berkeley, CA, USA, 2005. [Google Scholar]
- Seppänen, O.; Fisk, W.J.; Lei, Q.H. Ventilation and performance in office work. Indoor Air 2006, 16, 28–36. [Google Scholar] [CrossRef]
- Indoor Air Quality Scientific Findings Resource Bank. Ventilation Rates and Office Work Performance. Available online: https://iaqscience.lbl.gov/ventilation-rates-and-office-work-human-performance#_ENREF_8 (accessed on 3 August 2023).
- Leaman, A.; Bordass, B. Productivity in buildings: The ‘killer’variables. In Creating the Productive Workplace; Taylor & Francis: Abingdon, UK, 2006; pp. 181–208. [Google Scholar]
- Al Horr, Y.; Arif, M.; Kaushik, A.; Mazroei, A.; Katafygiotou, M.; Elsarrag, E. Occupant productivity and office indoor environment quality: A review of the literature. Build. Environ. 2016, 105, 369–389. [Google Scholar] [CrossRef]
- Hodgson, M. Sick building syndrome. Occup. Med. (Phila. Pa.) 2000, 15, 571–585. [Google Scholar]
- Apte, M.G.; Fisk, W.J.; Daisey, J.M. (Eds.) Indoor Carbon Dioxide Concentrations and SBS in Office Workers; Citeseer: Espoo, Finland, 2000. [Google Scholar]
- Fisk, W.J.; Seppanen, O.; Faulkner, D.; Huang, J. Economizer System Cost Effectiveness: Accounting for the Influence of Ventilation Rate on Sick Leave. In Proceedings of the Healthy Buildings 2003 Conference, Singapore, 7–11 December 2003. [Google Scholar]
- Fisk, W.J. Quantitative Relationship of Sick Building Syndrome Symptoms with Ventilation Rates. Indoor Air. 2009, 19, 159–165. [Google Scholar] [CrossRef]
- Milton, D.K.; Glencross, P.M.; Walters, M.D. Risk of sick leave associated with outdoor air supply rate, humidification, and occupant complaints. Indoor Air 2000, 10, 212–221. [Google Scholar] [CrossRef] [PubMed]
- Fisk, W.J.; Black, D.; Brunner, G. Changing ventilation rates in US offices: Implications for health, work performance, energy, and associated economics. Build. Environ. 2012, 47, 368–372. [Google Scholar] [CrossRef]
- Cony, L.; Laverge, J. (Eds.) A Methodology to Assess Economical Impacts of Poor IAQ in Office Buildings from DALY and SBS Induced Costs. In Proceedings of the 2022: CLIMA 2022 The 14th REHVA HVAC World Congress, Rotterdam, The Netherlands, 12–25 May 2022. [Google Scholar]
- van der Voordt, T.; Jensen, P.A. The impact of healthy workplaces on employee satisfaction, productivity and costs. J. Corp. Real Estate 2023, 25, 29–49. [Google Scholar] [CrossRef]
- Mujan, I.; Anđelković, A.S.; Munćan, V.; Kljajić, M.; Ružić, D. Influence of indoor environmental quality on human health and productivity-A review. J. Clean. Prod. 2019, 217, 646–657. [Google Scholar] [CrossRef]
- Parkinson, T.; Schiavon, S.; Kim, J.; Betti, G. Common sources of occupant dissatisfaction with workspace environments in 600 office buildings. Build. Cities 2023, 4. [Google Scholar] [CrossRef]
- Seppänen, O.A.; Fisk, W. Some quantitative relations between indoor environmental quality and work performance or health. HvacR Res. 2006, 12, 957–973. [Google Scholar] [CrossRef]
- Tarantini, M.; Pernigotto, G.; Gasparella, A. A co-citation analysis on thermal comfort and productivity aspects in production and office buildings. Buildings 2017, 7, 36. [Google Scholar] [CrossRef]
- Bueno, A.M.; Paula Xavier AA de Broday, E.E. Evaluating the connection between thermal comfort and productivity in buildings: A systematic literature review. Buildings 2021, 11, 244. [Google Scholar] [CrossRef]


| Type of Study | Impact Area | Benefit | Correlation | Source |
|---|---|---|---|---|
| Review | Thermal comfort | Performance/productivity | −2% of productivity for each +1 °C above 25 °C | [113] |
| Review | Thermal comfort | Performance/productivity | Performance increase with temperature below 22 °C and decreases above 25 °C | [114] |
| Experimental | Thermal comfort | Performance/productivity | Optimum around 22 °C and PMV between 0 and −0.5 | [115] |
| Field intervention | Thermal comfort | Performance/productivity | +3% in execution speed when T from 25.5 °C to 23.5 °C | [112] |
| Review and statistical analysis | Thermal comfort | Health | +12% intensity of SBS-symptoms each +1 °C above 22.5 °C | [140] |
| Review | IEQ | Performance/productivity | +0.5–5% of productivity at building stock level by improving indoor environment | [108] |
| Simulation + market analysis | Visual comfort | Higher rent | +5–6% rent for offices with high daylight values | [118] |
| Empirical analysis | Visual comfort | Reduced sick leave | +1 h of daylight = +0.8% of recovery rate from sickness | [119] |
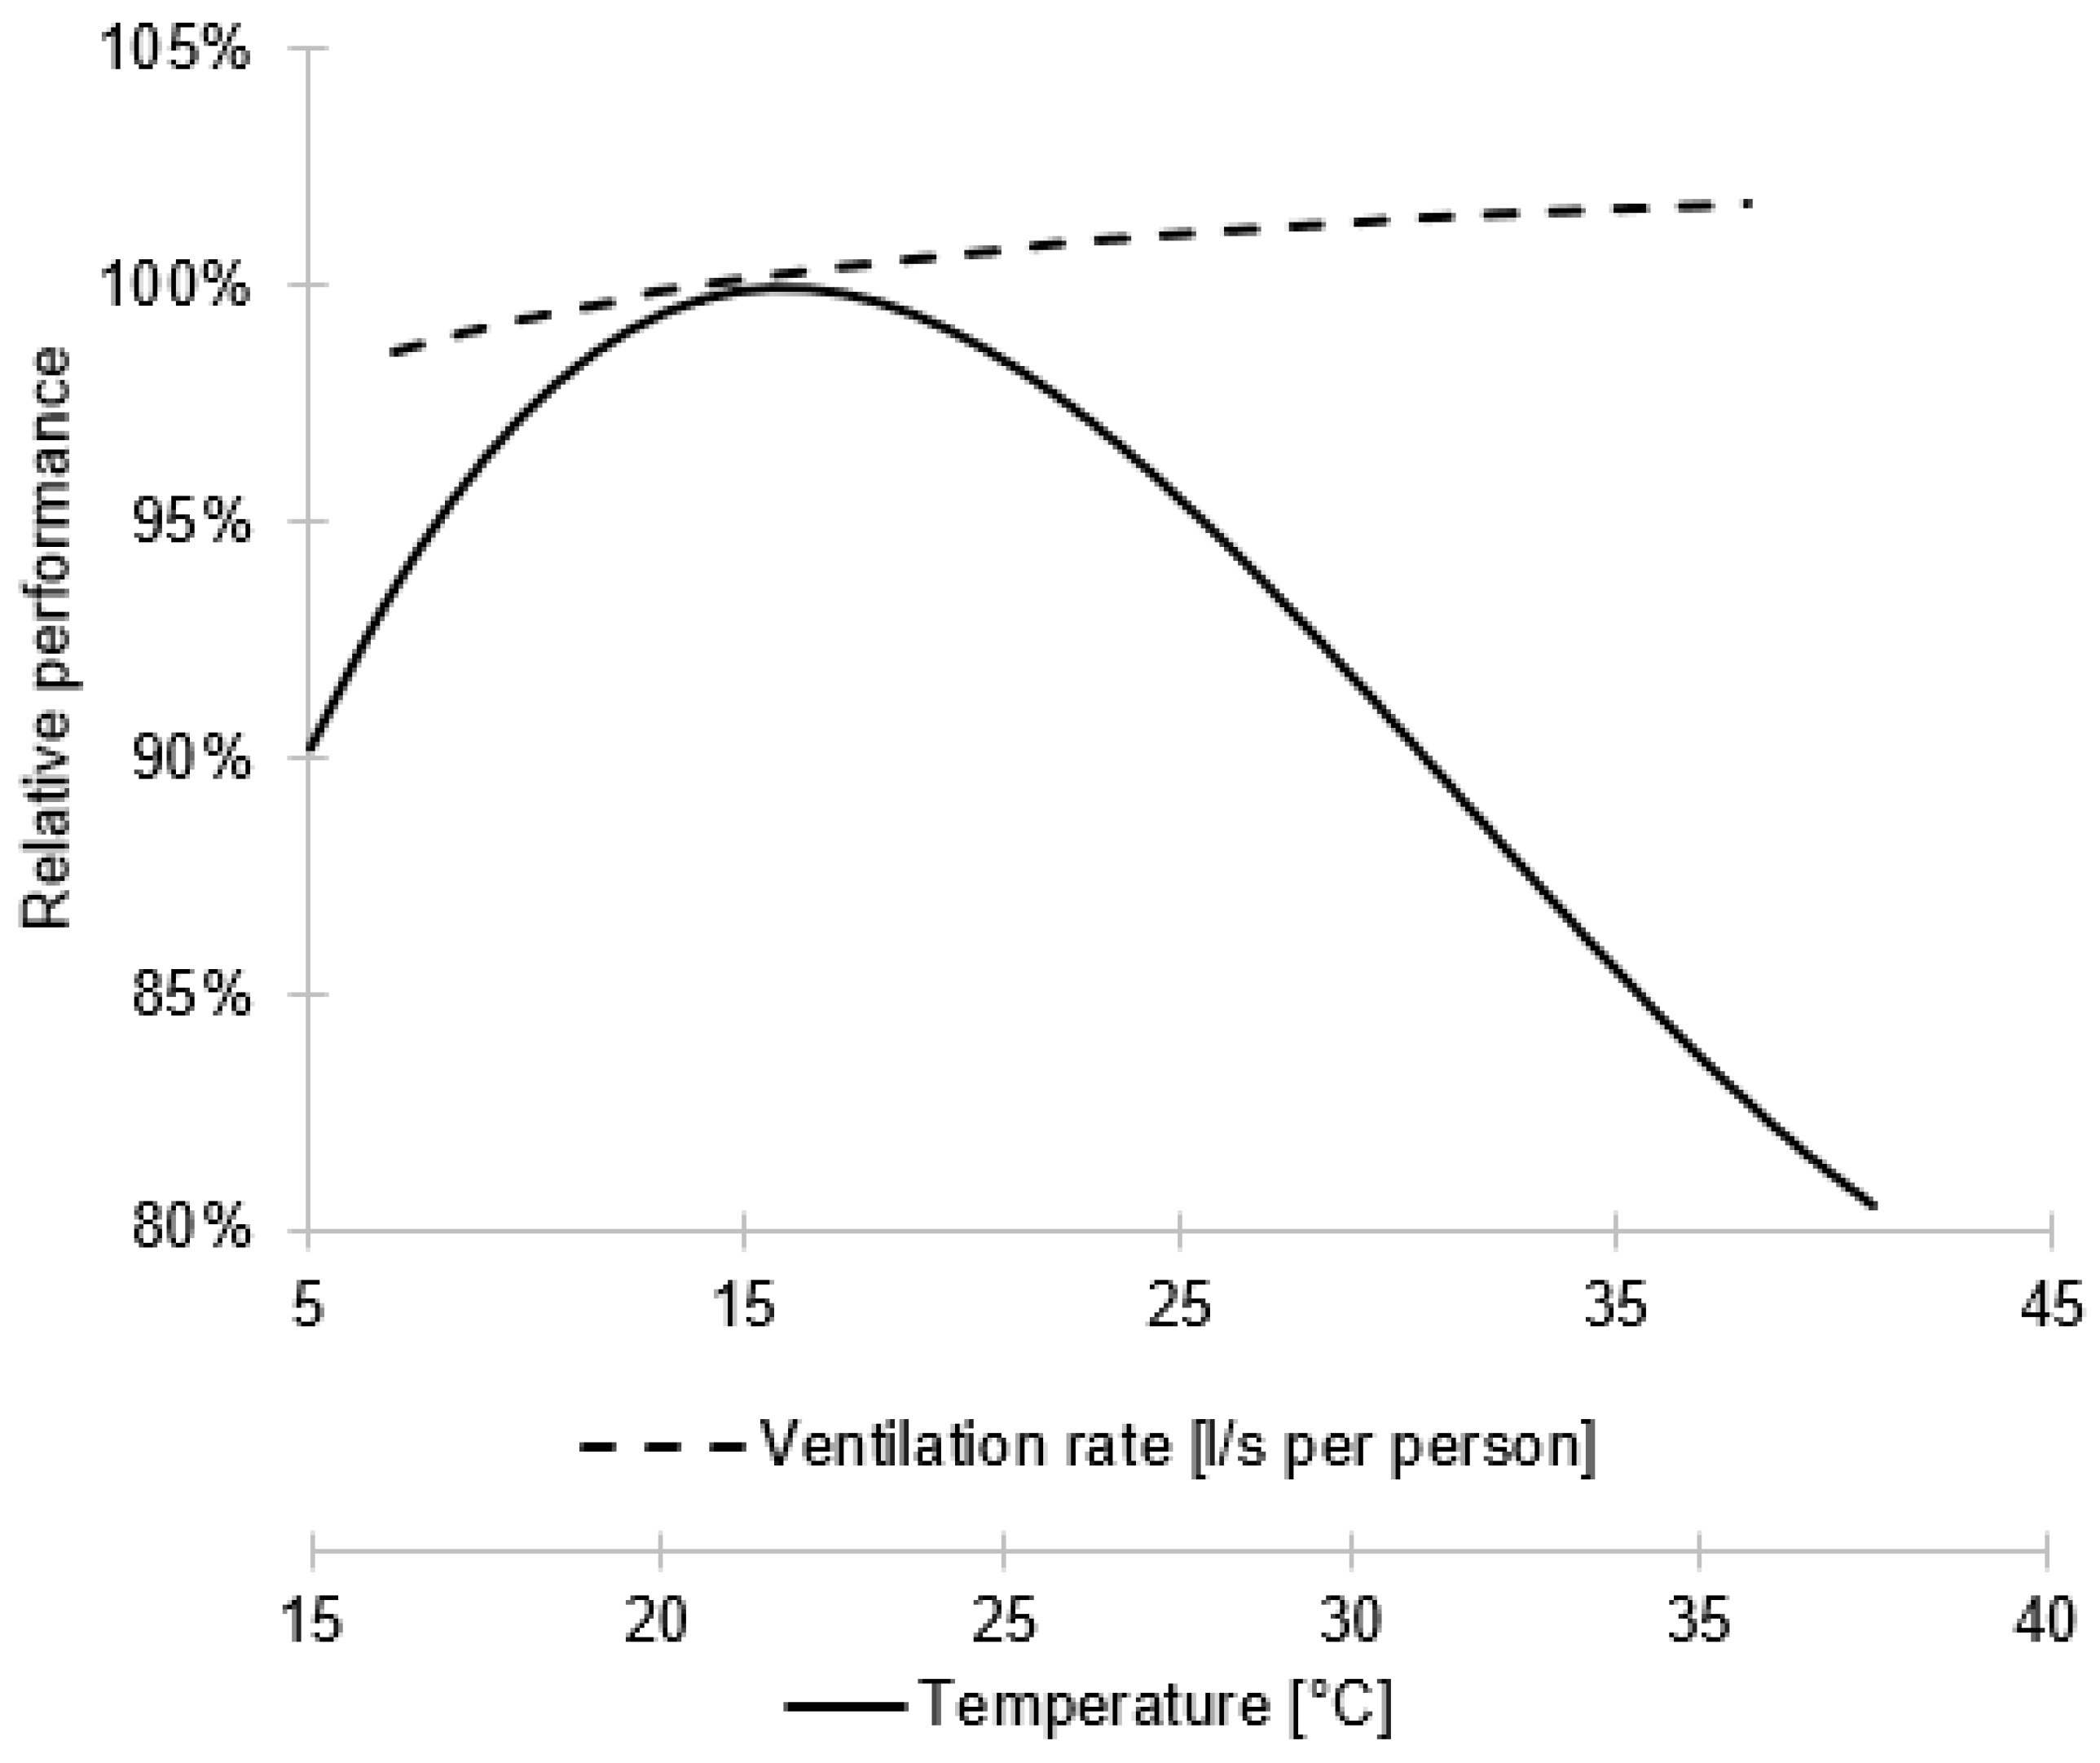
| Experimental | IAQ | Performance/productivity | +2.5–5% of work performance as ventilation rate from 5 to 20 l/s-person | [121] |
| Experimental | IAQ | Performance/productivity | +1.7% productivity for a 100% ventilation rate increase between 3 and 30 l/s-person | [124] |
| Review | IAQ | Performance/productivity | +1–3% productivity per 10 l/s-person. Negligible over 45 l/s-person | [125,126] |
| Empirical analysis | IAQ | Health | Symptoms prevalence decrease by up to 70–85% with large increases in ventilation rate | [131] |
| Review and statistical analysis | IAQ | Health | Risk of short-term sick leave = 35% for low ventilation rates | [134] |
| Review and statistical analysis | IAQ | Health | +23% SBS symptoms for ventilation from 10 to 5 l/s per person; −29% from 10 to 25 l/s per person | [133] |
Disclaimer/Publisher’s Note: The statements, opinions and data contained in all publications are solely those of the individual author(s) and contributor(s) and not of MDPI and/or the editor(s). MDPI and/or the editor(s) disclaim responsibility for any injury to people or property resulting from any ideas, methods, instructions or products referred to in the content. |
© 2023 by the authors. Licensee MDPI, Basel, Switzerland. This article is an open access article distributed under the terms and conditions of the Creative Commons Attribution (CC BY) license (https://creativecommons.org/licenses/by/4.0/).
Share and Cite
Garzia, F.; Verbeke, S.; Pozza, C.; Audenaert, A. Meeting User Needs through Building Automation and Control Systems: A Review of Impacts and Benefits in Office Environments. Buildings 2023, 13, 2530. https://doi.org/10.3390/buildings13102530
Garzia F, Verbeke S, Pozza C, Audenaert A. Meeting User Needs through Building Automation and Control Systems: A Review of Impacts and Benefits in Office Environments. Buildings. 2023; 13(10):2530. https://doi.org/10.3390/buildings13102530
Chicago/Turabian StyleGarzia, Federico, Stijn Verbeke, Cristian Pozza, and Amaryllis Audenaert. 2023. "Meeting User Needs through Building Automation and Control Systems: A Review of Impacts and Benefits in Office Environments" Buildings 13, no. 10: 2530. https://doi.org/10.3390/buildings13102530
APA StyleGarzia, F., Verbeke, S., Pozza, C., & Audenaert, A. (2023). Meeting User Needs through Building Automation and Control Systems: A Review of Impacts and Benefits in Office Environments. Buildings, 13(10), 2530. https://doi.org/10.3390/buildings13102530