Abstract
Indoor air quality is an important consideration for the health and well-being of building occupants, and the SARS CoV-2 pandemic highlighted the importance of maintaining proper ventilation in buildings. Air handling units (AHUs) are used to provide fresh air and maintain occupant comfort. The objective of this work was to study the evolution of filtration efficiency in an AHU fitted with bag filters, installed to treat office air in a low-energy building, over a 12-month period. The particulate filtration efficiency (PFE) and the microbial filtration efficiency (MFE) were quantified by measuring particle size distribution and bacterial and fungal concentration in the air circulating in the AHU. The resulting microbial concentration measurements in the fresh air (between 10²–103 CFU/m3 for fungi and around 103 CFU/m3 for bacteria) were higher than those in the extracted air from the offices (between 101 and 102 CFU/m3 for fungi and around 102 CFU/m3 for bacteria). The PFE and MFE measured were almost constant throughout the 12 months, with an increase of the filter pressure drop from 70 to 90 Pa. The PFE and MFE were quite comparable for a particle diameter. Therefore, the measurement of PFE is a reliable indicator of the MFE.
1. Introduction
The ventilation of buildings and maintenance of facilities to maintain good indoor air quality (IAQ) are topics that have come to the fore as a result of the SARS-CoV-2 pandemic [1,2,3]. The health authorities have notified us of many good practices to adopt on a daily basis to prevent the spread of viral particles. Viral particles are one of a number of pollutants to which we are exposed through direct contact and/or breathing indoor air, and consist of biological pollutants classified as bioaerosols, which include airborne bacteria, fungi, and viruses (living or fragments of), as well as plant particles (pollen, plant fragments) and animal particles or debris.
To better understand exposure to the microbiological contaminants in indoor air, such as viruses, bacteria, and fungi, sampling is essential to identify and quantify them. Numerous studies focusing on exposure to microbial bioaerosols have been carried out on the air quality in hospitals, waste treatment plants, housing, and agricultural environments [4,5,6,7]. Fewer studies have focused, however, on office spaces in terms of employee exposure to these bioaerosols [8].
To maintain suitable air quality, offices are usually ventilated by an air handling unit (AHU). AHUs filter the air entering the building, and thus reduce the airborne pollutants. They also maintain a temperature and a relative humidity between threshold values to ensure the comfort of the building’s occupants. A large variety of AHUs is available with differing characteristics, depending on the specificities of the building.
The construction of new buildings involves new standards and increasing amounts of insulation are being used to optimize energy performance. Openings are also becoming more limited and controlled, reducing the passive ventilation in new constructions. The use of AHUs is therefore important for replacing the polluted air with fresh air [9].
During use, AHU filters become clogged with particles in the filter media. There are three main particle collection mechanisms: impaction, interception, and diffusion [10,11]. Clogging leads to the formation of a particle cake which increases filter pressure drop. The higher the pressure drop, the more energy the fan uses to maintain the air flow [12,13]. In practice, when a certain filter pressure drop threshold is reached, the AHU filters have to be replaced.
It may be possible to measure the particle filtration efficiency (PFE) of filters to discover the extent of clogging development during use. For this purpose, analyzers enable quantification of particle size distribution (PSD) upstream and downstream of the filters to determine their efficiency. The filters used are tested for their particle-filtering efficiency but not for their efficiency in filtering microbial bioaerosols.
Many studies were conducted at the laboratory scale and/or under controlled conditions to determine the filtration efficiency of filters towards microorganisms compared to particles [14,15,16,17]. In general, the filtration efficiencies of microorganisms were similar to those of particles with same aerodynamic diameter due to particle capture mechanisms [14,15,16,17,18].
This study focuses on an AHU in a newly constructed building compliant with low-energy building standards. Most new buildings comply with these standards, so it is important to understand the issues in order to properly ventilate the various rooms inside them. The objectives of this study are: (i) to evaluate the climatic conditions of the air circulating through the AHU over a 12-month period, (ii) to study the evolution of pressure drop in the filters, (iii) to quantify the development of particle and microbiological filtration efficiencies, and (iv) to establish whether microbiological and particle filtration efficiencies are related. These new results obtained under real-life conditions over 12 months are compared with previous studies carried out under laboratory conditions with controlled aerosols.
2. Materials and Methods
2.1. Air Handling Unit Characteristics
The AHU studied is located in a building at IMT Atlantique in Nantes, France. The building is approximately 50 km from the Atlantic Ocean and the climate is oceanic, with an average temperature of 13.2 °C and rainfall of 801.7 mm/year (over the period 2011–2022). The study started in February 2021 and continued for 12 months, until February 2022.
The two-story building was constructed in 2014. It has a green roof and complies with low-energy building standards and more specifically the “Bâtiment Basse Consommation” French standard for newly constructed buildings. These buildings conform to the RT2012 standard by consuming less than 50 k Whpe/(m² · year), meaning less than 50 kW of primary energy per m² and per year. It comprises classrooms, meeting rooms, offices, practical rooms, and laboratories. The AHU investigated in this study handles the offices; another AHU handles the other rooms. The AHU investigated handles air for 47 offices spread over the two floors of the building. The total surface area of the offices supplied with fresh air and extracted air is 802 m², each office is 17 m² on average. The offices accommodate between 1 and 3 people. The air changes per hour (ACH) is 1.
The AHU operates at a constant flow rate of 2450 m3 per hour. There are two compartments—one for fresh air and one for extracted air, with a rotating heat exchanger between the two compartments (Figure 1). Each compartment contains two bag filters in parallel. The filters are classified as ISO Epm1 60% under the ISO16890 standard. They are composed of three layers: a high-efficiency glass microfiber filtration medium with a carded polyester mesh and a synthetic pre-filter layer. The filtration area of each filter is 1.5 m².
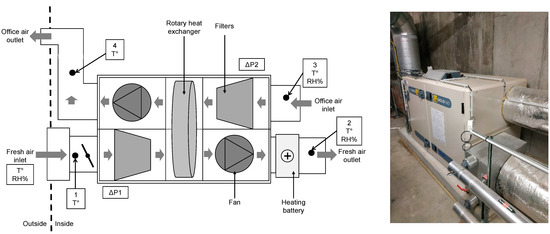
Figure 1.
Picture and simplified diagram of AHU components.
Figure 1 is a simplified diagram of the AHU, with the two compartments for air inlet and air outlet, and the different components. Each compartment contains two four-bag filters upstream of the rotary heat exchanger. A heating battery is located after the fresh air compartment on the supply air duct to regulate the temperature of the air supply to the office at 19 °C in winter. The dots numbered 1 to 4 in the figure represent the locations for measuring the temperature and relative humidity parameters in the ducts. Two data loggers provided continuous data acquisition from all temperature, relative humidity, and pressure sensors, at a frequency of 1/60 Hz.
2.2. Characterization of Airborne Particle Size Distribution and Mass Concentration
Measurements of particle size distribution (PSD) upstream and downstream of the AHU compartments (at measurement locations 1, 2, 3, and 4) were carried out with an Aerodynamic Particle Sizer (APS™, TSI Incorporated, Shoreview, MI, USA) 3321. This spectrometer provides high-resolution, real-time aerodynamic measurements of particles between around 0.5 and 20 µm in diameter.
At location 1, the mass concentration of particulate matter in the outdoor air was measured continuously during the campaign with a 1405 TEOM™ (Thermo Scientific™, St. Louis, MO, USA), an ambient particulate monitor with an oscillating microbalance.
2.3. Quantification and Identification of Cultivable Bacterial and Fungal Aerosols
Two Andersen 6-stage cascade impactors (Tisch Environmental Inc., Cleves, OH, USA) were used to quantify the airborne cultivable bacterial and fungal aerosols upstream and downstream of the AHU compartments, at sampling locations 1, 2, 3, and 4. The air sampling rate was 28.3 L/min. Air samples were collected at 10, 15, and 20 min on Petri dishes filled with different solid media to promote bacterial or fungal growth. The media selected for the sampling of bacteria and fungi were LB (Luria Bertani), a non-selective medium for isolation of aerobic mesophilic bacteria; R2A (Reasoner’s 2A agar), a non-selective medium for growth of inhibited bacteria on rich organic media; MEA (Malt Extract Agar), a non-selective medium for enumeration of yeasts and fungi typically used to determine fungal contamination of the air; DG18 (Dichloran-Glycerol), a selective medium with low water activity for xerophilic fungi typically used to determine fungal contamination of the air; and DRBC (Dichloran Rose-Bengal Chloramphenicol), a selective medium for yeast and fungi growth (inhibits bacteria growth and prevents colony spreading). The impactor was disinfected with 70% ethanol between each sampling.
After air sampling, the Petri dishes were incubated at 25 ± 2 °C for three to seven days. The bacteria or fungi growing on the media were enumerated to determine the number of colony-forming units (CFU) per m3 of air sampled. Note that in accordance with Andersen [19] stages 4, 5, and 6, a positive hole correction was applied for stages 4–6 where necessary.
During the study, isolated colonies after incubation were transferred to new Petri dishes and identified using two different methodologies. The selection of colonies was done in such a way that well-isolated colonies were uncontaminated subcultures. These colonies were selected randomly, but with the intention of creating a representative sample of the colonies most frequently observed. These samples were not exhaustive but gave an idea of the diversity of cultivable microbial aerosols. The fungal colonies were observed under light microscope (Olympus, model CX43, Rungis, France) after staining the mycelium with cotton blue. The specific patterns of hyphae and spores were used to determine the genus of these fungi. Where determination of the genus was not possible this way, DNA was extracted from the colony, amplified by PCR using iProof™ High-Fidelity PCR Kit (BioRAD, Hercules, CA, USA) with the primers 26F 5′-AGAGTTTGATCCTGGCTCA and 1492R 5′-GGTTACCTTGTTACGACTT for bacterial identification; and ITS5 5′-GGAAGTAAAAGTCTAACAAGG and ITS4 5′-TCCTCCGCTTATTGATATGC for fungi identification; and sequenced with Sanger sequencing by Eurofins genomics (Germany).
The various parameters measured in the study are summarized in Table 1. Note that the samples were taken from the center of the ducts using sampling probes. For particles and microorganisms, sampling was carried out in isokinetic conditions. The methodology implemented is based on particle and bacterial sampling in the AHU one time by month. Thus, the particle and bacterial concentrations and collection efficiencies are not representative of the variations that can be observed over a whole month.

Table 1.
Methodology and strategy deployed.
2.4. Calculation of Particle and Microbial Efficiencies
Concentrations of cultivable microbial aerosols (CMA) upstream and downstream of the filters were determined from two parallel samplings with the two Andersen impactors and then by enumerating the colonies on the 6-stage impactors.
The cultivable microbial concentrations sampled upstream and downstream of the filters relating to stage of the impactors, and (CFU/m3), are expressed by Equation (1).
With the volume of air sampled (m3) and the number of colonies enumerated at impactor stage .
The total microbial concentrations sampled upstream and downstream of filters and (CFU/m3) were calculated using the six stages of the impactor, using Equation (2).
The total microbial filtration efficiency and fractional microbial filtration efficiency , i.e., the related to the stage , were calculated using Equation (3).
Equation (4) was used to calculate the relative uncertainties of fractional microbial efficiency .
With the absolute uncertainty related to the microbial concentration from stage . According to Macher [20], a relative uncertainty of = 7% can be applied for a microbial concentration with this type of six-stage impactor. We therefore considered the relative uncertainty of the fractional microbial concentrations sampled upstream and downstream of the filters to be determined by Equation (5).
The absolute uncertainties of fractional microbial concentration were expressed using Equation (6) where the number of colonies counted downstream of the compartment was greater than 0.
The relative uncertainties of total microbial concentrations sampled upstream and downstream of the filters and total microbial filtration efficiency (MFE) were calculated using Equations (7) and (8).
Total particulate filtration efficiency () was calculated using Equation (9), taking into account the sum of the particles counted upstream and downstream of the filters over the channels of the APS, related to particle diameters from <0.523 µm to 19.81 µm.
with and (particle/cm3) the particle concentrations upstream and downstream of the filters, measured with the APS for particle diameter/channel . The relative uncertainties associated with were considered as being 5%.
Fractional particulate filtration efficiencies , related to particles with a diameter , were calculated using Equation (10).
Average fractional particle filtration efficiencies were calculated for several particle diameter ranges corresponding to Andersen impactor stages 7 µm and above, 4.7–7.0 µm, 3.3–4.7 µm, 2.1–3.3 µm, 1.1–2.1 µm, and 0.65–1.1 µm, corresponding respectively to stages 1 to 6.
In practice, the were calculated for stages 2 to 6, and when the number of particles counted upstream of the filter was high enough to calculate an efficiency. was calculated by averaging the between 5.05 and 6.73 µm (5 channels), between 3.52 and 4.7 µm (5 channels), between 2.29 and 3.28 µm (6 channels), between 1.2 and 2.13 µm (9 channels), and between 0.67 and 1.11 µm (8 channels).
The absolute uncertainties were the standard deviation of (Equation (11)),
With the number of APS channels taken into account for the calculation of for particle diameter range/impactor stage .
3. Results and Discussion
3.1. Climatic Conditions
Figure 2 shows the changes in temperature and relative humidity measured during the study for fresh air and extracted air (measurement locations 1 and 3).
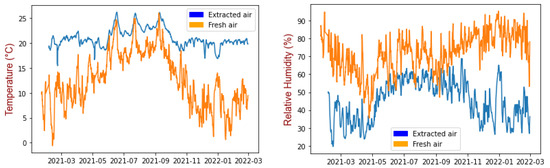
Figure 2.
Temperature (left) and relative humidity (right) for fresh air and extracted air. Sliding average of data over 24 h.
The temperature of the fresh air (25% 9.0 °C; mean 13.2 °C; 75% 18.3 °C) was lower than that of the extracted air from the offices (25% 20.1 °C; mean 20.6 °C; 75% 21.1 °C), and the relative humidity was higher than in the extracted air (fresh air 25% 63.6(%); mean 75.6(%); 75% 83.2(%) and extracted air 25% 28.9(%); mean 32.3(%); 75% 37.3(%)) (Figure 2). In the summer, there was less difference between fresh air and extracted air. The relative humidity of the extracted air from the offices was higher between June and November. The temperature changed according to the season, the temperature of the outside air showing greater amplitude. The filters in the two compartments were exposed to two different environments in terms of temperature and humidity. The temperature and relative humidity of the extracted air followed a logical pattern, as the heating battery and the rotary heat exchanger were providing thermal comfort for the building occupants (RH between 30% and 60%).
3.2. Measurements of Particle Concentration and Distribution
Table 2 shows the results obtained from TEOM measurement of fresh air.
Table 2.
Particle mass concentration statistics (mean, standard deviation, percentiles).
The mass concentration of particles in the fresh air entering the AHU fluctuated around 12.5 µg/m3 over the 12 months. Isolated peaks were also observed, with an average increase in value of up to 150 µg/m3 over 24 h. Table 2 shows that 50% of particle mass concentrations ranged between 7.2 and 16.6 µg/m3.
Table 3 gives the data on particle size distribution and number concentration in fresh air and extracted air upstream and downstream of the compartments, obtained with APS measurements.
Table 3.
Median particle diameter, geometric standard deviation of particles, and number concentration in fresh air and extracted air.
The profiles for particle size distribution in the extracted air at the AHU inlet were similar for the different samples across the study. There was a mono-modal polydispersed distribution of particles; the average modal diameter ranged between 0.6 µm and 0.7 µm. PSDs were more varied for fresh air at the AHU inlet, with modal diameters varying more widely than for the extracted air compartment (Table 3). In both cases, the majority of particles had a median diameter of less than 1 µm. It was difficult to determine the modal diameter of the particles because it was close to the minimum diameter of the APS (0.5 µm). Another sampler allowing broader analysis of the PSD might have allowed investigation of particles with smaller diameters.
The APS measurements showed that particle concentration was higher in the air entering the fresh air compartment than in the office air entering the AHU extracted air compartment. The filters in the fresh air compartment reduced the amount of particulate matter being blown into the offices.
A comparison of particle concentrations at the outlet of the fresh compartment and the inlet of the extracted compartment revealed that occupancy of the offices and activities taking place in them do not result in any significant increase in particulate matter.
3.3. Measurements of Microbial Concentration
Figure 3 and Figure 4 and Table 4 show concentrations of cultivable microbial aerosols (CMA) studied in the fresh and extracted air from counts with media that promote bacterial or fungal growth. An example of a Petri dish after incubation is shown in Appendix A Figure A1.
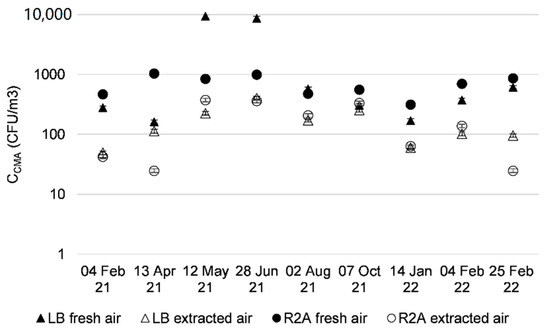
Figure 3.
Cultivable microbial aerosols with media-promoting bacterial growth, sampled from fresh and extracted air upstream of AHU filters, over 12 months.
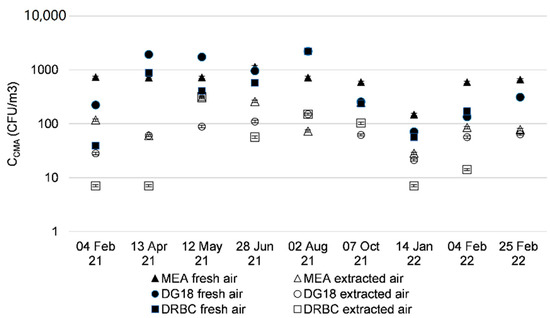
Figure 4.
Cultivable fungal concentration sampled from fresh and extracted air upstream of AHU filters over 12 months.
Table 4.
Average diameters of cultivable microbial aerosols (CMA) measured by impaction on the five media.
For bacteria, the concentrations of airborne cultivable microorganisms were higher in the fresh air than in the extracted air (Figure 3). For fresh air, the concentrations ranged between 102 and 103 CFU/m3. An increase in bacteria in aerosols was observed for the months of May and June 2021 on LB medium, peaking at 104 CFU/m3. This was also observed by Frankel [21].
The concentrations of fungi were higher for all three media (MEA, DG18, and DRBC) in fresh air (Figure 4); concentration levels were around 103 CFU/m3 for fresh air. The concentrations of cultivable fungal aerosols in the extracted air ranged from 101 to 102 CFU/m3; these concentrations were stable throughout the sampling in different months. It appears that the MEA medium led to a higher microbial concentration with slightly higher concentrations.
The concentrations of cultivable microorganisms in the outdoor air were higher than those measured in the extracted air from offices (102 and 103 CFU/m3 vs. around 102 respectively). These results concur with those found in the literature for concentrations in CFU/m3 in outdoor air and samples taken in offices or other buildings [5,6,22,23]. The culture media used were LB and R2A to promote the growth of bacterial genera, and MEA DG18 and DRBC for fungal genera, which may also give different readings. The DRBC and DG18 fungal media are selective media; the compound inhibits the growth of bacteria. Since bacteria cannot multiply, only fungal species were measured on these media. The MEA medium does not contain any inhibitor for bacterial growth, but its nutrients promote mainly the growth of yeasts and fungi. The selected bacterial media did not contain inhibitors for fungal growth, but did contain nutrients to promote bacterial growth. Bacterial and fungal colonies were counted on the plates containing these media. The results are to be interpreted with caution, as higher concentrations of bacterial aerosols were to be expected in the office intake air. This is because the occupation of offices by staff generates bacterial aerosols from the occupant’s microbiome, as it is the case at home [24].
The mean CMA diameters measured by impaction on the five media varied between 1.35 and 5.56 µm depending on the culture medium and the day and location of sampling. The average diameter (± standard deviation) was 3.13 ± 0.77 µm. These results are in agreement with previous studies. The authors determined with 6-stage Andersen impactor that average value for fungal aerosol diameters were between 2.1 µm and 4.7 µm [5] or between 1.1 µm and 3.3 µm [25]. The cut-off diameter of bacterial aerosols were less than 2.1 µm [25].
For extracted air, the average diameters of CMA from the fungal media (2.95 ± 0.76 µm) seemed to be higher than those from the bacterial media (2.54 ± 0.53 µm) with a confidence level of 98%. For fresh air, the results indicate that the average diameters of CMA from the fungal media (3.57 ± 0.62 µm) were not significantly higher (with a critical risk of 18%) than those from the bacterial media (3.37 ± 0.76 µm). This result is consistent with the fact that fungi can grow on bacterial media.
The average diameters of CMA in the fresh air were significantly higher than those in the extracted air, with a confidence level of above 99% for both bacterial and fungal media.
The growth of fungal species on LB and R2A media interfered with the observation of bacterial colonies. In addition, bacterial aerosols are more sensitive to desiccation than fungal spores, and collection by direct impaction may generate stress, which could also affect the results.
3.4. Filtration Performance
3.4.1. Filter Pressure Drops and Particle Filtration Efficiency
Figure 5 shows the pressure drops of the AHU filters measured during the study.
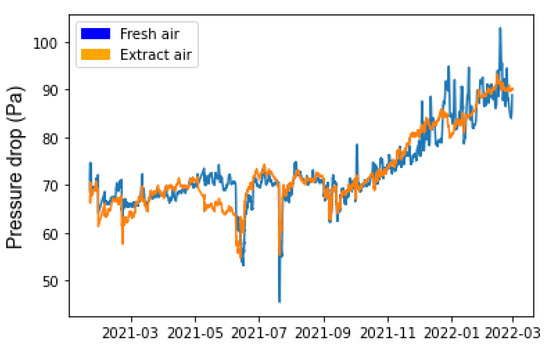
Figure 5.
Filter pressure drop over 12 months. Sliding average of data over 24 h.
The curves representing the pressure drop for the two compartments have similar profiles (Figure 5). From the beginning of the study until September, the pressure drops for the two filters were stable, at between 65 and 70 Pa. In September, after about 6 months of operation, the pressure drop showed a linear increase, reaching about 90 Pa for fresh air and 80 Pa for extracted air. This pressure drop evolution followed a classic profile, with two stages of clogging [26]. The first stage was consistent with clogging due to depth filtration, where the glass fiber filter medium captures particles in its depth. In this period, the pressure drop did not change and remained stable. Following this, there was an increase in the pressure drop of the filters, related to clogging and the formation of a particulate cake on the surface of the filter medium. The pressure drops in June and July are related to maintenance operations and power cuts.
Figure 6 shows the total particulate filtration efficiency (PFE) results and corresponding median diameters upstream of the compartments. Figure 7 shows the fractional PFE for diameters of 0.5 µm and 1 µm.
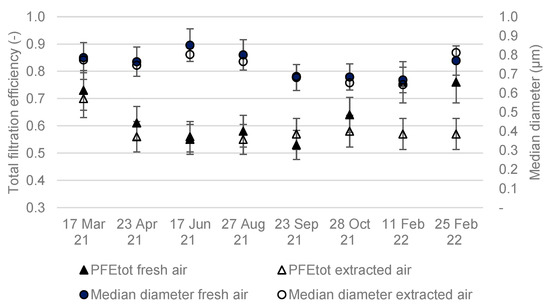
Figure 6.
Total particle filtration efficiency over 12 months.
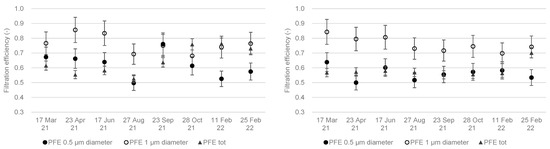
Figure 7.
Total particle filtration efficiency and filtration efficiency for aerosol diameters 0.5 µm and 1 µm in the fresh air (left) and extracted air (right) compartments over 12 months.
The total particle filtration efficiencies of the two compartments varied between 50% and 80% (Figure 6). The median particle diameter ranged between 0.7 and 0.9 µm. No increase in was observed during the study, despite the clogging of the filters and the increase in pressure drop. Particle filtration efficiencies at 0.5 µm and 1 µm were also stable throughout the study. An increase in the particle filtration efficiency of a filter is usually observed with filter clogging and the formation of a particle cake on the filter media [26]. It is possible that the filters were not sufficiently clogged for this to be observed, and that sampling over a longer period of time would have highlighted the increase in efficiency.
Filtration efficiency for particles with a diameter close to 1 µm ranged between 70% and 80%. The filtration efficiency of particles 1 µm in diameter was higher than for those 0.5 µm in diameter (Figure 7) in both the fresh air and extracted air compartments. In this range of particle diameters, the particles are collected mainly by the impaction mechanism, the efficiency of which increases with an increase in particle diameter or inertia [10,26]. The filtration efficiency with extracted air for particles 0.5 µm in diameter was close to the total particle filtration efficiency.
3.4.2. Comparison of Fractional Microbial Filtration Efficiency (MFE) and Particle Filtration Efficiency (PFE)
Figure 8 shows the fractional PFE and MFE results with media promoting bacterial growth in May 2021.
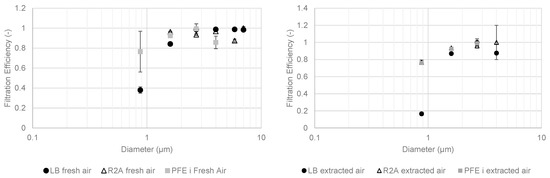
Figure 8.
Fractional filtration efficiency of particles and cultivable microbial aerosols with bacterial media in May 2021 for fresh (left) and extracted (right) compartments.
Bacterial and particle efficiencies were lower with decreasing particle diameters because of the impaction collection mechanism. Lower concentrations upstream of the extracted air compartment produced more contrasting results. For cultivable bacterial aerosols larger than 1 µm in diameter, fractional filtration efficiencies were between 80% and 100% for both compartments. Below 1 µm, the efficiencies were lower than 80%.
Figure 9 shows the fractional PFE and MFE results with fungal media in May 2021.
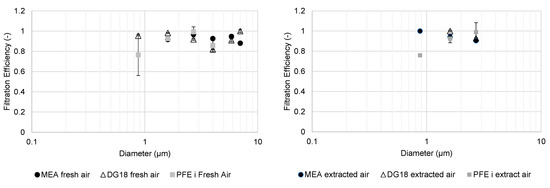
Figure 9.
Fractional filtration efficiency of particles and cultivable microbial aerosols with fungal media in May 2021 for fresh (left) and extracted (right) compartments.
The fractional MFE of fungal aerosols for MEA and DG18 media were between 80% and 100% for the fresh air compartment. In contrast to the results with bacterial aerosols, there was no decrease in fractional MFE for cultivable fungal aerosols with a diameter of less than 1 µm.
The results for the extracted air compartment were similar for fractional PFE and MFE, in both DG18 and MEA media. There was also no decrease in fractional MFE for cultivable fungal aerosols analyzed in the MEA medium for diameters of less than 1 µm, but the low concentrations upstream of the extracted air compartment gave more conflicting results.
Figure 10 shows the fractional PFE and MFE results with media promoting bacterial growth in February 2022.
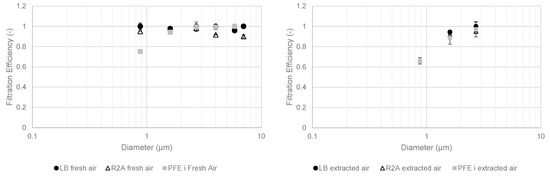
Figure 10.
Fractional filtration efficiency for particles and cultivable microbial aerosols with bacterial media in February 2022 for fresh (left) and extracted (right) compartments.
The fractional efficiencies calculated for cultivable bacterial aerosols in February 2022 were close to 100% for LB and R2A media. The profile for fractional PFE was similar to those observed in May 2021. There were no data for extracted air relating to fractional MFE with diameters under 1 µm because the number of colonies was below the quantification limit for extracted air (LQ: limit of quantification less than 10 colonies). In comparison with the data for the period May 2021 to February 2022, the MFE for particles smaller than 1 µm was about 40% with LB medium in fresh air in May 2021, and about 100% in February 2022. Filter clogging therefore increased the MFE for particles smaller than 1 µm in the LB medium.
Figure 11 gives the fractional PFE and MFE results with fungal media in February 2022.
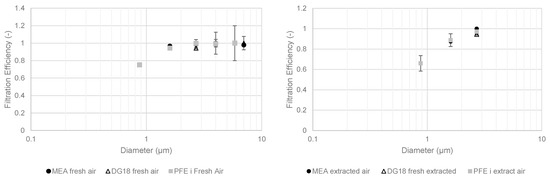
Figure 11.
Fractional filtration efficiency of particles and cultivable microbial aerosols with fungal media in February 2022 for fresh (left) and extracted (right) compartments.
The fractional MFEs for cultivable fungal aerosols for February 2022 were also close to 100% for MEA and DG18 media in the fresh air compartment. The same observations were made for the extracted air compartment. However, there were significantly fewer cultivable microbial aerosols collected in the impactor stages upstream of the filters. The data presented are similar to those measured for cultivable bacterial aerosols.
Measurements of spectral filtration efficiencies for particulate matter and cultivable microbial aerosols showed similar results. A comparison of these filtration efficiencies for equivalent diameters of particulate and microbial aerosols appears to be consistent. The efficiencies measured were very close for all diameters above 1 µm. Below 1 µm, the efficiencies were lower for both types of aerosols. It would seem that the filtration efficiencies of microbial aerosols can be investigated by direct measurement of the particles under real operational AHU conditions. These results obtained under real-life conditions are in agreement with those obtained in previous laboratory studies under controlled conditions [14,15].
3.5. Bacterial and Fungal Identification
Table 5 and Table 6 give the results after identification of isolated colonies using either microscopy or colony-PCR. These results are to be interpreted as a qualitative result of the colonies most often found on Petri dishes after impaction.
Table 5.
Fungi identified by light microscopy or colony-PCR.
Table 6.
Bacteria identify by colony-PCR.
In terms of fungal genera, Cladosporium, Aspergillus, and Penicillium were most often observed by light microscopy in both compartments (Table 5 and Table 6). These fungi are commonly identified in indoor air quality studies [27]. Other fungal species were identified in the fresh air. These species were probably airborne from plants or plant debris since they are commonly associated with plant-microorganism interactions.
Micrococcus luteus is a bacterial species present on the human skin microbiota [28]. This result concurs with the literature as these bacteria are probably related to human activities in offices. Tsukamurella spumae is an actinomycete isolated from the foam of activated sludge plants [29]. Kocuria rhizophila are actinobacteria isolated from the rhizoplane of narrow-leaved cattail [30]; the building was located close to the river Erdre and wetlands, where this type of plant is often found. Arthrobacter flavus is a psychrophilic bacterium isolated from a cyanobacterial mat sample from a pond in Antarctica [31]. Bacteria Aeromonas sp. and Paracoccus marinus are frequently found in aquatic environments. Their presence can also be explained by the proximity of the river Erdre [32,33].
4. Conclusions
The measured climatic conditions (temperature and relative humidity) of the fresh air follow a classical seasonal pattern. Those of the extracted air from the offices fluctuate less because the AHU allows comfortable climatic conditions maintained for the occupants.
The pressure drops of the two bag filters installed in the fresh air and extracted air compartments of the air handling unit follow a classical profile over the 12 months. During the first months, the pressure drop is stable with deep clogging of the filter media, and then it increases with clogging of the filter surface.
Particulate and microbiological total filtration efficiencies remained almost stable during the study.
The fractional collection efficiencies of particles and microorganisms were also quantified over 12 months. Our study demonstrated that filtration efficiencies of particulate matter and cultivable microbial aerosols bigger than 1 µm in aerodynamic diameter were comparable. Direct measurement of particulate filtration efficiency could be a good indicator of filtration efficiency for cultivable microbial aerosols. These results obtained under realistic conditions are consistent with previous studies carried out under controlled conditions.
Further investigations may be carried out to establish a relationship between the efficiencies for particle filtration (direct measurements that are easier to implement) and microbial filtration (which require a more complex protocol). In addition, analyses using molecular biology techniques could be carried out to investigate filtration efficiencies with different microbial populations, in particular the viral diversity found on each side of the filter, which has been inadequately studied and is of particular importance in the context of the COVID-19 pandemic.
Author Contributions
Conceptualization, A.J., Y.A. and P.L.C.; formal analysis, G.P., A.J., Y.A. and P.L.C.; investigation, G.P., A.J., Y.A. and P.L.C.; methodology, G.P., A.J., Y.A. and P.L.C.; supervision, A.J., Y.A. and P.L.C.; validation, A.J., Y.A. and P.L.C.; writing—original draft, G.P.; writing—review and editing, A.J., Y.A. and P.L.C. All authors have read and agreed to the published version of the manuscript.
Funding
This research received no external funding.
Institutional Review Board Statement
Not applicable.
Informed Consent Statement
Not applicable.
Data Availability Statement
Data available on request.
Acknowledgments
Thank you to EHESP (Rennes, France) and to IMT Atlantique (Nantes, France) for allowing the realization of this study. Thanks to Anne Gérard, Hélène Renaud, and Sophie Payet for the manipulations performed at EHESP. Thanks to the technical team of GEPEA laboratory at IMT Atlantique for the implementation of the AHU.
Conflicts of Interest
The authors declare no conflict of interest.
Appendix A

Figure A1.
Example of a Petri dish with MEA medium after incubation, sample made with a 6-stage Andersen impactor.
References
- Li, Y.; Leung, G.M.; Tang, J.W.; Yang, X.; Chao, C.Y.; Lin, J.Z.; Lu, J.W.; Nielsen, P.V.; Niu, J.; Qian, H.; et al. Role of ventilation in airborne transmission of infectious agents in the built environment ? a multidisciplinary systematic review. Indoor Air 2007, 17, 2–18. [Google Scholar] [CrossRef] [PubMed]
- Qian, H.; Miao, T.; Liu, L.; Zheng, X.; Luo, D.; Li, Y. Indoor transmission of SARS-CoV-2. Indoor Air 2021, 31, 639–645. [Google Scholar] [CrossRef]
- Szekeres, S.; Kostyák, A.; Szodrai, F.; Csáky, I. Investigation of Ventilation Systems to Improve Air Quality in the Occupied Zone in Office Buildings. Buildings 2022, 12, 493. [Google Scholar] [CrossRef]
- Bruni, E.; Simonetti, G.; Bovone, B.; Casagrande, C.; Castellani, F.; Riccardi, C.; Pomata, D.; Di Filippo, P.; Federici, E.; Buiarelli, F.; et al. Evaluation of Bioaerosol Bacterial Components of a Wastewater Treatment Plant Through an Integrate Approach and In Vivo Assessment. Int. J. Environ. Res. Public Health 2020, 17, 273. [Google Scholar] [CrossRef] [PubMed]
- Pastuszka, J.S.; Paw, U.K.; Lis, D.O.; Wlazło, A.; Ulfig, K. Bacterial and fungal aerosol in indoor environment in Upper Silesia, Poland. Atmos. Environ. 2000, 34, 3833–3842. [Google Scholar] [CrossRef]
- Sautour, M.; Sixt, N.; Dalle, F.; l’Ollivier, C.; Fourquenet, V.; Calinon, C.; Paul, K.; Valvin, S.; Maurel, A.; Aho, S.; et al. Profiles and seasonal distribution of airborne fungi in indoor and outdoor environments at a French hospital. Sci. Total Environ. 2009, 407, 3766–3771. [Google Scholar] [CrossRef]
- Shelton, B.G.; Kirkland, K.H.; Flanders, W.D.; Morris, G.K. Profiles of Airborne Fungi in Buildings and Outdoor Environments in the United States. Appl. Environ. Microbiol. 2002, 68, 11. [Google Scholar] [CrossRef]
- Gołofit-Szymczak, M.; Górny, R.L. Microbiological air quality in office buildings equipped with dventilation systems. Indoor Air 2018, 28, 792–805. [Google Scholar] [CrossRef]
- Meadow, J.F.; Altrichter, A.E.; Kembel, S.W.; Kline, J.; Mhuireach, G.; Moriyama, M.; Northcutt, D.; O’Connor, T.K.; Womack, A.M.; Brown, G.Z.; et al. Indoor airborne bacterial communities are influenced by ventilation, occupancy, and outdoor air source. Indoor Air 2014, 24, 41–48. [Google Scholar] [CrossRef]
- Davies, C.N. Air Filtration [By] C.N. Davies; Academic Press: Cambridge, MA, USA, 1973; Available online: https://books.google.fr/books?id=o0zguAAACAAJ (accessed on 4 July 2022).
- Rubenstein, D.I.; Koehl, M.A.R. The Mechanisms of Filter Feeding: Some Theoretical Considerations. Am. Nat. 1977, 111, 981–994. [Google Scholar] [CrossRef]
- Fisk, W.J.; Faulkner, D.; Palonen, J.; Seppanen, O. Performance and costs of particle air filtration technologies: Air filtration technology. Indoor Air 2002, 12, 223–234. [Google Scholar] [CrossRef] [PubMed]
- Zaatari, M.; Novoselac, A.; Siegel, J. The relationship between filter pressure drop, indoor air quality, and energy consumption in rooftop HVAC units. Build. Environ. 2014, 73, 151–161. [Google Scholar] [CrossRef]
- González, L.F.; Joubert, A.; Andrès, Y.; Liard, M.; Renner, C.; Le Coq, L. Filtration performances of HVAC filters for PM10 and microbial aerosols—Influence of management in a lab-scale air handling unit. Aerosol Sci. Technol. 2016, 50, 555–567. [Google Scholar] [CrossRef]
- Miller-Leiden, S.; Lohascio, C.; Nazaroff, W.W.; Macher, J.M. Effectiveness of In-Room Air Filtration and Dilution Ventilation for Tuberculosis Infection Control. J. Air Waste Manag. Assoc. 1996, 46, 869–882. [Google Scholar] [CrossRef]
- Forthomme, A.; Joubert, A.; Andrès, Y.; Simon, X.; Duquenne, P.; Bemer, D.; Le Coq, L. Microbial aerosol filtration: Growth and release of a bacteria–fungi consortium collected by fibrous filters in different operating conditions. J. Aerosol Sci. 2014, 72, 32–46. [Google Scholar] [CrossRef]
- Huang, R.; Agranovski, I.; Pyankov, O.; Grinshpun, S. Removal of viable bioaerosol particles with a low-efficiency HVAC filter enhanced by continuous emission of unipolar air ions. Indoor Air 2008, 18, 106–112. [Google Scholar] [CrossRef] [PubMed]
- Hinds, W.C.; Zhu, Y. Aerosol Technology: Properties, Behavior, and Measurement of Airborne Particles; John Wiley & Sons: Hoboken, NJ, USA, 2022. [Google Scholar]
- Andersen, A.A. New Sampler for the Collection, Sizing, and Enumeration of Viable Airborne Particles. J. Bacteriol. 1958, 76, 471–484. [Google Scholar] [CrossRef] [PubMed]
- Macher, J.M. Positive-Hole Correction of Multiple-Jet Impactors for Collecting Viable Microorganisms. Am. Ind. Hyg. Assoc. J. 1989, 50, 561–568. [Google Scholar] [CrossRef]
- Frankel, M.; Bekö, G.; Timm, M.; Gustavsen, S.; Hansen, E.W.; Madsen, A.M. Seasonal Variations of Indoor Microbial Exposures and Their Relation to Temperature, Relative Humidity, and Air Exchange Rate. Appl. Environ. Microbiol. 2012, 78, 8289–8297. [Google Scholar] [CrossRef]
- Anua, S.M.; Haris, N.F.; Mazlan, N. Bioaerosol Levels in Indoor Air of Animal House and Hospital Laboratories; A Comparison with Library and Administrative Offices. Malays. J. Med. Health Sci. 2020, 16, 94–100. [Google Scholar]
- Chao, H.J.; Schwartz, J.; Milton, D.K.; Burge, H.A. Populations and determinants of airborne fungi in large office buildings. Environ. Health Perspect. 2002, 110, 777–782. [Google Scholar] [CrossRef]
- Dunn, R.R.; Fierer, N.; Henley, J.B.; Leff, J.W.; Menninger, H.L. Home Life: Factors Structuring the Bacterial Diversity Found within and between Homes. PLoS ONE 2013, 8, e64133. [Google Scholar] [CrossRef] [PubMed]
- Jeong, S.B.; Ko, H.S.; Heo, K.J.; Shin, J.H.; Jung, J.H. Size distribution and concentration of indoor culturable bacterial and fungal bioaerosols. Atmos. Environ. X 2022, 15, 100182. [Google Scholar] [CrossRef]
- Novick, V.J.; Monson, P.R.; Ellison, P.E. The effect of solid particle mass loading on the pressure drop of HEPA filters. J. Aerosol Sci. 1992, 23, 657–665. [Google Scholar] [CrossRef]
- Dallongeville, A.; Le Cann, P.; Zmirou-Navier, D.; Chevrier, C.; Costet, N.; Annesi-Maesano, I.; Blanchard, O. Concentration and determinants of molds and allergens in indoor air and house dust of French dwellings. Sci. Total Environ. 2015, 536, 964–972. [Google Scholar] [CrossRef]
- Kloos, W.E.; Musselwhite, M.S. Distribution and Persistence of Staphylococcus and Micrococcus Species and Other Aerobic Bacteria on Human Skin. Appl. Microbiol. 1975, 30, 15. [Google Scholar] [CrossRef] [PubMed]
- Nam, S.-W.; Chun, J.; Kim, S.; Kim, W.; Zakrzewska-Czerwinska, J.; Goodfellow, M. Tsukamurella spumae sp. nov., A Novel Actinomycete Associated with Foaming in Activated Sludge Plants. Syst. Appl. Microbiol. 2003, 26, 367–375. [Google Scholar] [CrossRef]
- Kovács, G.; Burghardt, J.; Pradella, S.; Schumann, P.; Stackebrandt, E.; Màrialigeti, K. Kocuria palustris sp. nov. and Kocuria rhizophila sp. nov., isolated from the rhizoplane of the narrow-leaved cattail (Typha angustifolia). Int. J. Syst. Evol. Microbiol. 1999, 49, 167–173. [Google Scholar] [CrossRef]
- Reddy, G.S.; Aggarwal, R.K.; Matsumoto, G.I.; Shivaji, S. Arthrobacter flavus sp. nov., a psychrophilic bacterium isolated from a pond in McMurdo Dry Valley, Antarctica. Int. J. Syst. Evol. Microbiol. 2000, 50, 1553–1561. [Google Scholar] [CrossRef] [PubMed]
- Khan, S.T.; Takaichi, S.; Harayama, S. Paracoccus marinus sp. nov., an adonixanthin diglucoside-producing bacterium isolated from coastal seawater in Tokyo Bay. Int. J. Syst. Evol. Microbiol. 2008, 58, 383–386. [Google Scholar] [CrossRef]
- Parker, J.L.; Shaw, J.G. Aeromonas spp. clinical microbiology and disease. J. Infect. 2011, 62, 109–118. [Google Scholar] [CrossRef] [PubMed]
Publisher’s Note: MDPI stays neutral with regard to jurisdictional claims in published maps and institutional affiliations. |
© 2022 by the authors. Licensee MDPI, Basel, Switzerland. This article is an open access article distributed under the terms and conditions of the Creative Commons Attribution (CC BY) license (https://creativecommons.org/licenses/by/4.0/).