1. Introduction
Structural health monitoring is a strategy and process to evaluate the condition of a structural system by monitoring the load, environmental conditions, and dynamic response of the structure. Bridge structure damage detection has always been one of the hot research topics in the field of health detection, including the identification of damaged areas and the assessment of damage degree [
1,
2]. Its purpose is to judge whether the civil engineering structure is damaged and its location and damage degree, then predict the remaining life, and make future maintenance decisions for the monitored structure.
According to the applied characteristic data, damage detection methods can be divided into static identification methods [
3,
4,
5], dynamic identification methods [
6,
7,
8], and static–dynamic identification methods [
9,
10]. The damage detection of a bridge structure based on static tests is to carry out a static load test on the bridge structure under the closed condition of bridge operation and measure the static parameters such as deflection and strain of the bridge under static load. The method of structural damage detection based on dynamic tests [
11,
12] has been widely used in structural damage detection. Through the dynamic load test of the bridge structure, the overall dynamic performance of the bridge structure is obtained, and the amount of changes in the dynamic characteristics of the structure is taken as the basis for judging the operation condition and damage degree of the bridge [
13,
14]. Fabrizio vestronil et al. [
15] deduced from the partial differential equation of vibration that the eigenvalue of the equation is a function of the damage position and degree of the structure. Through the vibration test of a simply supported beam, the damage degree and position of the beam can be determined qualitatively by using the minimum frequency difference before and after the damage. Perera et al. [
9] proposed a damage detection method that can combine static and dynamic measurements in the model updating program. In the proposed method, global and local damage detection are combined to simplify the inspection procedure. Chang et al.[
6] studied the influence of vehicle parameters and speed on damage detection by conducting mobile vehicle bridge crossing experiments in the laboratory. The results show that higher vehicle speed can increase the accuracy of damage detection. Deng et al. [
16] proposed a probability-based damage detection method for long-span bridges. By eliminating the temperature effect of the measured modal frequency, small abnormalities of the bridge modal can be detected. Chen et al. [
17] proposed a multi-cross reference method to identify the damage of highway bridges using long-gauge fiber Bragg grating sensors with high durability. The results of numerical simulation and field experiment prove the accuracy of this method. Mohsen Mousavi et al. [
18] conducted damage detection research on the bridge according to the instantaneous frequency and amplitude of the bridge under dynamic loads.
With the increasing application of health monitoring systems in large-scale structures, data-driven safety assessment technology has been widely used [
19]. Machine learning can expand a large amount of input data and summarize the problems with similar basic characteristics distribution. Therefore, the structure damage detection theory based on machine learning has been studied [
20,
21]. Xiang et al. [
22] proposed a novel two-stage approach based on convolutional neural networks and an improved hunter–prey optimization algorithm to identify the structural damage. A numerical model of a frame structure and a test structure of a three-story frame were adopted to verify the effectiveness of the proposed method. Luo et al. [
23] presented a review of the technical literature concerning variations in the vibration properties of civil structures under varying temperature conditions and damage detection methods for bridge structures. The progress in research on the probability analysis method, the artificial intelligence method, and the optimization algorithm method in this field was reviewed. Lei et al. [
24] proposed a structural damage detection method based on convolutional neural network, which can identify structural damage under unknown load.
The Bayesian network is derived from the theory of probability theory and graph theory. It has a rigorous mathematical theoretical interpretation basis of probability theory. It is one of the most efficient theoretical models in the field of uncertain knowledge expression and reasoning in the current period [
25]. In engineering, when using a Bayesian network to study uncertainty, it mainly includes reasoning diagnosis and reasoning prediction, which are two key research directions. Sousa and Einstein [
26] developed a geological case prediction model and construction strategy decision-making model. These two models are based on the Bayesian network and combine professional domain knowledge and actual field measurement data to guide tunnel tunneling and risk decision-making. Xia et al. [
27] established a life-cycle risk assessment system for large-scale infrastructure by using a Bayesian network, on the basis of summarizing the risk factors existing in previous infrastructure projects and combining expert opinions. Feng et al. [
28] applied a Bayesian network to predict the degree of tunnel extrusion. The research shows that the prediction error rate of a Bayesian network to the actual results is low, and it supports the prediction of results under incomplete data. In applying Bayesian networks for safety evaluation and damage detection of engineering structures and mechanical systems, Fang et al. [
29] proposed the use of a nested discrete Bayesian network-based approach to construct the mapping relationship between structural responses and failure states of truss structures, and the failure risk of truss elements were evaluated by using the topology results of the trained Bayesian networks. Moreover, in the literature [
30], a Bayesian network was developed for providing a potential tool of the automatic damage detection of the yaw system, and the results show that the proposed three-layer Bayesian network model is capable of accurately identifying the drawbacks of the yaw system by combining with a BIC-based optimization strategy.
Compared with the traditional neural network algorithms [
31], if the logical relationship of network nodes for Bayesian networks can be clearly defined based on the prior information of structures, it would significantly reduce the requirements of training samples and enhance the training efficiency of the network model. In addition, the prediction results of Bayesian networks are usually presented by using probability distributions, which can be further applied for the reliability evaluation of structures [
29]. However, when using Bayesian networks for response prediction of large-scale structures, the number of network nodes are significantly increased due to the low correlation of network nodes. Furthermore, the prediction accuracy of Bayesian networks partly depends on the predefined network architecture, and an unreasonable network structure may cause inaccurate prediction results.
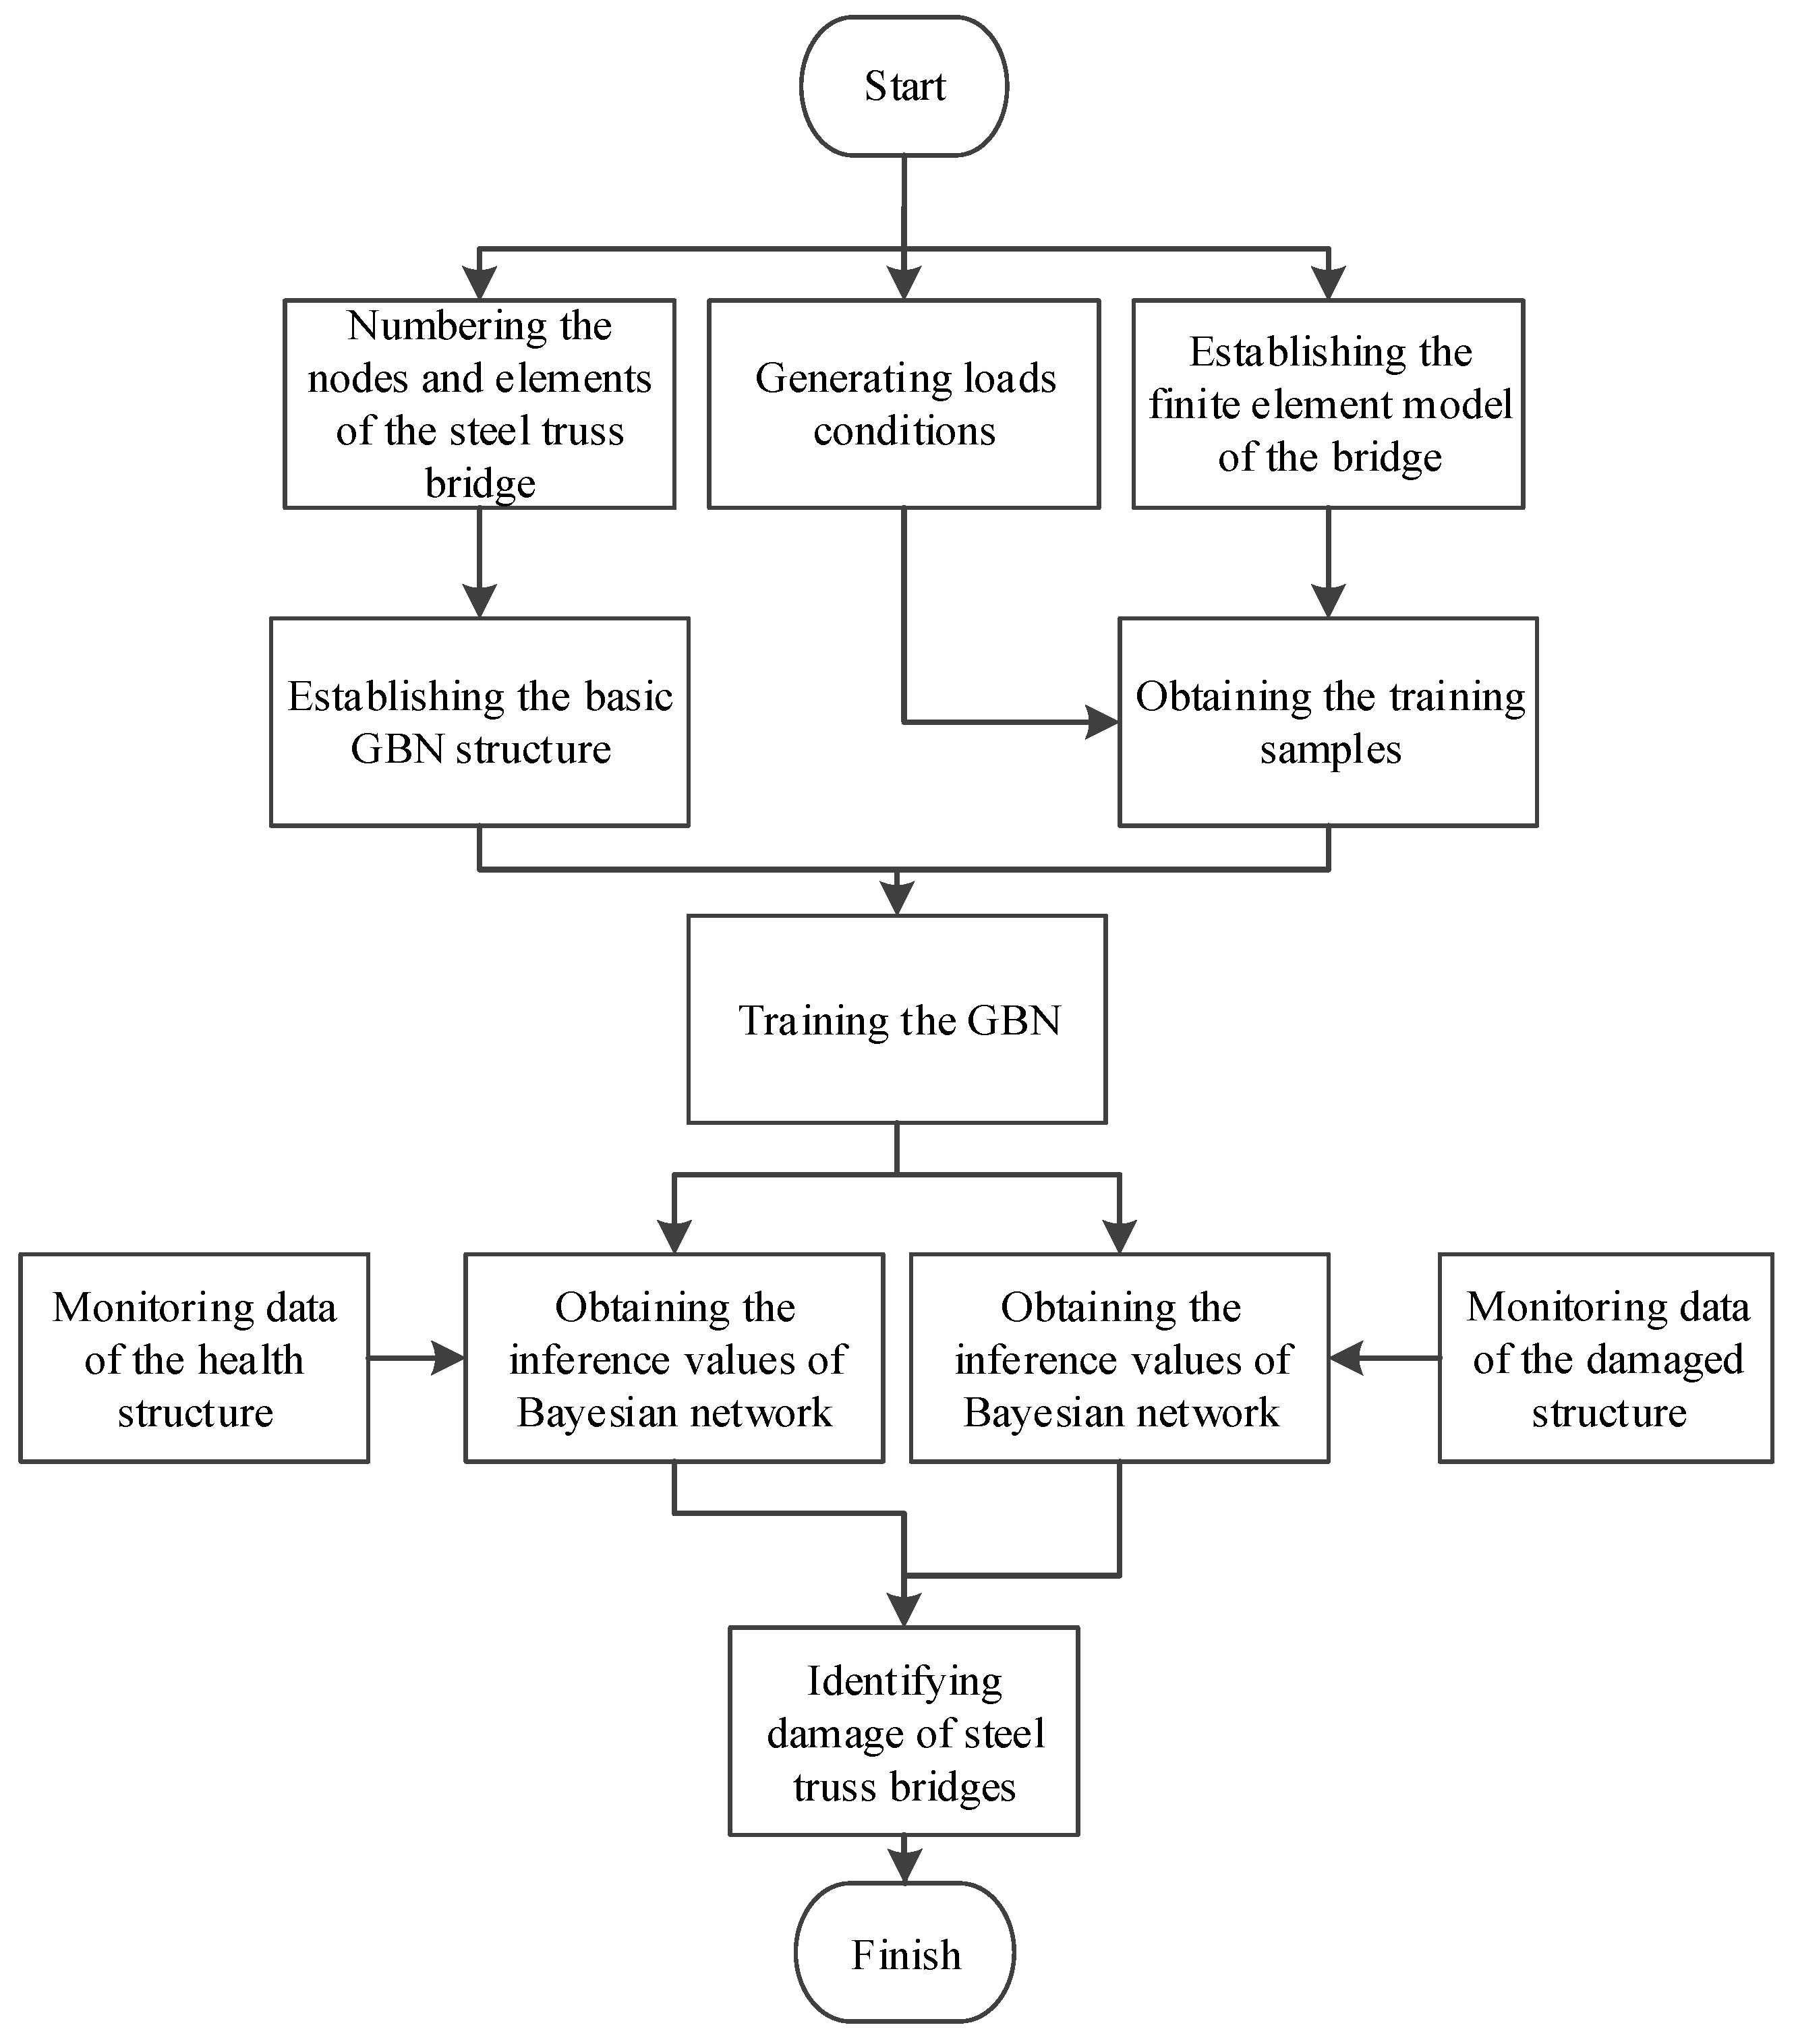
Based on the superior topology characteristics of Bayesian networks, in this study, the continuous Gaussian Bayesian networks were used for response prediction of steel truss bridge structures, and the prediction results were further applied for damage detection of such type of structures with a defined damage index. The proposed procedure can be described as: (1) According to the structural characteristics of steel truss bridges, a three-layer GBN model was first constructed based on the load factors and structural responses. (2) The finite element analysis of a bridge structure was performed to obtain the training data subjected to the various load excitations. (3) The training of a three-layer GBN model was achieved by using the maximum likelihood estimation. (4) Based on the trained network model, the stress measurements of all truss elements of bridges can be accurately estimated by searching the optimized topological information among network nodes. (5) The damage detection of steel truss bridges can be achieved by using the defined damage index with the estimated stress values of all truss elements.
The organization of this paper is as follows:
Section 2 describes the basic structure and characteristics of Bayesian networks and derives the parameter learning process of the GBN based on Bayesian parameter estimation. Then, the damage index and damage detection method of the steel truss bridge based on the GBN are proposed.
Section 3 takes an 80 m steel truss bridge under static load as a numerical example to verify the feasibility of the method.
Section 4 studies the damage detection of steel truss bridges under moving loads. Finally, conclusions are drawn in
Section 5.
3. Static Damage Detection Based on GBN
In order to verify the feasibility and accuracy of the damage detection method of steel truss bridge based on the GBN, this section takes a steel truss bridge under 80 m as a numerical example to carry out the damage detection research of a steel truss bridge under static load. Firstly, according to the damage detection process proposed in this paper, the GBN network model with three-layer nodes was established. Then, the finite element model of a steel truss bridge was used to calculate its response under different load factors. The obtained structural response data were used as the training samples of the GBN network to realize the parameter learning of the GBN network model and obtain the trained GBN network. Finally, the known load information of the steel truss bridge and a limited number of element stress test data were used as input and substituted into the trained GBN network to realize the inference of residual stress of the web members. Based on the stress inference results of the steel truss bridges, the damage location and damage degree of bridge structures were realized by using the damage index proposed in this paper.
3.1. Bridge Finite Element Model
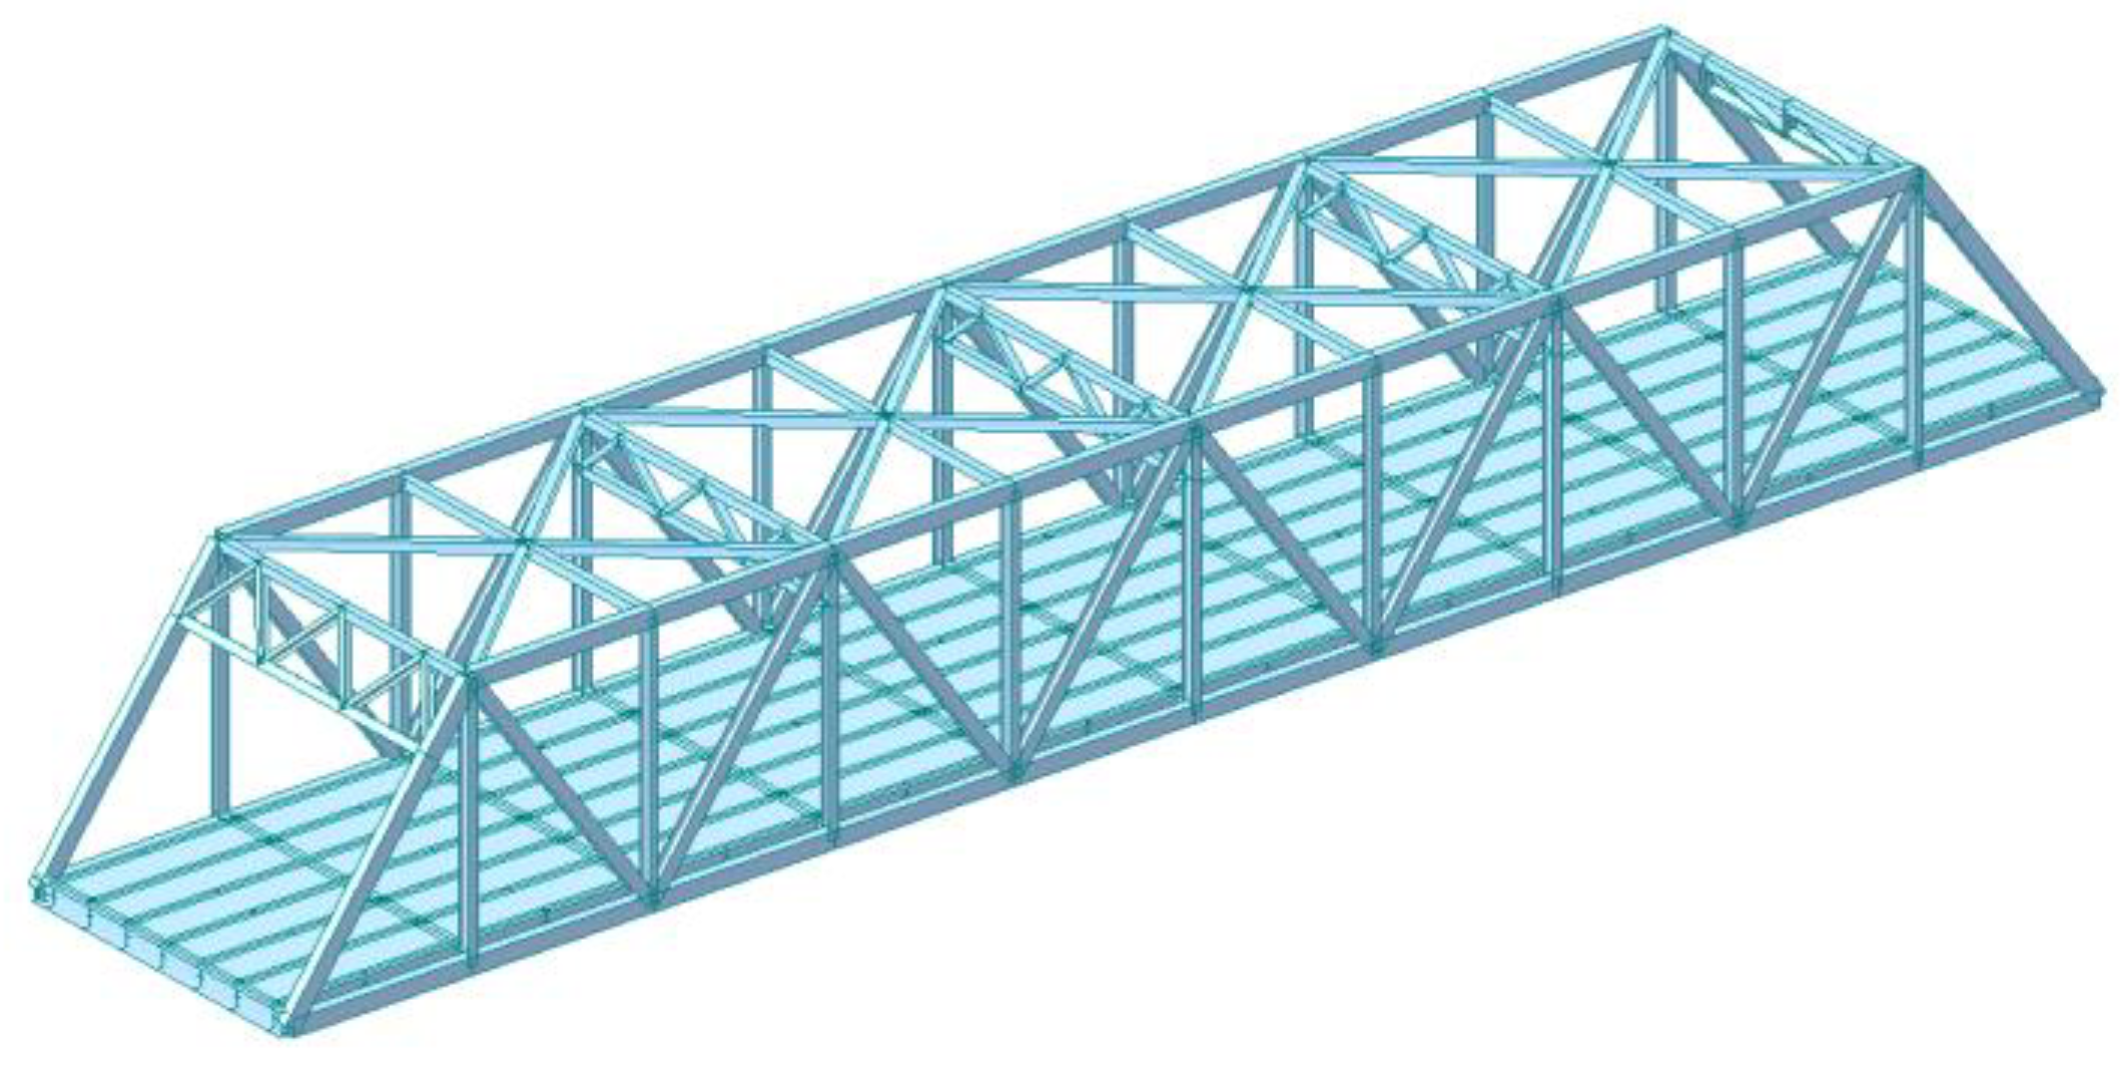
The finite element model of the 80 m steel truss bridge was established, as shown in
Figure 3. The structure of the bridge is a simply supported underpass steel truss girder composite girder bridge. The internode length of the steel truss girder is 8 m, the height of the main truss is 11 m, and the ratio of height to span is 1/7.3. The upper and lower strings of the main truss adopt a box-type section, and the web members adopt an H-type section. The deck of the bridge is composed of composite beams, which are combined with concrete bridge panels on the upper layer and steel beams on the lower layer. The material parameters of the model are shown in
Table 1.
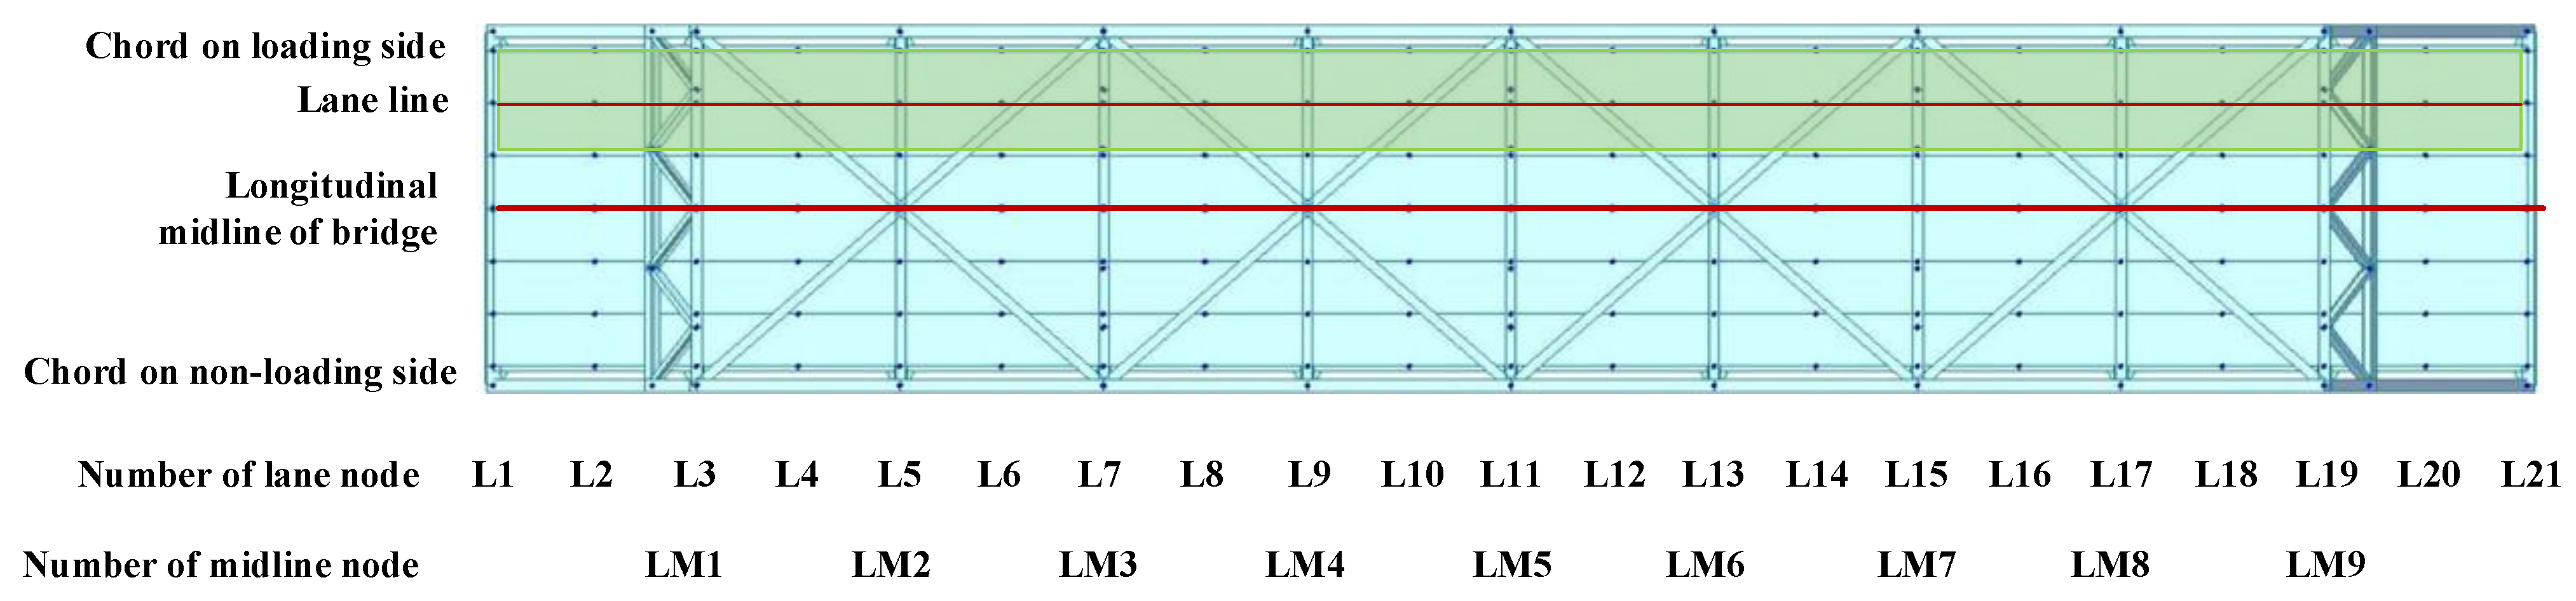
For the purpose of studying the influence of load positions on the structural responses, the lane line of the bridge was set as the load position. Twenty-one nodes on the lane line were selected as load action nodes and are numbered from L1 to L21.
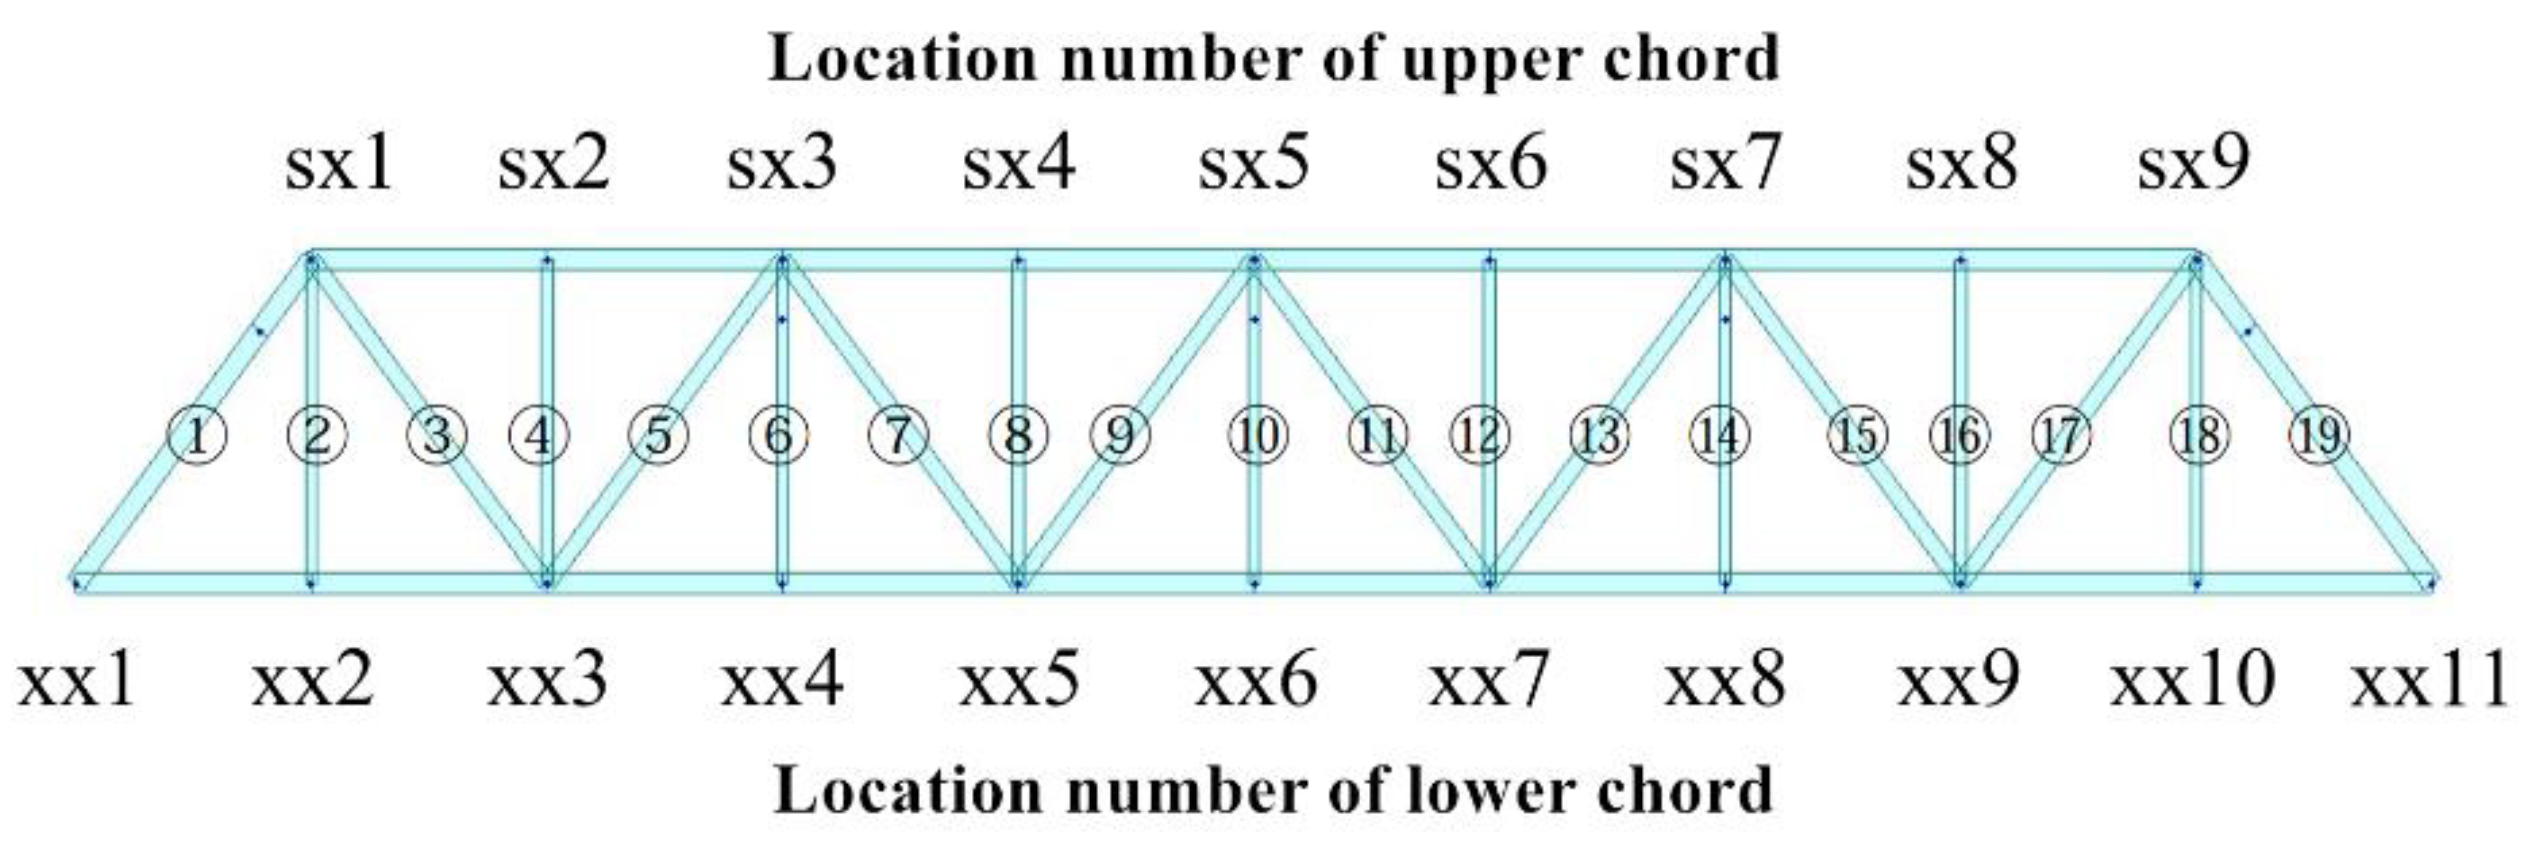
To distinguish the detailed locations of truss elements, the symmetrical truss elements on the sides of the lane line were divided into two parts that are “loading side” and “non-loading side”. For the steel truss bridge model as shown in
Figure 4, the web members on the “loading side” are numbered as 1~19, while the web members on the “non-loading side” are set as 20~38. The specific numbers of the loading side web members and the nodes of upper and lower chord are shown in
Figure 5.
3.2. Establishment of GBN
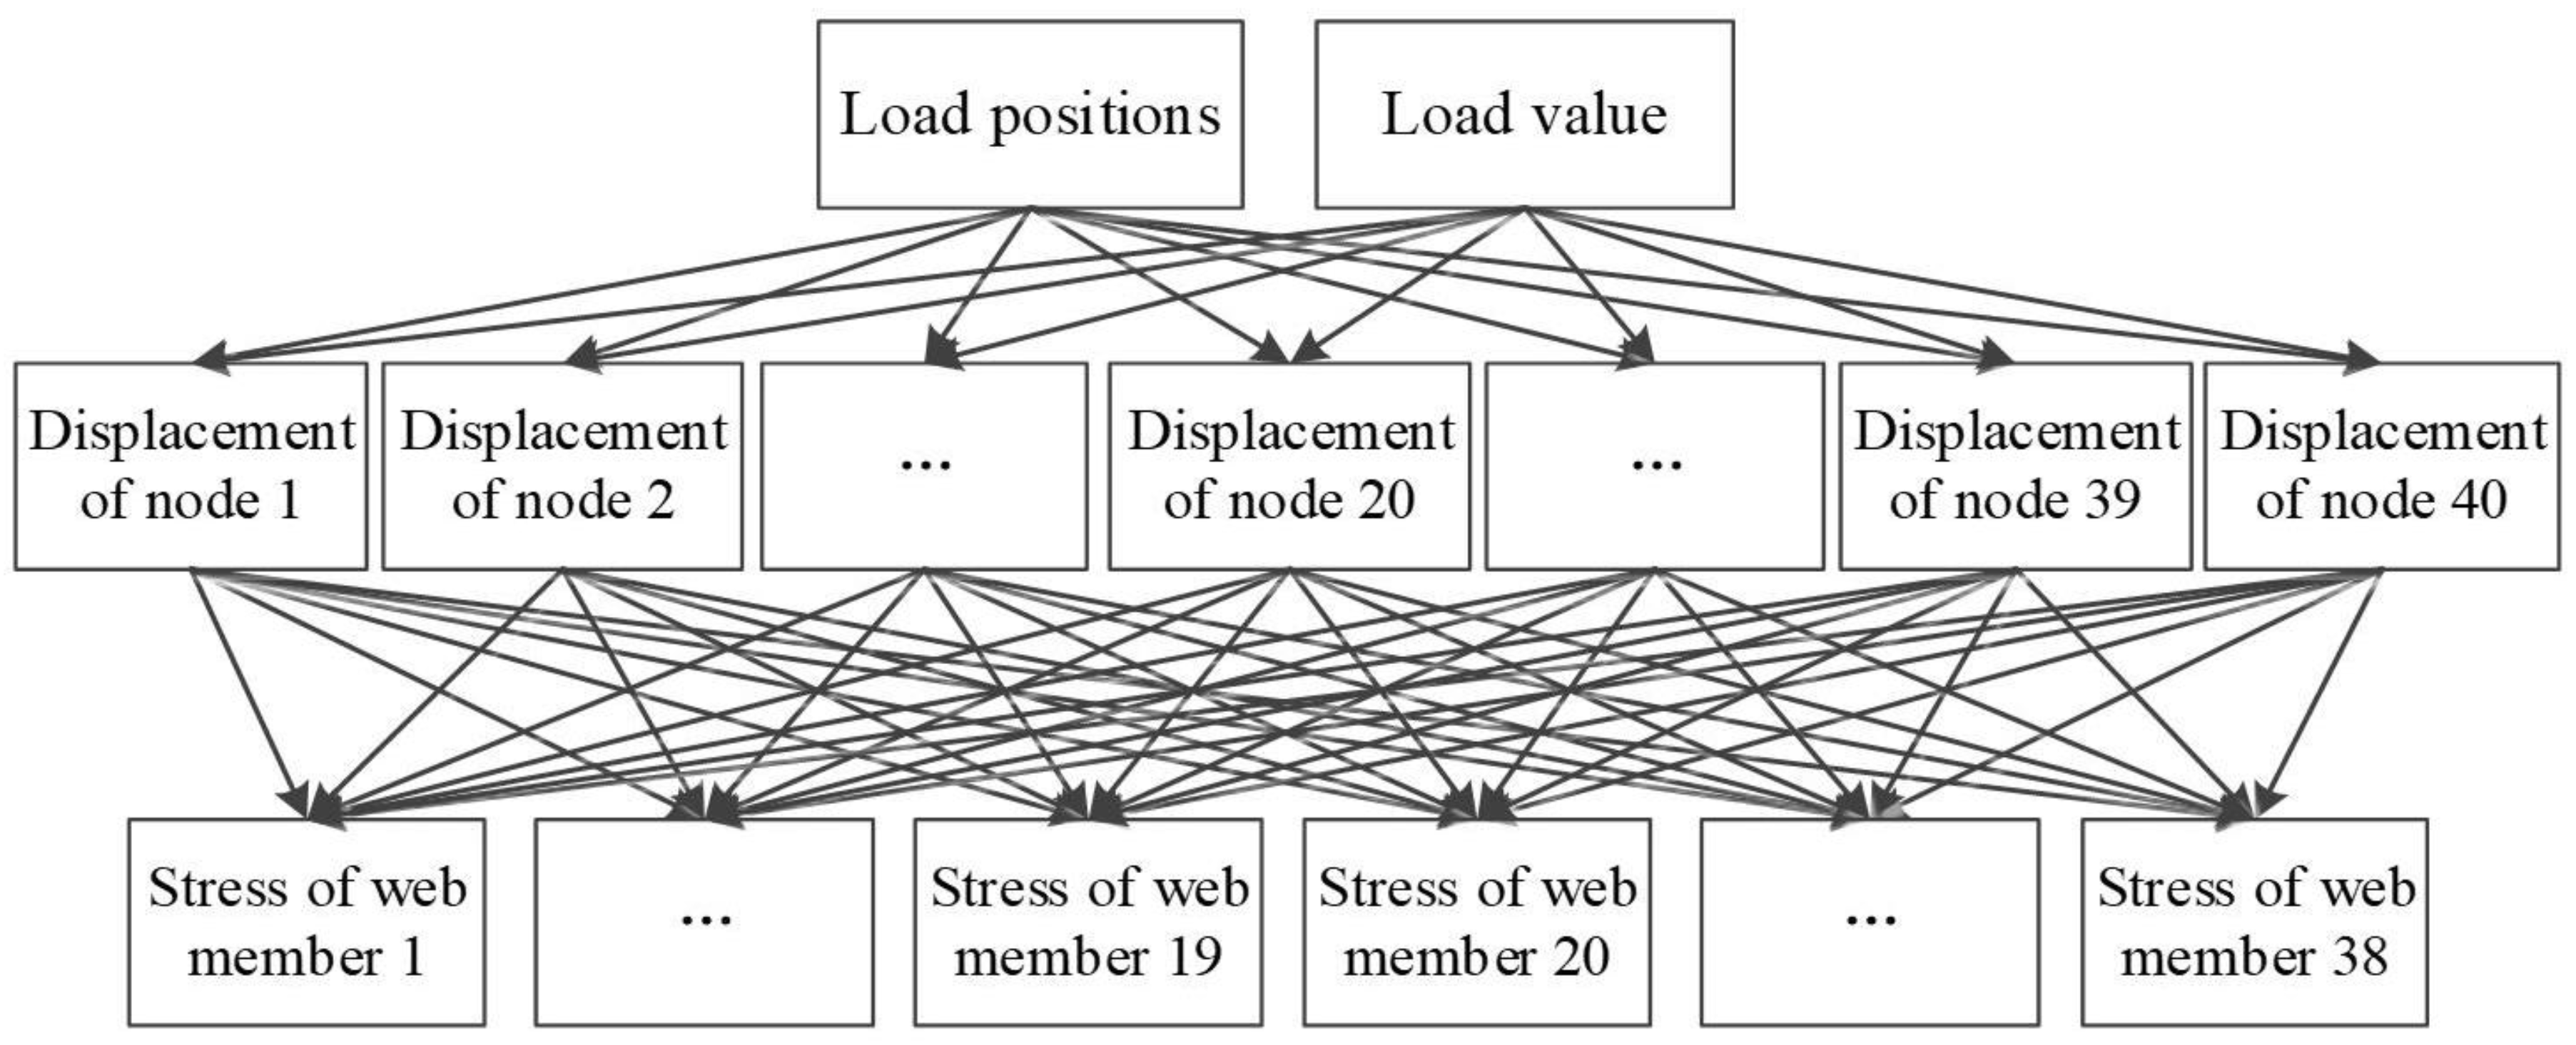
For the steel truss bridge structure, the factors affecting the effect of static load mainly include vehicle weight and vehicle position. In the construction of the GBN, the first-layer nodes correspond to the vehicle weight and vehicle position, respectively, the second-layer nodes correspond to the displacement of upper and lower chord nodes, and the third-layer nodes correspond to the stress of 38 web members, respectively.
In the process of data extraction, all node variables were assumed to follow Gaussian distribution: assuming that the load variable is G1 (unit: kN) and follows the distribution of G1~N (300, 56.25). As for the load position, we considered lane nodes 1~7, 8~14, and 15~21 as three intervals, and established the GBN under three different intervals. When the load was located in the range of lane nodes 1~7, the position variable of load was assumed to be X1, which follows the distribution of X1~N (4, 0.56). When the load was located in the range of lane nodes 8~14, it was assumed that the load position variable was X2, which follows the distribution of X2~N (11, 0.56). When the load was located in the range of lane nodes 15~21, it was assumed that the variable of load position was X3, which follows the distribution of X3~N (18, 0.56). According to the distribution of the above variables, 300 groups of samples were obtained by random sampling method. The finite element model was used to calculate the bridge response data under different combinations of variables, and the GBN training was realized based on the 300 sets of data obtained. The GBN parameters were trained by extracting the calculation results of the finite element model under different working conditions. In the three different action intervals, the node displacement of the loading side and the peak stress of the truss members were significantly larger than that of the non-loading side. In order to facilitate the discussion of the data reasoning performance of the GBN network and the damage detection effect, the node displacement and element stress of the loading side were taken as the research objectives.
3.3. Data Inference Analysis of GBN
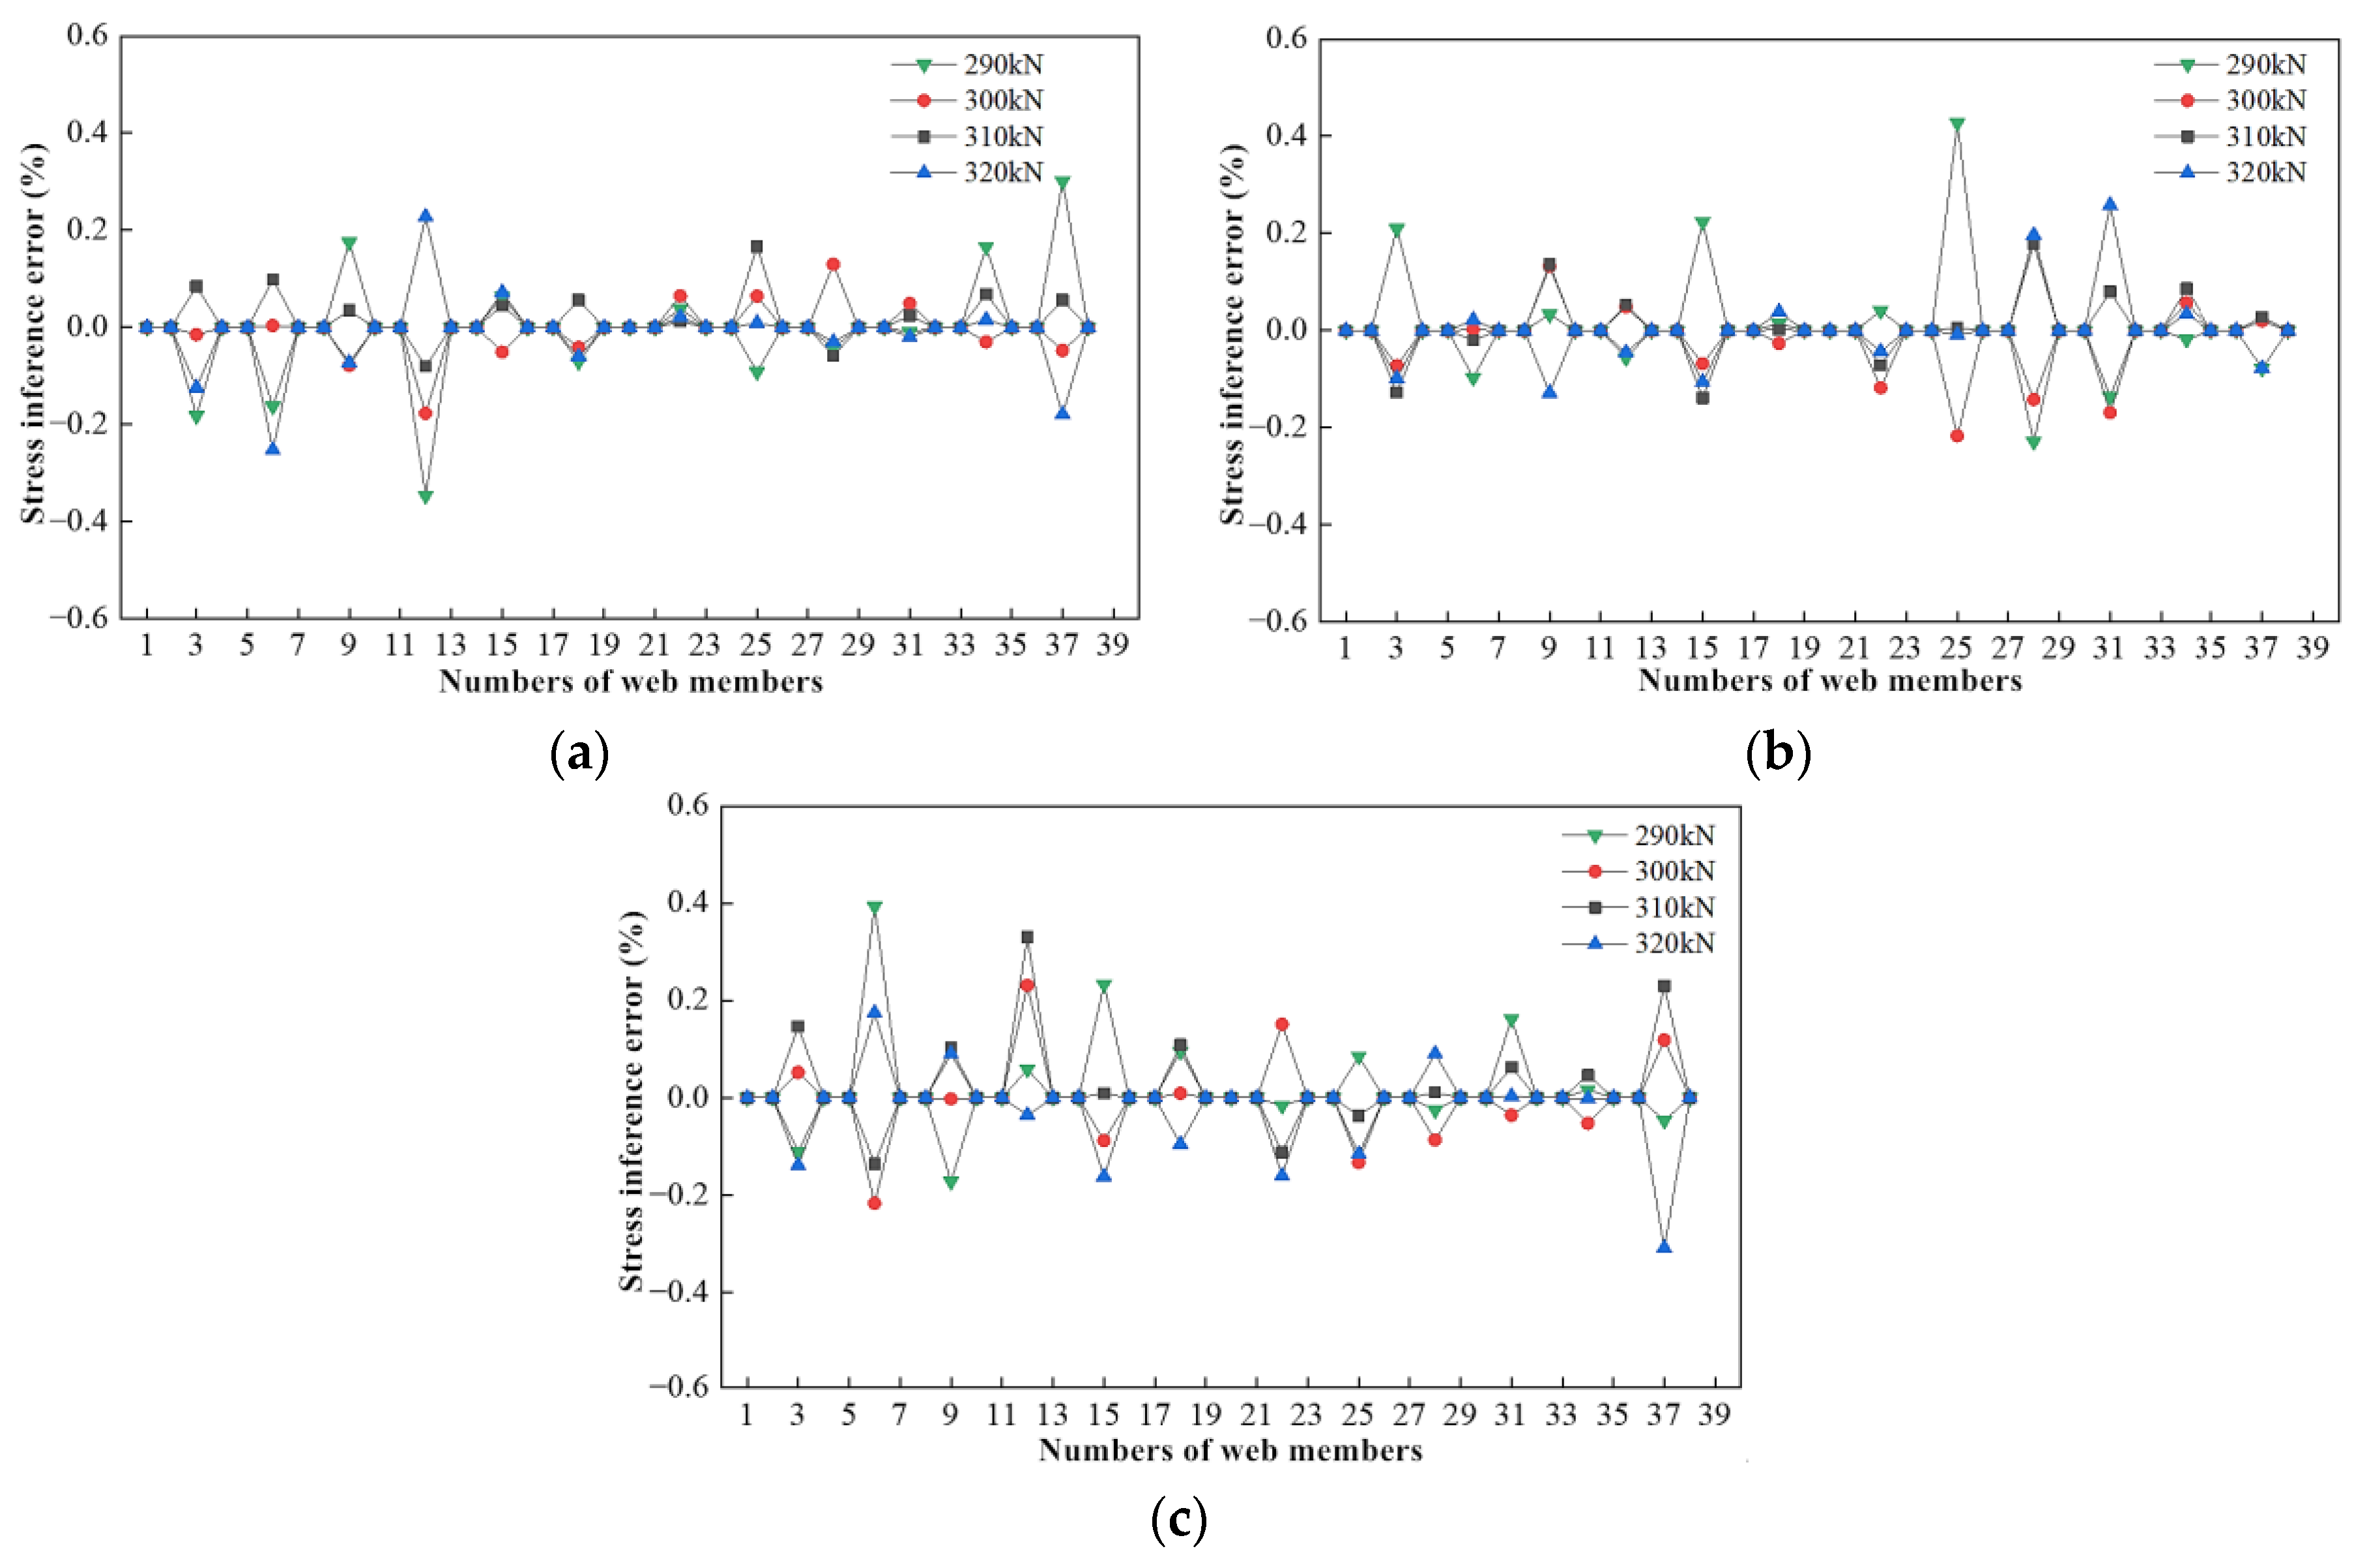
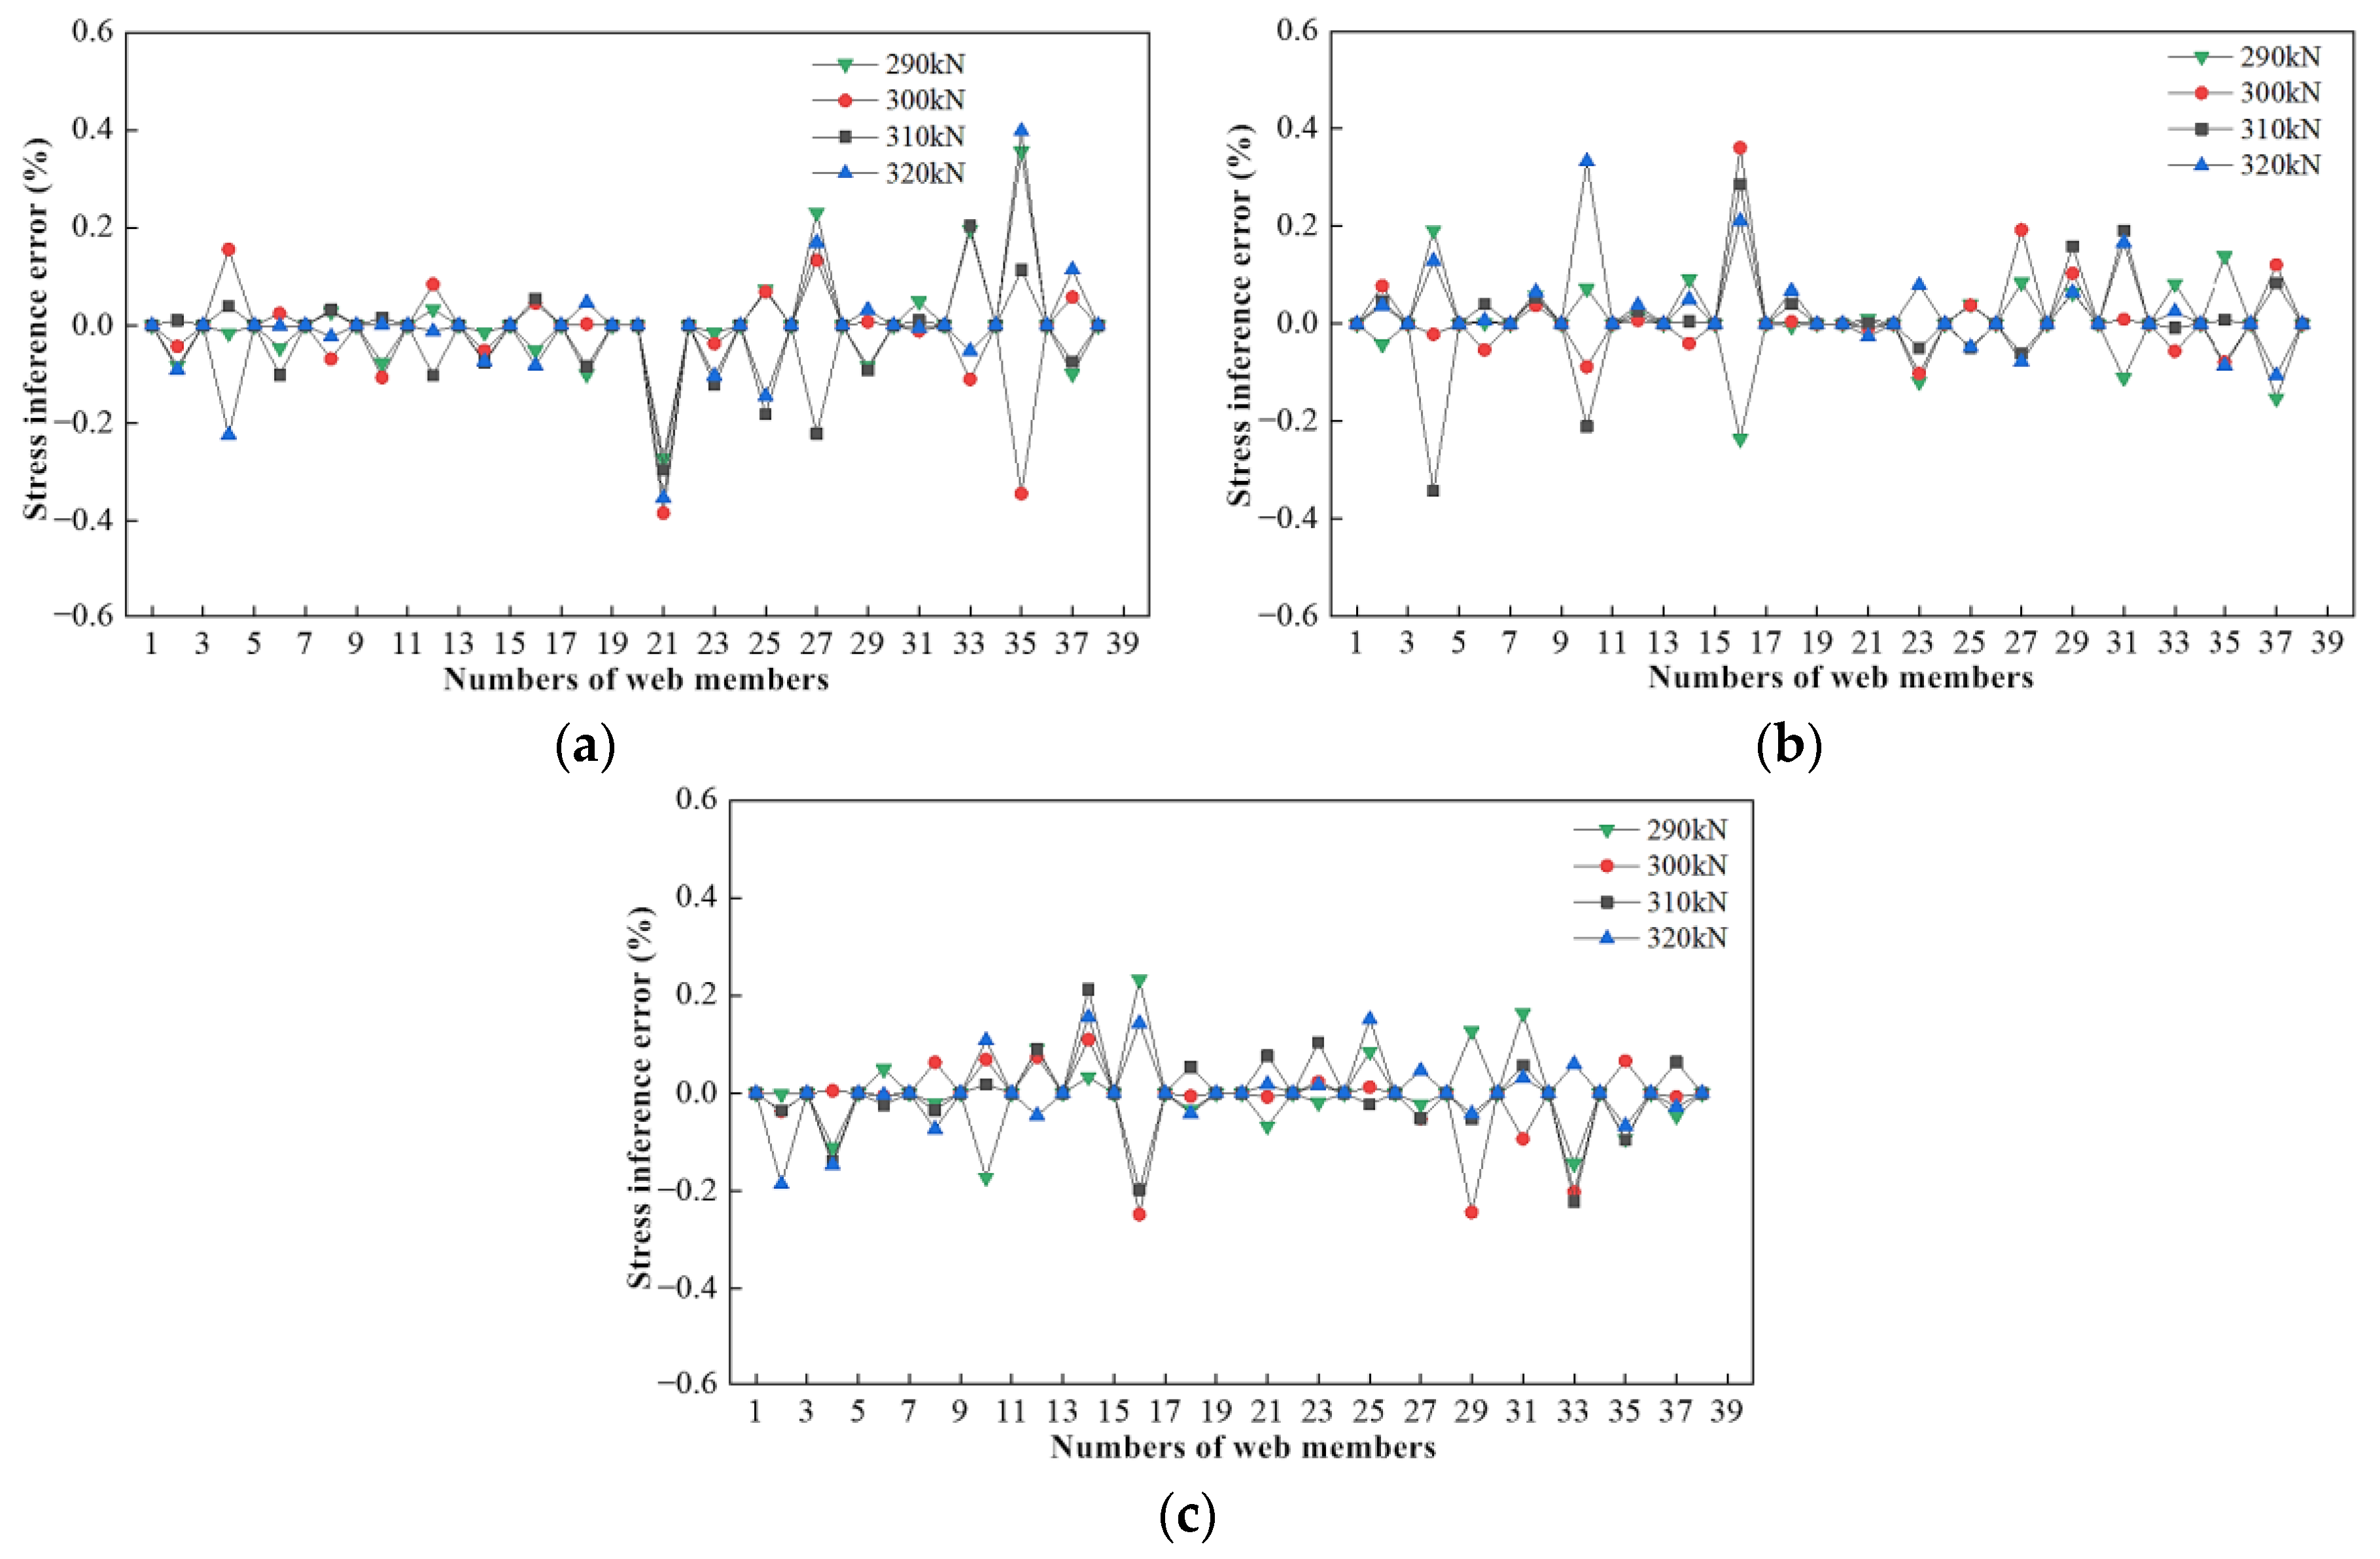
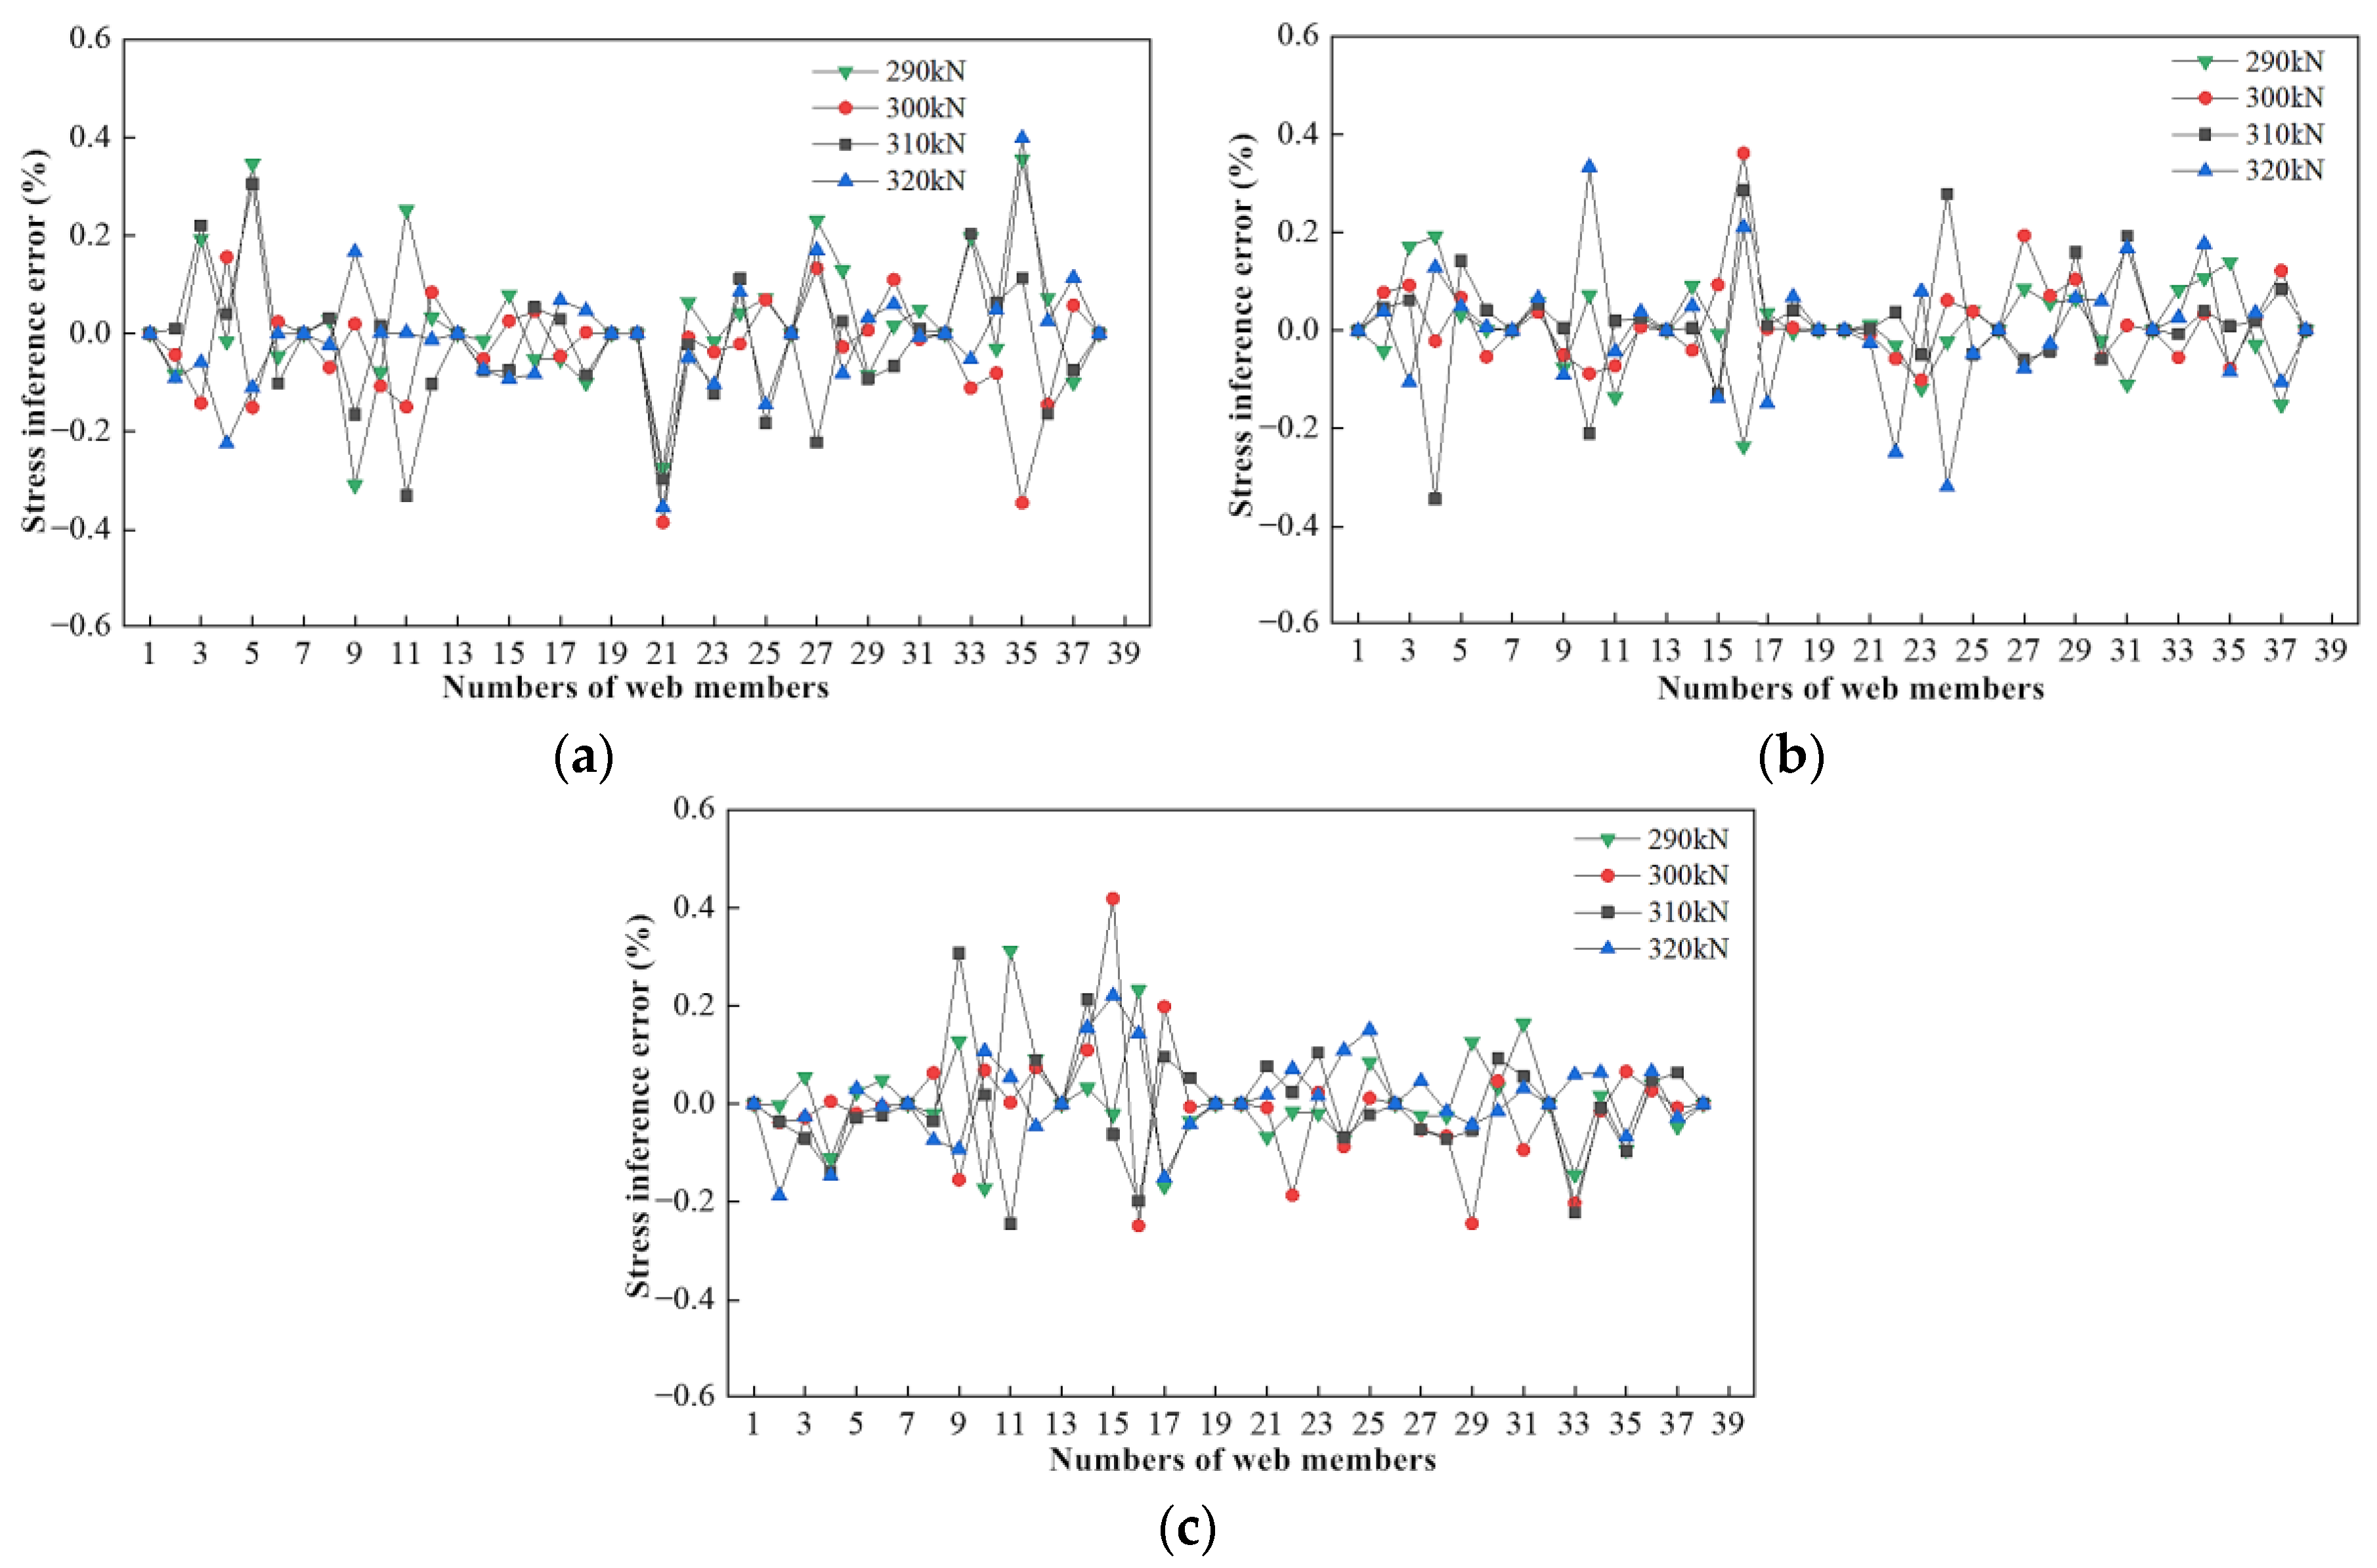
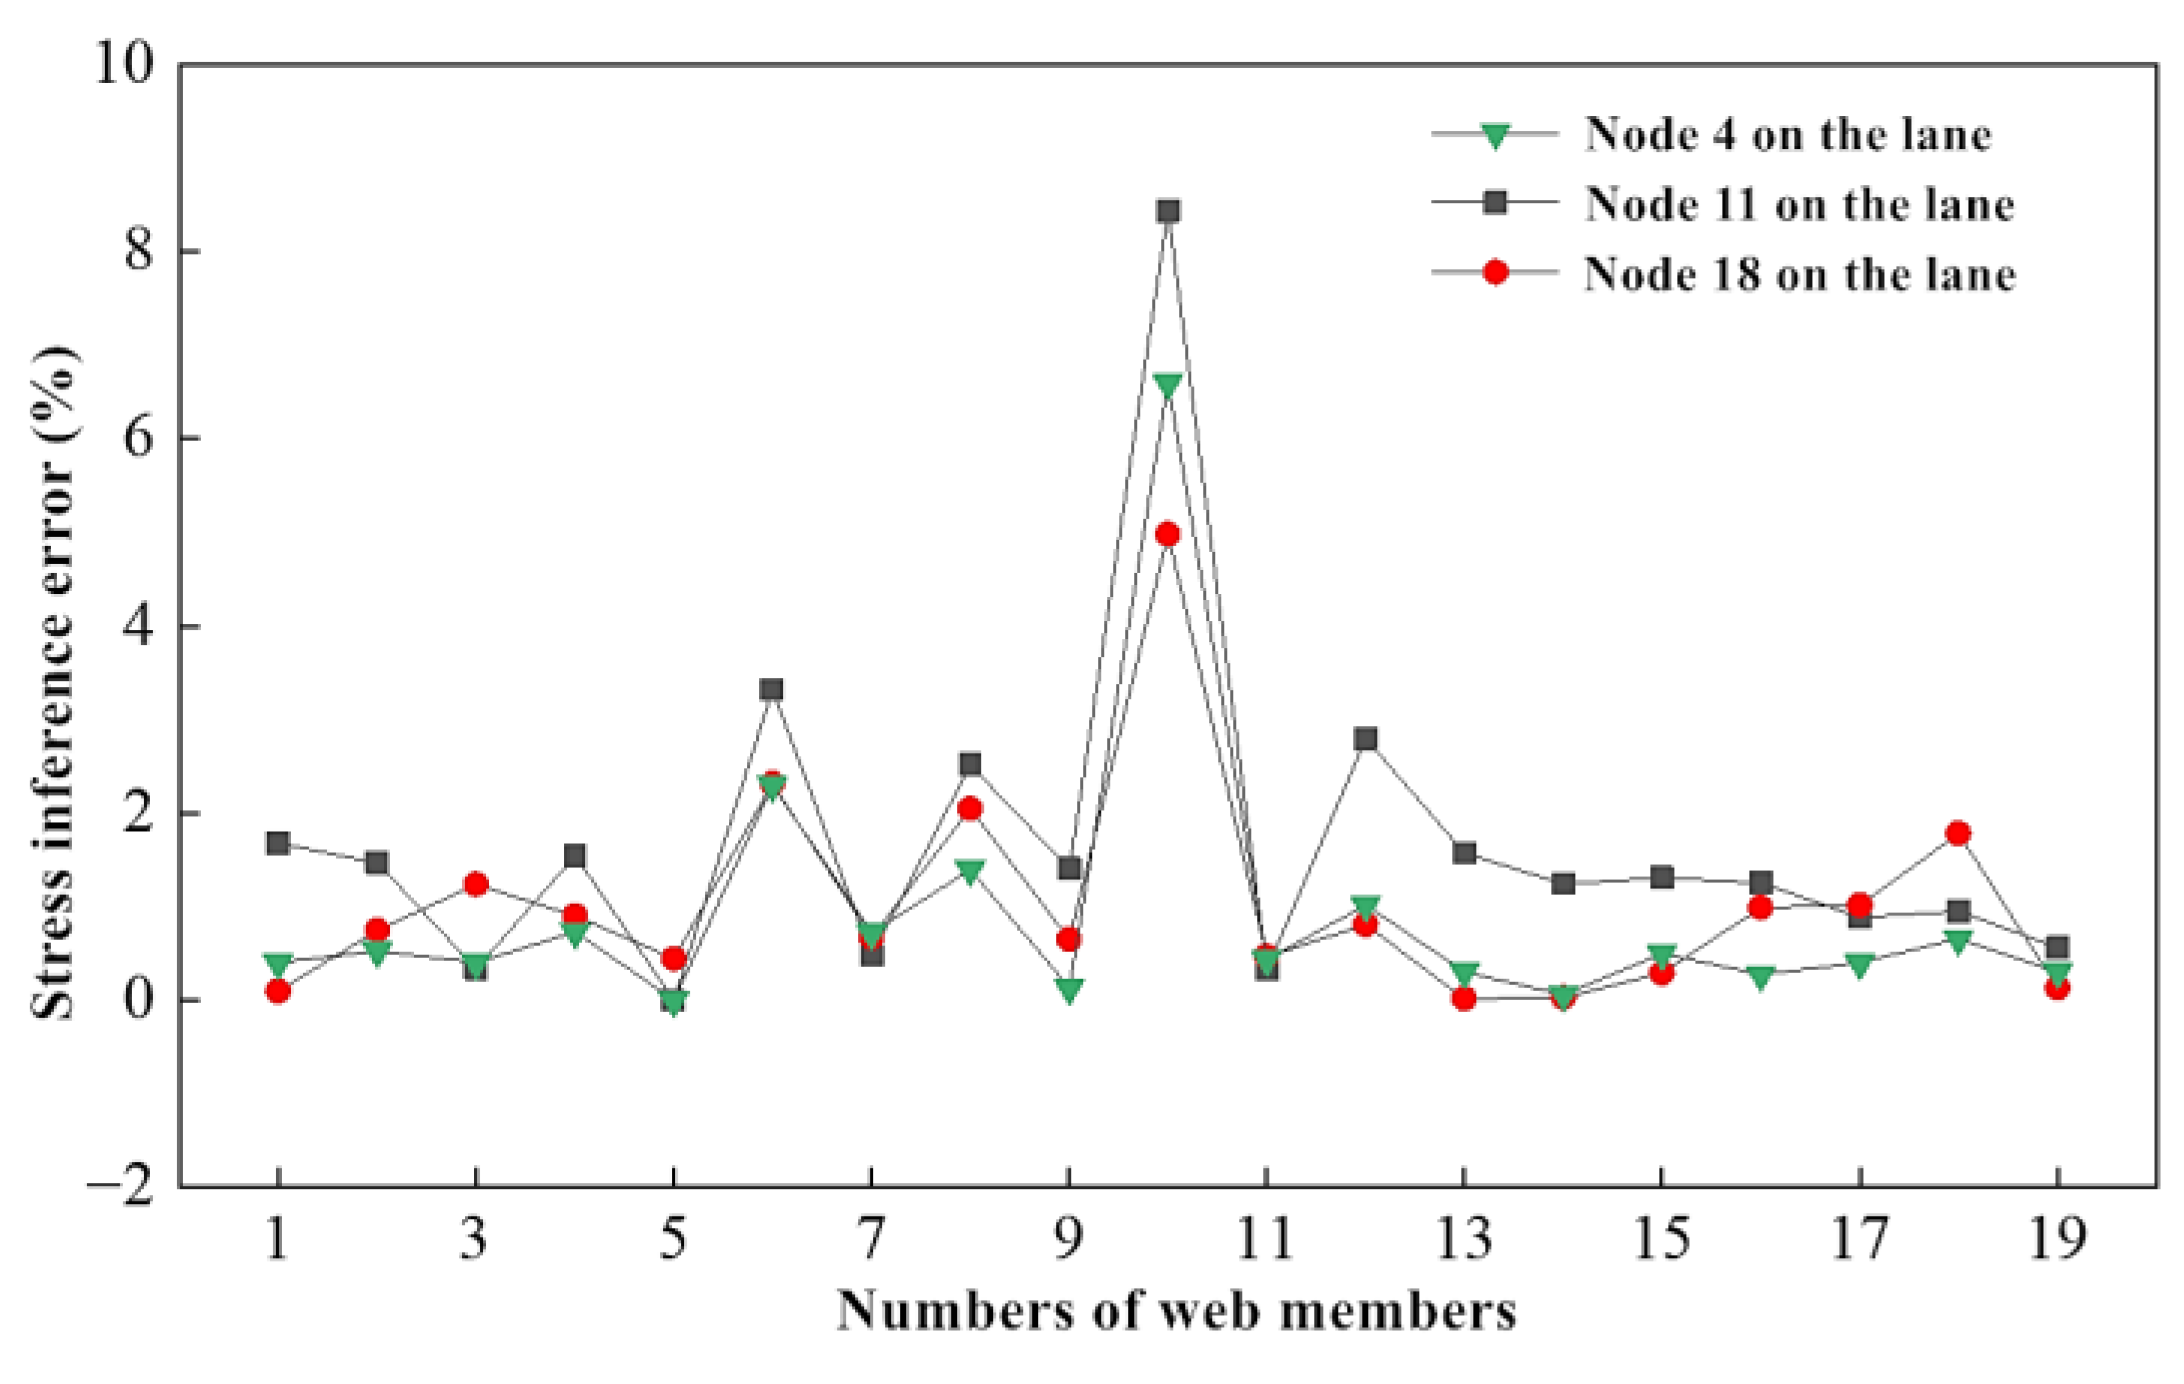
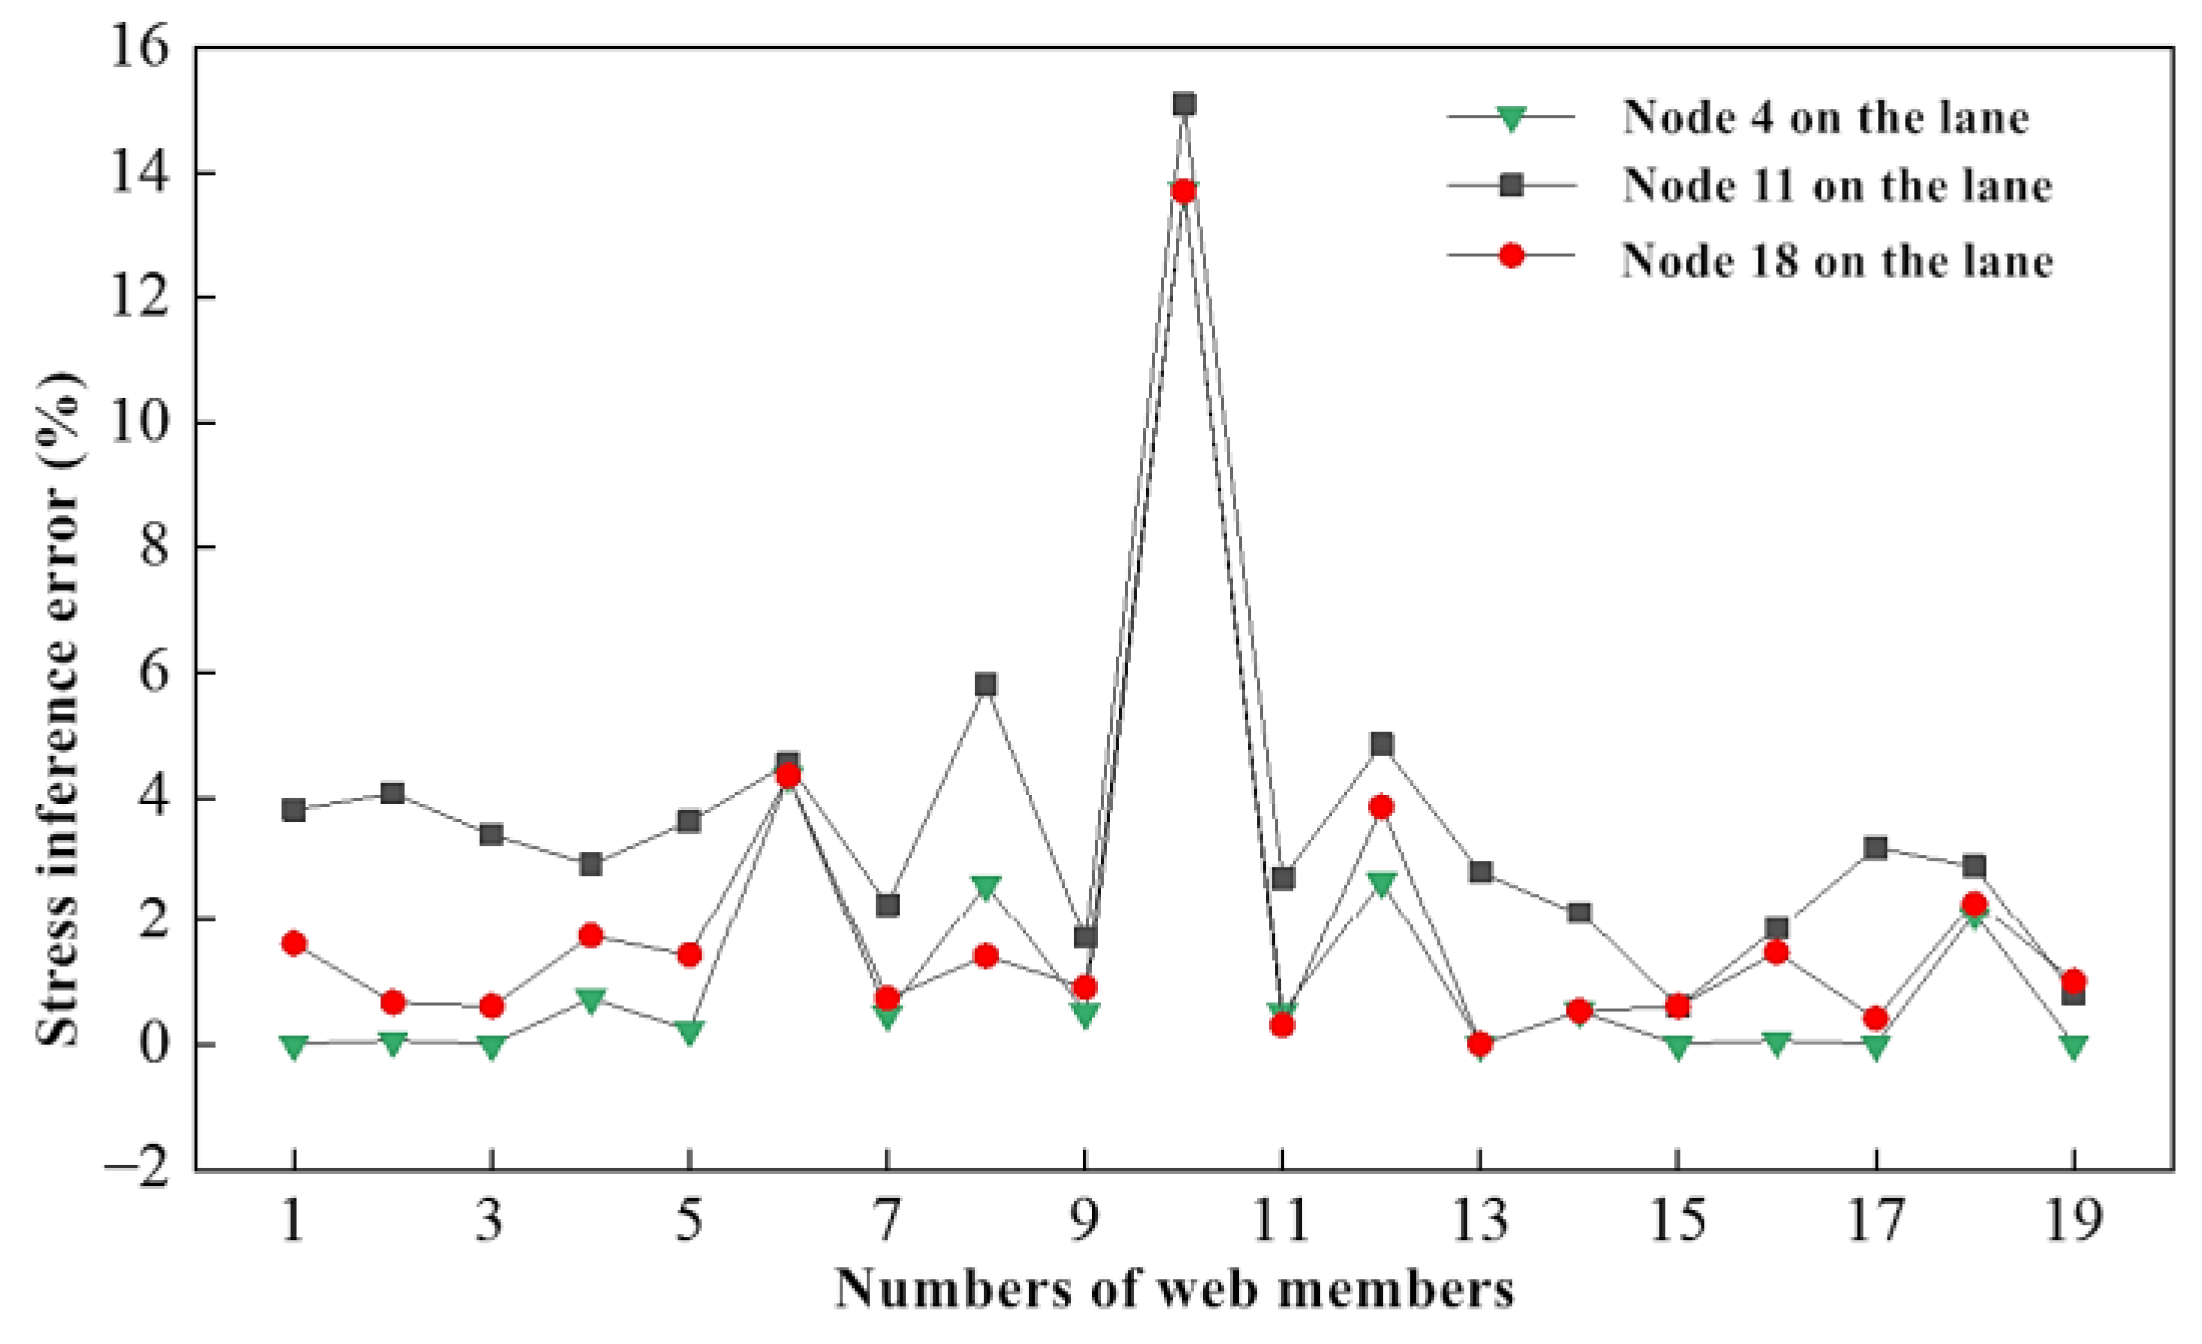
With the trained GBN model, the load information and stress monitoring data of some web members can be used as input to realize the stress inference of the remaining web members. To investigate the accuracy and reliability of using a trained GBN model for response prediction under the effects of different numbers of testing points, three cases are further discussed in this study. The corresponding three types of cases are as follows. (1) The stress data of 26 web members are known, of which the numbers are 1, 2, 4, 5, 7, 8, 10, 11, 13, 14, 16, 17, and 19 on the loading side and numbers 20, 21, 23, 24, 26, 27, 29, 30, 32, 33, 35, 36, and 38 on the non-loading side. (2) The stress data of 20 web members are known, which are numbers 1, 3, 5, 7, 9, 11, 13, 15, 17, and 19 of the loading test and numbers 20, 22, 24, 26, 28, 30, 32, 34, 36, and 38 of the non-loading side. (3) The stress test data of 8 web members are known, which are numbers 1, 7, 13, and 19 members measured under loading, and numbers 20, 26, 32, and 38 members on the non-loading side.
The load size is 290 kN, 300 kN, 310 kN, and 320 kN, respectively, and the load position is at node No. 4, 11, and 18 of the driveway. There are 12 load combinations in total. The test data under 12 working conditions were input into the trained GBN to infer the stress of the remaining web members. Finally, the accuracy of the stress inference results of steel truss bridges based on the GBN was verified by comparing and analyzing the error between the finite element model calculation results and the GBN inference results. The stress inference errors of the three types of cases are shown in
Figure 6,
Figure 7 and
Figure 8.
Under the cases of three different test data, the trained GBN can accurately infer the stress of the remaining web members, and the maximum prediction error is controlled within 0.5%. By comparing the stress prediction errors of the web members in the three cases, it can be found that with the decrease in the number of known members, the fluctuation of the stress inference results of the GBN gradually increases, but the overall prediction is still accurate.
3.4. Single-Point Damage Detection
In this section, the single-point damage detection of the steel truss bridge based on the GBN is discussed. In order to simulate the damage state of the steel truss bridge, the stiffness of web member 10 in the bridge model was reduced by 4%, 9%, and 16%, respectively. Through the static analysis of the steel truss bridge model, the responses of the structure under different damage states were obtained. The stress data of 20 web members selected in case 2 in
Section 3.3 were substituted into the trained GBN model, and the stress data of the remaining 18 web members were inferred. Then, the damage state of the steel truss bridge was identified by Equation (6).
In the process of damage detection, three load conditions were considered for each damage condition. Among them, the load size was 310.6 kN, and the action position corresponded to node 4, 11, and 18 of the lane, respectively. Therefore, three damage detection results were obtained under each damage condition. When 4%, 9%, and 16% damage occur to the web member element, the obtained damage detection results are shown in
Figure 9,
Figure 10 and
Figure 11. It can be inferred from the damage detection results that the proposed method can not only accurately locate the damage of the steel truss beam, but also quantify the damage degree of the web member element. In addition, it can be seen from these figures that when the load is applied to node 11, the damage index is closest to the actual damage degree of the web member. The damage detection results of node 11 under load are listed in
Table 2. According to the table, when the single point damage was 4%, 9%, and 16%, the damage indexes were 3.68%, 8.40%, and 15.10%, respectively.
3.5. Multi-Point Damage Detection of the Steel Truss Bridge
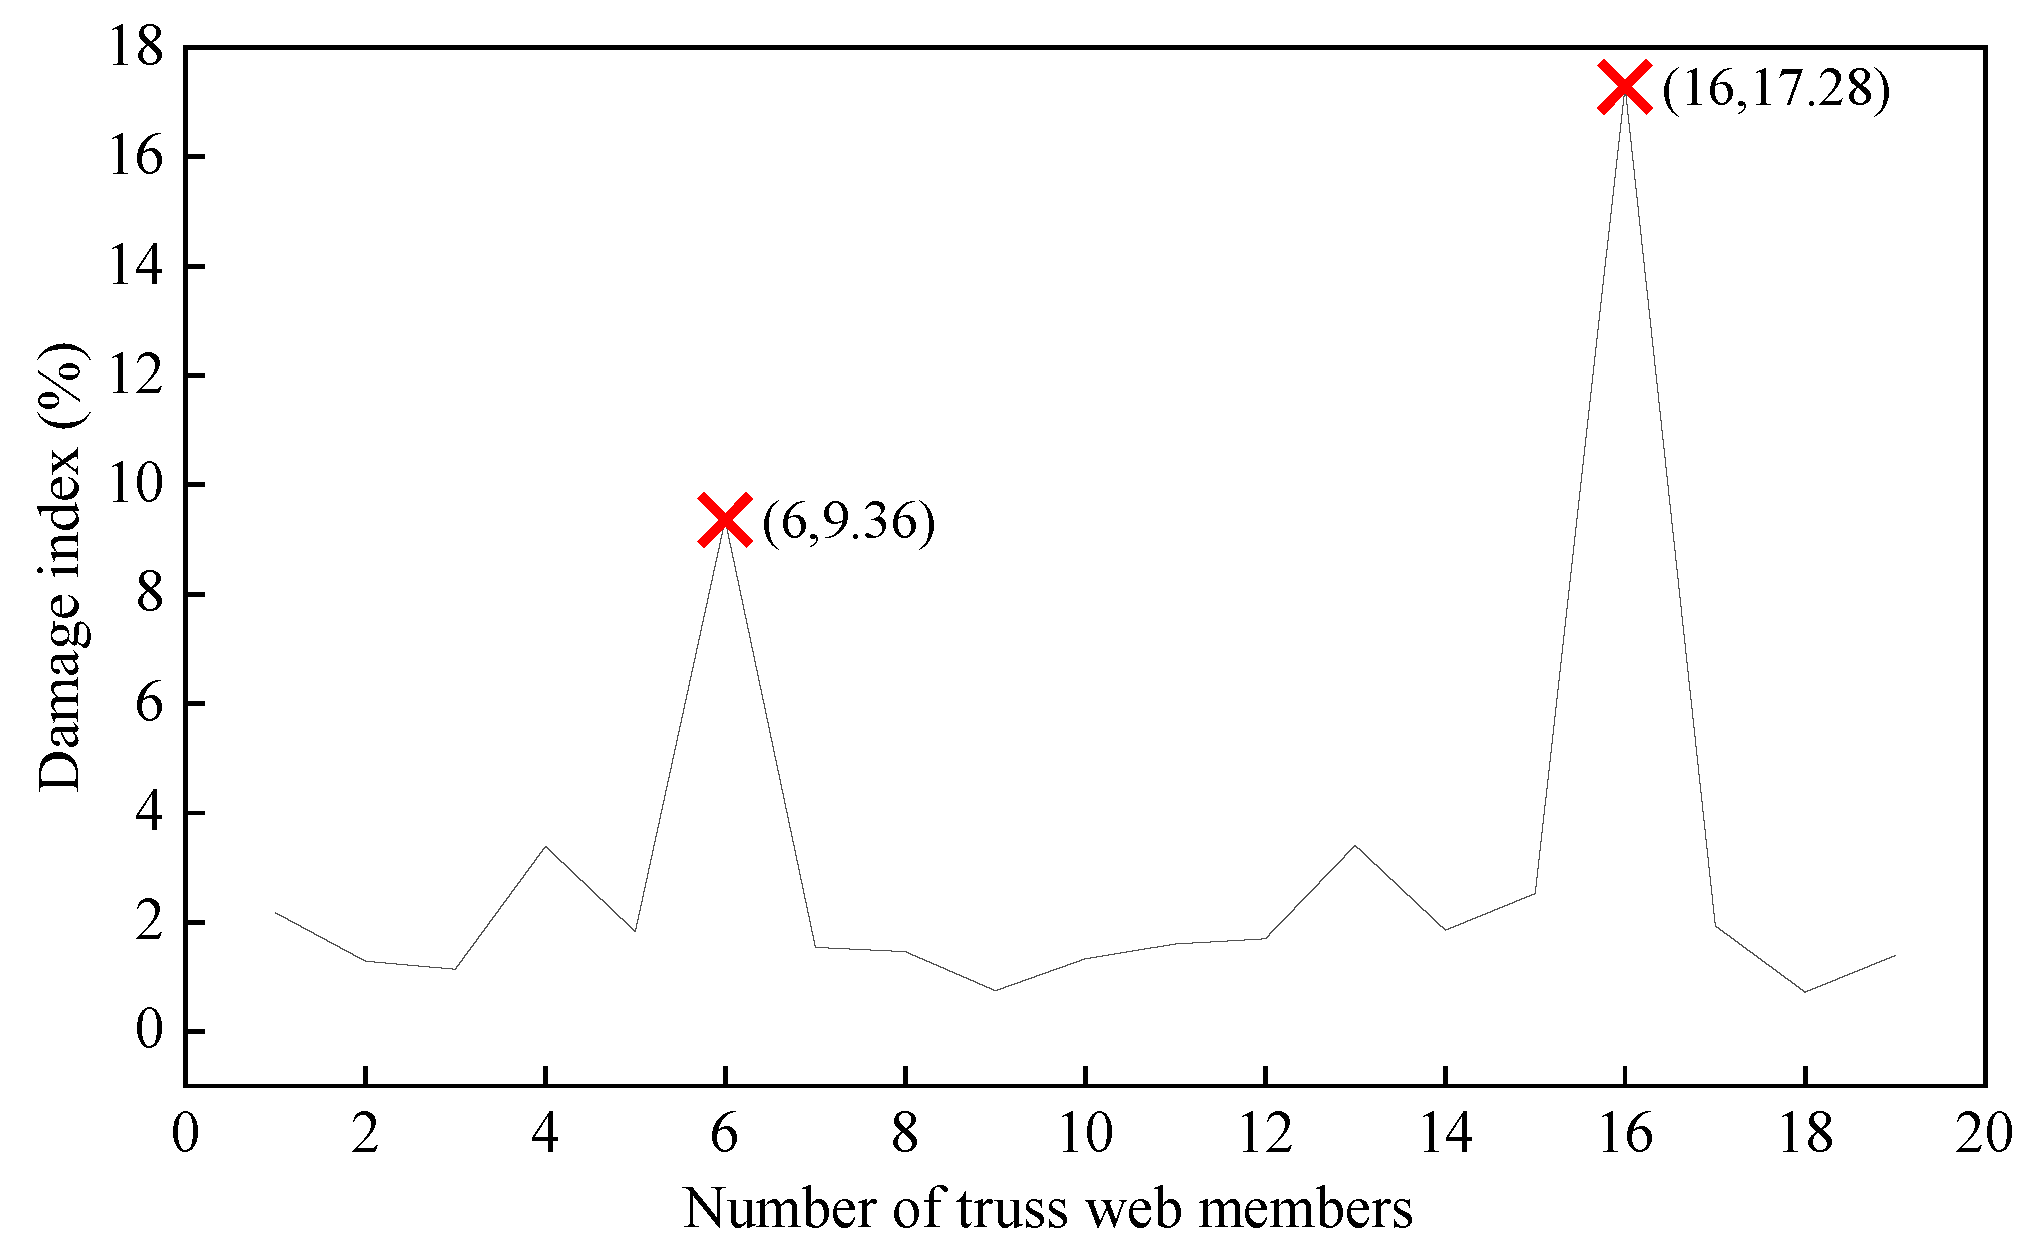
In this section, the effectiveness of the proposed method for multi-point damage detection of steel truss bridges was verified. In the finite element model, it was assumed that the stiffness of No. 6 member was weakened by 10% and that of No. 16 member was weakened by 20%. A load of 310.6 kN was applied at node 11 of the lane, and the response of the structure under multi-point damage was calculated by finite element model. The stress data of the selected 20 web members were substituted into the trained GBN model, and the stress data of the remaining 18 web members were inferred. Then, Equation (6) was used to calculate the damage index value of the steel truss bridge under multi-point damage condition. The result of damage detection is shown in
Figure 12. It can be found from
Figure 12 that the proposed method can realize multi-point damage location of steel truss bridges. The calculated value of the damage index is 9.36% at No. 6 member and 17.28% at No. 16 member. Through the above analysis, it can be seen that the method can not only effectively realize the single-point damage detection of steel truss bridges, but also has high accuracy in multi-point damage detection.
4. Dynamic Damage Detection Based on GBN
In this section, based on the steel truss bridge model established in
Section 3, the damage detection of the steel truss bridge under moving loads was studied. First, a vehicle–bridge coupled system was established using Universal Mechanism software to obtain the dynamic responses of the bridge under vehicle loads. Then, the GBN based on vehicle loads was constructed. The results of multi-point damage detection under the conditions of no noise and 5% noise were calculated, respectively, and the effect of multi-point damage detection of the steel truss bridge based on the GBN was verified.
4.1. Establishment of GBN
The bridge model was imported into the Universal Mechanism software as a flexible subsystem. The software was used to build the multi-body model of the vehicle. Then, the vehicle–bridge coupled system was established by combining subsystems of the bridge and vehicle. For convenience of calculation, vehicle loads were symmetrically arranged in two lanes. The established vehicle–bridge coupled system is used to calculate the dynamic response of the bridge under vehicle load.
When the GBN is constructed under dynamic loads, the first-layer nodes of the network correspond to the weight and speed of the vehicle, the second-layer nodes correspond to the maximum vertical deflection of the upper and lower chord joints of the steel truss bridge, and the third-layer nodes correspond to the peak stress of 38 web members. In the process of data extraction, it was assumed that all the node variables follow normal distribution. The vehicle weight G1 (unit: t) and the vehicle speed V1 (unit: km/h) are assumed to follow the distributions of G1~N (41, 10) and V1~N (65, 15), respectively. All 400 groups of samples conforming to the above rules were generated through random sampling and were used to calculate the bridge response data by the vehicle–bridge coupled system. The initial GBN was trained based on the extracted training data. The trained network was used to identify the damage of steel truss bridges to verify the feasibility of the proposed damage detection approach.
4.2. Damage Detection without Noise
Based on the finite element model in the health state, the vehicle mass was set to 50 T and the vehicle speed was set to 70 km/h. The peak stress data of the selected 20 web members were obtained. Then, the stress data calculated by the vehicle–bridge coupling was input into the trained GBN, and the peak stress of the remaining web members was inferred by using the topological relationship between network nodes.
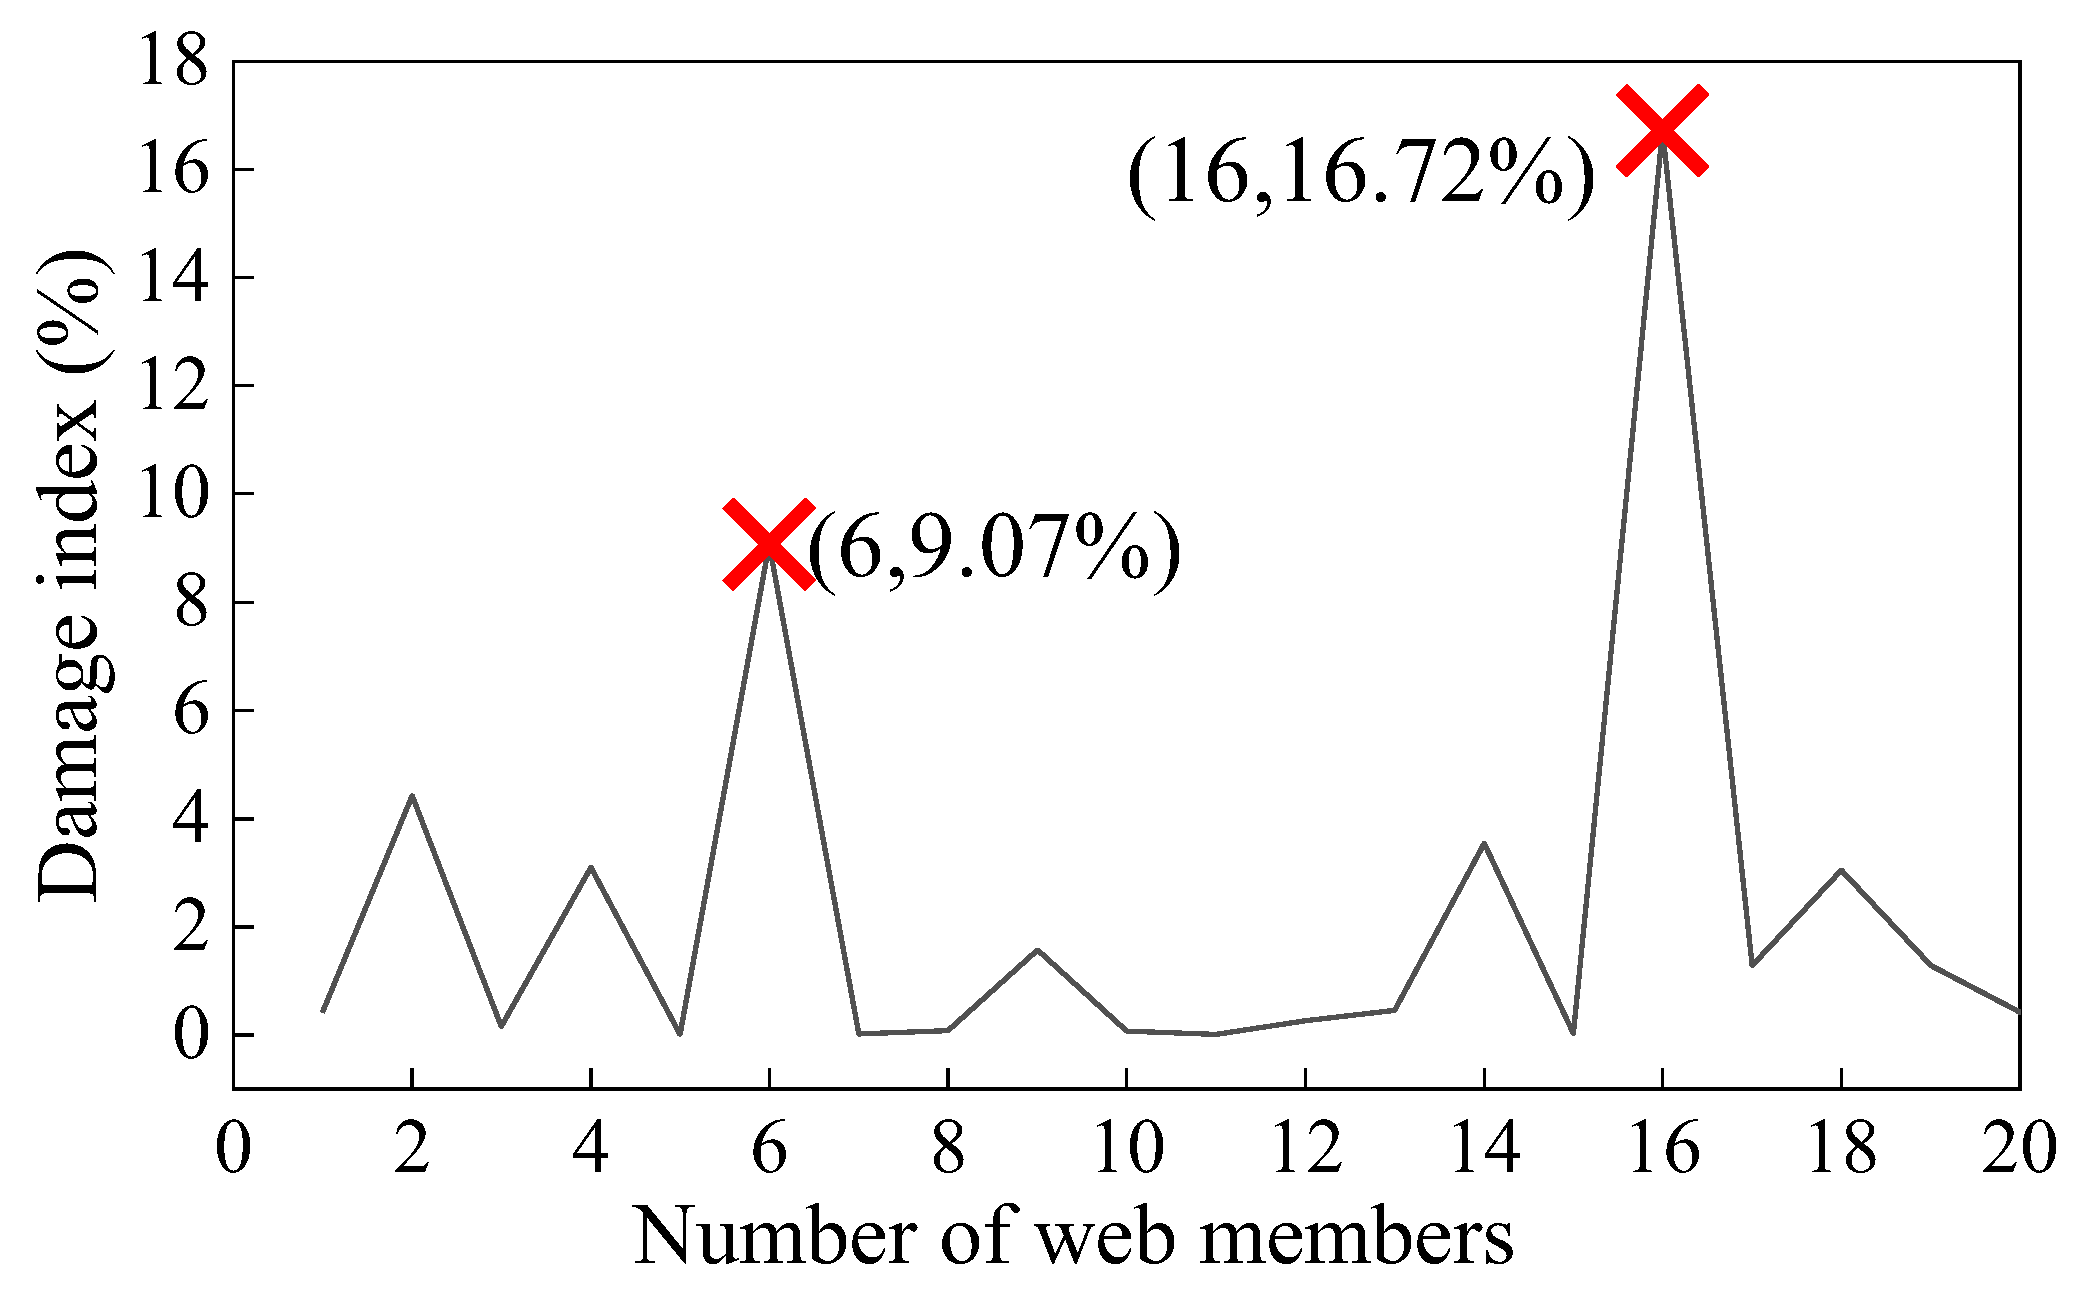
The stiffness of web members 6 and 16 in the finite element model was weakened by 10% and 20%, respectively. The finite element model of the bridge considering damage was used to analyze the vehicle–bridge coupled vibration under the condition of vehicle weight 50 t and vehicle speed 70 km/h, and the peak stress data of 20 selected structural elements were obtained. Then, the monitoring data were input into the GBN as new evidence to infer the stress of the remaining members. The inference results of injury model and health model were compared, as shown in
Figure 13. The damage index value obtained by Equation (6) is plotted in
Figure 14. The damage index of web members 6 and 16 were 9.07% and 16.72%, respectively. It can be proved that the GBN can effectively locate the damage of the steel truss bridges by using the dynamic response and can quantify the damage degree of members.
4.3. Damage Detection with 5% Noise
In this study, to further validate the reliability of using the proposed approach for damage detection of steel truss bridge structures under the effects of measurement noise, 5% random error was added to the element peak stress data to simulate the measured structural responses. In previous studies [
32], 5% noise level, in fact, indicates a relatively large error that is capable of interpreting the uncertainty of the measured structural responses caused by data acquisition devices and sensing systems, and thus, the effects of 5% measurement noise was considered in this study. Then, the data were fed into the trained GBN to infer the peak stress of the remaining web members. The calculation results of the damage index are shown in the
Figure 15. The damage index of web members 6 and 16 were 8.40% and 14.63%, respectively. With the addition of noise, the GBN-based damage detection still achieves high accuracy, which indicates that the proposed method has good noise resistance.
5. Conclusions
In this paper, a damage detection method for steel truss bridges based on a Gaussian Bayes network was proposed. A GBN model with load factors, node displacements, and maximum stress of structural elements as network node variables was constructed, and the analysis results of the finite element model of the bridge were used as training data to realize the parameter learning of the GBN. The known load information and a limited number of structural element stress test data were taken as input and replaced into the trained GBN. Then, combined with the damage index of element peak stress residual, the damage detection of the steel truss bridge based on the GBN was studied. Taking an 80 m steel truss bridge as a numerical example, the proposed GBN was trained by using the response data of the bridge model under load. The trained network model was used to verify the effect of the GBN on the stress inference of truss members of steel truss bridges under different damage degrees. Combined with the proposed damage index, the damage state of the bridge under static load and dynamic load was identified. Based on the identification results of different working conditions, the following conclusions were obtained:
(1) The static damage detection results were 3.68%, 8.40%, and 15.10%, respectively, when 4%, 9%, and 16% damage occurred to the web member 10 of the bridge. Based on the calculation results, it indicates the proposed damage detection method is capable of being used for damage localization and quantification of the steel truss bridges based on the trained GBN model.
(2) The static damage detection results were 9.36% and 17.28% when 10% damage occurred to web member 6 and 20% damage occurred to the web member 16 of the bridge. The results showed that the damage detection method based on GBN can effectively identify multi-point damage of the steel truss bridge under static loads.
(3) For the steel truss bridge under moving loads, the damage detection results of the two web members with 10% and 20% damage were 9.07% and 16.72%, respectively. With the condition of 5% noise, the calculated values of damage index were 8.40% and 14.63%. The calculation results showed that the proposed GBN can identify multi-point damage of the steel truss bridge under moving loads, even under the effects of 5% noise.
(4) Although the proposed approach is reliable for damage detection of steel truss bridges, how to further extend the Bayesian network for damage identification of other types of structures still needs to be studied.


