1. Introduction
Theatres have a significant presence within cities and are a symbol of artistic elevation [
1]. A theme of great interest in the literary panorama is the acoustic perception in opera houses, theatres, and places of performance for classical music and orchestras [
2]. Acoustic comfort is one of the aspects of greatest interest in building indoor environments [
3]. The acoustic perception in theatres, both from physical and subjective points of view, is considered a complex and multisensory experience. Many studies aimed to study the acoustic characterization of modern and ancient theatres [
4,
5,
6,
7,
8].
The optimal perception of sound is a clear perception of any change in tonal quality made by the performer [
9]. The indoor comfort of a theatre is related to several aspects such as optimal sound perception, adequate lighting [
10], optimal thermo-hygrometric conditions [
11], good positioning, and comfortable seating [
12]. Although it has been shown that the architectural configuration of concert halls affects the overall acoustic perception of listeners, it has been found that experienced listeners are able to assess sound quality regardless of the visual and architectural configuration of the hall [
13]. The renovation of theatres, mainly in historical buildings [
14,
15], is a difficult task as it involves many technical and architectural constraints. It is essential to pay the utmost attention to the technical component to guarantee the highest degree of acoustic quality. Good or bad sound quality leads to the success or failure of a theatre, for this reason, the study of sound propagation is fundamental during the design or renovation of a theatre [
16]. Unlike cinemas, theatres should not have electroacoustic sound amplification systems. By changing the acoustic conditions or by simply varying the position of the listener in a room, it is possible to notice differences in the frequency spectrum and time history of the sound [
17]. A theatre has excellent acoustics when the audience can easily follow voices, dialogues, and sounds coming from the stage.
The elements present inside a closed environment (walls, furniture, people, etc.) influence acoustic propagation, as they partially absorb the sound energy that reaches the surface. Such phenomena can alter and deteriorate the quality of the sound perceived by the receiver, degrading verbal communication or music. With the correct sound insulation, theatres can guarantee excellent acoustics at a reasonable cost [
18]. Jeong et al. [
19] investigated the correlation between the perception of the frequency change of short-term sounds and the acoustic quality perceived in listening spaces. Several studies have focused on envelope components [
20,
21]. Carbajo et al. [
22] suggested methods to assess acoustic properties of heterogeneous perforated panels as sound absorbers with the aim of assessing their acoustic properties. Their favorable visual impact allows these materials to be selected for theatre interiors where a high standard for decoration is desired.
In addition to the reverberation time [
23,
24], there are other energy-based acoustical parameters to be considered in the design phase [
25]. As reported by Barron [
26], the principal parameters to be evaluated for the acoustic assessment of theatres are the intelligibility measure, reverberation time, speech sound level, and background level. Of course, these aspects are different according to the typology, location, period of construction, materials, size, and configuration of the theatre. For instance, Roman and Greek theatres are often far from the modern city and so from traffic lines, so background noise levels inside the theatre are very low [
6].
In large halls, it is becoming a common demand to use the space for various activities such as conferences, concerts of classical and amplified music, etc. However, many performances do not enjoy critical and public success due to inadequate acoustics, thus, there is an increasing need to find architectural solutions that consider the variable acoustic requirements depending on the different possible layouts [
27]. Gao et al. [
28] proposed measurements of monophonic acoustic parameters based on energy in two multi-use performance spaces. Thanks to acoustic prediction software, it is possible to simulate the acoustic behavior of the theatres.
This paper aims to present a project of acoustic requalification of the Italian theatre “Cavallino Bianco”. It is located in Galatina, a city in southern Italy. The theatre can be a representative example of renovation, as it is similar in shape and construction materials to other theatres in the area and was built in the same period.
Firstly, the theatre is presented in the state in which it was found by the authors during their first survey; acoustic characterization was conducted both through on-site measurements and via numerical analysis with the EASE 4.4 software. This software is widely used in scientific literature to accurately simulate spaces with different end-uses, including theatres [
29,
30,
31,
32,
33,
34,
35,
36].
This first acoustic survey is for the configuration of the hall with a wooden roof and without a false ceiling. Analysis reveals reverberation times that are too high.
Several design hypotheses are numerically simulated, including the evaluation of the theatre in its original shape, with a false ceiling made of pressed vegetable fibers, and for different scenarios focused on the applications of light, medium, and heavy draped curtains.
Secondly, numerical analyses and on-site measurements are conducted on the real-life optimal scenario.
The study considers that the theatre is a multipurpose performance hall, as over the years it has hosted different types of shows and concerts; thus, one of the major challenges of this study is to identify technical solutions that guarantee a good acoustic response for all intended uses of the theatre (e.g., popular music, chamber music, drama theatre, opera and ballet, orchestral music) according to the different requirements. In fact, the requirements to achieve correct room acoustics and to ensure that at any point a listener can perceive the sounds produced by a sound source with sufficient intensity and clarity are not always the same; for example, a conference auditorium and a concert hall generally have different acoustic requirements. To this end, the main acoustic parameters considered fundamental for obtaining excellent acoustic quality of the indoor environment have been described taking into consideration the different uses of the theatre. After describing the case study, we present a a description of the main acoustic requirements that were analyzed. In the third section, the methodology applied to conduct this research and the scenarios/combination studied are presented. The results and the discussion are then provided in the next section. This paper ends with a conclusion section.
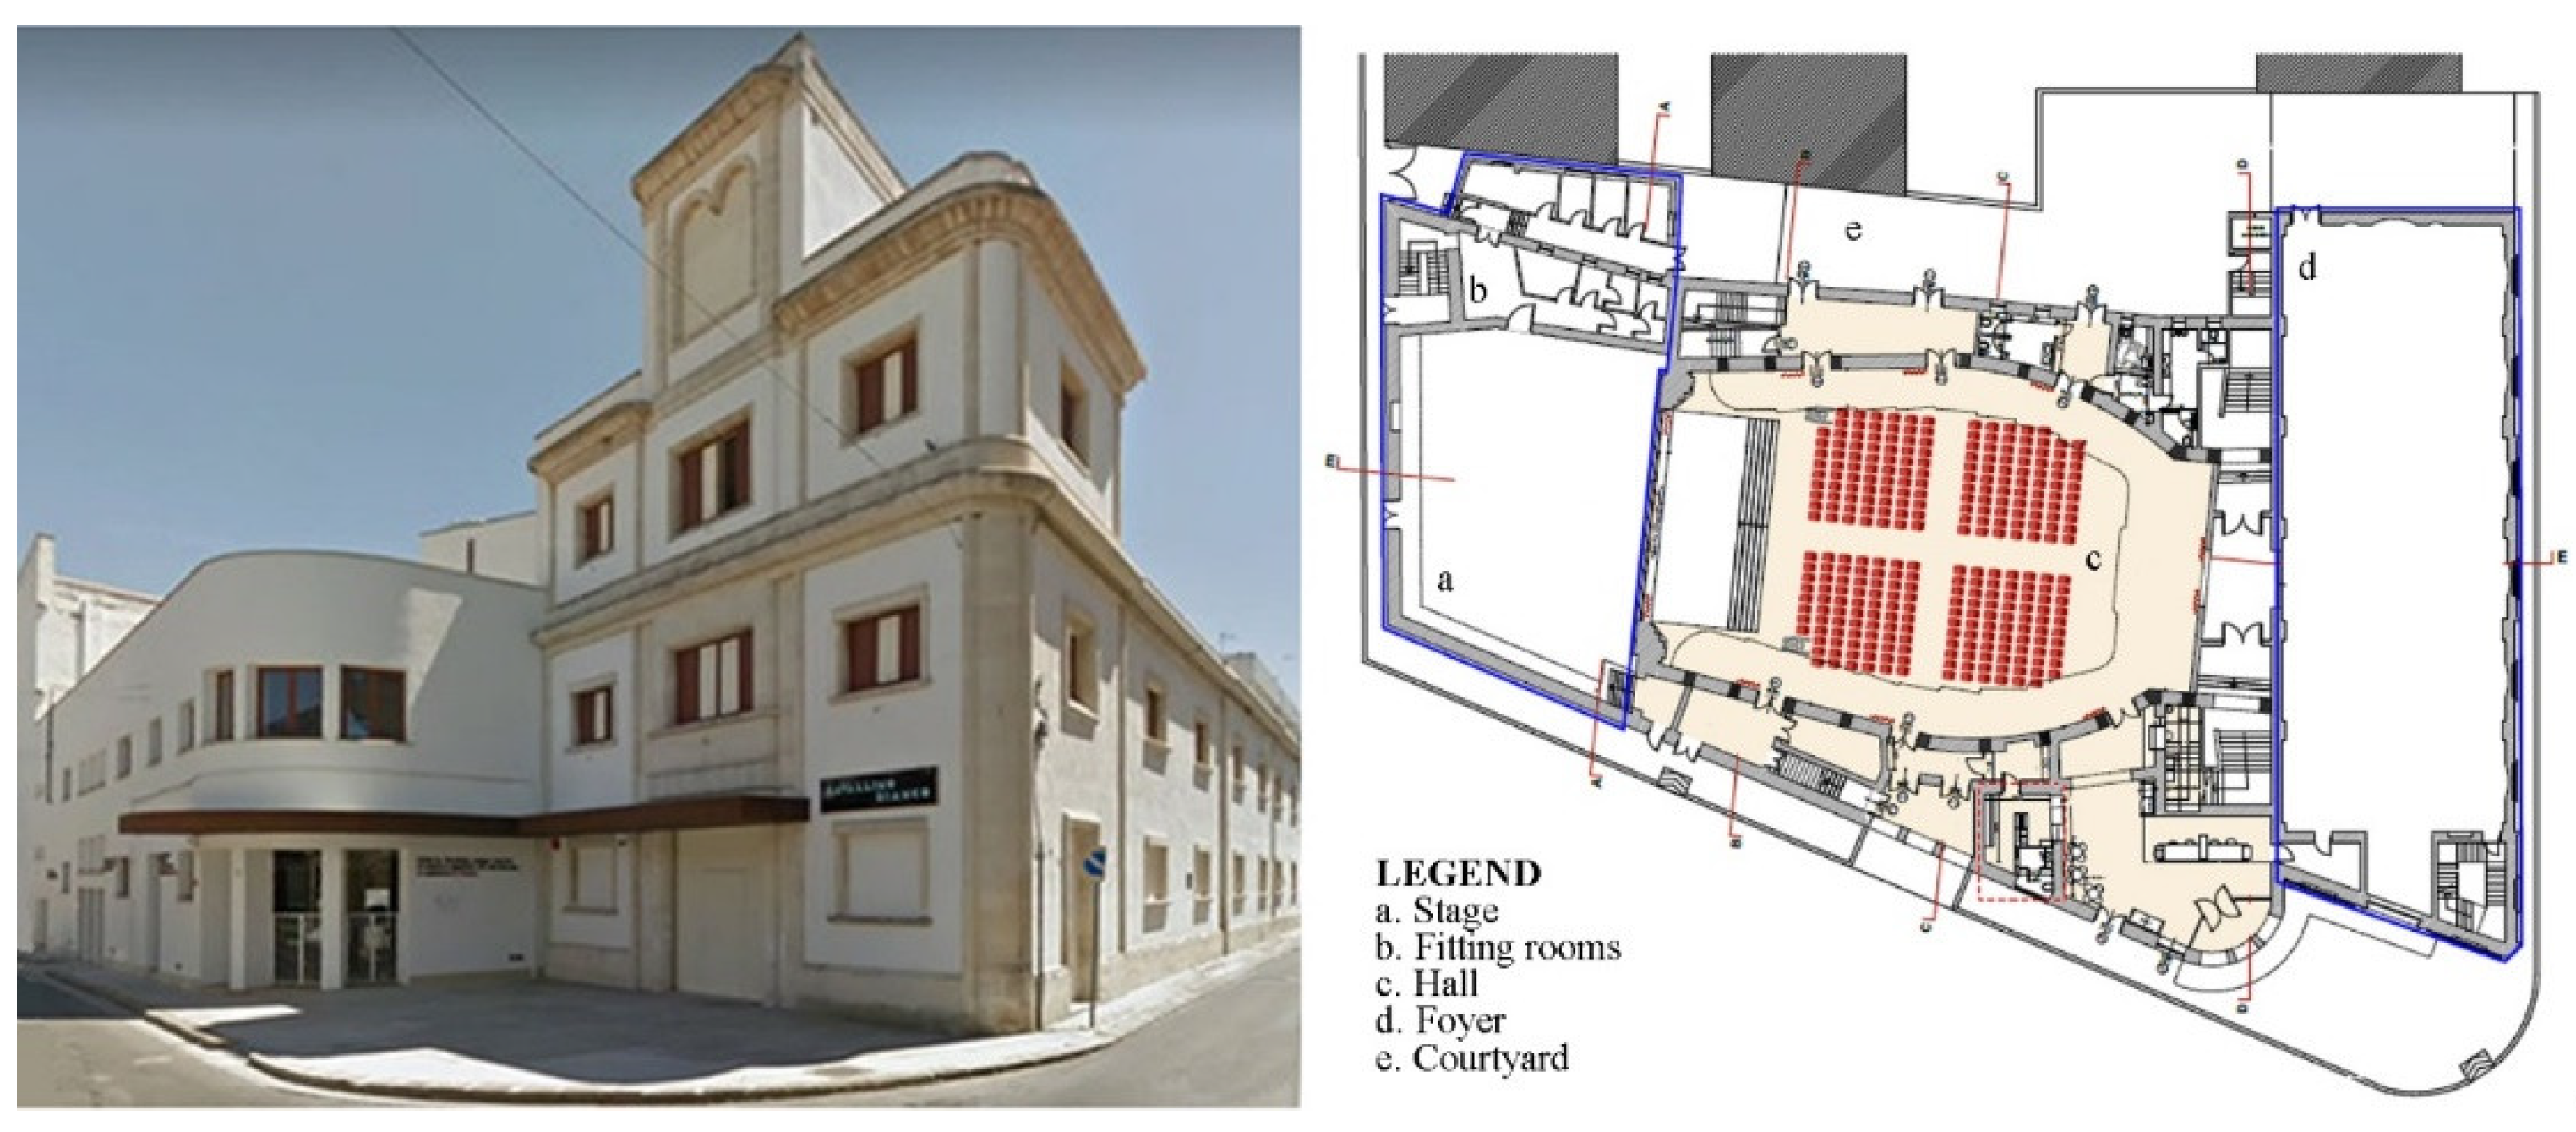
The “Cavallino Bianco” Theatre
The “Cavallino Bianco” Theatre, located in Galatina in the South of Italy and built in the 1950s, represents a cultural center of excellence. The rationalist language of the first decades of the 20th century influenced the construction of the Theatre. It is perfectly uniform in shape and color for its urban context thanks to the use of local materials, such as carparo and Lecce stone, which strongly characterized the buildings of the time. The construction technique is mixed, with local tuff masonry and a reinforced concrete frame structure.
Figure 1 shows the internal distribution of the spaces. The
foyer is a large rectangular room with a flat roof where natural light is provided by a series of windows. The hall is on three levels: on the first level there is the
plateau, while on the two upper floors there are the galleries, consisting of a series of balconies on the right and left side of the hall (20 balconies per floor for a total of 40 balconies). Two large staircases conduct to the seats on the upper floors, to the two levels of the balconies, and to the engine room. Two other staircases are in proximity to the stage. The dressing rooms are located on one side of the stage and are connected to a staircase leading to the head of the stage tower.
Table 1 presents the maximum capacity of the large, horseshoe-shaped hall for the historical configuration, called Combo 00.
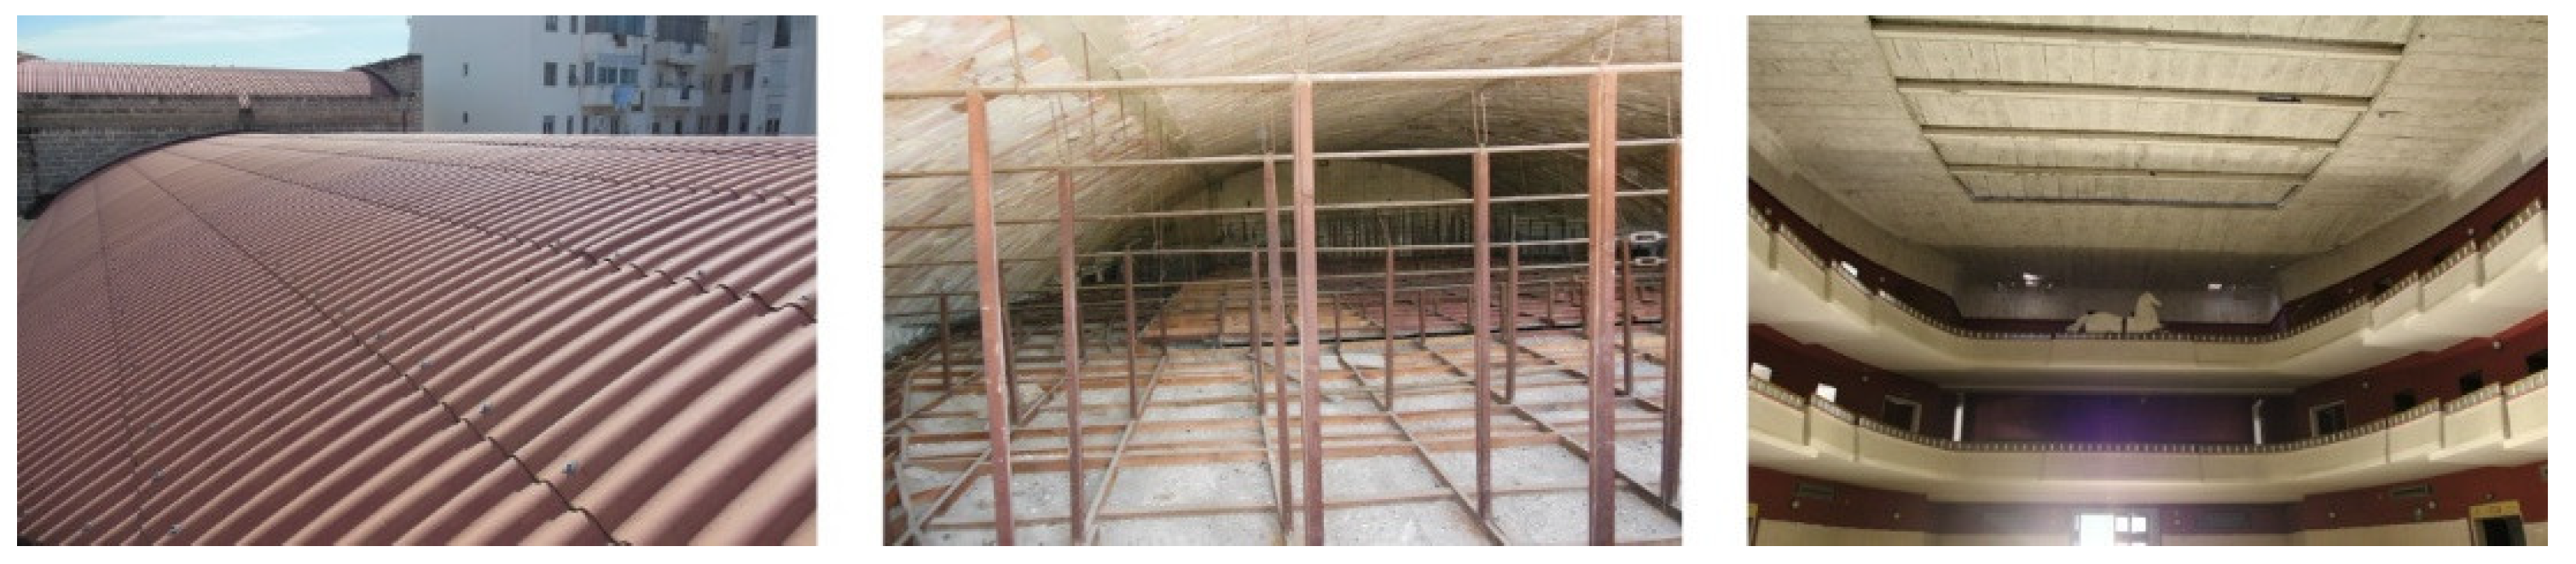
Two curved roofs were made with brick and concrete (
Figure 2), with a perimeter beam resting on a series of pillars and closed by a thick series of transverse steel. All the other roofs are protected from the outside with the typical local system made with slabs of
Pietra di Cursi laid on a sloping layer of
tufina (tuff ash). All the floors are in wrought cement with colored grit, a very common method in the 1950s. The original roof of the hall had a false ceiling made of pressed vegetable fibers. The internal volume of the hall was equal to 8400 m
3.
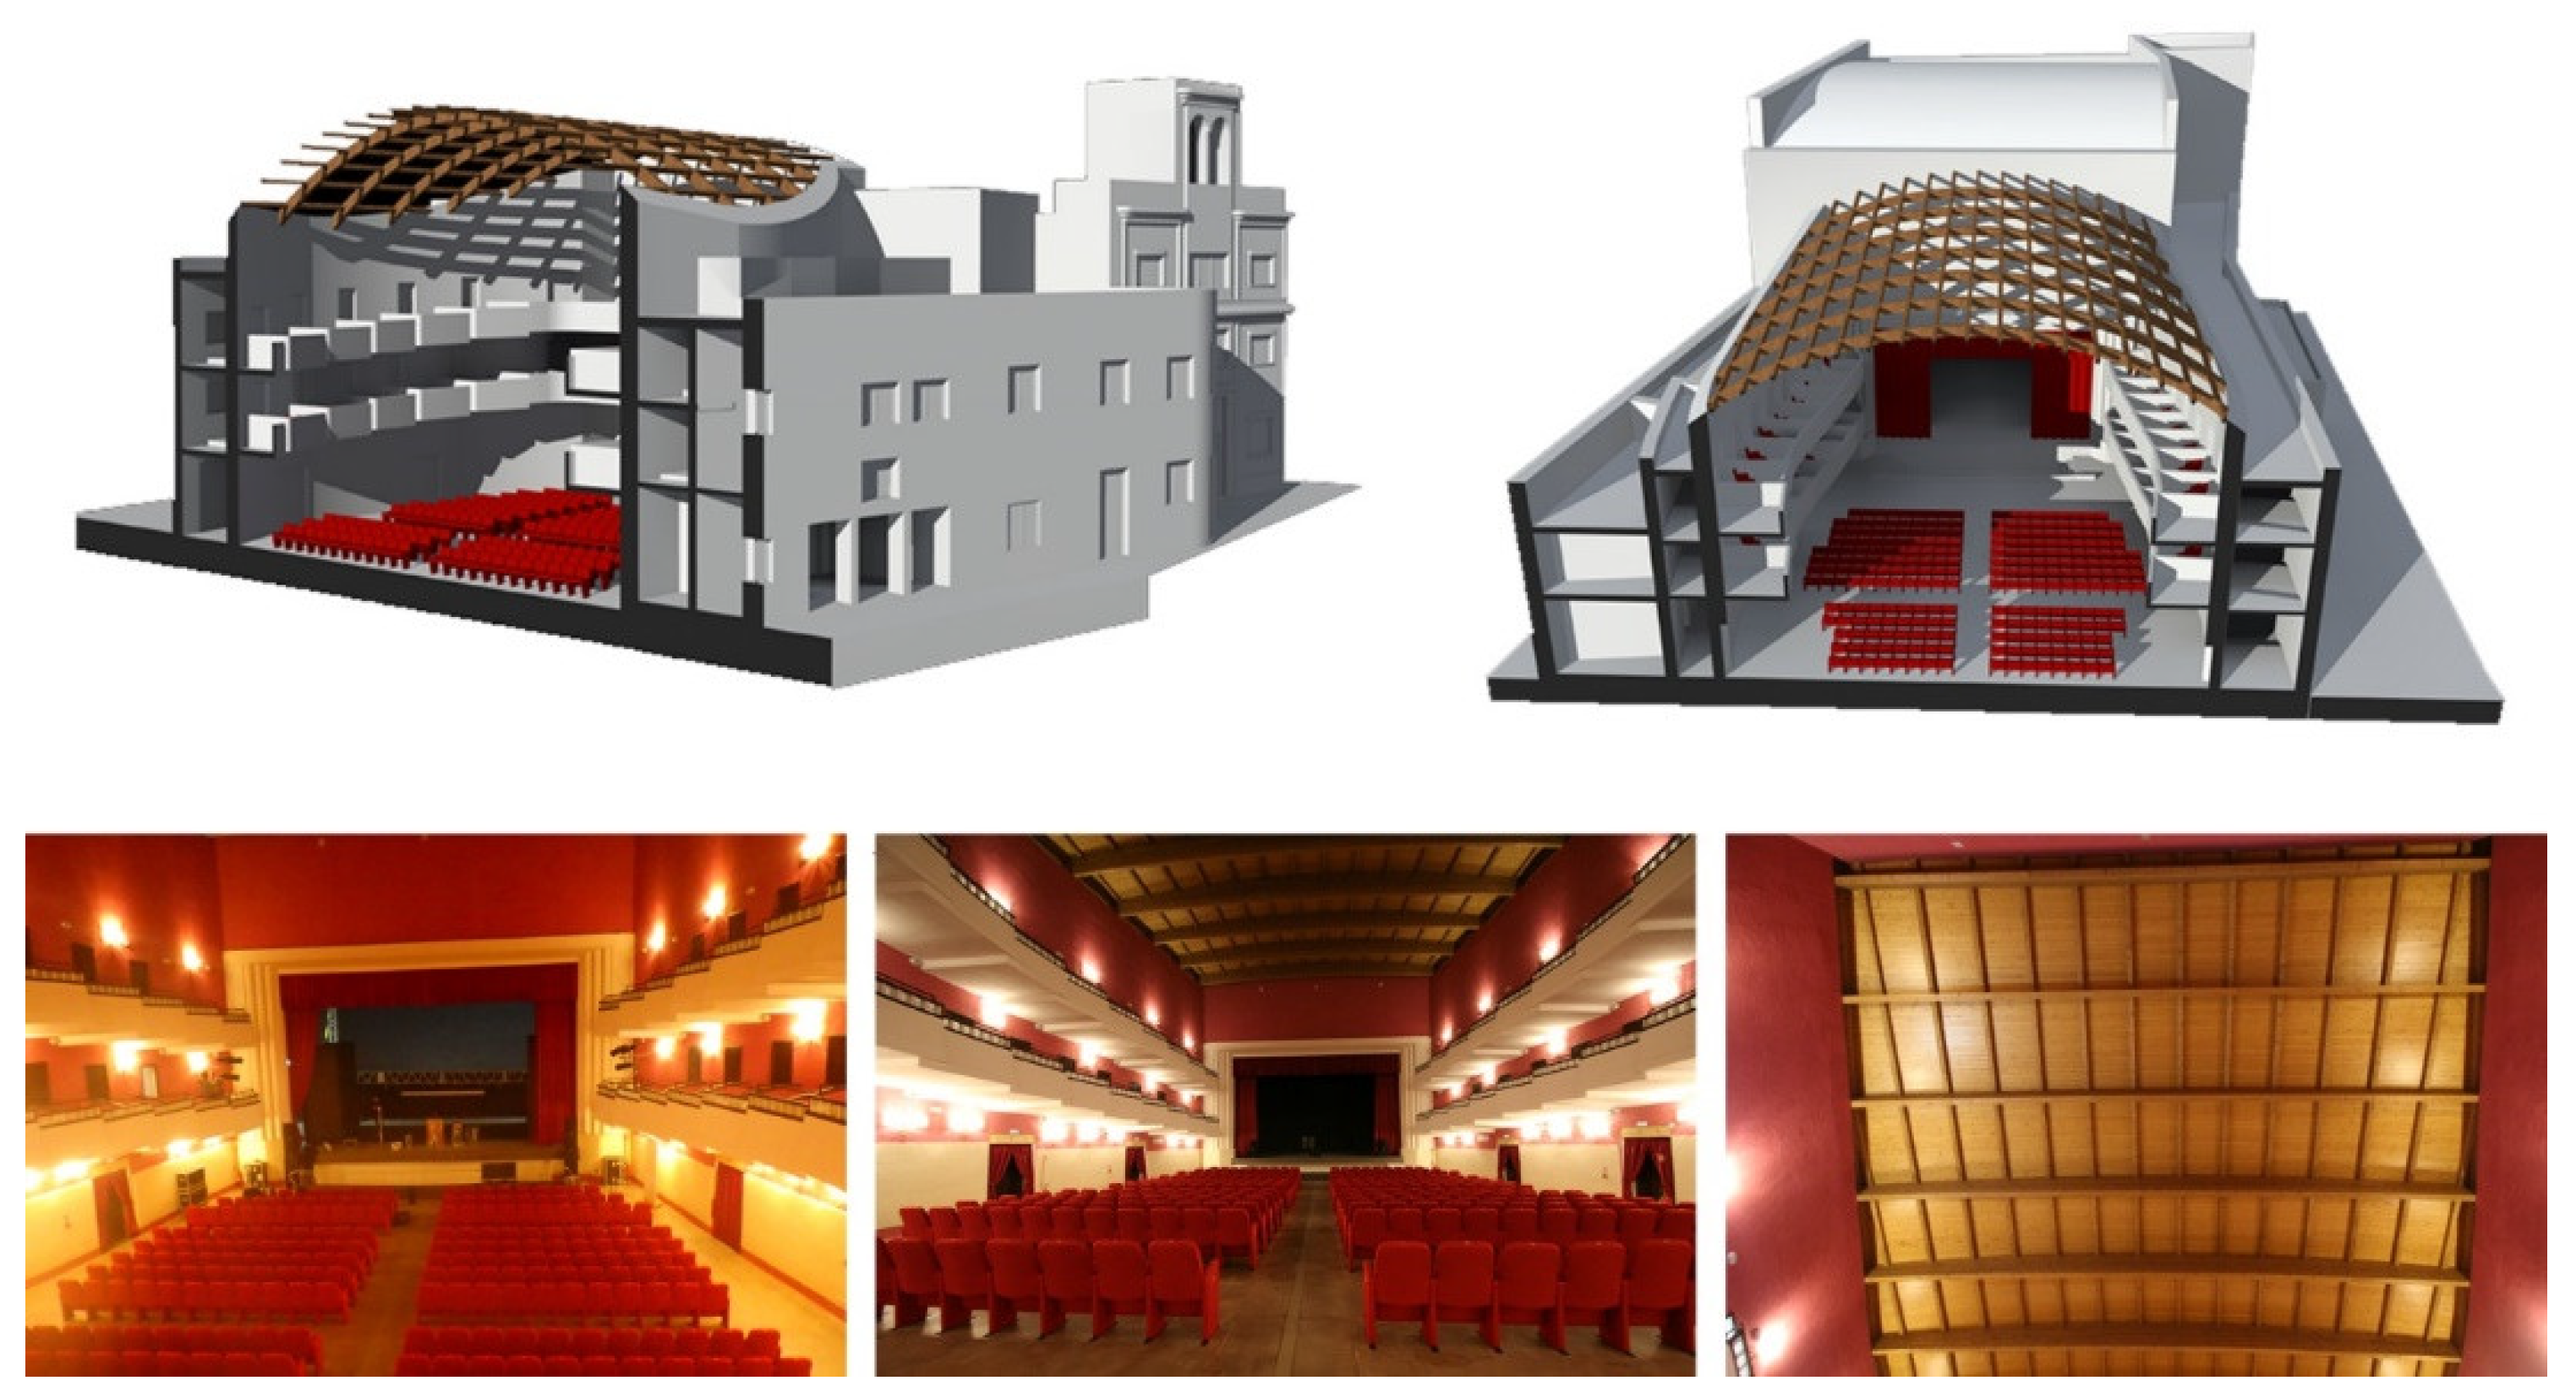
For structural strength, the original roof was demolished and replaced by a roof with a new glulam structure, which remained exposed without a false ceiling (called Combo 01). This resulted in a significant increase in the volume of the room and a consequent deterioration of the original acoustics, showing excessive reverberation time. Combo 01 is shown in
Figure 3, and provides an internal volume of 9200 m
3. The HVAC system was an all-air system with the air supply with diffusers placed near the ceiling on the wall opposite the stage tower. Therefore, when the system was in operation, the difficulty of ensuring adequate air movement in the theatre was noticeable.
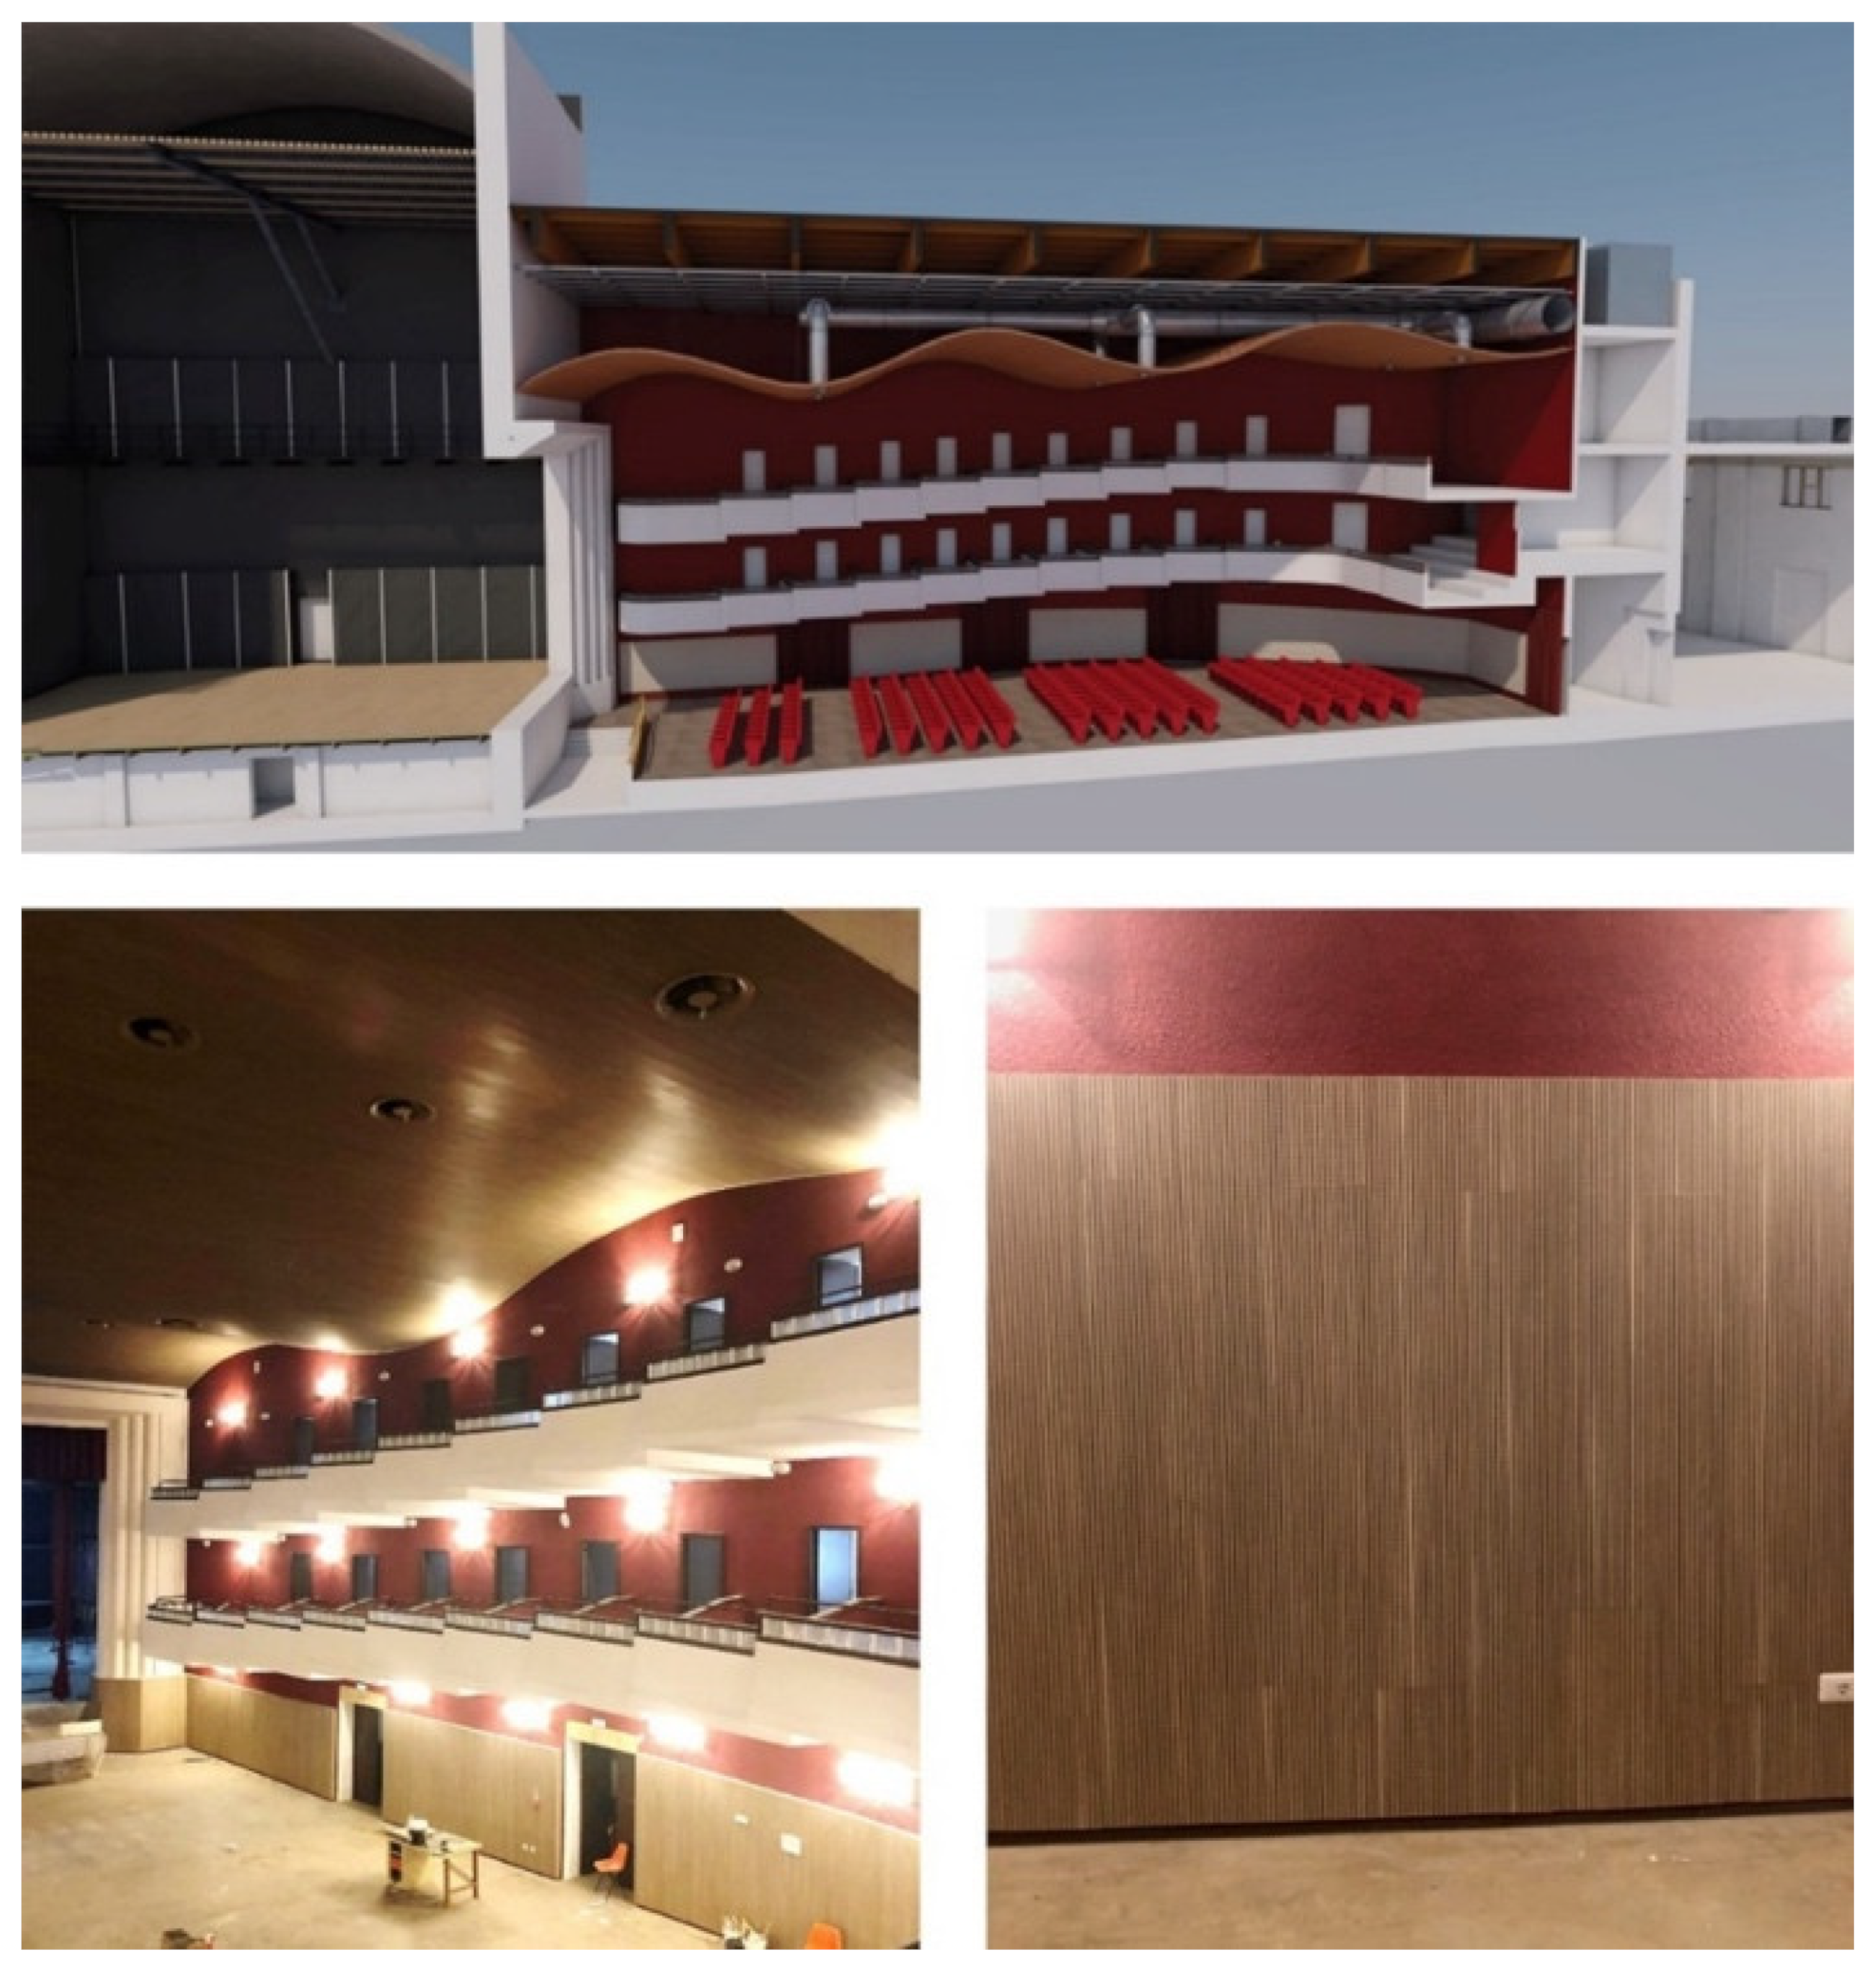
Subsequently, to improve the interior acoustic quality by reducing the reverberation time and absorbing the background noise of Combo 01, an additional configuration, called Combo 02, has been proposed, which consists of a wave false ceiling and vertical acoustic panels applied to the first 2.20 m of the hall walls at audience level (
Figure 4). The suspended ceiling, which has a pleasant, undulating pattern extending from the gallery towards the stage, significantly reduces the volume of the auditorium.
The special undulating shape was designed and acoustically verified to serve several functions: to restore the volume of the room to similar values as the original, to conceal the new HVAC system ductwork (as shown in
Figure 4 at to the p) in order to correct critical air distribution issues, and to act as an absorbent/reflective surface to ensure greater listening uniformity in the room.
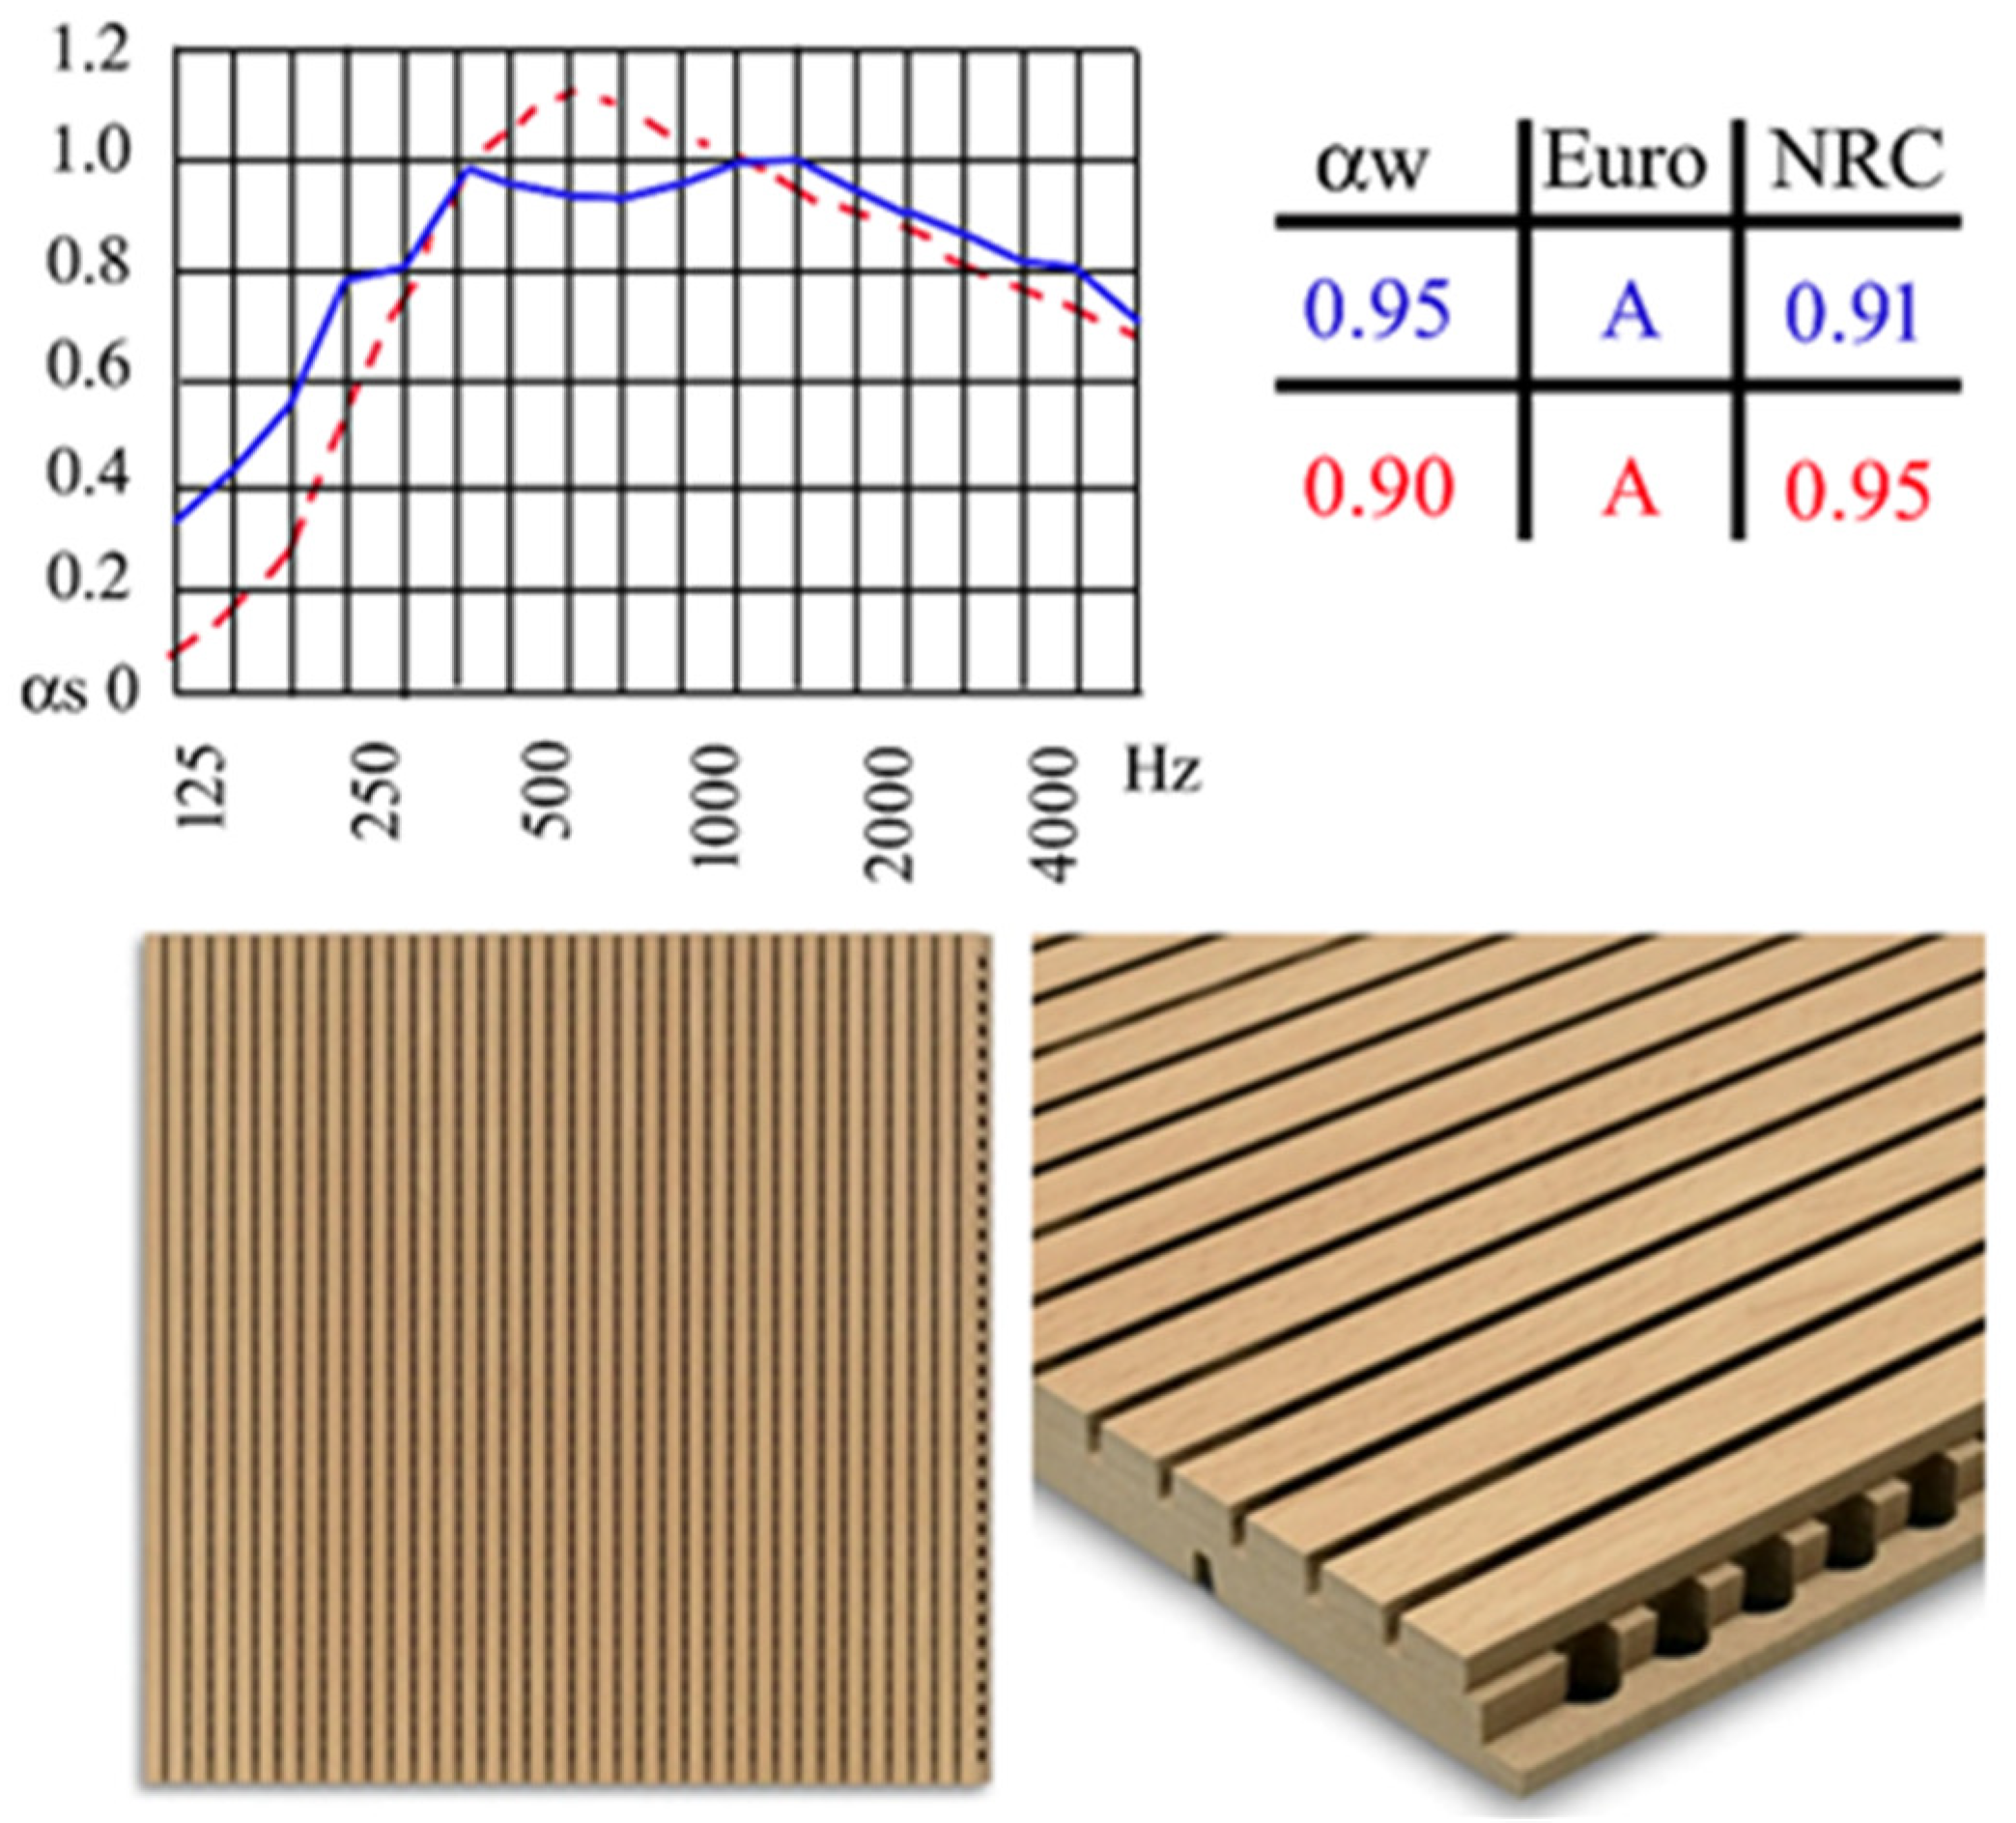
Table 2 presents the technical characteristics of the acoustic panels used for the walls and false ceiling. The panel stratigraphy is a mixed acoustic configuration whose efficiency is defined according to the principles of Helmholtz resonators (cavities) and vibrating membranes.
The panels consist of MDF (medium density fiberboard) lamellae measuring 4061 × 128 mm. The structure of the lamellas is articulated on milled longitudinal sections associated with a pattern of rear pitch holes, with the function of expanding the sound waves, thus lowering most frequencies. The rear surface of the slats has a sound-absorbing film made of black, non-woven fabric (TNT). The characteristics of sound absorption are guaranteed not only by the processing of the panel but also by the positioning of special rock wool mats (with density varying between 30 and 60 kg/m
3) to meet all the requirements dictated by the aesthetic–acoustic design and geometry of the rooms. The laminated structure of the panels is characterized by longitudinal milled details associated with a pattern of back-positioned holes. The lamellas allowed easy assembly and ensure the uniformity of the surface due to the absence of visible joints (
Figure 5). It shows the absorption coefficient for the panel in function of the frequency.
2. Acoustic Requirements
Numerous indicators have been proposed in the literature for assessing the acoustic quality of indoor environments [
3,
37]. Moreover, expressing an unequivocal judgment on the acoustic qualities of a concert hall is quite complex since it is strictly influenced by the culture and musical sensitivity of each listener, as well as by the type of music performed.
W.C. Sabine [
38] defined three simple rules to achieve good acoustics in an auditorium: guarantee a sufficiently loud sound at all points of the room; the sounds succeeding each other with rapid emission must reach the listener clearly and distinctly preserve their individuality; and the spectral components of complex sound must maintain their relative intensities.
As well known, the definition of the acoustic objectives is linked to the identification of the parameters that allow describing the quality of the room, both in terms of good listening and noise control. In particular, acoustic design aims at the correct transmission of the sound message from the stage to the audience.
Always, the acoustic characteristics of the room where the communication takes place can disturb the quality of the signal transmission, making it less intelligible to the listener. Good reception requires a good sound level of the useful signal and control of sound reverberation, quantified by measuring or calculating the reverberation time. Reverberation time is the most direct evaluation criterion for defining the acoustic quality of a room.
In confined environments, the perceived sound is modified by the reverberation phenomena, whereby a certain quantity of sound energy continues to persist after the sound signal has been interrupted: the greater the reverberation time, the longer the sound will persist within the room.
The effects of reverberated sound on listening quality are assessed by determining the conventional reverberation time, T60, which is the time required for the sound level to decrease by 60 dB after interruption of the sound emission.
According to UNI EN ISO 3382 [
39], to assess sound quality, it is important to consider the first 20–30 dB of decay. In any case, since there is no really recorded decay of 60 dB, due to the volume of the theatre and the single dodecahedral source used, it is possible to extrapolate the reverberation time value from a linear portion of the decay curve. The most used parameters is the reverberation time given by T
20, which is the time of decay between −5 and −25 dB multiply by 3, and T
30, i.e., time for decay between −5 and −35 dB multiply by 2. The decay time of the first section of the decay curve, from −0 to −10 dB, is called EDT (early decay time).
The optimal reverberation time value represents the right compromise between achieving a sufficient sound level under passive acoustics at all points in the room and reducing the harmful effects of excessive reverberation. The optimal reverberation time can be determined according to the volume of the room and its intended use. For example, rooms intended for listening to speech, where the direct sound is preferred to reverberated sound, need shorter reverberation time values than rooms designed for listening to music.
Table 3 shows the values of the optimal reverberation time [
40] considering different uses and maximum seat capacity.
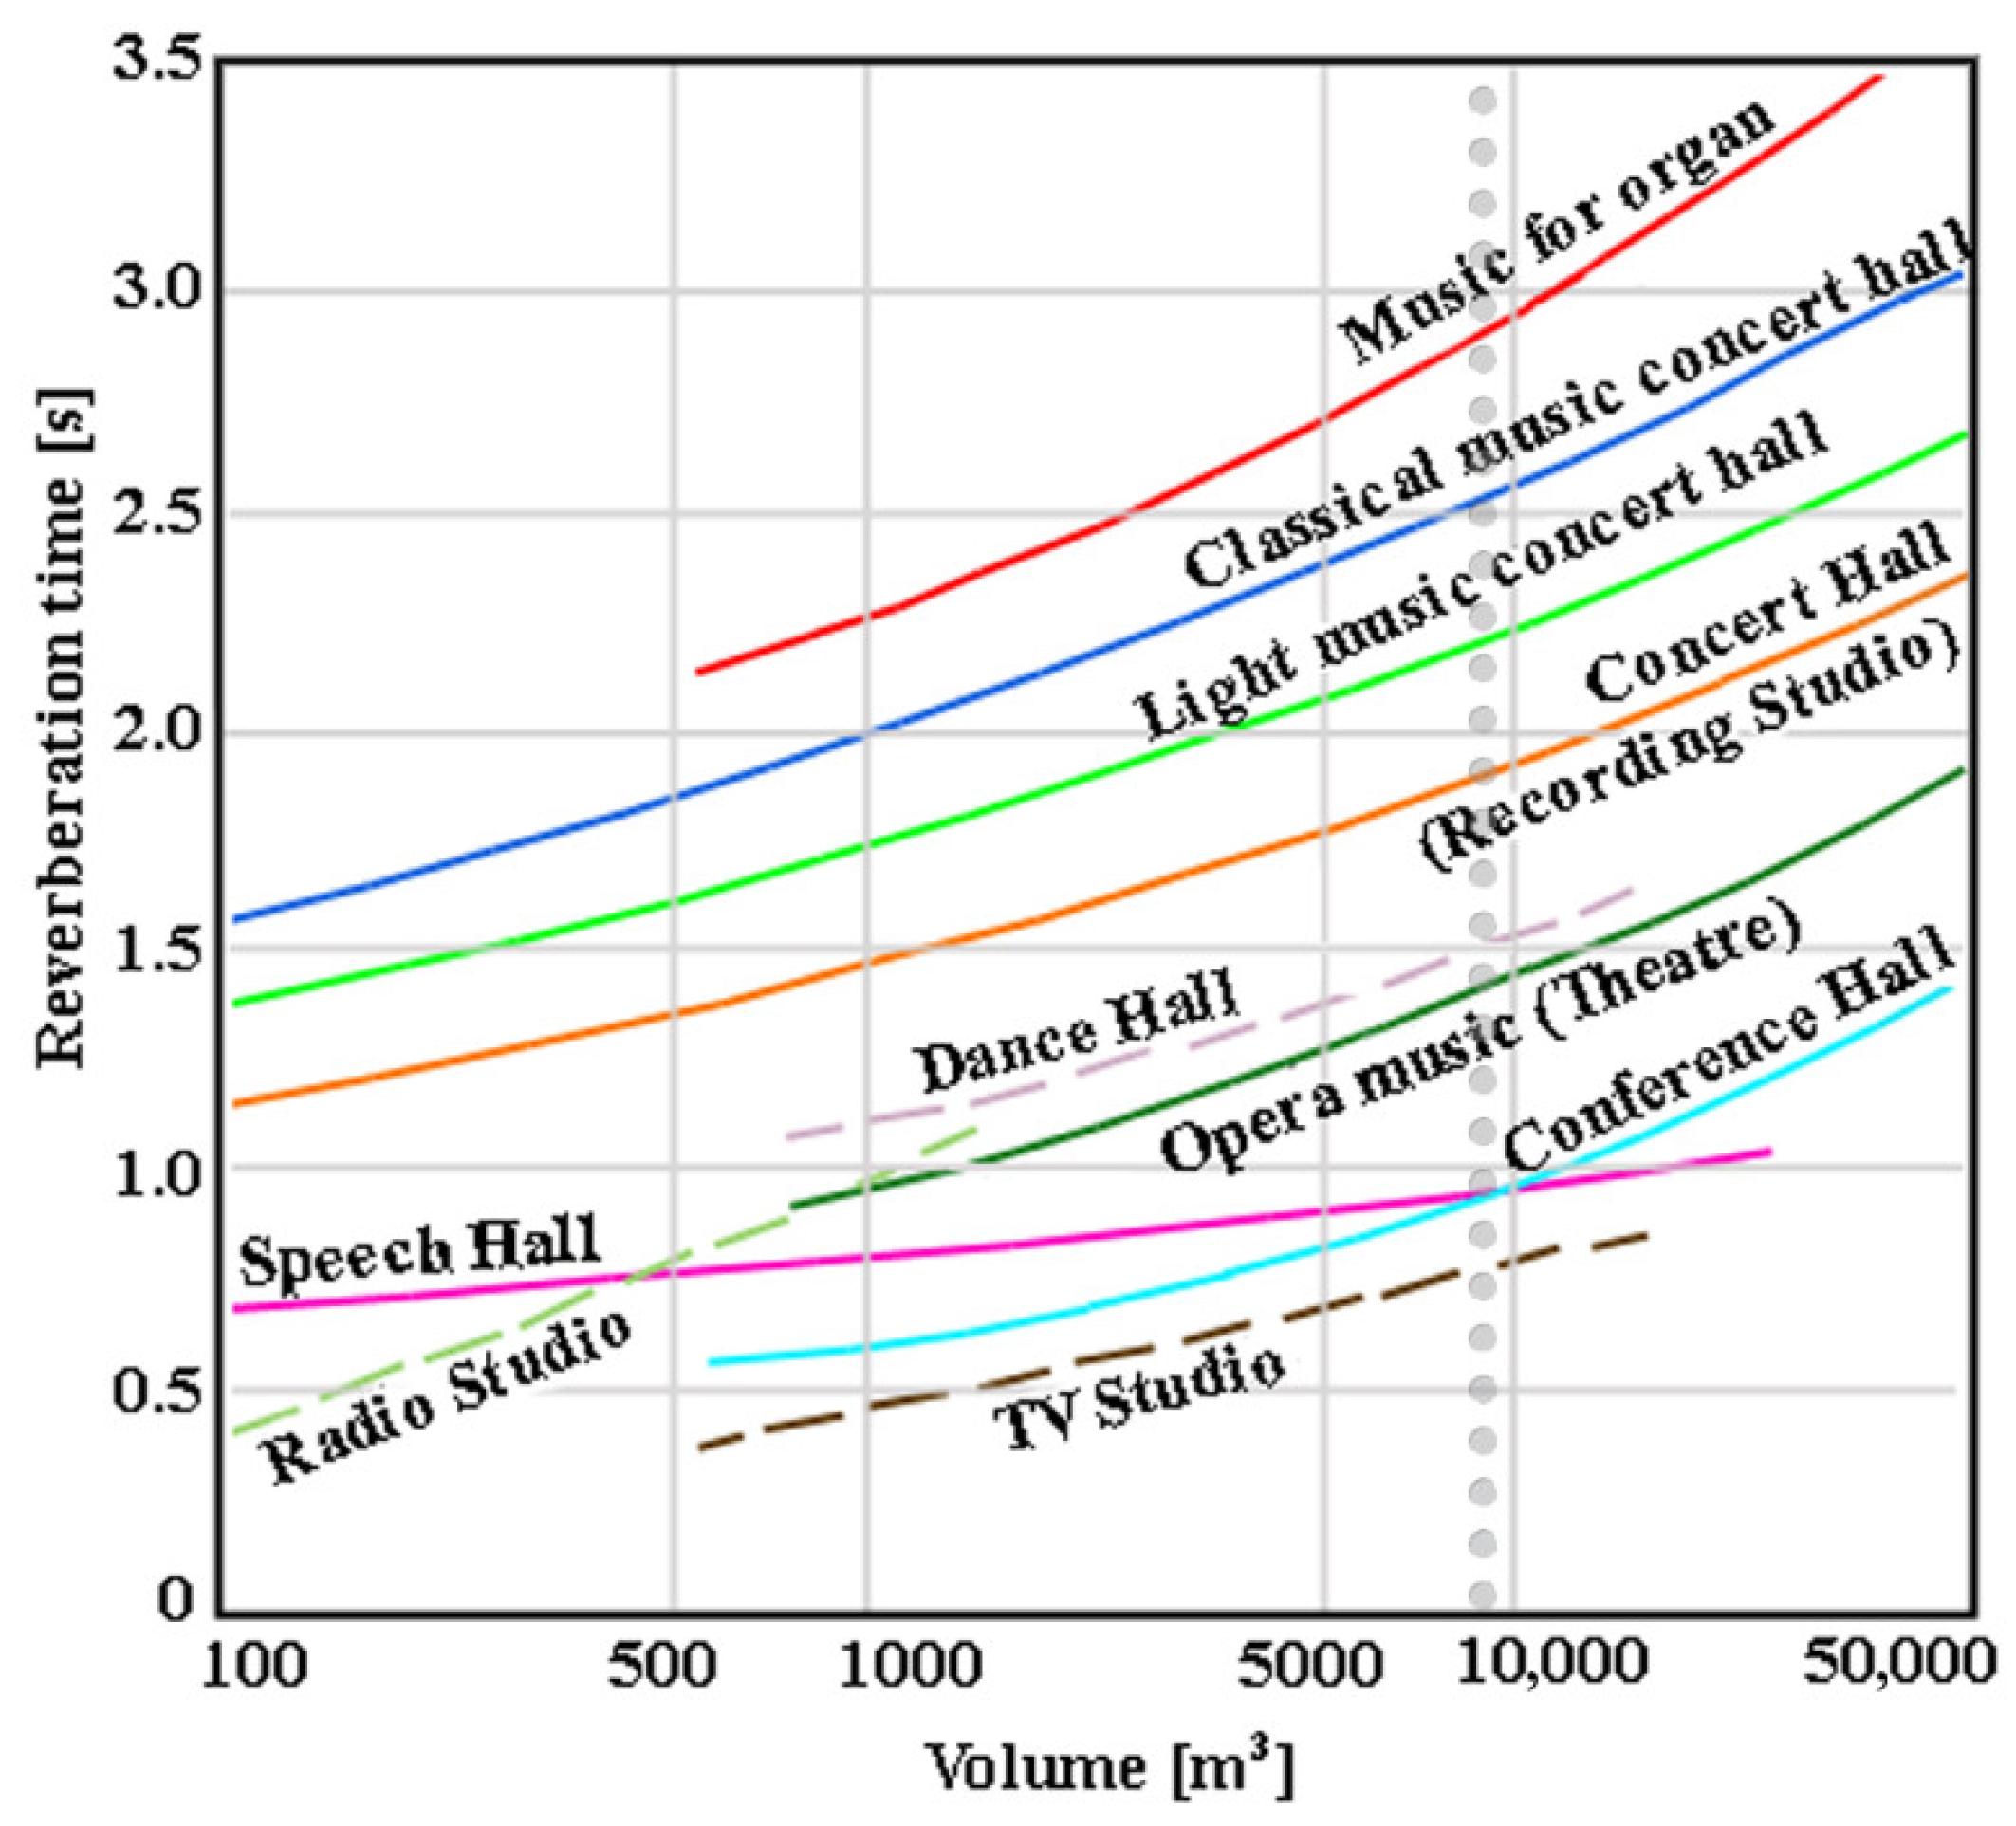
Figure 6 shows the optimal reverberation times as a function of the internal volume and the intended use [
41]. The values shown refer to a frequency of 500 Hz. The dotted line indicates the volume of the “Cavallino Bianco” Theatre (9200 m
3) in Combo 01.
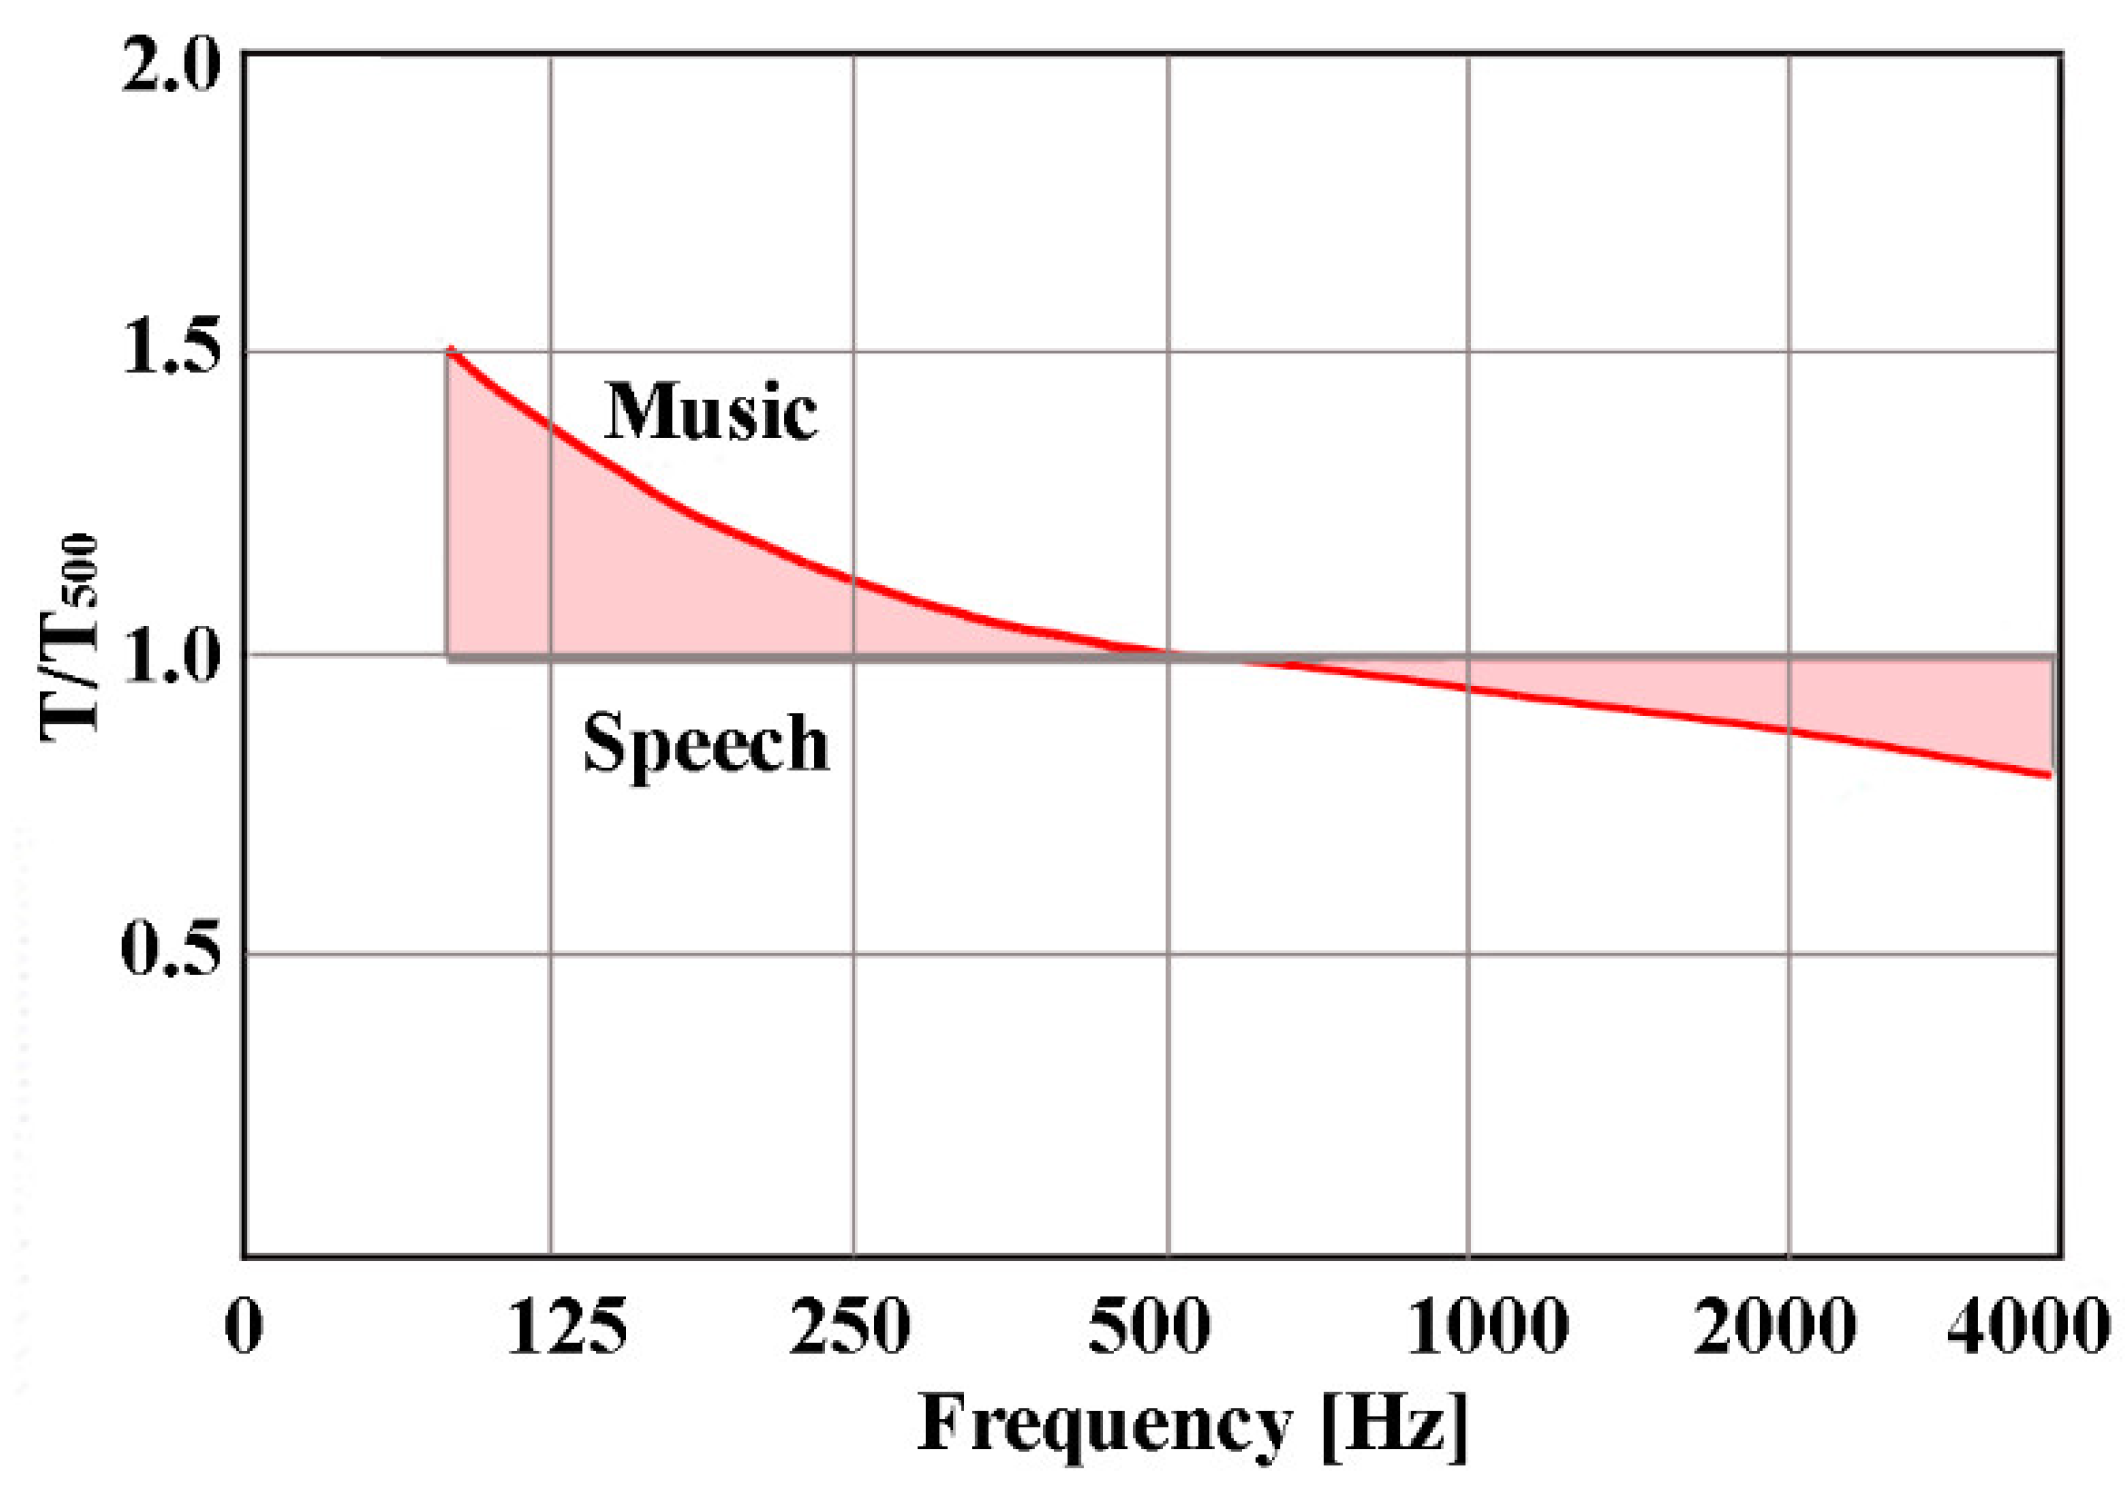
The optimal reverberation time changes depending on the frequency. According to the theory of Kinsler [
42], the reverberation time of large halls should be within the range shown in
Figure 7, it is accepted that the reverberation time at lower frequencies can almost double the value corresponding to 500 Hz. Since the absorption coefficient of the walls varies with frequency, the reverberation time also varies with frequency; thus, it is possible to refer to a precise frequency.
Table 4 shows the reference parameters based on the listener aspects in accordance with ISO 3382 [
39]. The single-number frequency averaging denotes the arithmetical average for the octave bands, except for the late lateral sound level (L
j), which is averaged energy. The typical range column refers to frequency-averaged values in single positions in non-occupied concert and multipurpose halls up to 25,000 m
3.
Acoustic quality can be evaluated using the clarity indexes C80 and C50, which assess the intelligibility of words and musical signals and, consequently, the acoustic comfort. Clarity is defined as the logarithmic ratio between the energy received within 80 ms (C80) or 50 ms (C50) and all the energy that follows; it represents the degree of distinctiveness of the sound, that is, how much single sounds are distinguishable from each other within a complex emission. The clarity index is a measure of music understanding and represents the relationship between the so-called “useful” energy, which includes direct sound and reflected sound that reaches the listener within the first 80 ms after the arrival of direct sound, and the energy after that moment.
C80 is mainly used for music: it interprets subjective feelings regarding the perception of attack clarity, the difference between different voices, transparency, source localization, and sound definition. Values of C80 around 0 dB relate to acoustic environments suitable for the performance of symphonic music, while for opera it must be between 1 and 4 dB. The limits for instrumental music are −2 and +2 dB.
Another method to establish the level of speech quality is the speech transmission index (STI) [
43], which considers the effects of background noise and reverberation on speech intelligibility. The STI aims to objectively quantify the intelligibility of speech at a specific location in an environment when “speech” is produced through a normalized signal at another specific location of the environment. The STI method is useful for evaluating the effects of changes introduced in the environment (presence of people, geometric changes, presence of materials, etc), for acoustic correction, and for predicting the quality of speech intelligibility when comparing different environments.
Table 5 reports the speech transmission quality class of RASTI (rapid speech transmission index), which represents a simplified STI value that does not conceptually add anything to the STI.
In general, as regards the validity of the predictive results obtained with models based on empirical formulas, it is noted that the direct sound field is always correctly predicted and, consequently, the model is particularly suitable for the study of the sound level near the sound source itself. Over a certain distance from the sound source, on the other hand, the reverberant field prevails. In this area, whose extent also depends on the directivity of the sound source, the prediction is only correct if the room is like a reverberating room with a perfectly diffuse field, i.e., reverberation time the same everywhere and regular perfectly linear sound-level decay curves over time. In theatres and auditoriums, these assumptions are generally respected.
It should be noted that these aspects are widely influenced by typology, location, period of construction, materials, size, and configurations/geometry of the theatre. Moreover, several studies presented in the literature focused their attention on the evaluation of T30 (while in this study the T20 values are shown) and on parameters that are more important for specific tasks of the theatre (e.g., a certain kind of music performance). Finally, similar studies selected different positions of sources. For this reason, a direct comparison of the results of other studies conducted in other theatres shows that the evaluated parameters are very different. The study [
41] presented an acoustical assessment of the Teatro Nuovo of Spoleto and the Teatro Alighieri of Ravenna and found that, based on the room volume and reverberation time, it is possible to see that the parameter T20 in both theatres is slightly below the optimum value. The trend lines of the EDTs of the two theatres are very similar to each other, but the trend line of the speech clarity index (C50) in Ravenna is higher than in Spoleto. Alayòn et al. [
5] conducted a study on a Roman theatre in Malaga by comparing results with other similar theatres outputs and found that the decay times obtained by simulation in this theatre were coherent with the experimental results of theatres of similar dimensions in Hispania (Italica EDT 0.75 s and T30 1.07 s, both at mid frequencies). The study conducted on Eszterháza Opera House [
44] found that C80 results in a sound level of around 1.65 dB, confirming the same uniformity of the perception in all the positions, but the situation in the stalls and galleries differed significantly.
3. Methodological Procedure
Table 6 presents the main parameters of the analyzed combinations and specifies when numerical and/or experimental measurements were performed.
As previously described, Combo 00 represents the hall with a curved roof and a false ceiling made of pressed vegetable fibers. The hall has no vertical panels or draped curtains. Analysis was carried out by the EASE software considering the presence of an audience in the hall. There are no on-site measured data for this combination. As is well known, in architectural acoustics, the influence of the audience on the overall reverberation time is very important. In further work, this aspect will be considered.
Combo 01-v is the hall with a wooden roof without a false ceiling. The hall has no vertical acoustic panels or draped curtains. For this Combo, there are numerical and experimental results; both are without the presence of an audience in the hall.
Combo 01 is the hall with a wooden roof without a false ceiling. The hall has no vertical acoustic panels or draped curtains. Analysis was carried out by the EASE software considering the presence of an audience in the hall. There are no on-site measured data for this combination.
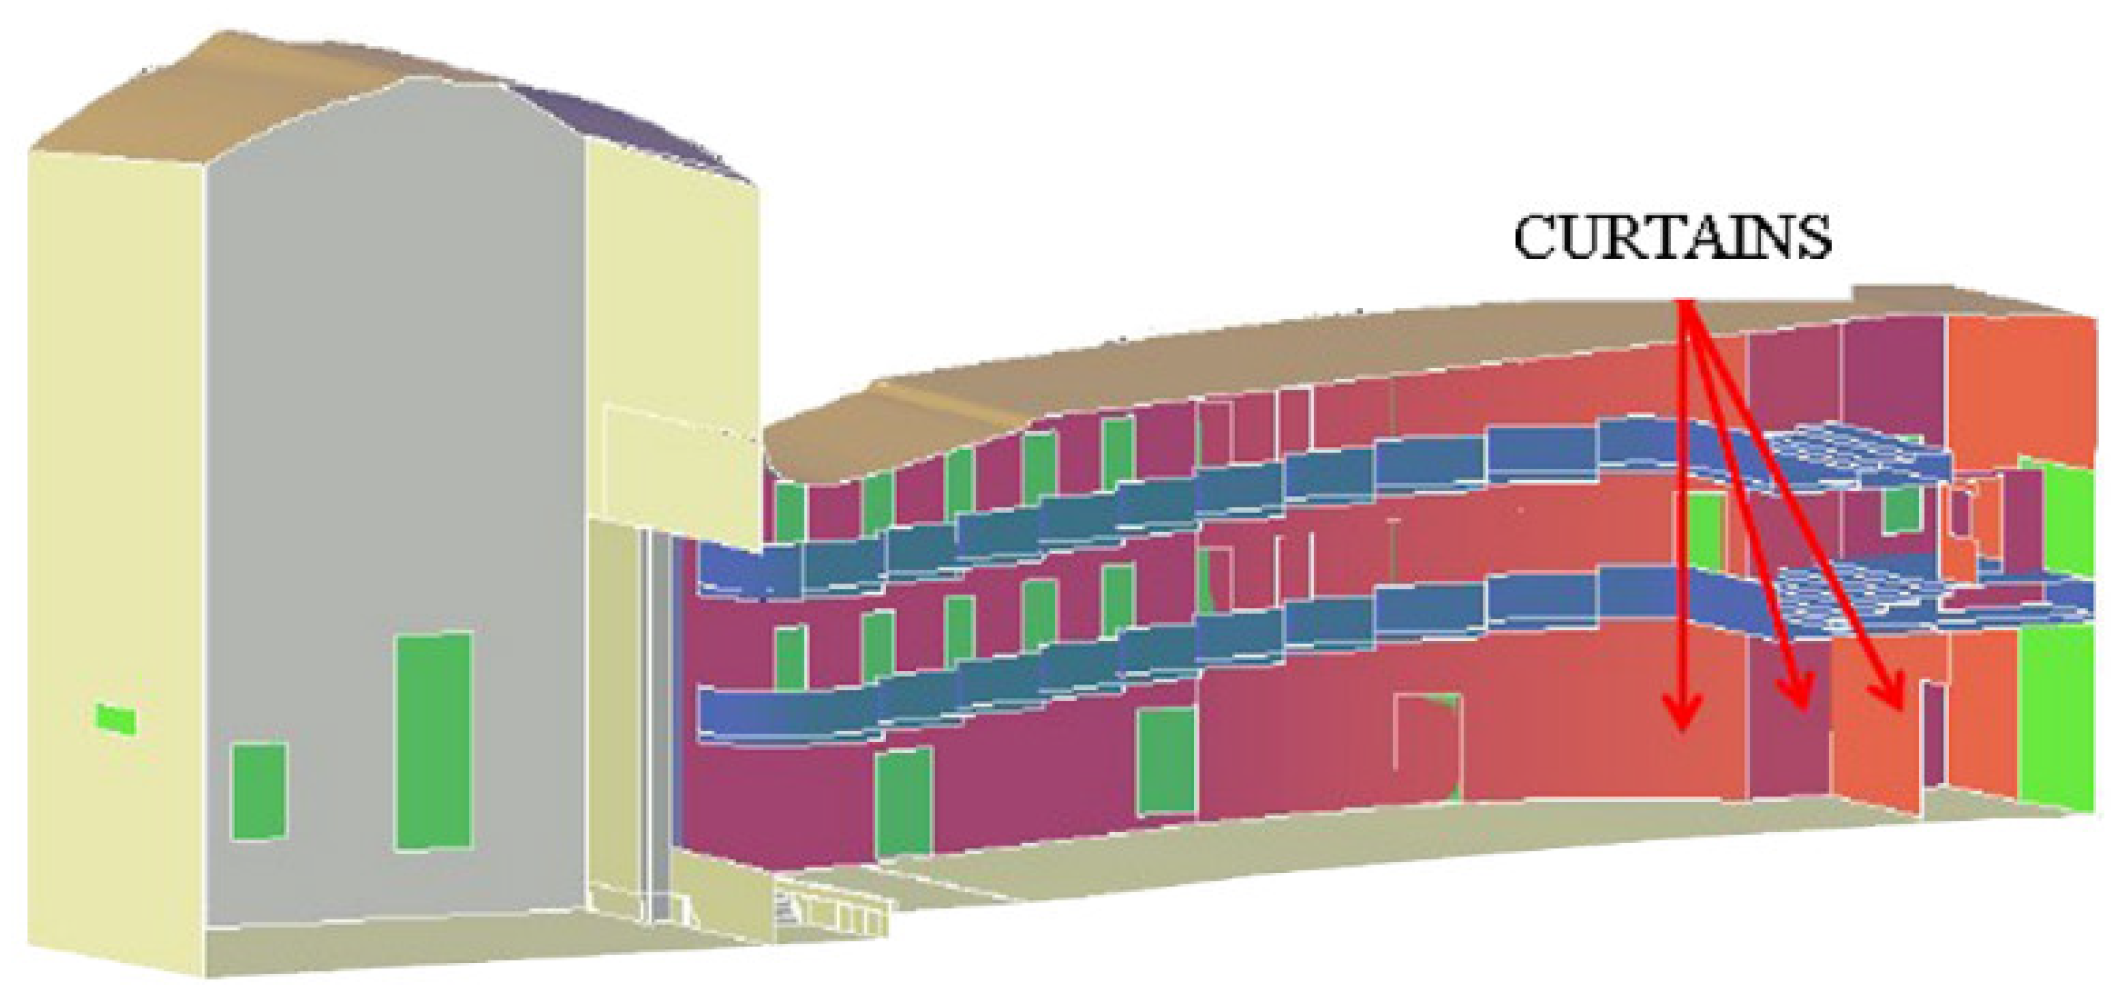
Combos 01-a/b/c are characterized by the hall with a wooden roof without a false ceiling (see
Figure 8). The hall has no vertical acoustic panels, but the hall is equipped with heavy (Combo 01-a), medium (Combo 01-b), and light draped curtains (Combo 01-c). Analysis was carried out by the EASE software considering the presence of an audience in the hall. There are no on-site measured data for these combinations.
Combo 02 shows the acoustic behavior of the hall after the installation of sound-absorbing and sound-reflecting acoustic panels vertically on the walls at audience-level and a false ceiling in the auditorium. Analyses were numerical with EASE software and experimental with on-site measurements, both without an audience.
Combo 02-a differs from Combo 02 due to the presence of newly upholstered chairs and an audience. For this configuration, there was only a numerical analysis conducted in the EASE environment.
Combo 02-b is like Combo 02-a: the hall has a wooden roof with a wave false ceiling, vertical acoustic panels, and upholstered chairs. In this case, analyses were numerically and experimentally performed without an audience.
3.1. On-Site Measurements: Measurement Instruments
Acoustic investigations allow evaluating the acoustic field of the theatre [
45]. On-site measurements were performed using the following instruments:
The sound-level meter was calibrated before and after each measurement cycle with a fixed reference signal of 94 dB using the CB006 acoustic calibrator. The difference between the measurements was always less than 0.5 dB.
The Software used to manage acoustic measurements is CMA - CESVA Measuring Assistant Software (ver.BCS151, C/Maracaibo, 608030 Barcelona, Spain).
The measurements of the reverberation time were performed in accordance with ISO 3382-1 [
39]. The dodecahedron and the sound level meter were placed in the center of the stage. The reverberation time (T
20) for all octave bands (63 kHz to 4 kHz) was measured using the sound-decay technique obtained by interrupting a stationary sound source. This method consists of detecting sound-pressure decay as a function of time. This decay is obtained by causing broadband and bandwidth-limited random noise in the room and recording the sound-pressure drop immediately after the interruption of the random noise source. An omnidirectional pressure source emitting broadband noise (pink noise) is used.
The criteria for the exact positioning of the sources and the sound-level meters are reported in
Table 7. The criteria also satisfy the ISO 3382-1 [
39].
Once the source was positioned, the sound-level meter was calibrated.
For each measurement, the source was turned on, and there was at least a two-second delay before turning off the dodecahedral source. Three measurements were made for each position of the sound-level meter, with the source in a fixed position on stage.
The measurement of T30 needs a level at least 45 dB above the background noice in each frequency band. Since the power of the dodecahedral source was low for the large volume of the theatre, the T20 was measured.
To correctly acquire the noise indicators, the T20 of the environment and residual noise were evaluated to guarantee a sound pressure level at least 45 dB higher than the residual noise when the source was switched on. The frequency range examined was 50 Hz–4000 Hz.
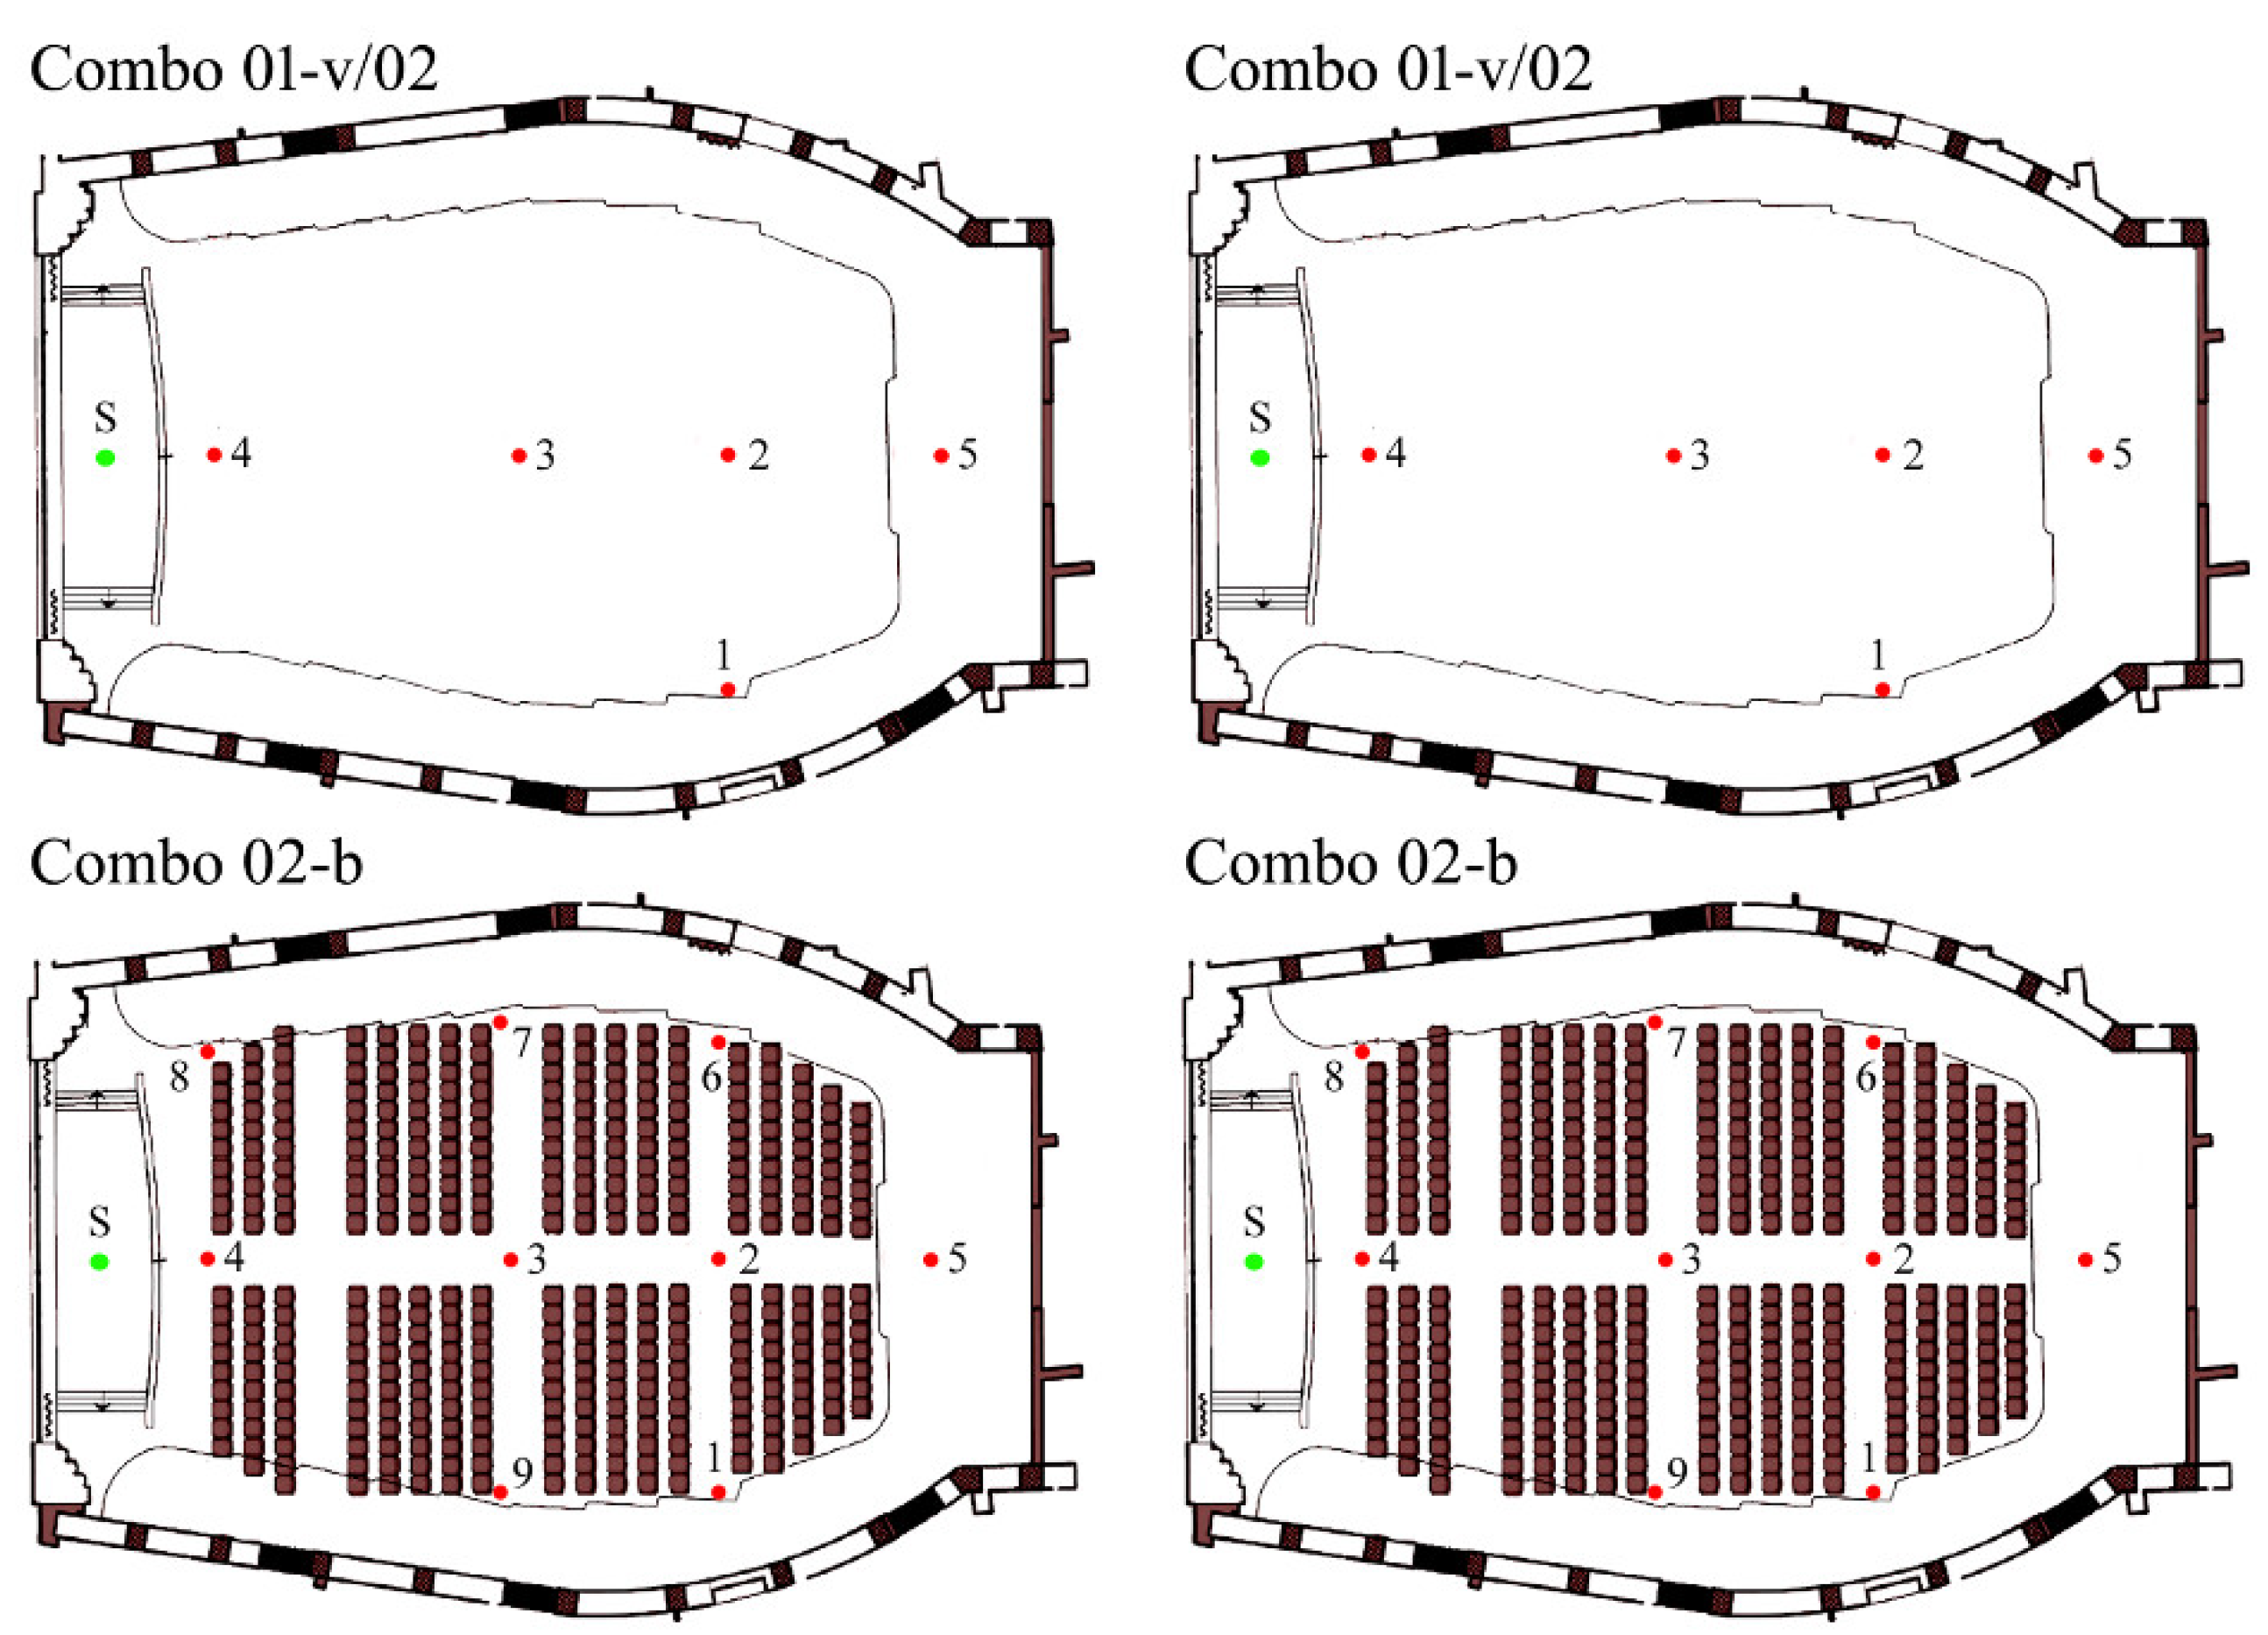
Figure 9 shows the exact positioning for the acoustic surveys for Combo 01-v/02 and Combo 02-b. More acquisitions were acquired for the last measurement (Combo 02-b).
3.2. Numerical Analysis: EASE Software
Detailed acoustic modeling of the theatre was realized using EASE (Enhanced Acoustic Simulator for Engineers) software [
51]. The software permits setting the values relative to the absorption coefficients of the envelope and the electroacoustic properties of the sound source, such as sensitivity and directional transfer functions, and the level of the individual transducers. In addition, it is possible to describe mechanical characteristics, including opening angles for line array configurations, insert virtual or measured filters, and set up different speaker models and input configurations. In this case, the sound source was represented by the dodecahedral speaker that generates white or pink noise within the room.
The investigation of acoustic parameters was carried out through a mapping process that allows numerous simulations based on the diffuse field assumptions of statistical acoustics.
Standard mapping uses statistical formulas from Eyring or Sabine to generate reverberation time values, which can be used to calculate some acoustic parameters such as STI (speech transmission index).
Calculations can be performed not only for audience areas but also on all surfaces of the room and at specific listening positions, facilitating the identification of potential problems and detailed analysis of representative positions. The results of the calculation are available in 1/3 octave as well as in higher bandwidths.
For a better evaluation of the results, reference is made to some of statistical resources, such as standard deviation, average, and distribution graph, which can be used to optimize the performance of the system and to illustrate simulation results.
EASE’s Local Decay Time function provides quick control of local reverberation time values using a special ray-tracing technique, providing more precise local results than statistical formulas over a short period of time. Calculations for several measurement points of the room can be carried out simultaneously.
This verification is important because both Eyring’s and Sabine’s formulations are based on the generalized assumption that the absorbing materials are uniformly spaced throughout the room’s surfaces, and that the reverberant sound field in the room is nearly diffuse. A single set of frequency-dependent RTs is derived from the equations for the room. Although these formulas are widely accepted throughout the world, the above assumptions are only true under certain circumstances. For example, the reverberation time can be highly dependent on the geometric properties of the room and the distribution pattern of acoustic materials, leading to different subjective perceptions of sound persistence by a listener sitting under a balcony vs. one in the middle of the room. Local Decay Time allows for analyzing this effect immediately.
Table 8 shows the sound absorption factors of elements and construction materials used.
Receivers and a source are included in the model. To create the three-dimensional model, it was necessary to find the right compromise between two needs: contained calculation times and accuracy. To calculate the parameters indicative of the acoustic performance of the hall, the simulations were performed considering a sound source with the characteristics shown in
Table 9.
4. Results and Discussions
4.1. On-Site Measurements
Firstly, the hall of the theatre was analyzed in the state in which it was found by the authors during the first survey (Combo 01-v). This choice was made considering that there are no experimental values of Combo 00 as it was demolished and rebuilt before the first survey.
Table 10 shows the on-site measurements of reverberation time (T
20) of Combo 01-v. The values shown in bold are the average values of the three measurements. The legend shows the intervals recommended in the literature, as shown in
Table 3.
Table 10 shows that the average values of the reverberation time are very high and require correction. A prior study [
52] reported that the reverberation times of Italian theatres are between 1 and 2 s, while those of other rooms are generally distributed over a wider interval of 1.0 to 2.5.
Table 11 shows the on-site measurements of T
20 of Combo 02, consisting of the application of sound-absorbing and sound-reflecting acoustic panels installed vertically on the first 2.2 m of the walls at audience-level and with a false ceiling in the hall. Analyses were conducted without an audience and before the installation of armchairs. The reverberation times of Combo 02 are lower than those of Combo 01 (the hall without a false ceiling and without insulating panels); in fact, the values are always less than 2 s.
Table 12 shows the on-site measurements of T
20 of Combo 02-b: the hall with a wooden roof with a wave false ceiling, vertical acoustic panels, and upholstered chairs. Given the current pandemic period, it was not possible to validate the acoustic behavior of the theatre with the presence of an audience.
4.2. Numerical Analyses
This section provides the results of the numerical acoustic analysis carried out on the theatre hall. Comparison between the different proposed configurations was based on optimization of T20, C80, and STI.
4.2.1. Numerical Analyses of Reverberation Time T20
Table 13 shows the comparison between the on-site measurements of the T20 of Combo 01-v and the values calculated by EASE software. There is a good correspondence between the measured and numerical values.
Table 14 shows the reverberation time T
20 of all combinations as a function of the frequency.
Regarding Combos 00, 01-v, and 01, excessive reverberation time results in sounds lingering for a long time before they fade away (values ranging from a few hundredths of a second to 2–3 s depending on the size), with the consequence being consecutive sounds continue to flooding in until they saturate the room and make it very difficult to talk, listen, or concentrate. Inadequate reverberation instead makes the room too “dry”, with the feeling of talking “in an aquarium”, and it is often detrimental to the enjoyment of music. Each room has an optimal reverberation according to its size and use; the installation of audio systems should parallel an acoustic analysis of the room. As evident for Combo 01-a/b/c, draped curtains can considerably reduce reverberation times to optimal. The values at mid-high frequencies (1000–2000 Hz) are slightly lower than the optimal value for music, increasing verbal understanding. Combo 02-a has an optimal trend, ranging between 0.5 s and 2 s for all frequencies.
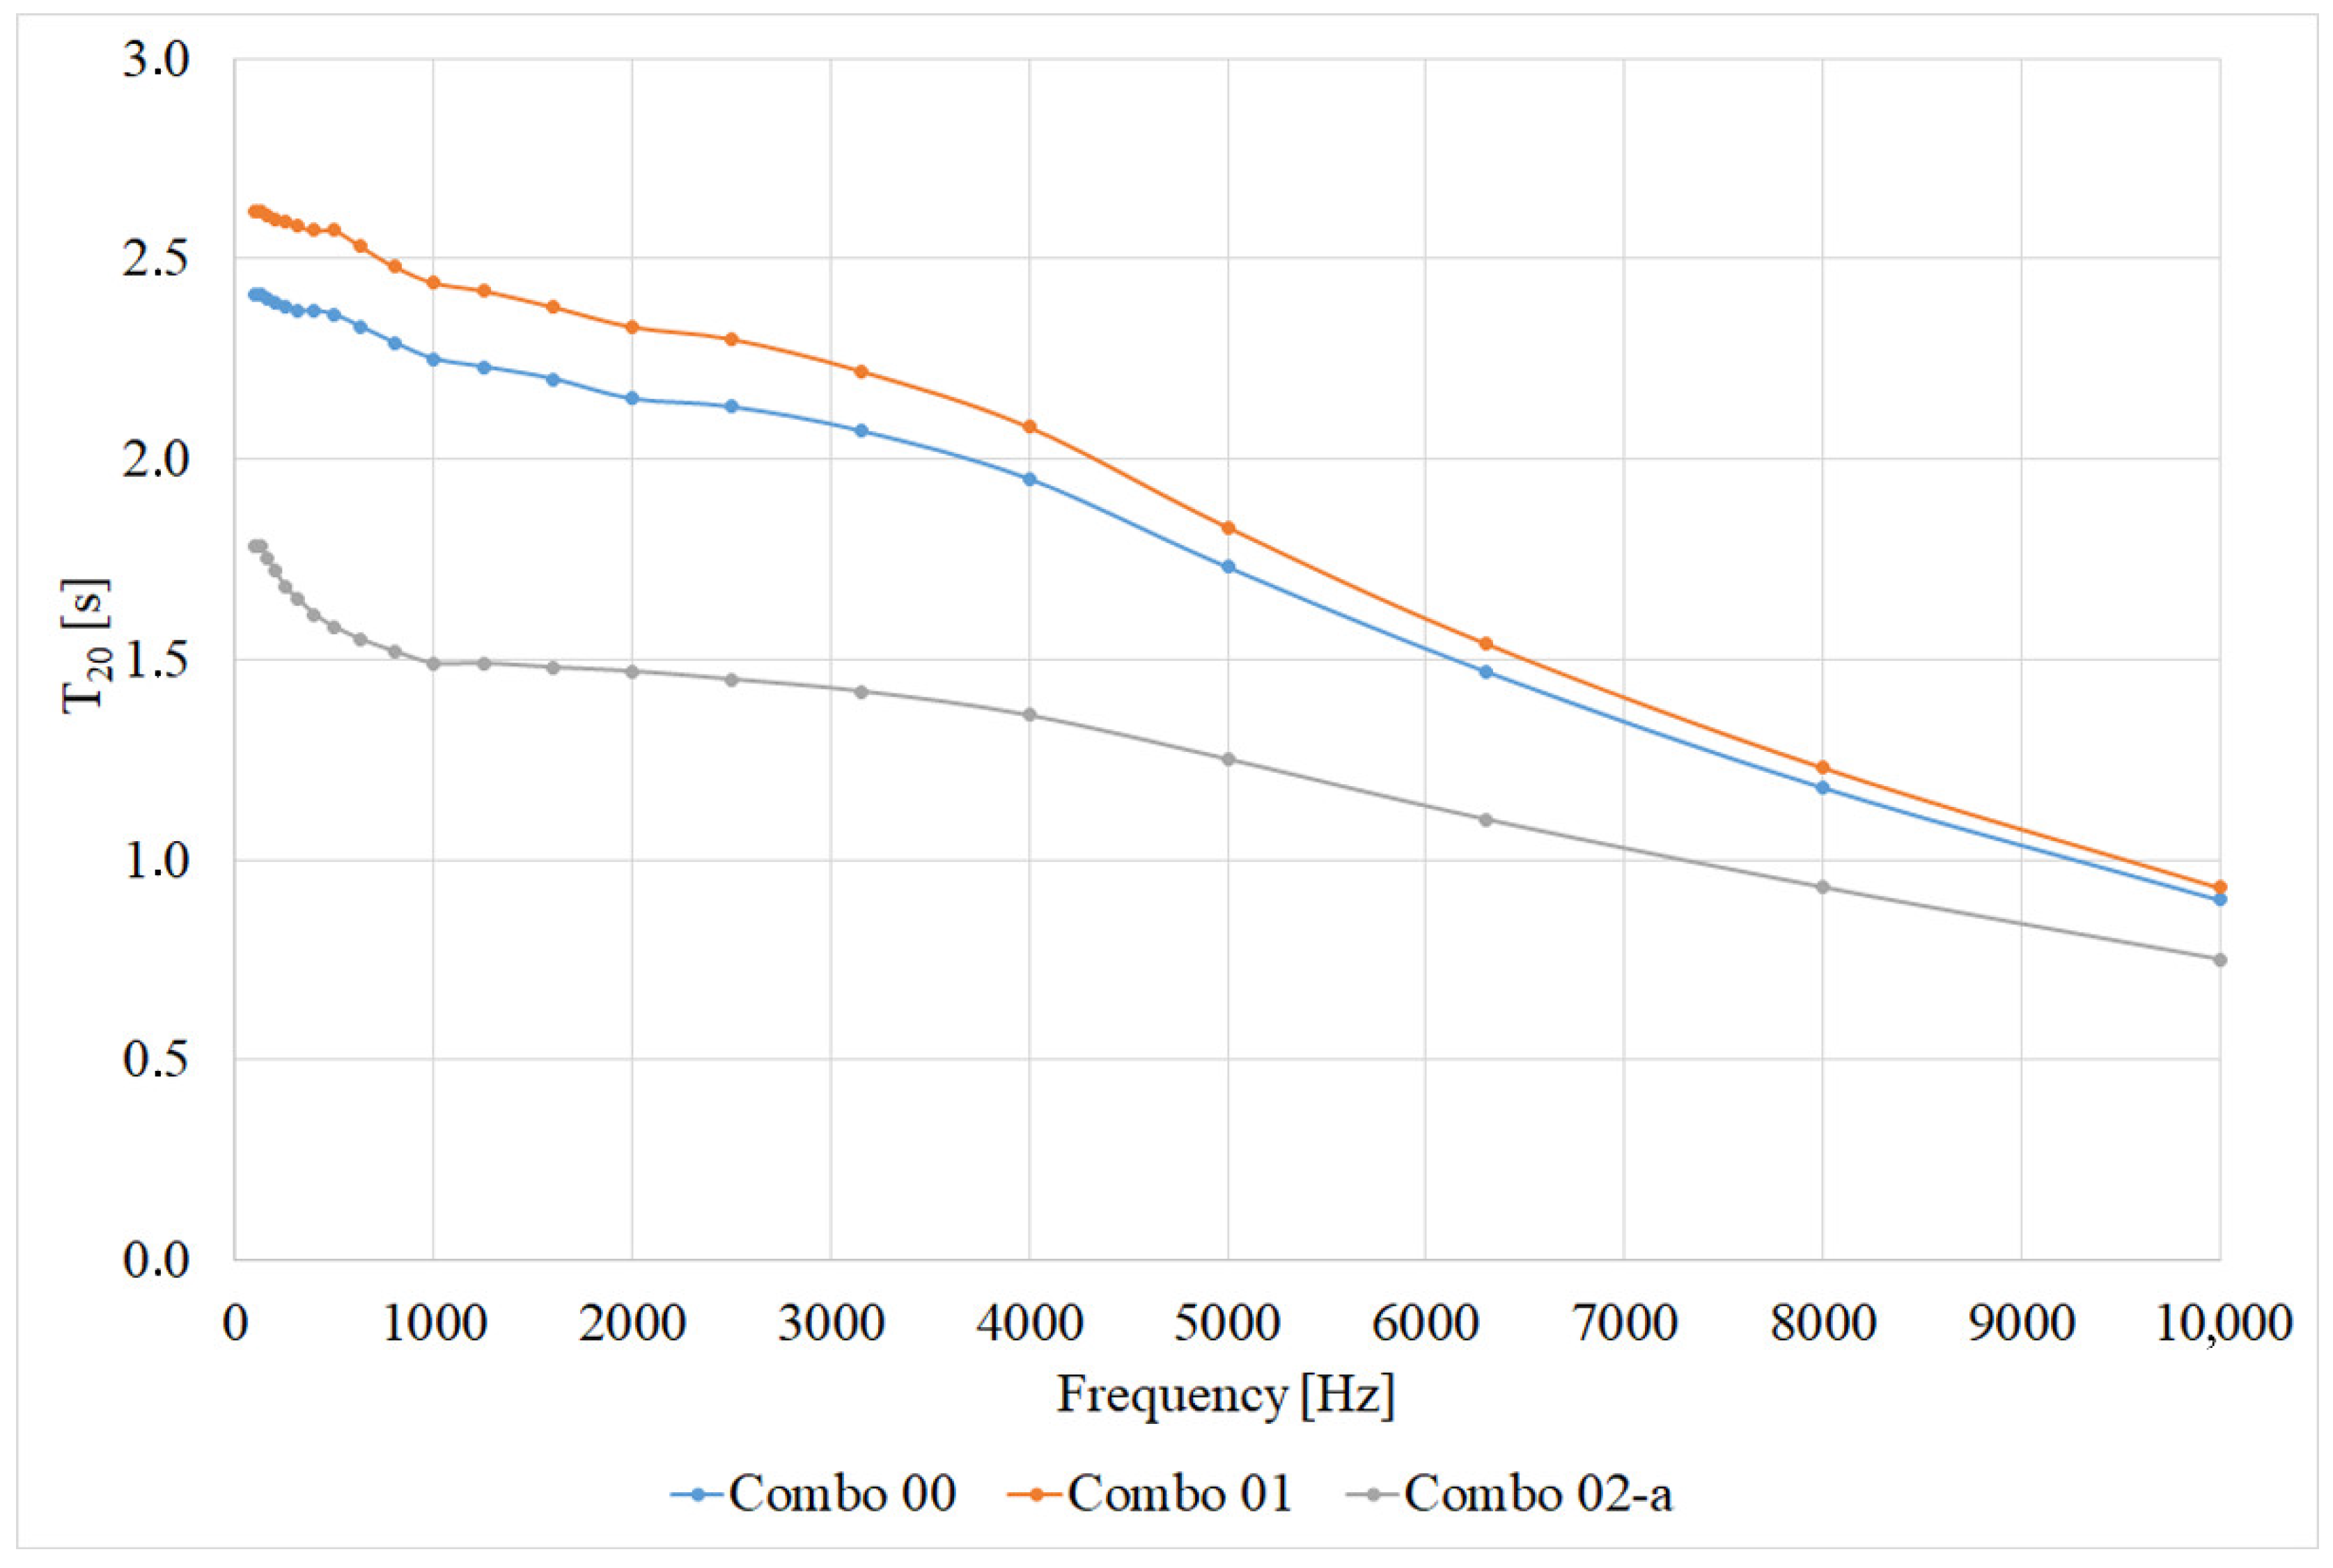
Figure 10 shows the reverberation time T
20 of Combos 00/01/02-a. The graph highlights the clear improvement that can be achieved with the new roof configuration.
The variation of the reverberation due to the presence or absence of the false ceiling and the vertical panels is very wide (Combo 01 and Combo 02-a), while it is low if the configurations differ just for the presence of a wooden roof (Combo 01) or concrete roof (Combo 00). For high frequency values, above 5000 Hz, the difference in T20 between these two last configurations is negligible.
Reducing the volume of the room and using sound-absorbing materials for the roof and walls have important consequences on the reduction of reverberation time, especially at low and middle frequencies. At 500 Hz, the T20 decreases from 2.36 s for Combo 00 to 1.58 s for Combo 02-a. The panel absorption of the walls and ceilings might be the main reason for this. The used sound-absorbing materials present high values of absorption coefficients in the middle range, with the maximum value being around 500 Hz.
4.2.2. Numerical Analyses of Clarity Index C80
C
80 describes the clarity with which a listener receives a spoken message. This parameter evaluates the possibility of clearly perceiving musical notes played in rapid succession, as well as clearly distinguishing notes played simultaneously by one or more instruments, and it is useful mainly for evaluating musical halls. Values of C
80 around 0 dB relate to acoustic environments suitable for the performance of symphonic music, while for opera, it must be between 1 and 4 dB, as shown in
Table 15. The limits for instrumental music are −2 and +2 dB.
Regarding Combos 00 and 01-v/a/b/c, the first remark is that all configurations are suboptimal for opera. The clarity index often has a value less than unity, limiting the use of the hall for these events. Combo 01-c slightly improves performance for symphonic music over all others. For instrumental music, Combo 01 is close to the performance of Combo 00, making up for the disadvantage of having large extra volume. Relative to the suggested limit value of 4 dB, Combo 00 also remains in the optimal range at the highest frequencies. Oppositely, Combos 01-b and 01-a already fall out of the optimal range for all uses at low frequencies.
Combo 02-a has improved C
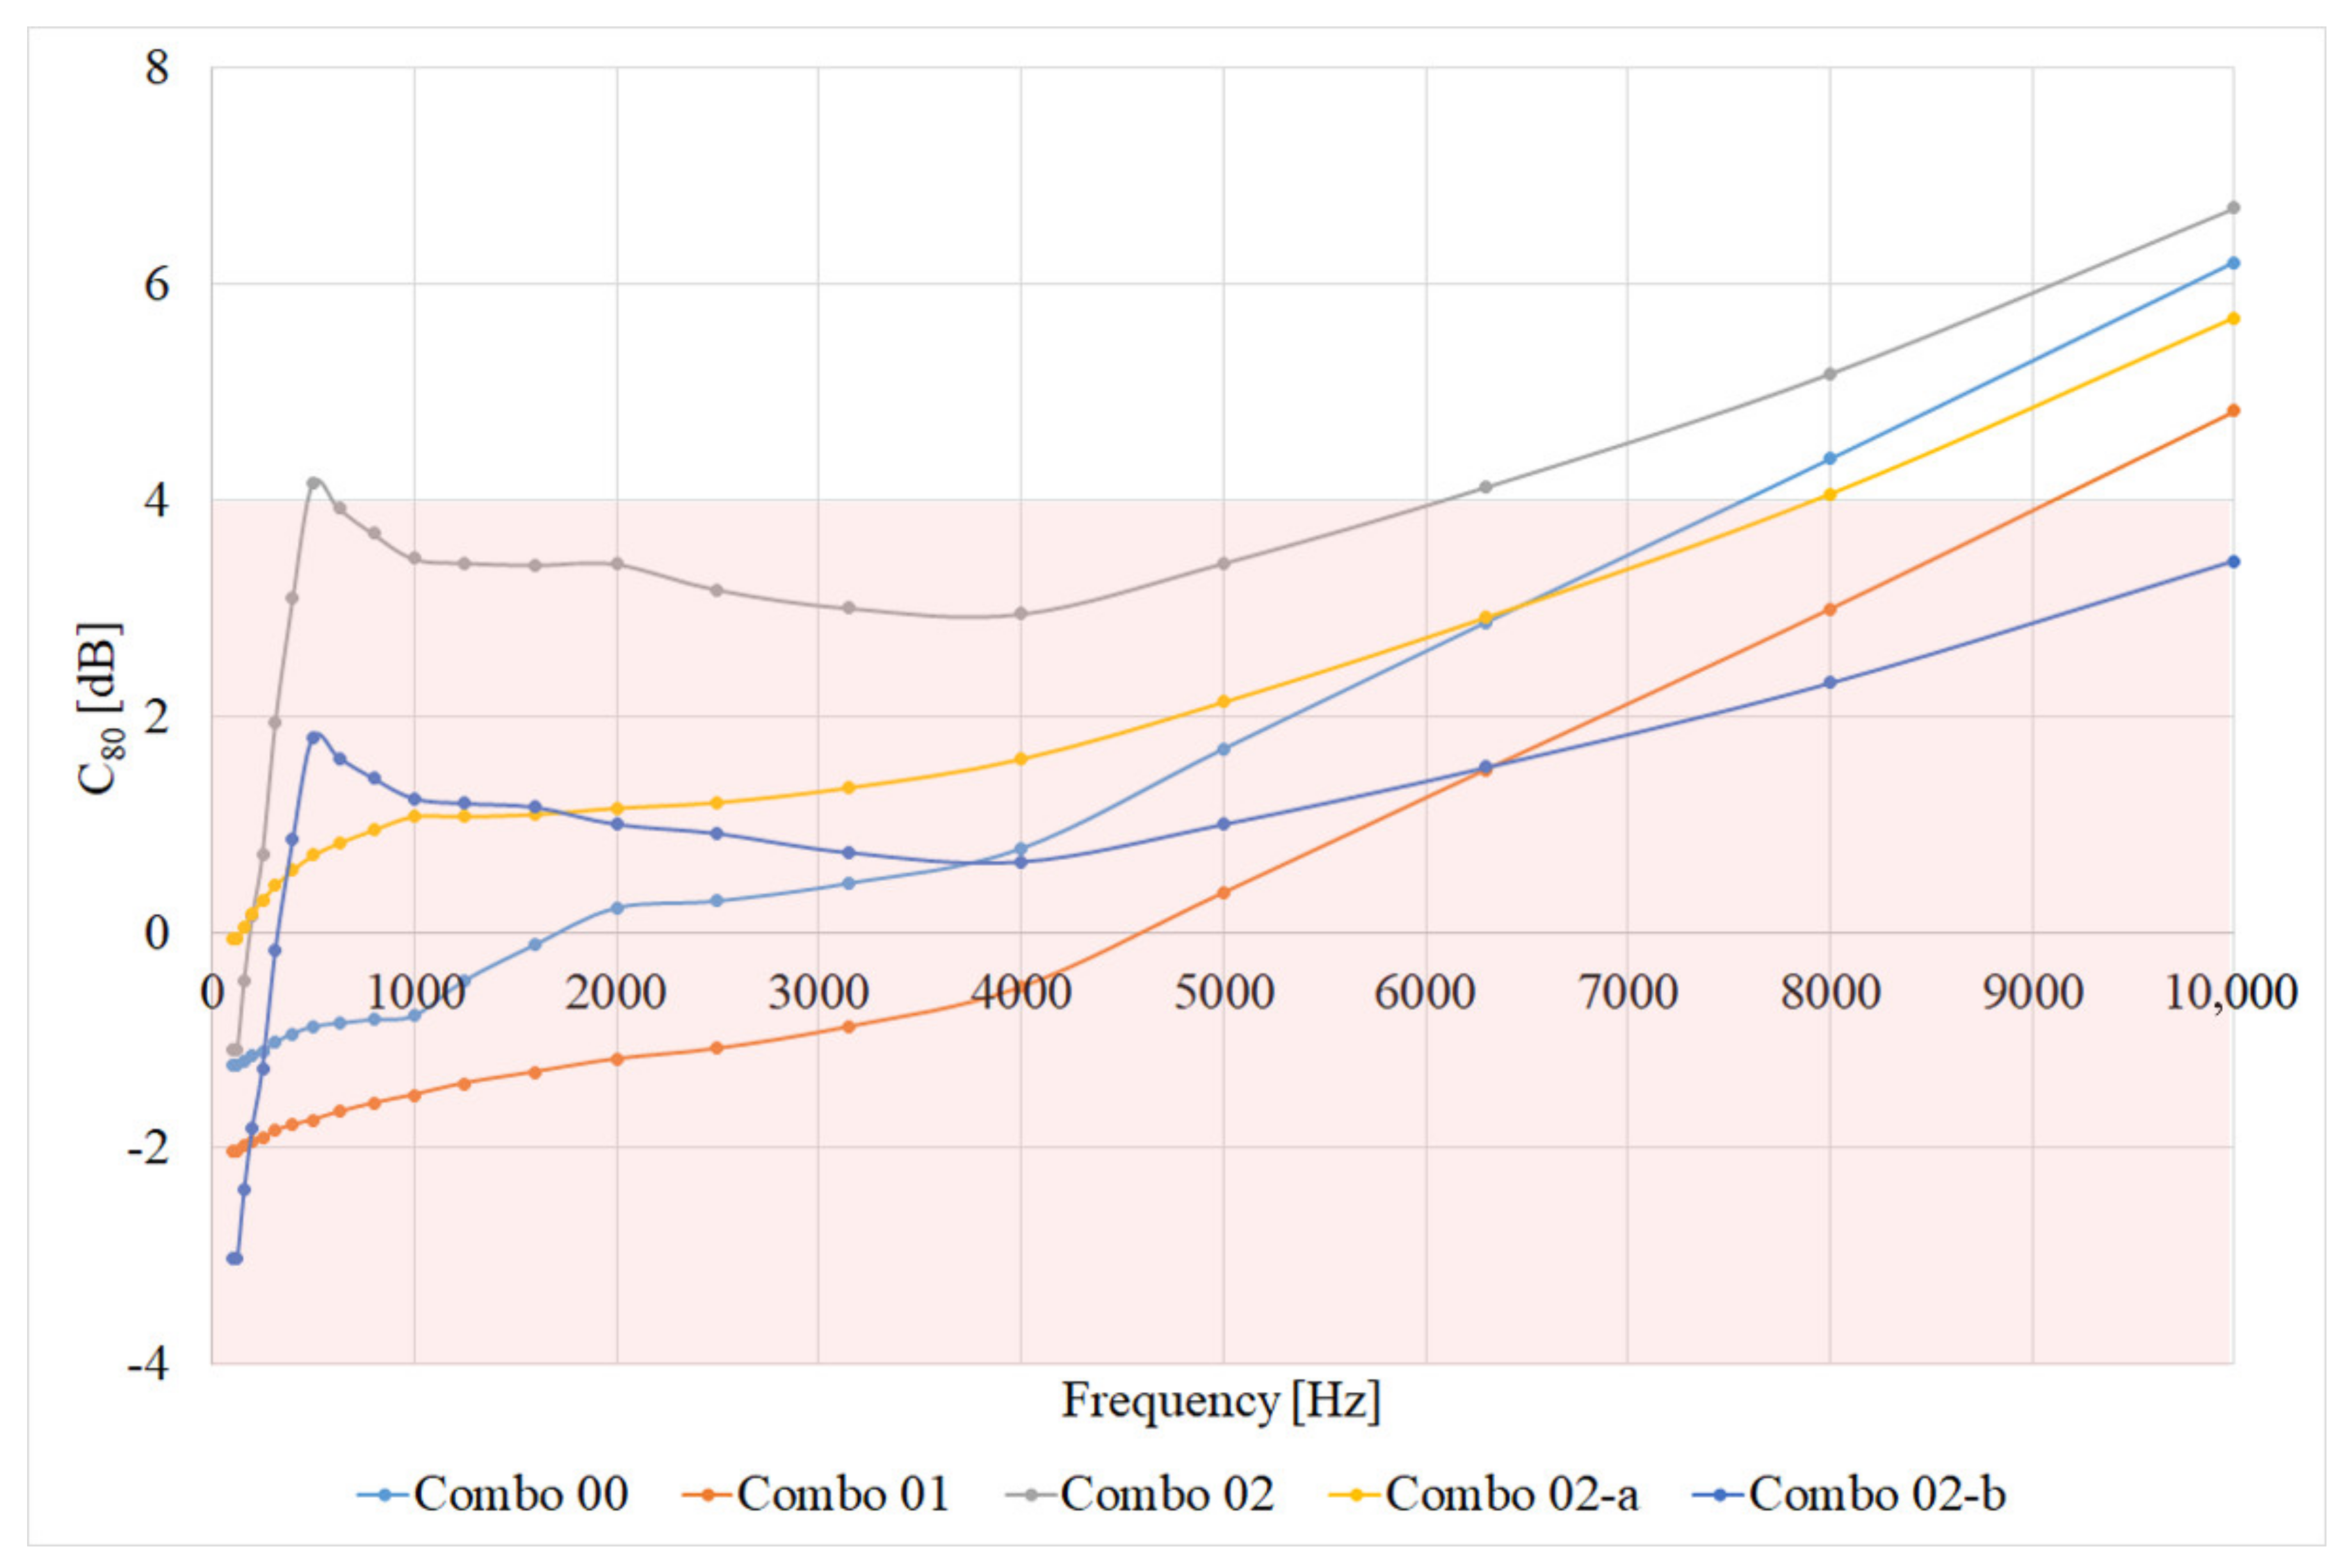
80, allowing the theatre to be used for a wide range of musical genres such as instrumental, symphonic, and opera. This achieves the goal of having a multipurpose theatre serving a small community.
Figure 11 shows that the final Combo 02-a remains within the ideal range (less than 4 dB) up to frequencies of around 8000 Hz.
4.2.3. Numerical Analyses of Speech Transmission Index (STI)
Table 16 shows the Speech Transmission Index (STI), and the quality classes in which it falls.
Regarding Combos 00 and 01-v/a/b/c, the STI values are never lower than 0.42 and never higher than 0.70; therefore neither the worst nor excellent conditions are reached at all points in the room. Combos 01-a and 01-b, which had a non-performing C80, now have a good STI, confirming the difficulty of achieving a configuration that can be simultaneously optimal for different uses. In fact, Combo 01, which had a good C80 value, now presents a lower STI value, with discreet performance.
The STI values of Combo 02-a are never lower than 0.52 and never higher than 0.60; therefore, neither the worst nor excellent conditions are reached at all points in the room, but there is still a slight improvement over Combos 00 and 01. Combo 02-b represents the configuration with no audience, so it is close to the behavior of the room when filled below the maximum capacity. In this case, there is a small improvement in speech intelligibility.
5. Conclusions
This paper presents an experimental acoustic characterization of the Italian Theatre “Cavallino Bianco” located in Galatina, a city in southern Italy, in order to define an acoustic upgrading intervention and the subsequent performance verification.
In particular, the main goal is to present a project of the acoustic requalification of the theatre that can be a representative example of renovation, as it is similar in shape and construction materials to other theatres in the area and was built in the same period.
This study proposed the realization of a wave ceiling and the application of sound-absorbing and reflecting panels on the walls; these operations were carried out. All operations affected the acoustic characterization of the theatre, shown both through on-site measurements made during the main construction phases and numerical simulations.
The first acoustic characterization was conducted both through on-site measurements and numerical analysis with the EASE 4.4 software. Secondly, numerical analyses and on-site measurements were conducted on the realized optimal scenario. In the historical configuration, the hall had a curved roof with a false ceiling made of pressed vegetable fibers (Combo 00), which, due to structural problems, was demolished and rebuilt with a wooden roof without a false ceiling (Combo 01), with a consequent increase in volume and worsening of reverberation time. The third intervention improved the acoustic performance of Combo 01 through the use of a wave ceiling and sound-absorbing and reflecting panels applied to the walls (Combo 02).
A series of design solutions were numerically simulated in EASE software, including an evaluation of the theatre configuration before the current state (referred to as the first survey), numerous scenarios focused on the application of different materials on the walls and the floor, and modeling with or without a false ceiling. On-site measurements were also conducted.
Regarding the reverberation time T20, Combos 00/01 show excessive reverberation times. Draped curtains (Combo 01-a/b/c) can considerably reduce reverberation times to optimal. The values at mid-high frequencies (1000–2000 Hz) are slightly lower than the optimal value for music, but increase verbal understanding.
The clarity index C80 was plotted for all combinations, and the results were evaluated based on different uses of the hall. It is evident that all configurations are suboptimal for opera. Heavy draped curtains (Combo 01-c) slightly improve the performance of symphonic music over all other uses. For instrumental music, Combo 01 is close to the performance of Combo 00, making up for the disadvantage of having large extra volume. Relative to the suggested limit of 4 dB (maximum value for opera), Combo 00 remains in the optimal range also at the highest frequencies. Oppositely, Combos 01-b/a already fall out of the optimal range for all uses at low frequencies.
The STI of all combinations ranges between 0.42 and 0.70, indicating that neither the worst nor excellent conditions are reached at all points of the hall. It is interesting to note that light and medium draped curtains (Combos 01-a/b), which had an unsatisfactory C80, have a good STI, confirming the difficulty of achieving a configuration that can be simultaneously optimal for different uses. In fact, Combo 01, which had a good C80, now presents a lower (though decent) STI.
The final configuration proposed (Combo 02), by reducing the volume of the hall and using sound-absorbing materials, significantly reduces the reverberation time at different frequencies. In addition, the theatre at full capacity, i.e., with chairs and people, has evident improvement of the clarity index, allowing the theatre to be used for a wide range of musical genres such as instrumental, symphonic, and opera. The goal of having a multipurpose theatre serving a small community has been achieved. The values of STI for the final operative configuration are never lower than 0.52 and never higher than 0.60, guaranteeing discrete conditions with a slight improvement over the initial configurations.
Future work will involve experimental validation of the theatre with the presence of the public over a range of intended uses and musical genres.


 ,
, 


