1. Introduction
Over a third of the energy use and associated greenhouse gas emissions on a global scale comes from the operation of buildings [
1]. Reducing the energy demand of the building sector is important for many reasons, e.g., as a means to mitigate climate change, to improve energy security [
2], to replace fossil fuels, and to reduce costs for building occupiers [
3]. To achieve these reductions, governments have enacted energy standards and building codes as well as building design guidelines that aim to reduce net delivered energy to buildings.
A large body of research exists on the potential for energy savings in the residential building stock. This literature focusses on thermal characteristics and consequent space heating demand, e.g., [
4], as well as changing the behavioral patterns of occupiers [
4,
5,
6]. Several studies focus on the city scale and the relationship between energy use in the residential building stock and urban form. Denser, more compact areas are found to be more energy efficient than more dispersed ones [
7,
8,
9,
10,
11], and housing typology and the shape of the building is found to impact on thermal performance [
12,
13]. Some of these studies have revealed that also certain building characteristics affect the energy demand, such as the share of passive areas (the share of the floor area in a building that are within 6 m from a façade and hence will have less demand for artificial lighting) [
14,
15,
16].
Also important for domestic energy use is the size of the building. In the US, Wilson and Boehland [
17] compared single-family houses of different sizes and found that smaller houses constructed according to only moderate energy performance standards use significantly less energy for heating and cooling than larger houses constructed according to very high energy performance standards. Similarly, in New Zealand, Viggers et al. [
3] found that the heating required to maintain constant temperatures in newer and larger detached dwellings was equivalent to that required to heat older and smaller detached dwellings.
As for most countries, Norwegian building codes [
18] as well as international sustainability assessment methods such as BREEAM NOR [
19] measure energy performance of dwellings by normalizing energy use to floor area. This measure has been criticized in literature [
20,
21]. One reason for the critique is that this measure fails to account for building occupancy, since an occupied building is likely to have a higher area-normalized energy use than an unoccupied building [
21,
22]. A second issue of critique is that energy use does not linearly increase with floor area [
20,
21,
22]. While the end use of energy increases with floor area, the area-normalized energy use decreases as the floor area increase.
Generally, households with higher income can afford more floor area and more electricity consuming appliances that in addition are used more extensively [
23]. Focusing on energy use per capita rather than per floor area, studies in Sweden found that the buildings with the highest per capita energy demand were located in high-income city centers as opposed to low-income suburbs [
20].
Measuring energy performance of dwellings by normalizing energy use to floor area can be misleading if the aim is to reduce overall energy demand. As can be seen in many countries, the reductions in energy demand in residential buildings “has been offset by an increase in floor area per capita” [
20] (p. 2). Despite reductions in energy demand in the domestic building stock, Palmer [
24] found that per capita energy use for heating in Australia has remained constant over 50 years, which can be explained by a combination of factors including reduced household sizes and larger dwellings. During recent decades there has been a significant increase in average floor area per person in many countries such as the UK [
25], Australia, Canada, New Zealand, and the US [
3]. This is also the case in Norway, where the average size of households (by number of persons) decreased from 2.66 in 1980 to 2.16 in 2019 [
26] and the average dwelling area per person increased from 36 m
2 in 1980 to 58 m
2 in 2013 [
27].
Due to the variance in energy use of different dwelling types, and in dwellings size and size of households, the overall energy demand is likely divergent when measured per person compared to per floor area. By examining population density in relation to dwelling types and dwelling sizes on city scale, this paper aims to reveal patterns of dwelling area per person across different dwelling types. Such patterns can provide the basis for more realistic modelling of per capita energy use than the current methods focusing on performance per floor area only. The research question is as follows: To what extent are there systematic differences of floor area per person across dwelling types, what are the implications of these differences for energy use per person, and what are the implications for the total energy and environmental performance of different layouts on block, neighborhood, and city scale?
2. Materials and Methods
We mapped spaciousness of living (in terms of dwelling area per person) and areas with specific dwelling types (detached dwellings, dwellings in multi-dwelling buildings, etc.) in the cities Oslo and Trondheim and used open access data that can be linked geographically to national grid cells in GIS. In the following, the cases examined, the data collected, the data preparation and coding, and the method of analyses are described in more detail.
2.1. Cases Examined
The cases examined in this study are the two Norwegian cities Oslo and Trondheim. Oslo is the capital of Norway and has a population of 694,086 inhabitants, 1628 inhabitants per km
2 and an average of 1.97 inhabitants per dwelling. The population is expected to increase 15% by 2050. Trondheim is by population the third largest city in Norway, has 205,332 inhabitants, 414 inhabitants per km
2 and an average of 2.01 inhabitants per dwelling. The population is expected to increase 16% by 2050 [
28]. Both Trondheim and Oslo have a coastal climate with mild winters, cool summers, and frequent precipitation most months of the year. Due to geographical conditions such as latitude, the climate of Oslo and Trondheim are somewhat different. Oslo is hotter in summer, but also somewhat colder in winter [
29].
2.2. Data Sources
Descriptive statistics for Norway are available as gridded data aggregated at resolutions ranging from 500 km to 250 m [
30]. Due to confidentiality constraints, the register of the Norwegian population (DSF) is usually not publicly available at address or building level but can be found as aggregated data at a resolution of 250-m grid cells provided by Statistics Norway. The DSF register does not include coordinates, but is linked to GAB, the official address register in Norway, making it possible to identify the population by coordinates [
31]. In the gridded data set, grid cells that originally had 1 to 9 residents were assigned the number 5 by Statistics Norway to anonymize the data [
31].
Statistics on dwellings are also available as gridded data provided by Statistics Norway. These statistics are based on several sources including the cadaster, population and dwelling counts and the DSF register. Average gross internal area (GIA) and number of dwellings within different dwelling categories is available for each grid cell. Dwellings are categorized as (1) detached houses (dwe_det), (2) houses with two dwellings (dwe_2dw), (3) row houses, linked houses, and houses with 3–4 dwellings (dwe_row), (4) dwellings in multi-dwelling buildings (dwe_mult), (5) dwellings in residences for communities (dwe_com), and (6) dwellings in other buildings (dwe_oth) [
32]. Detached houses are in this study used to describe stand-alone houses with only one household.
Total net energy requirements are defined in the Norwegian building codes, TEK17 § 14-2 [
18], while data on specific energy use, reported as national average in kWh per m
2 GIA per year for different dwelling categories, are provided by Statistics Norway [
33]. The national averages are based on surveys where the households report on procured amount of energy, and include electricity, oil, and kerosene, as well as wood, coal, and coke.
2.3. Data Preparation
The data on population and dwellings are aggregated at 250-m resolution grid cells (n = 2205 in Oslo and n = 1832 in Trondheim). In this study, grid cells with 5 residents were omitted because of the potential bias caused by the above-mentioned anonymization method used by Statistics Norway (n = 2026 in Oslo, n = 1191 in Trondheim). For each grid cell, residents per dwelling (number of persons per household) was calculated based on population count and dwelling count. Gross internal area (GIA) per person was then calculated based on average GIA per grid cell and residents per dwelling.
The calculations in this study, which are based on average values within the 250 m × 250 m grid cells, can have caused dispersed average values in calculations of residents per dwelling and dwelling area per person. This is particularly the case for the grid cells containing multiple dwelling types, while for homogenous areas (with all dwellings belonging to the same dwelling type, for instance an area with only detached houses) there will be lesser variance within the grid cells. In this study we have therefore primarily examined grid cells that are homogenous regarding dwelling types. These were identified as cells where all (100%) of the dwellings belonged to the same type. Grid cells that were very heterogenous regarding dwelling types were also distinguished (dwe_diff), identified by including at least three different dwelling types where no type had a larger share than 50%.
For each of the dwelling types, mean and standard deviation for dwelling area per person and for energy use per person per dwelling type were calculated. For these calculations the dwelling types (2) houses with two dwellings (dwe_2dw), (5) dwellings in residences for communities (dwe_com), and (6) dwellings in other buildings (dwe_oth) were omitted due to low numbers of homogenous grid cells and insufficient reporting on energy use for these types.
2.4. Data Analysis and Visualization
QGIS 3.4.5 with GRASS 7.6.0 [
34] was used for data collection, calculations, analyses, and map visualization of results for Trondheim and Oslo. The maps were colored in equal integrals based on mean values per grid cell for area (m
2) per dwelling, numbers of residents, and dwelling area per person respectively. Microsoft excel was used for additional data management and for extraction of graphs with results.
3. Results
The results are first presented by describing the general spatial patterns of mean dwelling area, residents per dwelling and dwelling area per person for the two cities. Findings specific for homogenous grid cells are then reported. Then, findings regarding floor area per person for the different dwelling types and calculations on specific energy use as well as energy requirements per person are presented.
3.1. Spatial Patterns of Dwelling Area
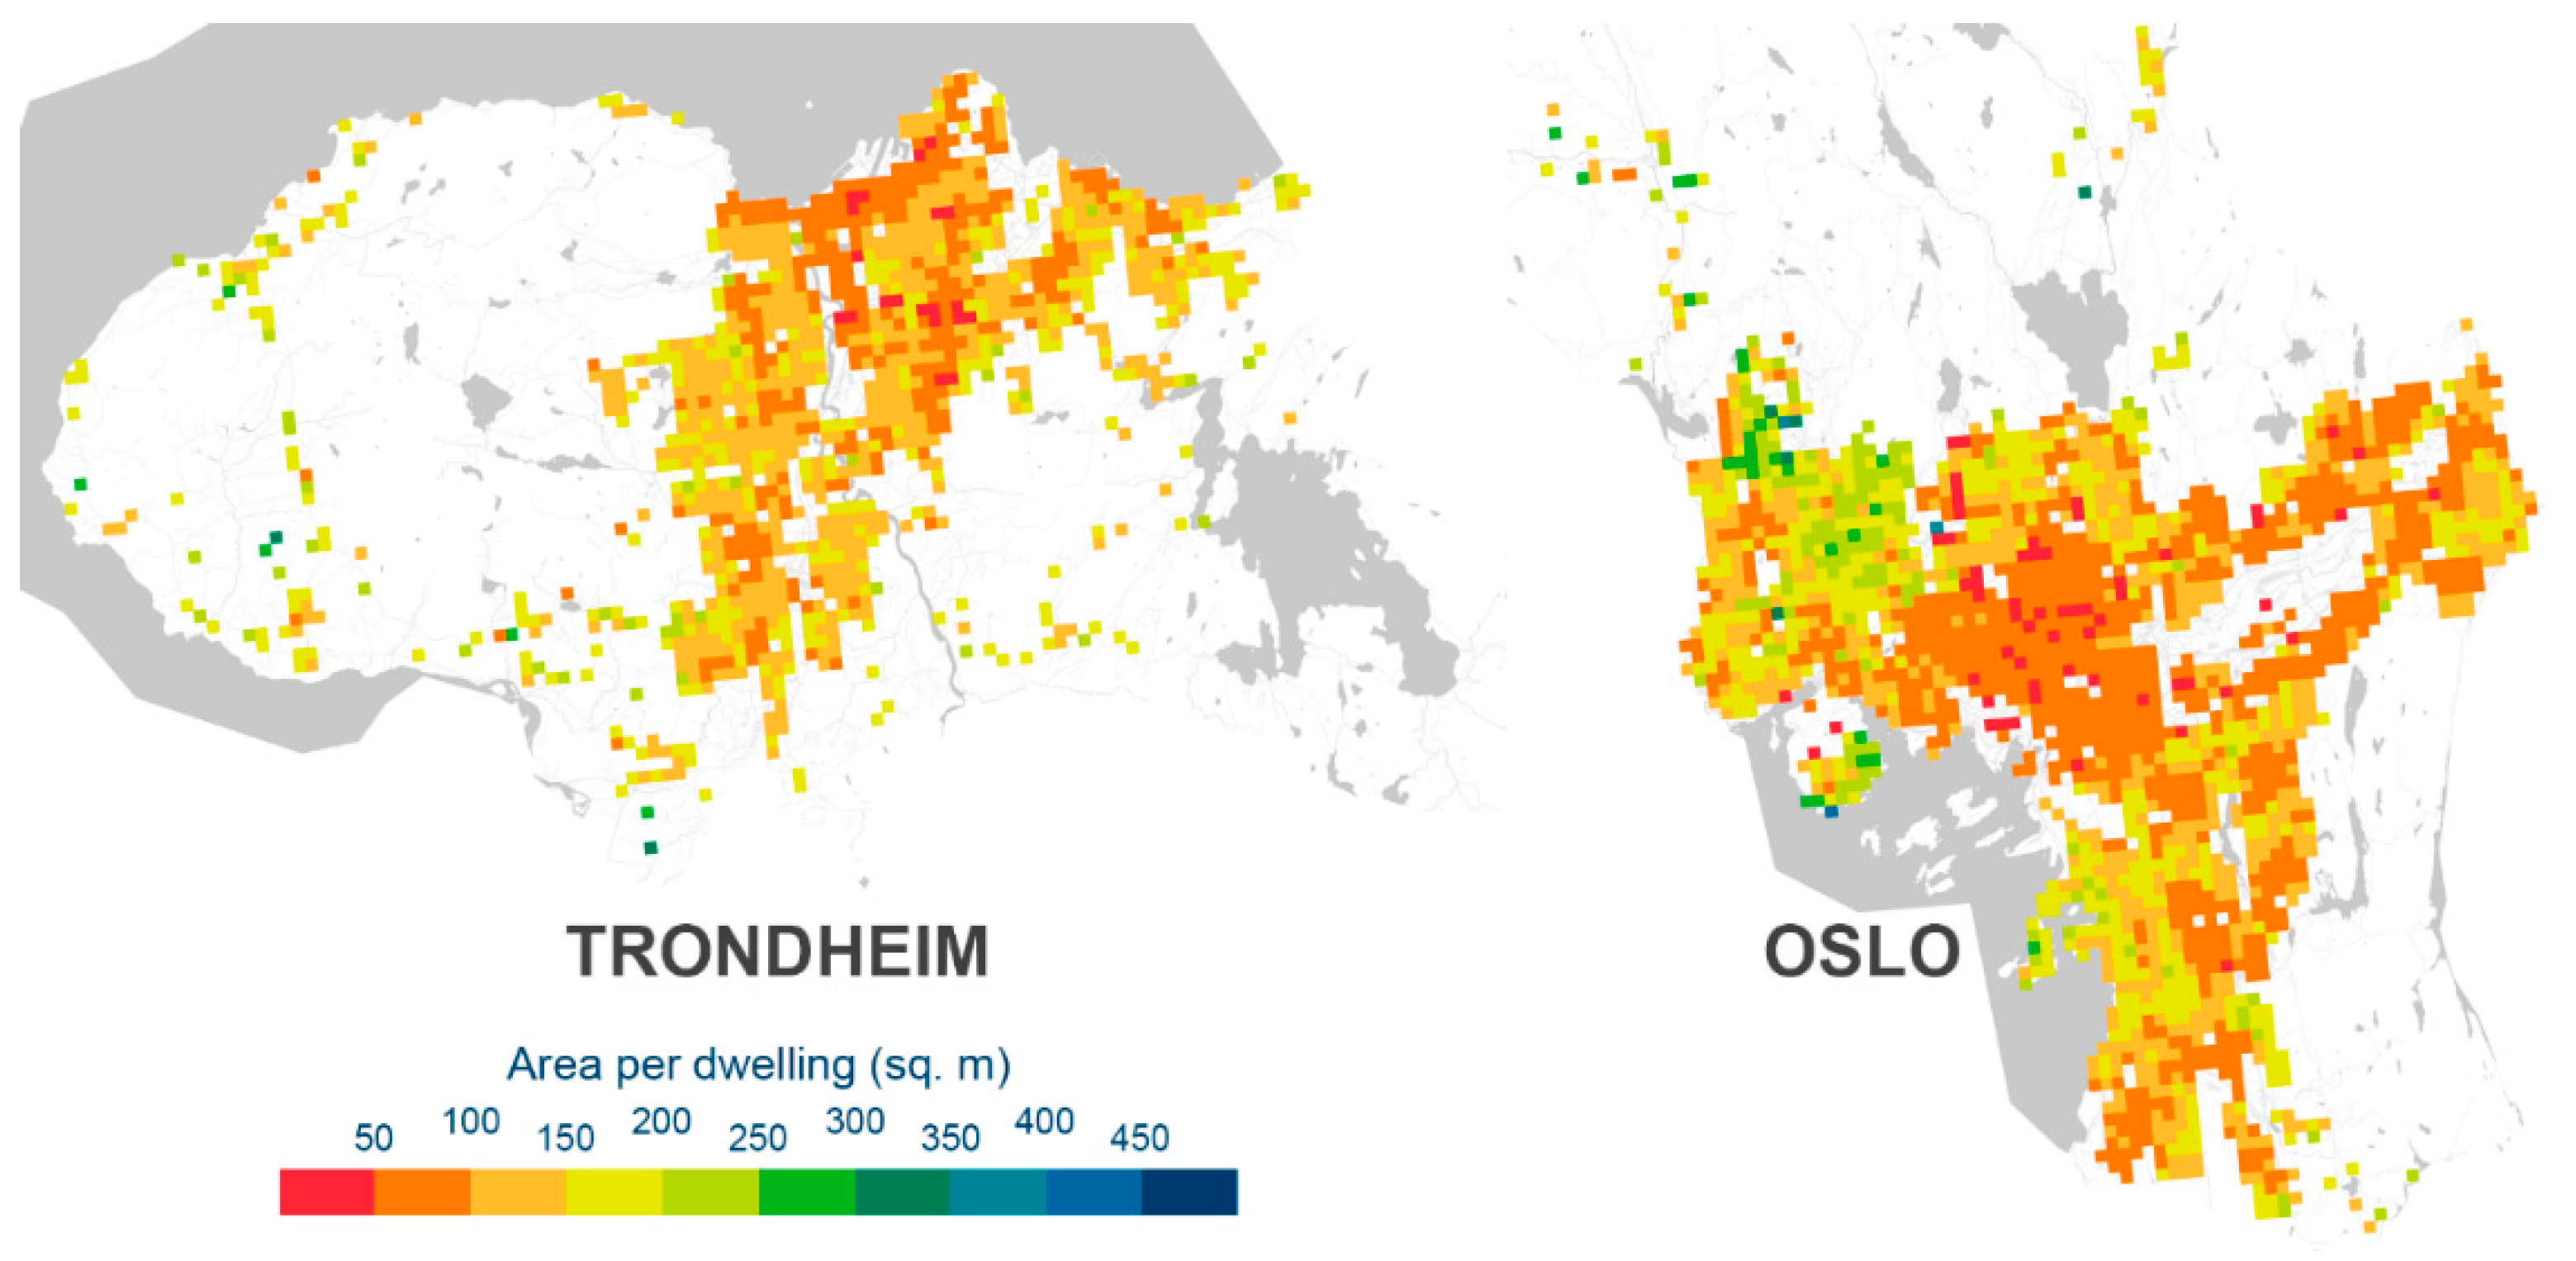
Figure 1 shows the mean area per dwelling per grid cell in
Figure 1. In central Oslo, few grid cells have an average dwelling size larger than 100 m
2. Some areas stand out with a significantly higher average size, such as Bygdøy (up to 439 m
2), Ullern, Rød, and Holmenkollen to the west (with the highest value of 367 m
2) and Nordstrand to the south (highest value 268 m
2). In Trondheim, the mean area per dwelling is less clearly divided into separate uniform areas than in Oslo, but in the western part of the historic center (including Ila), the area Møllenberg to the east and Elgeseter/Tempe to the south, the average dwelling size is less than 100 m
2 for all grid cells, and in some cases less than 50 m
2. The areas Berg and Moholt, which are dominated by student housing, stand out with a low area per dwelling (26–35 m
2). Generally, mean areas per dwelling increase with distance from the city center, in areas such as Byneset (at the west side of the peninsula) (up to 321 m
2), Kattem to the south (247 m
2 at the highest), and Bratsberg to the southeast (242 m
2 at the highest) (
Figure 1).
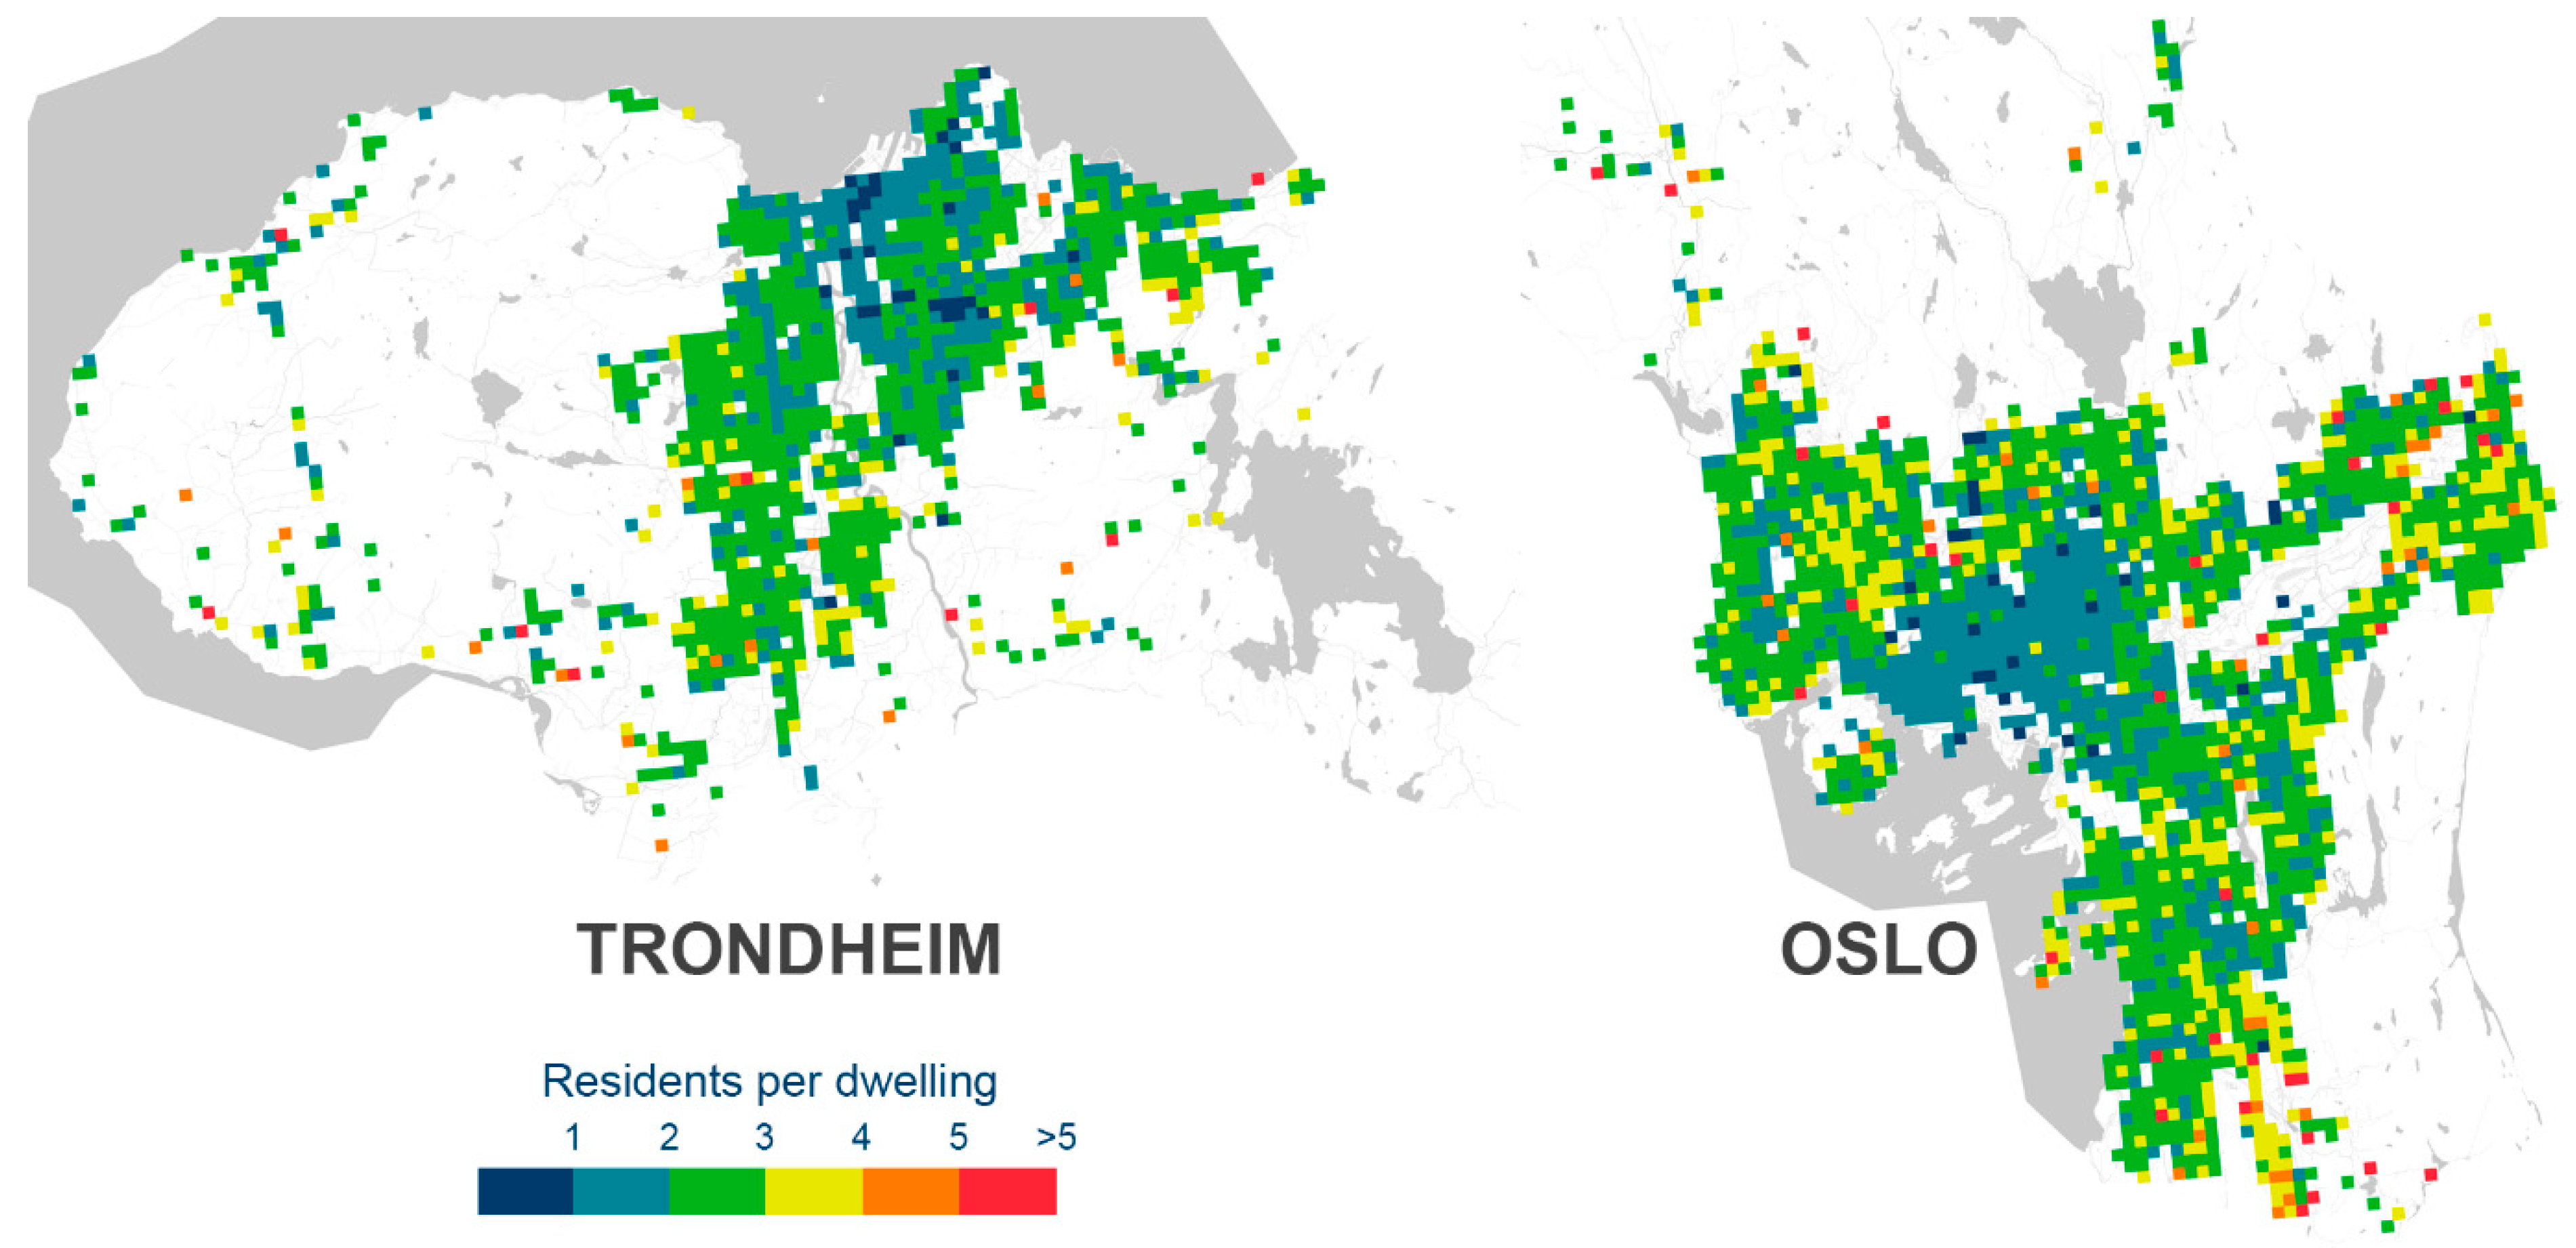
Both in Oslo and Trondheim, dwellings in the city center are, with few exceptions, smaller than 100 m
2 (in some cases also less than 50 m
2) on average and at the same time have low numbers of residents per dwelling (
Figure 2). The maps show clear patterns of low resident counts in central areas in both cities, while other areas are more diverse. For Trondheim, the student housing areas Berg and Moholt can be distinguished with low resident counts (in most cases 1 resident per dwelling).
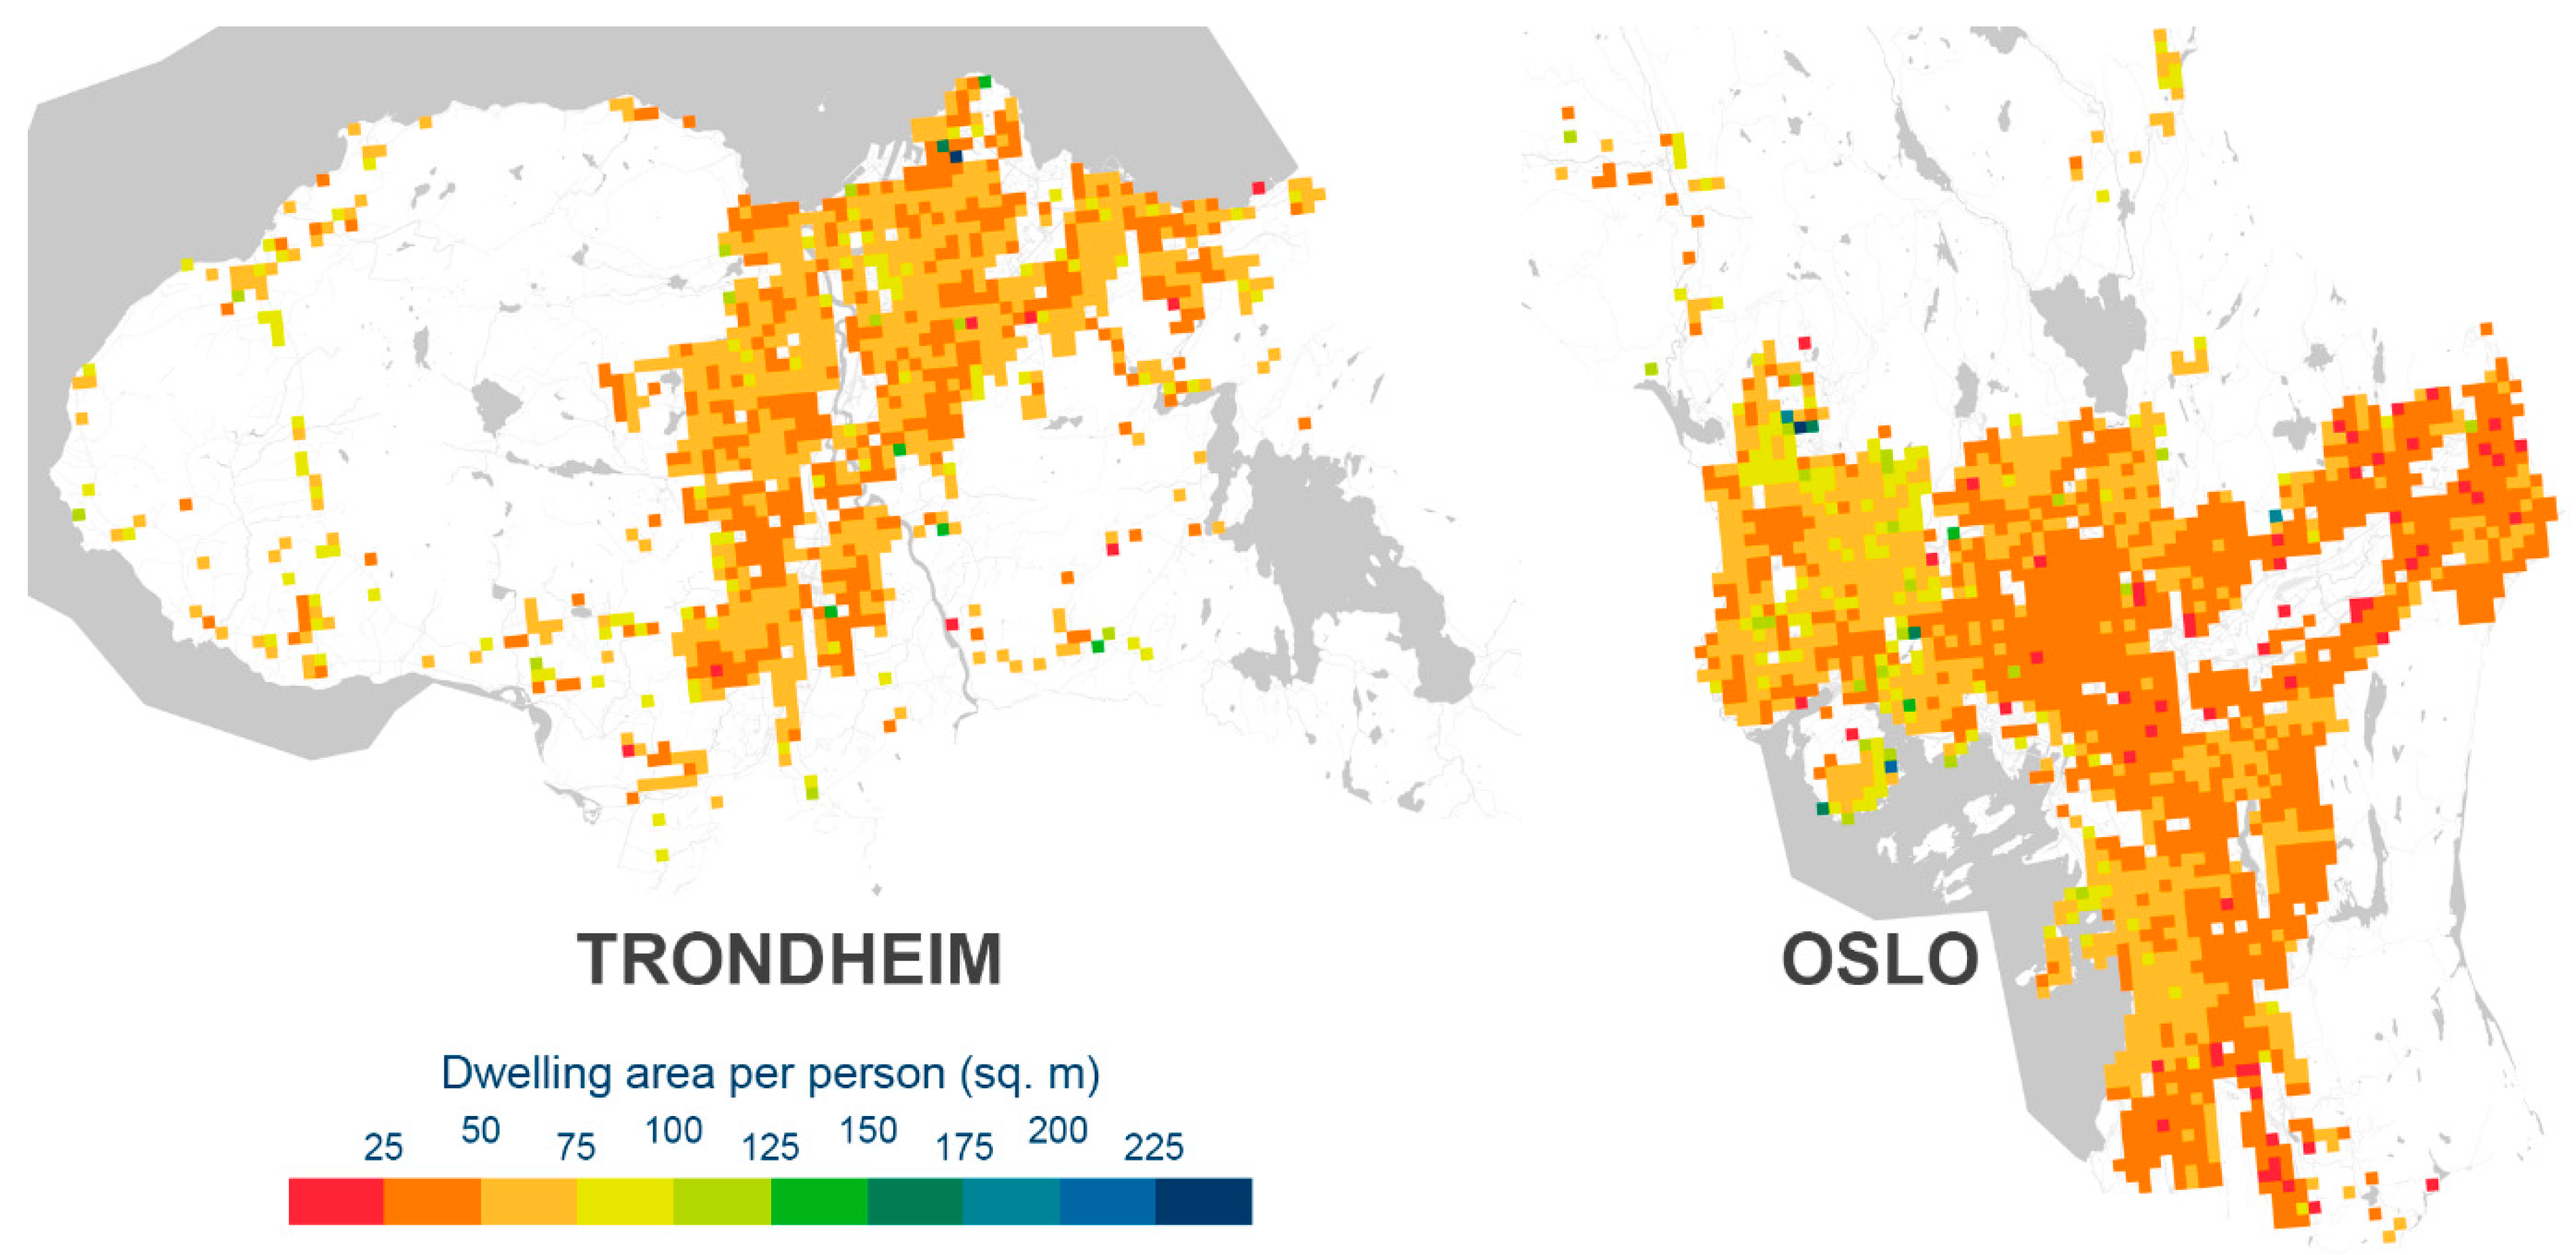
The maps in
Figure 3 show dwelling area per person. Due to the combination of few residents per dwelling but at the same time relatively small dwellings, the dwelling area per person in central Oslo is typically less than 50 m
2. The peninsula Bygdøy to the west and the areas Ullern, Rød, and Holmenkollen to the west and northwest and Nordstrand towards the southeast stand out with a high dwelling area per person. In Trondheim, the central area is not distinguishable from other areas regarding dwelling area per person.
3.2. Spatial Patterns of Dwelling Types
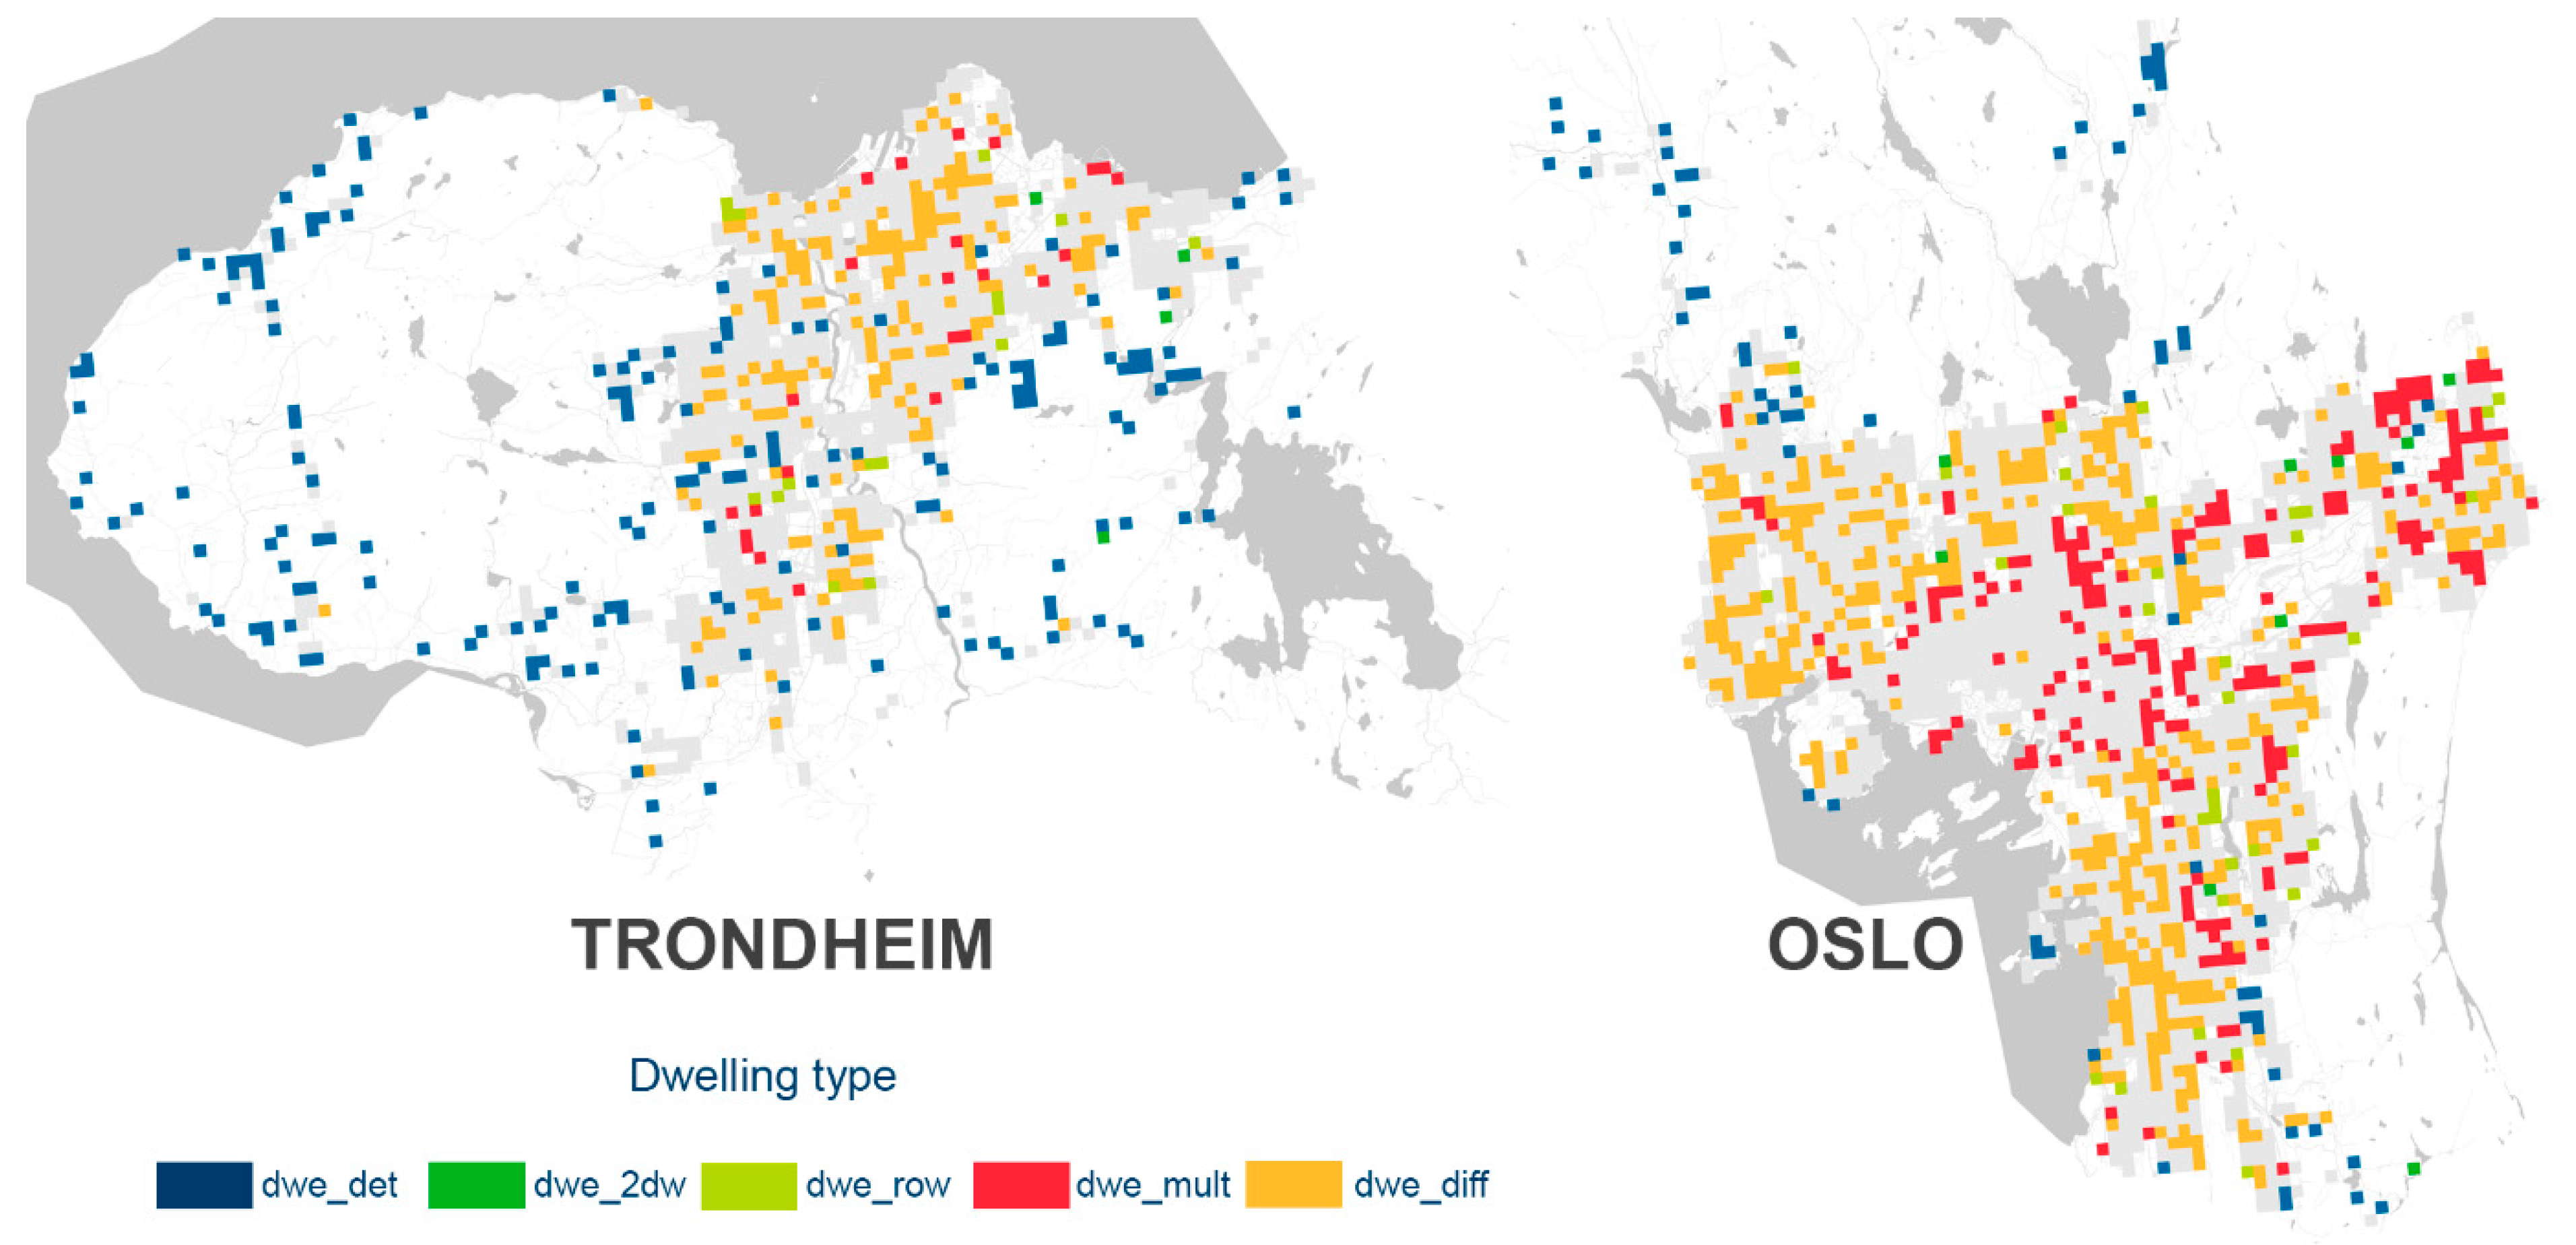
When comparing the location of different dwelling types, there are significant differences between the cities (
Figure 4). Generally, Trondheim has a high share of homogenous areas (100% of grid cells belonging to the same dwelling type) with detached dwellings (
n = 177, 14.9% of the grid cells), while for Oslo there is a higher share of homogenous multi-dwelling areas (
n = 215, 10.6% of grid cells). In comparison, the share of homogenous grid cells with detached dwellings in Oslo is 3.4%, while the share of homogenous multi-dwelling grid cells in Trondheim is 2%. Regarding the share of grid cells containing multiple dwelling types (dwe_diff), this is also higher in Oslo than in Trondheim (22.2% and 15.8%, respectively). Row houses (dwe_row) are represented by 1.7% in Oslo and 1.3% in Trondheim, while the share of houses with two dwellings (dwe_2dw) is also low in both cases, 0.4% in Oslo and 0.3% in Trondheim.
In both cases, as expected, homogenous grid cells with detached houses are found in the areas farthest away from the city center. The diversity type (dwe_diff) is found in a zone outside the central area in Oslo, while a clear pattern for this type is not found in Trondheim.
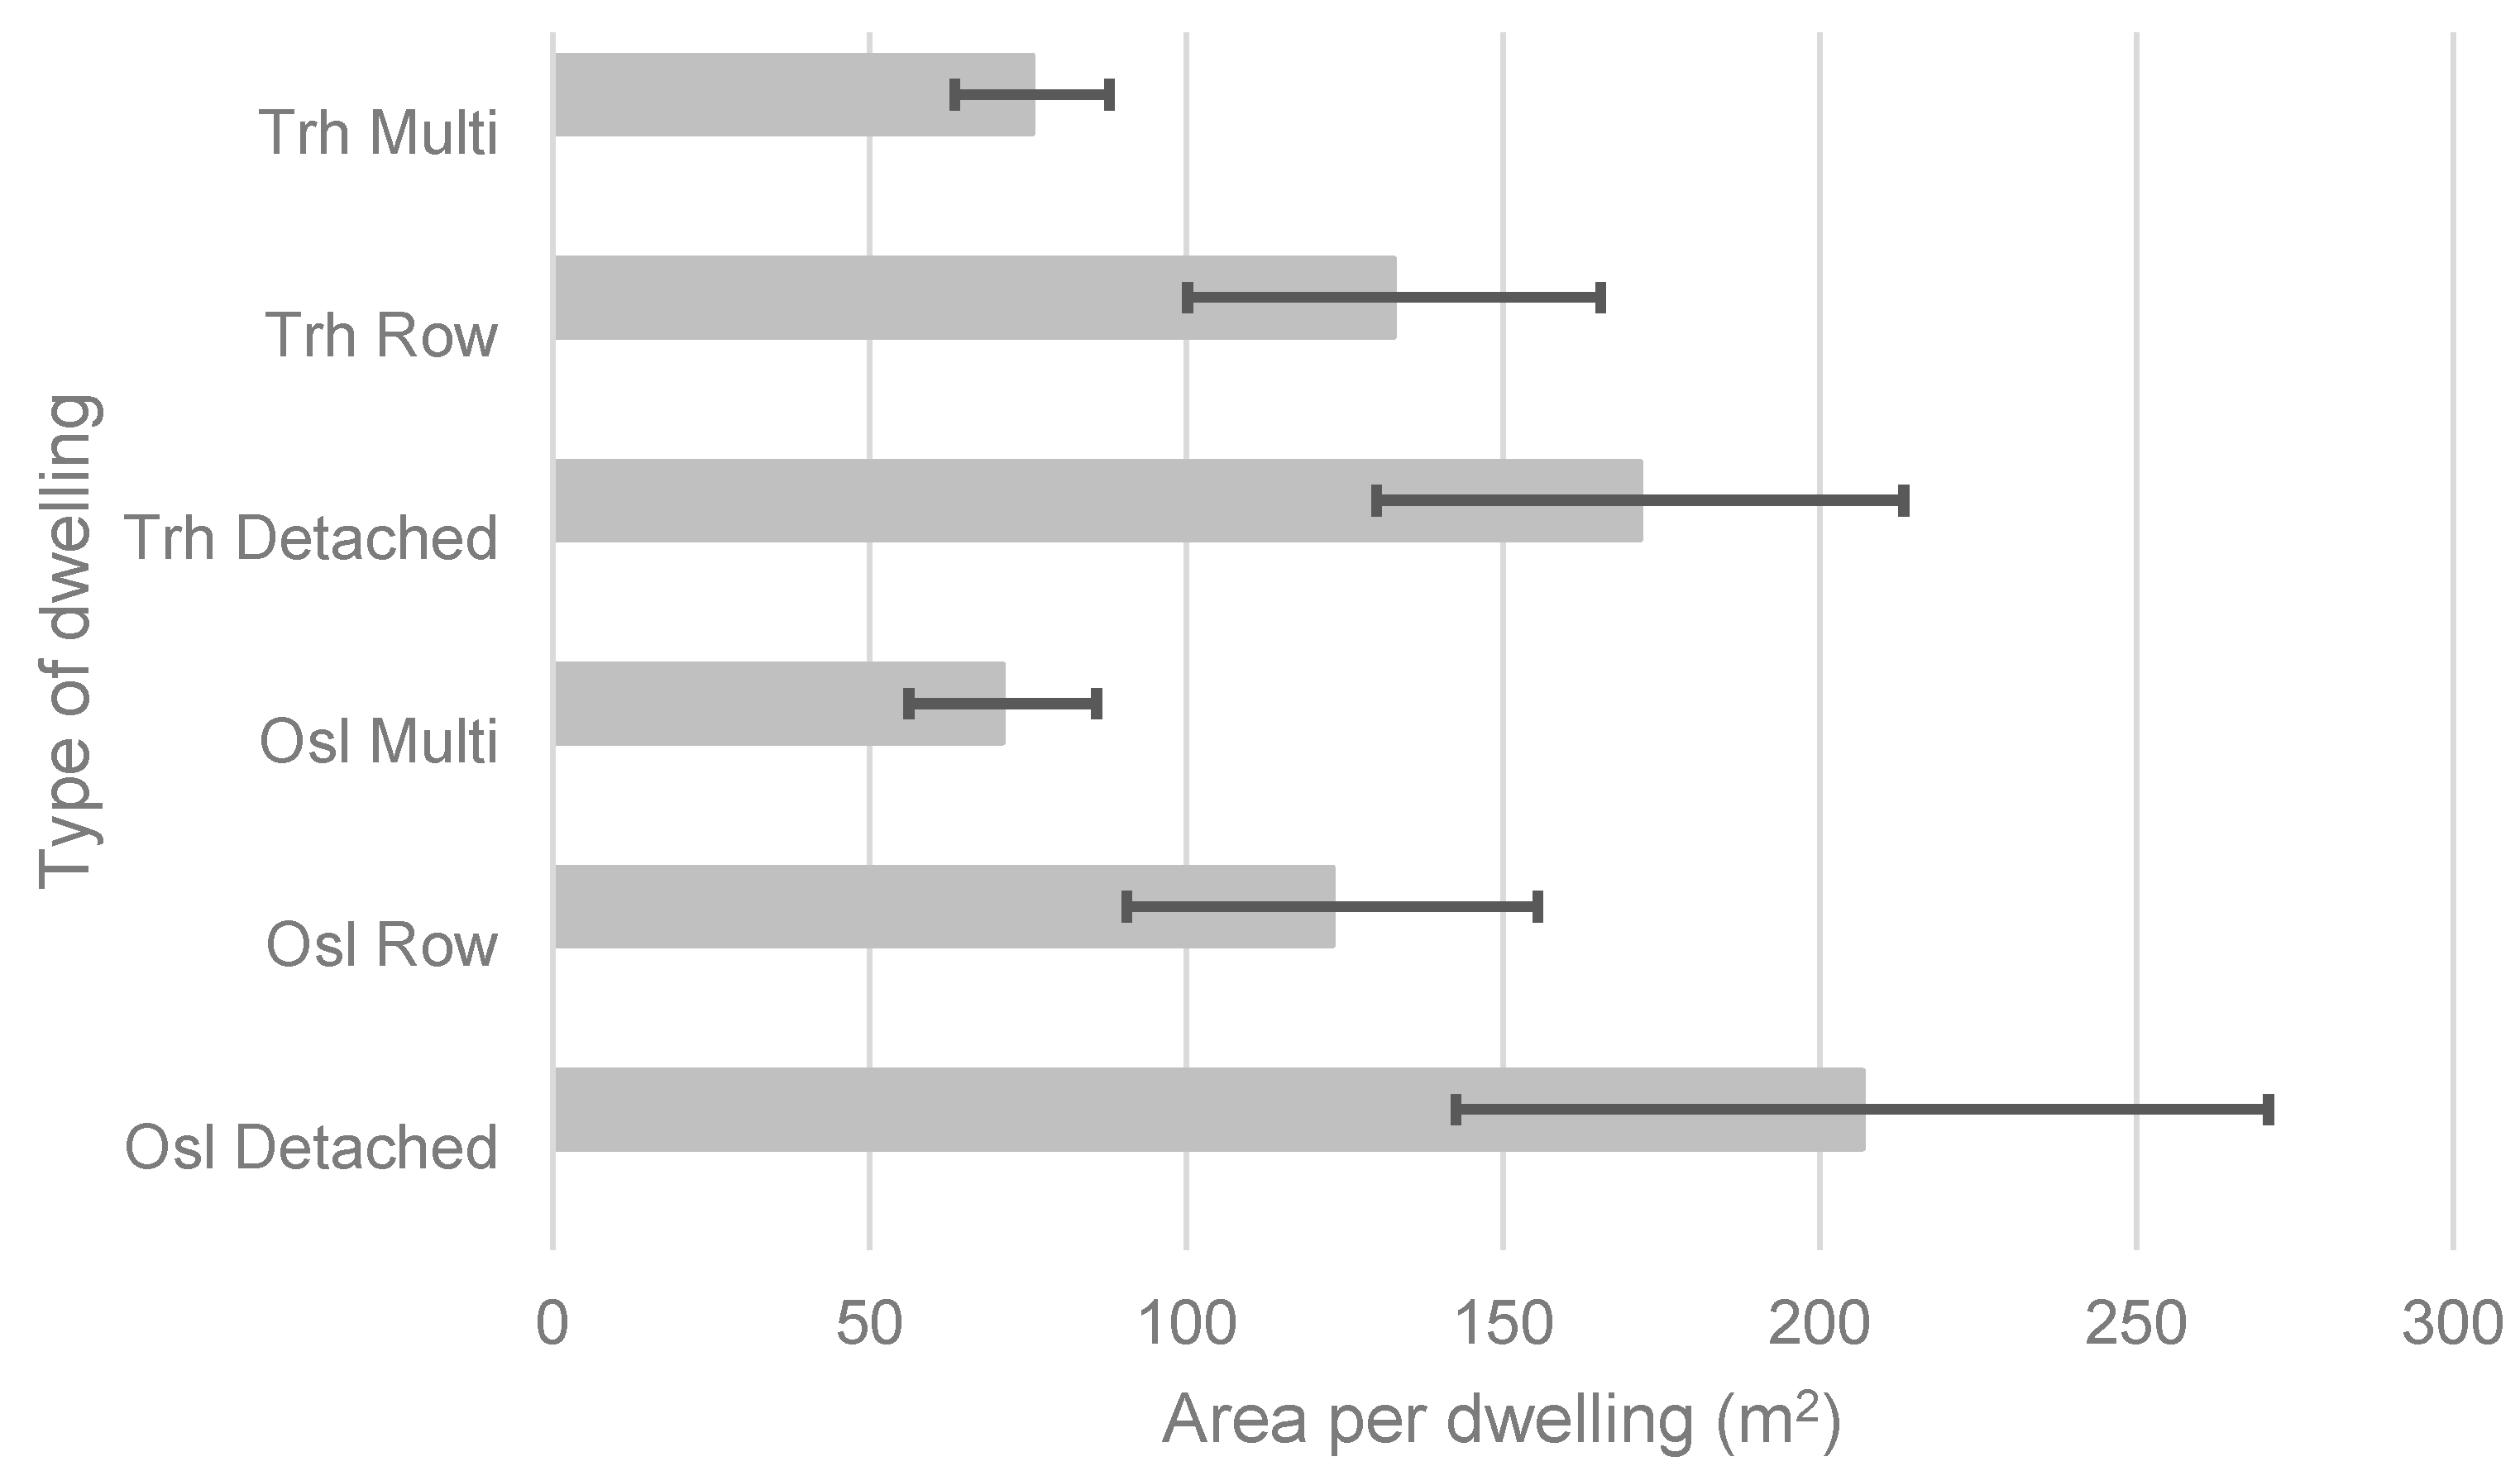
3.3. Floor Area and Spaciousness of Living for Different Dwelling Types
As shown in
Figure 5 mean floor areas of detached dwellings in Oslo and Trondheim are 206.8 m
2 and 171.7 m
2, respectively, whereas mean size of dwellings in apartment buildings (multi-dwelling buildings) is 71.1 m
2 in Oslo and 75.7 m
2 in Trondheim. Row houses are on average larger in Trondheim than in Oslo, 132.9 m
2 and 123.1 m
2 respectively. In both cities, the type detached dwellings varies most by size, while the variation within dwellings in apartment buildings (multi-dwelling buildings) is low in both cities.
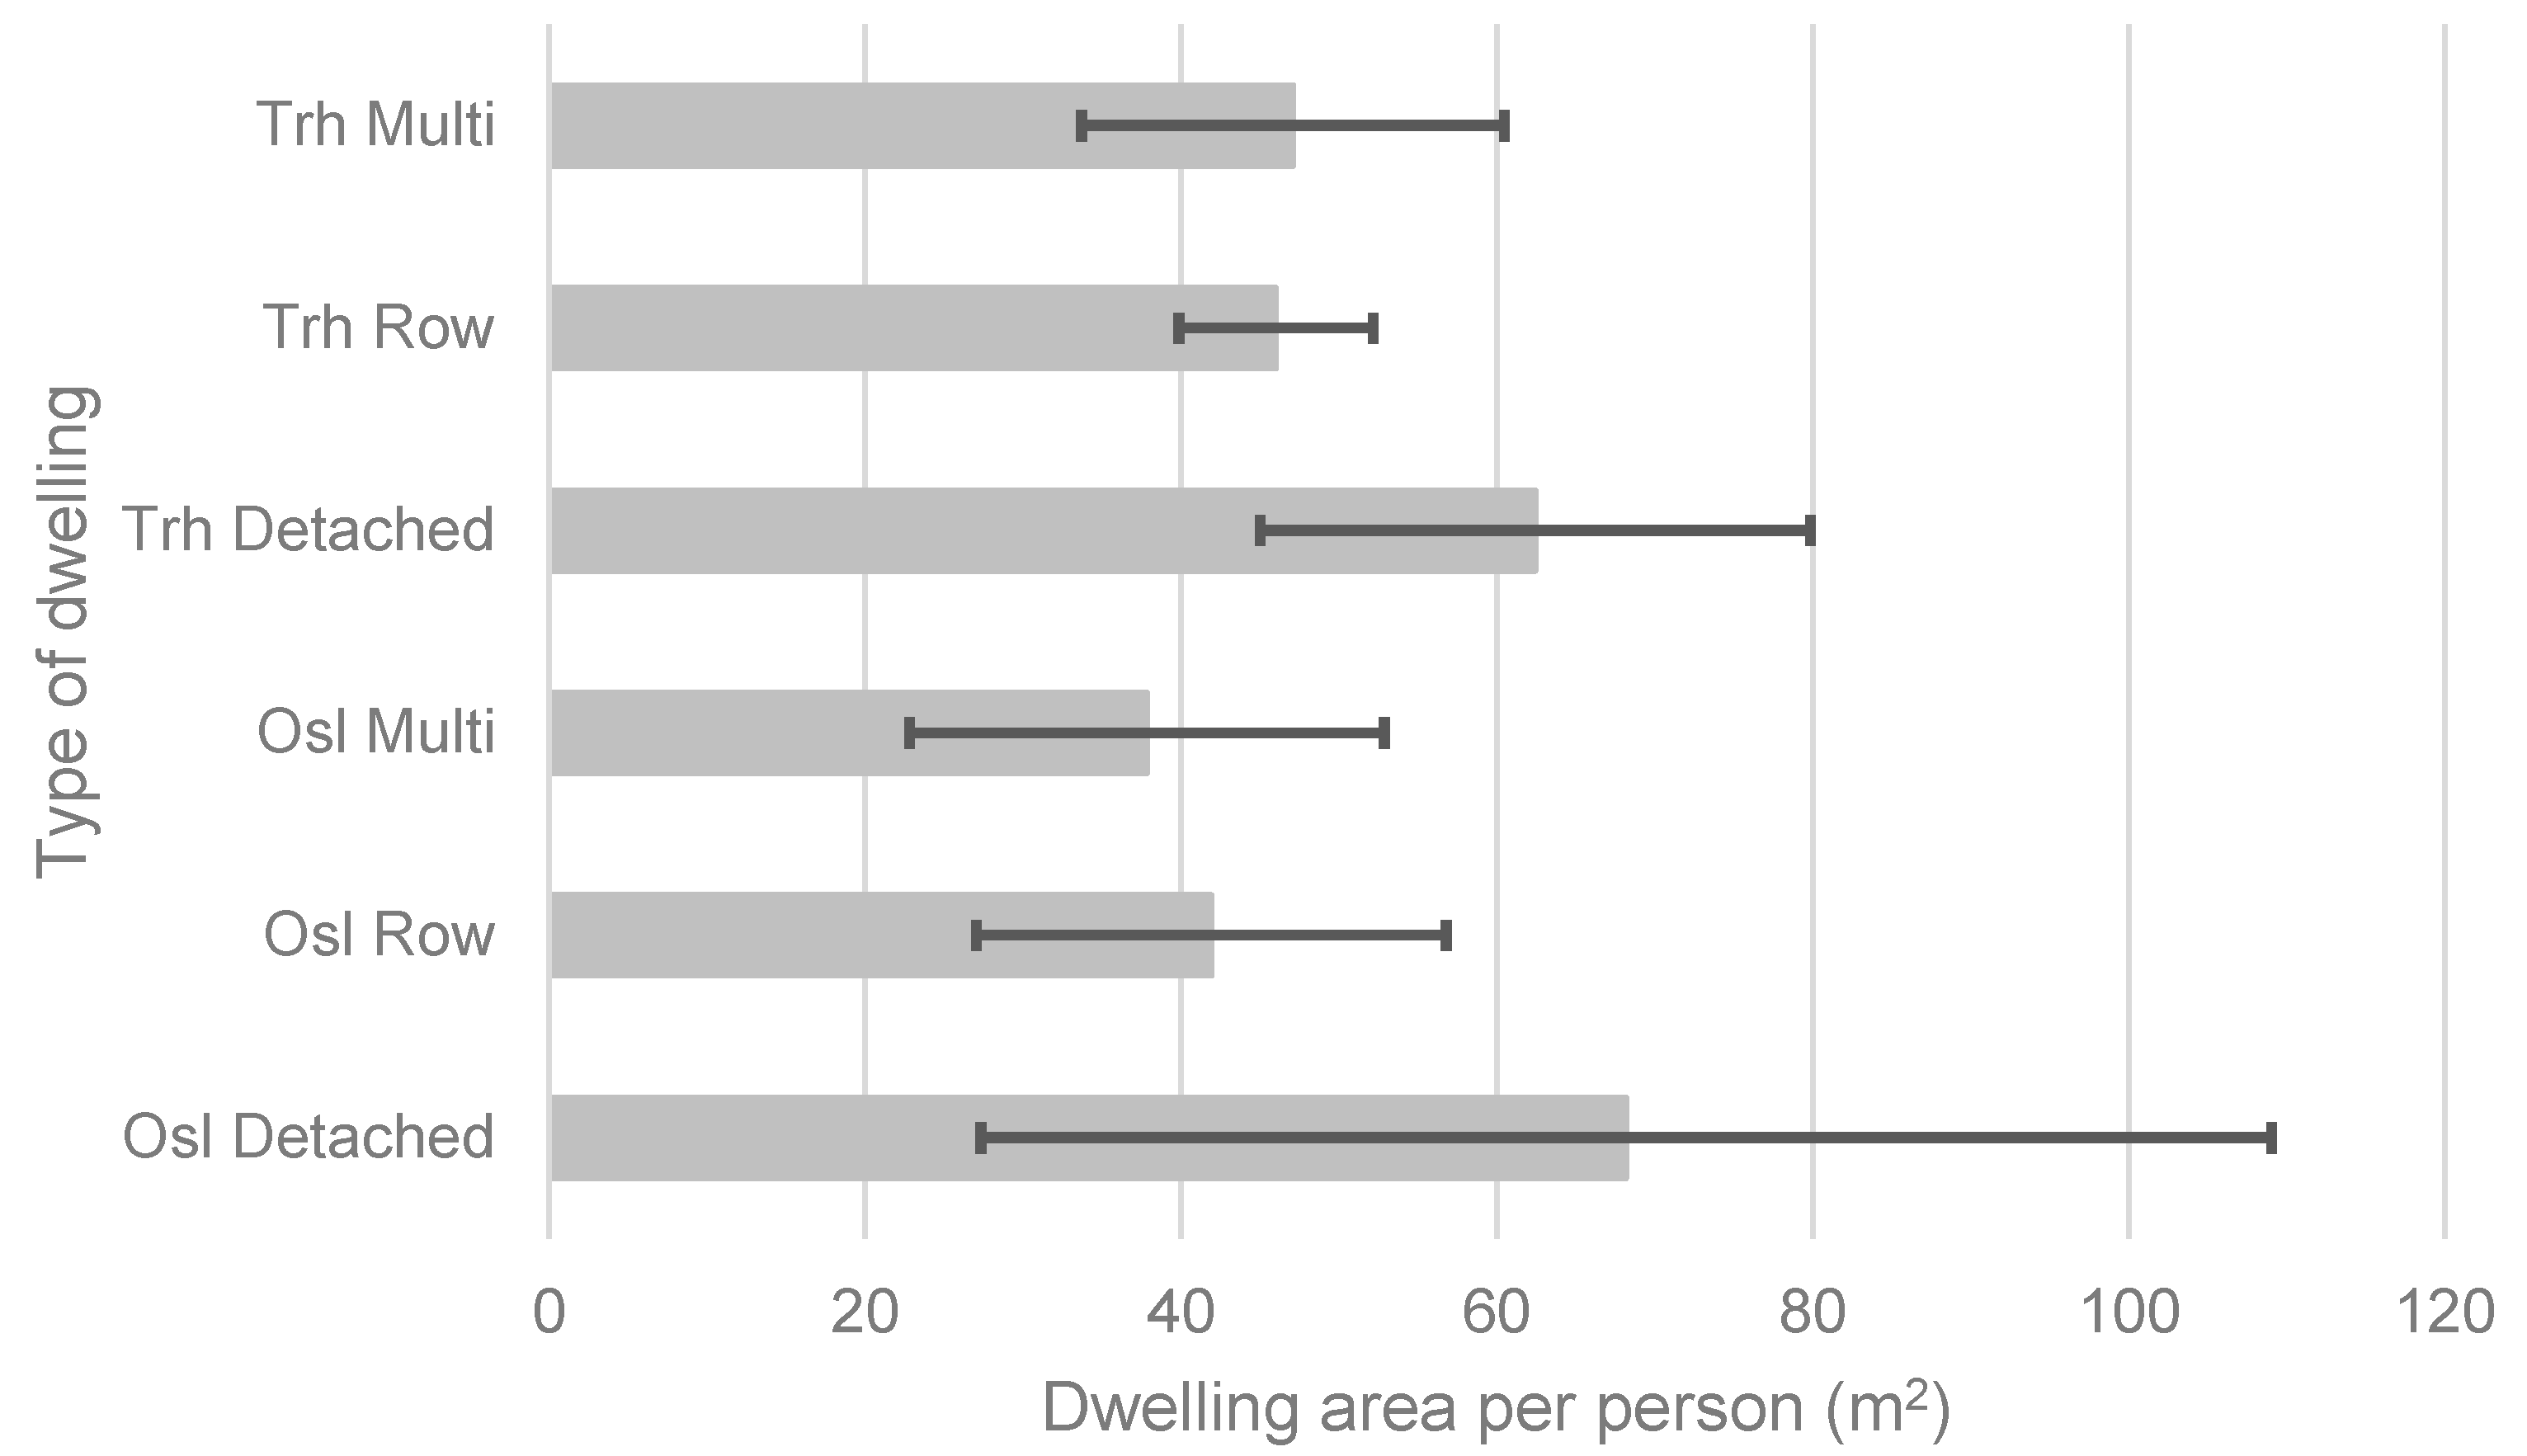
Figure 6 shows dwelling area per person for the different dwelling types. In Oslo, the mean dwelling area per person for detached dwellings is 68.2 m
2, almost twice as high as for dwellings in apartment buildings (37.8 m
2). In Trondheim, the difference is smaller, with mean areas of 62.4 m
2 compared to 47.1 m
2. Detached houses are in Oslo the type with highest variation in dwelling area per person; this variation is lower in Trondheim. For apartment buildings, dwelling area per person is higher in Trondheim than in Oslo (47 m
2 and 38 m
2 respectively), while the variation within the type is slightly higher in Oslo. In Trondheim the variation within row houses (dwe_row, a category including also linked houses and houses with three to four dwellings) is low. The differences between the two cities, which is especially apparent in spatial patterns of area per dwelling (
Figure 1) and for variations within the type detached dwellings, can be explained by the larger variation in economy and living conditions in Oslo compared to Trondheim [
35].
3.4. Energy Use for Different Types of Dwellings
Table 1 shows energy use per person for different types of dwellings based on net energy requirements in current national building codes and available statistics on specific energy use for the different dwelling types. “Total net energy requirements” lists the current national requirements for different dwelling types for new buildings. The requirements differentiate between (1) detached houses, houses with two dwellings, row houses, linked houses, and houses with 3–4 dwellings and (2) dwellings in multi-dwelling buildings. For (1) the maximum permitted is 100 + 1600/m
2 heated GIA per year; for (2) it is 95 kWh per m
2 heated GIA per year [
18]. The “specific energy use” is based on statistics from Statistics Norway where national average energy use is reported per dwelling type [
33]. All numbers are based on mean values of dwelling area and dwelling area per person as described in
Section 3.3.
Even if the “total net requirements” do not vary much between the dwelling types (ranging from 95 to 112 kWh/m2 in Oslo and from 95 to 113 kWh/m2 in Trondheim), the large difference in floor area per person between dwelling types causes a large variation of maximum allowed energy use per person (total energy requirement per person). For Oslo, the requirement for detached dwellings is more than twice as high as for dwellings in apartment buildings, 7433 and 3595 kWh per person per year respectively. The difference between dwellings in apartment buildings and detached dwellings is also high in Trondheim, about 50% higher for detached dwellings.
The “total net requirements” calculations per dwelling type are based on a utopic scenario in which all dwellings, old and new, perform in accordance with contemporary building norms regarding energy demand per floor area. However, for the “specific energy use”, the differences between dwelling types are even more striking: In Oslo, the per capita energy use for detached houses and for apartment buildings are 13,501 and 5904 kWh per year, respectively. This difference is also large in Trondheim, but here per capita energy use for apartment buildings is higher than in Oslo.
4. Discussion
The results of our analyses show that different dwelling types in Oslo and Trondheim vary considerably in floor area per person. Multiplying this floor area per person with energy demand per floor area shows that the energy demand per person is significantly higher for people living in detached dwellings compared to people living in row houses or in apartment buildings.
Current national energy efficiency regulations regarding energy performance of buildings, measuring this per floor area, do not grasp the energy demand effects of dwelling sizes. The considerable variation in area per dwelling between different dwelling types affects the total energy demand for each dwelling type and allows for considerably higher energy demand for detached dwellings than for dwellings in apartment buildings. We find the mean dwelling area per person to be significantly higher for detached dwellings than for dwellings in apartment buildings in both cities. Consequently, including the effect of dwelling area per person across dwelling type, the differences in total energy demand per person between dwelling types increase even more.
While our results focus on the implications of the total net energy requirements (according to National building codes) and statistics on specific energy use when these are calculated per person and where only operational energy is included, a study by Stephan and Crawford [
36] shows that by accounting for embodied energy demand in addition to operational energy the difference in energy performance between dwelling types increases even more. They find that the life cycle energy demand in larger dwellings often is higher because of increase in material use in addition to the fact that these dwellings have larger areas to heat, cool, and light and argue that “building energy efficiency regulations should incorporate embodied energy, correct energy intensity thresholds for house size and use multiple functional units to measure efficiency” [
36] (p. 1158).
Existing research has found that detached dwellings have additional disadvantages when accounting for energy use and emissions from transportation and infrastructure [
37,
38]. We found homogenous areas with detached dwellings in the outer area of the cities, while apartment buildings dominate the central areas (in the case of Oslo also the central business districts, CBDs). In general, the population density (population per hectare or km
2) is lower in areas dominated by detached dwellings due to building layouts and footprints and need for access roads. The population density will influence characteristics of the area such as the amount of people using the area, traffic intensity and the potential for a variety of building functions, which in turn influence the need to travel to meet daily needs. This demonstrates the complex relationship between urban morphology and emissions. Several studies have identified that the distance to the city center or CBD is strongly associated with vehicle miles travelled (VMT) [
39,
40,
41] and that energy use for transport increases with distance between the dwelling and the closest main city or city center [
38]. In addition, detached houses in scattered settlements require significantly more material, energy, and investment in infrastructure per dwelling. Our results, revealing that detached dwellings have significantly higher per capita energy use compared to other dwelling types, adds to the above-mentioned and well-known sustainability problems concerning detached housing and sprawl.
This study reveals patterns of geographical variations in dwelling size, number of residents per dwelling as well as dwelling area per person, allowing for identification of areas with certain characteristics such as student housing areas in Trondheim and areas dominated by large, detached dwellings in Oslo. A study by Stephan and Athanassiadis [
42] demonstrates the potential of mapping and visualizing embodied environmental requirements of buildings in GIS. By including data on dwellings and dwelling areas at a finer resolution, the relationship between dwelling area per person and energy and/or environmental performance can be further examined.
The dwelling types applied in this study follows the differentiation in Norwegian statistics. This categorization is clear and useful for detached dwellings and for houses with two dwellings. The type named dwe_row is more diverse, since it includes row houses, linked houses as well as houses with 3–4 dwellings, which are dwelling types that may differ much by variables influencing energy demand, for instance by area of building envelope per dwelling This is the case also for the category multi-dwelling buildings, since this includes continuous blocks as well as lamellas and high-rise, building types that differ by many variables influencing energy demand [
43,
44]. Due to these ranges within some of the dwelling categories applied, this paper has focused on pointing out some overall patterns. For examining energy demand via more detailed numbers or providing knowledge about building and apartment layouts at detailed scale, further studies applying more detailed data of apartment types and building morphology should be conducted. Future studies also should consider variance in climatic conditions and outdoor environmental differences.


