
Evaluation of Subjective Feelings of Outdoor Thermal Comfort in Residential Areas: A Case Study of Wuhan


Abstract
:1. Introduction
2. Study Site and Methods
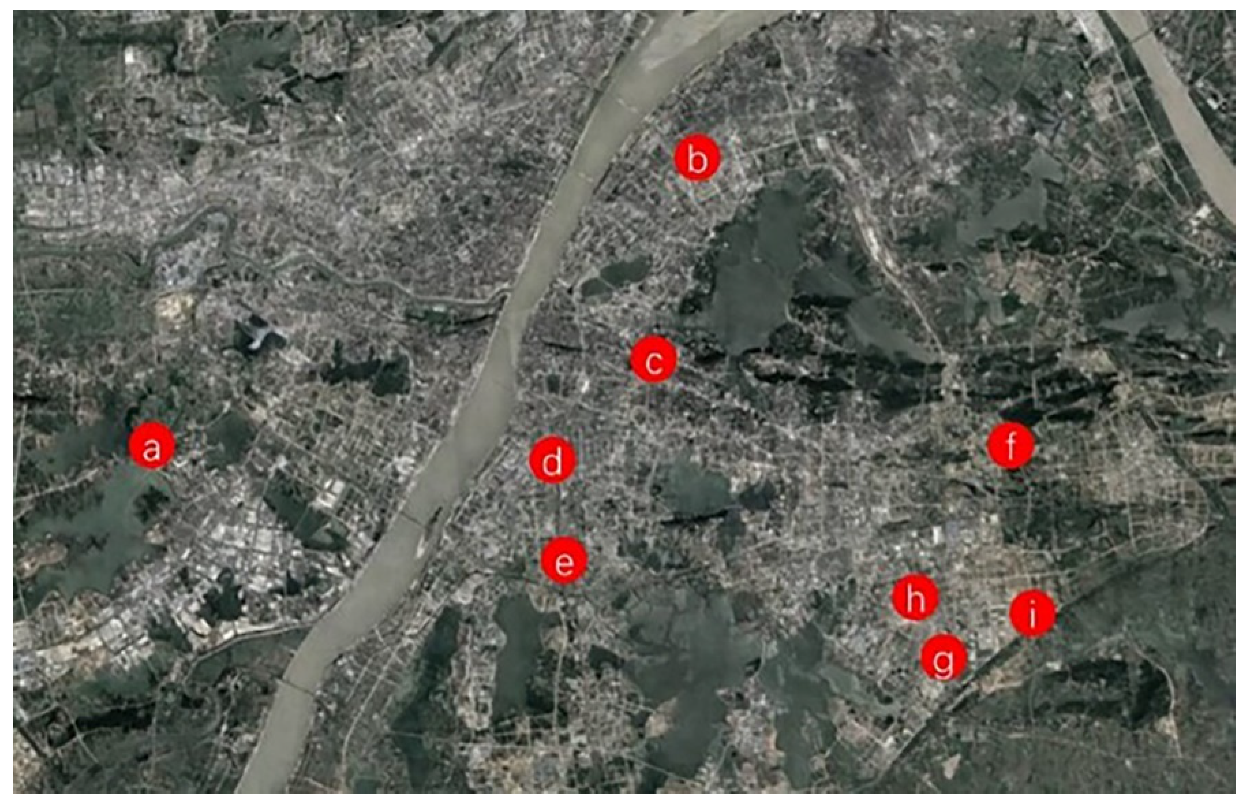
2.1. Study Site
2.2. Methods
2.2.1. Environmental Parameters of the Study Site
- (1).
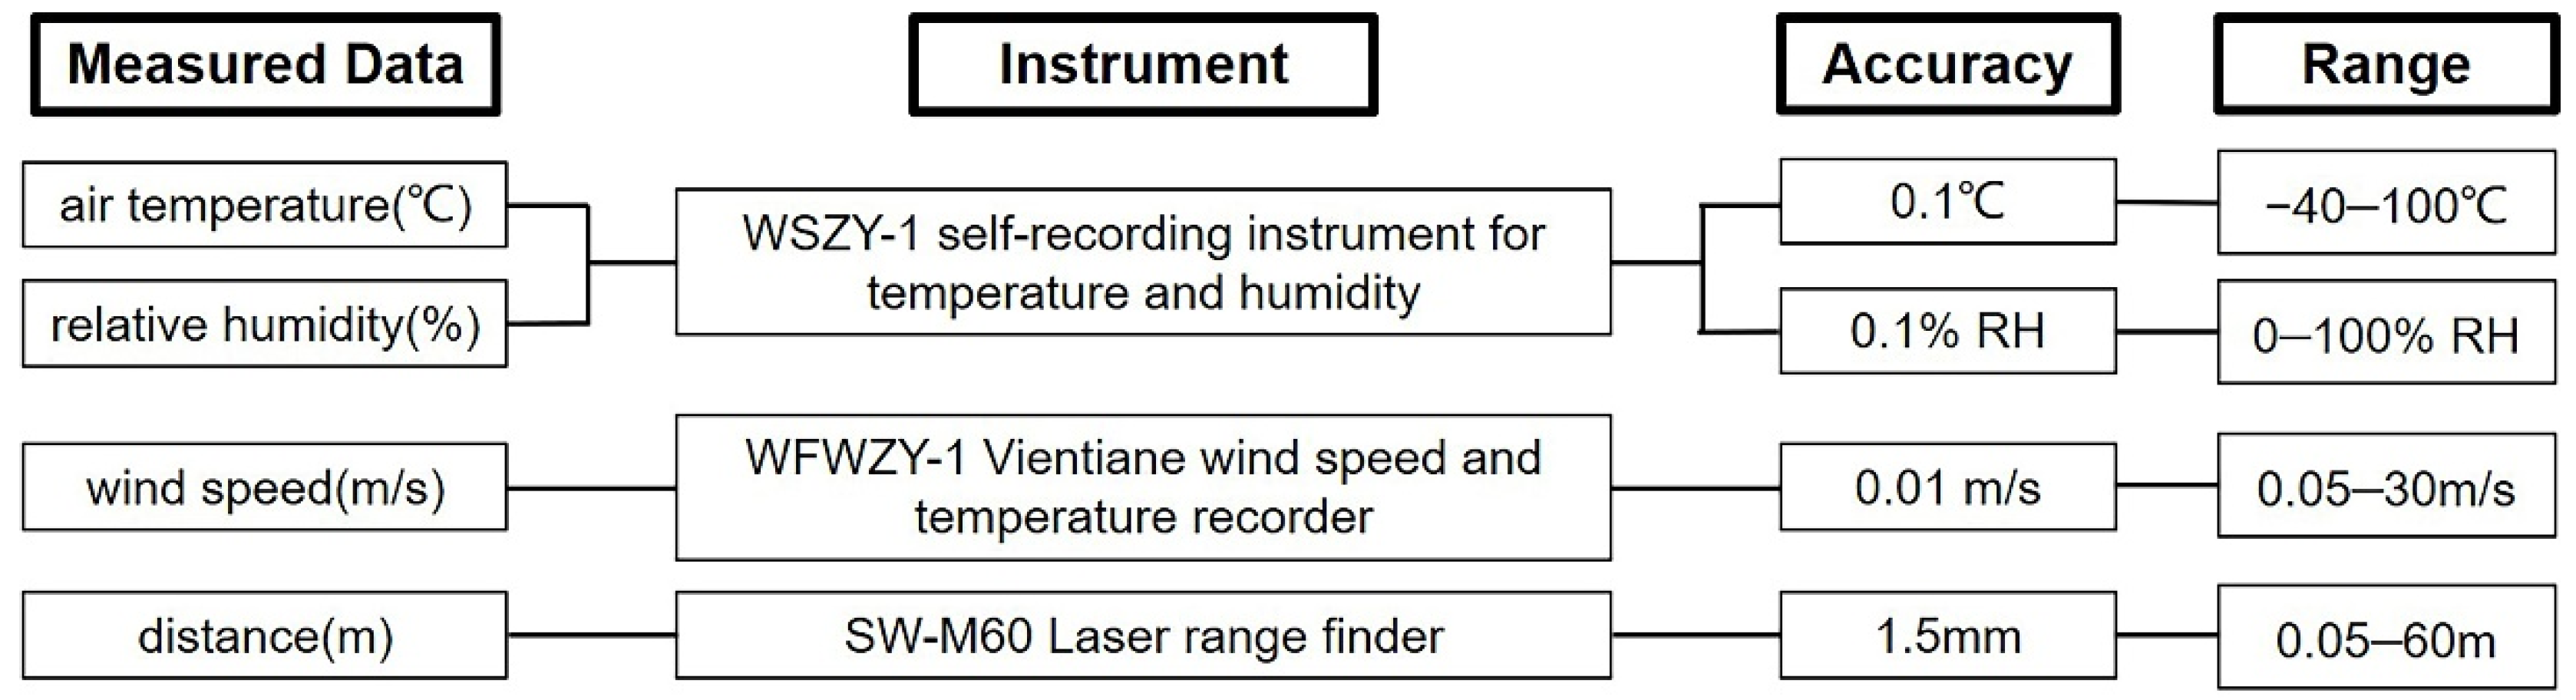
- Measurements of Meteorological Parameters
- (2).
- Classifications of Planning Parameters
- Building height was further classified into three types according to the number of stories in the buildings, as shown in Table 1: (a) low-rise: less than 5 stories, (b) middle-high-rise: 6–15 stories, and (c) high-rise: more than 15 stories.
- Environmental quality was also classified into three types according to economic level [31], which was measured by the sales price per square meter as of October 2020 in Wuhan, as shown in Table 3: (a) low: less than 16,000 yuan/m2, (b) medium: 16,000–22,000 yuan/m2, and (c) high: more than 22,000 yuan/m2. Here, according to the exchange rate on 20 August 2021, 1 yuan equals 0.1583 U.S. dollars.
- (3).
- Underlying Surface Measurements
2.2.2. Questionnaire Survey
2.2.3. Analytical Methods
3. Results
3.1. Current Conditions of Residential Areas in Summer and Winter
3.2. Influences of Planning Characteristics on Thermal Comfort in Summer
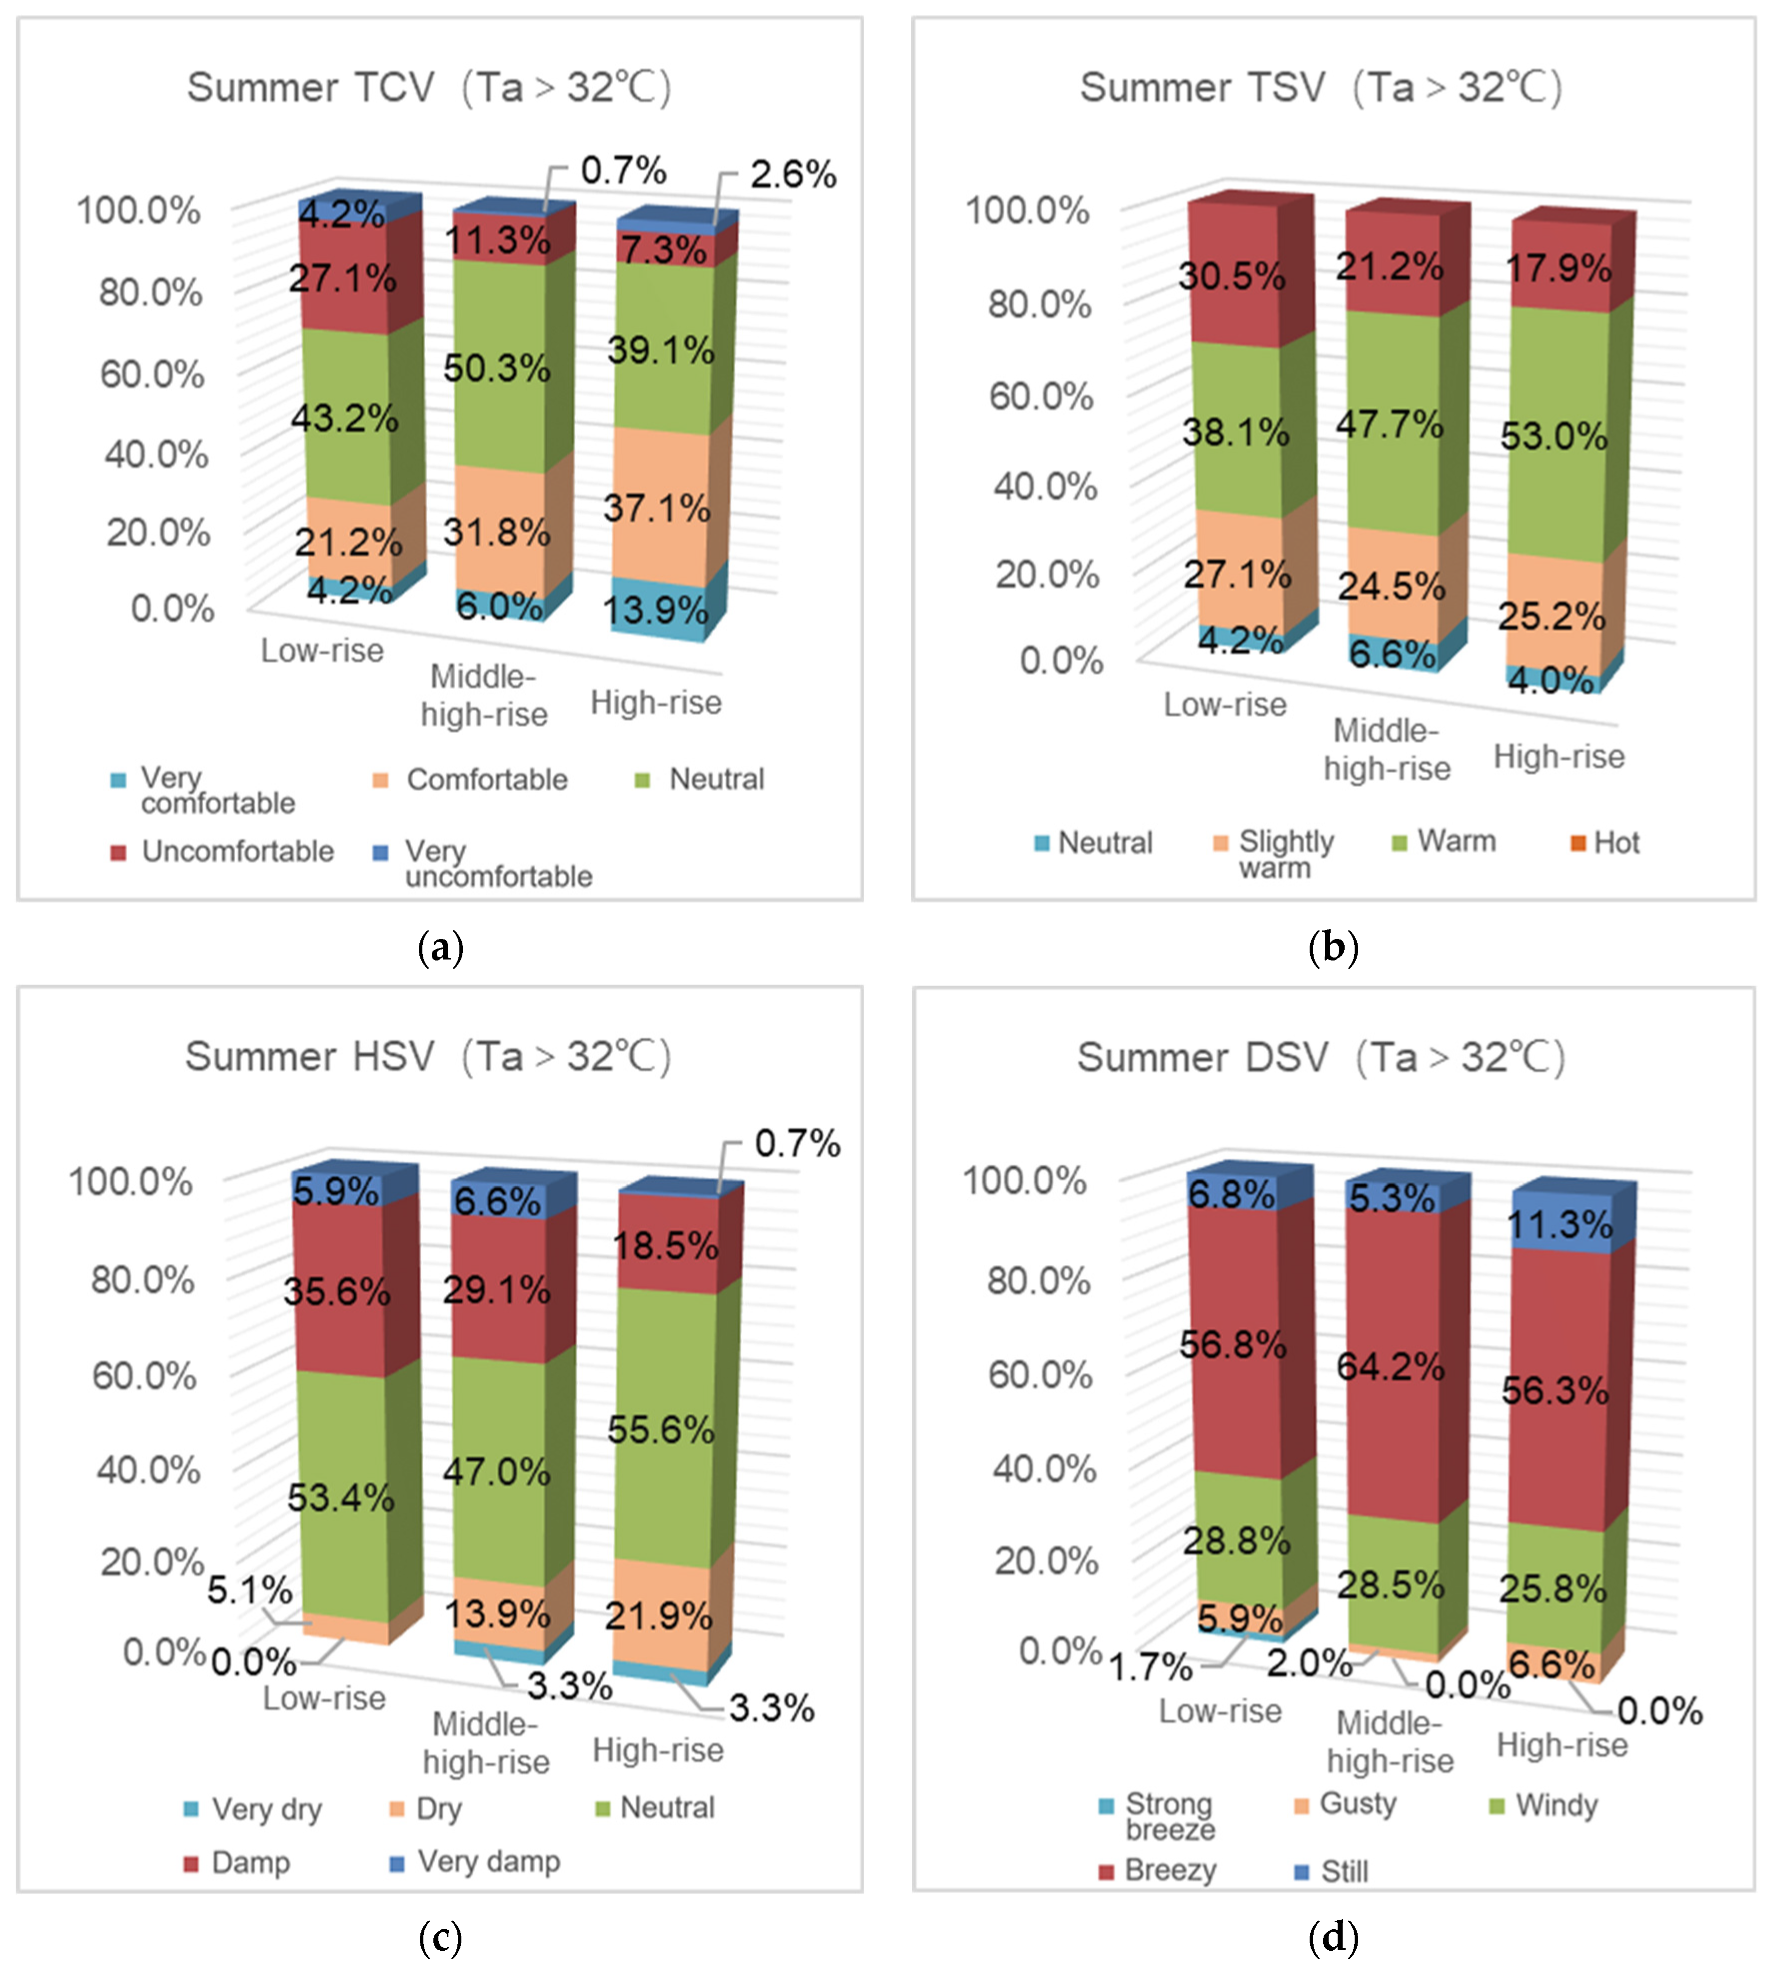
3.2.1. Increasing Building Height Can Improve Outdoor Thermal Comfort and Humidity Satisfaction within Summer
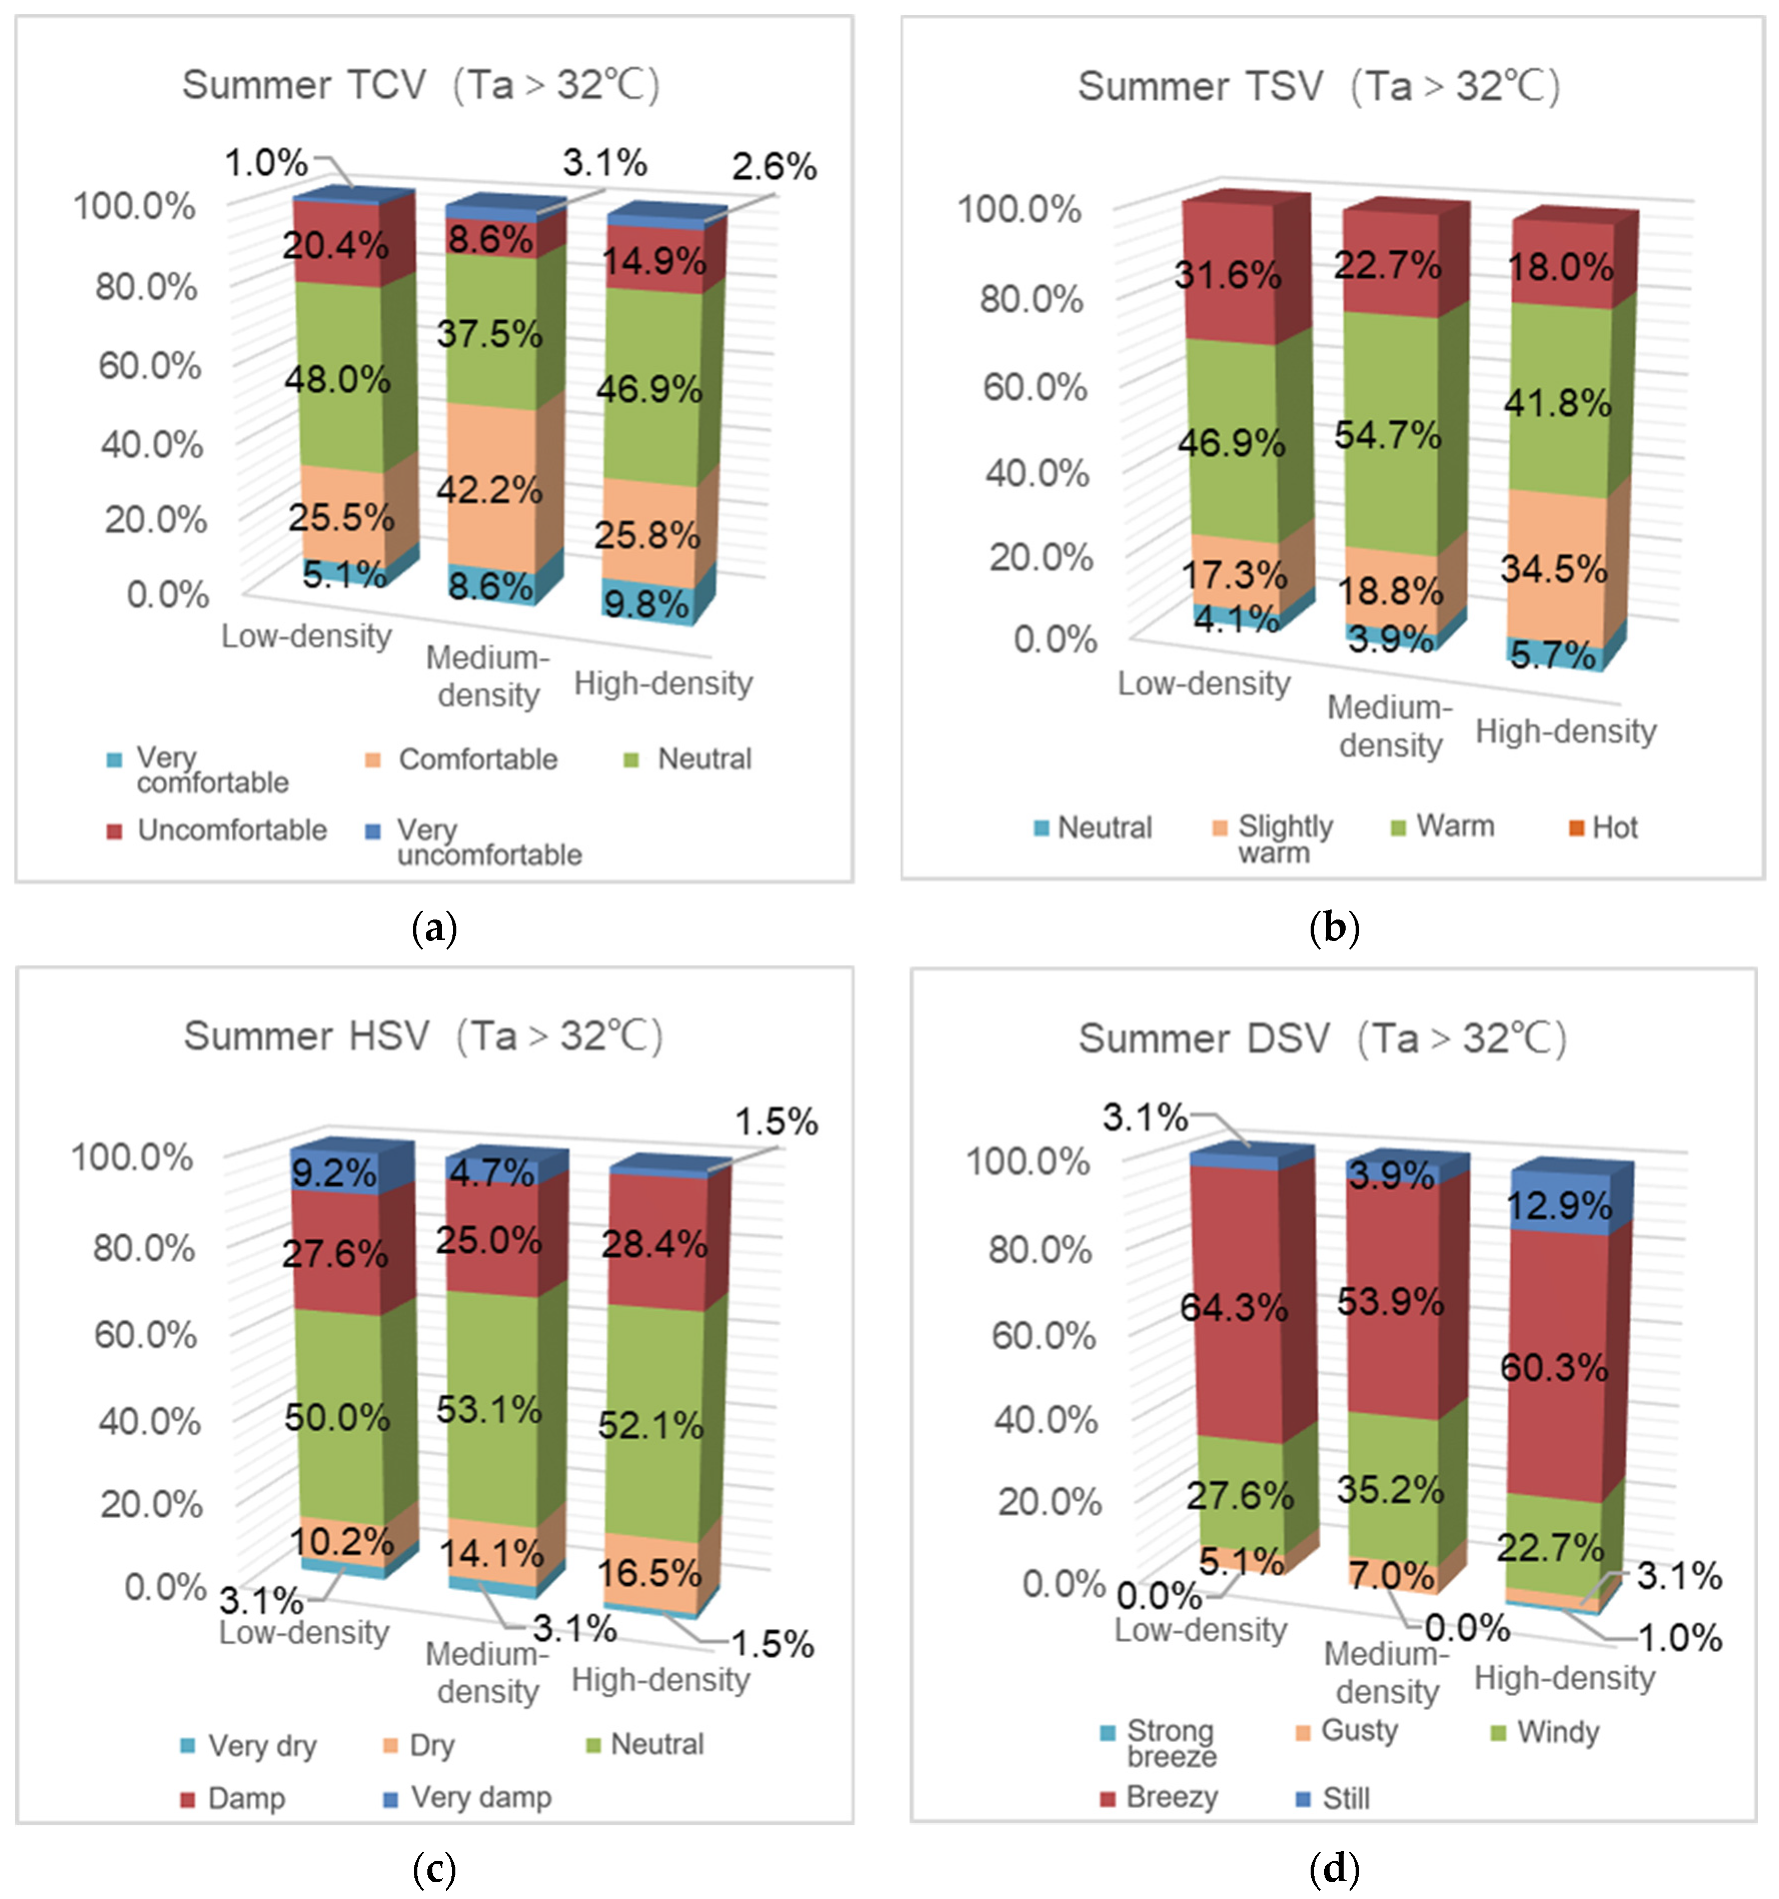
3.2.2. Medium Building Density Is Most Conducive to Outdoor Thermal Comfort and wind Speed Satisfaction in Summer
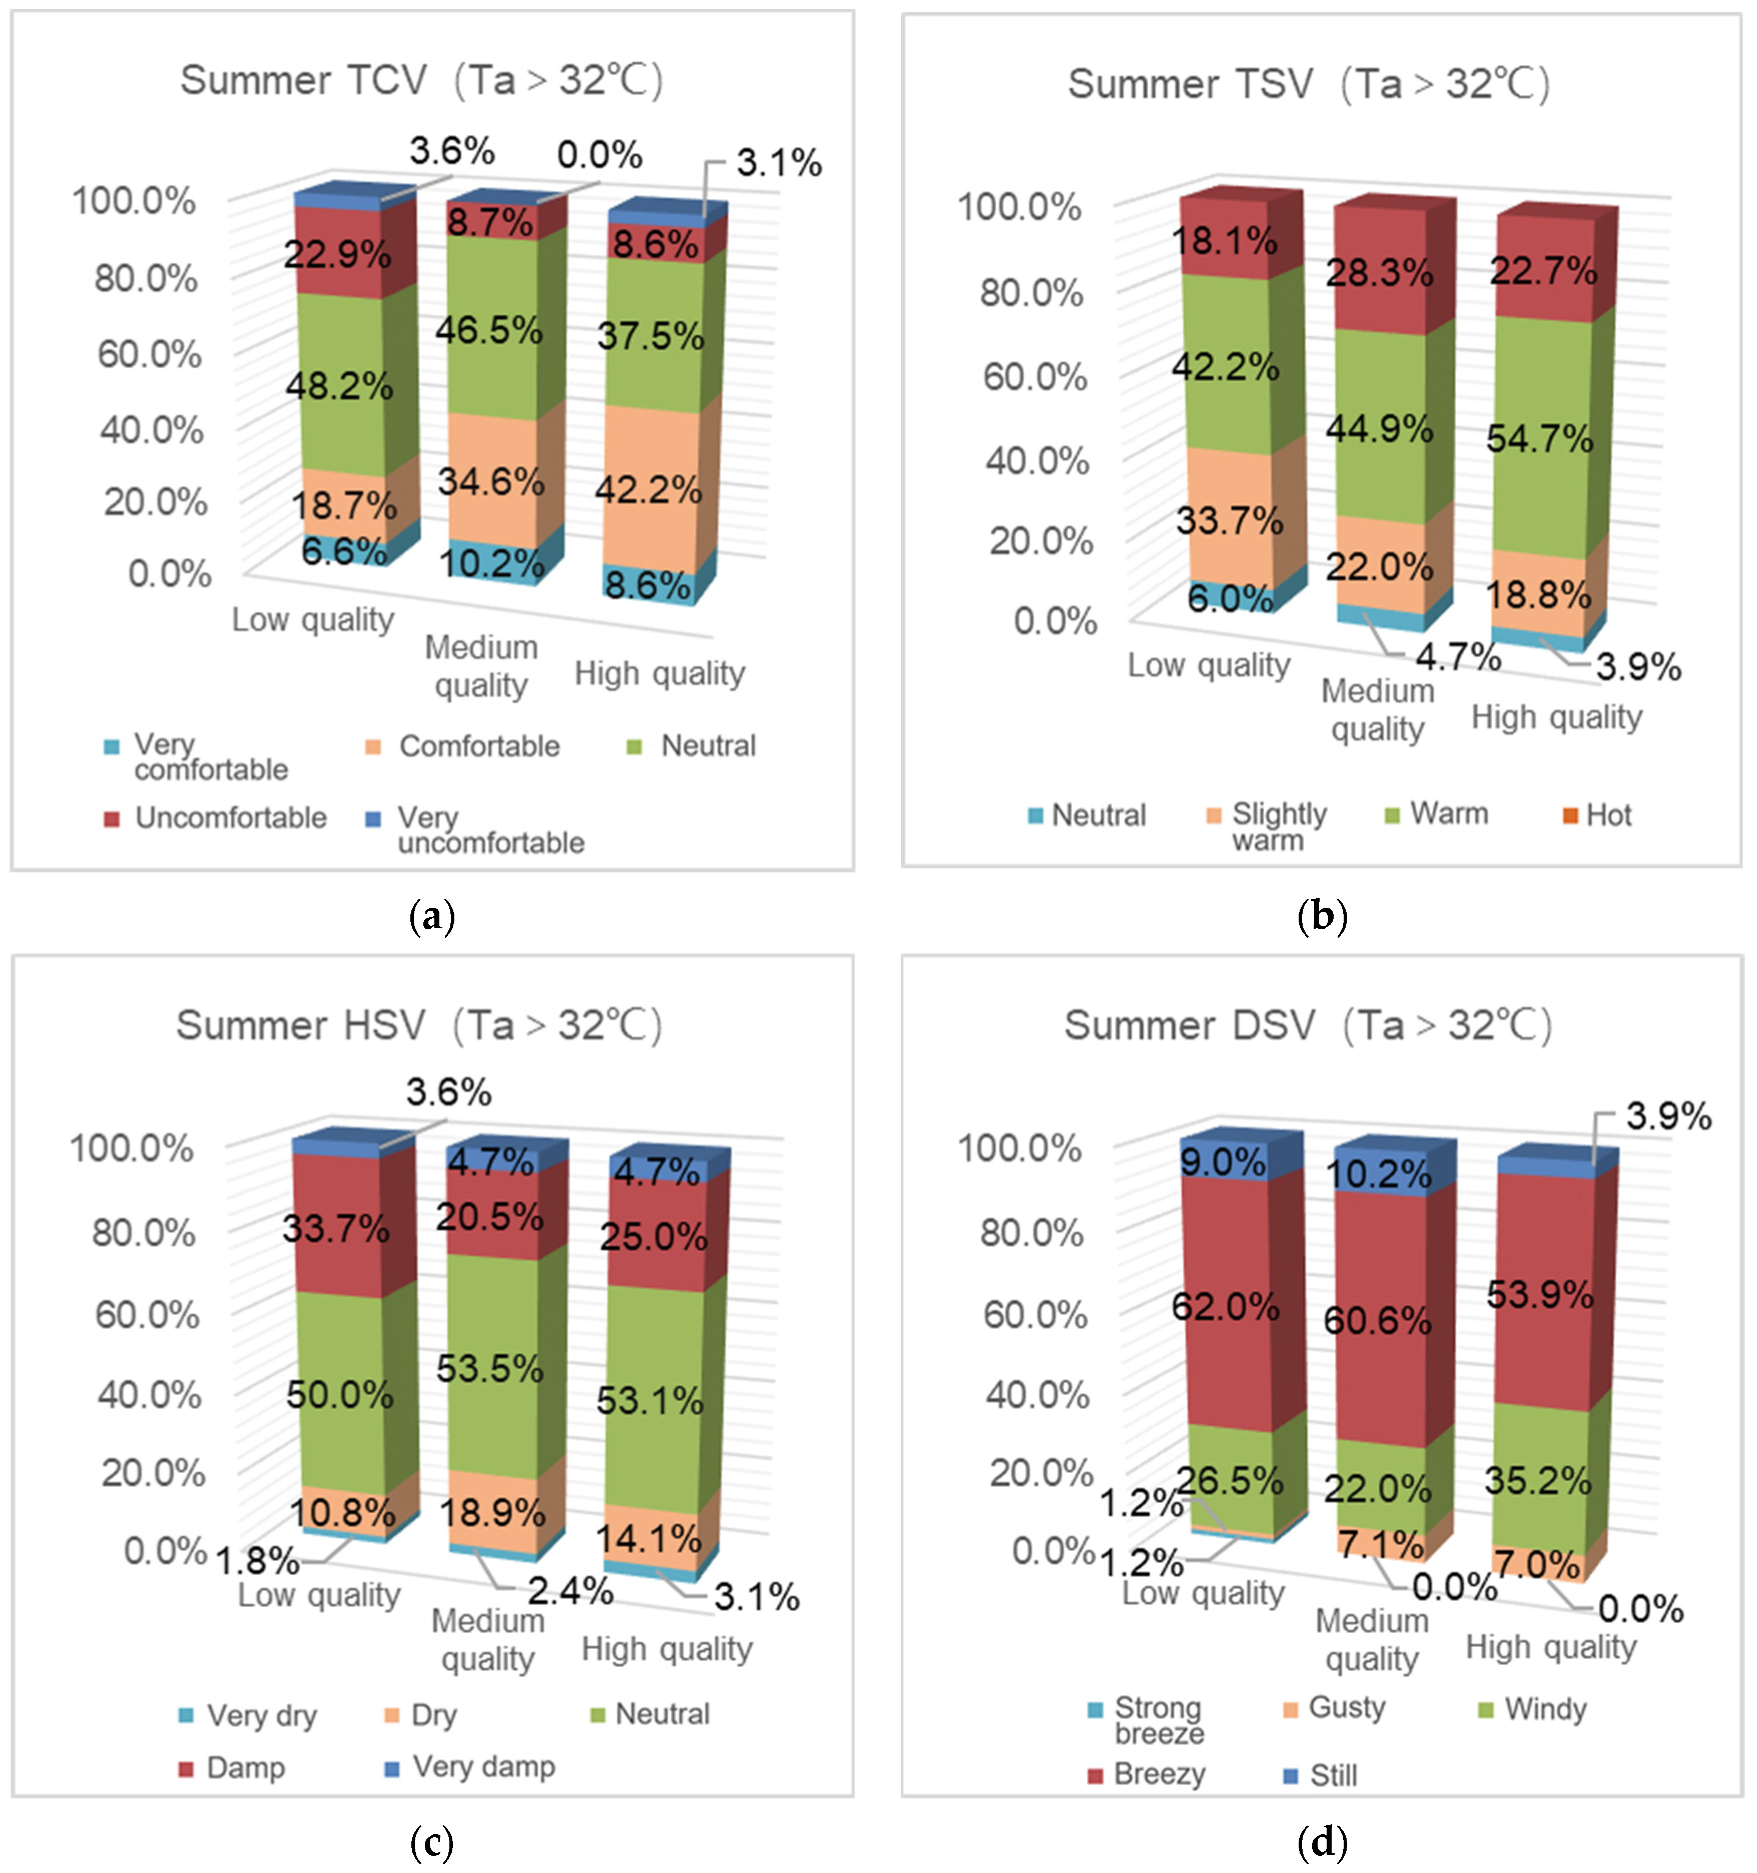
3.2.3. Relationship between Environmental Quality and Outdoor Comfort in Summer
3.3. Relationships between Outdoor Activities and Thermal Comfort
3.4. Effects of Underlying Surface Types on Outdoor Thermal Comfort in Summer
4. Discussion
4.1. Analysis of Current Conditions of Outdoor Thermal Comfort in Winter and Summer
4.2. Analysis of Relationships between Characteristics of Residential Areas and Thermal Comfort in Summer
- (1)
- Building height
- (2)
- Building density
- (3)
- Environmental quality
4.3. Selection of Outdoor Activities
4.4. Limitations
5. Conclusions
- (1).
- The current levels of outdoor thermal comfort are different for each season. Although the difference between the comfort in both seasons is only 6.4%, the other three indicators of temperature, humidity, and wind speed are quite different: Summer has a more appropriate thermal effect, but higher humidity, and significantly lower wind speed.
- (2).
- Thermal comfort in summer is affected by building height, density and environmental quality. In temperatures above 32 °C, the high-rise residential areas with more than 15 stories produce the highest outdoor comfort with a satisfaction value of 51.00%, which is mainly the result of low humidity. Where the building density is 22% < FAR ≤ 30%, the levels of comfort are the highest with a satisfaction value of 50.8%, which is mainly the result of wind speeds. Moreover, in areas with high environmental quality, comfort is also the highest with a satisfaction value of 50.8%, which is also mainly the result of higher wind speeds.
- (3).
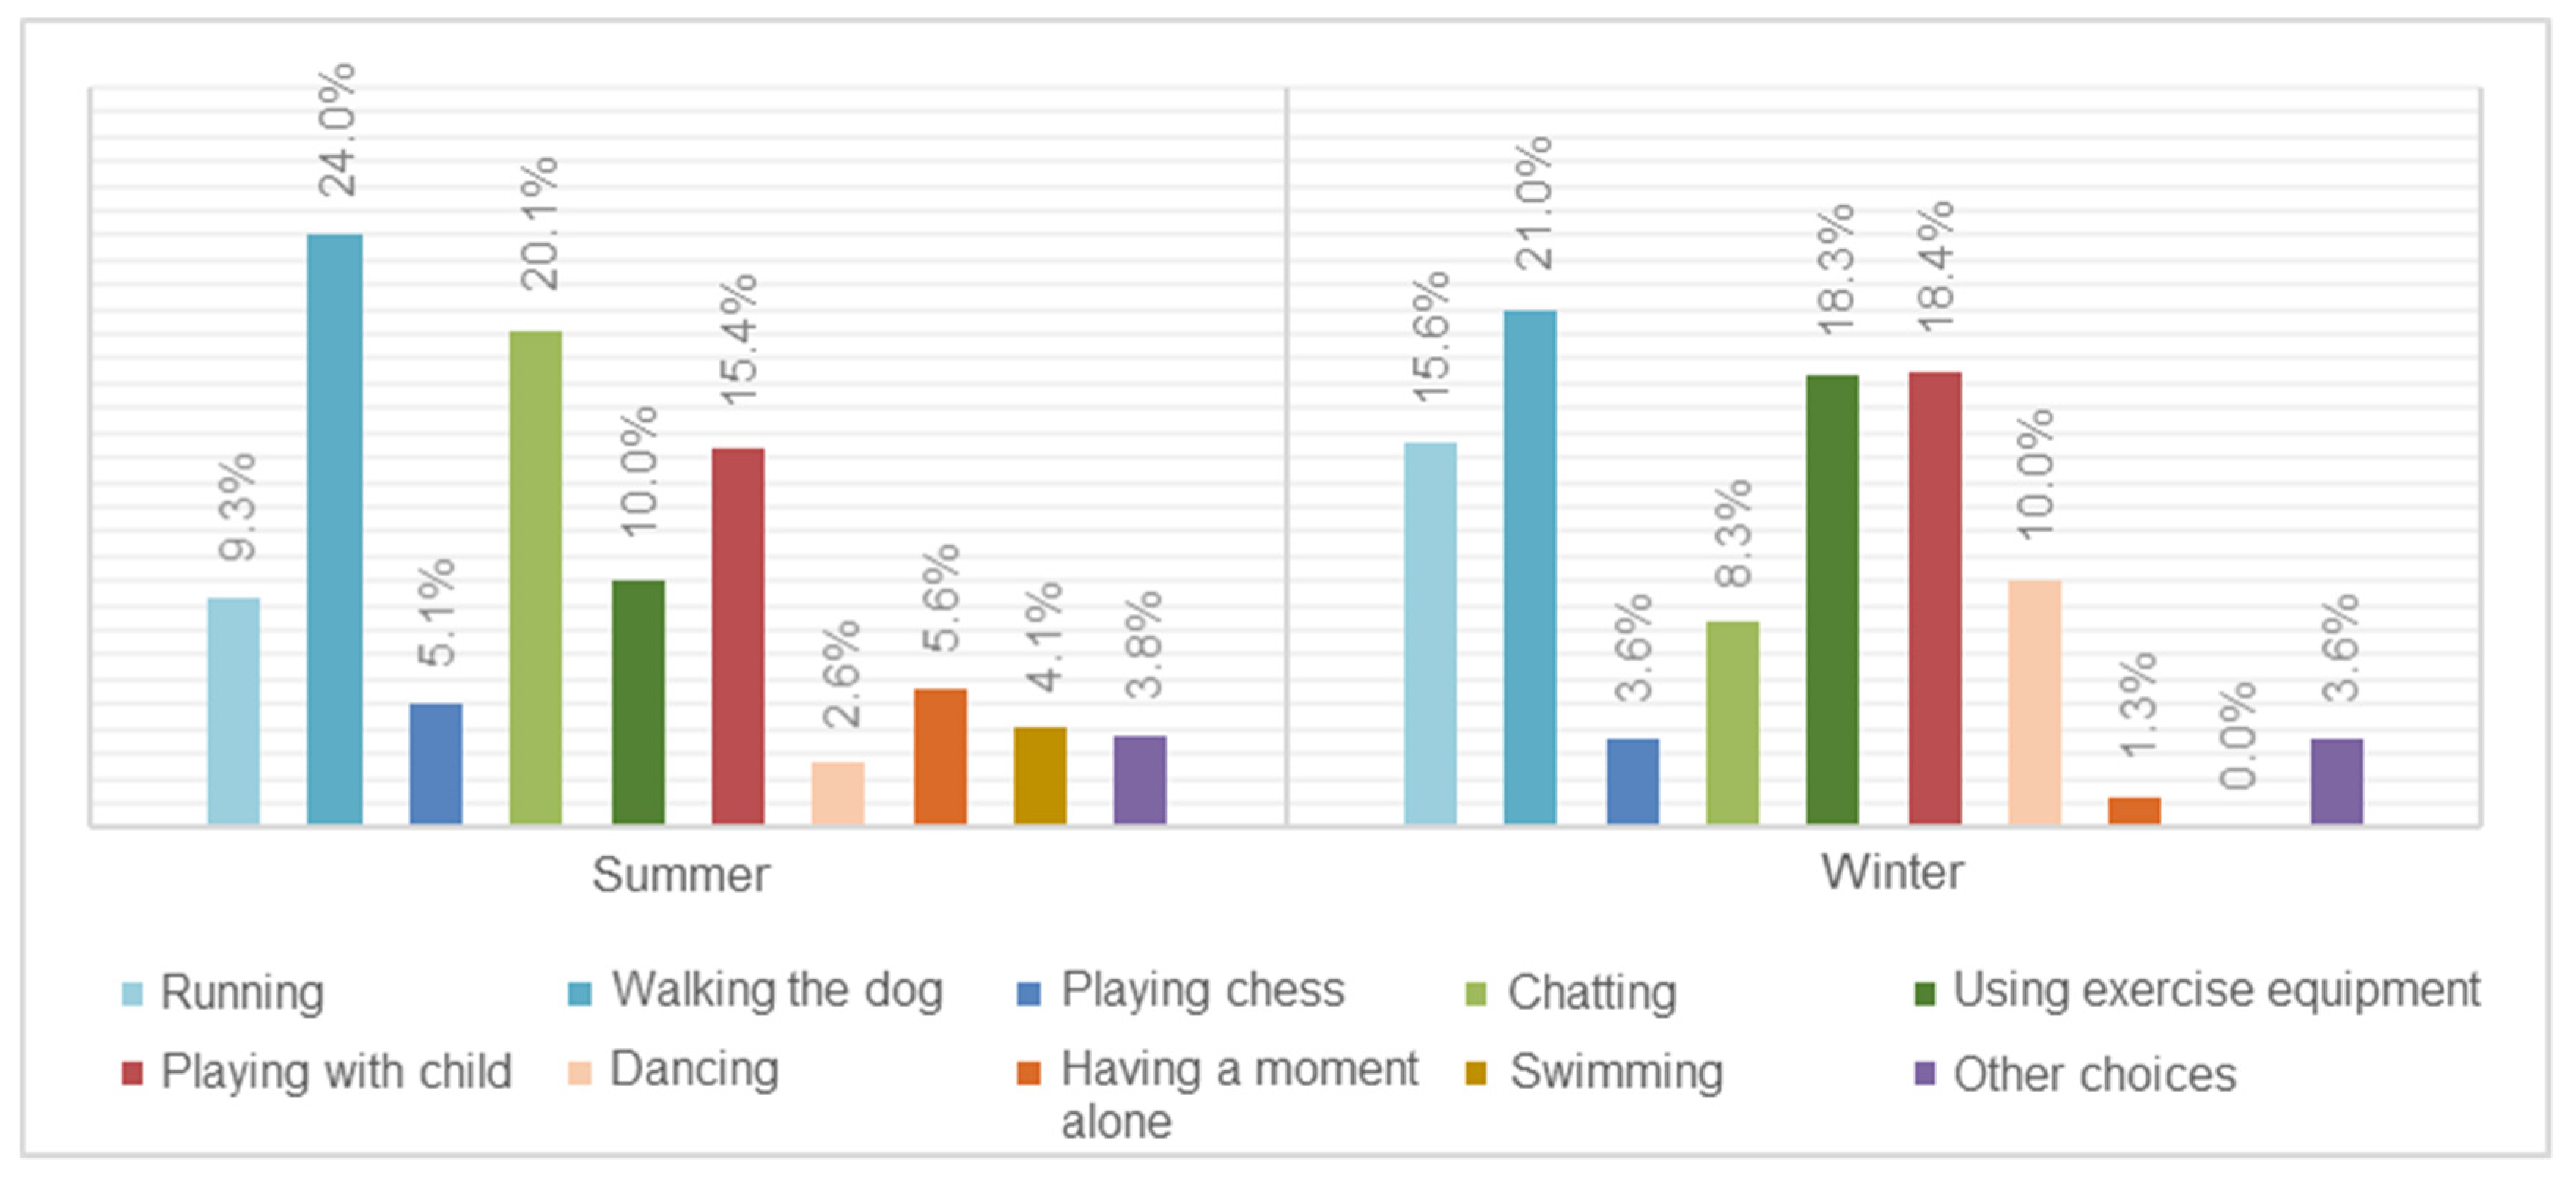
- The types of outdoor activities chosen by residents differ by season. Residents tend to choose static activities in summer but dynamic activities in winter. Spots for resting and sitting are more suitable for outdoor activities in summer, whereas spots for sports and fitness are more suitable in winter while footpaths and children’s playgrounds are suitable in both seasons. The improvement of facilities enhances outdoor thermal comfort.
- (4).
- Green areas and those with impervious paving can affect outdoor thermal comfort in summer. Positive correlations exist between green areas and comfort, so expanding such areas can reduce heat sensations. When the green coverage rate exceeds 70.0%, temperature satisfaction can be increased from 33.3% to 66.7%. Negative correlations exist between areas with impervious paving and temperature sensations. If such areas are 400–625 m2, then the temperature satisfaction drops to less than 21.5%.
Author Contributions
Funding
Data Availability Statement
Conflicts of Interest
Abbreviations
| TCV | Thermal comfort voting |
| PMV | Predicted mean vote |
| SET | Standard effective temperature |
| UTCI | Universal thermal climate index |
| PET | Physiological equivalent temperature |
| CFD | Computational fluid dynamics |
| FAR | Floor area ratio |
| TSV | Temperature sensation voting |
| HSV | Humidity sensation voting |
| DSV | Draft sensation voting |
| MTCV | Mean thermal comfort vote |
| MTSV | Mean temperature sensation vote |
| MHSV | Mean humidity sensation vote |
| MDSV | Mean wind sensation vote |
| SVF | Sky view factor |
| MRT | Mean radiation temperature |
Appendix A
| Label | Name | Building Height in Stories | Average building Height in Metres | Building Density | Floor Area Ratio | Year of Completed Construction | Characteristics |
| a | Oriental Hawaii Villa | 3, 4 | 8.4 | 21% | 0.63 | 2003 | Most of the buildings are townhouses and single-family villas. The planning takes the water system as the centre and arranges the driveway around the residential area. Greening is uneven and the ground is hard. |
| Investigation sample point | 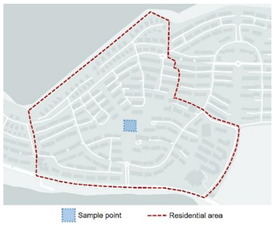 | ||||||
| Label | Name | Building Height in Stories | Average Building Height in Metres | Building Density | Floor Area Ratio | Year of Completed Construction | Characteristics |
| b | Gang Hua Village | 6 | 16.8 | 33% | 1.98 | 1992 | Housing for senior industrial workers. There are many tall evergreen trees and the space under the forest is covered with bare, hard ground. Lack of assisted living facilities. some areas have benches, pavilions, and newsstands. |
| Investigation sample point | 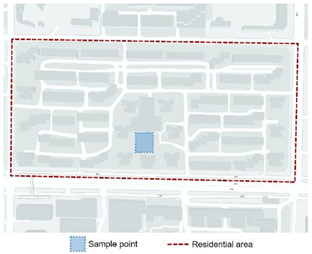 | ||||||
| Label | Name | Building Height in Stories | Average Building Height in Metres | Building Density | Floor Area Ratio | Year of Completed Construction | Characteristics |
| c | Zhang Jia Wan Community | 6, 8, 11, 18 | 22.8 | 24% | 2.5 | 1994 | Affordable housing. Many tall, evergreen trees and equipped with flower beds, shrubs, etc. Cool in summer and lack of sunshine in winter. Equipped with fitness facilities, benches, pavilions, etc. |
| Investigation sample point |  | ||||||
| Label | Name | Building Height in Stories | Average Building Height in Metres | Building Density | Floor Area Ratio | Year of Completed Construction | Characteristics |
| d | Central Garden Residential Area | 6, 8, 17 | 23.4 | 32% | 2.1 | 2003 | A pleasant living environment with a central green space and scattered arrangements of trees, shrubs, and grasslands. Walking trails in the forest. Equipped with day-care centres, shopping malls, and swimming pools. |
| Investigation sample point | 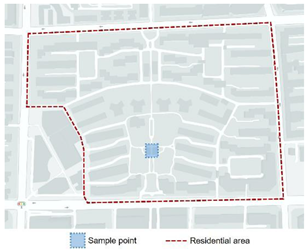 | ||||||
| Label | Name | Building Height in Stories | Average Building Height in Metres | Building Density | Floor Area Ratio | Year of Completed Construction | Characteristics |
| e | Ban Qiao Community | 3 | 8.4 | 42% | 1.23 | 2002 | Rebuilt houses arranged in rows with narrow spacing. Lack of greening and public activity spaces while the ground is hard pavement. |
| Investigation sample point | 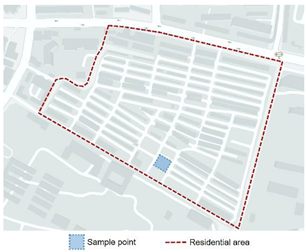 | ||||||
| Label | Name | Building Height in Stories | Average Building Height in Metres | Building Density | Floor Area Ratio | Year of Completed Construction | Characteristics |
| f | Hong Jing Garden Villa | 2, 3 | 9.0 | 18% | 0.55 | 1995 | Most of the buildings are single-family houses and townhouses of uniform height. Trees and shrubs are distributed at different levels between houses, but there is a lack of public spots for outdoor activities. |
| Investigation sample point | 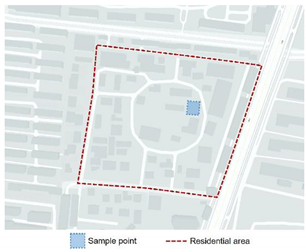 | ||||||
| Label | Name | Building Height in Stories | Average Building Height in Metres | Building Density | Floor Area Ratio | Year of Completed Construction | Characteristics |
| g | Vanke City Garden Residential Area | 4, 6, 7, 10 | 21.9 | 24% | 1.3 | 2007 | The community takes commerce as its centre and the road as the basis for configuring residential groups. The greening is evenly distributed with sidewalks under the trees, benches along the road, and facilities for the disabled. |
| Investigation sample point | 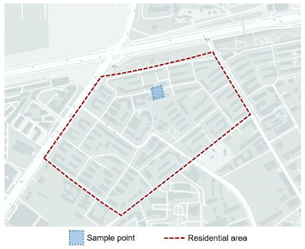 | ||||||
| Label | Name | Building Height in Stories | Average Building Height in Metres | Building Density | Floor Area Ratio | Year of Completed Construction | Characteristics |
| h | Vanke Jing Yuan Residential Area | 34 | 90.0 | 25% | 4.57 | 2015 | Super high-rise residential buildings. Vegetation is mostly trees around the house and the central lawn. The open square is equipped with fitness equipment and benches. There are no driveways and the ground is paved with rubber runway and floor tiles. |
| Investigation sample point | 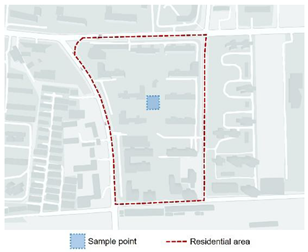 | ||||||
| Label | Name | Building Height in Stories | Average Building Height in Metres | Building Density | Floor Area Ratio | Year of Completed Construction | Characteristics |
| i | Fo Zu Ling Community | 6, 12 | 22.1 | 21% | 1.57 | 2008 | The buildings are evenly distributed. The overall greening is good. The parking area is paved with permeable grass bricks. The central green space is equipped with children’s facilities, pavilions, benches, etc. |
| Investigation sample point | 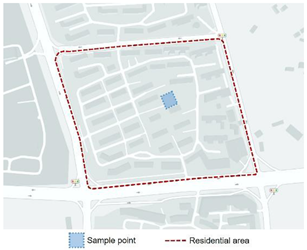 | ||||||
References
- Zhang, J.; Yu, Z.; Cheng, Y.; Chen, C.; Wan, Y.; Zhao, B.; Vejre, H. Evaluating the disparities in urban green space provision in communities with diverse built environments: The case of a rapidly urbanizing Chinese city. Build. Environ. 2020, 183, 107170. [Google Scholar] [CrossRef]
- Chen, X.; Xu, Y.; Yang, J.; Wu, Z.; Zhu, H. Remote sensing of urban thermal environments within local climate zones: A case study of two high-density subtropical Chinese cities. Urban Clim. 2020, 31, 100568. [Google Scholar] [CrossRef]
- Xiong, Y.; Liu, J.; Kim, J. Understanding differences in thermal comfort between urban and rural residents in hot summer and cold winter climate. Build. Environ. 2019, 165, 106393. [Google Scholar] [CrossRef]
- Wu, Z.; Chen, L. Optimizing the spatial arrangement of trees in residential neighborhoods for better cooling effects: Integrating modeling with in-situ measurements. Landsc. Urban Plan. 2017, 167, 463–472. [Google Scholar] [CrossRef]
- Zhang, L.; Zhan, Q.; Lan, Y. Effects of the tree distribution and species on outdoor environment conditions in a hot summer and cold winter zone: A case study in Wuhan residential quarters. Build. Environ. 2018, 130, 27–39. [Google Scholar] [CrossRef]
- Caniato, M.; Gasparella, A. Discriminating People’s Attitude towards Building Physical Features in Sustainable and Conventional Buildings. Energies 2019, 12, 1429. [Google Scholar] [CrossRef] [Green Version]
- Caniato, M.; Bettarello, F.; Ferluga, A.; Marsich, L.; Schmid, C.; Fausti, P. Thermal and acoustic performance expectations on timber buildings. Build. Acoust. 2017, 24, 219–237. [Google Scholar] [CrossRef]
- Peng, Y.; Feng, T.; Timmermans, H. A path analysis of outdoor comfort in urban public spaces. Build. Environ. 2019, 148, 459–467. [Google Scholar] [CrossRef]
- Golasi, I.; Salata, F.; Vollaro, E.D.L.; Coppi, M.; Vollaro, A.D.L. Thermal Perception in the Mediterranean Area: Comparing the Mediterranean Outdoor Comfort Index (MOCI) to Other Outdoor Thermal Comfort Indices. Energies 2016, 9, 550. [Google Scholar] [CrossRef] [Green Version]
- Deevi, B.; Chundeli, F.A. Quantitative outdoor thermal comfort assessment of street: A case in a warm and humid climate of India. Urban Clim. 2020, 34, 100718. [Google Scholar] [CrossRef]
- Li, Y.; Rezgui, Y.; Guerriero, A.; Zhang, X.; Han, M.; Kubicki, S.; Yan, D. Development of an adaptation table to enhance the accuracy of the predicted mean vote model. Build. Environ. 2020, 168, 106504. [Google Scholar] [CrossRef]
- Du, H.; Yang, C. Re-visitation of the thermal environment evaluation index standard effective temperature (SET*) based on the two-node model. Sustain. Cities Soc. 2020, 53, 101899. [Google Scholar] [CrossRef]
- Wang, C.; Zhan, W.; Liu, Z.; Li, J.; Li, L.; Fu, P.; Huang, F.; Lai, J.; Chen, J.; Hong, F.; et al. Satellite-based mapping of the Universal Thermal Climate Index over the Yangtze River Delta urban agglomeration. J. Clean. Prod. 2020, 277, 123830. [Google Scholar] [CrossRef]
- Lai, P.-C.; Choi, C.C.; Wong, P.; Thach, T.Q.; Wong, M.S.; Cheng, W.; Krämer, A.; Wong, C.-M. Spatial analytical methods for deriving a historical map of physiological equivalent temperature of Hong Kong. Build. Environ. 2016, 99, 22–28. [Google Scholar] [CrossRef] [Green Version]
- Feng, X.; He, C.; Fang, Z.; Ji, Z. Present Research on Outdoor Thermal Comfort. Build. Sci. 2017, 33, 152–158. [Google Scholar] [CrossRef]
- Fang, Z.; Lin, Z.; Mak, C.M.; Niu, J.; Tse, K.-T. Investigation into sensitivities of factors in outdoor thermal comfort indices. Build. Environ. 2018, 128, 129–142. [Google Scholar] [CrossRef]
- Salata, F.; Golasi, I.; Vollaro, R.D.L.; Vollaro, A.D.L. Outdoor thermal comfort in the Mediterranean area. A transversal study in Rome, Italy. Build. Environ. 2016, 96, 46–61. [Google Scholar] [CrossRef]
- Nazarian, N.; Fan, J.; Sin, T.; Norford, L.; Kleissl, J. Predicting outdoor thermal comfort in urban environments: A 3D numerical model for standard effective temperature. Urban Clim. 2017, 20, 251–267. [Google Scholar] [CrossRef]
- Taleghani, M.; Kleerekoper, L.; Tenpierik, M.; van den Dobbelsteen, A. Outdoor thermal comfort within five different urban forms in the Netherlands. Build. Environ. 2015, 83, 65–78. [Google Scholar] [CrossRef]
- Du, H.; Cai, Y.; Zhou, F.; Jiang, H.; Jiang, W.; Xu, Y. Urban blue-green space planning based on thermal environment simulation: A case study of Shanghai, China. Ecol. Indic. 2019, 106, 105501. [Google Scholar] [CrossRef]
- Zhao, Q.; Sailor, D.J.; Wentz, E.A. Impact of tree locations and arrangements on outdoor microclimates and human thermal comfort in an urban residential environment. Urban For. Urban Green. 2018, 32, 81–91. [Google Scholar] [CrossRef] [Green Version]
- Xu, M.; Hong, B.; Mi, J.; Yan, S. Outdoor thermal comfort in an urban park during winter in cold regions of China. Sustain. Cities Soc. 2018, 43, 208–220. [Google Scholar] [CrossRef]
- Xue, F.; Gou, Z.; Lau, S.S.Y. Green open space in high-dense Asian cities: Site configurations, microclimates and users’ perceptions. Sustain. Cities Soc. 2017, 34, 114–125. [Google Scholar] [CrossRef]
- Amindeldar, S.; Heidari, S.; Khalili, M. The effect of personal and microclimatic variables on outdoor thermal comfort: A field study in Tehran in cold season. Sustain. Cities Soc. 2017, 32, 153–159. [Google Scholar] [CrossRef]
- Zhang, L.; Deng, Z.; Liang, L.; Zhang, Y.; Meng, Q.; Wang, J.; Santamouris, M. Thermal behavior of a vertical green facade and its impact on the indoor and outdoor thermal environment. Energy Build. 2019, 204, 109502. [Google Scholar] [CrossRef]
- Niu, J.; Hong, B.; Geng, Y.; Mi, J.; He, J. Summertime physiological and thermal responses among activity levels in campus outdoor spaces in a humid subtropical city. Sci. Total. Environ. 2020, 728, 138757. [Google Scholar] [CrossRef]
- Watanabe, S.; Nagano, K.; Ishii, J.; Horikoshi, T. Evaluation of outdoor thermal comfort in sunlight, building shade, and pergola shade during summer in a humid subtropical region. Build. Environ. 2014, 82, 556–565. [Google Scholar] [CrossRef]
- Ministry of Housing and Urban-Rural Development of the People’s Republic of China. Code for Thermal Design of Civil Building GB 50176-2016; China Architecture & Building Press: Beijing, China, 2016. [Google Scholar]
- Ye, X.; Chen, F.; Hou, Z. The Effect of Temperature on Thermal Sensation: A Case Study in Wuhan City, China. Procedia Eng. 2015, 121, 2149–2156. [Google Scholar] [CrossRef] [Green Version]
- Ministry of Housing and Urban-Rural Development of the People’s Republic of China. Standard for Urban Residential Area Planning and Design GB 50180-2018; China Architecture & Building Press: Beijing, China, 2018. [Google Scholar]
- Hu, W. Planning Principle and Design Method of Residential Area; China Architecture & Building Press: Beijing, China, 2007; pp. 35–41. [Google Scholar]
- Djekic, J.; Djukic, A.; Vukmirovic, M.; Djekic, P.; Brankovic, M.D. Thermal comfort of pedestrian spaces and the influence of pavement materials on warming up during summer. Energy Build. 2018, 159, 474–485. [Google Scholar] [CrossRef] [Green Version]
- Chen, L.; Ng, E.Y.Y. Outdoor thermal comfort and outdoor activities: A review of research in the past decade. Cities 2012, 29, 118–125. [Google Scholar] [CrossRef]
- Shooshtarian, S.; Lam, C.K.C.; Kenawy, I. Outdoor thermal comfort assessment: A review on thermal comfort research in Australia. Build. Environ. 2020, 177, 106917. [Google Scholar] [CrossRef]
- ASHRAE. ANSI/ASHRAE Standard 55-2017. Thermal Environmental Conditions for Human Occupancy; ASHRAE: Atlanta, GA, USA, 2017. [Google Scholar]
- Xi, T.; Li, Q.; Mochida, A.; Meng, Q. Study on the outdoor thermal environment and thermal comfort around campus clusters in subtropical urban areas. Build. Environ. 2012, 52, 162–170. [Google Scholar] [CrossRef]
- Šebjan, U.; Tominc, P. Impact of support of teacher and compatibility with needs of study on usefulness of SPSS by students. Comput. Hum. Behav. 2015, 53, 354–365. [Google Scholar] [CrossRef]
- Schober, P.; Boer, C.; Schwarte, L.A. Correlation Coefficients: Appropriate use and interpretation. Anesth. Analg. 2018, 126, 1763–1768. [Google Scholar] [CrossRef]
- Gao, J. Comparative Analysis and Application of Statistical Methods for Librarians’ Evaluation. Res. Libr. Sci. 2019, 9–14. [Google Scholar] [CrossRef]
- Ji, L.; Xi, Z.; Chen, Z.; Liu, Y. Study on climatic characteristics and assessment methods of high tempera-ture weather in Jilin province. J. Meteorol. Environ. 2020, 36, 49–54. [Google Scholar] [CrossRef]
- Feng, K. Spatial and temporal variation characteristics of cold weather days with different grades in China from 1961 to 2017. Resour. Environ. Yangtze Basin 2020, 29, 150–163. [Google Scholar] [CrossRef]
- Huang, Z.; Gou, Z.; Cheng, B. An investigation of outdoor thermal environments with different ground surfaces in the hot summer-cold winter climate region. J. Build. Eng. 2020, 27, 100994. [Google Scholar] [CrossRef]
- Mao, Y. Study on Climate Adaptability of Human Beings to Thermal Comfort in China. Ph.D. Thesis, Xi’an University of Architecture and Technology, Xi’an, China, 2006. [Google Scholar] [CrossRef]
- Chen, F. Architecture and Climate—Wind Circumstance in Hot-Summer and Cold-Winter. Ph.D. Thesis, Tongji University, Shanghai, China, 2007. [Google Scholar] [CrossRef]
- Abdollahzadeh, N.; Biloria, N. Outdoor thermal comfort: Analyzing the impact of urban configurations on the thermal performance of street canyons in the humid subtropical climate of Sydney. Front. Arch. Res. 2021, 10, 394–409. [Google Scholar] [CrossRef]
- Krüger, E.; Minella, F.; Rasia, F. Impact of urban geometry on outdoor thermal comfort and air quality from field measurements in Curitiba, Brazil. Build. Environ. 2011, 46, 621–634. [Google Scholar] [CrossRef]
- Kubota, T.; Miura, M.; Tominaga, Y.; Mochida, A. Wind tunnel tests on the relationship between building density and pedestrian-level wind velocity: Development of guidelines for realizing acceptable wind environment in residential neighborhoods. Build. Environ. 2008, 43, 1699–1708. [Google Scholar] [CrossRef]
- Huang, Z.; Cheng, B.; Gou, Z.; Zhang, F. Outdoor thermal comfort and adaptive behaviors in a university campus in China’s hot summer-cold winter climate region. Build. Environ. 2019, 165, 106414. [Google Scholar] [CrossRef]


| Low-Rise | Middle-High-Rise | High-Density | |||
|---|---|---|---|---|---|
| Label | Name | Label | Name | Label | Name |
| a | Oriental Hawaii Villa | b | Gang Hua Village | c | Zhang Jia Wan Community |
| e | Ban Qiao Community | g | Vanke City Garden Residential Area | d | Central Garden Residential Area |
| f | Hong Jing Garden Villa | i | Fo Zu Ling Community | h | Vanke Jing Yuan Residential Area |
| Low-Density | Medium-Density | High-Density | |||
|---|---|---|---|---|---|
| Label | Name | Label | Name | Label | Name |
| a | Oriental Hawaii Villa | c | Zhang Jia Wan Community | b | Gang Hua Village |
| f | Hong Jing Garden Villa | g | Vanke City Garden Residential Area | d | Central Garden Residential Area |
| i | Fo Zu Ling Community | h | Vanke Jing Yuan Residential Area | e | Ban Qiao Community |
| Low Environmental Quality | Medium Environmental Quality | High Environmental Quality | |||
|---|---|---|---|---|---|
| Label | Name | Label | Name | Label | Name |
| b | Gang Hua Village | a | Oriental Hawaii Villa | c | Zhang Jia Wan Community |
| e | Ban Qiao Community | d | Central Garden Residential Area | g | Vanke City Garden Residential Area |
| i | Fo Zu Ling Community | f | Hong Jing Garden Villa | h | Vanke Jing Yuan Residential Area |
| Thermal Environment Survey |
|---|
| Gender: Age: |
| (1) How long have you lived in the community? |
| ☐ Less than one year ☐ One to three years ☐ More than three years |
| (2) How often do you visit the outdoor community spaces? |
| ☐ Daily ☐ Several times a week ☐ Several times a month ☐ Usually do not visit |
| (3) Where do you like to go? Inside or outside the community? |
| ☐ Inside the community ☐ Shopping malls around the community ☐ Gardens around the community |
| (4) What do you do outdoors? |
| ☐ Running ☐ Walking the dog ☐ Playing chess ☐ Chatting ☐ Dancing ☐ Find solitude ☐ Swimming ☐ Fitness ☐ Playing with children ☐ Other choices_______ |
| (5) Where do you prefer to exercise or rest? |
| ☐ Flower bed ☐ Water’s edge ☐ Indoor activity centre ☐ Open square ☐ Under a tree ☐ Raised platforms ☐ Lawn ☐ Other choices_______ |
| (6) (TCV) Do you feel comfortable in the community? |
 |
| (7) (TSV) How do you feel about the temperature? |
 |
| (8) (HSV) How do you feel about the humidity? |
 |
| (9) (DSV) How do you feel about the wind speed? |
 |
| Green Area | Water Area | Area with Impervious Paving | |||
|---|---|---|---|---|---|
| Rho of Spearman | MTCV | Correlation coefficient | 0.812 * | −0.593 | −0.762 |
| Significance (double-tailed) | 0.008 | 0.092 | 0.017 | ||
| MTSV | Correlation coefficient | −0.857 * | 0.309 | 0.857 * | |
| Significance (double-tailed) | 0.003 | 0.418 | 0.003 | ||
| MHSV | Correlation coefficient | 0.586 | 0.091 | −0.653 | |
| Significance (double-tailed) | 0.097 | 0.815 | 0.057 | ||
| MDSV | Correlation coefficient | 0.479 | −0.653 | −0.479 | |
| Significance (double-tailed) | 0.192 | 0.056 | 0.192 | ||
Publisher’s Note: MDPI stays neutral with regard to jurisdictional claims in published maps and institutional affiliations. |
© 2021 by the authors. Licensee MDPI, Basel, Switzerland. This article is an open access article distributed under the terms and conditions of the Creative Commons Attribution (CC BY) license (https://creativecommons.org/licenses/by/4.0/).
Share and Cite
Li, K.; Xia, T.; Li, W. Evaluation of Subjective Feelings of Outdoor Thermal Comfort in Residential Areas: A Case Study of Wuhan. Buildings 2021, 11, 389. https://doi.org/10.3390/buildings11090389
Li K, Xia T, Li W. Evaluation of Subjective Feelings of Outdoor Thermal Comfort in Residential Areas: A Case Study of Wuhan. Buildings. 2021; 11(9):389. https://doi.org/10.3390/buildings11090389
Chicago/Turabian StyleLi, Kun, Tingting Xia, and Wenya Li. 2021. "Evaluation of Subjective Feelings of Outdoor Thermal Comfort in Residential Areas: A Case Study of Wuhan" Buildings 11, no. 9: 389. https://doi.org/10.3390/buildings11090389
APA StyleLi, K., Xia, T., & Li, W. (2021). Evaluation of Subjective Feelings of Outdoor Thermal Comfort in Residential Areas: A Case Study of Wuhan. Buildings, 11(9), 389. https://doi.org/10.3390/buildings11090389