
Identification of Critical Success Factors (CSFs) of BIM Software Selection: A Combined Approach of FCM and Fuzzy DEMATEL

Abstract
:1. Introduction
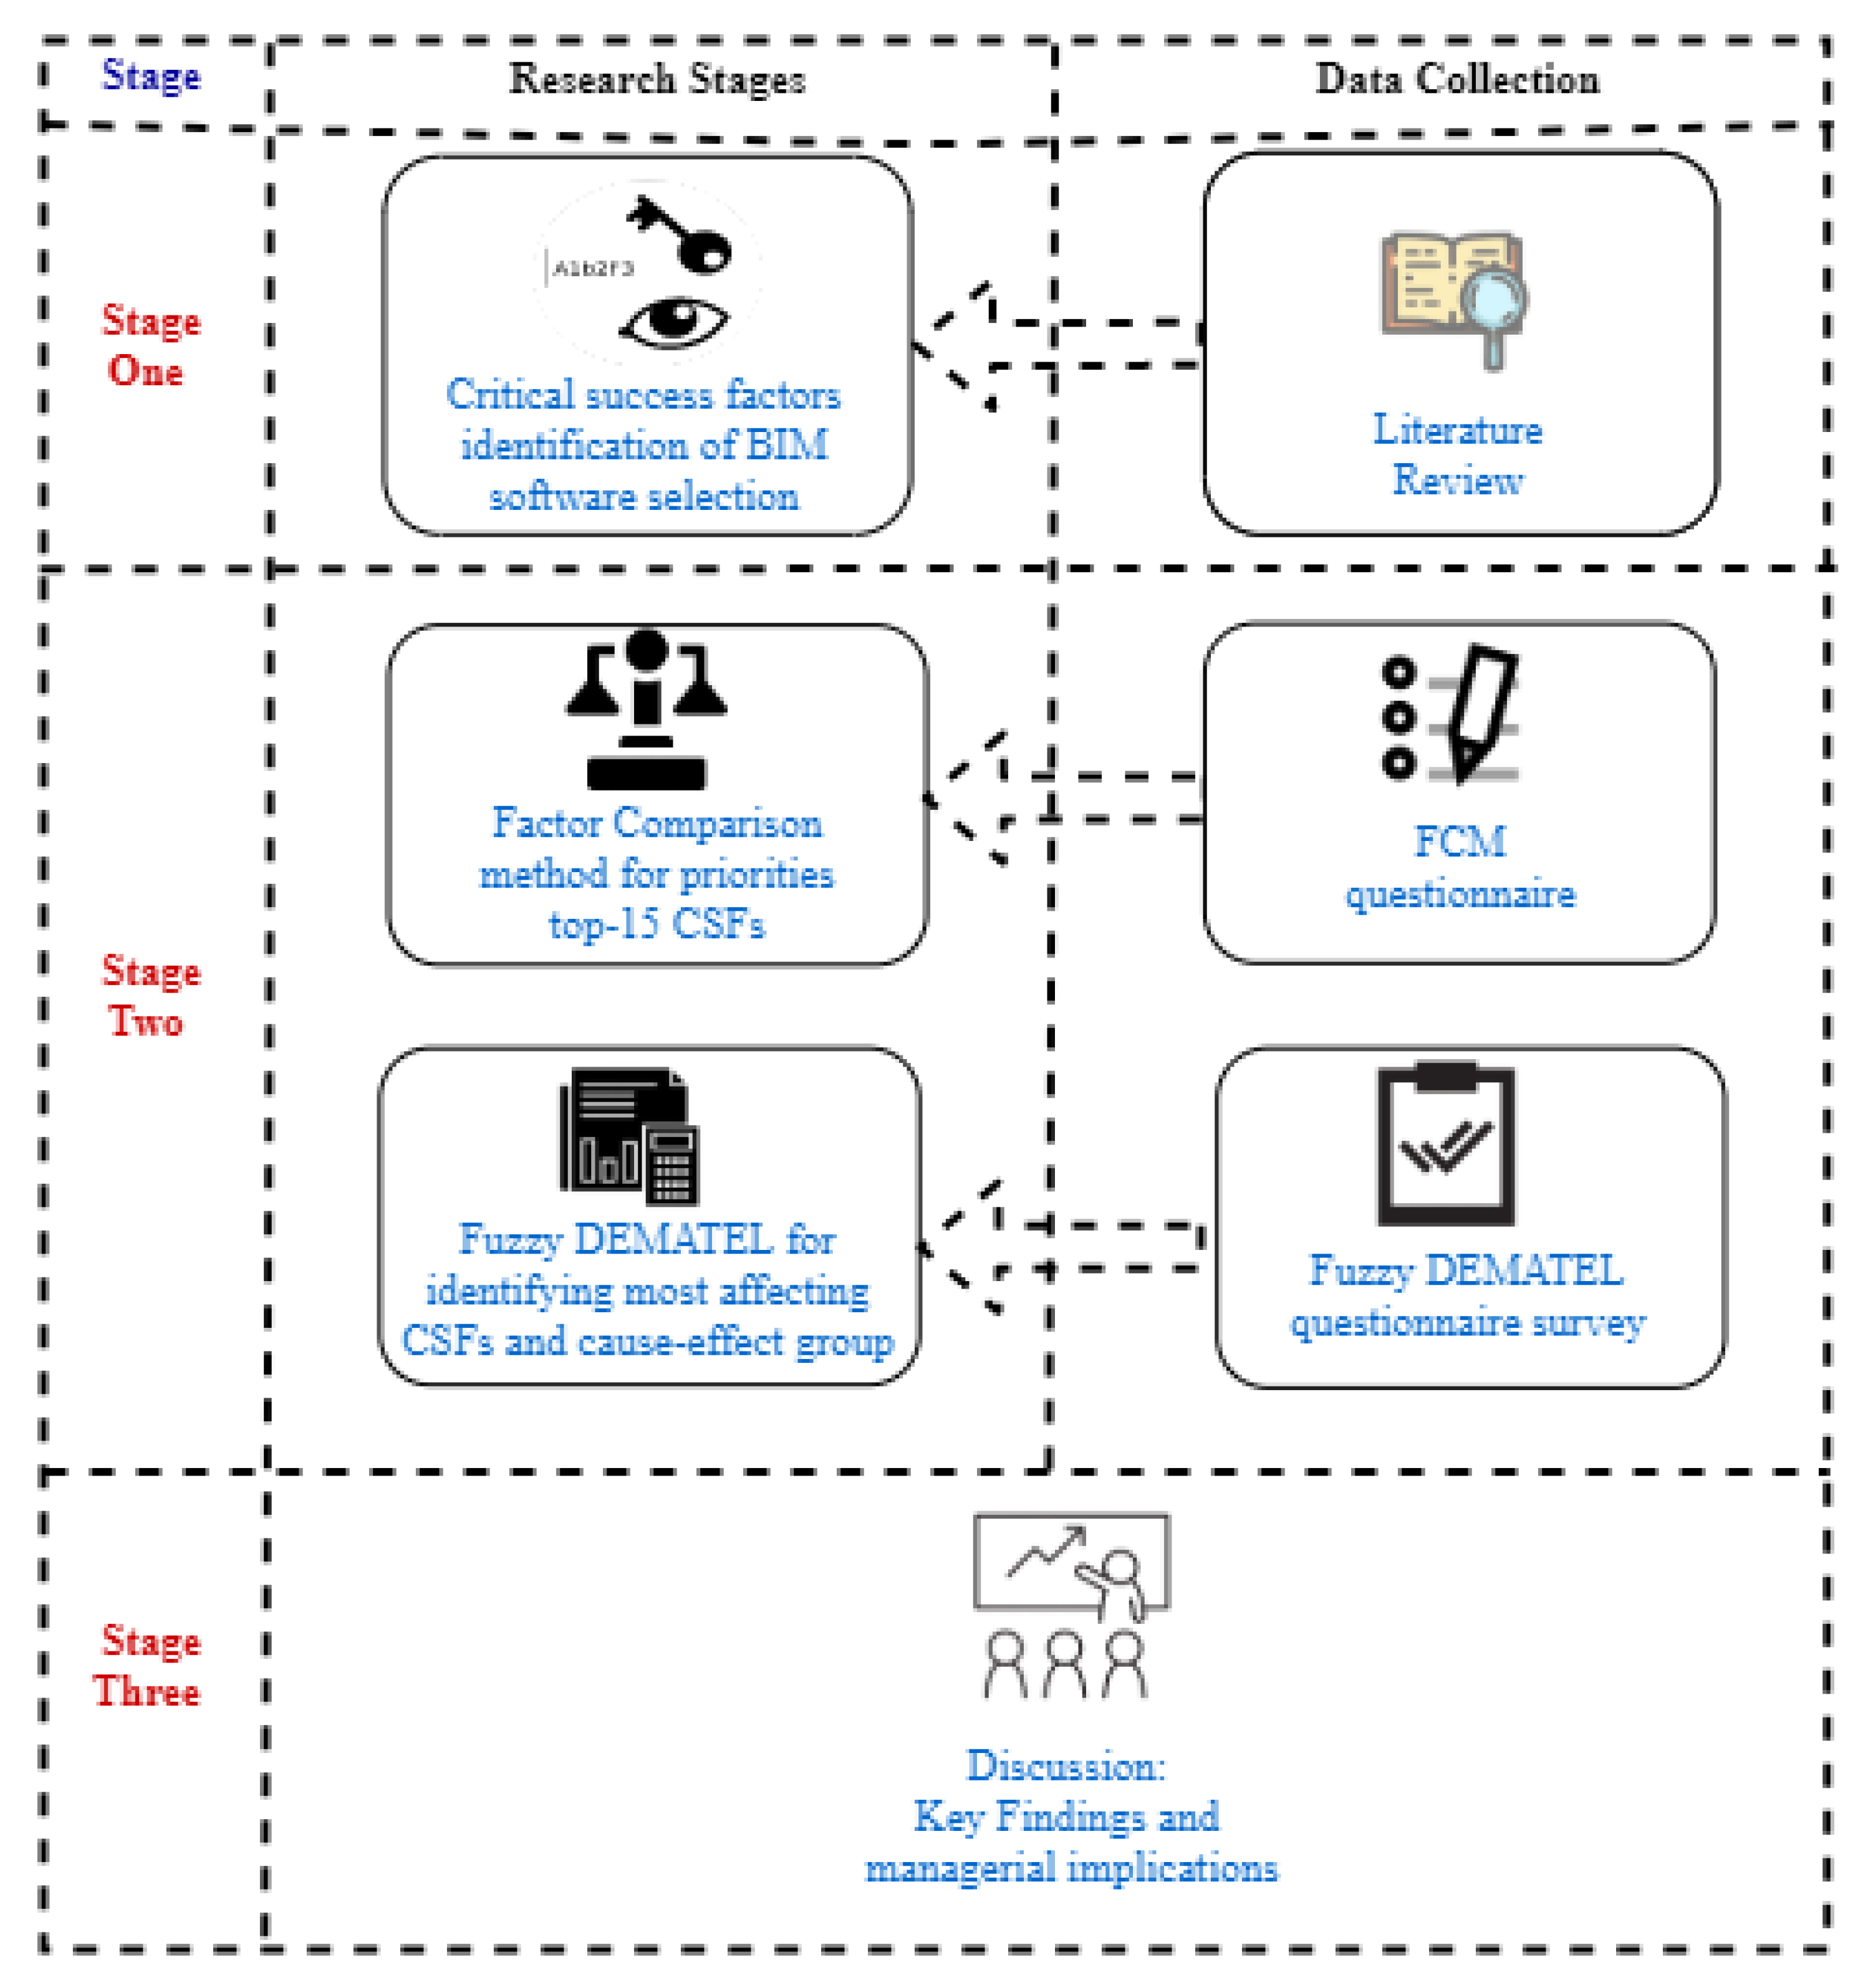
2. Research Methodology
2.1. Factors Identification through Literature Review
- Cost: Every organization needs to purchase the required BIM software considering the overall cost. There are many direct and indirect costs associated with the BIM software, which plays a key role in decision making, i.e., cost of license upgrades, cost of hardware upgrades, an initial investment in the software purchase and cost of implementation and training. This needs to be balanced by stakeholders who are economically benefited by the utilization of BIM in terms of enhanced productivity (improved cost, quality, and time).
- Management: The usage of BIM software affects several organizational aspects, such as organizational workflows, job descriptions, credential requirements, project delivery methods, contractual agreements, skills, and general knowledge requirements. Therefore, many important factors should be considered, such as BIM adoption policies, staff competencies, awareness of BIM, flexibility, and willingness to change the workflow & business model, co-operation and support from other stakeholders, supportive contractual framework, and training of the employees.
- Technical: With the swift progress of technology, BIM software have to be supplemented with desired technical attributes to address relevant issues for enhanced project performance in AEC. The technical aspects are important such as software functionality, interoperability, user-friendliness, BIM standards and regulations, data security and privacy protocols, potential capabilities of application integration/extension, accessibility of BIM software, capacity to handle large data, BIM objects/library, level of data management and compatibility with existing hardware.
- Vendor: Vendor characteristics can impact the BIM software selection process. The BIM software vendor acts as a key player in the BIM software demand and supply chain. New updated/upgraded version releases of software at regular time intervals play a vital role in improving usability. Factors such as software popularity and reputation, technical service support, R&D capabilities, documentation, and training support have considerable influence in the decision-making process.
2.2. Data Collection
2.3. Data Analysis Techniques
2.3.1. Factor Comparison Method (FCM)
2.3.2. Fuzzy DEMATEL Method
DEMATEL Method
- Pairwise comparisons are determined into five levels by quantifying the linguistic assessments of expert’s response evaluation, where “No influence”, “Low influence”, “Medium influence”, “High influence”, and “Very High Influence” are denoted by 1, 2, 3, 4, and 5, respectively.
- The direct relation matrix T is developed. As illustrated in Equation (1), T is an n × n matrix generated by a pairwise relationship in reference to influence and the direction between success factors.
- 3.
- The normalized direct-relation matrix can be generated using Equation (2), where Y = [yij] n × n and 0 ≤ yij ≤ 1. Moreover, u can be derived using Equation (3). All principal diagonal members in matrix Y are set to zero.
- 4.
- The total relation matrix is generated on the basis of a normalized direct-relation matrix by using Equation (4), where I is n × n identity matrix. The member wij denotes the indirect influence effect that factor i have on factor j, so matrix W can show the total relationship between each pair of system factors.
- 5.
- In this step, wij (i, j = 1, 2,...,n) is considered to be the members of the total matrix W. Subsequently, a summation of rows and columns is carried out from the total relation matrix. Hence, rows and columns are represented as Bi and Qj, respectively.
- 6.
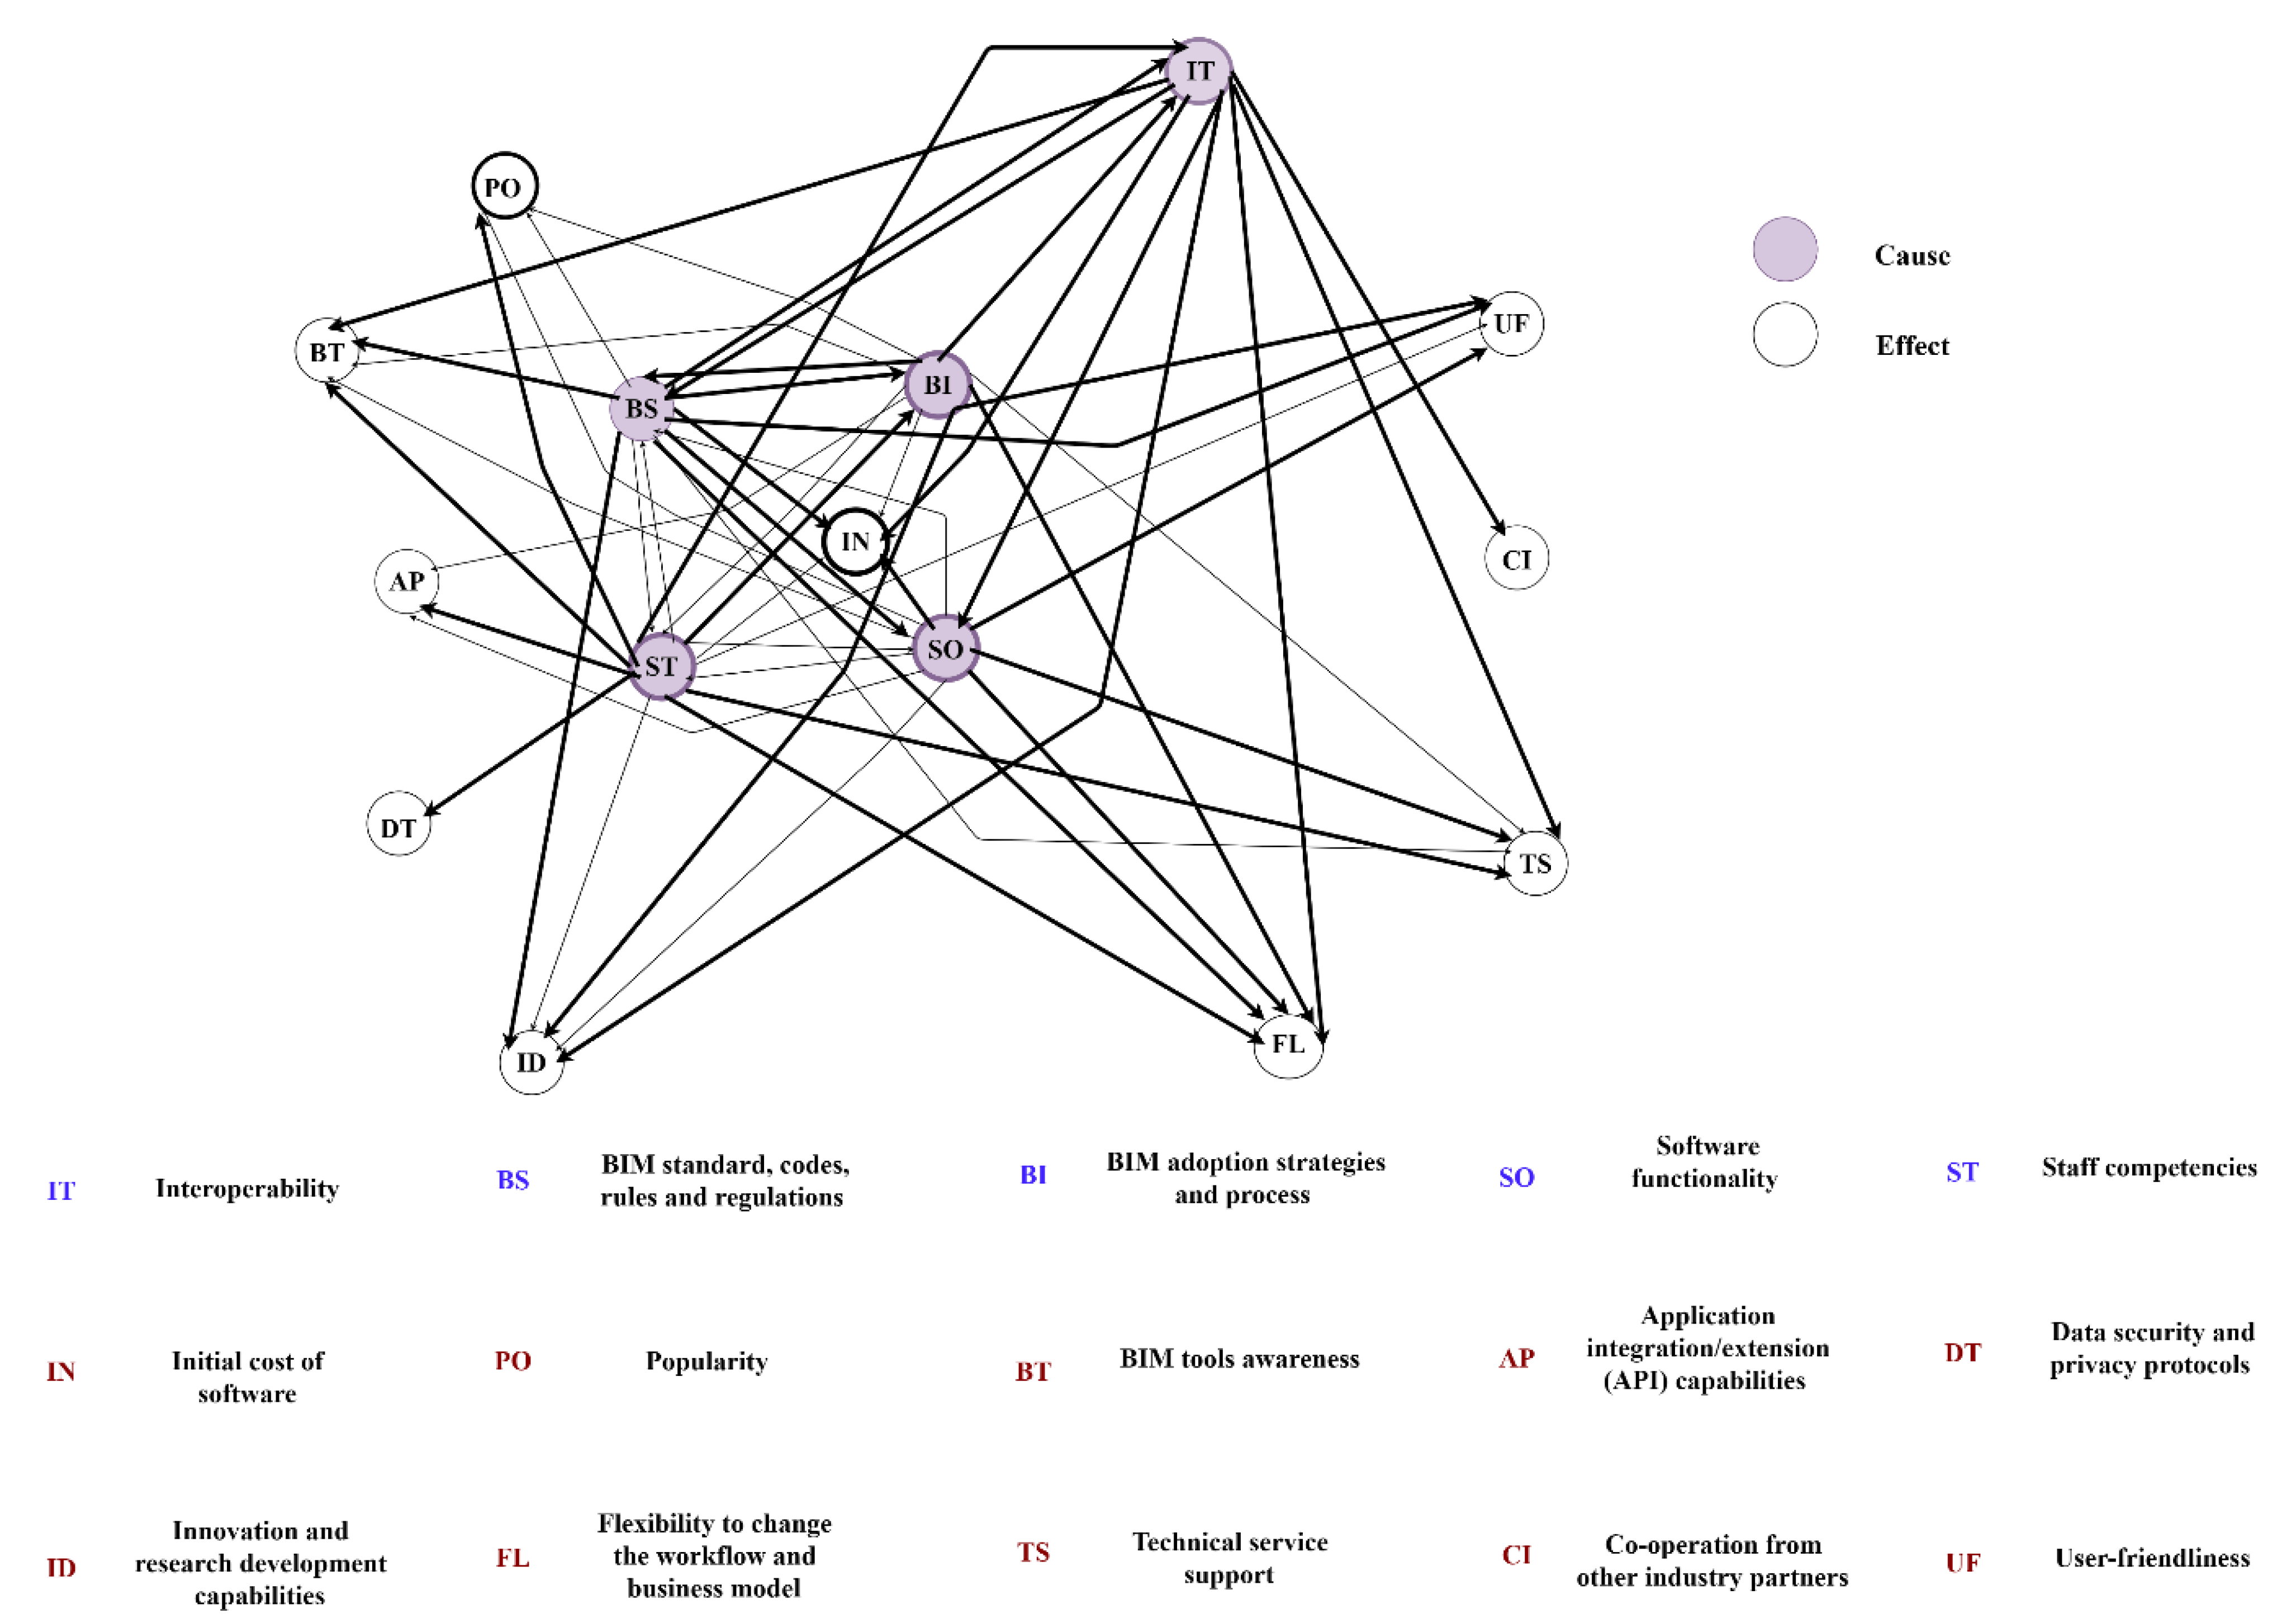
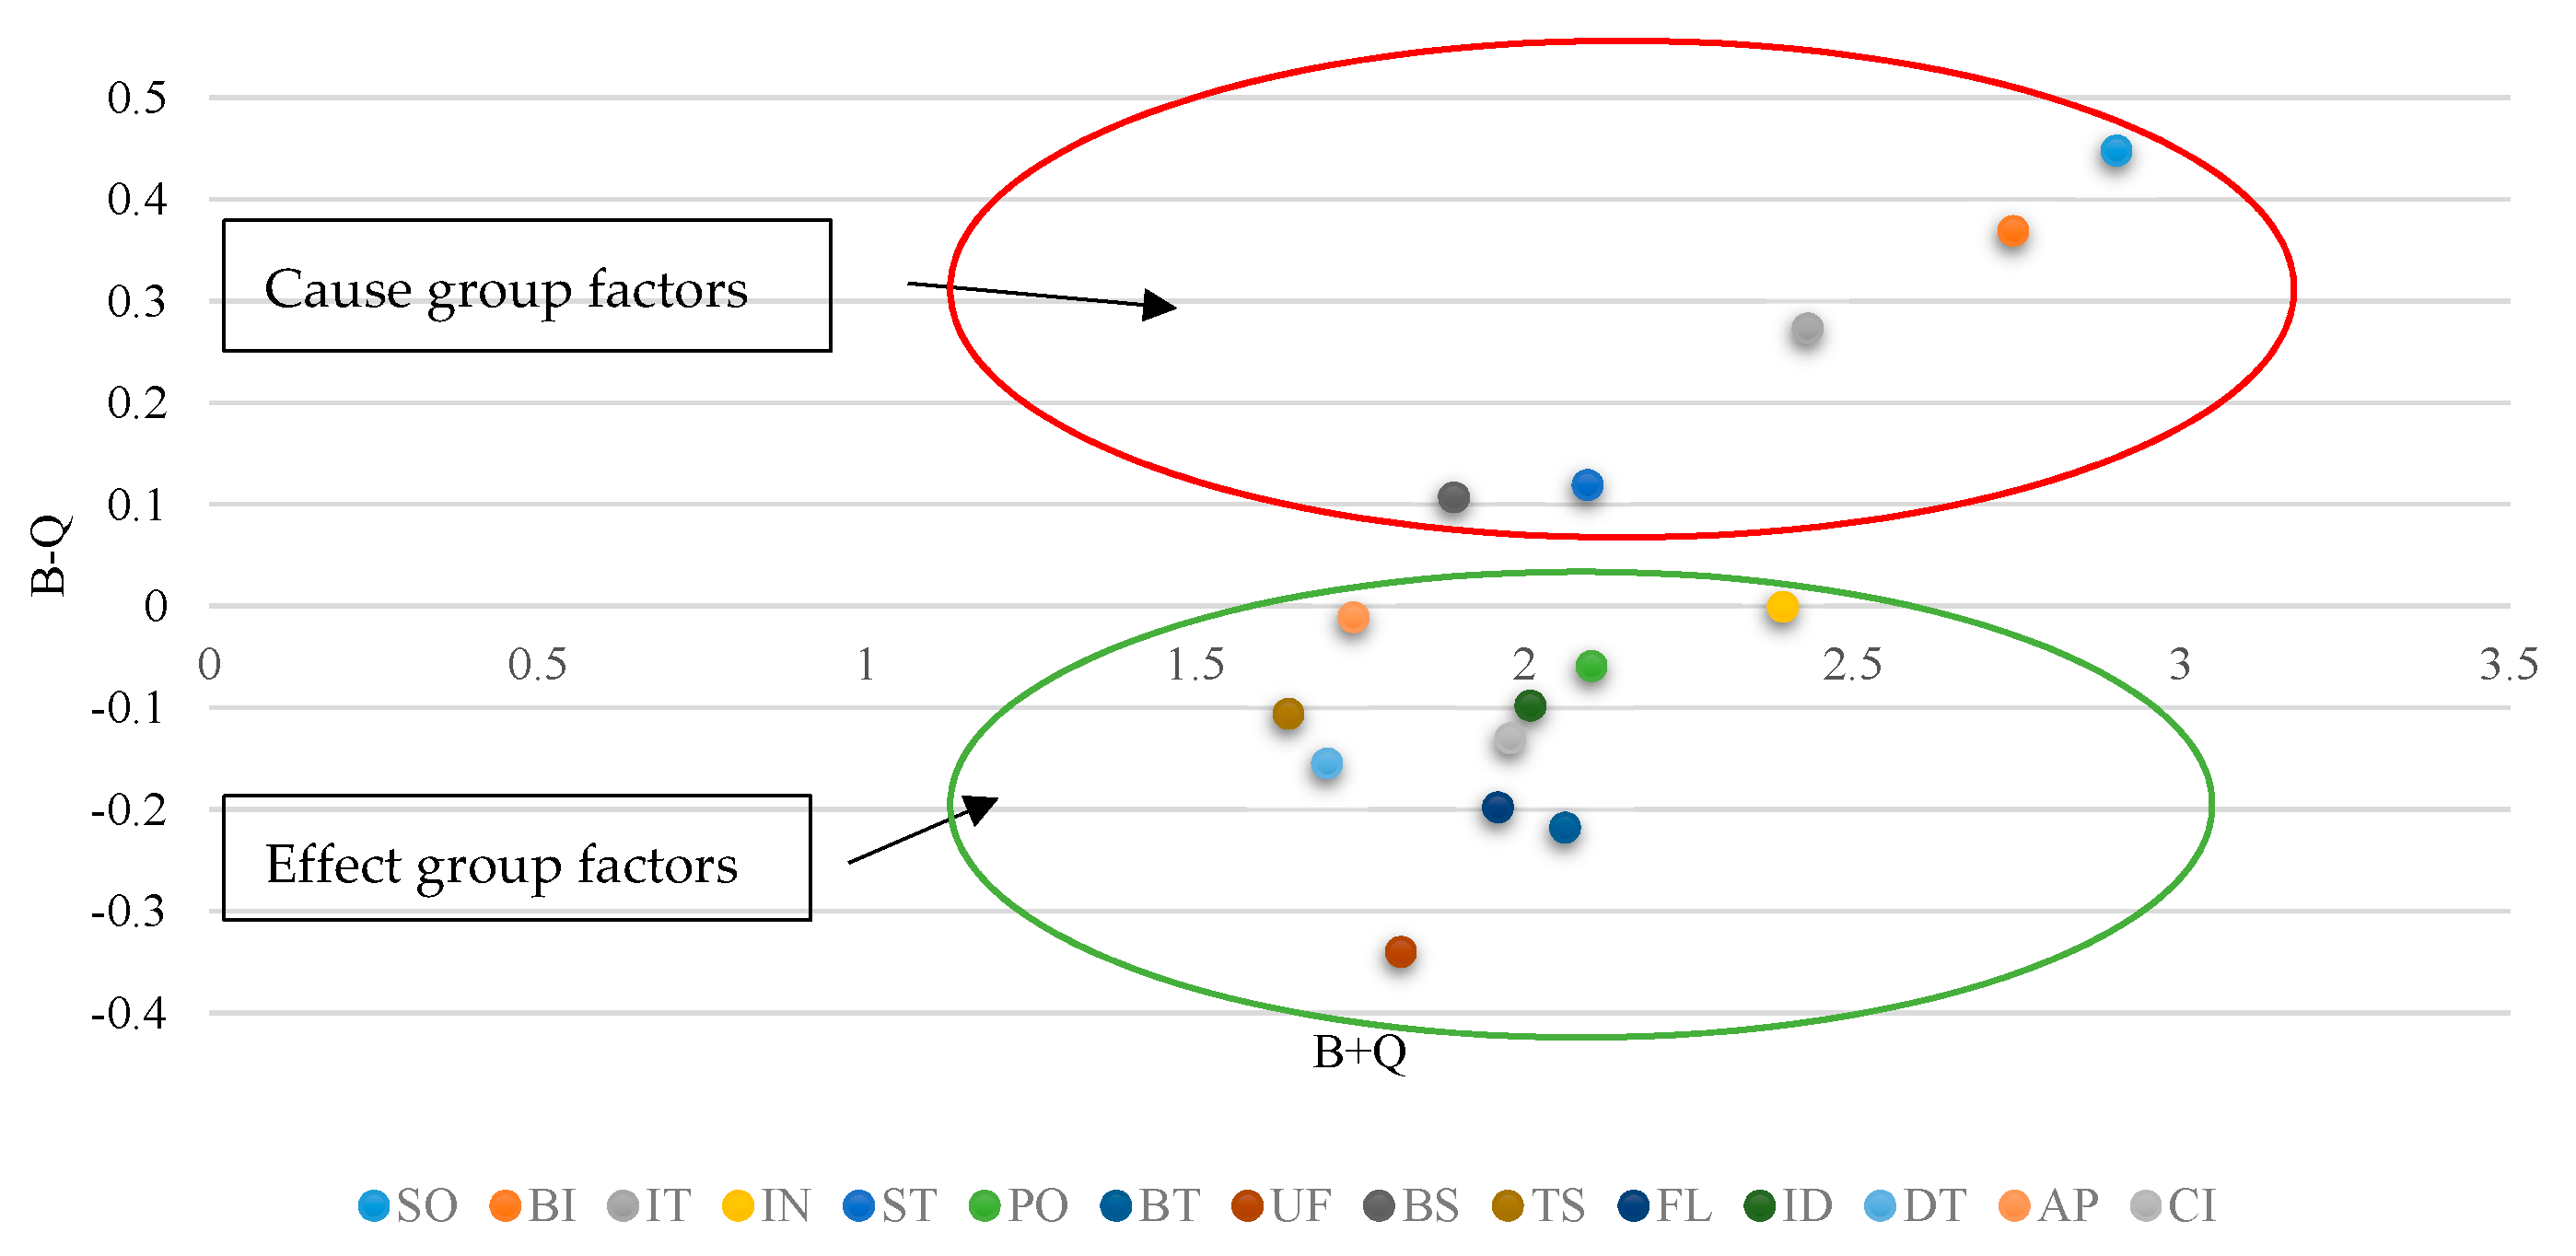
- In the last step, the cause-effect relationship graph is developed by mapping the ordered pairwise dataset of (B + Q, B − Q), where the horizontal axis is generated by summation of Bk and Qk, and the vertical axis is obtained by subtracting Qk from Bk. The horizontal axis “Prominence” represents the significance of the factor, and the vertical axis depicts “Relation”. Here, the positive value of (Bk − Qk) brings factors into the cause group, whereas the negative value of (Bk − Qk) turns into the effect group. Thus, the complex relationship between factors can be visualized with a casual cause-effect relationship graph.
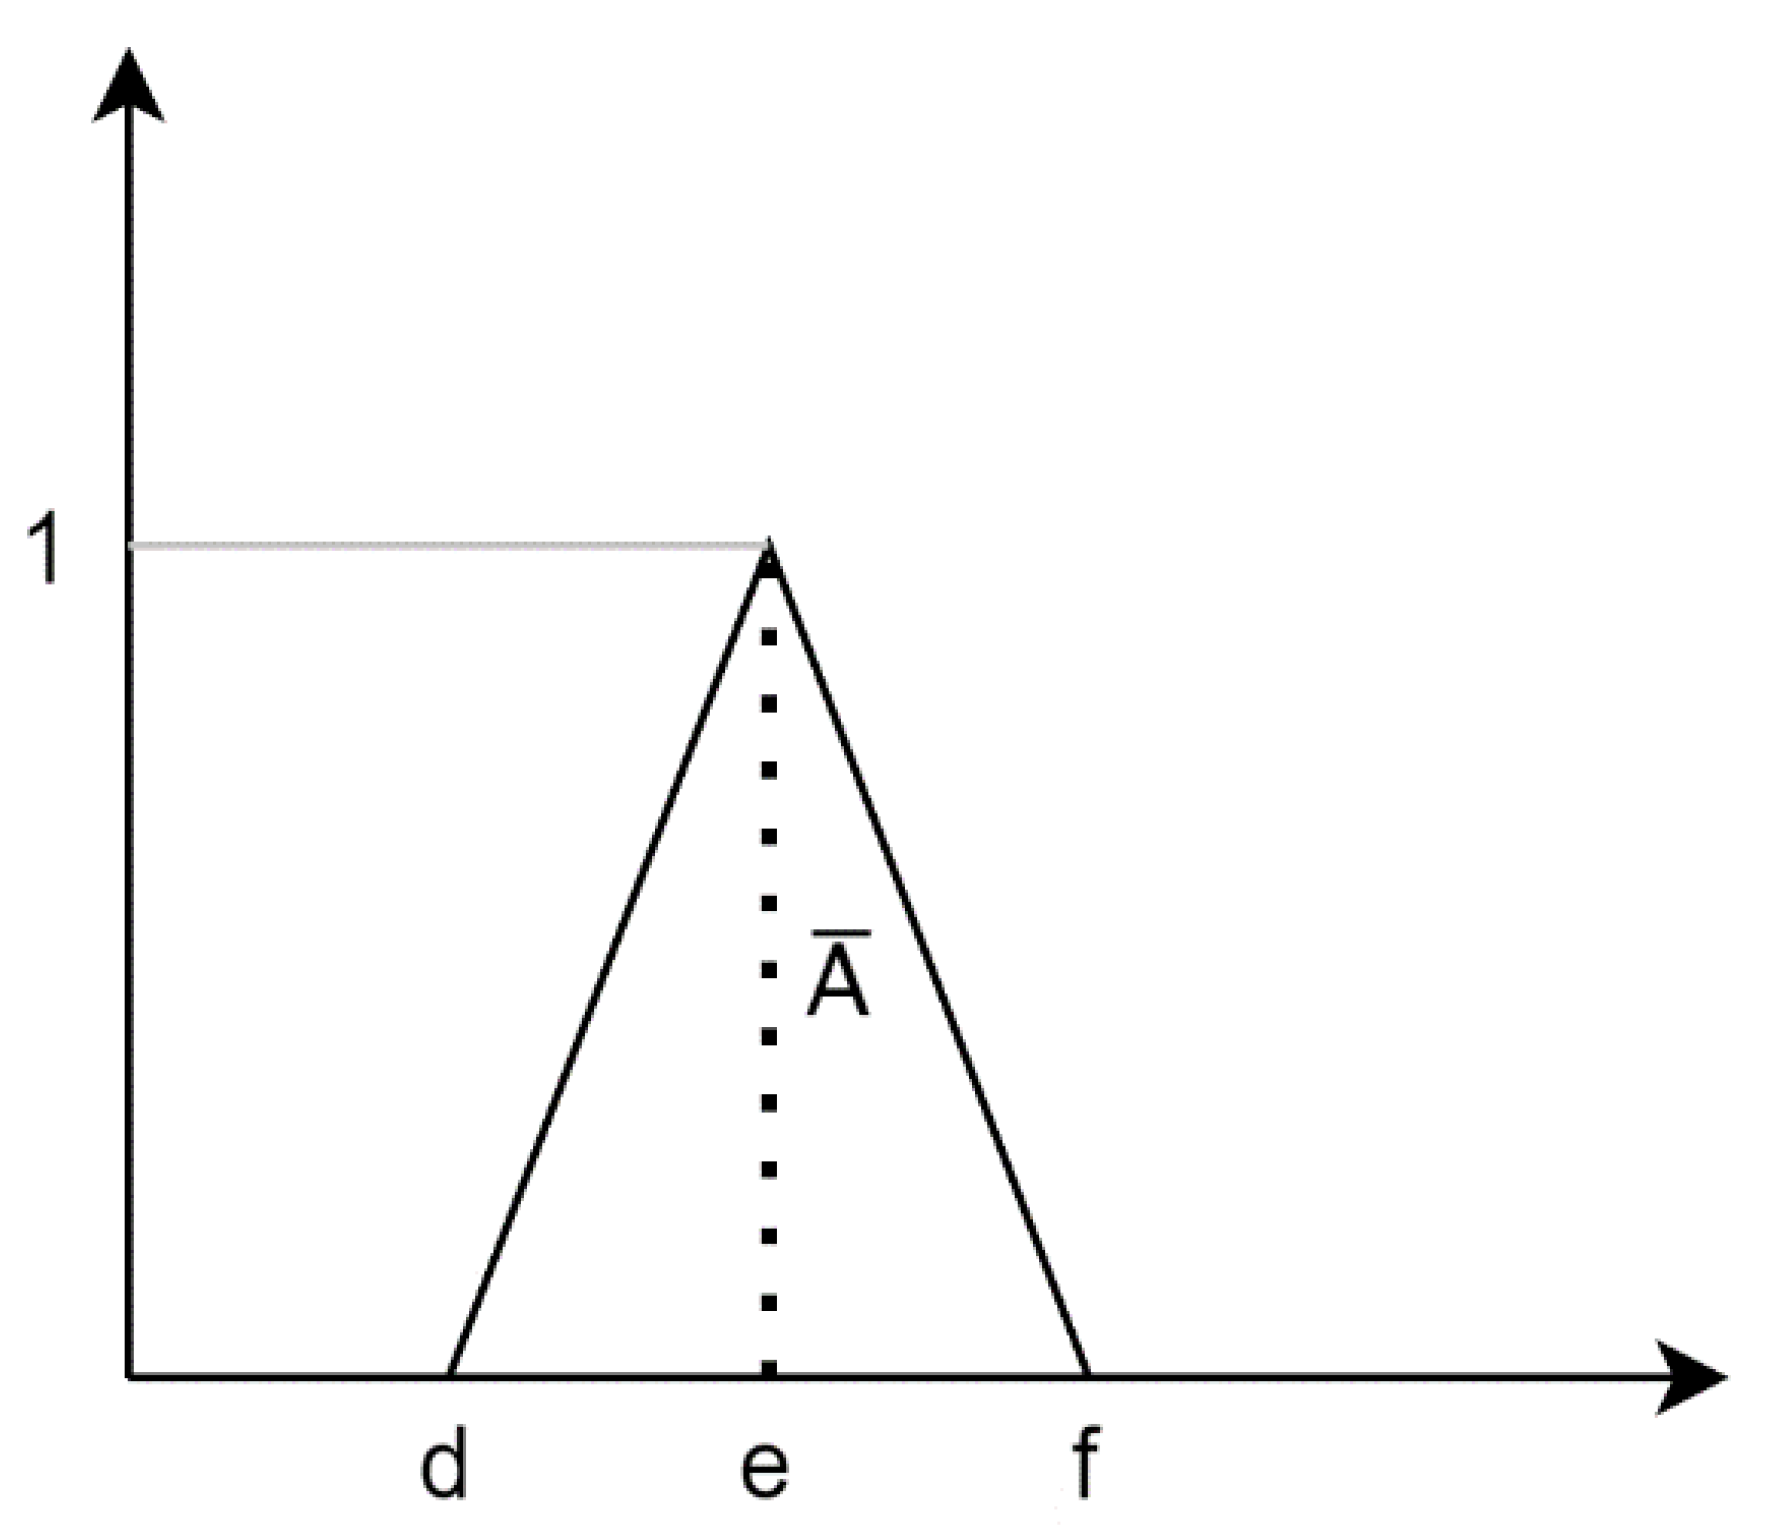
Fuzzy Theory
- Normalization of the fuzzy numbers is carried out with the following Equations (8)–(11).
- 2.
- Normalized crisp values are computed for the left side and right side, using Equations (12) and (13).
- 3.
- Total normalized crisp values are computed with the following Equation (14).
- 4.
- In this step, crisp values are calculated by utilizing the following Equation (15).
- 5.
- In the last step, the integration of crisp values is computed by using Equation (16).
3. Data Analysis and Result
3.1. Result of FCM
3.2. Result of Fuzzy DEMATEL
3.3. Strategy Diagram
4. Discussion
4.1. Discussion On Key Findings
4.2. Managerial Implications from Findings of Research Study
5. Conclusions
6. Limitation of Study
Author Contributions
Funding
Institutional Review Board Statement
Informed Consent Statement
Data Availability Statement
Conflicts of Interest
References
- Gu, N.; London, K. Understanding and facilitating BIM adoption in the AEC industry. Autom. Constr. 2010, 19, 988–999. [Google Scholar] [CrossRef]
- Patel, T.; Suthar, V.; Bhatt, N. Application of Remotely Piloted Unmanned Aerial Vehicle in Construction Management. In Recent Trends in Civil Engineering; Springer: Singapore, 2021; pp. 319–329. [Google Scholar] [CrossRef]
- Jin, R.; Zou, Y.; Gidado, K.; Ashton, P.; Painting, N. Scientometric analysis of BIM-based research in construction engineering and management. Eng. Constr. Archit. Manag. 2019, 26, 1750–1776. [Google Scholar] [CrossRef] [Green Version]
- Wang, J.; Hou, L.; Wu, P. BIM-supported tunnel light environment evaluation: A case study on Shanghai Chenxiang Road Tunnel Project. Proc. Int. Conf. Comput. Civ. Build. Eng. 2016, 1023–1030. [Google Scholar]
- Arayici, Y.; Coates, P.; Koskela, L.; Kagioglou, M.; Usher, C.; O’Reilly, K. BIM adoption and implementation for architectural practices. Struct. Surv. 2011, 29, 7–25. [Google Scholar] [CrossRef] [Green Version]
- Sacks, R.; Eastman, C.; Lee, G.; Teicholz, P. BIM Handbook: A Guide to Building Information Modeling for Owners, Managers, Designers, Engineers and Contractors; John Wiley & Sons: Hoboken, NJ, USA, 2018. [Google Scholar]
- Eastman, C.; Teicholz, P.; Sacks, R.; Liston, K.A. Guide to Building Information Modeling for Owners, Managers, Architects, Engineers, Contractors, and Fabricators. In BIM Handbook; John Wiley & Sons: Hoboken, NJ, USA, 2018. [Google Scholar]
- Abdirad, H. Metric-based BIM implementation assessment: A review of research and practice. Archit. Eng. Des. Manag. 2017, 13, 52–78. [Google Scholar] [CrossRef]
- Fosu, R. Decision Making Processes for BIM Software Selection in the U.S.A.E.C Industry: Developing A Unified Streamlined Framework; Purdue University: West Lafayette, IN, USA, 2017. [Google Scholar]
- Amrollahi, A.; Khansari, M.; Manian, A.; Boynton, A.C.; Zmud, R.W.; Bullen, C.V.; Rockart, J.F.; Chhillar, D.; Sharma, K.; Ghapanchi, A.H.; et al. Investigating Critical Success Factors of Project Management in Global Software Development: A Work in Progress. Decis. Support Syst. 2019, 14, 1–15. [Google Scholar]
- Rockart, J.F. Changing Role of the Information Systems Executive: A Critical Success Factors Perspective. Sloan Sch. Manag. 1982, 24, 3–13. [Google Scholar]
- Evans, M.; Farrell, P.; Mashali, A.; Zewein, W. Critical success factors for adopting building information modelling (BIM) and lean construction practices on construction mega-projects: A Delphi survey. J. Eng. Des. Technol. 2021, 19, 537–556. [Google Scholar] [CrossRef]
- Mom, M.; Tsai, M.H.; Hsieh, S.H.; Mom, M.; Hsieh, S.H. Developing critical success factors for the assessment of BIM technology adoption: Part I. Methodology and survey. J. Chin. Inst. Eng. Trans. Chinese Inst. Eng. A 2014, 37, 845–858. [Google Scholar] [CrossRef]
- Khemlani, L. AECbytes Newsletter; AECbytes: Santa Clara, CA, USA, 2007. [Google Scholar]
- Liberatore, M.J.; Pollack-Johnson, B. Factors influencing the usage and selection of project management software. IEEE Trans. Eng. Manag. 2003, 50, 164–172. [Google Scholar] [CrossRef]
- Kannan, G.; Vinay, V.P. Multi-criteria decision making for the selection of CAD/CAM system. Int. J. Interact. Des. Manuf. 2008, 2, 151–159. [Google Scholar] [CrossRef]
- Yazgan, H.R.; Boran, S.; Goztepe, K. An ERP software selection process with using artificial neural network based on analytic network process approach. Expert Syst. Appl. 2009, 36, 9214–9222. [Google Scholar] [CrossRef]
- Ayaǧ, Z.; Özdemir, R.G. An intelligent approach to ERP software selection through fuzzy ANP. Int. J. Prod. Res. 2007, 45, 2169–2194. [Google Scholar] [CrossRef]
- Tsai, W.H.; Chien, S.W.; Chien, S.W. Identification of critical failure factors in the implementation of enterprise resource planning (ERP) system in Taiwan’s industries. Int. J. Manag. Enterp. Dev. 2005, 2, 219–239. [Google Scholar] [CrossRef]
- Boo, Y.C.; Miroslaw, J.S.; Henry, C.L.J.; Young, H.K. Analyzing Enterprise Resource Planning System Implementation Success Factors in the Engineering–Construction Industry. J. Comput. Civ. Eng. 2008, 3801, 373–382. [Google Scholar] [CrossRef]
- Tsai, W.-H.; Chen, S.-P.; Hwang, E.T.Y.; Hsu, J.-L. A Study of the Impact of Business Process on the ERP System Effectiveness. Int. J. Bus. Manag. 2010, 5. [Google Scholar] [CrossRef] [Green Version]
- Tsai, W.H.; Lee, P.L.; Shen, Y.S.; Lin, H.L. A comprehensive study of the relationship between enterprise resource planning selection criteria and enterprise resource planning system success. Inf. Manag. 2012, 49, 36–46. [Google Scholar] [CrossRef]
- Wu, C.; Xu, B.; Mao, C.; Li, X. Overview of bim maturity measurement tools. J. Inf. Technol. Constr. 2017, 22, 34–62. [Google Scholar]
- McGraw Hill. The Business Value of BIM in Europe: Getting Building Information Modeling to the Bottom Line in the United Kingdom, France and Germany; McGraw Hill: Bedford, MA, USA, 2010. [Google Scholar]
- Won, J.; Lee, G.; Dossick, C.; Messner, J. Where to Focus for Successful Adoption of Building Information Modeling within Organization. J. Constr. Eng. Manag. 2013, 139, 4013014. [Google Scholar] [CrossRef] [Green Version]
- Arayici, Y.; Coates, P.; Koskela, L.; Kagioglou, M.; Usher, C.; O’Reilly, K. Technology adoption in the BIM implementation for lean architectural practice. Autom. Constr. 2011, 20, 189–195. [Google Scholar] [CrossRef]
- Eastman, C.; Teicholz, P.; Sacks, R.; Liston, K. BIM Handbook: A Guide to Building Modeling. J. Chem. Inf. Model. 2011. [Google Scholar] [CrossRef]
- Sun, C.; Jiang, S.; Skibniewski, M.J.; Man, Q.; Shen, L. A literature review of the factors limiting the application of BIM in the construction industry. Technol. Econ. Dev. Econ. 2017, 23, 764–779. [Google Scholar] [CrossRef] [Green Version]
- Azhar, S. Building Information Modelling (BIM): Trends, Benefits, Risks and Challenges for the AEC Industry, Leadership and Management in Engineering. Leadersh. Manag. Eng. 2011, 11, 241–252. [Google Scholar] [CrossRef]
- Singh, V.; Gu, N.; Wang, X. A theoretical framework of a BIM-based multi-disciplinary collaboration platform. Autom. Constr. 2011, 20, 134–144. [Google Scholar] [CrossRef]
- Bernstein, P.G.; Pittman, J.H. Barriers to the Adoption of Building Information Modeling in the Building Industry. Autodesk Build. Solut. White Pap. 2004, 32, 1–14. [Google Scholar]
- Giel, B.K.; Issa, R.R.A. Return on Investment Analysis of Using Building Information Modeling in Construction. J. Comput. Civ. Eng. 2013, 27, 511–521. [Google Scholar] [CrossRef]
- Porwal, A.; Hewage, K.N. Building Information Modeling (BIM) partnering framework for public construction projects. Autom. Constr. 2013, 31, 204–214. [Google Scholar] [CrossRef]
- Volk, R.; Stengel, J.; Schultmann, F. Building Information Modeling (BIM) for existing buildings—Literature review and future needs. Autom. Constr. 2014, 38, 109–127. [Google Scholar] [CrossRef] [Green Version]
- Méndez, R.O. The Building Information Model in Facilities Management; Worcester Polytechnic Institute: Worcester, MA, USA, 2006. [Google Scholar]
- Schlueter, A.; Thesseling, F. Building information model based energy/exergy performance assessment in early design stages. Autom. Constr. 2009, 18, 153–163. [Google Scholar] [CrossRef]
- Eastman, C.; Teicholz, P.; Sacks, R.; Liston, K. BIM Handbook Introduction. In BIM Handbook; Wiley: Hoboken, NJ, USA, 2008; pp. 1–24. [Google Scholar]
- Chang, C.-Y.; Pan, W.; Howard, R. Impact of Building Information Modeling Implementation on the Acceptance of Integrated Delivery Systems: Structural Equation Modeling Analysis. J. Constr. Eng. Manag. 2017, 143, 4017044. [Google Scholar] [CrossRef]
- Mom, M.; Tsai, M.H.; Hsieh, S.H. Developing critical success factors for the assessment of BIM technology adoption: Part II. Analysis and results. J. Chin. Inst. Eng. Trans. Chin. Inst. Eng. A 2014, 37, 859–868. [Google Scholar] [CrossRef]
- Patel, T.; Patel, V. Data privacy in construction industry by privacy-preserving data mining (PPDM) approach. Asian J. Civ. Eng. 2020, 21, 505–515. [Google Scholar] [CrossRef]
- Hartmann, T.; Gao, J.; Fischer, M. Areas of Application for 3D and 4D Models on Construction Projects. J. Constr. Eng. Manag. 2008, 134, 776–785. [Google Scholar] [CrossRef]
- Patel, T.D.; Haupt, T.C.; Bhatt, T. Fuzzy probabilistic approach for risk assessment of BOT toll roads in Indian context. J. Eng. Des. Technol. 2019, 18, 251–269. [Google Scholar] [CrossRef]
- Babakus, E.; Mangold, W.G. Adapting the SERVQUAL scale to hospital services: An empirical investigation. Health Serv. Res. 1992, 26, 767–786. [Google Scholar]
- Bapat, H.; Sarkar, D.; Gujar, R. Application of integrated fuzzy FCM-BIM-IoT for sustainable material selection and energy management of metro rail station box project in western India. Innov. Infrastruct. Solut. 2021, 6, 73. [Google Scholar] [CrossRef]
- Ekel, P.Y. Methods of decision making in fuzzy environment and their applications. Nonlinear Anal. Theory Method. Appl. 2001, 47, 979–990. [Google Scholar] [CrossRef]
- Chang, B.; Chang, C.W.; Wu, C.H. Fuzzy DEMATEL method for developing supplier selection criteria. Expert Syst. Appl. 2011, 38, 1850–1858. [Google Scholar] [CrossRef]
- Gabus, A.; Fontela, E. Perceptions of the World Problematique: Communication Procedure, Communicating with Those Bearing Collective Responsibility; DEMATEL Report No. 1; Battelle Geneva Research Centre: Geneva, Switzerland, 1973. [Google Scholar]
- Li, R.J. Fuzzy method in group decision making. Comput. Math. with Appl. 1999, 38, 91–101. [Google Scholar] [CrossRef] [Green Version]
- Lee, C.S.; Pan, C.Y. An intelligent fuzzy agent for meeting scheduling decision support system. Fuzzy Sets Syst. 2004, 142, 467–488. [Google Scholar] [CrossRef]
- Zadeh, L.A. Fuzzy sets. Inf. Control 1965, 8, 338–353. [Google Scholar] [CrossRef] [Green Version]
- Opricovic, S.; Tzeng, G.H. Defuzzification within a multicriteria decision model. Int. J. Uncertain. Fuzziness Knowl. Based Syst. 2003, 11, 635–652. [Google Scholar] [CrossRef]
- Kim, H.S.; Cho, B.N.; Moon, H.S.; Ju, K.B.; Kang, L.S. Enhancing interoperability of construction data for managing integrated active BIM features. Adv. Mater. Res. 2014, 831, 442–445. [Google Scholar] [CrossRef]
- Tibaut, A.; Rebolj, D.; Nekrep Perc, M. Interoperability requirements for automated manufacturing systems in construction. J. Intell. Manuf. 2016, 27, 251–262. [Google Scholar] [CrossRef]
- Bryde, D.; Broquetas, M.; Volm, J.M. The project benefits of building information modelling (BIM). Int. J. Proj. Manag. 2013, 31, 971–980. [Google Scholar] [CrossRef] [Green Version]


| Parameters | Factors | Description | References |
|---|---|---|---|
| Cost | Annual cost of upgrades (AN) | Cost associated with every license upgrade of the BIM software annually, including applicable taxes | [8,24,25,26] |
| Cost of required hardware upgrades (CO) | Cost incurred in the hardware/system up-gradation according to the system requirements of the latest available BIM software | [8,24,25,26] | |
| Initial cost of software (IN) | Cost expenses for the initial setup and purchase of the suitable BIM software | [8,24,25,26] | |
| Implementation cost (IM) | Cost expenditures consisting of BIM adoption and execution, i.e., cost of software and hardware per resource, cost of experts/technicians, cost of operations, etc. | [8,24,25,26] | |
| Management | BIM adoption strategies and process (BI) | Policies and strategies defined by the top management of the stakeholders for BIM adoption. | [26,27,28,29,30,31,32] |
| Staff competencies (ST) | Technical competencies and respective experience of the human resources/employees involved in the project. | [27,28,29,30,31,32] | |
| BIM software awareness (BT) | Impact and awareness of the various BIM software in the respective country/state. | [26,27,28,33,34] | |
| Flexibility to change the workflow and business model (FL) | Willingness of the stakeholders to adopt the changes in the workflow and business model to incorporate BIM. | [27,28,30,31,35] | |
| Co-operation from other industry partners (CI) | Inter-collaboration of the industry partners/stakeholders supporting the BIM adoption. | [25,27,36] | |
| Contractual framework (CN) | Terms and conditions of the contract favouring the BIM implementation in the project. | [25,27,28,34] | |
| Training of employers (TR) | Frequency of the training provided to the employers to keeping them updated about the recent technology trends in the industry. | [8,24,26,27,32,35] | |
| Technical | Software functionality (SO) | Functionality of the software in terms of design, engineering, analysis, management, etc. | [8,25,28,34,35,37,38,39] |
| Interoperability (IT) | Options of interoperability of the files with other BIM software. | [8,25,29,31,34,37,38,39] | |
| User-friendliness (UF) | User interface/graphic interface easiness of the BIM software to utilize in the various types of projects. | [8,24,25,26,35] | |
| BIM standard, codes, rules, and regulations (BS) | Presence/enforcement of specific BIM standard codes, rules, and regulations by the government authorities in the country/state. | [26,29,30,33,37,38,39] | |
| Data security and privacy protocols (DT) | Level of security and privacy of the project data managed in the BIM software. | [34,35,37,40] | |
| Application integration/extension (API) capabilities (AP) | Availability/possibility of various extensions or plugins for the BIM software. | [28,37,41] | |
| Accessibility of BIM software (AC) | Ease of availability/accessibility of the BIM software in the region. | [28,33,34,35,37] | |
| Large data handling capacity (LA) | Capability of the BIM software to manage/process large size files. | [28,29,34,37] | |
| BIM objects/library (BL) | Availability of the BIM objects for various BIM software. | [8,25,37] | |
| Sophistication of data management (SD) | Ease of the data/information exchange process for BIM projects. | [8,25,29,34,37] | |
| Compatibility with existing hardware (CH) | System requirements/compatibility of the BIM software with the existing hardware of the systems used by stakeholders. | [28,31,37,39] | |
| Vendors | Popularity (PO) | Popularity and reputation of the vendor company across the globe for their BIM software utilization. | [8,25,29,39] |
| Technical service support (TS) | Quality of post-sales service and level of customer satisfaction. | [8,25,39] | |
| Innovation & research development capabilities (ID) | R&D capacity of the vendor company in terms of funding as well as resources. | [8,25,39] | |
| Documentation & training support (DO) | Provision of supportive documentation and training to the customers on the newly launched BIM software and latest techniques. | [8,39,25] |
| Characteristics | Classification | Total Numbers |
|---|---|---|
| Company size | Large (>200 employees) | 9 |
| Medium (100 to 200 employees) | 4 | |
| Small (<100 employees) | 2 | |
| Position | CEO/Managing director | 10 |
| CTO/Technical head/Manager | 5 | |
| Years of experience | >15 years | 11 |
| 5 to 10 years | 4 |
| Characteristics | Classification | Total Numbers |
|---|---|---|
| Company type | Government organization | 5 |
| BIM consultancy and design consultancy | 20 | |
| Contractor company | 11 | |
| Project management consultancy | 12 | |
| Position | Top-level | 37 |
| Mid-level | 11 | |
| Years of experience | <5 years | 11 |
| 5 top 10 years | 24 | |
| >10 years | 13 |
| Score | Difference of Importance between Two CSFs |
|---|---|
| 0 | No difference |
| 1 | Minor difference |
| 2 | Average difference |
| 3 | Major difference |
| 4 | High difference |
| CN | CO | AP | IM | FL | AN | CI | TS | ID | UF | LA | BL | AC | SD | BI | TR | BT | IN | CH | SO | IT | DT | DO | ST | PO | BS | Score | Ranking |
|---|---|---|---|---|---|---|---|---|---|---|---|---|---|---|---|---|---|---|---|---|---|---|---|---|---|---|---|
| CN | CN1 | CN0 | IM2 | FL4 | CN1 | CN1 | TS2 | CN2 | CN1 | CN1 | CN0 | AC2 | N1 | BI1 | CN1 | BT1 | IN2 | CN0 | SO4 | CN0 | DT2 | CN2 | CN1 | PO1 | BS1 | 11 | 20 |
| CO | CO1 | CO2 | FL2 | AN1 | CO3 | CO0 | ID1 | UF1 | CO2 | CO1 | AC1 | CO1 | BI2 | TR1 | BT2 | IN1 | CO3 | SO2 | CO1 | CO0 | CO1 | CO1 | PO2 | BS1 | 16 | 15 | |
| AP | AP2 | FL1 | AN1 | AP1 | TS1 | ID1 | AP2 | AP2 | BL1 | AP3 | N1 | AP1 | TR2 | BT1 | AP1 | AP2 | SO3 | AP1 | DT1 | AP2 | ST1 | PO1 | AP1 | 18 | 13 | ||
| IM | FL1 | AN1 | IM1 | TS2 | I1 | UF1 | IM2 | IM3 | AC1 | IM0 | BI1 | TR1 | BT3 | IM2 | IM2 | SO4 | IM1 | DT1 | IM2 | ST1 | PO2 | BS2 | 15 | 16 | |||
| FL | FL1 | FL2 | TS1 | ID2 | UF2 | FL2 | FL2 | FL1 | FL2 | FL1 | FL1 | FL1 | IN1 | FL1 | SO3 | FL1 | FL0 | FL1 | ST1 | PO1 | BS1 | 24 | 10 | ||||
| AN | AN2 | TS1 | ID1 | AN1 | LA1 | AN0 | AC1 | N1 | BI1 | AN1 | BT1 | IN1 | AN2 | SO2 | AN1 | DT1 | AN2 | AN0 | PO1 | BS1 | 12 | 19 | |||||
| CI | TS3 | ID2 | CI3 | CI3 | BL1 | AC1 | CI3 | BI1 | CI3 | BT2 | IN2 | CI2 | SO4 | CI1 | PO1 | CI2 | ST1 | PO1 | BS1 | 17 | 14 | ||||||
| TS | TS0 | TS2 | TS3 | TS2 | TS1 | TS2 | BI2 | TR1 | BT1 | TS1 | TS1 | SO1 | TS1 | DT1 | TS2 | TS0 | PO1 | BS1 | 25 | 9 | |||||||
| ID | ID2 | ID2 | ID1 | AC1 | ID3 | BI1 | ID1 | ID1 | IN1 | CH1 | SO1 | ID1 | ID1 | ID2 | ID1 | PO1 | BS1 | 23 | 11 | ||||||||
| UF | UF2 | UF3 | UF0 | UF1 | BI3 | UF1 | BT1 | IN2 | UF2 | SO3 | UF1 | DT1 | UF1 | ST1 | UF1 | UF1 | 27 | 7 | |||||||||
| LA | LA2 | AC1 | LA2 | BI1 | TR2 | BT1 | IN1 | LA2 | SO4 | IT1 | DT1 | DO2 | LA2 | PO2 | BS1 | 9 | 22 | ||||||||||
| BL | BL1 | BL2 | BI2 | BL1 | BT1 | IN2 | BL1 | SO3 | IT2 | DT2 | DO1 | BL1 | BL0 | BS2 | 8 | 23 | |||||||||||
| AC | AC1 | AC2 | TR2 | BT2 | IN2 | AC0 | SO2 | AC1 | DT2 | AC1 | ST1 | PO1 | BS1 | 13 | 18 | ||||||||||||
| SD | BI2 | SD1 | BT1 | SD0 | SD2 | SD1 | IT1 | DT1 | DO1 | ST2 | PO2 | BS2 | 7 | 24 | |||||||||||||
| BI | BI3 | BI1 | IN1 | BI2 | SO4 | BI1 | BI1 | BI2 | BI1 | PO1 | BI1 | 38 | 2 | ||||||||||||||
| TR | BT2 | IN2 | TR1 | SO3 | IT1 | DT1 | DO2 | ST1 | PO1 | BS1 | 10 | 21 | |||||||||||||||
| BT | IN3 | BT3 | SO4 | BT2 | DT1 | BT2 | ST1 | PO1 | BT1 | 28 | 6 | ||||||||||||||||
| IN | IN3 | SO4 | IN2 | IN0 | IN3 | IN1 | PO1 | IN2 | 32 | 3 | |||||||||||||||||
| CH | SO4 | CH1 | DT1 | CH1 | CH1 | PO1 | CH0 | 5 | 26 | ||||||||||||||||||
| SO | SO3 | SO4 | SO4 | SO2 | SO3 | BS1 | 71 | 1 | |||||||||||||||||||
| IT | DT1 | IT1 | ST2 | PO2 | BS3 | 6 | 25 | ||||||||||||||||||||
| DT | DT3 | DT1 | PO2 | BS1 | 21 | 12 | |||||||||||||||||||||
| DO | ST1 | PO2 | BS3 | 14 | 17 | ||||||||||||||||||||||
| ST | PO2 | BS2 | 31 | 4 | |||||||||||||||||||||||
| PO | PO2 | 29 | 5 | ||||||||||||||||||||||||
| BS | 26 | 8 |
| Influence Score | Linguistic Terms | L | M | U |
|---|---|---|---|---|
| 1 | No influence | 0 | 0.1 | 0.3 |
| 2 | Very low influence | 0.2 | 0.3 | 0.5 |
| 3 | Low influence | 0.3 | 0.5 | 0.7 |
| 4 | High influence | 0.5 | 0.7 | 0.9 |
| 5 | Very high influence | 0.7 | 0.9 | 1 |
| SO | BI | IT | IN | ST | PO | BT | UF | BS | TS | FL | ID | DT | AP | CI | |
|---|---|---|---|---|---|---|---|---|---|---|---|---|---|---|---|
| SO | - | 2 | 2 | 4 | 3 | 3 | 3 | 4 | 3 | 4 | 4 | 3 | 1 | 3 | 2 |
| BI | 2 | - | 5 | 3 | 3 | 3 | 3 | 4 | 4 | 3 | 5 | 4 | 2 | 3 | 3 |
| IT | 4 | 3 | - | 5 | 3 | 3 | 4 | 3 | 5 | 4 | 4 | 5 | 1 | 2 | 5 |
| IN | 3 | 3 | 4 | - | 4 | 4 | 4 | 5 | 4 | 4 | 5 | 5 | 2 | 1 | 4 |
| ST | 3 | 4 | 4 | 3 | - | 5 | 4 | 3 | 3 | 5 | 5 | 3 | 4 | 4 | 2 |
| PO | 2 | 2 | 3 | 4 | 4 | - | 4 | 3 | 1 | 3 | 4 | 4 | 2 | 3 | 2 |
| BT | 2 | 3 | 3 | 4 | 3 | 3 | - | 4 | 4 | 3 | 4 | 3 | 3 | 1 | 3 |
| UF | 3 | 4 | 4 | 5 | 4 | 3 | 5 | - | 5 | 4 | 5 | 5 | 2 | 2 | 3 |
| BS | 4 | 4 | 4 | 4 | 3 | 3 | 5 | 4 | - | 3 | 4 | 4 | 2 | 1 | 2 |
| TS | 2 | 3 | 3 | 3 | 2 | 2 | 4 | 4 | 4 | - | 4 | 5 | 5 | 4 | 4 |
| FL | 4 | 4 | 4 | 4 | 5 | 3 | 5 | 5 | 4 | 3 | - | 5 | 4 | 3 | 4 |
| ID | 4 | 4 | 4 | 4 | 3 | 3 | 5 | 5 | 5 | 4 | 4 | - | 3 | 2 | 3 |
| DT | 3 | 3 | 3 | 5 | 4 | 4 | 4 | 3 | 3 | 5 | 5 | 4 | - | 4 | 4 |
| AP | 4 | 3 | 3 | 4 | 5 | 5 | 3 | 4 | 3 | 5 | 5 | 3 | 4 | - | 2 |
| CI | 4 | 4 | 5 | 3 | 4 | 2 | 3 | 3 | 3 | 3 | 4 | 4 | 2 | 2 | - |
| SO | BI | IT | IN | ST | PO | BT | UF | BS | TS | FL | ID | DT | AP | CI | |
|---|---|---|---|---|---|---|---|---|---|---|---|---|---|---|---|
| SO | (0.00,0.00,0.00) | (0.50,0.70,0.90) | (0.50,0.70,0.90) | (0.70,0.90,1.00) | (0.20,0.30,0.50) | (0.70,0.90,1.00) | (0.70,0.90,1.00) | (0.70,0.90,1.00) | (0.20,0.30,0.50) | (0.70,0.90,1.00) | (0.70,0.90,1.00) | (0.70,0.90,1.00) | (0.50,0.70,0.90) | (0.50,0.70,0.90) | (0.70,0.90,1.00) |
| BI | (0.30,0.50,0.70) | (0.00,0.00,0.00) | (0.50,0.70,0.90) | (0.50,0.70,0.90) | (0.50,0.70,0.90) | (0.50,0.70,0.90) | (0.70,0.90,1.00) | (0.70,0.90,1.00) | (0.30,0.50,0.70) | (0.50,0.70,0.90) | (0.50,0.70,0.90) | (0.70,0.90,1.00) | (0.30,0.50,0.70) | (0.30,0.50,0.70) | (0.50,0.70,0.90) |
| IT | (0.30,0.50,0.70) | (0.30,0.50,0.70) | (0.00,0.00,0.00) | (0.30,0.50,0.70) | (0.50,0.70,0.90) | (0.30,0.50,0.70) | (0.50,0.70,0.90) | (0.50,0.70,0.90) | (0.30,0.50,0.70) | (0.30,0.50,0.70) | (0.30,0.50,0.70) | (0.50,0.70,0.90) | (0.30,0.50,0.70) | (0.30,0.50,0.70) | (0.50,0.70,0.90) |
| IN | (0.30,0.50,0.70) | (0.30,0.50,0.70) | (0.30,0.50,0.70) | (0.00,0.00,0.00) | (0.30,0.50,0.70) | (0.20,0.30,0.50) | (0.30,0.50,0.70) | (0.30,0.50,0.70) | (0.30,0.50,0.70) | (0.20,0.30,0.50) | (0.20,0.30,0.50) | (0.50,0.70,0.90) | (0.30,0.50,0.70) | (0.30,0.50,0.70) | (0.50,0.70,0.90) |
| ST | (0.50,0.70,0.90) | (0.30,0.50,0.70) | (0.30,0.50,0.70) | (0.50,0.70,0.90) | (0.00,0.00,0.00) | (0.20,0.30,0.50) | (0.30,0.50,0.70) | (0.30,0.50,0.70) | (0.20,0.30,0.50) | (0.20,0.30,0.50) | (0.00,0.10,0.30) | (0.30,0.50,0.70) | (0.20,0.30,0.50) | (0.20,0.30,0.50) | (0.30,0.50,0.70) |
| PO | (0.50,0.70,0.90) | (0.30,0.50,0.70) | (0.30,0.50,0.70) | (0.30,0.50,0.70) | (0.20,0.30,0.50) | (0.00,0.00,0.00) | (0.20,0.30,0.50) | (0.30,0.50,0.70) | (0.20,0.30,0.50) | (0.20,0.30,0.50) | (0.30,0.50,0.70) | (0.20,0.30,0.50) | (0.00,0.10,0.30) | (0.20,0.30,0.50) | (0.20,0.30,0.50) |
| BT | (0.70,0.90,1.00) | (0.20,0.30,0.50) | (0.20,0.30,0.50) | (0.20,0.30,0.50) | (0.00,0.10,0.30) | (0.30,0.50,0.70) | (0.00,0.00,0.00) | (0.00,0.10,0.30) | (0.00,0.10,0.30) | (0.20,0.30,0.50) | (0.20,0.30,0.50) | (0.30,0.50,0.70) | (0.30,0.50,0.70) | (0.20,0.30,0.50) | (0.20,0.30,0.50) |
| UF | (0.70,0.90,1.00) | (0.00,0.10,0.30) | (0.00,0.10,0.30) | (0.00,0.10,0.30) | (0.50,0.70,0.90) | (0.30,0.50,0.70) | (0.20,0.30,0.50) | (0.00,0.00,0.00) | (0.00,0.10,0.30) | (0.00,0.10,0.30) | (0.20,0.30,0.50) | (0.00,0.10,0.30) | (0.00,0.10,0.30) | (0.00,0.10,0.30) | (0.00,0.10,0.30) |
| BS | (0.00,0.10,0.30) | (0.70,0.90,1.00) | (0.30,0.50,0.70) | (0.20,0.30,0.50) | (0.30,0.50,0.70) | (0.20,0.30,0.50) | (0.30,0.50,0.70) | (0.00,0.10,0.30) | (0.00,0.00,0.00) | (0.00,0.10,0.30) | (0.50,0.70,0.90) | (0.00,0.10,0.30) | (0.30,0.50,0.70) | (0.00,0.10,0.30) | (0.50,0.70,0.90) |
| TS | (0.00,0.10,0.30) | (0.20,0.30,0.50) | (0.00,0.10,0.30) | (0.30,0.50,0.70) | (0.20,0.30,0.50) | (0.50,0.70,0.90) | (0.30,0.50,0.70) | (0.20,0.30,0.50) | (0.20,0.30,0.50) | (0.00,0.00,0.00) | (0.20,0.30,0.50) | (0.20,0.30,0.50) | (0.00,0.10,0.30) | (0.00,0.10,0.30) | (0.00,0.10,0.30) |
| FL | (0.20,0.30,0.50) | (0.30,0.50,0.70) | (0.20,0.30,0.50) | (0.30,0.50,0.70) | (0.20,0.30,0.50) | (0.00,0.10,0.30) | (0.20,0.30,0.50) | (0.00,0.10,0.30) | (0.50,0.70,0.90) | (0.20,0.30,0.50) | (0.00,0.00,0.00) | (0.00,0.10,0.30) | (0.00,0.10,0.30) | (0.50,0.70,0.90) | (0.20,0.30,0.50) |
| ID | (0.50,0.70,0.90) | (0.20,0.30,0.50) | (0.70,0.90,1.00) | (0.30,0.50,0.70) | (0.00,0.10,0.30) | (0.30,0.50,0.70) | (0.20,0.30,0.50) | (0.30,0.50,0.70) | (0.00,0.10,0.30) | (0.00,0.10,0.30) | (0.00,0.10,0.30) | (0.00,0.00,0.00) | (0.50,0.70,0.90) | (0.00,0.10,0.30) | (0.00,0.10,0.30) |
| DT | (0.20,0.30,0.50) | (0.20,0.30,0.50) | (0.00,0.10,0.30) | (0.30,0.50,0.70) | (0.00,0.10,0.30) | (0.20,0.30,0.50) | (0.00,0.10,0.30) | (0.20,0.30,0.50) | (0.20,0.30,0.50) | (0.20,0.30,0.50) | (0.30,0.50,0.70) | (0.30,0.50,0.70) | (0.00,0.00,0.00) | (0.00,0.10,0.30) | (0.20,0.30,0.50) |
| AP | (0.30,0.50,0.70) | (0.30,0.50,0.70) | (0.30,0.50,0.70) | (0.30,0.50,0.70) | (0.20,0.30,0.50) | (0.20,0.30,0.50) | (0.20,0.30,0.50) | (0.30,0.50,0.70) | (0.00,0.10,0.30) | (0.00,0.10,0.30) | (0.20,0.30,0.50) | (0.00,0.10,0.30) | (0.20,0.30,0.50) | (0.00,0.00,0.00) | (0.00,0.10,0.30) |
| CI | (0.20,0.30,0.50) | (0.70,0.90,1.00) | (0.20,0.30,0.50) | (0.20,0.30,0.50) | (0.30,0.50,0.70) | (0.00,0.10,0.30) | (0.20,0.30,0.50) | (0.00,0.10,0.30) | (0.50,0.70,0.90) | (0.20,0.30,0.50) | (0.30,0.50,0.70) | (0.00,0.10,0.30) | (0.00,0.10,0.30) | (0.20,0.30,0.50) | (0.00,0.00,0.00) |
| SO | BI | IT | IN | ST | PO | BT | UF | BS | TS | FL | ID | DT | AP | CI | |
|---|---|---|---|---|---|---|---|---|---|---|---|---|---|---|---|
| SO | (0.00,0.00,0.00) | (0.04,0.06,0.07) | (0.04,0.06,0.07) | (0.06,0.07,0.08) | (0.02,0.02,0.04) | (0.06,0.07,0.08) | (0.06,0.07,0.08) | (0.06,0.07,0.08) | (0.02,0.02,0.04) | (0.06,0.07,0.08) | (0.06,0.07,0.08) | (0.06,0.07,0.08) | (0.04,0.06,0.07) | (0.04,0.06,0.07) | (0.06,0.07,0.08) |
| BI | (0.02,0.04,0.06) | (0.00,0.00,0.00) | (0.04,0.06,0.07) | (0.04,0.06,0.07) | (0.04,0.06,0.07) | (0.04,0.06,0.07) | (0.06,0.07,0.08) | (0.06,0.07,0.08) | (0.02,0.04,0.06) | (0.04,0.06,0.07) | (0.04,0.06,0.07) | (0.06,0.07,0.08) | (0.02,0.04,0.06) | (0.02,0.04,0.06) | (0.04,0.06,0.07) |
| IT | (0.02,0.04,0.06) | (0.02,0.04,0.06) | (0.00,0.00,0.00) | (0.02,0.04,0.06) | (0.04,0.06,0.07) | (0.02,0.04,0.06) | (0.04,0.06,0.07) | (0.04,0.06,0.07) | (0.02,0.04,0.06) | (0.02,0.04,0.06) | (0.02,0.04,0.06) | (0.04,0.06,0.07) | (0.02,0.04,0.06) | (0.02,0.04,0.06) | (0.04,0.06,0.07) |
| IN | (0.02,0.04,0.06) | (0.02,0.04,0.06) | (0.02,0.04,0.06) | (0.00,0.00,0.00) | (0.02,0.04,0.06) | (0.02,0.02,0.04) | (0.02,0.04,0.06) | (0.02,0.04,0.06) | (0.02,0.04,0.06) | (0.02,0.02,0.04) | (0.02,0.02,0.04) | (0.04,0.06,0.07) | (0.02,0.04,0.06) | (0.02,0.04,0.06) | (0.04,0.06,0.07) |
| ST | (0.04,0.06,0.07) | (0.02,0.04,0.06) | (0.02,0.04,0.06) | (0.04,0.06,0.07) | (0.00,0.00,0.00) | (0.02,0.02,0.04) | (0.02,0.04,0.06) | (0.02,0.04,0.06) | (0.02,0.02,0.04) | (0.02,0.02,0.04) | (0.00,0.01,0.02) | (0.02,0.04,0.06) | (0.02,0.02,0.04) | (0.02,0.02,0.04) | (0.02,0.04,0.06) |
| PO | (0.04,0.06,0.07) | (0.02,0.04,0.06) | (0.02,0.04,0.06) | (0.02,0.04,0.06) | (0.02,0.02,0.04) | (0.00,0.00,0.00) | (0.02,0.02,0.04) | (0.02,0.04,0.06) | (0.02,0.02,0.04) | (0.02,0.02,0.04) | (0.02,0.04,0.06) | (0.02,0.02,0.04) | (0.00,0.01,0.02) | (0.02,0.02,0.04) | (0.02,0.02,0.04) |
| BT | (0.06,0.07,0.08) | (0.02,0.02,0.04) | (0.02,0.02,0.04) | (0.02,0.02,0.04) | (0.00,0.01,0.02) | (0.02,0.04,0.06) | (0.00,0.00,0.00) | (0.00,0.01,0.02) | (0.00,0.01,0.02) | (0.02,0.02,0.04) | (0.02,0.02,0.04) | (0.02,0.04,0.06) | (0.02,0.04,0.06) | (0.02,0.02,0.04) | (0.02,0.02,0.04) |
| UF | (0.06,0.07,0.08) | (0.00,0.01,0.02) | (0.00,0.01,0.02) | (0.00,0.01,0.02) | (0.04,0.06,0.07) | (0.02,0.04,0.06) | (0.02,0.02,0.04) | (0.00,0.00,0.00) | (0.00,0.01,0.02) | (0.00,0.01,0.02) | (0.02,0.02,0.04) | (0.00,0.01,0.02) | (0.00,0.01,0.02) | (0.00,0.01,0.02) | (0.00,0.01,0.02) |
| BS | (0.00,0.01,0.02) | (0.06,0.07,0.08) | (0.02,0.04,0.06) | (0.02,0.02,0.04) | (0.02,0.04,0.06) | (0.02,0.02,0.04) | (0.02,0.04,0.06) | (0.00,0.01,0.02) | (0.00,0.00,0.00) | (0.00,0.01,0.02) | (0.04,0.06,0.07) | (0.00,0.01,0.02) | (0.02,0.04,0.06) | (0.00,0.01,0.02) | (0.04,0.06,0.07) |
| TS | (0.00,0.01,0.02) | (0.02,0.02,0.04) | (0.00,0.01,0.02) | (0.02,0.04,0.06) | (0.02,0.02,0.04) | (0.04,0.06,0.07) | (0.02,0.04,0.06) | (0.02,0.02,0.04) | (0.02,0.02,0.04) | (0.00,0.00,0.00) | (0.02,0.02,0.04) | (0.02,0.02,0.04) | (0.00,0.01,0.02) | (0.00,0.01,0.02) | (0.00,0.01,0.02) |
| FL | (0.02,0.02,0.04) | (0.02,0.04,0.06) | (0.02,0.02,0.04) | (0.02,0.04,0.06) | (0.02,0.02,0.04) | (0.00,0.01,0.02) | (0.02,0.02,0.04) | (0.00,0.01,0.02) | (0.04,0.06,0.07) | (0.02,0.04,0.06) | (0.00,0.00,0.00) | (0.00,0.01,0.02) | (0.00,0.01,0.02) | (0.04,0.06,0.07) | (0.02,0.02,0.04) |
| ID | (0.04,0.06,0.07) | (0.02,0.02,0.04) | (0.06,0.07,0.08) | (0.02,0.04,0.06) | (0.00,0.01,0.02) | (0.02,0.04,0.06) | (0.02,0.02,0.04) | (0.02,0.04,0.06) | (0.00,0.01,0.02) | (0.00,0.01,0.02) | (0.00,0.01,0.02) | (0.00,0.00,0.00) | (0.04,0.06,0.07) | (0.00,0.01,0.02) | (0.00,0.01,0.02) |
| DT | (0.02,0.02,0.04) | (0.02,0.02,0.04) | (0.00,0.01,0.02) | (0.02,0.04,0.06) | (0.00,0.01,0.02) | (0.02,0.02,0.04) | (0.02,0.04,0.06) | (0.02,0.02,0.04) | (0.02,0.02,0.04) | (0.02,0.02,0.04) | (0.02,0.04,0.06) | (0.02,0.04,0.06) | (0.00,0.00,0.00) | (0.00,0.01,0.02) | (0.02,0.02,0.04) |
| AP | (0.02,0.04,0.06) | (0.02,0.04,0.06) | (0.02,0.04,0.06) | (0.02,0.04,0.06) | (0.02,0.02,0.04) | (0.02,0.02,0.04) | (0.02,0.02,0.04) | (0.02,0.04,0.06) | (0.00,0.01,0.02) | (0.00,0.01,0.02) | (0.02,0.02,0.04) | (0.00,0.01,0.02) | (0.02,0.02,0.04) | (0.00,0.00,0.00) | (0.00,0.01,0.02) |
| CI | (0.02,0.02,0.04) | (0.06,0.07,0.08) | (0.02,0.02,0.04) | (0.02,0.02,0.04) | (0.02,0.04,0.06) | (0.00,0.01,0.02) | (0.02,0.02,0.04) | (0.00,0.01,0.02) | (0.04,0.06,0.07) | (0.02,0.02,0.04) | (0.02,0.04,0.06) | (0.00,0.01,0.02) | (0.00,0.01,0.02) | (0.02,0.02,0.04) | (0.00,0.00,0.00) |
| SO | BI | IT | IN | ST | PO | BT | UF | BS | TS | FL | ID | DT | AP | CI | |
|---|---|---|---|---|---|---|---|---|---|---|---|---|---|---|---|
| SO | (0.02,0.06,0.16) | (0.06,0.11,0.22) | (0.06,0.10,0.21) | (0.07,0.12,0.23) | (0.03,0.07,0.17) | (0.07,0.12,0.22) | (0.07,0.12,0.22) | (0.07,0.12,0.22) | (0.03,0.06,0.16) | (0.07,0.11,0.20) | (0.07,0.12,0.22) | (0.07,0.12,0.21) | (0.05,0.09,0.20) | (0.05,0.09,0.19) | (0.07,0.12,0.21) |
| BI | (0.05,0.09,0.21) | (0.02,0.05,0.15) | (0.05,0.10,0.21) | (0.06,0.10,0.22) | (0.05,0.09,0.20) | (0.05,0.10,0.21) | (0.07,0.12,0.22) | (0.07,0.11,0.21) | (0.04,0.08,0.17) | (0.05,0.09,0.18) | (0.05,0.10,0.20) | (0.07,0.11,0.21) | (0.04,0.08,0.18) | (0.03,0.07,0.17) | (0.05,0.10,0.20) |
| IT | (0.04,0.09,0.19) | (0.04,0.08,0.19) | (0.01,0.04,0.12) | (0.04,0.08,0.19) | (0.05,0.09,0.18) | (0.04,0.08,0.18) | (0.05,0.09,0.20) | (0.05,0.09,0.19) | (0.03,0.07,0.16) | (0.03,0.07,0.16) | (0.04,0.08,0.18) | (0.05,0.09,0.19) | (0.03,0.07,0.17) | (0.03,0.07,0.16) | (0.05,0.09,0.19) |
| IN | (0.04,0.08,0.18) | (0.04,0.08,0.17) | (0.03,0.07,0.17) | (0.01,0.04,0.12) | (0.03,0.07,0.16) | (0.03,0.06,0.15) | (0.04,0.07,0.17) | (0.03,0.07,0.16) | (0.03,0.07,0.15) | (0.02,0.05,0.13) | (0.03,0.06,0.15) | (0.05,0.09,0.18) | (0.03,0.07,0.16) | (0.03,0.06,0.15) | (0.05,0.09,0.18) |
| ST | (0.05,0.09,0.18) | (0.03,0.07,0.17) | (0.03,0.07,0.16) | (0.05,0.09,0.18) | (0.01,0.03,0.10) | (0.03,0.06,0.14) | (0.04,0.07,0.16) | (0.03,0.07,0.16) | (0.02,0.05,0.13) | (0.02,0.05,0.13) | (0.01,0.04,0.13) | (0.03,0.07,0.16) | (0.02,0.05,0.13) | (0.02,0.05,0.13) | (0.03,0.07,0.16) |
| PO | (0.05,0.09,0.18) | (0.03,0.07,0.16) | (0.03,0.07,0.15) | (0.03,0.07,0.16) | (0.02,0.05,0.13) | (0.01,0.03,0.10) | (0.03,0.06,0.14) | (0.03,0.07,0.15) | (0.02,0.05,0.13) | (0.02,0.05,0.12) | (0.03,0.07,0.15) | (0.03,0.05,0.14) | (0.01,0.03,0.11) | (0.02,0.05,0.13) | (0.03,0.05,0.14) |
| BT | (0.06,0.10,0.17) | (0.03,0.05,0.14) | (0.02,0.05,0.13) | (0.03,0.05,0.14) | (0.01,0.03,0.11) | (0.03,0.07,0.14) | (0.01,0.03,0.09) | (0.01,0.04,0.11) | (0.01,0.03,0.10) | (0.02,0.05,0.12) | (0.03,0.05,0.13) | (0.03,0.07,0.14) | (0.03,0.06,0.14) | (0.02,0.04,0.12) | (0.02,0.05,0.13) |
| UF | (0.06,0.09,0.16) | (0.01,0.03,0.11) | (0.01,0.03,0.10) | (0.01,0.03,0.11) | (0.04,0.07,0.14) | (0.03,0.06,0.13) | (0.02,0.05,0.12) | (0.01,0.02,0.08) | (0.00,0.02,0.09) | (0.01,0.03,0.09) | (0.02,0.04,0.12) | (0.01,0.03,0.10) | (0.01,0.03,0.09) | (0.01,0.03,0.09) | (0.01,0.03,0.10) |
| BS | (0.01,0.04,0.13) | (0.06,0.10,0.18) | (0.03,0.07,0.15) | (0.03,0.05,0.14) | (0.03,0.06,0.14) | (0.02,0.05,0.13) | (0.03,0.07,0.15) | (0.01,0.03,0.12) | (0.01,0.03,0.09) | (0.01,0.03,0.11) | (0.05,0.08,0.16) | (0.01,0.04,0.12) | (0.03,0.06,0.14) | (0.01,0.03,0.11) | (0.05,0.08,0.16) |
| TS | (0.01,0.03,0.11) | (0.02,0.05,0.12) | (0.01,0.03,0.10) | (0.03,0.06,0.14) | (0.02,0.04,0.11) | (0.04,0.07,0.15) | (0.03,0.06,0.14) | (0.02,0.04,0.12) | (0.02,0.04,0.11) | (0.00,0.02,0.07) | (0.02,0.04,0.12) | (0.02,0.04,0.12) | (0.00,0.02,0.10) | (0.00,0.02,0.09) | (0.01,0.03,0.10) |
| FL | (0.02,0.05,0.13) | (0.03,0.07,0.15) | (0.02,0.05,0.13) | (0.03,0.07,0.15) | (0.02,0.05,0.12) | (0.01,0.03,0.11) | (0.02,0.05,0.13) | (0.01,0.03,0.11) | (0.04,0.07,0.15) | (0.02,0.04,0.11) | (0.01,0.02,0.09) | (0.01,0.03,0.11) | (0.01,0.03,0.10) | (0.04,0.07,0.14) | (0.02,0.05,0.13) |
| ID | (0.05,0.09,0.17) | (0.02,0.05,0.14) | (0.06,0.09,0.17) | (0.03,0.07,0.15) | (0.01,0.03,0.11) | (0.03,0.07,0.15) | (0.03,0.05,0.14) | (0.03,0.07,0.15) | (0.01,0.03,0.11) | (0.01,0.03,0.10) | (0.01,0.04,0.12) | (0.01,0.03,0.09) | (0.05,0.08,0.15) | (0.01,0.03,0.10) | (0.01,0.04,0.12) |
| DT | (0.02,0.05,0.13) | (0.02,0.05,0.12) | (0.01,0.03,0.10) | (0.03,0.06,0.14) | (0.01,0.03,0.10) | (0.02,0.04,0.12) | (0.01,0.03,0.11) | (0.02,0.04,0.12) | (0.02,0.04,0.11) | (0.02,0.04,0.11) | (0.03,0.06,0.13) | (0.03,0.06,0.13) | (0.00,0.02,0.07) | (0.00,0.02,0.09) | (0.02,0.04,0.12) |
| AP | (0.03,0.07,0.15) | (0.03,0.06,0.15) | (0.03,0.06,0.14) | (0.03,0.07,0.15) | (0.02,0.05,0.12) | (0.02,0.05,0.13) | (0.02,0.05,0.13) | (0.03,0.06,0.14) | (0.01,0.03,0.10) | (0.01,0.03,0.10) | (0.02,0.05,0.13) | (0.01,0.03,00.11) | (0.02,0.04,0.12) | (0.01,0.02,0.08) | (0.01,0.03,0.11) |
| CI | (0.02,0.05,0.14) | (0.06,0.10,0.17) | (0.02,0.05,0.13) | (0.03,0.05,0.14) | (0.03,0.06,0.14) | (0.01,0.03,0.11) | (0.03,0.05,0.13) | (0.01,0.03,0.11) | (0.05,0.08,0.15) | (0.02,0.04,0.12) | (0.03,0.07,0.14) | (0.01,0.03,0.11) | (0.01,0.03,0.11) | (0.02,0.04,0.12) | (0.01,0.03,0.09) |
| SO | BI | IT | IN | ST | PO | BT | UF | BS | TS | FL | ID | DT | AP | CI | |
|---|---|---|---|---|---|---|---|---|---|---|---|---|---|---|---|
| SO | 0.07 | 0.12 | 0.11 | 0.13 | 0.08 | 0.13 | 0.13 | 0.13 | 0.08 | 0.12 | 0.13 | 0.13 | 0.10 | 0.10 | 0.12 |
| BI | 0.11 | 0.00 | 0.11 | 0.12 | 0.11 | 0.11 | 0.13 | 0.12 | 0.09 | 0.10 | 0.11 | 0.12 | 0.09 | 0.09 | 0.11 |
| IT | 0.10 | 0.09 | 0.00 | 0.10 | 0.10 | 0.09 | 0.11 | 0.10 | 0.08 | 0.08 | 0.09 | 0.10 | 0.08 | 0.08 | 0.10 |
| IN | 0.09 | 0.09 | 0.09 | 0.00 | 0.08 | 0.07 | 0.09 | 0.08 | 0.08 | 0.00 | 0.07 | 0.10 | 0.08 | 0.08 | 0.10 |
| ST | 0.10 | 0.09 | 0.08 | 0.10 | 0.00 | 0.00 | 0.09 | 0.08 | 0.00 | 0.00 | 0.00 | 0.08 | 0.00 | 0.00 | 0.08 |
| PO | 0.10 | 0.08 | 0.08 | 0.08 | 0.00 | 0.00 | 0.00 | 0.08 | 0.00 | 0.00 | 0.08 | 0.00 | 0.00 | 0.00 | 0.00 |
| BT | 0.11 | 0.00 | 0.00 | 0.00 | 0.00 | 0.08 | 0.00 | 0.00 | 0.00 | 0.00 | 0.00 | 0.08 | 0.07 | 0.00 | 0.00 |
| UF | 0.10 | 0.00 | 0.00 | 0.00 | 0.08 | 0.00 | 0.00 | 0.00 | 0.00 | 0.00 | 0.00 | 0.00 | 0.00 | 0.00 | 0.00 |
| BS | 0.00 | 0.11 | 0.08 | 0.00 | 0.08 | 0.00 | 0.08 | 0.00 | 0.00 | 0.00 | 0.09 | 0.00 | 0.07 | 0.00 | 0.09 |
| TS | 0.00 | 0.00 | 0.00 | 0.07 | 0.00 | 0.08 | 0.07 | 0.00 | 0.00 | 0.00 | 0.00 | 0.00 | 0.00 | 0.00 | 0.00 |
| FL | 0.00 | 0.08 | 0.00 | 0.08 | 0.00 | 0.00 | 0.00 | 0.00 | 0.08 | 0.00 | 0.00 | 0.00 | 0.00 | 0.08 | 0.00 |
| ID | 0.10 | 0.00 | 0.10 | 0.08 | 0.00 | 0.08 | 0.00 | 0.08 | 0.00 | 0.00 | 0.00 | 0.00 | 0.09 | 0.00 | 0.00 |
| DT | 0.00 | 0.00 | 0.00 | 0.07 | 0.00 | 0.00 | 0.00 | 0.00 | 0.00 | 0.00 | 0.00 | 0.00 | 0.00 | 0.00 | 0.00 |
| AP | 0.08 | 0.08 | 0.07 | 0.08 | 0.00 | 0.00 | 0.00 | 0.07 | 0.00 | 0.00 | 0.00 | 0.00 | 0.00 | 0.00 | 0.00 |
| CI | 0.00 | 0.11 | 0.00 | 0.00 | 0.07 | 0.00 | 0.00 | 0.00 | 0.08 | 0.00 | 0.08 | 0.00 | 0.00 | 0.00 | 0.00 |
| Q | B | B + Q | B − Q | |
|---|---|---|---|---|
| Software Functionality (SO) | 1.227 | 1.675 | 2.901 | 0.448 |
| BIM adoption strategies and process (BI) | 1.188 | 1.557 | 2.744 | 0.369 |
| Interoperability (IT) | 1.079 | 1.352 | 2.431 | 0.273 |
| Initial cost of software (IN) | 1.197 | 1.196 | 2.393 | −0.001 |
| Staff competencies (ST) | 0.989 | 1.107 | 2.096 | 0.119 |
| Popularity (PO) | 1.08 | 1.022 | 2.102 | −0.059 |
| BIM software awareness (BT) | 1.14 | 0.922 | 2.062 | −0.218 |
| User friendliness (UF) | 1.076 | 0.736 | 1.812 | −0.34 |
| BIM standard, codes, rules and regulations (BS) | 0.893 | 1 | 1.893 | 0.107 |
| Technical service support (TS) | 0.873 | 0.768 | 1.641 | −0.106 |
| Flexibility to change the workflow and business model (FL) | 1.079 | 0.881 | 1.96 | −0.198 |
| Innovation and research development capabilities (ID) | 1.054 | 0.956 | 2.009 | −0.098 |
| Data security and privacy protocols (DT) | 0.927 | 0.772 | 1.7 | −0.155 |
| Application integration/extension (API) capabilities (AP) | 0.875 | 0.865 | 1.74 | −0.011 |
| Co-operation from other industry partners (CI) | 1.055 | 0.925 | 1.979 | −0.13 |
Publisher’s Note: MDPI stays neutral with regard to jurisdictional claims in published maps and institutional affiliations. |
© 2021 by the authors. Licensee MDPI, Basel, Switzerland. This article is an open access article distributed under the terms and conditions of the Creative Commons Attribution (CC BY) license (https://creativecommons.org/licenses/by/4.0/).
Share and Cite
Patel, T.; Bapat, H.; Patel, D.; van der Walt, J.D. Identification of Critical Success Factors (CSFs) of BIM Software Selection: A Combined Approach of FCM and Fuzzy DEMATEL. Buildings 2021, 11, 311. https://doi.org/10.3390/buildings11070311
Patel T, Bapat H, Patel D, van der Walt JD. Identification of Critical Success Factors (CSFs) of BIM Software Selection: A Combined Approach of FCM and Fuzzy DEMATEL. Buildings. 2021; 11(7):311. https://doi.org/10.3390/buildings11070311
Chicago/Turabian StylePatel, Tirth, Hirakraj Bapat, Daksh Patel, and Jacobus Daniel van der Walt. 2021. "Identification of Critical Success Factors (CSFs) of BIM Software Selection: A Combined Approach of FCM and Fuzzy DEMATEL" Buildings 11, no. 7: 311. https://doi.org/10.3390/buildings11070311
APA StylePatel, T., Bapat, H., Patel, D., & van der Walt, J. D. (2021). Identification of Critical Success Factors (CSFs) of BIM Software Selection: A Combined Approach of FCM and Fuzzy DEMATEL. Buildings, 11(7), 311. https://doi.org/10.3390/buildings11070311