Article

The Relationship between Building Agents in the Context of Integrated Project Management: A Prospective Analysis

by
Alberto Cerezo-Narváez
1,*,
Andrés Pastor-Fernández
1,
Manuel Otero-Mateo
1 and
Pablo Ballesteros-Pérez
2
1
Department of Mechanical Engineering and Industrial Design, University of Cadiz, 11519 Puerto Real, Spain
2
Department of Engineering Projects, Universitat Politècnica de València, 46022 Valencia, Spain
*
Author to whom correspondence should be addressed.
Buildings 2021, 11(5), 184; https://doi.org/10.3390/buildings11050184
Submission received: 3 March 2021 / Revised: 20 April 2021 / Accepted: 22 April 2021 / Published: 26 April 2021

Abstract

:
The increasing complexity of building projects, with high quality standards, integrated technologies and strong management restrictions, demands the intervention of numerous and diverse specialists. This requires an intense leadership, organization and coordination effort. However, building regulations, such as the Spanish Law on Building Management (LOE) 38/1999, only formally consider developers, project designers, project and work supervisors, quality control entities, construction companies, owners and final users as building agents. However, these categories are insufficient to represent the interests of all the stakeholders. The purpose of this paper is to carry out an analysis of the agents that are currently part of the entire building process. If their relationship of influence and dependence, as well as their alignment with the overall objectives of the project are studied, potential convergences, divergences, agreements and disagreements can be established. To do this, the authors conducted a prospective analysis through the MACTOR (Matrix of Alliances and Conflicts: Tactics, Objectives and Recommendations) strategic planning simulation tool, for which the rules of the Delphi technique were applied and a consultation with technical experts, both professionals and academics, was held. The research provides insight to assess the power relationships between the building agents, as well as to measure the alignment of objectives with their interests. Results show that, in the context of integrated project management (IPM), the influence of technical agents is reduced by limiting their functions to those marked by their regulatory framework, allowing them to focus on their legal powers, and the room for manoeuvre of the professional agents, who are subject to systematized monitoring and control, is also reduced. The prospective analysis also highlights the importance of defining the scope from its early stages, as well as the need to reach multilateral agreements based on the other two main constraints: time and cost.

1. Introduction

Despite the poor performance of construction industry projects [1], their contribution to the development of the international economy over the past 40 years has been crucial, in Africa [2], America [3], Asia [4], Europe [5] and Oceania [6]. In Spain, this industry has exemplified the intense and complex crisis the country has suffered over the period from 2008 to 2014 [7], commonly referred to as the Spanish real estate bubble [8].
The performance of construction projects is influenced by many aspects [9], both technical (limitations, constraints and assumptions, risks and opportunities, etc.) and relational (changes, stakeholders’ needs and expectations, etc.). If those involved in the project state their demands at a very early stage [10], then the requirements to be considered in the project definition can be identified early on, which greatly increases the chance of the project completing successfully [11]. Acceptance or rejection of these requests may be the first of several occasions when these interests may call into question the organizational interrelationships between agents [12].
The increasing complexity of building projects, with high quality standards [13], passive and active integrated construction technologies [14], strong restrictions on scope, quality, time and cost [15] and stringent regulations [16], is increasingly demanding that the latter be solved by numerous and diverse technicians and specialised professionals [17]. This requires their management, organization and coordination at all stages of the life cycle of the building process [18].
The construction sector is made up of a wide variety of activities [19], undertaken by a wide range of technical, managerial and professional disciplines. This involves the participation of numerous agents who must interact with each other throughout the entire process. These activities (from the design and its approval to the construction, inspection and completion of the building) must be encompassed by a regulatory framework [20]. In the majority of the countries of the European Union (EU), central authorities are involved in setting building regulations, although regional and local authorities may also be concerned [21]. In Spain, these interactions are established by organizational schemes ranging from the most traditional, governed by custom and reactively adapted by the legislation, first by the Civil Code (CC) [22] and subsequently by the LOE [23], to the most proactive, incorporating new forms of collaboration [24] that are currently challenging these regulations.
Hierarchical relationships between building agents are linked (by regulation or contract) to the life cycle phases. First, the technical project, which spans the time from the developer’s initial idea until this is reflected in a document ready for implementation. During this process, regulatory aspects, selection of construction systems, economic-financial constraints, tenders, etc., arise. Next, the building work, that begins the moment the execution of the technical project is commissioned to the construction company and ends with the building being handed over to the developer. It is during this process that permits are obtained, raw materials are elaborated and supplier selection, product supply, waste management, quality control, etc., take place. This is followed by the usage stage, which is from the moment of the building being handed over until the moment it is no longer in use. This includes processes such as maintenance work. Finally, the end of life, once the building is no longer in use, a process which requires the correct disposal of the materials resulting from dismantling. This point is influenced by the regulatory framework, degree of sensitivity, etc.
In short, the undertaking of a project in the construction industry requires the participation of different and heterogeneous interdisciplinary groups, which can make the social component an element as much or even more important than the technical specifications themselves [25]. In fact, a culture of collaborative work among participants serves to achieve greater productivity [26]. In addition to the lack of definition and/or technical deficiencies that may arise throughout the project [27], the attitude of the stakeholders and their response to these problems is conditioned by their interest and commitment [28]. A lack of cooperation, trust and even communication leads to conflicts [29], hampering the performance of numerous projects in the sector. However, new forms of contract have been incorporated to improve this situation [30], promoting more stable relationships between stakeholders [31], clarifying divergences and emphasising both individual and group convergences.
This research carries out an analysis of the agents that are currently part of the building process in Spain, to evaluate their relationships, in terms of influence and dependence, as well as their alignment (opposed, neutral, indifferent or favourable) with the project’s objectives. To this end, the paper is structured in the following terms: Firstly, an analysis of the legal, socio-economic and structural context of the construction sector in Spain is carried out. Secondly, the relationships between agents and their alignment with the project’s objectives are studied, in the context of integrated management of the building project, for which a prospective analysis is undertaken. Finally, the results obtained are discussed and the most important conclusions drawn.

2. Study Context

European Directive 85/384/EEC [32] highlights the commitment to functionality, economy, harmony and environmental balance of the building process. This regulatory framework compiles the demands of European society in relation to the quality of buildings, which affects both structural safety and fire protection along with other aspects related to the well-being of people, such as noise protection, thermal insulation or accessibility. European Directive 89/106/EEC [33] aims to remove technical barriers to trade in construction products between Member States in the EU. These directives do not intend to harmonise the European legal framework, but rather to provide a common market for construction products and services [34].
In Spain, the starting point is the simple regulation of the CC, prior to regulatory harmonisation with Europe, which only includes project designers, project and work supervisors and construction companies as parties involved, which is not sufficient to cover all situations that arise in the current context. This process ends with the arrival of the transposition laid out in the LOE.
The Spanish CC establishes the contractual obligations of parties involved in a contract, including technical projects and building works. In this context, the contracts are both for services (developers with technical experts) and construction (developers with construction companies). This primal triangular approach contrasts with the diversity of stakeholders currently participating in the complex field that encompasses the building process [35]. The CC has been supplemented by regulations related to consumer and user protection, to the land use and valuation act, and to health and safety in construction.
For instance, Royal Decree 1627/1997 [36], which transposes European Directive 92/57/EEC [37], provides for minimum health and safety measures in construction, and regulates the functions and responsibilities of the agents involved therein. This regulation recognises developers, project designers, project and work safety coordinators, project and work supervisors, construction companies, subcontractors and self-employed workers. Regarding the CC, this divides the action of specialists according to the phase of the process life cycle, incorporates subcontractors and self-employed workers, and introduces safety coordinators.
The LOE examines the roles, obligations and responsibilities of parties involved in the building process, who may occasionally have conflicting interests [38], as well as the safeguards necessary to ensure the quality of buildings and protect end-users. In the context of the LOE, the building agents are all, physical or legal entities, actively involved in the process of building and their obligations must be determined by the provisions of the LOE and the contract arising from their intervention (it can be noted that stakeholders also include those individuals and organizations whose interests may be positively or negatively affected as a result of project execution or successful project completion [39], so all the building agents are stakeholders, but not all the stakeholders are building agents).
The LOE explicitly recognizes developers, project designers, construction companies, project and work supervisors, building quality control entities, product suppliers, owners and users. However, this also implicitly recognizes consultants (topography, geotechnics and environmental impact), waste managers and insurance companies, as well as partial designers and supervisors (for the structure and facilities). In the case of project designers, safety coordinators and project and work supervisors, certain university degrees are required to be able to carry out these functions in the building process. In the LOE, these powers are reserved for architects and technical architects (quantity surveyors), as well as for different branched of engineers and technical engineers, depending on the use of the building.
Additionally, the LOE is committed to ensuring suitable acoustic conditions, energy-saving, structural and fire safety, promoting innovation and technological development and obtaining more comfortable, safe and economical results for users, as well as being competitive and sustainable for society. For this reason, the LOE finally establishes a harmonised standard with the European Directives. This revision of the legal regulatory framework shows most of the parties involved in a building project in Spain. However, in the 20 years since the newest building regulation came into force, new agents have been incorporated or other agents that were already appearing intermittently throughout the process have been consolidated.
Among the building agents that are not explicitly included in the building regulations, the project managers must be highlighted [40], who in Spain are not assigned their own powers nor subject to specific regulation [41]. They are exclusively contracted by the developers to manage the entire building process. To achieve the agreed objectives, the activities of the project lifecycle will have to be organized. To do this, the stakeholders will need to be coordinated, including the building agents, teams must be led, available resources must be programmed according to constraints, and the risks must be controlled. In short, the project must be managed. Other noteworthy agents are [42]:
  • Control entities and sponsors, such as financial institutions and insurance companies [43], as well as self-regulatory professional bodies, which in Spain are professional associations that check building requirements [44].
  • Technicians, such as consultants of topographical and geotechnical studies, partial designers of technical projects (or subcontractors of project designers), interior designers, landscapers and decorators [45], as well as partial supervisors of work construction (or subcontractors of work directors).
  • Managerial agents, such as site foremen [46] (who traditionally represented the contractor but are being independently incorporated as construction managers [47]) and waste managers [48] (dealing with recycling, valorisation and disposal).
  • Specialised professionals [49], such as construction subcontractors.
After the publication of the LOE in 1999, the construction sector became one of the drivers of the Spanish economy [50], due to its contribution to gross domestic product (GDP), its capacity to generate jobs and the multiplying potential of other auxiliary industries, until the bursting of the real estate bubble [51], when it halved its share of national GDP from 10.41% in 2008 to 5.22% in 2014. In addition, according to data from the National Statistics Institute (INE), in these last 20 years, although productivity in civil engineering works has almost doubled (up 88.27%), in building it has barely increased by 1.74% [52].
The reality of the building sector in Spain led to the incorporation of new contracting formulas beyond the traditional contract, with the aim of optimising investment, applying technological advances and ensuring the construction and delivery. Among these organisational models, those which stand out are the project and construction (turnkey) model [53] and the IPM [41]. Other contract types less used in Spain are the accelerated construction process, the build–own–operate–transfer (BOOT) model, the engineering model and open book pricing, among others.
The traditional model is one in which, on the one hand, the developer contracts the architectural and/or engineering services to design the technical project and assume the functions and responsibilities of the supervision of the work, and, on the other hand, formalises a construction contract with the construction company for the material execution of the work and coordination of subcontractors. In this way, the whole process is divided into the celebration of two non-concurrent main contracts:
  • Between the developer and the technicians, by which they undertake to define the technical specifications of the building work and even prepare the tender, advising on the choice of the construction company, as well as supervising the execution of the building work.
  • Between the developer and the construction company, by means of which, the latter is obliged to the developer to carry out the work in accordance with the technical project. As the technical project was designed prior to the tender, this promotes competitiveness among bidders, reducing the problems of a lack of definition or contradictions that may arise. This avoids a conflict of interest between construction companies and technicians as they are independent of one another. However, these contracts do not provide for an organisational and systematic structure that considers all stakeholders’ needs and expectations, nor a system of proactive control of the developer’s objectives [54], which may result in delays in delivery, cost overruns, and inability to resolve future claims [55].
The turnkey contract modifies the roles played by the agents involved [56]. This contract reduces participants in the construction process to two: developer and construction company, in a bilateral relationship, with the construction company assuming responsibility for the entire process [53] to deliver a complete, proven and ready-to-use building. Under this general obligation, the construction companies carry out the technical definition of the project, execution of the work and commissioning of the building, which implies a greater specialisation and technological contribution compared to traditional contracts.
In relation to the traditional model, the IPM contract involves the participation in the building process of a fourth agent, the project manager, who assumes functions that in the traditional model are usually partially exercised by the developer, the design team and the project and work supervisors. These management contracts involve organizations that direct, manage, plan, coordinate, supervise and control works, resulting in a reduction in the time and costs associated [57]. In the building process, the IPM advises on design, monitors quality, inspects, consults contracts and makes binding decisions with other agents, through the management of both the project and the work.

3. Prospective Analysis

How can the power relationships of each building agent be determined? What is this relationship between interests? Is it possible to measure these interactions? How can they be measured? How do the positions of the stakeholders within the project impact its outcome? To answer these research questions, a prospective analysis has been done. Prospective analysis is a qualitative method that is based on action and non-predetermination using specific methods for setting out a range of future scenarios [58]. This methodology includes a stakeholder analysis of the parties involved in the system to be studied. To undertake this stakeholder analysis, the MACTOR strategic planning simulation tool is used [59] because of its facilitation and systematisation capacity. This tool is designed to assess the power relationships between the project stakeholders, as well as to measure the alignment of objectives from the associated particular interests [60].
The MACTOR method seeks to gauge the balance of power between stakeholders and study their convergences and divergences when faced with a certain number of associated objectives, allowing them to determine alliances and coalitions and avoid conflicts [61]. This tool provides an analysis to predict the future behaviour of stakeholders that operate in a project: What is their position in relation to this or that problem? With whom could alliances be formed? How strong are they? How reliable are they? With whom will it be more difficult to negotiate? These are some of the major uncertainties addressed by the MACTOR tool.
This methodology has already been successfully applied in other economic sectors, such as fishery and aquaculture [62], agri-food [63], sustainable development [64], higher education [65], renewable energy [66], government [67], creative industry [68], telecommunications [69] and tourism [70], among others.
The MACTOR analysis requires a sequence of steps [71] that can be described in these three stages:
  • The building agents (parties actively involved) as well as the strategic objectives of the entire building process are identified.
  • The data are entered into the software, converting qualitative data in accordance with prescribed procedures, with which the results are obtained:
    • Identification of the strategic stakes and associated goals and of the position of each actor according to each objective.
    • Pinpoint convergences and divergences.
  • The data are analysed to make recommendations or proposals to the building agents, based on their relationships and positions regarding the project objectives (for example, formulating strategic recommendations and asking key questions for the future).
As the sequence of steps progresses, MACTOR produces tables and graphs. These results obtained will provide a clearer picture of how the system actually works. However, it is necessary to define one step prior to carrying out this method: to establish the data sources which will feed the system. These data may come from content analysis, literature review, seminars, workshops, questionnaires and interviews with stakeholders or experts [72]. In this research, results will come from a panel of experts, using the Delphi technique. Identifying and selecting suitable opinion experts is crucial for the success of the research [73], becoming one of the most critical actions in the whole process [46]. Although these experts can have differentiated decision-making habits, risk preferences or knowledge backgrounds [74], the useful guidance provided by them indicates that they are confident in the field [75]. Once the process starts, the experts arrangement through the Delphi Technique allows the level of consensus and the hierarchy of its importance [76] to be determined.

3.1. Selection of Experts

The Delphi technique has to be executed with the participation of individuals who have knowledge and competence in the study subject, as well as a deep understanding of the problem [77]. Accordingly, to be part of the initial sample, it is necessary for the panel members to be building experts. To do this, initial requirements included having both relevant experience and deep knowledge on the subject (building life cycle, building project management, construction management, construction engineering, legal regulatory framework, real estate promotion, etc.), so academics who are or have been professionals, and professionals who are or have been academics were sought. In addition, in order to avoid bias, candidates had to meet four additional requirements:
  • Expertise, either in building project management or in construction management, or in designing technical projects or directing works. Ten years of experience are required, having participated in at least five projects of more than one million euros each. The possession of professional project management certifications is positively valued.
  • Relevant teaching experience, with at least another ten years of acknowledgement (two recognized five-year periods) in this field.
  • Pioneering research, with at least twelve years of impactful research (two recognized six-year periods) in this field.
  • Transfer experience, with at least five collaboration contracts in this field with companies for applying research findings in a specific context.

3.2. Identification of Agents and Strategic Objectives

Once the panel of experts is formalized, a preliminary list is extracted from the current legal framework for the identification of agents. This is distributed to the panel of experts to suggest changes and comments, indicating that the research is conducted in the context of a IPM contract comprised of the technical project and the building work. This took two rounds (after a first round in which some actors not explicitly included in the regulation were proposed and some clarifications were made) to reach an agreement. Table 1 shows this final list, including the main phases of the process in which the building agents participate. On the contrary, a preliminary list of strategic objectives is extracted from the literature review of the last two decades. This is distributed to the panel of experts to suggest new references. Although no objectives were added or removed, some references were included, as shown in Table 2. Classic managerial objectives such as cost, time, quality and scope (of work) [78,79,80,81] are joined by instrumental objectives such as health and safety and environment [82,83,84,85,86] and communication [87,88], technical and professional objectives such as functionality, productivity and technical performance [89,90], and client objectives such as profitability [91,92] and customer satisfaction [93,94]. From Table 1 and Table 2, both questionnaires are sent to the expert panel.

3.3. Data Collection

In relation to the agents, following the instructions of the MACTOR tool, a hierarchical classification is carried out using the matrix of direct influences (MDI), quantifying the direct influences (DI) and dependences (DD) between agents, in accordance with a scale of 0–4: (0) if agent Ai cannot question agent Aj, (1) if agent Ai can question agent Aj’s operations (limited in scope and time), (2) if agent Ai can question the choice of agent Aj, (3) if agent Ai can question agent Aj’s roles, and (4) if agent Ai can question the existence of agent Aj.
Regarding the objectives, there is to determine the position of agents in relation to each objective, which is represented in the valued positions matrix (2MAO). To do this, first it must be determined whether the agent is favourable or unfavourable towards the objective: (+) if agent Aj is in favour of objective Oi, (−) if agent Aj is against objective Oi and (0) if agent Aj is neutral towards objective Oi (this represents the simple positions matrix (1MAO)). In second place, the intensity of the agent’s position on that objective is measured: (0) if objective Oi has little or no impact, (1) if objective Oi can question (limited in scope and time) the operations of agent Aj or is essential to them, (2) if objective Oi can question the choice of agent Aj or is essential for it, (3) if objective Oi can question the performance of agent Aj’s duties or is essential for them, and (4) if objective Oi can question the existence of agent Aj or is essential for it.
Experts must consider each agent’s plans, motivations, limitations and means of action. The estimations of the experts are made in successive anonymous rounds, with maximum autonomy on the part of the participants. The experts are asked to include appropriate comments to justify their answers, so that the other experts can reason this out in subsequent rounds. The consultation process ends once an agreement is reached. In order to obtain the MDI and 2MAO, this agreement is achieved through the consensus among panel members (convergence of opinions expressed) and the stability of their responses (limited variation in the responses given by the group). On the one hand, consensus is obtained across the interquartile range (IQR), by calculating the difference between the third quartile (Q3) and the first (Q1), with a variation equal to or less than 0.5 being accepted [97]. On the other hand, stability is calculated using the relative interquartile range (RIR), which results from dividing the IQR by the second quartile (Q2), and is accepted if the variation is less than 0.3 [98]. It can be noted that the values entered in MACTOR represent the median (Q2) for each cell value, once it is verified that both the IQR and RIR do not exceed the maximum permitted values for each row i and column j. Then, the software subsequently evaluates the power relationships between them.

3.4. Relationships between Agents

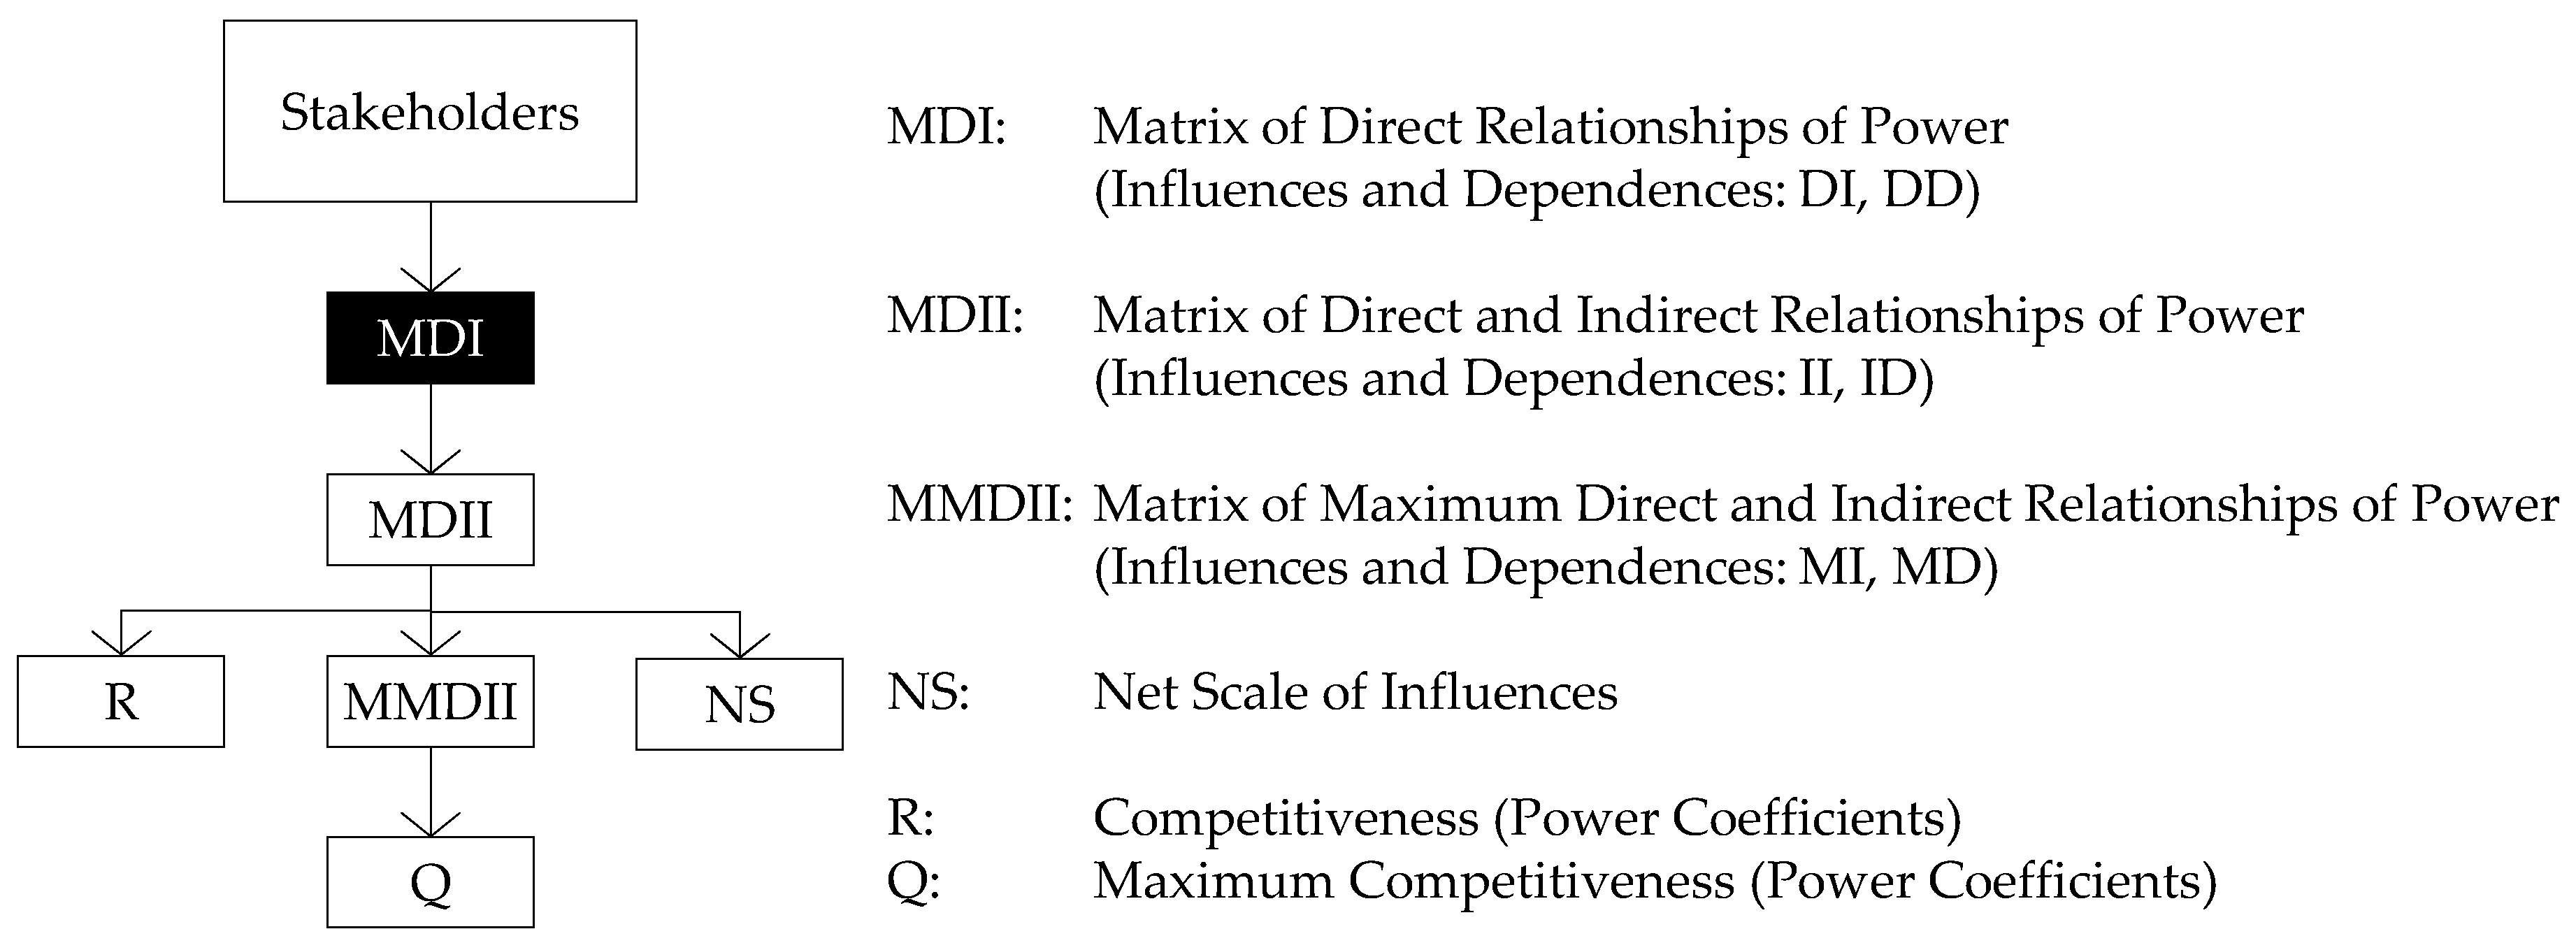
If the influences that each agent has on the others are added together, without considering the indirect self-influences, the matrix of direct and indirect influences (MDII) is obtained, which shows the direct and indirect influences and dependences (II, ID) of second order between agents [60]. Next, using the MDVI, the competitiveness relationship (Ri) between agents is also determined, considering both influences and dependences and their retroaction. These relationships ascend as their influence increases (and/or their dependence decreases) and vice versa, anticipating the pre-eminence of one agent over another. Then, the net scale (NS) of influences is determined, measuring for each pair of agents the distance between DI and II, indicating for each pair of agents the surplus influence exerted or received (which translates into the most and least influential agents). After that, the influence-dependence graph between agents is obtained. This graph shows the degree of dependence on the X-axis and the impact of influence on the Y-axis. Thus, agents are classified into four types: dominant (very influential, not very dependent), intermediary (influential, but also dependent), autonomous (not very influential and independent) and dominated (not very influential, very dependent). Finally, the maximum level of influence that an agent can exert on another agent, directly or through a intermediary agent, is identified, and the matrix of maximum direct and indirect influences (MMDII) is obtained. From the MMDII, the maximum competitiveness ratios (Qi) are determined, summarizing in a single value the degrees of maximum influence and dependence of each agent, giving a measure of their real relationships [99]. This process is summarized in Figure 1:

3.5. Alignment of Agents and Objectives

The 2MAO matrix quantifies the agents’ positions on the objectives. From this, the simple position matrix (1MAO) is obtained, focused on the agents’ assessments, indicating each agent’s position on each objective (for, against or neutral). If the values of the MIDI and the 2MAO are combined, the valued weighted positions matrix is obtained (3MAO), which considers the degree of opinion of each agent on each objective, hierarchy and competitiveness. Positive values represent the acquiescence of agents in achieving their objectives and negative ones represent their opposition to achieving them. Each of the three matrices provides the number of agreements (OK) and disagreements (KO) of the agents with the objectives and the convergences (CV) and divergences (DV) between agents, as well as their mobilisation (MB). Once these matrices are calculated, the net distances between agents can be obtained, which allows potential alliances to be recognized, as well as the net distances between objectives. The conjunction of these two allows shared and contrary positions to be determined according to agent and objective, enabling these common agreements to be worked on [99]. This process is summarized in Figure 2:

4. Results

A total of eighteen respondents finally participated from 15/04/2020 to 14/10/2020, after accepting the proposal for participation and meeting the requirements established to be considered experts. The invited group of experts came from six areas of knowledge (Architectural Buildings, Administrative Law, Civil Law, Construction Engineering, Architectural Projects and Engineering Projects) from eight Spanish universities, accumulating an average of forty-one building projects (from six to one hundred and thirty-nine projects), five five-year periods of teaching experience and four six-year periods of research (from thirteen to forty-seven years), and sixteen transfer contracts (from five to thirty-six), as is shown in Table 3. In summary, the experts have extensive experience in building-related research and teaching, as well as active participation in numerous construction projects, demonstrating their expertise in the generation, dissemination and transfer of knowledge in the field.
Once the group of experts was obtained, they proceeded to weigh the direct relationships between agents (getting the MDI) and of these agents with the general objectives of the project (getting the 2MAO). To this end, they are provided with the final list of the building agents and the overall objectives, so that these can be assessed, according to the scales defined. In the case of stakeholders’ relationships of power, the experts reached an agreement after the third round in the MDI (with an IQR of 0.42 and a RIR of 0.24). In the case of the position of stakeholders with regard to the project objectives, the experts reached an agreement in the fourth round in the 2MAO (with an IQR of 0.48 and a RIR of 0.28). The resulting final matrices are shown in Table 4 and Table 5.
After consensus and stability were achieved in the expert panel consultation, the matrices’ data (MDI, 2MAO) were loaded into the MACTOR software (version 5.1.2). Through this tool, the results processed were subsequently analysed, establishing hierarchies of the relationships between the agents, as well as the relationships of the agents with the project objectives. This information is of great relevance, since from it the prospective analysis of building agents is generated.
Table 6 summarizes both direct, indirect and maximum influences and dependences between agents: DI, DD, II, ID, MI, MD. Directly, the great influence wielded by project managers with 53 points (as managerial leaders during the whole process), the public administrations and the professional associations with 17 points (as controllers of legal and technical requirements), project designers with 26 points (as technical leaders during the technical project) and project and work supervisors with 16 points (as technical leaders during the building work) can be highlighted. However, if indirect influences are also considered, although project managers remain the most influential agents (with 226), project designers (with 102) and project and work supervisors (with 125) lose their position to public administrations (with 157) and professional boards (with 128). If maximum influences are considered, project managers (with 75), project designers (with 36), public administrations (with 32) and project and work supervisors (with 30) must be stressed. In terms of dependence, the position of professional associations, project designers and construction companies stand out, both in direct and indirect terms. The entire MDII and MMDII matrices are shown in Table A1 and Table A3 (see Appendix A).
Table 7 (see the entire matrix in Table A2) collects the net scale: NS of influences for each agent. In this case, the net influence of project managers (with 209 points), public administrations (with 157), construction managers (with 84) and project and work supervisors (with 81) stands out, as well as the net dependence of product suppliers (with 82 negative points), self-employed workers (with −73) and even construction companies (with −69). Additionally, Table 8 draws the competitiveness (and maximum competitiveness): Ri, Qi in each agent’s case, in which the positions of project managers (by delegation of the developers), real estate developers (as direct clients) and public administrations (for their power to demand legally compliant solutions), as well as construction managers (as assistant project managers during the construction phase) and owners (due to exploitation of the promotion) highlight above the rest. The project designers are in an intermediate position, even though they have the intellectual right to the object of the construction. Likewise, those responsible for ensuring that the work is carried out in accordance with the contracts and the rules for smooth construction (project and work supervisors and control entities) are also at an intermediate level of the hierarchy. On the other hand, the actors in charge of materialisation (main and specific contractors) are at the bottom of the scale and are highly dependent on the other agents involved.
Table 9 summarizes simple, valued and weighted valued of convergences and divergences: CV, DV between agents (see the entire matrices in Table A4, Table A5, Table A6, Table A7, Table A8, Table A9, Table A10 and Table A11). Both in terms of alignment and mobilisation, the position of project managers and construction managers stands out for their contribution to the leadership, organization and coordination of the process. In addition, project managers are also highlighted in terms of divergence, along with the real estate developers, who are the initiators of the entire building process and recruiters directly or indirectly of most of the participants. Additionally, it is worth noting the neutral position of public administrations and professional associations. Finally, Table 10 summarises the simple, valued and weighted valued of agreements and disagreements: OK, KO, as well as the mobilisation: MB that the objectives cause between the agents. The objective that achieves the most agreements is the project scope (with 31, 104 and 90.9 points, respectively), followed by the project quality (with 31, 88 and 71.4) and the technical performance (with 28.77 and 74.3), all of them related to compliance with requirements. On the contrary, the objectives that cause the most disagreements among agents are the project cost and time (with −27, −73 and −67 points), the other two elements of the “triple constraint”, followed by its profitability (with −25, −47 and −30).
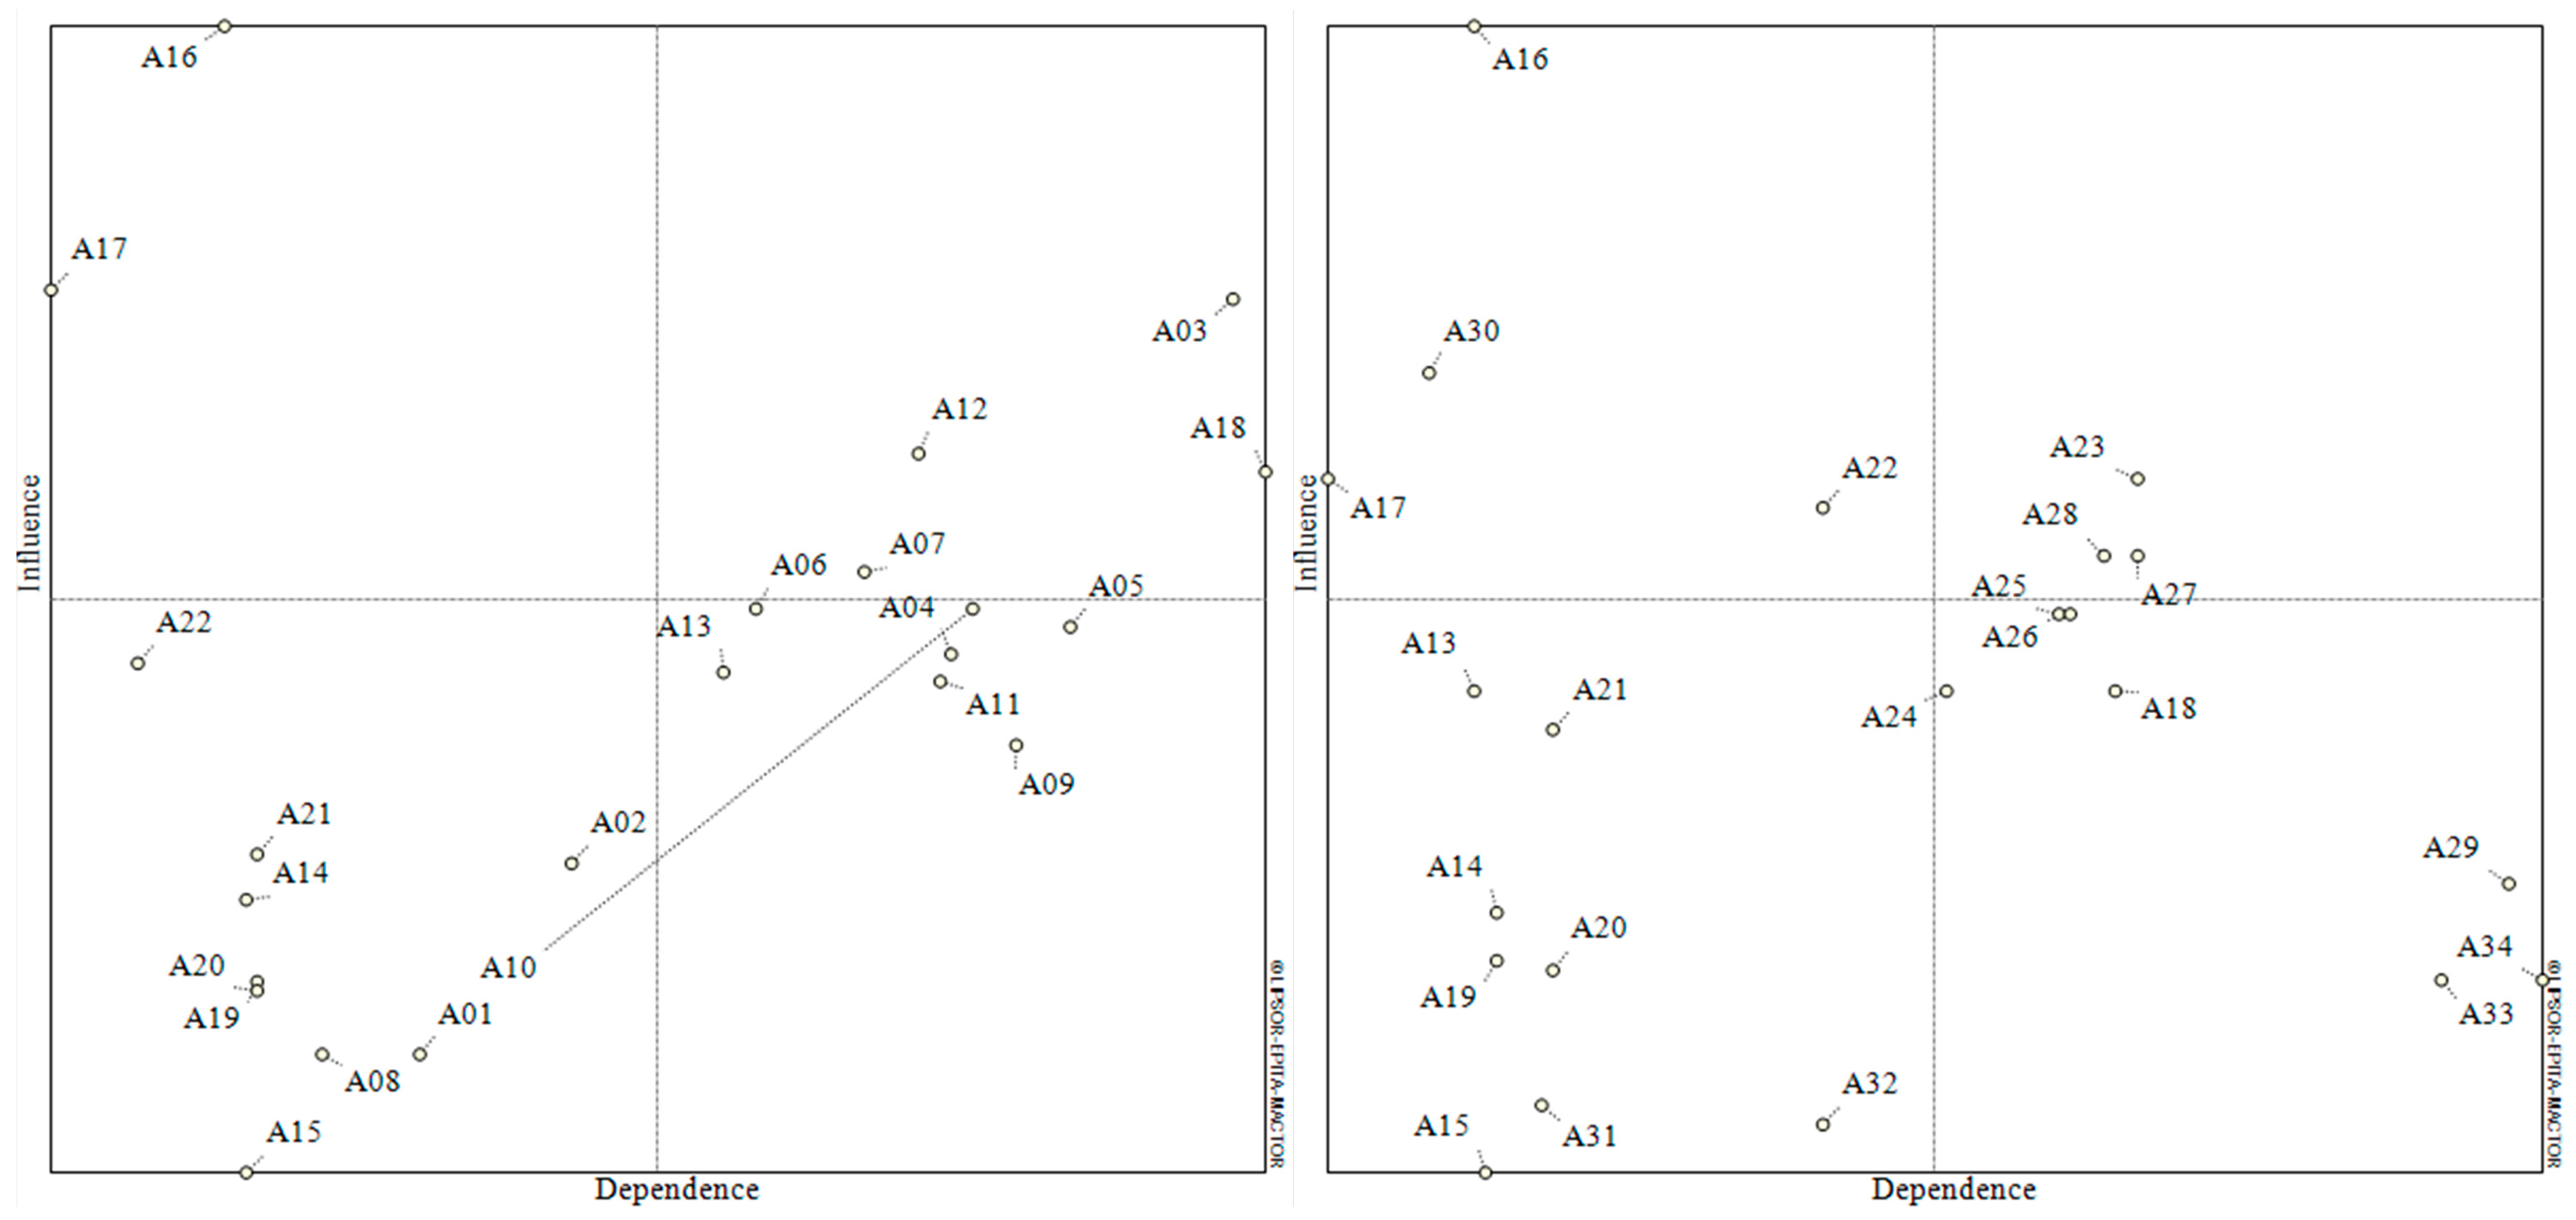
Figure 3 shows the map of relationships between agents, differentiating between the technical project and the building work. In both stages, the dominant position of project managers and public administrations stands out, whereas the construction managers do so during the building work. In addition, real estate developers, owners, end-users, financial institutions, insurance companies, control entities and waste managers also act as autonomous agents throughout the whole process. During the technical project, the main figures recognised as building agents in the LOE (project designers and telecommunications designers) act as intermediary agents (together with health and safety coordinators and professional associations), and those outsourced by them (structural designers, facility designers, energy efficiency certifiers and project health and safety coordinators), as dominated agents (together with environmental consultants, health and safety planners and use and maintenance planners). In contrast, owners, end-users, financial institutions, insurance companies, and control entities do so as autonomous agents, as well as topographical and geotechnical consultants and interior designers, landscapers and decorators. During the building work, those figures recognised as building agents in the LOE (work directors, executive work directors, telecommunications supervisors and work health and safety coordinators) also act as intermediary agents, and those outsourced by them (structural and facility supervisors), construction companies and their entire supply chain become dominated agents.
Figure 4 shows the net distances between agents in relation to their positions on the project objectives. During the technical project, it is worth noting the distance between the technical agents explicitly listed in the LOE and their subcontractors (who may also act as partial technical agents, hence their conflicting positions). On the other hand, during the building work, it is worth noting the distance between the construction managers and the construction companies and their entire supply chain (thanks to this position, directors and supervisors can focus on the fulfilment of requirements). However, both in the technical project and in the building work, the aligned position of real estate developers, owners, end-users (as direct and indirect clients) and project managers stands out. Finally, Figure 5 shows the net distances between objectives. During the design of the technical project, it is worth noting the distance between the scope and quality (stressing the difference between doing the right things and doing the things right) and between cost and time (as the reverse side of the same purpose), as well as the alignment between health and safety and environment. On the other hand, during the building work, it is worth noting both the distance between scope and quality, and cost and time (as in the design of the technical project). On the contrary, throughout the whole process, the alignment of profitability, productivity and technical performance stands out.

5. Discussion

Scenario analysis based on prospective tools [99] has proven useful in preparing possible potential scenarios. This is one of the crucial stages of planning [100], as the resolution of conflicts stemming from having differing individual goals conditions the evolution of the project. In this setting, once the relevant agents in a IPM context are identified, a stakeholder analysis has made it possible to understand their power relationships and alignments. This improves stakeholder management, which is a key factor in achieving optimal outcomes [101]. Nevertheless, this would require consistent behaviour on the part of agents in achieving their goals, which may not happen, as they are reluctant to reveal their strategic approaches and their means of action. Therefore, instead of using the stakeholders themselves as a method for gathering the data [102], a panel of experts using the Delphi Technique [103] is established, with a notably neutral nature. If reliable information is available, the needs of stakeholders relating to information [104] can be grouped by their alignments, agreements and convergences.
From a theoretical point of view, the results of the MACTOR analysis explain that the influence and interdependence between stakeholders show the strength of the competitiveness of stakeholders in determining the objectives to be formulated. The higher the competitiveness, the stronger the influence in accommodating each other’s interests. The MACTOR score also indicates the level of stakeholder approval. In addition, this score shows the convergence and divergence between stakeholders and compiles their agreements and disagreements. Thanks to the measurement of the relationships of power of each pair of stakeholders and the position of each stakeholder with respect to each objective provided by the panel of experts, the MACTOR tool allows the:
  • Creation of agents’ strategy, once their goals, objectives, preferences, motivations, constraints, coherence and attitude are identified.
  • Identification of strategic stakes and their corresponding objectives, once converging and diverging objectives between agents are determined.
  • Position of each agent with respect to the strategic objectives.
  • Gathering of all possible tactics (alliance and conflict games), once the stakeholders’ position with respect to the different objectives is evaluated.
  • Calculation of the competitiveness between stakeholders, once the structure of direct and indirect influences is analysed.
  • Integration of the competitiveness of each stakeholder to the degree of his/her/its positioning with respect to objectives.
  • Formulation of strategic recommendations and key questions for the future, which are beyond the scope of this research.
From a practical point of view, the network of influences and dependences between the agents and their position regarding the overall objectives allows potential conflicts and alliances to be identified, thanks to their agreements, disagreements, convergences and divergences. Thanks to prospective analysis, the direct and indirect influences between each pair of agents, as well as their dependences, are known. Once the agreements, disagreements, convergences and divergences of these agents with respect to each project objective are known, alliances can be established and conflicts avoided. This can apply to different regulatory frameworks and different contract modalities between the agents involved in the building process, thanks to the MDI (which measures the jeopardy between each pair of agents) and 2MAO (which measures the intensity of the priority of each objective for each agent) matrices. Different contexts will lead to different relationships of power between agents and different positions of the agents with respect to the project objectives, but thanks to MACTOR it will be possible to gather all possible tactics (alliance and conflict games). In summary, this tool enables the visualisation of agent groups (with converging interests), their apparent degree of freedom, also to identify those agents potentially more at risk and to analyse the stability of the system.
IPM contracts generate multiple benefits in organisations, reducing the failure rate of projects undertaken [105], so that traditional contracts included in the Spanish LOE are being superseded. Despite not being explicitly included in the Spanish legal system, the figure of the project manager (for the entire building process) and of the construction manager (for the contracting and building work), must be highlighted for their central roles. In this study, both project and construction managers achieve the highest number of convergences, establishing the greatest number of relationships with the other agents. In this way, this study can be used as a precedent in Spain to address the responsibilities of these agents, placing them fully in the building process, despite having no specific professional powers reserved [41]. However, all the agents must reflect their respective interests in defining the project from the beginning [10], for which they must know the hierarchical structure of their relationships, specially project designers and work supervisors, which are the following agents in number of convergences and play the managerial roles in traditional contracts [106]. Accordingly, the IPM places the Spanish system in an international context, mitigating the effects of the singularity of the Spanish regulatory framework [44] related to the roles, functions and responsibilities of the active stakeholders (buildings agents) that are present during the process. On the contrary, the neutral position of final users (because they are not present during the building process), public administrations and self-regulatory professional bodies can be stressed.
With regard to the position of each agent with respect to the project objectives, in this study the scope objective has achieved the most agreements among the building agents identified (90.9%). This result is aligned with the literature that holds that most of the conflicts and crises between building agents that occur in a building project stem from a lack of (or mis-) definition [107]. This lack of definition can lead to moments of tension when responsibility is sought from the rest of the agents. In fact, the lack of cooperation between agents has been identified for almost 20 years as one of the biggest causes of deficiency in the construction industry [108]. In this scenario, knowing about their relationships of power is critical to finding a solution to these problems. In addition, the quality and the technical performance objectives are the second (76.4%) and third (74.3%) most agreed objectives, respectively, confirming that legal and stakeholders’ requirements must be considered, but doing it in an effective and efficient manner. This contributes to client satisfaction [109], the fourth objective with the most agreement among the agents in this study (61.5%). The following objective to be taken into account was productivity (57.8%). This contrasts with the lack of productivity in the Spanish building sector, which has barely increased by 1% in the last 20 years, despite the increase in the turnover of Spanish construction companies in recent years. The rest of the objectives do not reach 50% agreement, although health and safety and environment are close (44.7% and 46.4%, respectively). Functionality (28.9%), communication (28.3%) and profitability (23.0%) are only around 25%. On the contrary, cost (4.5%) and time (3.4%) generate the greatest disagreements among agents, becoming another two of the major sources of failure in construction projects, as stated in the literature [110].

6. Conclusions

The Spanish model related to the organization of enabling degrees and professional practice is a specific model that is not widespread in Europe. Certain academic degrees legally have their own sphere of competences that directly enable the practice of a profession in the construction sector (aeronautical, agronomic, civil, geological, industrial, mining, organizational, telecommunications and topographical engineers and technical engineers, as well as architects and technical architects), ensuring their presence in the building process, which is not the case in other countries. However, although this is not mandatory, these agents participate in the process in different countries of the EU, although under different names, but with similar roles and responsibilities (safety managers instead of health and safety planners or project and work health and safety coordinators, quantity surveyors instead of work supervisors, etc.).
The IPM contract allows technicians to focus on the functions explicitly included in their professional powers, (technical design of the projects and/or subsequent supervision or coordination of the works). This frees them from other management tasks (requirements analysis, quality plans, budgets, certifications, obtaining administrative licenses, selection of suppliers, comparison of offers, etc.), which are performed implicitly in the traditional contract, often without remuneration or specific preparation to do so.
According to the objectives outlined in this research and answering the research questions (defining and determining the relationships of power between building agents and their position in relation to the overall objectives of the project), it was necessary to select a method that allows analysis of both the qualitative and quantitative variables that make up the different scenarios, their characteristics, interdependencies between them and their limits. MACTOR is a simple but useful tool that leads to a better understanding of the power play and relationships between building agents. The added value provided by MACTOR derives mainly from the position of the agents in relation to their goals, as well as from the tactics for possible alliances and conflicts and strategic recommendations to prevent potential future scenarios based on their agreements and convergences and taking into account their disagreements and divergences. In this sense, thanks to the compilation of data from the matrices of dependences and direct influences (MDI) and valued positions (2MAO), the necessary information is obtained to understand the relationships between agents and their alignment with the objectives, which allows their behaviour to be predicted, allowing possible problems between agents, as well as deviations from the project’s objectives, to be prevented.
These analyses are applicable in situations that are difficult to foresee, in which multiple actors are involved and varying interests, perspectives, and options collide. The MACTOR results explain that the influence and interdependence between active stakeholders and show how powerful the competitiveness of stakeholders is in determining the overall objectives to be formulated. The higher the competitiveness, the stronger the influence of building agents in accommodating the interests of each agent. The methodology employed is not only an instrument that helps in decision-making itself, but it also provides an instrument for group use.
The study of building agents shows the importance of project managers, as drivers (and leaders) of the projects, exerting decisive influence over the other agents. It is also worth noting the role played by public administrations (for their ability to demand solutions that comply with legality), by construction managers (as assistant project managers during the construction phase of the building), by developers (as direct clients) and by owners (as holders of the property). The designers are in intermediate positions, despite possessing the intellectual rights of the object of construction. In addition, those responsible for implementing contracts and projects accordingly and to good construction standards (project and work supervisors and control entities) are also at an intermediate level of hierarchy. On the other hand, those agents involved in implementation (main and specific contracts), are at the lower end of the scale, presenting a strong dependence on the other agents involved.
The study of the project objectives shows that correct scope is essential for good project completion. However, the other two main constraints (time and cost) are the objectives that cause the greatest conflict of interest among building agents. With regard to the agreements and disagreements that these cause between agents, the greatest convergences occur between project managers and construction managers, exceeding those that occur between them and agents with specific professional power. Conversely, the greatest divergences are between project managers and developers, owners, financial institutions and insurance companies, although these divergences are five times less than the convergences outlined. The presence of managerial agents thanks to the IPM contract allows developers to delegate operational decisions, technicians to focus on their technical goals without assuming functions not explicitly included in their contracts and professionals to be controlled.
In short, the stakeholder analysis reflects that, in an IPM contractual context, the influence of technical agents (project designers and project and work supervisors) is reduced by limiting their functions to those marked by the regulatory framework, as well as reducing the room for manoeuvre of professionals, subjected to systematised monitoring and supervision, whose mission is masked in other forms of contract (for technicians in the traditional model and for professionals in the turnkey model). In addition, prospective analysis highlights the importance of defining scope (and quality) from the early stages of a project, as well as the need to reach multilateral agreements based on the other two main project constraints: time and cost, based on the convergences and agreements that the technical performance provides. However, further research is required to adjust policies, strategies and routines that ensure potential future scenarios. Given that this study is the first study, it is recommended to continue this line of research with another tool from the prospective analysis, such as MICMAC, that is a structural prospective analysis used to study indirect relationships and MULTIPOL, which is another prospective analysis used to compare different actions or solutions for problems according to multiple criteria and policies.

Author Contributions

Conceptualization, A.C.-N.; methodology, A.C.-N., A.P.-F., and M.O.-M.; validation, P.B.-P.; formal analysis, A.C.-N. and P.B.-P.; investigation, A.C.-N., A.P.-F., and M.O.-M.; resources, A.C.-N.; data curation, A.C.-N.; writing A.C.-N. and P.B.-P.; original draft preparation, A.C.-N., A.P.-F., and M.O.-M.; writing—review and editing, A.C.-N. and P.B.-P.; supervision, A.P.-F. and M.O.-M.; funding acquisition, A.C.-N. and P.B.-P. All authors have read and agreed to the published version of the manuscript.

Funding

This research received no external funding.

Institutional Review Board Statement

Not applicable.

Informed Consent Statement

Not applicable.

Data Availability Statement

All the data are included in the article (Table 4 and Table 5) and Appendix A (Table A1, Table A2, Table A3, Table A4, Table A5, Table A6, Table A7, Table A8, Table A9, Table A10 and Table A11).

Acknowledgments

All authors acknowledge the help received by the research group TEP-955 from the PAIDI (Junta de Andalucía, Spain). The first and last authors acknowledge the help received by the research project PIN-0053-2019 by the Fundación Pública Andaluza Progreso y Salud (Junta de Andalucía, Spain).

Conflicts of Interest

The authors declare no conflict of interest.

Appendix A

Appendix A contains the entire MDII, MMDII, 1MAO, 3MAO, 1CAA, 1DAA, 2CAA, 2DAA, 3CAA and 3DAA matrices.
Table A1. Matrix of Direct and Indirect Influences (MDII). Extracted from MACTOR Software version 5.1.2.
A01A02A03A04A05A06A07A08A09A10A11A12A13A14A15A16A17A18A19A20A21A22A23A24A25A26A27A28A29A30A31A32A33A34
A011111111111111000010000000000000000
A021244313133232000040000000000000000
A03231210118618810741110141000111111000000
A042377646155443000070000111111000000
A052276756155553000080000111111000000
A062276756155553000080000111111000000
A072276756155554111081000111111000000
A081111111111111000010000000000000000
A092353433155552000060000111111000000
A102364544166664111071000111111000000
A112363543166662000070000111111000000
A1223968561777741110101000111111000000
A133320022422222435005743200222340004
A141110011111113452003331100111110001
A150000000000000000000000000000000000
A164513910685877762120222455878887104341013
A17231089581876762110122112656666601166
A18231178561887740000150000645566600066
A190111100000003322003430111110000000
A200111100000003322003230111110000000
A211343221144331000080000534455500055
A2212645341655530000120003645566901399
A231111111011110000090003678566801388
A241111111011110000050003444444601366
A251111111011110000060003545555701377
A261111111011110000060003545555701377
A271111111011110000070003645566801388
A281111111011110000070003645566801388
A290011101010010000000003111111504755
A30111001111111010106011474567710113910
A310000000000000000000001000000201211
A320000000000000000000001000000101111
A330011101010010000000003111111401333
A340011101010010000000003111111401333
Table A2. Net Scale of Influences (NS). Extracted from MACTOR Software version 5.1.2.
A01A02A03A04A05A06A07A08A09A10A11A12A13A14A15A16A17A18A19A20A21A22A23A24A25A26A27A28A29A30A31A32A33A34
A01 0−1−1−1−1−10−1−1−1−1−2−10−4−2−100−1−1−1−1−1−1−1−10−10000
A020 111−11000−10−1−10−5−31−1−1−3−2−1−1−1−1−1−10−10000
A031−1 341−10324−2201−12−1030−1−4−6000000−1−100−1−1
A041−1−3 0−200211−2300−9−80−1−1−3−4000000−1000−1−1
A051−1−40 −2−10100−3300−10−90−1−1−2−5000000−1000−1−1
A0611−122 1021101−10−6−5300−2−30000000−10000
A071−1101−1 0212−1201−7−8210−1−4000000−1−100−1−1
A080000000 0000−3−10−5−1000−1−10000000−10000
A0910−3−2−1−2−20 −1−1−20−10−8−8−200−4−6000000−1−100−1−1
A1010−2−10−1−101 0−1201−6−7−110−4−50000000−10000
A1111−4−10−1−2010 −10−10−7−6000−3−50000000−10000
A1210223010211 201−6−7310−3−5000000−1−100−1−1
A1321−2−3−3−1−230−20−2 13−1−6−42430200222340004
A14110001011010−1 50−200031100111100001
A1500−1000−100−10−1−3−5 −1−10−2−200000000000000
A1645129106758676101 −1220255878887103341013
A1723108958187676211 122112656666601166
A181−1−300−3−20210−3400−22−12 00−8−12−3−1−1−1−1−16−60066
A19010110−100−10−1−2020−20 130111110000000
A20011110000000−402−2−10−1 301111100−10000
A21134322114433−3−30−5−18−3−3 05344555−10055
A221264534165550−10−5−212000 3122336−40266
A23110000000000−2−10−8−63−1−1−5−3 330007−71377
A24110000000000000−7−51−1−1−3−1−3 00005−41355
A25110000000000000−8−61−1−1−4−2−30 0006−51366
A26110000000000−2−10−8−61−1−1−4−2000 006−61366
A27110000000000−2−10−8−61−1−1−5−30000 07−71377
A28110000000000−2−10−7−6100−5−300000 7−71377
A29001110101001−3−10−10−6−600−5−6−7−5−6−6−7−7 −102611
A30111001111111−400−306011474567710 13910
A31000000000000000−3−100000−1−1−1−1−1−1−2−1 100
A32000000000000000−4−10000−2−3−3−3−3−3−3−6−3−1 −2−2
A33001110101001000−10−6−600−5−6−7−5−6−6−7−7−1−902 0
A34001110101001−4−10−13−6−600−5−6−7−5−6−6−7−7−1−10020
Table A3. Matrix of Maxima Direct and Indirect Influences (MMDII). Extracted from MACTOR Software version 5.1.2.
A01A02A03A04A05A06A07A08A09A10A11A12A13A14A15A16A17A18A19A20A21A22A23A24A25A26A27A28A29A30A31A32A33A34
A010111111111111000010000000000000000
A021011111111111000010000000000000000
A031104441111411111021000111111000000
A041110111111111000020000111111000000
A051111011111111000020000111111000000
A061111101111111000020000111111000000
A071111110111111111021000111111000000
A081111111011111000010000000000000000
A091111111101111000020000111111000000
A101111111110111111021000111111000000
A111111111111011000020000111111000000
A121111111111101111021000111111000000
A133320022422220224004333200222340004
A141110011111111041001111100111110001
A150000000000000000000000000000000000
A163322222422221110021333222222343334
A171111111111111111011111111111101111
A181111111111111000000000111111100011
A190111100000001111000320111110000000
A200111100000001111001020111110000000
A211111111111111000010000111111100011
A221111111111111000010000111111101111
A231111111011110000020001044111101111
A241111111011110000020001101111101111
A251111111011110000020001110111101111
A261111111011110000020001111011101111
A271111111011110000020001111101101111
A281111111011110000020001111110101111
A290011101010010000000001111111004433
A301110011111110101010111111111101111
A310000000000000000000001000000100111
A320000000000000000000001000000101011
A330011101010010000000001111111101101
A340011101010010000000001111111101110
Table A4. Matrix of Simple Positions of Actors with respect to Objectives (1MAO). Extracted from MACTOR Software version 5.1.2.
A01A02A03A04A05A06A07A08A09A10A11A12A13A14A15A16A17A18A19A20A21A22A23A24A25A26A27A28A29A30A31A32A33A34
O01−1−1−1−1−1−1−1−1−1−1−1−1111−10011−1−1−1−1−1−1−1−1−1−1−1−1−1−1
O02−1−1−1−1−1−1−1−1−1−1−1−1111−10011−1−1−1−1−1−1−1−1−1−1−1−1−1−1
O031111111111111111000111111111111111
O041111111111111111000111111111111111
O051111111111111001000111111111111111
O061111111111111001000111111111111111
O071111111111111111000000111111−11−1−1−11
O081111111111111001001001111111111111
O091111111111111001000011111111111111
O10−1−1−1−1−1−1−1−1−1−1−1−1111100100−1−1−1−1−1−1−1−1−1−1−1−1−1
O111111111111111111001111111111111111
O121111111111111111001111111111111111
Table A5. Matrix of Weighted Valued Positions of Actors with respect to Objectives (3MAO). Extracted from MACTOR Software version 5.1.2.
A01A02A03A04A05A06A07A08A09A10A11A12A13A14A15A16A17A18A19A20A21A22A23A24A25A26A27A28A29A30A31A32A33A34
O01−0.2−0.7−2.3−2.5−2.6−1.7−1.7−0.4−0.9−1.5−1.2−2.11.11.20−17.4001.11.1−1.8−5−2.2−3.1−3.4−1.7−1.8−1.9−0.7−9.3−0.20−0.5−0.2
O02−0.2−0.7−2.3−2.5−2.6−1.7−1.7−0.4−0.9−1.5−1.2−2.11.11.20−17.4000.40.7−1.8−5−2.2−3.1−3.4−1.7−1.8−1.9−0.7−9.3−0.20−0.5−0.2
O030.213.52.52.61.71.70.40.91.51.22.11.10.6017.40001.15.453.33.13.41.71.81.90.79.30.200.50.5
O040.31.43.52.52.63.43.40.41.92.22.44.21.10.6017.40001.15.4102.23.13.43.41.81.90.79.30.200.50.5
O050.10.31.20.60.60.90.80.11.40.70.61.11.1005.80001.15.47.51.10.80.90.90.92.80.770.100.10.1
O060.10.31.20.60.60.90.80.11.42.20.63.21.1005.80001.15.47.51.10.80.90.90.90.90.770.100.10.1
O070.10.33.50.60.60.90.80.40.50.71.81.11.10.605.80000003.30.80.90.90.90.9−0.22.300−0.10.1
O080.10.33.52.52.60.90.80.40.50.70.61.11.10023.2000.4002.51.10.80.90.90.90.90.79.30.200.50.5
O090.20.72.32.52.61.71.70.40.91.51.22.11.10023.200001.852.23.13.41.71.81.90.79.30.200.50.5
O10−0.1−0.3−1.2−1.9−1.9−0.9−0.8−0.3−0.5−0.7−0.6−1.13.31.2017.4001.100−2.5−1.1−2.3−2.6−0.9−0.9−0.9−0.7−7−0.10−0.4−0.4
O110.10.31.20.60.60.90.80.10.50.70.61.11.10.605.8000.40.41.82.51.10.80.90.90.90.90.22.3000.10.1
O120.20.72.30.60.60.91.70.20.91.50.62.14.41.8023.2000.40.41.852.20.80.91.71.81.90.42.3000.10.1
Table A6. Matrix of Simple Convergences of Objectives between Actors (1CAA). Extracted from MACTOR Software version 5.1.2.
A01A02A03A04A05A06A07A08A09A10A11A12A13A14A15A16A17A18A19A20A21A22A23A24A25A26A27A28A29A30A31A32A33A34
A0101212121212121212121212955110036911121212121212111211111112
A0212012121212121212121212955110036911121212121212111211111112
A0312120121212121212121212955110036911121212121212111211111112
A0412121201212121212121212955110036911121212121212111211111112
A0512121212012121212121212955110036911121212121212111211111112
A0612121212120121212121212955110036911121212121212111211111112
A0712121212121201212121212955110036911121212121212111211111112
A0812121212121212012121212955110036911121212121212111211111112
A0912121212121212120121212955110036911121212121212111211111112
A1012121212121212121201212955110036911121212121212111211111112
A1112121212121212121212012955110036911121212121212111211111112
A1212121212121212121212120955110036911121212121212111211111112
A1399999999999908810006878999999898889
A145555555555558086005644555555454445
A155555555555558806005644555555454445
A16111111111111111111111111106600046910111111111111101110101011
A170000000000000000000000000000000000
A180000000000000000000000000000000000
A193333333333336554000423333333333333
A206666666666668666004066666666666666
A219999999999997449002609999999999999
A2211111111111111111111111184410003690111111111111111111111111
A2312121212121212121212121295511003691101212121212111211111112
A2412121212121212121212121295511003691112012121212111211111112
A2512121212121212121212121295511003691112120121212111211111112
A2612121212121212121212121295511003691112121201212111211111112
A2712121212121212121212121295511003691112121212012111211111112
A2812121212121212121212121295511003691112121212120111211111112
A2911111111111111111111111184410003691111111111111101112121211
A3012121212121212121212121295511003691112121212121211011111112
A3111111111111111111111111184410003691111111111111112110121211
A3211111111111111111111111184410003691111111111111112111201211
A3311111111111111111111111184410003691111111111111112111212011
A3412121212121212121212121295511003691112121212121211121111110
Table A7. Matrix of Simple Divergences of Objectives between Actors (1DAA). Extracted from MACTOR Software version 5.1.2.
A01A02A03A04A05A06A07A08A09A10A11A12A13A14A15A16A17A18A19A20A21A22A23A24A25A26A27A28A29A30A31A32A33A34
A010000000000003331003200000000101110
A020000000000003331003200000000101110
A030000000000003331003200000000101110
A040000000000003331003200000000101110
A050000000000003331003200000000101110
A060000000000003331003200000000101110
A070000000000003331003200000000101110
A080000000000003331003200000000101110
A090000000000003331003200000000101110
A100000000000003331003200000000101110
A110000000000003331003200000000101110
A120000000000003331003200000000101110
A133333333333330002000023333333434443
A143333333333330002000023333333434443
A153333333333330002000023333333434443
A161111111111112220002201111111212221
A170000000000000000000000000000000000
A180000000000000000000000000000000000
A193333333333330002000023333333333333
A202222222222220002000022222222222222
A210000000000002220002200000000000000
A220000000000003331003200000000000000
A230000000000003331003200000000101110
A240000000000003331003200000000101110
A250000000000003331003200000000101110
A260000000000003331003200000000101110
A270000000000003331003200000000101110
A280000000000003331003200000000101110
A291111111111114442003200111111010001
A300000000000003331003200000000101110
A311111111111114442003200111111010001
A321111111111114442003200111111010001
A331111111111114442003200111111010001
A340000000000003331003200000000101110
Table A8. Matrix of Valued Convergences of Objectives between Actors (2CAA). Extracted from MACTOR Software version 5.1.2.
A01A02A03A04A05A06A07A08A09A10A11A12A13A14A15A16A17A18A19A20A21A22A23A24A25A26A27A28A29A30A31A32A33A34
A010.021.022.526.526.520.020.528.522.521.021.021.514.09.010.024.00.00.03.513.017.521.521.025.025.020.519.520.525.028.527.525.525.524.5
A0221.00.022.526.526.520.020.528.522.521.021.021.514.09.010.024.00.00.03.513.017.521.521.025.025.020.519.520.525.028.527.525.525.524.5
A0322.522.50.028.028.021.522.030.024.022.522.523.015.59.510.525.50.00.04.512.517.022.022.526.526.522.021.022.025.530.028.026.026.026.0
A0426.526.528.00.032.025.526.034.028.026.526.527.016.59.010.028.50.00.04.513.020.527.026.530.530.526.025.026.030.534.033.031.031.030.0
A0526.526.528.032.00.025.526.034.028.026.526.527.016.59.010.028.50.00.04.513.020.527.026.530.530.526.025.026.030.534.033.031.031.030.0
A0620.020.021.525.525.50.019.527.521.520.020.020.513.08.09.023.00.00.03.012.016.520.520.024.024.019.518.519.524.027.526.524.524.523.5
A0720.520.522.026.026.019.50.028.022.020.520.521.013.58.59.523.50.00.03.512.517.021.020.524.524.520.019.020.024.528.027.025.025.024.0
A0828.528.530.034.034.027.528.00.030.028.528.529.018.511.012.030.50.00.05.013.521.027.528.532.532.528.027.028.031.036.033.531.531.532.0
A0922.522.524.028.028.021.522.030.00.022.522.523.015.58.59.525.50.00.03.514.519.023.022.526.526.522.021.022.026.530.029.027.027.026.0
A1021.021.022.526.526.520.020.528.522.50.021.021.514.08.09.024.00.00.03.513.017.521.521.025.025.020.519.520.525.028.527.525.525.524.5
A1121.021.022.526.526.520.020.528.522.521.00.021.514.09.010.024.00.00.03.012.016.520.521.025.025.020.519.520.524.028.526.524.524.524.5
A1221.521.523.027.027.020.521.029.023.021.521.50.014.58.59.524.50.00.03.513.518.022.021.525.525.521.020.021.025.529.028.026.026.025.0
A1314.014.015.516.516.513.013.518.515.514.014.014.50.013.014.020.00.00.010.515.012.514.514.015.015.013.512.513.516.018.517.515.515.516.5
A149.09.09.59.09.08.08.511.08.58.09.08.513.00.014.012.00.00.09.511.57.07.59.09.09.08.57.57.57.59.08.08.08.09.0
A1510.010.010.510.010.09.09.512.09.59.010.09.514.014.00.013.00.00.09.012.07.58.010.010.010.09.58.58.58.010.08.58.58.510.0
A1624.024.025.528.528.523.023.530.525.524.024.024.520.012.013.00.00.00.09.013.520.024.524.027.027.023.522.523.527.030.529.527.527.526.5
A170.00.00.00.00.00.00.00.00.00.00.00.00.00.00.00.00.00.00.00.00.00.00.00.00.00.00.00.00.00.00.00.00.00.0
A180.00.00.00.00.00.00.00.00.00.00.00.00.00.00.00.00.00.00.00.00.00.00.00.00.00.00.00.00.00.00.00.00.00.0
A193.53.54.54.54.53.03.55.03.53.53.03.510.59.59.09.00.00.00.06.52.03.53.53.03.03.53.53.54.54.54.54.54.54.5
A2013.013.012.513.013.012.012.513.514.513.012.013.515.011.512.013.50.00.06.50.014.014.512.013.013.012.511.512.514.515.015.013.013.013.0
A2117.517.517.020.520.516.517.021.019.017.516.518.012.57.07.520.00.00.02.014.00.019.016.520.520.517.016.017.020.522.522.520.520.518.5
A2221.521.522.027.027.020.521.027.523.021.520.522.014.57.58.024.50.00.03.514.519.00.020.525.525.521.020.021.026.529.029.027.027.025.0
A2321.021.022.526.526.520.020.528.522.521.021.021.514.09.010.024.00.00.03.512.016.520.50.025.025.020.519.520.524.028.526.524.524.524.5
A2425.025.026.530.530.524.024.532.526.525.025.025.515.09.010.027.00.00.03.013.020.525.525.00.029.024.523.524.529.032.531.529.529.528.5
A2525.025.026.530.530.524.024.532.526.525.025.025.515.09.010.027.00.00.03.013.020.525.525.029.00.024.523.524.529.032.531.529.529.528.5
A2620.520.522.026.026.019.520.028.022.020.520.521.013.58.59.523.50.00.03.512.517.021.020.524.524.50.019.020.024.528.027.025.025.024.0
A2719.519.521.025.025.018.519.027.021.019.519.520.012.57.58.522.50.00.03.511.516.020.019.523.523.519.00.019.023.527.026.024.024.023.0
A2820.520.522.026.026.019.520.028.022.020.520.521.013.57.58.523.50.00.03.512.517.021.020.524.524.520.019.00.024.528.027.025.025.024.0
A2925.025.025.530.530.524.024.531.026.525.024.025.516.07.58.027.00.00.04.514.520.526.524.029.029.024.523.524.50.032.533.531.531.528.5
A3028.528.530.034.034.027.528.036.030.028.528.529.018.59.010.030.50.00.04.515.022.529.028.532.532.528.027.028.032.50.035.033.033.032.0
A3127.527.528.033.033.026.527.033.529.027.526.528.017.58.08.529.50.00.04.515.022.529.026.531.531.527.026.027.033.535.00.034.034.031.0
A3225.525.526.031.031.024.525.031.527.025.524.526.015.58.08.527.50.00.04.513.020.527.024.529.529.525.024.025.031.533.034.00.032.029.0
A3325.525.526.031.031.024.525.031.527.025.524.526.015.58.08.527.50.00.04.513.020.527.024.529.529.525.024.025.031.533.034.032.00.029.0
A3424.524.526.030.030.023.524.032.026.024.524.525.016.59.010.026.50.00.04.513.018.525.024.528.528.524.023.024.028.532.031.029.029.00.0
Table A9. Matrix of Valued Divergences of Objectives between Actors (2DAA). Extracted from MACTOR Software version 5.1.2.
A01A02A03A04A05A06A07A08A09A10A11A12A13A14A15A16A17A18A19A20A21A22A23A24A25A26A27A28A29A30A31A32A33A34
A010.00.00.00.00.00.00.00.00.00.00.00.05.05.55.52.00.00.06.04.50.00.00.00.00.00.00.00.01.00.01.01.01.00.0
A020.00.00.00.00.00.00.00.00.00.00.00.05.05.55.52.00.00.06.04.50.00.00.00.00.00.00.00.01.00.01.01.01.00.0
A030.00.00.00.00.00.00.00.00.00.00.00.05.05.55.52.00.00.06.04.50.00.00.00.00.00.00.00.02.00.02.02.02.00.0
A040.00.00.00.00.00.00.00.00.00.00.00.08.08.58.53.00.00.09.06.50.00.00.00.00.00.00.00.01.00.01.01.01.00.0
A050.00.00.00.00.00.00.00.00.00.00.00.08.08.58.53.00.00.09.06.50.00.00.00.00.00.00.00.01.00.01.01.01.00.0
A060.00.00.00.00.00.00.00.00.00.00.00.05.05.55.52.00.00.06.04.50.00.00.00.00.00.00.00.01.00.01.01.01.00.0
A070.00.00.00.00.00.00.00.00.00.00.00.05.05.55.52.00.00.06.04.50.00.00.00.00.00.00.00.01.00.01.01.01.00.0
A080.00.00.00.00.00.00.00.00.00.00.00.08.08.58.53.00.00.09.06.50.00.00.00.00.00.00.00.02.50.02.52.52.50.0
A090.00.00.00.00.00.00.00.00.00.00.00.05.05.55.52.00.00.06.04.50.00.00.00.00.00.00.00.01.00.01.01.01.00.0
A100.00.00.00.00.00.00.00.00.00.00.00.05.05.55.52.00.00.06.04.50.00.00.00.00.00.00.00.01.00.01.01.01.00.0
A110.00.00.00.00.00.00.00.00.00.00.00.05.05.55.52.00.00.06.04.50.00.00.00.00.00.00.00.02.00.02.02.02.00.0
A120.00.00.00.00.00.00.00.00.00.00.00.05.05.55.52.00.00.06.04.50.00.00.00.00.00.00.00.01.00.01.01.01.00.0
A135.05.05.08.08.05.05.08.05.05.05.05.00.00.00.04.00.00.00.00.02.05.05.08.08.05.05.05.08.08.09.09.09.06.0
A145.55.55.58.58.55.55.58.55.55.55.55.50.00.00.05.00.00.00.00.03.05.55.58.58.55.55.55.58.58.59.59.59.56.5
A155.55.55.58.58.55.55.58.55.55.55.55.50.00.00.05.00.00.00.00.03.05.55.58.58.55.55.55.59.08.510.010.010.06.5
A162.02.02.03.03.02.02.03.02.02.02.02.04.05.05.00.00.00.05.05.50.02.02.03.03.02.02.02.04.03.04.04.04.03.0
A170.00.00.00.00.00.00.00.00.00.00.00.00.00.00.00.00.00.00.00.00.00.00.00.00.00.00.00.00.00.00.00.00.00.0
A180.00.00.00.00.00.00.00.00.00.00.00.00.00.00.00.00.00.00.00.00.00.00.00.00.00.00.00.00.00.00.00.00.00.0
A196.06.06.09.09.06.06.09.06.06.06.06.00.00.00.05.00.00.00.00.03.06.06.09.09.06.06.06.08.09.09.09.09.07.0
A204.54.54.56.56.54.54.56.54.54.54.54.50.00.00.05.50.00.00.00.03.54.54.56.56.54.54.54.55.56.56.56.56.54.5
A210.00.00.00.00.00.00.00.00.00.00.00.02.03.03.00.00.00.03.03.50.00.00.00.00.00.00.00.00.00.00.00.00.00.0
A220.00.00.00.00.00.00.00.00.00.00.00.05.05.55.52.00.00.06.04.50.00.00.00.00.00.00.00.00.00.00.00.00.00.0
A230.00.00.00.00.00.00.00.00.00.00.00.05.05.55.52.00.00.06.04.50.00.00.00.00.00.00.00.02.00.02.02.02.00.0
A240.00.00.00.00.00.00.00.00.00.00.00.08.08.58.53.00.00.09.06.50.00.00.00.00.00.00.00.01.00.01.01.01.00.0
A250.00.00.00.00.00.00.00.00.00.00.00.08.08.58.53.00.00.09.06.50.00.00.00.00.00.00.00.01.00.01.01.01.00.0
A260.00.00.00.00.00.00.00.00.00.00.00.05.05.55.52.00.00.06.04.50.00.00.00.00.00.00.00.01.00.01.01.01.00.0
A270.00.00.00.00.00.00.00.00.00.00.00.05.05.55.52.00.00.06.04.50.00.00.00.00.00.00.00.01.00.01.01.01.00.0
A280.00.00.00.00.00.00.00.00.00.00.00.05.05.55.52.00.00.06.04.50.00.00.00.00.00.00.00.01.00.01.01.01.00.0
A291.01.02.01.01.01.01.02.51.01.02.01.08.08.59.04.00.00.08.05.50.00.02.01.01.01.01.01.00.01.00.00.00.01.0
A300.00.00.00.00.00.00.00.00.00.00.00.08.08.58.53.00.00.09.06.50.00.00.00.00.00.00.00.01.00.01.01.01.00.0
A311.01.02.01.01.01.01.02.51.01.02.01.09.09.510.04.00.00.09.06.50.00.02.01.01.01.01.01.00.01.00.00.00.01.0
A321.01.02.01.01.01.01.02.51.01.02.01.09.09.510.04.00.00.09.06.50.00.02.01.01.01.01.01.00.01.00.00.00.01.0
A331.01.02.01.01.01.01.02.51.01.02.01.09.09.510.04.00.00.09.06.50.00.02.01.01.01.01.01.00.01.00.00.00.01.0
A340.00.00.00.00.00.00.00.00.00.00.00.06.06.56.53.00.00.07.04.50.00.00.00.00.00.00.00.01.00.01.01.01.00.0
Table A10. Matrix of Weighted Valued Convergences of Objectives between Actors (3CAA). Extracted from MACTOR Software version 5.1.2.
A01A02A03A04A05A06A07A08A09A10A11A12A13A14A15A16A17A18A19A20A21A22A23A24A25A26A27A28A29A30A31A32A33A34
A010.04.414.711.011.18.99.32.86.48.57.212.47.22.60.081.90.00.00.73.016.129.712.212.113.39.49.110.34.142.81.61.02.92.6
A024.40.017.413.713.811.712.05.69.211.39.915.29.34.00.084.50.00.01.24.518.432.315.014.816.012.111.913.06.745.64.23.65.55.3
A0314.717.40.024.024.122.022.315.919.521.620.225.517.59.10.094.40.00.04.08.825.241.025.225.126.322.422.223.315.455.912.912.314.215.6
A0411.013.724.00.020.418.218.612.115.717.816.521.713.25.60.090.30.00.02.56.323.038.721.521.422.618.718.419.513.152.110.610.011.911.9
A0511.113.824.120.40.018.318.712.315.818.016.621.813.35.60.090.40.00.02.56.323.138.821.621.522.718.818.619.713.252.310.710.112.012.0
A068.911.722.018.218.30.016.510.113.715.814.419.712.56.00.088.80.00.01.86.722.236.519.519.320.516.616.417.511.050.18.47.89.79.8
A079.312.022.318.618.716.50.010.414.016.114.820.012.96.30.089.10.00.02.27.122.536.919.819.620.917.016.717.811.350.48.88.210.110.2
A082.85.615.912.112.310.110.40.07.69.78.413.67.93.00.083.00.00.00.93.216.830.613.413.214.510.510.311.45.144.02.62.03.83.7
A096.49.219.515.715.813.714.07.60.013.311.917.211.04.50.086.50.00.01.56.020.234.217.016.818.014.113.915.08.747.66.15.57.47.3
A108.511.321.617.818.015.816.19.713.30.014.019.312.45.40.088.50.00.02.06.922.036.219.118.920.216.216.017.110.649.78.17.59.49.4
A117.29.920.216.516.614.414.88.411.914.00.017.911.45.40.087.20.00.01.55.520.234.317.717.618.814.914.715.88.748.46.25.67.58.1
A1212.415.225.521.721.819.720.013.617.219.317.90.015.57.40.092.20.00.02.79.325.439.923.022.824.020.119.921.014.453.611.911.213.113.3
A137.29.317.513.213.312.512.97.911.012.411.415.50.011.00.080.60.00.07.89.419.028.615.213.514.312.912.513.68.335.76.56.17.37.8
A142.64.09.15.65.66.06.33.04.55.45.47.411.00.00.046.20.00.04.75.39.013.18.16.46.86.45.85.92.815.02.01.92.52.8
A150.00.00.00.00.00.00.00.00.00.00.00.00.00.00.00.00.00.00.00.00.00.00.00.00.00.00.00.00.00.00.00.00.00.0
A1681.984.594.490.390.488.889.183.086.588.587.292.280.646.20.00.00.00.035.940.282.0105.992.091.292.389.289.090.181.2119.679.078.480.182.7
A170.00.00.00.00.00.00.00.00.00.00.00.00.00.00.00.00.00.00.00.00.00.00.00.00.00.00.00.00.00.00.00.00.00.0
A180.00.00.00.00.00.00.00.00.00.00.00.00.00.00.00.00.00.00.00.00.00.00.00.00.00.00.00.00.00.00.00.00.00.0
A190.71.24.02.52.51.82.20.91.52.01.52.77.84.70.035.90.00.00.02.42.25.62.71.71.82.32.42.41.27.60.70.61.00.9
A203.04.58.86.36.36.77.13.26.06.95.59.39.45.30.040.20.00.02.40.015.121.37.97.17.67.26.67.74.121.22.82.63.33.2
A2116.118.425.223.023.122.222.516.820.222.020.225.419.09.00.082.00.00.02.215.10.041.724.024.625.722.622.323.418.048.016.015.517.016.6
A2229.732.341.038.738.836.536.930.634.236.234.339.928.613.10.0105.90.00.05.621.341.70.038.639.740.937.036.737.832.269.729.729.030.930.5
A2312.215.025.221.521.619.519.813.417.019.117.723.015.28.10.092.00.00.02.77.924.038.60.022.623.819.919.720.813.153.410.59.911.813.1
A2412.114.825.121.421.519.319.613.216.818.917.622.813.56.40.091.20.00.01.77.124.639.722.60.023.719.819.520.614.153.211.611.012.913.0
A2513.316.026.322.622.720.520.914.518.020.218.824.014.36.80.092.30.00.01.87.625.740.923.823.70.021.020.821.915.354.512.812.214.114.2
A269.412.122.418.718.816.617.010.514.116.214.920.112.96.40.089.20.00.02.37.222.637.019.919.821.00.016.817.911.450.58.98.310.210.3
A279.111.922.218.418.616.416.710.313.916.014.719.912.55.80.089.00.00.02.46.622.336.719.719.520.816.80.017.711.150.38.68.09.910.0
A2810.313.023.319.519.717.517.811.415.017.115.821.013.65.90.090.10.00.02.47.723.437.820.820.621.917.917.70.012.251.49.79.111.011.1
A294.16.715.413.113.211.011.35.18.710.68.714.48.32.80.081.20.00.01.24.118.032.213.114.115.311.411.112.20.044.14.23.65.55.0
A3042.845.655.952.152.350.150.444.047.649.748.453.635.715.00.0119.60.00.07.621.248.069.753.453.254.550.550.351.444.10.041.641.042.943.7
A311.64.212.910.610.78.48.82.66.18.16.211.96.52.00.079.00.00.00.72.816.029.710.511.612.88.98.69.74.241.60.01.02.92.5
A321.03.612.310.010.17.88.22.05.57.55.611.26.11.90.078.40.00.00.62.615.529.09.911.012.28.38.09.13.641.01.00.02.31.9
A332.95.514.211.912.09.710.13.87.49.47.513.17.32.50.080.10.00.01.03.317.030.911.812.914.110.29.911.05.542.92.92.30.03.7
A342.65.315.611.912.09.810.23.77.39.48.113.37.82.80.082.70.00.00.93.216.630.513.113.014.210.310.011.15.043.72.51.93.70.0
Table A11. Matrix of Weighted Valued Divergences of Objectives between Actors (3DAA). Extracted from MACTOR Software version 5.1.2.
A01A02A03A04A05A06A07A08A09A10A11A12A13A14A15A16A17A18A19A20A21A22A23A24A25A26A27A28A29A30A31A32A33A34
A010.00.00.00.00.00.00.00.00.00.00.00.02.92.00.08.70.00.01.51.00.00.00.00.00.00.00.00.00.20.00.10.00.10.0
A020.00.00.00.00.00.00.00.00.00.00.00.03.62.70.08.90.00.02.11.60.00.00.00.00.00.00.00.00.30.00.20.20.20.0
A030.00.00.00.00.00.00.00.00.00.00.00.05.64.70.09.30.00.04.23.20.00.00.00.00.00.00.00.01.80.01.81.71.80.0
A040.00.00.00.00.00.00.00.00.00.00.00.06.25.30.09.60.00.04.83.40.00.00.00.00.00.00.00.00.40.00.30.30.40.0
A050.00.00.00.00.00.00.00.00.00.00.00.06.35.30.09.70.00.04.83.50.00.00.00.00.00.00.00.00.40.00.30.30.40.0
A060.00.00.00.00.00.00.00.00.00.00.00.04.93.90.09.10.00.03.42.60.00.00.00.00.00.00.00.00.50.00.40.40.50.0
A070.00.00.00.00.00.00.00.00.00.00.00.04.83.90.09.10.00.03.42.60.00.00.00.00.00.00.00.00.50.00.40.40.50.0
A080.00.00.00.00.00.00.00.00.00.00.00.03.32.40.08.90.00.01.91.30.00.00.00.00.00.00.00.00.30.00.20.20.30.0
A090.00.00.00.00.00.00.00.00.00.00.00.03.93.00.08.90.00.02.51.80.00.00.00.00.00.00.00.00.30.00.30.20.30.0
A100.00.00.00.00.00.00.00.00.00.00.00.04.63.70.09.10.00.03.12.40.00.00.00.00.00.00.00.00.50.00.40.40.40.0
A110.00.00.00.00.00.00.00.00.00.00.00.04.23.30.09.00.00.02.82.10.00.00.00.00.00.00.00.01.00.00.90.91.00.0
A120.00.00.00.00.00.00.00.00.00.00.00.05.44.50.09.20.00.03.93.00.00.00.00.00.00.00.00.00.60.00.50.50.60.0
A132.93.65.66.26.34.94.83.33.94.64.25.40.00.00.018.50.00.00.00.02.99.05.47.07.44.95.05.14.415.63.53.34.13.2
A142.02.74.75.35.33.93.92.43.03.73.34.50.00.00.018.60.00.00.00.03.08.14.56.16.54.04.14.23.214.72.42.22.92.3
A150.00.00.00.00.00.00.00.00.00.00.00.00.00.00.00.00.00.00.00.00.00.00.00.00.00.00.00.00.00.00.00.00.00.0
A168.78.99.39.69.79.19.18.98.99.19.09.218.518.60.00.00.00.018.118.30.09.99.29.910.09.19.29.212.012.211.711.611.98.9
A170.00.00.00.00.00.00.00.00.00.00.00.00.00.00.00.00.00.00.00.00.00.00.00.00.00.00.00.00.00.00.00.00.00.0
A180.00.00.00.00.00.00.00.00.00.00.00.00.00.00.00.00.00.00.00.00.00.00.00.00.00.00.00.00.00.00.00.00.00.0
A191.52.14.24.84.83.43.41.92.53.12.83.90.00.00.018.10.00.00.00.02.57.64.05.56.03.43.63.62.314.11.51.42.01.7
A201.01.63.23.43.52.62.61.31.82.42.13.00.00.00.018.30.00.00.00.02.75.93.14.04.32.62.72.81.510.21.10.91.41.1
A210.00.00.00.00.00.00.00.00.00.00.00.02.93.00.00.00.00.02.52.70.00.00.00.00.00.00.00.00.00.00.00.00.00.0
A220.00.00.00.00.00.00.00.00.00.00.00.09.08.10.09.90.00.07.65.90.00.00.00.00.00.00.00.00.00.00.00.00.00.0
A230.00.00.00.00.00.00.00.00.00.00.00.05.44.50.09.20.00.04.03.10.00.00.00.00.00.00.00.01.70.01.61.61.70.0
A240.00.00.00.00.00.00.00.00.00.00.00.07.06.10.09.90.00.05.54.00.00.00.00.00.00.00.00.00.50.00.40.40.50.0
A250.00.00.00.00.00.00.00.00.00.00.00.07.46.50.010.00.00.06.04.30.00.00.00.00.00.00.00.00.50.00.50.40.50.0
A260.00.00.00.00.00.00.00.00.00.00.00.04.94.00.09.10.00.03.42.60.00.00.00.00.00.00.00.00.50.00.40.40.50.0
A270.00.00.00.00.00.00.00.00.00.00.00.05.04.10.09.20.00.03.62.70.00.00.00.00.00.00.00.00.60.00.50.50.50.0
A280.00.00.00.00.00.00.00.00.00.00.00.05.14.20.09.20.00.03.62.80.00.00.00.00.00.00.00.00.60.00.50.50.50.0
A290.20.31.80.40.40.50.50.30.30.51.00.64.43.20.012.00.00.02.31.50.00.01.70.50.50.50.60.60.01.30.00.00.00.2
A300.00.00.00.00.00.00.00.00.00.00.00.015.614.70.012.20.00.014.110.20.00.00.00.00.00.00.00.01.30.01.21.21.20.0
A310.10.21.80.30.30.40.40.20.30.40.90.53.52.40.011.70.00.01.51.10.00.01.60.40.50.40.50.50.01.20.00.00.00.1
A320.00.21.70.30.30.40.40.20.20.40.90.53.32.20.011.60.00.01.40.90.00.01.60.40.40.40.50.50.01.20.00.00.00.1
A330.10.21.80.40.40.50.50.30.30.41.00.64.12.90.011.90.00.02.01.40.00.01.70.50.50.50.50.50.01.20.00.00.00.1
A340.00.00.00.00.00.00.00.00.00.00.00.03.22.30.08.90.00.01.71.10.00.00.00.00.00.00.00.00.20.00.10.10.10.0

References

  1. Oppong, G.D.; Chan, A.P.C.; Dansoh, A. A review of stakeholder management performance attributes in construction projects. Int. J. Proj. Manag. 2017, 35, 1037–1051. [Google Scholar] [CrossRef]
  2. Anaman, K.A.; Osei-Amponsah, C. Analysis of the causality links between the growth of the construction industry and the growth of the macro-economy in Ghana. Constr. Manag. Econ. 2007, 25, 951–961. [Google Scholar] [CrossRef]
  3. Choy, C.F. Revisiting the “Bon curve”. Constr. Manag. Econ. 2011, 29, 695–712. [Google Scholar] [CrossRef]
  4. Chiang, Y.H.; Tao, L.; Wong, F.K.W. Causal relationship between construction activities, employment and GDP: The case of Hong Kong. Habitat Int. 2015, 46, 1–12. [Google Scholar] [CrossRef]
  5. Escavy, J.I.; Herrero, M.J.; Trigos, L.; Sanz-Pérez, E. Demographic vs economic variables in the modelling and forecasting of the demand of aggregates: The case of the Spanish market (1995–2016). Resour. Policy 2020, 65, 101537. [Google Scholar] [CrossRef]
  6. Leviäkangas, P.; Mok-Paik, S.; Moon, S. Keeping up with the pace of digitization: The case of the Australian construction industry. Technol. Soc. 2017, 50, 33–43. [Google Scholar] [CrossRef]
  7. Economic and Social Council. The Role of the Construction Sector in Economic Growth: Competitiveness, Cohesion and Quality of Life; CES: Madrid, Spain, 2016; Volume 2, ISBN 978-8481883589. [Google Scholar]
  8. Martori, J.C.; Madariaga, R.; Oller, R. Real estate bubble and urban population density: Six Spanish metropolitan areas 2001–2011. Ann. Reg. Sci. 2016, 56, 369–392. [Google Scholar] [CrossRef]
  9. Demirkesen, S.; Ozorhon, B. Measuring Project Management Performance: Case of Construction Industry. Eng. Manag. J. 2017, 29, 258–277. [Google Scholar] [CrossRef]
  10. Heywood, C.; Smith, J. Integrating stakeholders during community FM’s early project phases. Facilities 2006, 24, 300–313. [Google Scholar] [CrossRef]
  11. Cerezo-Narváez, A.; Otero-Mateo, M.; Pastor-Fernández, A. Influence of scope management in construction industry projects. DYNA Manag. 2016, 4, 1–15. [Google Scholar]
  12. Wu, G.; Liu, C.; Zhao, X.; Zuo, J. Investigating the relationship between communication-conflict interaction and project success among construction project teams. Int. J. Proj. Manag. 2017, 35, 1466–1482. [Google Scholar] [CrossRef]
  13. Kifokeris, D.; Xenidis, Y. Constructability: Outline of Past, Present, and Future Research. J. Constr. Eng. Manag. 2017, 143, 04017035. [Google Scholar] [CrossRef]
  14. García-de-Soto, B.; Agustí-Juan, I.; Joss, S.; Hunhevicz, J. Implications of Construction 4.0 to the workforce and organizational structures. Int. J. Constr. Manag. 2019, 1–13. [Google Scholar] [CrossRef]
  15. Collins, W.; Parrish, K.; Gibson, G.E. Development of a Project Scope Definition and Assessment Tool for Small Industrial Construction Projects. J. Manag. Eng. 2017, 33, 04017015. [Google Scholar] [CrossRef]
  16. Tavakolan, M.; Etemadinia, H. Fuzzy Weighted Interpretive Structural Modeling: Improved Method for Identification of Risk Interactions in Construction Projects. J. Constr. Eng. Manag. 2017, 143, 04017084. [Google Scholar] [CrossRef]
  17. Lepanjuuri, K.; Humphrey, A. Survey of Employment by Occupation in the Construction Industry; NatCen Social Research: London, UK, 2016. [Google Scholar]
  18. Luo, L.; He, Q.; Jaselskis, E.J.; Xie, J. Construction Project Complexity: Research Trends and Implications. J. Constr. Eng. Manag. 2017, 143, 1–10. [Google Scholar] [CrossRef]
  19. Ballesteros-Pérez, P.; Smith, S.T.; Lloyd-Papworth, J.G.; Cooke, P. Incorporating the effect of weather in construction scheduling and management with sine wave curves: Application in the United Kingdom. Constr. Manag. Econ. 2018, 36, 666–682. [Google Scholar] [CrossRef] [Green Version]
  20. van der Heijden, J.; de Jong, J. Towards a better understanding of building regulation. Environ. Plan. B 2013, 36, 1038–1052. [Google Scholar] [CrossRef]
  21. Branco Pedro, J.; Meijer, F.; Visscher, H. Building control systems of European Union countries: A comparison of tasks and responsibilities. Int. J. Law Built Environ. 2010, 2, 45–59. [Google Scholar] [CrossRef]
  22. Spanish Government Royal Decree of 24 July 1889. Civil Code of Spain. Span. Off. Gaz. 1889, 206, 249–259. [Google Scholar]
  23. Government of Spain Law 38/99 on Building Management. Span. Off. Gaz. 1999, 266, 38925–38934.
  24. Surahyo, A. Types of Construction Contracts. In Understanding Construction Contracts; Springer: Cham, Switzerland, 2018; pp. 45–52. [Google Scholar]
  25. Dong, Y.H.; Ng, S.T. A modeling framework to evaluate sustainability of building construction based on LCSA. Int. J. Life Cycle Assess. 2016, 21, 555–568. [Google Scholar] [CrossRef]
  26. Cerezo-Narváez, A.; Pastor-Fernández, A.; Otero-Mateo, M.; Portela-Núñez, J.M. Influence of interpersonal competences on the way to organizational maturity in project management. In Proceedings of the 20th International Congress on Project Management and Engineering, Cartagena, Spain, 13–15 July 2016; IPMA Spain: Cartagena, Spain, 2016; pp. 28–40. [Google Scholar]
  27. Fageha, M.K.; Aibinu, A.A. Prioritising Project Scope Definition Elements in Public Building Projects. Australas. J. Constr. Econ. Build. 2014, 14, 18–33. [Google Scholar] [CrossRef] [Green Version]
  28. Bygballe, L.E.; Endresen, M.; Fålun, S. The role of formal and informal mechanisms in implementing lean principles in construction projects. Eng. Constr. Archit. Manag. 2018, 25, 1322–1338. [Google Scholar] [CrossRef]
  29. Wang, Y.; Chen, Y.; Fu, Y.; Zhang, W. Do prior interactions breed cooperation in construction projects? The mediating role of contracts. Int. J. Proj. Manag. 2017, 35, 633–646. [Google Scholar] [CrossRef] [Green Version]
  30. Chan, A.P.C.; Chan, D.W.M.; Yeung, J.F.Y. Relational Contracting for Construction Excellence. Principles, Practices and Case Studies, 1st ed.; Routledge: London, UK, 2009; ISBN 978-0203926727. [Google Scholar]
  31. Lühr, G.J.; Bosch-Rekveldt, M.G.C.; Radujkovic, M. Key stakeholders’ perspectives on the ideal partnering culture in construction projects. Front. Eng. Manag. 2021, 8, 1–14. [Google Scholar] [CrossRef]
  32. Council of the European Union. Council Directive 85/384/EEC of 10 June 1985. Mutual Recognition of Diplomas, Certificates and Other Evidence of Formal Qualifications in Architecture. Off. J. Eur. Communities 1985, 223, 15–25. [Google Scholar]
  33. Council of the European Union. Council Directive 89/106/EEC of 21 December 1988. Approximation of Laws, Regulations and Administrative Provisions relating to Construction Products. Off. J. Eur. Communities 1988, 40, 12–26. [Google Scholar]
  34. van der Heijden, J.; van Bueren, E. Regulating sustainable construction in Europe. Int. J. Law Built Environ. 2013, 5, 5–20. [Google Scholar] [CrossRef]
  35. Ramírez Gallardo, G. The Building Management Law. Constr. Rep. 2000, 51, 49–56. [Google Scholar]
  36. Spanish Government Royal Decree 1627/1997 on minimum requirements for health and safety at construction sites. Span. Off. Gaz. 1997, 256, 30875–30886.
  37. Council of the European Union. Council Directive 92/57/EEC of 24 June 1992. Implementation of Minimum Safety and Health Requirements at Temporary or Mobile Construction Sites. Off. J. Eur. Communities 1992, 245, 6–22. [Google Scholar]
  38. Martínez-Escribano, C. Building Agents’ Warranties and Responsibilities, 3rd ed.; Lex Nova: Valladolid, Spain, 2007; ISBN 978-8484067320. [Google Scholar]
  39. Project Management Institute. A Guide to the Project Management Body of Knowledge. PMBOK Guide, 6th ed.; PMI: Newtown Square, PN, USA, 2017; ISBN 978-1628253825. [Google Scholar]
  40. Meng, X.; Boyd, P. The role of the project manager in relationship management. Int. J. Proj. Manag. 2017, 35, 717–728. [Google Scholar] [CrossRef] [Green Version]
  41. Soler-Severino, M.J.; Humero-Martín, A.E. Analysis of Project and Construction Management in the Spanish Legal Framework. Aranzadi J. Urban. Build. 2013, 27, 331–355. [Google Scholar]
  42. Atkin, B.; Skitmore, M. Editorial: Stakeholder management in construction. Constr. Manag. Econ. 2008, 26, 549–552. [Google Scholar] [CrossRef] [Green Version]
  43. Lafuente, E.; Strassburger, F.; Vaillant, Y.; Vilajosana, J. Organizational Resilience and Performance: Analysis of the Relevance of Suppliers’ Trade Credit and Bank Diversification in the Spanish Construction Industry. Constr. Econ. Build. 2017, 17, 1–19. [Google Scholar] [CrossRef] [Green Version]
  44. Branco Pedro, J.; Meijer, F.; Visscher, H. Technical building regulations in EU countries: A comparison of their organization and formulation. In Proceedings of the 18th CIB World Congress, Salford, UK, 10–13 May 2010; University of Salford: Salford, UK, 2010; pp. 1–13. [Google Scholar]
  45. Rodden, T.; Benford, S. The evolution of buildings and implications for the design of ubiquitous domestic environments. In Proceedings of the 2003 Conference on Human Factors in Computing Systems; ACM Press: New York, NY, USA, 2003; pp. 9–16. [Google Scholar]
  46. Kines, P.; Andersen, L.P.S.; Spangenberg, S.; Mikkelsen, K.L.; Dyreborg, J.; Zohar, D. Improving construction site safety through leader-based verbal safety communication. J. Saf. Res. 2010, 41, 399–406. [Google Scholar] [CrossRef]
  47. Brioso, X.; Humero, A. Incorporating Lean Construction agent into the Building Standards Act: The Spanish case study. Organ. Technol. Manag. Constr. 2016, 8, 1511–1517. [Google Scholar] [CrossRef] [Green Version]
  48. Fundación CONAMA. Circular Economy in the Construction Industry; Fundación CONAMA: Madrid, Spain, 2018. [Google Scholar]
  49. Fernando, P.G.D.; Fernando, N.G.; Gunarathna, M.A.C.L. Skills developments of labourers to achieve the successful project delivery in the Sri Lankan construction industry. Civ. Environ. Res. 2016, 8, 86–99. [Google Scholar]
  50. Fuentes-Bargues, J.L.; González-Gaya, C. Analysis of the Spanish construction sector from its main economic values. In Proceedings of the 17th International Congress on Project Management and Engineering, Logroño, Spain, 17–19 July 2013; IPMA Spain: Logroño, Spain, 2013; pp. 434–446. [Google Scholar]
  51. Cardesín-Díaz, J.M.; Mirás-Araujo, J. Historic urbanization process in Spain (1746–2013): From the fall of the American empire to the Real estate bubble. J. Urban Hist. 2017, 43, 33–52. [Google Scholar] [CrossRef]
  52. Spanish Statistical Office Construction Structure Publications. Available online: https://www.mitma.gob.es/informacion-para-el-ciudadano/informacion-estadistica/construccion/estructura-de-la-industria-de-la-construccion/publicaciones-de-estructura-de-la-construccion/estructura-de-la-construccion-años-2001-2013 (accessed on 7 December 2020).
  53. Hernández-Rodríguez, A. International turnkey construction contracts. J. Transnatl. Law Noteb. 2014, 6, 161–235. [Google Scholar]
  54. Capó-Vicedo, J.; Hospitaler-Pérez, A.; Lario-Esteban, F.C. Analysis of the adaptation to the construction sector of existing organizational and production structures in the automotive sector. In Proceedings of the 5th Congress on Organizational Engineering, Valladolid and Burgos, Spain, 4–5 September 2003; ADINGOR: Valladolid and Burgos, Spain, 2003; pp. 1–10. [Google Scholar]
  55. Mesa, H.A.; Molenaar, K.R.; Alarcón, L.F. Exploring performance of the integrated project delivery process on complex building projects. Int. J. Proj. Manag. 2016, 34, 1089–1101. [Google Scholar] [CrossRef]
  56. Rodrigo-García, G. New contracting modalities in construction. Turnkey, design and build, forward purchase and forward funding. Constr. Manag. 2004, 172, 40–44. [Google Scholar]
  57. Fernández-Romero, F.J. The Role of Project Management within the Scope of the Construction Contract; University of Seville: Seville, Spain, 2010. [Google Scholar]
  58. Godet, M. Introduction to la prospective. Futures 1986, 18, 134–157. [Google Scholar] [CrossRef]
  59. Godet, M. Actors’ moves and strategies: The mactor method. An air transport case study. Futures 1991, 23, 605–622. [Google Scholar] [CrossRef]
  60. Godet, M.; Meunier, F. Analyzing Actors’ Strategies: The Mactor Method; LIPS: Paris, France, 1996. [Google Scholar]
  61. Lakner, Z.; Kiss, A.; Merlet, I.; Oláh, J.; Máté, D.; Grabara, J.; Popp, J. Building coalitions for a diversified and sustainable tourism: Two case studies from Hungary. Sustainability 2018, 10, 1090. [Google Scholar] [CrossRef] [Green Version]
  62. Vivanco-Aranda, M.; Mojica, F.J.; Martínez-Cordero, F.J. Foresight analysis of tilapia supply chains (Sistema Producto) in four states in Mexico: Scenarios and strategies for 2018. Technol. Forecast. Soc. Chang. 2011, 78, 481–497. [Google Scholar] [CrossRef]
  63. Lafourcade, B.; Chapuy, P. Scenarios and Actors’ Strategies. Technol. Forecast. Soc. Chang. 2000, 65, 67–80. [Google Scholar] [CrossRef]
  64. Elmsalmi, M.; Khlifi, H.; Hachicha, W. Elaboration of Risk Mitigation Strategies based on Sustainable Development Practices. In Proceedings of the 6th International Conference on Advanced Logistics and Transport, Bali, Indonesia, 24–27 July 2017; IEEE: Bali, Indonesia, 2017; pp. 53–58. [Google Scholar]
  65. Lakner, Z. Main actors and their strategies in Hungarian higher education. Acta Oeconomica 2013, 63, 201–224. [Google Scholar] [CrossRef]
  66. Lo, C.C.; Wang, C.H.; Huang, C.C. The national innovation system in the Taiwanese photovoltaic industry: A multiple stakeholder perspective. Technol. Forecast. Soc. Chang. 2013, 80, 893–906. [Google Scholar] [CrossRef]
  67. Bettencourt, R. Strategic prospective for the implementation of employment policies in the Azores. Technol. Forecast. Soc. Chang. 2010, 77, 1566–1574. [Google Scholar] [CrossRef]
  68. Mangifera, L.; Isa, M. Development model of creative industries: An application of MACTOR. KnE Soc. Sci. 2019, 3, 360. [Google Scholar] [CrossRef]
  69. Heger, T.; Rohrbeck, R. Strategic foresight for collaborative exploration of new business fields. Technol. Forecast. Soc. Chang. 2012, 79, 819–831. [Google Scholar] [CrossRef]
  70. Made-Sutrisna, I.B.; Nyoman-Saskara, I.A.; Suyana-Utama, M.; Wiwin-Setyari, N.P. Prospective analysis of sustainable tourism development in penglipuran village as a tourist village role model in Bali. Technol. Soc. Sci. J. 2020, 13, 184–198. [Google Scholar]
  71. Godet, M.; Monti, R.; Meunier, F.; Roubelat, F. A toolbox for scenario planning. In Futures Research Methodology; Glenn, J.C., Gordon, T.J., Eds.; The Millennium Project: Washington, DC, USA, 2009; pp. 1–74. ISBN 978-0981894119. [Google Scholar]
  72. Rees, G.H.; MacDonell, S. Data gathering for actor analyses: A research note on the collection and aggregation of individual respondent data for MACTOR. Future Stud. Res. J. 2017, 9, 115–137. [Google Scholar] [CrossRef] [Green Version]
  73. He, Y.; Tian, K. Modeling experts selection for scientific evaluations. A scientometrics based study. In Proceedings of the International Conference on Modeling, Simulation, Optimization and Numerical Techniques, Shenzhen, China, 27–28 February 2019; Atlantis Press: Paris, France, 2019; pp. 194–201. [Google Scholar]
  74. Liu, X.; Xu, Y.; Montes, R.; Herrera, F. Social network group decision making: Managing self-confidence-based consensus model with the dynamic importance degree of experts and trust-based feedback mechanism. Inf. Sci. N. Y. 2019, 505, 215–232. [Google Scholar] [CrossRef]
  75. Liu, W.; Dong, Y.; Chiclana, F.; Cabrerizo, F.J.; Herrera-Viedma, E. Group decision-making based on heterogeneous preference relations with self-confidence. Fuzzy Optim. Decis. Mak. 2017, 16, 429–447. [Google Scholar] [CrossRef] [Green Version]
  76. Habibi, A.; Sarafrazi, A.; Izadyar, S. Delphi technique theoretical framework in qualitative research. Int. J. Eng. Sci. 2014, 3, 8–13. [Google Scholar]
  77. Afshari, A.R.; Yusuff, R.M.; Derayatifar, A.R. An application of Delphi method for eliciting criteria in personnel selection problem. Sci. Res. Essays 2012, 7, 2927–2935. [Google Scholar]
  78. Rankin, J.; Fayek, A.R.; Meade, G.; Haas, C.; Manseau, A. Initial metrics and pilot program results for measuring the performance of the Canadian construction industry. Can. J. Civ. Eng. 2008, 35, 894–907. [Google Scholar] [CrossRef]
  79. Williams, T. Identifying success factors in construction projects: A case study. Proj. Manag. J. 2016, 47, 97–112. [Google Scholar] [CrossRef]
  80. Alashwal, A.M.; Fareed, N.F.; Al-obaidi, K.M. Determining success criteria and success factors for international construction projects for malaysian contractors. Constr. Econ. Build. 2017, 17, 62–80. [Google Scholar] [CrossRef] [Green Version]
  81. Frefer, A.A.; Mahmoud, M.; Haleema, H.; Almamlook, R. Overview success criteria and critical success factors in project management. Ind. Eng. Manag. 2018, 7, 1000244. [Google Scholar]
  82. Xiao, H.; Proverbs, D. Factors influencing contractor performance: An international investigation. Eng. Constr. Archit. Manag. 2003, 10, 322–332. [Google Scholar] [CrossRef]
  83. Ahadzie, D.K.; Proverbs, D.G.; Olomolaiye, P.O. Critical success criteria for mass house building projects in developing countries. Int. J. Proj. Manag. 2008, 26, 675–687. [Google Scholar] [CrossRef]
  84. Khosravi, S.; Afshari, H. A success measurement model for construction projects. In Proceedings of the 11th International Conference on Financial Management and Economics, Hong Kong, China, 2–3 July 2011; IACSIT Press: Singapore, 2011; pp. 186–190. [Google Scholar]
  85. Yan, H.; Elzarka, H.; Gao, C.; Zhang, F.; Tang, W. Critical Success Criteria for Programs in China: Construction Companies’ Perspectives. J. Manag. Eng. 2019, 35, 04018048. [Google Scholar] [CrossRef]
  86. Zhang, J.; Kang, L.; Li, H.; Ballesteros-Pérez, P.; Skitmore, M.; Zuo, J. The impact of environmental regulations on urban Green innovation efficiency: The case of Xi’an. Sustain. Cities Soc. 2020, 57, 102123. [Google Scholar] [CrossRef]
  87. Cheung, S.O.; Suen, H.C.H.; Cheung, K.K.W. PPMS: A Web-based construction Project Performance Monitoring System. Autom. Constr. 2004, 13, 361–376. [Google Scholar] [CrossRef]
  88. Wang, Q.; El-Gafy, M.; Zha, J. Bi-Level Framework for Measuring Performance to Improve Productivity of Construction Enterprises. In Proceedings of the 2010 Construction Research Congress, Banff, AB, Canada, 8–10 May 2010; ASCE: Reston, VA, USA, 2010; pp. 970–979. [Google Scholar]
  89. Chan, A.P.C.; Scott, D.; Lam, E.W.M. Framework of Success Criteria for Design/Build Projects. J. Manag. Eng. 2002, 18, 120–128. [Google Scholar] [CrossRef]
  90. Chovichien, V.; Nguyen, T.A. List of indicators and criteria for evaluating construction project success and their weight assignment. In Proceedings of the 4th International Conference on Engineering, Project, and Production Management, Bangkok, Thailand, 23–25 October 2013; EPPM: Bangkok, Thailand, 2013; pp. 130–150. [Google Scholar]
  91. Heravi, G.; Ilbeigi, M. Development of a comprehensive model for construction project success evaluation by contractors. Eng. Constr. Archit. Manag. 2012, 19, 526–542. [Google Scholar] [CrossRef]
  92. Chan, A.P.C.; Chan, A.P.L. Key performance indicators for measuring construction success. Benchmarking 2004, 11, 203–221. [Google Scholar] [CrossRef]
  93. Leong, T.K.; Zakuan, N.; Mat-Saman, M.Z.; Ariff, M.S.M.; Tan, C.S. Using Project Performance to Measure Effectiveness of Quality Management System Maintenance and Practices in Construction Industry. Sci. World J. 2014, 2014, 1–9. [Google Scholar] [CrossRef]
  94. Nassar, N.; AbouRizk, S. Practical Application for Integrated Performance Measurement of Construction Projects. J. Manag. Eng. 2014, 30, 04014027. [Google Scholar] [CrossRef]
  95. Spanish Government. Royal Decree 235/2013 for the approval of the basic procedure for the certification of the energy efficiency of buildings. Off. State Gaz. 2013, 89, 27548–27562. [Google Scholar]
  96. Spanish Government. Royal Decree 1000/2010 on compulsory professional boards’certification. Off. State Gaz. 2010, 190, 68555–68559. [Google Scholar]
  97. Von-der-Gracht, H.A. Consensus measurement in Delphi studies. Review and implications for future quality assurance. Technol. Forecast. Soc. Change 2012, 79, 1525–1536. [Google Scholar] [CrossRef]
  98. Mengual-Andrés, S.; Roig-Vila, R.; Mira, J.B. Delphi study for the design and validation of a questionnaire about digital competences in higher education. Int. J. Educ. Technol. High. Educ. 2016, 13, 12. [Google Scholar] [CrossRef] [Green Version]
  99. Godet, M. Handbook of Strategic Prospective, 3rd ed.; Dunod: Paris, France, 2007; ISBN 978-2100531622. [Google Scholar]
  100. Jason, L.A.; Glenwick, D.S. Handbook of Methodological Approaches to Community-Based Research; Oxford University Press: Oxford, UK, 2016; ISBN 978-0190243654. [Google Scholar]
  101. Yang, J.; Shen, G.Q.; Ho, M.; Drew, D.S.; Chan, A.P.C. Exploring critical success factors for stakeholder management in construction projects. J. Civ. Eng. Manag. 2009, 15, 337–348. [Google Scholar] [CrossRef]
  102. Nematpour, M.; Khodadadi, M.; Rezaei, N. Systematic analysis of development in Iran’s tourism market in the form of future study: A new method of strategic planning. Futures 2021, 125, 102650. [Google Scholar] [CrossRef]
  103. Walters, J.; Kaminsky, J.; Gottschamer, L. A Systems Analysis of Factors Influencing Household Solar PV Adoption in Santiago, Chile. Sustainability 2018, 10, 1257. [Google Scholar] [CrossRef] [Green Version]
  104. IPMA ICB. Individual Competence Baseline for Project, Programme & Portfolio Management, 4th ed.; IPMA: Zurich, Switzerland, 2015; ISBN 978-9492338013. [Google Scholar]
  105. Davis, K. Different stakeholder groups and their perceptions of project success. Int. J. Proj. Manag. 2014, 32, 189–201. [Google Scholar] [CrossRef]
  106. Smith, N. Roles and responsibilities in project contract management. In Contracting for Project Management; Turner, J.R., Ed.; Routledge: New York, NY, USA, 2017; pp. 1–18. ISBN 978-0566085291. [Google Scholar]
  107. Cerezo-Narváez, A.; Pastor-Fernández, A.; Otero-Mateo, M.; Ballesteros-Pérez, P. Integration of cost and work breakdown structures in the management of construction projects. Appl. Sci. 2020, 10, 1386. [Google Scholar] [CrossRef] [Green Version]
  108. Moore, C.C.; Mosley, D.C.; Slagle, M. Partnering guidelines for win-win project management. Proj. Manag. J. 1992, 23, 18–21. [Google Scholar]
  109. Soewin, E.; Chinda, T. Development of a construction performance index in the construction industry: System dynamics modelling approach. Int. J. Constr. Manag. 2020, 1–12. [Google Scholar] [CrossRef]
  110. Shehu, Z.; Endut, I.R.; Akintoye, A. Factors contributing to project time and hence cost overrun in the Malaysian construction industry. J. Financ. Manag. Prop. Constr. 2014, 19, 55–75. [Google Scholar] [CrossRef]
Figure 1. MACTOR stages from Stakeholders Relationships of Power.
Buildings 11 00184 g001
Figure 2. MACTOR stages from Objectives Positions.
Buildings 11 00184 g002
Figure 3. Map of Influences and Dependencies between Actors (left: Technical Project, right: Building Work). Extracted from MACTOR Software version 5.1.2.
Buildings 11 00184 g003
Figure 4. Net Distances between Actors (left: Technical Project, right: Building Work). Extracted from MACTOR Software version 5.1.2.
Buildings 11 00184 g004
Figure 5. Net Distances between Objectives (left: Technical Project, right: Building Work). Extracted from MACTOR Software version 5.1.2.
Buildings 11 00184 g005
Table 1. List of building agents.
IDAcronymReferenceNoteBuilding AgentsPW
A01TC[23](1)Topographical ConsultantsX
A02GC[23](1)Geotechnical ConsultantsX
A03PD[23](2)Project DesignersX
A04SD[42](1, 3)Structural DesignersX
A05FD[42](1, 3)Facility DesignersX
A06EEC[95](3, 4)Energy Efficiency CertifiersX
A07TD[23](2)Telecommunications DesignersX
A08IDLD[45](5)Interior Designers, Landscapers and/or DecoratorsX
A09EIC[23](1, 3)Environmental Impact ConsultantsX
A10HSP[36](6)Health and Safety PlannersX
A11UMP[23](1, 3)Use and Maintenance PlannersX
A12PHSC[36](6)Project Health and Safety CoordinatorsX
A13RED[23](2)Real Estate DevelopersXX
A14O[23](2)OwnersXX
A15FU[23](2)Final UsersXX
A16PM[40](5)Project ManagersXX
A17PA[23](2)Public AdministrationsXX
A18SRPB[96](7)Self-regulatory Professional BodiesXX
A19FI[43](5)Financial InstitutionsXX
A20IC[43](1, 3)Insurance CompaniesXX
A21QCLE[23](2)Quality Control Laboratories and EntitiesXX
A22WM[48](1, 6)Waste ManagersXX
A23PS[23](2)Project Supervisors X
A24SS[42](1, 8)Structural Supervisors X
A25FS[42](1, 8)Facility Supervisors X
A26TS[23](2)Telecommunications Supervisors X
A27WS[23](2)Work Supervisors X
A28WHSC[36](6)Work Health and Safety Coordinators X
A29BC[23](2)Building Contractors X
A30CM[47](5)Construction Managers X
A31SF[46](5, 9)Site Foremen X
A32SSC[49](6, 9)Specialist Subcontractors X
A33SEW[23](2, 9)Self-employed Workers X
A34PS[23](2, 9)Product Suppliers X
(1) Implicitly recognized in Spanish LOE 38/1999. (2) Explicitly recognized in Spanish LOE 38/1999. (3) Subcontracts for Project Designers. (4) Explicitly recognized in Spanish Royal Decree 235/2013. (5) Figures not included in the Spanish regulatory framework. (6) Explicitly recognized in Spanish Royal Decree 1627/1997. (7) Explicitly recognized in Spanish Royal Decree 1000/2010. (8) Subcontracts for Project Supervisors. (9) Subcontracts for Contractors. P: Technical Project. W: Building Work.
Table 2. List of objectives of the building process.
DecadeSourceO01O02O03O04O05O06O07O08O09O10O11O12
CSQSWHSEFPTPPFCMCS
2001–2010[89]XXX-XXXXXX-X
[82]XXX-XX---X-X
[92]XXX-XXX--X-X
[87]XXX-XX----XX
[83]XXX--X-----X
[78]XXXXXX------
[88]XXXX------X-
2011–2020[84]XXX-XX-----X
[91]XXX-XX---X-X
[90]XXX-XXXXX-XX
[93]XXX-X------X
[94]XXX-X----X-X
[79]XX-XX--X-X--
[80]XXXXX-X-XX-X
[81]XXXXXXXXXX-X
[85]XXX-XX---X-X
Sources are shown in chronological order. C: Cost. S: Schedule. Q: Quality. SW: Scope (of Work). HS: Health and Safety. E: Environment. F: Functionality. P: Productivity. TP: Technical Performance. PF: Profitability. CM: Communication. CS: Customer Satisfaction.
Table 3. Panel of experts.
UniversityKnowledge AreaAcademic<break/>RolesProfessional<break/>RolesAcademic YearsProfessional YearsTransfer ContractsBuilding<break/>Projects
Cadiz125Associate ProfessorUrbanism Consultant211387
Cordoba510Full ProfessorEnvironmental Manager4324237
Granada110Associate ProfessorTechnical Director 1517737
130Full ProfessorContract Auditor391856
715Full ProfessorTechnical Director 20243142
720Full ProfessorConstruction Manager2010308
Jaen720Associate ProfessorOperations Manager3412827
Malaga715Adjunct ProfessorTechnical Director 1319641
720Associate ProfessorFacilities Specialist30121518
Polytechnic of Madrid110Full ProfessorStructures Specialist47162640
720Full ProfessorProgram Manager32232060
Polytechnic of Valencia110Associate ProfessorProject Manager 21426139
715Adjunct ProfessorTechnical Director 14193696
720Associate ProfessorProperty Developer21151215
Seville110Full ProfessorQuality Controller28401041
130Adjunct ProfessorProperty Advisor 2335624
715Full ProfessorTechnical Director 27252870
715Associate ProfessorTechnical Director 1321552
Knowledge Areas of the Council of Universities of Spain: 110: Architectural Constructions. 125: Administrative Law. 130: Civil Law. 510: Construction Engineering. 715: Architectural Projects. 720: Engineering Projects.
Table 4. Matrix of Direct Influences (MDI). Data input for MACTOR Software version 5.1.2.
A01A02A03A04A05A06A07A08A09A10A11A12A13A14A15A16A17A18A19A20A21A22A23A24A25A26A27A28A29A30A31A32A33A34
A01 010000000000000000000000000000000
A020 11000011000000000000000000000000
A0311 4441111411000020000000000000000
A04011 000011110000020000000000000000
A050010 10011110000020000000000000000
A0600101 0011110000020000000000000000
A07001010 011111000020000000000000000
A080010000 00000000000000000000000000
A0900111010 0000000020000000000000000
A10001110100 011000020000000000000000
A110011111000 00000020000000000000000
A1200111110111 1000020000000000000000
A13000000000000 214004000000000000000
A140000000000001 41001100000000000000
A1500000000000000 0000000000000000000
A16332002242222010 000333200222340004
A170110011011111000 10101100111100000
A1811111110111100000 0000111111000000
A19000000000000110000 310000000000000
A200000000000001100001 20000000000000
A2101111000000000000000 0111110000000
A22001110101001000000000 111111100011
A231000000000000000020000 44111100011
A2400000000000000000200001 0011100011
A25000000000000000002000010 111100011
A261000000000000000020000101 11100011
A2710000000000000000200001111 1100011
A28100000000000000002000011111 100011
A291000000000000000000001000000 04433
A3000000000000000010000001111111 0011
A31000000000000000000000000000010 100
A320000000000000000000000000000100 00
A3310000000000000000000010000001001 1
A34100000000000000000000100000010011
Influences are graded from 0 to 4 according to the importance of the actor’s jeopardy: 0: No influence. 1: Operating procedure. 2: Choice. 3: Functions. 4: Existence.
Table 5. Matrix of Actors × Objectives (2MAO). Data input for MACTOR Software version 5.1.2.
A01A02A03A04A05A06A07A08A09A10A11A12A13A14A15A16A17A18A19A20A21A22A23A24A25A26A27A28A29A30A31A32A33A34
O01−2−2−2−4−4−2−2−4−2−2−2−2122−30033−1−2−2−4−4−2−2−2−3−4−4−4−4−2
O02−2−2−2−4−4−2−2−4−2−2−2−2122−30012−1−2−2−4−4−2−2−2−3−4−4−4−4−2
O033334422422221123000332344222344444
O044434444443441123000334244422344444
O051111111131111001000333111113333111
O061111111133131001000333111111333111
O071131111411311121000000311111−11−1−1−11
O081134411411111004001001111111344444
O092224422422221004000012244222344444
O10−1−1−1−3−3−1−1−3−1−1−1−1322300300−1−1−3−3−1−1−1−3−3−3−3−3−3
O111111111111111111001111111111111111
O122221112222124324001112211222211111
The sign indicates whether the actor is likely to reach objective or not. 0: Objective has a bleak outcome. 1: Objective Oi jeopardises (is vital for) the actor’s Aj operating procedures. 2: Objective Oi jeopardises the actor’s Aj choice/is vital for its choice. 3: Objective Oi jeopardises (is indispensable for) the actor’s Aj functions. 4: Objective Oi jeopardises (is indispensable for) the actor’s Aj existence.
Table 6. Summary of Direct and Indirect and Maximum Influences and Dependencies between Actors (DI, II, MI, DD, ID, MD). Extracted from Table 4, Table A1 and Table A3.
A01A02A03A04A05A06A07A08A09A10A11A12A13A14A15A16A17A18A19A20A21A22A23A24A25A26A27A28A29A30A31A32A33A34
DI1426888916871111805317176591615899101015102144
II1334102636668721353686085743702261571272625818312561696975753693752626
MI13133620202024132024202464270753222181623302524242424242727551717
DD58171213111051211131185560316861271011111211164471216
ID41551199210372852699928990621918170181192020814464747581781059194499108
MD293132313130302530273030201114130391212132920292929292722919192026
Table 7. Summary of Net Scale of Influences and Dependencies between Actors (NS). Extracted from Table A2.
A01A02A03A04A05A06A07A08A09A10A11A12A13A14A15A16A17A18A19A20A21A22A23A24A25A26A27A28A29A30A31A32A33A34
NS−28−21−17−29−37−4−13−13−46−24−29−51218−18209157−547561281−3−5−6−6−3−6984−12−39−73−82
Table 8. Competitiveness Relationships and Maximum Competitiveness Relationships between Actors (Ri, Qi). Extracted from MACTOR Software version 5.1.2.
A01A02A03A04A05A06A07A08A09A10A11A12A13A14A15A16A17A18A19A20A21A22A23A24A25A26A27A28A29A30A31A32A33A34
Ri0.10.31.20.60.60.90.80.10.50.70.61.11.10.60.05.84.41.30.40.41.81.12.50.80.90.90.90.90.22.30.00.00.10.1
Qi0.30.31.50.60.60.60.80.30.60.90.60.83.71.504.92.40.60.80.71.11.21.10.80.80.80.80.91.11.50.10.10.60.5
Table 9. Summary of Convergences and Divergences among Actors. Extracted from Table A6, Table A7, Table A8, Table A9, Table A10 and Table A11.
A01A02A03A04A05A06A07A08A09A10A11A12A13A14A15A16A17A18A19A20A21A22A23A24A25A26A27A28A29A30A31A32A33A34
SCV33133133133133133133133133133133133126715715731100101186257331308331331331331331311331311311311331
VCV65265268679079062363883869265064566546228230773400143401533645664751751638609636754844819765765740
WCV359432698601604551560388486541501645454221025120010724969863210986296625635565864101436343327377382
SDV191919191919191919191919838383390079541019151919191919391939393919
VDV33333748483333543333373316518018290001881411537294848333333684873737338
WDV172034313126261921242528155132031800116911133413436262727367231303418
SCV: Simple Convergences. SDV: Simple Divergences. VCV: Valued Convergences. VDV: Valued Divergences. WCV: Weighted Valued Convergences. WDV: Weighted Valued Divergences.
Table 10. Agreements, Disagreements and Mobilization in relation to the Objectives. Extracted from Table 5, Table A4 and Table A5.
O01O02O03O04O05O06O07O08O09O10O11O12
SOK553131292924282853232
VOK118881044547345977133255
WOK4.53.476.490.944.746.428.957.874.323.028.361.5
SKO−27−270000−400−2500
VKO−73−730000−400−4700
WKO−67−670000−100−3000
MB71.670.576.490.944.746.429.357.874.353.128.361.5
SOK: Simple Agreements. SKO: Simple Disagreements. VOK: Valued Agreements. VKO: Valued Disagreements. WOK: Weighted Valued Agreements. WKO: Weighted Valued Disagreements. MB: Degree of Mobilization.
Publisher’s Note: MDPI stays neutral with regard to jurisdictional claims in published maps and institutional affiliations.

