Abstract
Various concretes have been developed to meet the principles of sustainability. High volume fly ash-self compacting concrete (HVFA-SCC) is one example. The utilization of HVFA-SCC for structural applications, however, raises a concern among designers: that HVFA-SCC may not be as strong as conventional concrete when carrying shear forces. This concern is related to slow strength development and relatively smoother crack surface formation in HVFA-SCC, which, consequently, reduces the aggregate interlock mechanism contribution to the shear strength. In this respect, the design code for estimating the shear strength of HVFA-SCC may not be valid for the reason that the code was developed on the basis of the conventional concrete database. Previous research on the shear strength of HVFA-SCC was limited and no database can be extracted to justify the validity of the shear design code. This research was conducted to clarify the suitability of shear design code for HVFA-SCC. The research began with a limited laboratory investigation, followed by a numerical investigation to expand the range of results. Two types of HVFA-SCC beams with dimensions of 100 mm × 150 mm × 1700 mm were prepared, utilizing 50% and 60% fly ash. The shear behavior obtained from the laboratory investigations was then numerically modeled with the help of 3D ATENA Engineering software. The numerical model was used to explore the influence of reinforcement ratio, shear span to beam effective depth ratio, and beam size on the shear strength of the HVFA-SCC beam. The results were compared with the shear strength database of conventional and unconventional concrete beams to judge if the provisions in the design code can be applied to the shear design of an HVFA-SCC beam. The results confirm that the ACI shear design code is applicable for HVFA-SCC.
1. Introduction
HVFA-SCC is a type of concrete that combines high volume fly ash (HVFA) and self-compacting concrete (SCC). HVFA concrete is defined as concrete that uses fly ash as a supplementary cementitious material to replace cement, where the replacement level is at least 50% by the weight of cement. Fifty percent fly ash is considered to be high, and exceeds the conventional use of fly ash, which is limited to the range of 15–25%. HVFA concrete is suitable for mass concrete applications to reduce heat of hydration [1]. In the late 1980s, the Canadian Center for Minerals and Energy Technology (CANMET) began the development of HVFA concrete for structural use. They showed that, with a replacement level of 60%, it is possible to produce concrete for structural applications, with good mechanical properties and durability [2,3]. Meanwhile, SCC is a type of concrete that has the ability to flow independently by utilizing gravitational energy. The moderate viscosity of SCC allows it to flow unhindered, even through congested reinforcement areas, while maintaining the homogeneity of the mixture and without the risk of segregation and bleeding [4,5]. The main advantages of using SCC in construction are efficiency in the construction process in terms of shorter time, reduced labor costs, and better compaction of concrete. Considering the advantages of the two types of concrete above, several researchers began to combine the two types of concrete as a new type of concrete called HVFA-SCC, which is designed using carefully selected and proportioned materials, including high amounts of fly ash (minimum 50% of the total binder) to produce structural concrete that is durable and environmentally friendly [6,7,8,9]. In a study conducted by Bouzoubad and Lachemi [10], it was shown that HVFA-SCC could be designed by replacing 60% cement with class F fly ash. In addition, Nehdi et al. [11] also studied the resistance of SCC by incorporating fly ash and slag in high volumes and they concluded that SCC with 50% replacement of fly ash and slag could improve workability and durability.
The use of fly ash in high volumes is not without its drawbacks. One of them is a problem related to slow strength development. In addition, SCC with a lower proportion of coarse aggregate and smaller aggregate size can lead to relatively smoother crack surface formation and affect the aggregate interlock mechanism in its contribution to the shear strength of concrete. This fact raises concerns among designers that SCC may not be as strong as conventional concrete in carrying shear forces. Several researchers have tried to answer this problem, including Lin and Chen [12] who studied the shear behavior of SCC with two levels of coarse aggregate content (CA), namely a lower and higher amount of CA than conventional concrete (CC). A total of 24 SCC beams were tested with a rectangular cross-section. It is known that the shear strength of a beam with a higher amount of CA indicates shear strength comparable to that of a CC beam. However, SCC beams containing a lower CA have less ultimate shear strength than CC beams. From recent studies conducted by Ahmad and Inaam [13], based on the shear strength database from several papers, it was concluded that the SCC beam without a stirrup has an average strength ratio of 1.86 compared to the shear strength calculated from the ACI code and only around 6.67% were unconservative. Meanwhile, concerns related to the use of fly ash in high volumes, associated with shear strength, have also been researched by Ortega [14]. Two types of beams were used in Ortega’s research design, namely a mixture of 70% fly ash to substitute cement and a mixture of 100% Portland cement. The results were compared with several design codes commonly used in North America and Europe. He concluded that the existing design codes for conventional concrete were acceptable for HVFAC designs. Arezoumandi et al. [15] conducted an experimental study on the shear strength of a full-scale beam constructed with two different fly ash contents (50% and 70% by weight) and compared the results with conventional concrete (CC). A total of 12 tests were carried out without stirrups and with three different ratios of longitudinal reinforcement. They concluded that HVFAC beams have shear strengths comparable to CC beams.
Concern regarding the validity of design codes for estimating the shear strength of non-conventional concrete has been an issue of some research [14,15,16,17,18,19]. With respect to HVFA-SCC, the results shown by previous research are promising; this concrete has adequate shear strength. This implies that the code provisions that were actually developed for the conventional beam shear design can be used as an approach in the HVFA-SCC beam shear design. This has also been confirmed by Algazali et al. [20] and shows that the shear strength of the HVFA-SCC beam still meets the minimum value of the ACI design code. However, Algazali et al.’s research is still limited to the reinforcement ratio of 1.69–2.71% and the ratio of shear span to the effective depth of the beam is about 3.3. Thus, there is still room for wider exploration by investigating other important parameters that affect the shear strength of HVFA-SCC beams.
This research was conducted for this purpose. However, it must be realized that it will take a lot of expensive resources to investigate these parameters, if it relies solely on experiments in the laboratory. Therefore, the approach used in this research began with a limited laboratory investigation and was followed by a numerical investigation to expand the range of results. Laboratory investigations were carried out by preparing two types of beams, namely HVFA-SCC with fly ash contents of 50% and 60% (by weight) as cement substitution. The shear behavior obtained from the results of laboratory investigations was then numerically modeled with the help of 3D ATENA Engineering software. This numerical model was then used to explore the influence of several major parameters, which affect the shear strength of the HVFA-SCC beam. The results of this numerical investigation were compared with the shear strength of conventional and unconventional concrete databases as a basis for concluding whether the provisions in the design code can be applied to the shear design of HVFA-SCC beams.
2. Parameters Affecting Shear
This research will be precisely on target if major parameters affecting shear strength of RC beam were identified and selected carefully. Some of the literature was quite helpful in identifying these parameters, as indicated by the joint ASCE-ACI Committee 426 [21] and joint ASCE-ACI Committee 445 [22], which is now generally accepted in the research community as a shear failure model (see Figure 1). Figure 1 shows that the shear strength of the concrete beam consists of a shear component in the compression zone of the beam that is not cracked (Vcc), shear transfer at the interface due to aggregate interlock (Vca), dowel action of longitudinal reinforcement (Vd), and the residual tensile stress across the crack (Vcr). Several parameters have been identified as having a significant influence on the contribution to the shear resistance mechanism. The most-dominant, known mechanism influences are concrete strength, span to depth ratio (a/d), longitudinal reinforcement ratio, aggregate size, axial force, as well as other parameters such as bearing conditions, point of loading, etc.
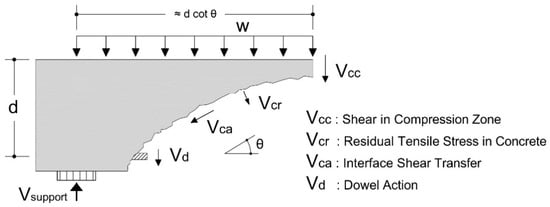
Figure 1.
The balance of forces at the formation of the primary diagonal crack before shear failure.
In many design codes, the shear strength of a structural component is usually considered to be directly proportional to (fc’)0.33–0.5, which indicates that the tensile strength of concrete is used as a governing parameter [23]. The strength of the concrete also affects the Vcc component. Concrete with high compressive strength will be more resistant to preserve its compression zone. However, for concrete that is categorized as high strength (more than 50 MPa), diagonal cracking can pass through, instead of around, the aggregates due to the high strength of the cement paste. This condition will cause a smoother crack surface, which, in turn, can affect the shear transfer mechanism and result in an unconservative prediction [24,25,26].
The ratio of the shear span to the effective height of the beam (a/d) affects the magnitude of the combination of moments and shear forces arising on the beam. The combination of these forces determines the type of diagonal crack formation that will trigger shear failure. In long shear spans (a/d ≥ 6), the moment is very dominant compared to shear force so that the beam collapses due to bending before the formation of diagonal cracks. At an a/d ratio between 2.5 and 6.0, the combination of flexure-shear forces will cause the formation of a diagonal tension crack which triggers shear failure. At shorter shear spans (i.e., a/d ratio between 1.0 and 2.5), the beam can redistribute the internal forces that occur after the formation of the diagonal crack, so that the beam is able to bear a higher additional load than the beam with a ratio a/d ≥ 2.5. In a beam with a/d ≤ 1, a compression load path will be formed directly to the support; the beam resists shear force through the arch action mechanism [27,28,29,30].
The flexural reinforcement ratio (ρ) affects the shear strength of the beam through the dowel action. The greater the reinforcement ratio, the greater the dowel action provided by the reinforcement. However, the effectiveness of this dowel action is influenced by the thickness of the concrete cover and the tensile strength of the concrete. Inadequate thickness of the concrete cover and low tensile strength results in weakness of the concrete when providing support during the dowel action. The diagonal shear crack formation and propagation is also influenced by reinforcement ratio. The higher the flexural reinforcement ratio, the smaller the longitudinal strain that occurs in the reinforcement, which prevents propagation of the diagonal crack into the compression zone. The small longitudinal strain also reduces the diagonal crack width so that the aggregates interlocking in the diagonal crack plane are effective in contributing to the shear transfer [31].
Analysis of the shear cracks through fracture mechanics resulted in the conclusion that the nominal shear strength of concrete beams will decrease as the size of the beams increase. Bazant and Kim [32] calculated the nominal reduction in shear strength by giving the λs factor of:
where d is the effective height of the beam, da is the maximum aggregate size, and λ0 is a constant. Meanwhile, ACI 318-19 [33] set the modification value as shown in Equation (2) to take into account the size effect:
3. Methods
The method used in this research was an experimental method undertaken in the laboratory; the results were then further explored using numerical methods. The details of these two methods will be explained in the following subsection.
3.1. Experimental Investigation
3.1.1. Materials and Properties
The fly ash used in this research (Table 1) contained 64.17% Al2O3 + SiO2 + Fe2O3 with 11.29% Al2O3, 31.76% SiO2, and 21.12% Fe2O3. Meanwhile, the level of SO3 was 1.67% and CaO was 15.02%. Therefore, according to ASTM C-618, the fly ash used belonged to class C fly ash (which includes ‘C1′ type fly ash according to CSA A3001). This fly ash was mixed with Ordinary Portland Cement (OPC) to form the binder used in the HVFA-SCC mix design. The amount of fly ash content was 50% and 60% of the total weight of the binder.

Table 1.
Oxide composition of fly ash.
The HVFA-SCC mixture was developed through an optimization process for the binder and aggregate composition. Table 2 describes the properties and composition of HVFA-SCC.

Table 2.
Material proportions in HVFA-SCC beams.
The fine aggregate comprised river sand with a specific gravity of 2.62 and absorption of 1.9. Coarse aggregates comprised crushed stone with a maximum size of 15 mm and specific gravity of 2.64. A polycarboxylate ether (PCE)-based superplasticizer was used to improve the flowability of the mixture. The superplasticizer dosage was adjusted for each mixture to achieve a slump flow target of at least 600 mm. The final design of the HVFA-SCC mixture is illustrated in Table 2.
Before the concrete mixing process, all of the required materials were weighed according to the composition of the trial mix. The concrete mixing process started with mixing dry materials (cement, fly ash, fine aggregate, coarse aggregate) in the concrete mixer, followed by the addition of up to three quarters of the water needed. After about 5 min, the superplasticizer liquid and the remaining water were added gradually and thoroughly mixed in the concrete mixer until a visually even mix of concrete was reached. The HVFA-SCC mixture was designed to meet the characteristics of passing abilities and filling abilities, according to the guidelines in EFNARC 2002 and ASTM C1611. In Table 3, the properties of HVFA-SCC fresh concrete are presented.

Table 3.
Fresh properties of HVFA-SCC mixes.
The compressive strength of the concrete was determined by testing a standard cylindrical specimen with a diameter of 150 mm and a height of 300 mm following ASTM C39, while the direct tensile test used a prism specimen of dimensions 100 mm × 100 mm × 400 mm. The direct tensile test was similar to that of Alhussainy et al. [34]. The specimens were cured by covering them with wet gunny sacks for seven days.
Testing of the mechanical properties of the concrete material was carried out after 28 days, along with the testing of the beams. The average compressive strength of HVFA-SCC with cement replacement levels of 50% and 60% were 35.18 and 31.84 MPa, respectively. Based on the results of the direct tensile strength test, the 50% and 60% HVFA-SCC concrete had an average tensile strength of 2.06 MPa and 2.21 MPa, respectively.
3.1.2. Beam Specimens
There were two groups of test beam specimens, namely HVFA-SCC concrete beams with fly ash content of 50% and 60%. Each group consisted of three beam specimens. All of the beams used 16 mm diameter longitudinal reinforcement, without stirrups, and were designed as shear failure beams.
All of the beams had a width (b) of 100 mm, a total span length of 1700 mm and a total depth (h) of 150 mm. The distance between supports was 1500 mm. The ratio of shear span to effective depth (a/d) was 4.2. Two steel reinforcements with a diameter of 16 mm and yield strength of 402.95 MPa were used as longitudinal tensile reinforcement. The placement of the longitudinal reinforcement can be seen in Figure 2.

Figure 2.
Reinforcement arrangement.
Formwork, made of wooden planks, was prepared before casting. To avoid leakage and absorption of water, all wood joint holes and the inner surface of the wooden formwork were covered with duct tape. The placement of the reinforcement into the formwork was in accordance with the design drawing. HVFA-SCC concrete casting was carried out from above and allowed independent flow, filling the formwork and covering the reinforcement without using a vibrator. After one day, the beams were covered with wet gunny sacks. After seven days, the specimen beam and its supports were removed from the formwork and stored in the laboratory room for 28 days. Before the beam specimen was tested, both sides of the beam were painted white and marked with vertical and horizontal lines every 5 cm, to facilitate the detection and plotting of concrete cracks.
3.1.3. Testing Beam Specimens
Loading on the beam was applied by a hydraulic pump connected to a load measuring instrument (load cell) and a digital load indicator. The deflection of the beam was measured by a dial gauge, placed as indicated in Figure 3.
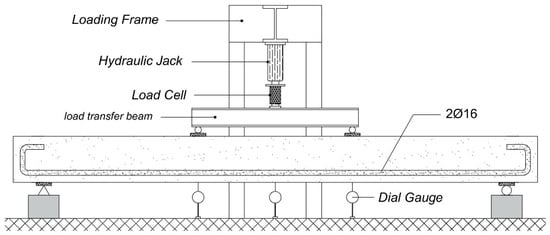
Figure 3.
Beam specimen testing setup.
The beam was tested with a four-point bending configuration on a simple support, as shown in Figure 3. Steel profile I was used as a point load divider at both ends. At a load increment of 0.25 kN, cracks on both sides of the beam were observed visually and plotted on both sides of the beam. The condition of the beams before and after failure can be seen in Figure 4.
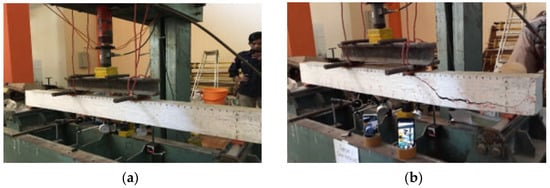
Figure 4.
Testing the specimen beam (a) before and (b) after the beam shear failure.
3.2. Numerical Modeling
Numerical modeling was carried out with the help of 3D ATENA Engineering Software (Cervenka Consulting, Prague, Czech Republic), to investigate the effect of the a/d ratio, the longitudinal reinforcement ratio (ρ), and beam effective depth (d). The effect of the a/d ratio was determined by extending the beam span but maintaining the cross-sectional size. The effect of the flexural reinforcement ratio was investigated by providing various reinforcement diameters in the range of reinforcement ratios between ρmin and ρmax. The effect of d was carried out by varying the beam depth but keeping the width and the reinforcement area.
3.2.1. Materials Model
Material modeling (constitutive model) was used to define the properties of a material numerically; this represents the response of the material when it receives a load or stress. In this research, the constitutive model for concrete was defined as 3D Nonlinear Cementitious 2 within the ATENA software. This material has a stress-strain relationship as shown in Figure 5. In ATENA software, the concrete properties inherent in 3D Nonlinear Cementitious 2 can be generated as a function of the characteristic cube compressive strength of concrete. However, the parameters generated from the ‘generate process’ can be modified according to the real properties of the concrete used in the simulation.
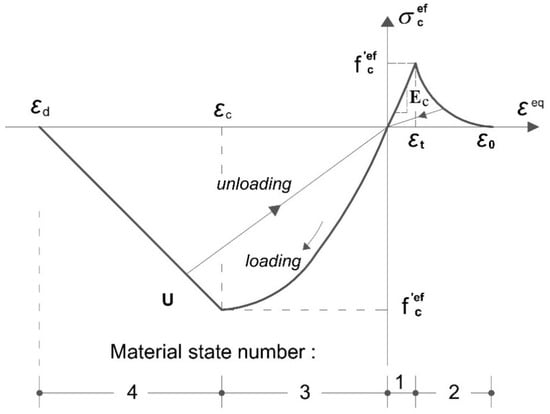
Figure 5.
Uniaxial stress-strain relationship for concrete.
The stress-strain relationship that represents reinforcement material is defined as a material that has elastic, perfectly plastic (bilinear) properties. The choice of this model is quite realistic because, in reinforced concrete beams with typical shear failure, the collapse occurs before or when the flexural reinforcement reaches the yield limit; there is no strain hardening mechanism.
In the ATENA program, the transfer between point loads (e.g., external loads, support reactions, etc.) and the concrete elements must be carried out through an intermediate material that ensures no stress concentration occurs in the concrete. The presence of this stress concentration can cause premature failure in this area. The intermediate material used to assist load transfer to the concrete in this study was a steel plate. The steel plate used is defined as a 3D Elastic Isotropic material, where the stress-strain relationship (constitutive model) of this material is linear.
The material properties used as inputs in material modeling are shown in Table 4.

Table 4.
Material properties.
3.2.2. Beam Model and Finite Element Meshing
The geometry of the beam and reinforcement investigated in this research is illustrated in Figure 6. The symmetrical nature of the beam allowed modeling to be carried out only at half-span. In the ATENA program, solid element geometries were modeled as macro-elements. In this research, there were 3 macro-elements that had to be defined, each of which represented a concrete beam element (macro-element 1), a left support steel plate element (macro-element 2), and a steel plate as an intermediary for the transfer of external loads (macro-element 3). Meanwhile, the geometry of the line elements representing the reinforcement was modeled and defined as ‘reinforcement bars’.
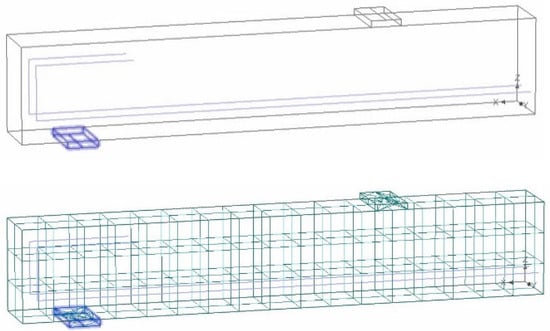
Figure 6.
Beam modeling and its meshing.
The relationship between one solid element and the other solid elements was modeled and defined by the ‘contacts’ on each ‘surface’ which were connected to each other. In this research, the contact surface between concrete beams and steel plates used the perfect connection type. Perfect connection ensures that there was no slip between the beam and the steel plate, so that the function of the steel plate as a medium to distribute point loads to the beam was not disturbed by the slip phenomenon. For the connection between reinforcement and concrete, the ATENA program provides a choice between ‘perfect connection’ or ‘bond model’, which we have to define ourselves. In this research, the reinforcement was assumed to have a perfect connection with the concrete. This choice was based on the fact that the bond strength of HVFA-SCC is higher than conventional concrete.
The meshing process of the beam into small finite elements was automatically carried out in the ATENA software. The basic elements that can be selected for meshing are brick, tetra and brick-tetra combinations. The tetra element has a higher order of analysis compared to brick. The consequence of choosing the finite element model is the computational complexity. Basically, a simpler model is preferable as long as the results obtained are sufficiently representative. Considering this, the brick element was chosen in this research. The results of the beam modeling are shown in Figure 6.
3.2.3. Loading
In this research, the load to be calculated in the numerical simulation consisted of self-weight and point load. The self-weight was automatically generated in the ATENA program; while the point load had to be defined through the options on the ‘Load Cases’ menu. At least 2 types of load cases needed to be defined: Load Case 1 (LC-1), which represents vertical and horizontal reactions on the supports, and Load Case 2 (LC-2), which represents the external load to be applied. The loading applied to the beam (LC-2) is a load control, meaning that the external load applied to the beam is carried out by constant increments of load until the beam collapses. This load control option was adjusted, in this research, to correspond to the laboratory testing which also used load control. The magnitude of the applied load in this numerical simulation was 250 N per step.
4. Results and Discussion
4.1. Cracking Failure Modes
Flexural cracks appear first within the pure bending zone where the moment is at its maximum. These cracks are visually observed at loads in the 3.0–4.5 kN range. These cracks can actually occur at lower loads if crack observation was carried out using a crack detector.
Shear failure in all of the test beams is characterized by the formation of diagonal tension cracks on both sides of the shear span, where one of these cracks develops into a primary diagonal crack, causing the beams to collapse. Visual observations show that the primary diagonal cracks begin to form when the load reaches 21.88 to 25.75 kN. A careful observation of Figure 7 and Figure 8 concludes that the beams are collapsed through two mechanisms i.e., a diagonal crack penetrates the compression zone and the splitting of the concrete cover around the flexural reinforcement.
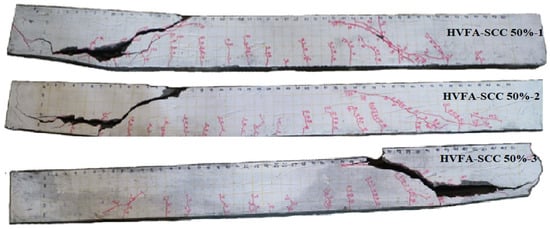
Figure 7.
Crack pattern of 50% HVFA-SCC concrete at ultimate shear force.
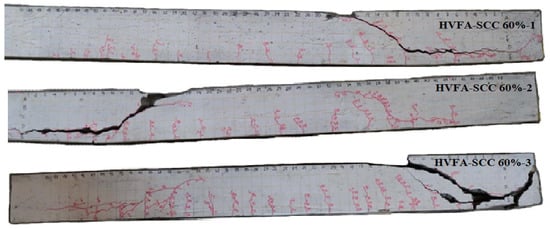
Figure 8.
Crack pattern of 60% HVFA-SCC concrete at ultimate shear force.
4.2. Load-Deflection
In general, beam behavior tends to follow a bi-linear relationship (Figure 9). Initial stiffness is maintained until the load reaches 2–3 kN, after which the stiffness of the beam decreases and follows the second linearity pattern. This reduction in stiffness is a consequence of the increasing crack intensity with increasing load. At peak load, the beam immediately collapses and this peak load becomes the end point of the second linearity. The non-ductile failure is typical of shear failure in beams without stirrups. When the diagonal tension cracks have penetrated the compression zone or the concrete covering the flexural reinforcement has split, the shear strength of the concrete vanishes, so that the beam collapses instantly.
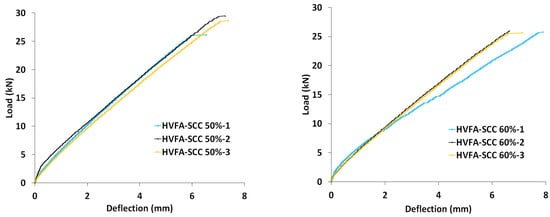
Figure 9.
Load-deflection curves of HVFA-SCC beams.
Table 5 summarizes the key points of the HVFA-SCC beam behavior extracted from the load-deflection curve. In general, HVFA-SCC 50% has slightly higher compressive strength than HVFA-SCC 60%. This affects the ultimate shear strength of these concretes. It is also interesting to note that loads corresponding to the first appearance of primary diagonal cracks are in the 85–90% range of ultimate shear strength values. This indicates that, once the primary diagonal cracks are formed, they rapidly propagate and develop in such a way as to cause shear failure.

Table 5.
Summary of experimental results of the HVFA-SCC beams.
4.3. Experimental Results vs. Numerical Simulation
The comparison of the load-deflection curve obtained from numerical simulation and experimental laboratory for the six beams is presented in Figure 10. In general, the trend of the curve of the numerical simulation is in agreement with the experimental results. The similarity of these results can be further quantified by comparing the shear strength and maximum deflection obtained from the two methods. The ratio of the average shear strength of the test results and the numerical simulation, Vtest/Vatena, and the mean maximum deflection of the test results and the numerical simulation, δtest/δatena, are shown in Table 6. The Vtest/Vatena of HVFA-SCC 50% is 1.06 and its corresponding δtest/δatena is 1.08. The ratios indicate that the difference between the measured and numerical simulation is below 10%. For HVFA-SCC 60%, the difference is within 13%. Thus, the numerical modeling using 3D ATENA Engineering in this research is quite satisfactory, especially for 50% HVFA-SCC. On the basis of these results, beam modeling with 3D ATENA Engineering software can be further developed to conduct parametric studies in order to evaluate various parameter effects.
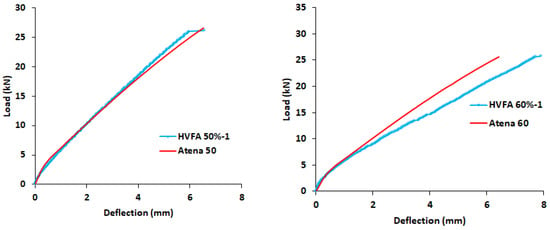
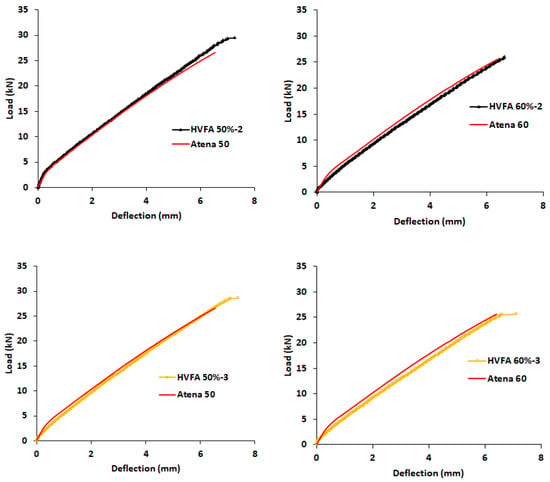
Figure 10.
Comparison of load-deflection curves determined by experiments and numerical simulation.

Table 6.
Comparison of measured and predicted shear strength and deflection.
4.4. Parametric Studies
This section discusses the results of a parametric study specifically intended to evaluate the effect of major parameters on the 50% HVFA-SCC beam shear strength. The parameters used in the research include reinforcement ratio (ρ = As/bd), shear span to beam effective depth (a/d) ratio and beam dimension. The effects of the ρ is carried out by maintaining the original dimensions of the beam sections and varying the parameters to simulate the effects of ρ i.e., the area of reinforcement (As). Meanwhile, the effect of a/d ratio is performed by varying the position of the point load or shear span. Finally, the effect of beam dimension is carried out by varying the effective depth (d).
4.4.1. The Effect of the Reinforcement Ratio (ρ)
Figure 11 shows the effect of the reinforcement ratio on the shear strength of the beam: the greater the reinforcement ratio the greater the shear strength of the beam. However, the relationship between the two parameters is not linear. On a small reinforcement ratio (i.e., between 0.019 and 0.026), the increase in shear strength can reach 29%. After that, increasing the reinforcement ratio from 0.026 to 0.034 only shows a 5% increase in shear strength.
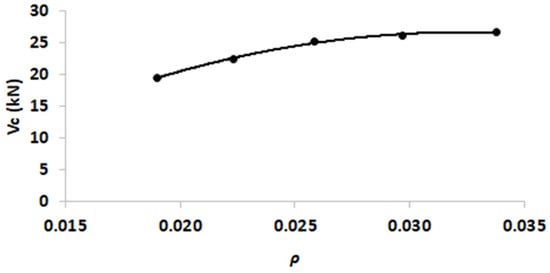
Figure 11.
The effect of reinforcement ratio (ρ) on shear strength of HVFA-SCC beam.
The effect of the reinforcement ratio can be traced from the contribution of longitudinal reinforcements in preventing the propagation and development of diagonal tension cracks. An increase in reinforcement ratio causes a smaller strain in the reinforcement (see Figure 12). Consequently, it will prevent propagation of diagonal tension crack penetrating into the compression zone and maintain the tightness of the diagonal tension crack width. A higher reinforcement ratio also provides a better reinforcement’s ability to withstand the vertical force transfer via dowel action. However, at certain point, concrete cover may not be able to withstand the greater vertical force transfer (see Figure 7 and Figure 8). Thus, the increase in the reinforcement ratio is no longer effective in increasing the shear capacity, as shown in Figure 11.
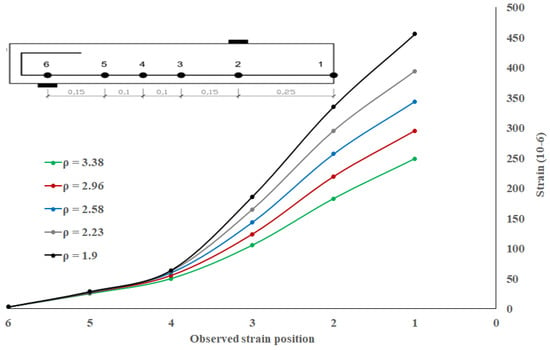
Figure 12.
The effect of reinforcement ratio (ρ) on the longitudinal strain at various positions.
4.4.2. The Effect of Shear Span to Beam Effective Depth Ratio (a/d)
The effect of the shear span to beam effective depth ratio (a/d) is presented in Figure 13, which shows the increase in shear strength when a/d decreases. There are two things that need to be considered in order to interpret the results shown in Figure 13. Firsly, the a/d value is set in the range of 2.5–6.0 and secondly, the a/d variation is simulated by changing the shear span (a) but by maintaining the cross-sectional size of the beam. The first stipulation provides a limitation related to the shear resistance mechanism of reinforced concrete beams, which can be distinguished as beam action and arch action. Some literature notes that arch action is effective in short shear spans (a/d ≤ 2). Brown et al. [30] showed that asymmetrically loaded reinforced concrete beams will collapse at large shear spans (a/d = 3.5–5.8) compared to short shear spans (a/d=1.7) due to effective arch action of the shorter beams. In the numerical simulation of this research, the limitation of a/d in the 2.5–6.0 range was intended so that the beam collapse occurred shortly after the primary diagonal tension crack formed. Hence, the beam was not significant enough to develop shear resistance through the arch action mechanism. This failure mechanism corresponds to that observed in the test beams (a/d = 4.2), as described in Section 4.1.
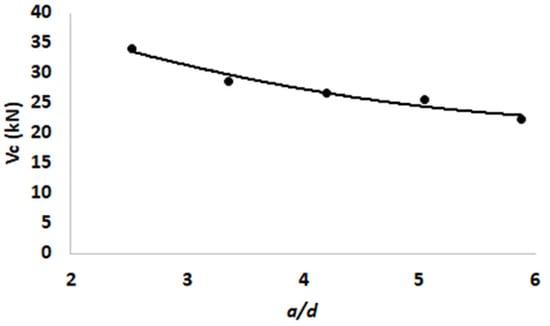
Figure 13.
The effect of span to depth ratio (a/d) on the shear strength of the HVFA-SCC beam.
The second stipulation implies that the change in a/d represents the change in the moment to shear force ratio (M/V). The combination of M and V will induce the flexural stress f and the shear stress v in the beam where these two stresses can be transformed into two pairs of inclined principal stresses. From material mechanics (assuming elastic and homogenous material), it can be proven that the value of principal stress is:
and the inclination angle α is:
The smaller the a/d, the smaller the effect of the f value and, on the contrary, the greater the effect of the v value on the magnitude of the principal stresses and the angle of inclination. Equation (1) indicates that for a beam bearing the same shear force V but with a different shear span a, the magnitude of tensile principal stress t on a beam with a shorter a will be smaller, due to the smaller f value contribution to the beam. This means that a beam with a shorter shear span has the opportunity to resist a larger shear force V. Although the above argument is based on the assumption that the beam is in a homogeneous state until the diagonal tension crack is formed, it still contains a logical explanation that describes the increase in shear strength as the a/d value decreases.
4.4.3. The Effect of Effective Beam Depth (d)
Figure 14 shows the effect of the effective depth of the beam d on the shear strength of the beam (Vc/b.d). The shear strength is expressed as Vc/b.d to emphasize the effect of d as a representation of the size effect on the shear strength of concrete. Figure 14 indicates that the larger the beam size, the smaller the value of the shear strength. This is in line with the theory put forward by Bazant et al. [32] and which is also confirmed by the test results in other research [35].
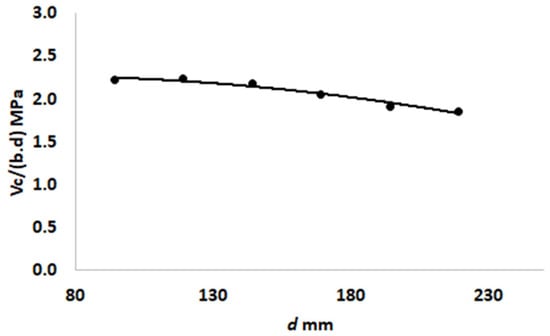
Figure 14.
The effect of effective depth d of the beam on concrete shear strength.
Paying closer attention to Figure 14, it must be realized that the effect of d on the shear strength shown in the figure is obtained by numerical simulations with the following conditions: only the value of d is varied while other parameters, such as beam width b, reinforcement area (As), and shear span a, are kept constant. This means that the change in effective depth also generates changes in the size of the cross section (b.d), the ratio of reinforcement (ρ), and the ratio of the shear-span to the effective dpeth of the beam (a/d). Therefore, to clarify the effect of d (size effect) on the shear strength of concrete, the shear strength values in Figure 14 can also be expressed in terms of ρ and a/d as shown in Figure 15 and Figure 16, respectively. The effects of ρ and a/d as described in the previous section (Figure 11 and Figure 13) are also included in Figure 15 and Figure 16.
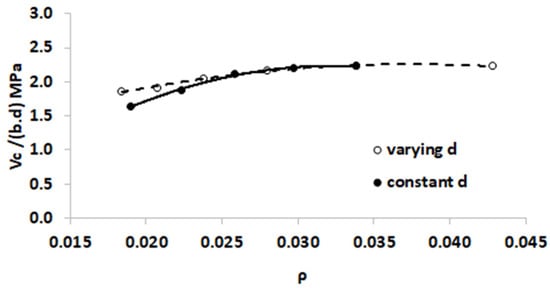
Figure 15.
The effect of ρ due to ‘varying d’ and ‘constant d’ on the shear strength of concrete.
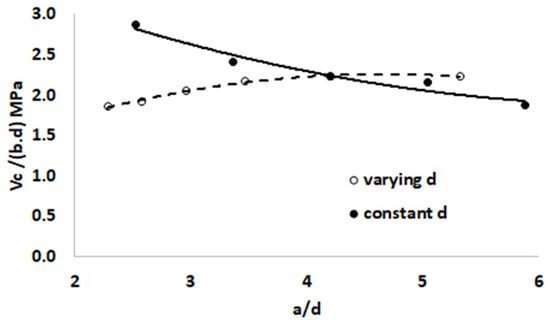
Figure 16.
The effect of a/d due to ‘varying d’ and ‘constant d’ on the shear strength of concrete.
In Figure 15, the legend ‘constant d’ shows that the change in the value of ρ is obtained from the change in the value of As but the values of b and d are constant; while ‘varying d’ shows that the change in the value of ρ is obtained from the fixed values of As and b but the value of d changes. Therefore, the ‘constant d’ curve represents the effect of ρ on the shear strength of concrete. Meanwhile, the curve ‘varying d’ in Figure 15 indicates the effect of ρ caused by changes in the value of d. In this case, the higher the value of d, the lower the value of ρ and vice versa. Thus, Figure 15 provides a clue that is consistent with the previous statement, i.e., the greater the value of d (or smaller ρ), the lower the shear strength. It is also interesting to note that the rate of decline of the ‘varying d’ curve is slower than the ‘constant d’ curve at ρ below 0.025. This indicates that, at ρ below 0.025, there is a difference between the effect of the reinforcement area As and the effect of the effective depth of beam d on the shear strength of the concrete. The effect of the size on the shear strength of the concrete is smaller than the effect of longitudinal reinforcement. This may be traced to the shear transfer mechanism in the diagonally cracked beam. In small ρ, a large strain will be sensitively induced in the longitudinal reinforcement. Hence, the small longitudinal reinforcement is unable to withstand crack propagation. As a consequence, the shear transfer contributed by the dowel action and the aggregate interlocking is not significant. In this condition, the shear strength of concrete is more dependent on the shear contributed by the concrete in the compression zone. At this small reinforcement ratio, a higher d could better provide a larger concrete compression zone.
In Figure 16, ‘constant d’ legend shows that the change in the value of a/d is obtained from the change in the value of the shear span a, but both the width b and the effective depth d are constant; while ‘varying d’ shows that the change in the value of a/d is obtained from the constant value of shear span a and beam width b, but the value of d changes. Therefore, the ‘constant d’ curve can be marked to represent the effect of the shear span on the shear strength of the concrete. Meanwhile, the curve ‘varying d’ in Figure 16 indicates the effect of a/d caused by changes in the value of d on the shear strength of concrete. In this case, a higher d value causes a lower a/d value and vice versa. Thus, Figure 16 provides a clue that is consistent with the previous statement, i.e., the greater the value of d (or a/d is smaller) will cause the shear strength to decrease.
Figure 16 clearly shows the difference in trend between the effect of a/d on the shear strength of concrete between the ‘varying d’ and ‘constant d’ curves. The effect of a/d on the ‘constant d’ curve and shear strength has been described in Section 4.4.1. This effect can be emphasized as being a result of the formation of the diagonal tension crack, caused by the inclined principal tensile stress, where the magnitude of the principal tensile stress is influenced by a combination of the magnitude of the flexure and shear stress. At short shear spans, the flexural stress decreases, whereas the shear stress increases. As a consequence, the principal tensile stress magnitude becomes smaller so that the beam can still resist a greater shear force before the primary diagonal tension crack is formed. Meanwhile, the effect of a/d on the ‘varying d’ curve comes from changes in the effective depth of beam d. The effect of d on the beam was determined by Bazant and Kim [32], based on the study of fracture mechanics. In addition, another explanation related to the size effect is the so-called statistical (stochastic) effect which is caused by the spatial variability of the local strength of the material [35]. According to the weakest link theory, the strength of the structure is determined by the strength of its weakest component. The structure will fail when the strength is exceeded at its weakest part because stress redistribution is not taken into account. The larger the section size, the greater the chance of the stress exceeding the strength of the weakest part of the structure.
4.5. Shear Strength of HVFA-SCC
The results of laboratory investigations and numerical simulations regarding the longitudinally reinforced shear strength of HVFA-SCC beams, as described in the previous sections, need to be compared with the database of concrete shear strength in the literature. It can then be assessed as to whether the shear strength of HVFA-SCC is still within the upper and lower bounds of the shear strength of concrete. In addition, the mapping of HVFA-SCC shear strength values in the concrete shear strength database can also be used as an approach to determine whether or not a new formulation is needed in the calculation of HVFA-SCC shear strength in reinforced concrete design.
ACI-318-19 [33] provides an estimate of the shear strength as follows:
Equation (6) recognizes the contribution of the reinforcement ratio to the shear strength but the value of shear strength calculated from Equation (6) must not exceed the following values:
The estimation of shear strength according to the ACI design code is based on a conventional concrete shear strength database. Therefore, mapping the shear strength of HVFA-SCC beams in a conventional concrete shear strength database can be a justification for whether or not to modify the formula.
The concrete shear strength database used in this research refers to the Ortega study [14]. Ortega has collected 994 conventional concrete shear strength data, which represent the shear strength of concrete beams with various compressive strengths, a/d ratio, reinforcement ratio, cross section size, etc. The database is redrawn in Figure 17 and Figure 18. The shear strength values of HVFA-SCC beams obtained in this research, both the experimental results and numerical simulations, are also presented in the database. In addition, the estimated shear strength values from Equations (3) and (4) are also shown. It can be seen that the shear strength of the HVFA-SCC beam is within the upper bound (Figure 17) and the mean (Figure 18) of the conventional beam shear strength database. This confirms that the ACI design code is applicable for HVFA-SCC.
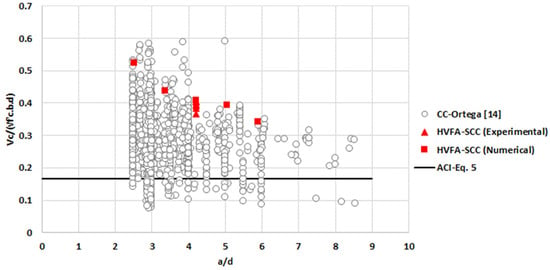
Figure 17.
HVFA-SCC shear strength in the database of normalized shear strength vs. shear span to beam effective depth ratio.
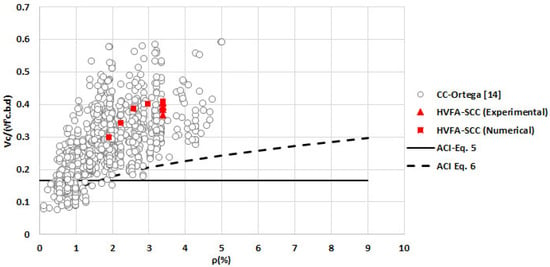
Figure 18.
HVFA-SCC shear strength in the database of normalized shear strength vs. longitudinal reinforcement ratio.
The value of HVFA-SCC shear strength from the results of this study is also presented in other non-conventional concrete shear strength databases [14,15,36,37,38,39,40] (see Figure 19 and Figure 20). Although the amount of data used in constructing Figure 19 and Figure 20 is limited, it shows that the non-conventional concrete meets the shear strength values estimated from the ACI design code. In Figure 19 and Figure 20, the value of HVFA-SCC shear strength from this research is higher than the value of HVFA-SCC shear strength from Algazali et al. The difference may be related to the size effect: the HVFA-SCC beam from Algazali measured 305 × 457 mm2 while the HVFA-SCC beam in this research was 100 × 150 mm2. The ACI design code also recognizes this size effect by providing a modification factor whose value depends on the effective depth of the beam. The greater the beam size, the smaller the value of the modification factor.
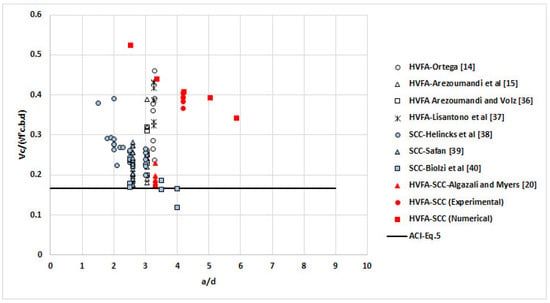
Figure 19.
Normalized shear strength of non-conventional concrete vs. beam effective depth ratio.
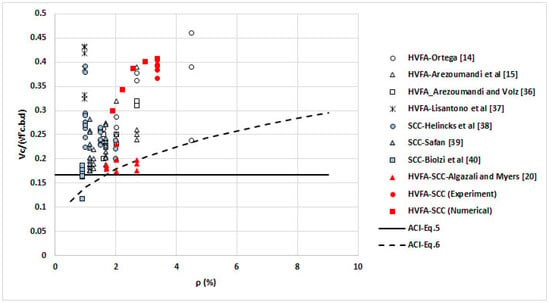
Figure 20.
Normalized shear strength of non-conventional concrete vs. longitudinal reinforcement ratio.
5. Conclusions
Experimental investigation has been carried out to determine the shear behavior of HVFA-SCC beams without stirrups. The failure mode of the beams is characterized by the formation of diagonal tension cracks on both sides of the shear span. One of these cracks develops into a primary diagonal crack which propagates in the compression zone towards the loading point, and also initiates splitting of the concrete cover around the flexural reinforcements.
Numerical modeling was performed, using 3D ATENA Engineering Software to investigate the effect of the a/d ratio, the longitudinal reinforcement ratio (ρ), and beam depth (d). Within a/d in the range of 2.5–6.0, the shear strength of the beam is lower as the a/d increases. This may be due to the efficacy of arch action at shorter shear spans. The longitudinal reinforcement contributes to the shear transfer mechanism by restricting the width of the diagonal crack tension and by dowel action. Therefore, a higher longitudinal reinforcement ratio gives a better shear strength. As for the effect of beam depth, it is confirmed that a larger size of beam tends to create a lower shear strength.
Comparison of the shear strength of HVFA-SCC beams with the shear strength database of both conventional and unconventional concrete indicates that the shear strength of HVFA-SCC beams without stirrups is fairly similar to that of other concrete. Hence, the ACI shear design code can be applied to HVFA-SCC.
Author Contributions
A.S.B. designed the experiment, carried out laboratory test, performed numerical simu-lation, and wrote initial draft of the manuscript; E.S. designed the experiment, and re-viewed the draft; S.S. analyzed data, and reviewed the draft; S.A.K. contributed to the original conception and design, analyzed data, wrote the final draft of the manuscript. All authors have read and agreed to the published version of the manuscript.
Funding
This research has been made possible due to financial support by Ministry of Research and Technology/BRIN, Indonesia through a research scheme of Penelitian Disertasi Doktor (contract No. 166/SP2H/AMD/LT/DRPM/2020).
Institutional Review Board Statement
Not applicable.
Informed Consent Statement
Not applicable.
Data Availability Statement
The data presented in this study are available on request from the corresponding author.
Acknowledgments
Authors would like to express a sincerely gratitude to Structural Laboratory of the Civil Engineering Department, Sebelas Maret University for supporting the experiment with a dedicated team of ‘Laboran & UG Students’
Conflicts of Interest
The authors declare no conflict of interest.
References
- Mehta, P.K. High-performance, high-volume fly ash concrete for sustainable development. In Proceedings of the International Workshop on Sustainable Development and Concrete Technology, Beijing, China, 20–21 May 2004. [Google Scholar]
- Bilodeau, A.; Malhotra, V.M. High-volume fly ash system: Concrete solution for sustainable development. ACI Struct. J. 2000, 97, 41–48. [Google Scholar] [CrossRef]
- Malhotra, V.M. Superplasticized Fly Ash Concrete for Structural Applications. Concr. Int. 1979, 8, 28–31. [Google Scholar]
- Okamura, H.; Ouchi, M. Self-compacting concrete. J. Adv. Concr. Technol. 2003, 1, 5–15. [Google Scholar] [CrossRef]
- Sahmaran, M.; Yurtseven, A.; Yaman, I.O. Workability of hybrid fiber reinforced self-compacting concrete. Build. Environ. 2005, 40, 1672–1677. [Google Scholar] [CrossRef]
- Kristiawan, S.A.; Budi, A.S.; Hadi, A.N. Uniaxial compressive stress-strain behavior of self-compacting concrete with high-volume fly ash. Int. J. GEOMATE 2018, 14, 77–85. [Google Scholar] [CrossRef]
- Kristiawan, S.A.; Sunarmasto; Tyas, G.P. Degradation of self-compacting concrete (SCC) due to sulfuric acid attack: Experiment investigation on the effect of high volume fly ash content. IOP Conf. Ser. Mater. Sci. Eng. 2016, 107, 1. [Google Scholar] [CrossRef]
- Kristiawan, S.A.; Sunarmasto; Ridlo, M.M. Sorptivity of self-compacting concrete with high volume fly ash and its eco-mechanical-durability performance. IOP Conf. Ser. Mater. Sci. Eng. 2018, 442, 1. [Google Scholar] [CrossRef]
- Kristiawan, S.A.; Sangadji, S.; Sunarmasto. Eco-durability index of self-compacting concrete incorporating high volume fly ash. IOP Conf. Ser. Mater. Sci. Eng. 2019, 615, 1. [Google Scholar] [CrossRef]
- Bouzoubaâ, N.; Lachemi, M. Self-compacting concrete incorporating high volumes of class F fly ash: Preliminary results. Cem. Concr. Res. 2001, 31, 413–420. [Google Scholar] [CrossRef]
- Nehdi, M.; Pardhan, M.; Koshowski, S. Durability of self-consolidating concrete incorporating high-volume replacement composite cements. Cem. Concr. Res. 2004, 34, 2103–2112. [Google Scholar] [CrossRef]
- Chen, S.; Li, J. Shear behavior of reinforced high-strength concrete beams. ACI Struct. J. 2013, 110, 1112–1114. [Google Scholar]
- Ahmad, S.; Inaam, Q. Shear strength of self-compacting concrete and recycled aggregate concrete beams: An appraisal of design codes. Asian J. Civ. Eng. 2019, 20, 327–340. [Google Scholar] [CrossRef]
- Ordonez, C.A.O. Shear and Fracture Behavior of High-Volume Fly Ash Reinforced Concrete for Sustainable Construction. Doctoral Dissertation, Missouri University of Science and Technology, Rolla, MO, USA, 2012. [Google Scholar]
- Arezoumandi, M.; Volz, J.S.; Ortega, C.A.; Myers, J.J. Shear Behavior of High-Volume Fly Ash Concrete versus Conventional Concrete: Experimental Study. J. Struct. Eng. 2015, 141, 1506–1513. [Google Scholar] [CrossRef]
- Darmawan, M.S.; Bayuaji, R.; Sugiardjo, H.; Husin, N.A.; Affandhie, R.B.A. Shear Strength of Geopolymer Concrete Beams Using High Calcium Content Fly Ash in a Marine Environment. Buildings 2019, 9, 98. [Google Scholar] [CrossRef]
- Cladera, A. Shear design procedure for reinforced normal and high-strength concrete beams using artificial neural networks. Part I: Beams without stirrups. Eng. Struct. 2004, 26, 917–926. [Google Scholar] [CrossRef]
- Sadati, S.; Arezoumandi, M.; Khayat, K.H.; Volz, J.S. Shear performance of reinforced concrete beams incorporating recycled concrete aggregate and high-volume fl y ash. J. Clean. Prod. 2016, 115, 284–293. [Google Scholar] [CrossRef]
- Choulli, Y.; Marı, A.R.; Cladera, A. Shear behaviour of full-scale prestressed i-beams made with self compacting concrete. Mater. Struct. 2008, 41, 131–141. [Google Scholar] [CrossRef]
- Alghazali, H.H.; Myers, J.J. Shear behavior of full-scale high volume fly ash-self consolidating concrete (HVFA-SCC) beams. Constr. Build. Mater. 2017, 157, 161–171. [Google Scholar] [CrossRef]
- Joint ASCE-ACI Task Committee 426 on Shear and Diagonal Tension of the Committee on Masonry and Reinforced Concrete of the Structural Division. The Shear Strength of Reinforced Concrete Materials—Slabs. J. Struct. Div. 1974, 100, 1543–1591. [Google Scholar] [CrossRef]
- Joint ASCE-ACI Committee 445 on Shear and Torsion. Recent approaches to shear design of structural concrete on shear and torsion. J. Struct. Eng.-ASCE 1999, 124, 1375–1417. [Google Scholar]
- Jung, S.; Kim, K.S. Knowledge-based prediction of shear strength of concrete beams without shear reinforcement. Eng. Struct. 2008, 30, 1515–1525. [Google Scholar] [CrossRef]
- El-Sayed, A.K.; El-Salakawy, E.F.; Benmokrane, B. Shear capacity of high-strength concrete beams reinforced with FRP bars. ACI Struct. J. 2006, 103, 383–389. [Google Scholar] [CrossRef]
- Russo, G.; Somma, G.; Angeli, P. Design shear strength formula for high strength concrete beams. Mater. Struct. Constr. 2004, 37, 680–688. [Google Scholar] [CrossRef]
- Elsanadedy, H.M.; Abbas, H.; Almusallam, T.H. Shear strength prediction of HSC slender beams without web reinforcement. Mater. Struct. 2016, 49, 3749–3772. [Google Scholar] [CrossRef]
- MacGregor, J.G. Reinforced Concrete Mechanics & Design, 3rd ed.; Prentice Hall: Upper Saddle River, NJ, USA, 1997. [Google Scholar]
- Park, R.; Paulay, T. Reinforced Concrete Strutures; John Wiley & Sons: New York, NY, USA, 1975; pp. 127–128. [Google Scholar]
- Collins, M.P.; Bentz, E.C.; Sherwood, E.G.; Xie, L. Adequate theory for the shear strength of reinforced concrete structures. In Morley Symposium on Concrete Plasticity and its Application; University of Cambridge, Department of Engineering: Cambridge, UK, 2007; pp. 75–94. [Google Scholar]
- Brown, M.D.; Bayrak, O.; Jirsa, J.O. Design for shear based on loading conditions. ACI Struct. J. 2006, 103, 541–550. [Google Scholar]
- Nilson, A.; Darwin, D.; Dolan, C. Design of Concrete Structures, 14th ed.; McGraw-Hill: New York, NY, USA, 2010. [Google Scholar]
- Bazant, Z.P.; Kim, J. Size Effect in Shear Failure of Longitudinally Reinforced Beams. Int. Concr. Abstr. Portal 1984, 81, 456–468. [Google Scholar]
- ACI Committee. ACI 318-19. Building Code Requirements for Structural Concrete; American Concrete Institute: Farmington Hills, MI, USA, 2019. [Google Scholar]
- Alhussainy, F.; Hasan, H.A.; Rogic, S.; Sheikh, M.N.; Hadi, M.N.S. Direct tensile testing of Self-Compacting Concrete. Constr. Build. Mater. 2016, 112, 903–906. [Google Scholar] [CrossRef]
- Syroka-Korol, E.; Tejchman, J. Experimental investigations of size effect in reinforced concrete beams failing by shear. Eng. Struct. 2014, 58, 63–78. [Google Scholar] [CrossRef]
- Arezoumandi, M.; Volz, J.S. Effect of fl y ash replacement level on the shear strength of high-volume fl y ash concrete beams. J. Clean. Prod. 2013, 59, 120–130. [Google Scholar] [CrossRef]
- Lisantono, A.; Wigroho, H.Y.; Purba, R.A. Shear behaviour of high volume fly ash concrete as replacement of Portland cement in RC beam. Proc. Eng. 2017, 171, 80–87. [Google Scholar] [CrossRef]
- Helincks, P.; Boel, V.; de Corte, W.; de Schutter, G.; Desnerck, P. Structural behaviour of powder-type self-compacting concrete: Bond performance and shear capacity. Eng. Struct. 2013, 48, 121–132. [Google Scholar] [CrossRef]
- Safan, M. Shear Strength of Self-compacting Concrete Containing Different Fillers and Coarse Aggregates. Can. J. Civ. Eng. 2012, 39, 760–770. [Google Scholar] [CrossRef]
- Biolzi, L.; Cattaneo, S.; Mola, F. Bending-shear response of self-consolidating and high-performance reinforced concrete beams. Eng. Struct. 2014, 59, 399–410. [Google Scholar] [CrossRef]
Publisher’s Note: MDPI stays neutral with regard to jurisdictional claims in published maps and institutional affiliations. |
© 2021 by the authors. Licensee MDPI, Basel, Switzerland. This article is an open access article distributed under the terms and conditions of the Creative Commons Attribution (CC BY) license (https://creativecommons.org/licenses/by/4.0/).