
Towards a New Analytical Creep Model for Cement-Based Concrete Using Design Standards Approach


Abstract
:1. Introduction
2. Concrete Creep
2.1. Creep Prediction Models
2.2. Experimental Database
- 28-day experimentally measured compressive strength and elastic modulus
- Concrete’s age at loading and the applied stress level
- Concrete’s mix proportion
- Type of cement and aggregate properties
- Dimensions of the test specimens
- Curing conditions and environmental conditions during creep test
- Creep strain curves after 90 days of loading
3. Result Analysis of Prediction Models for NAC
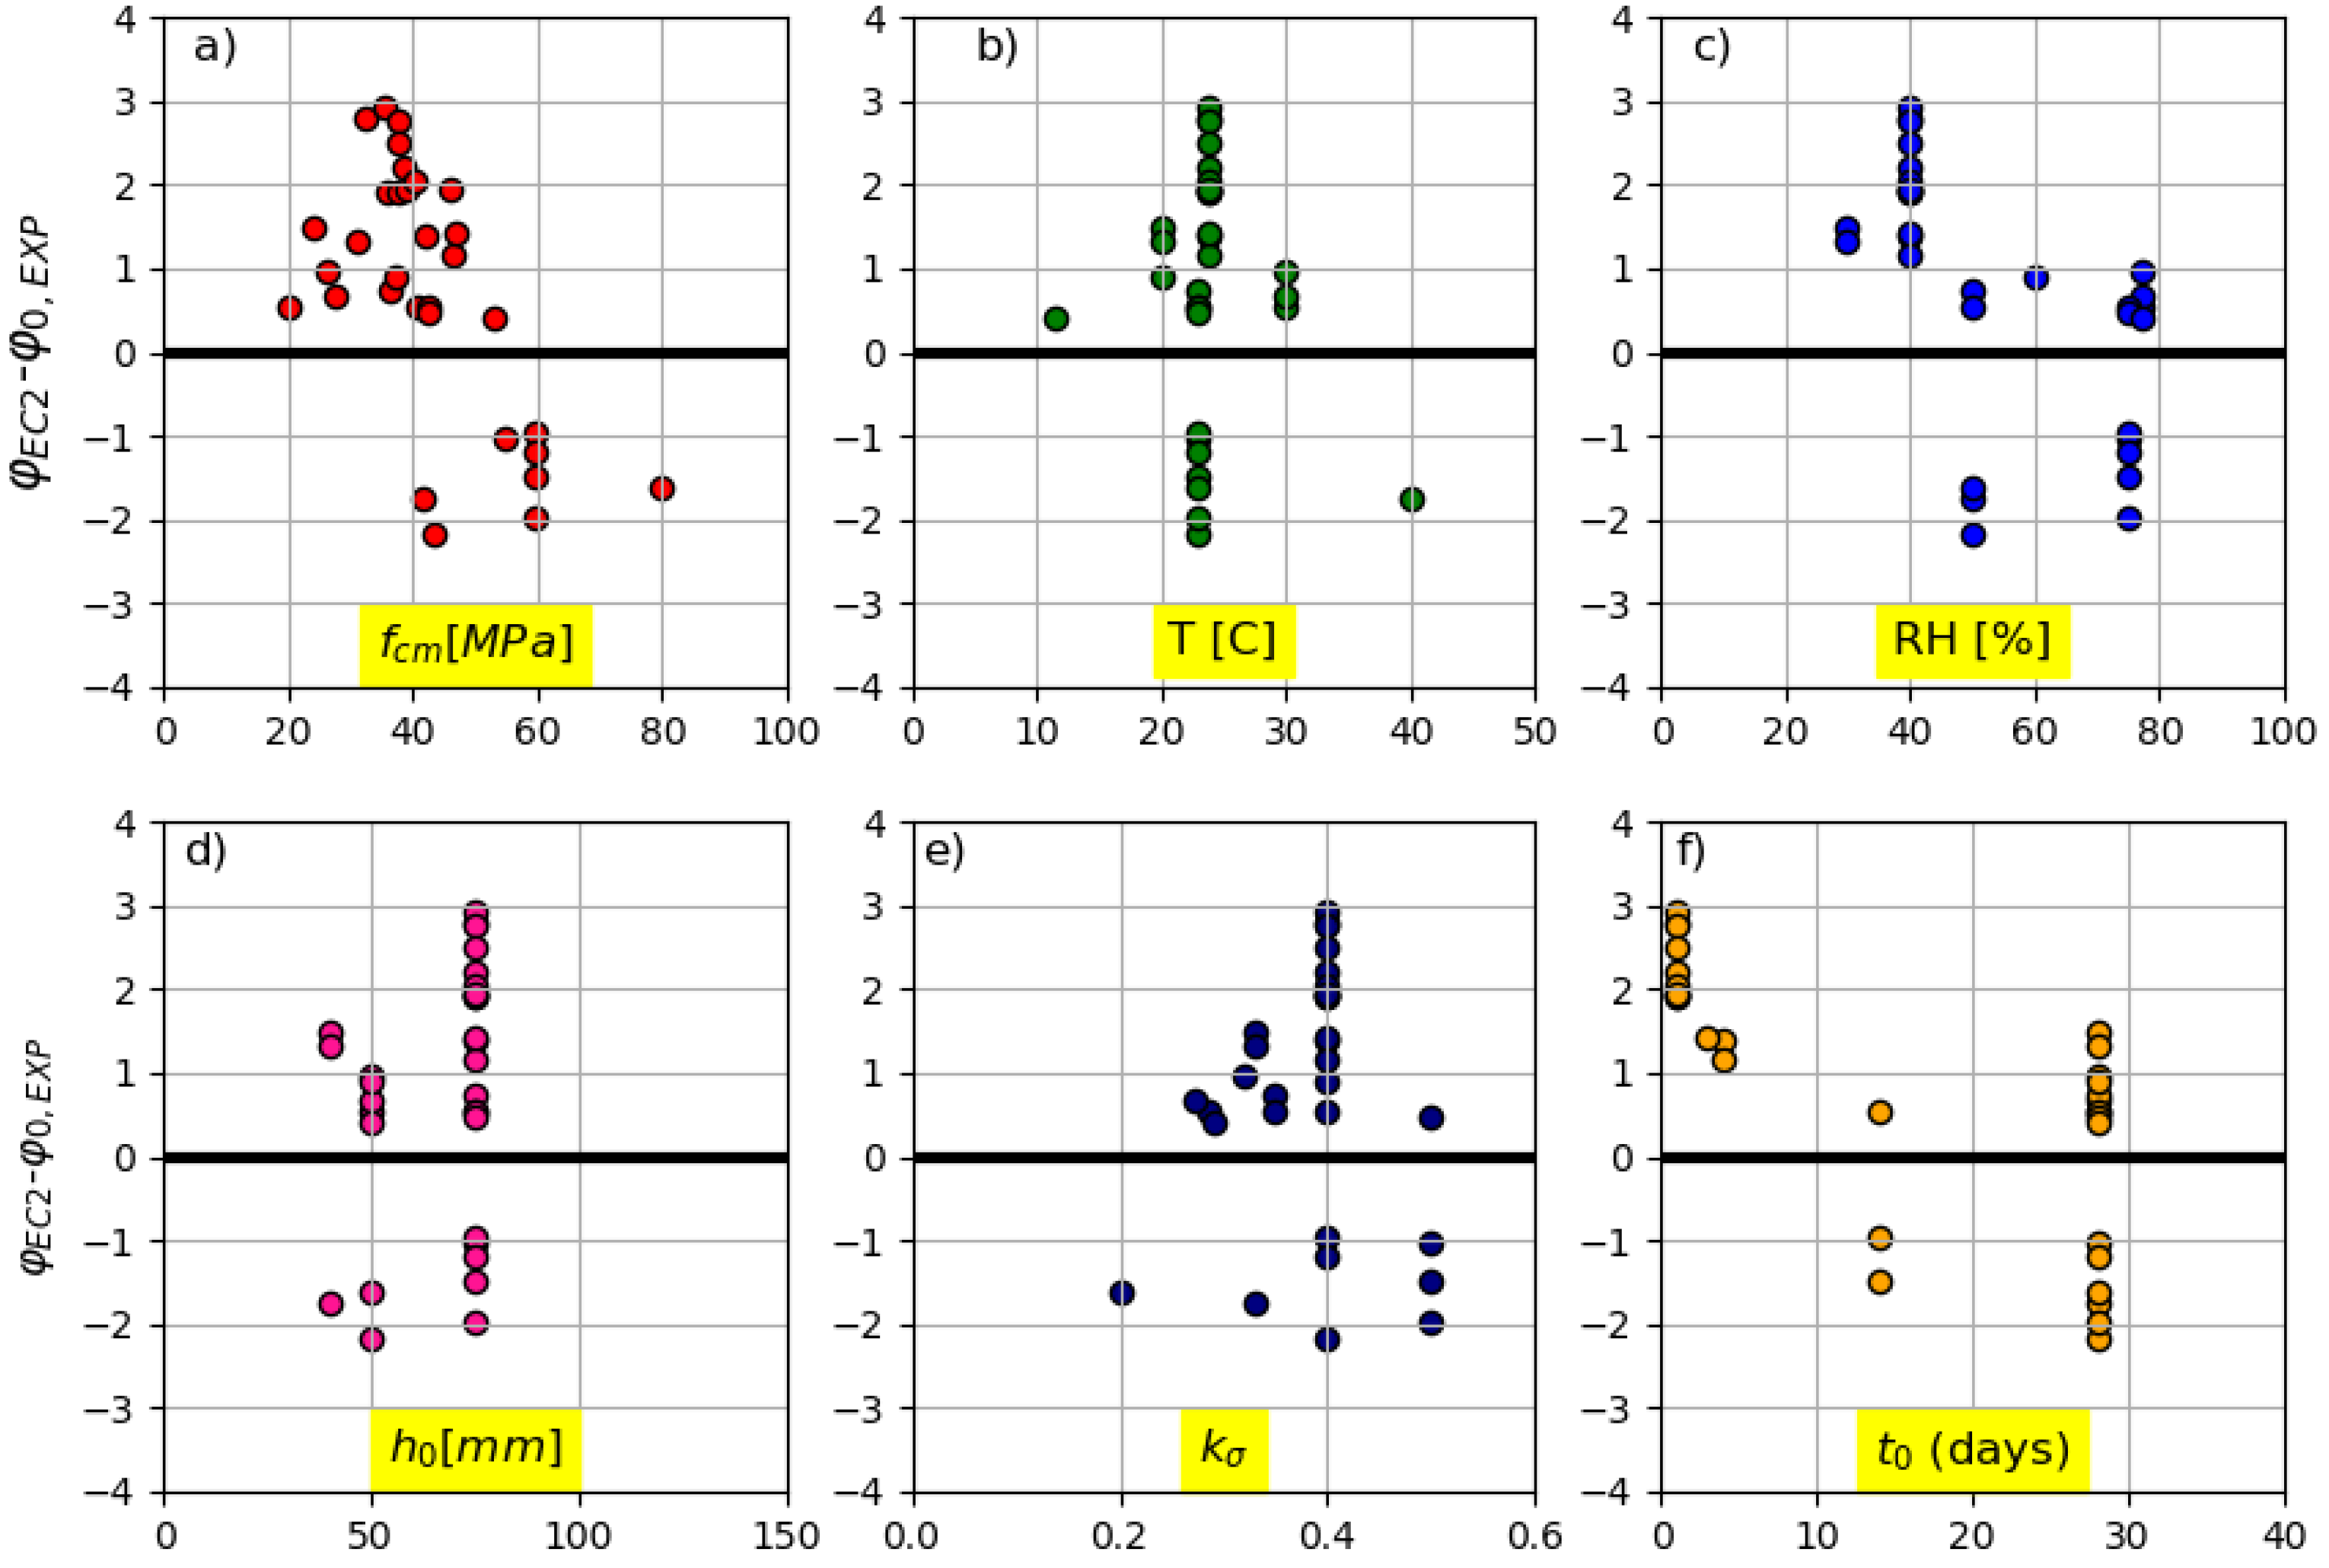
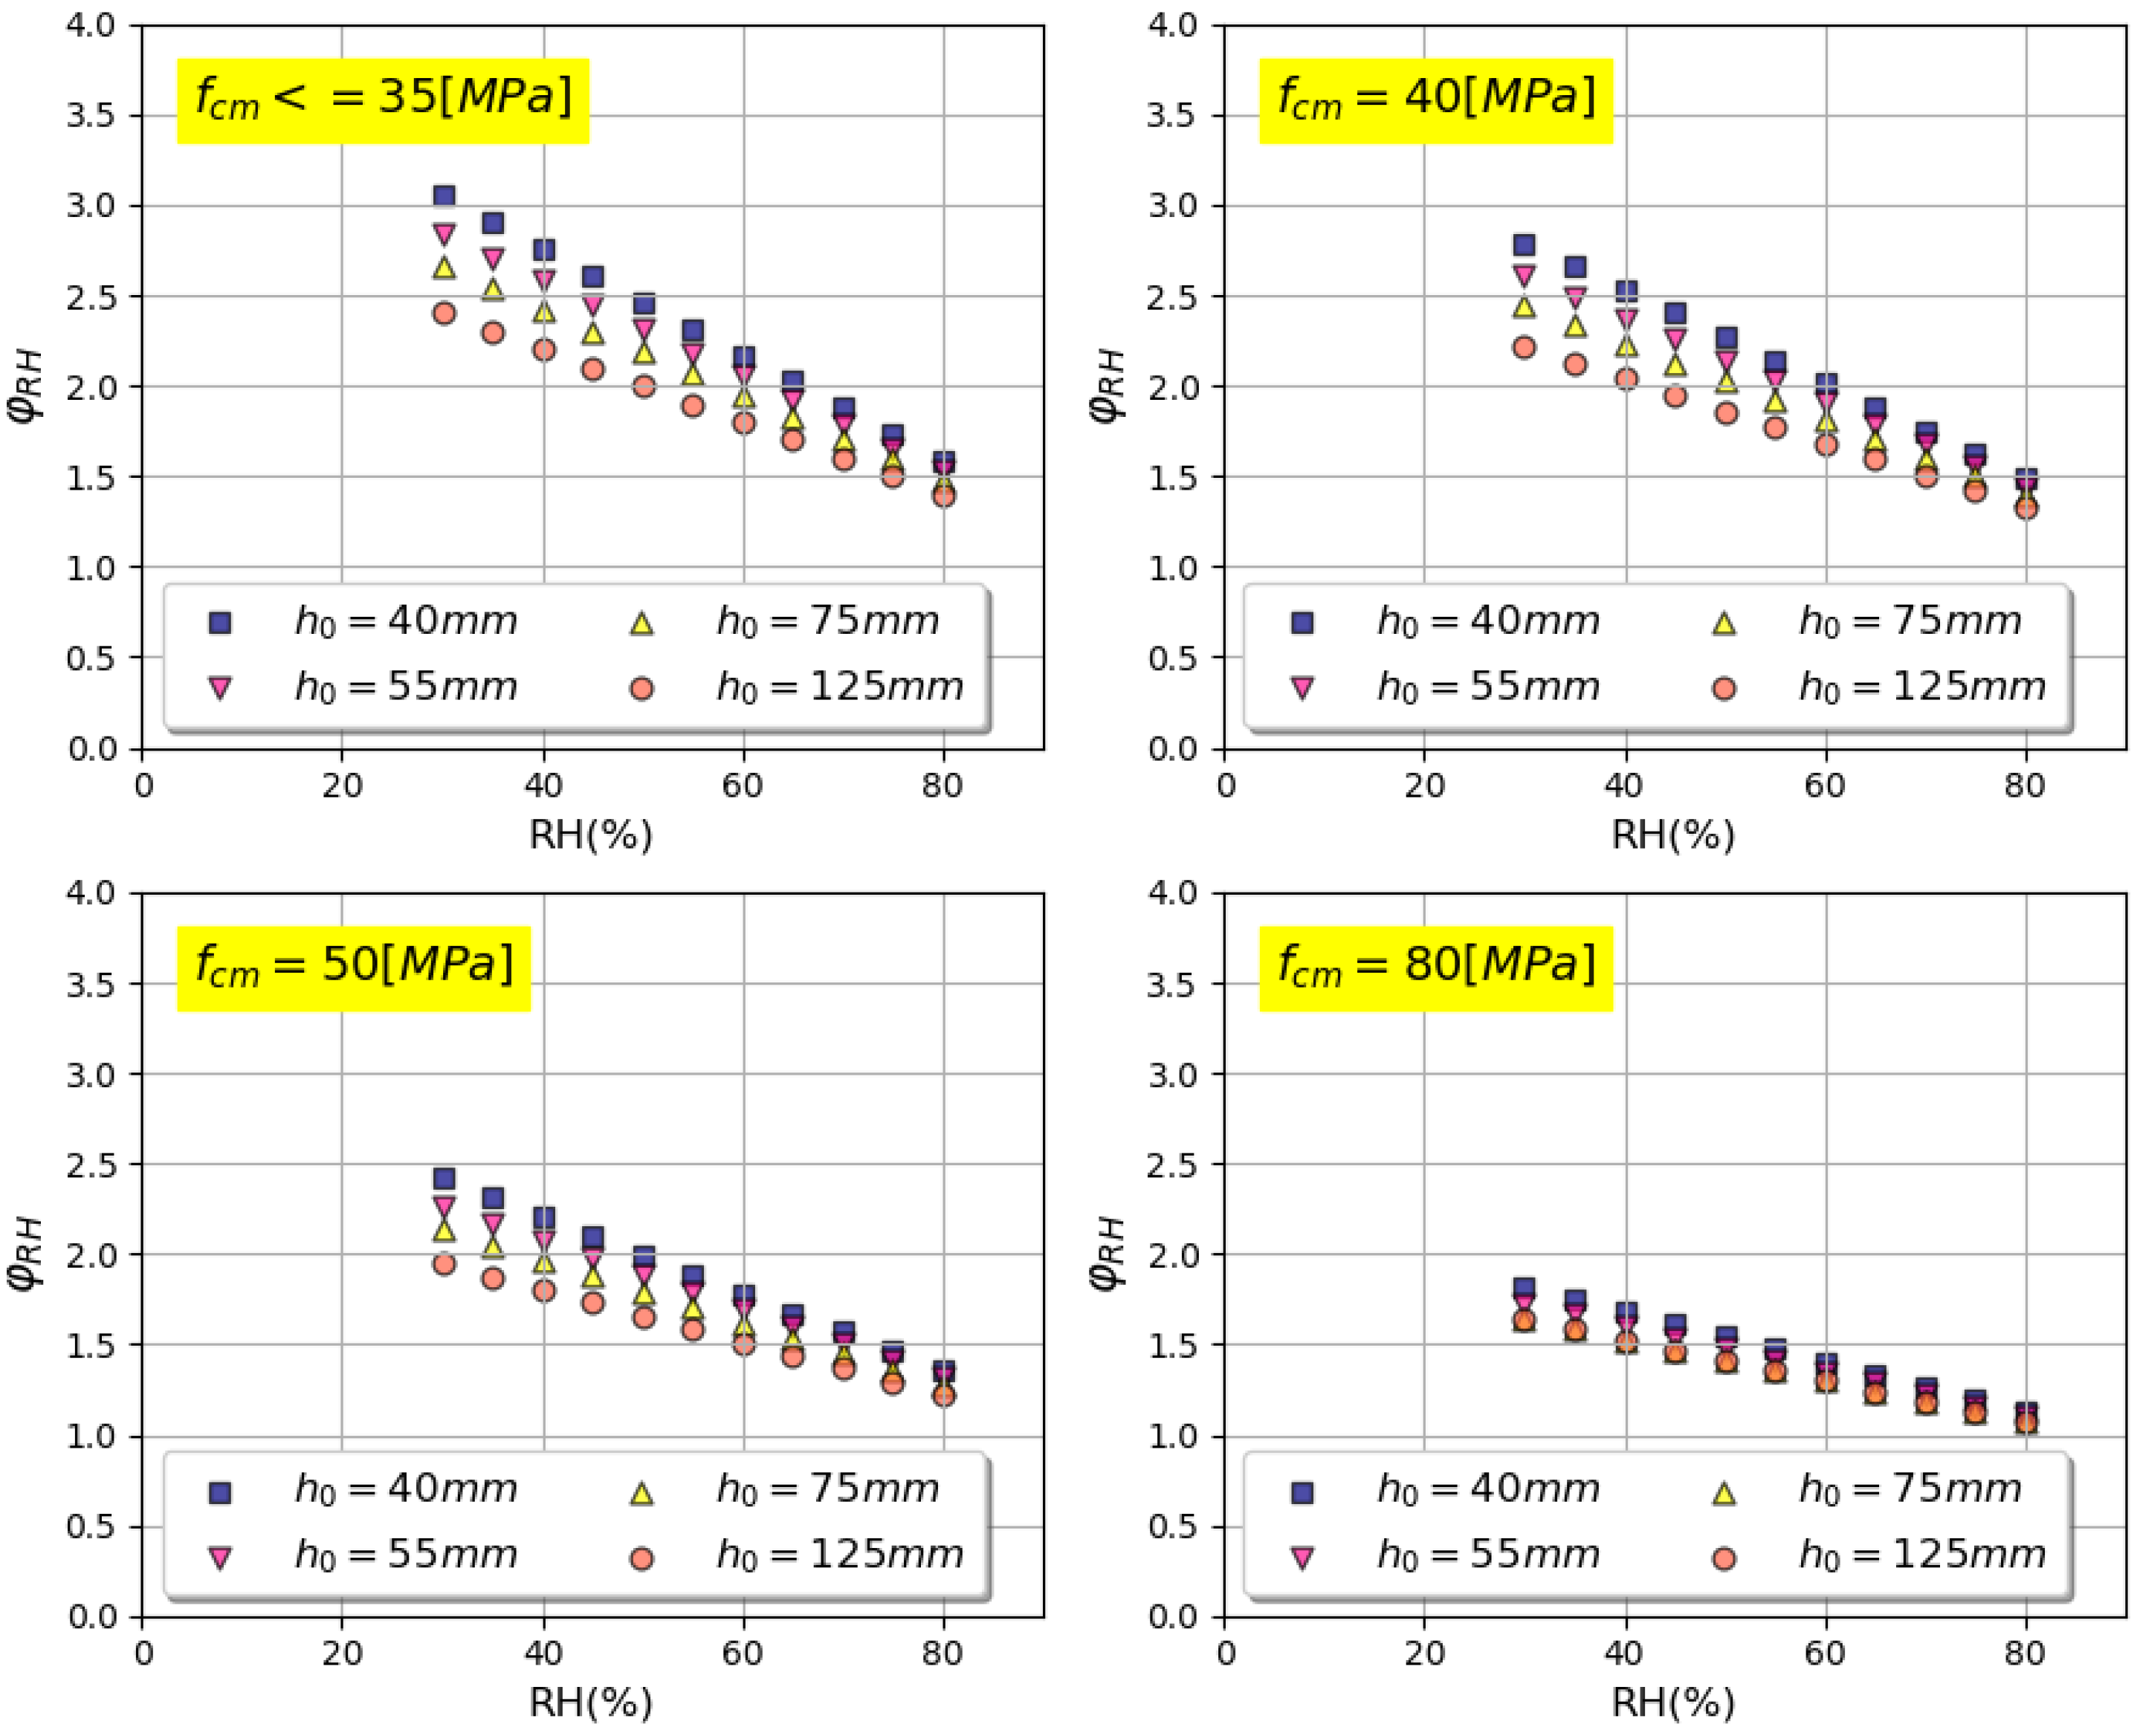
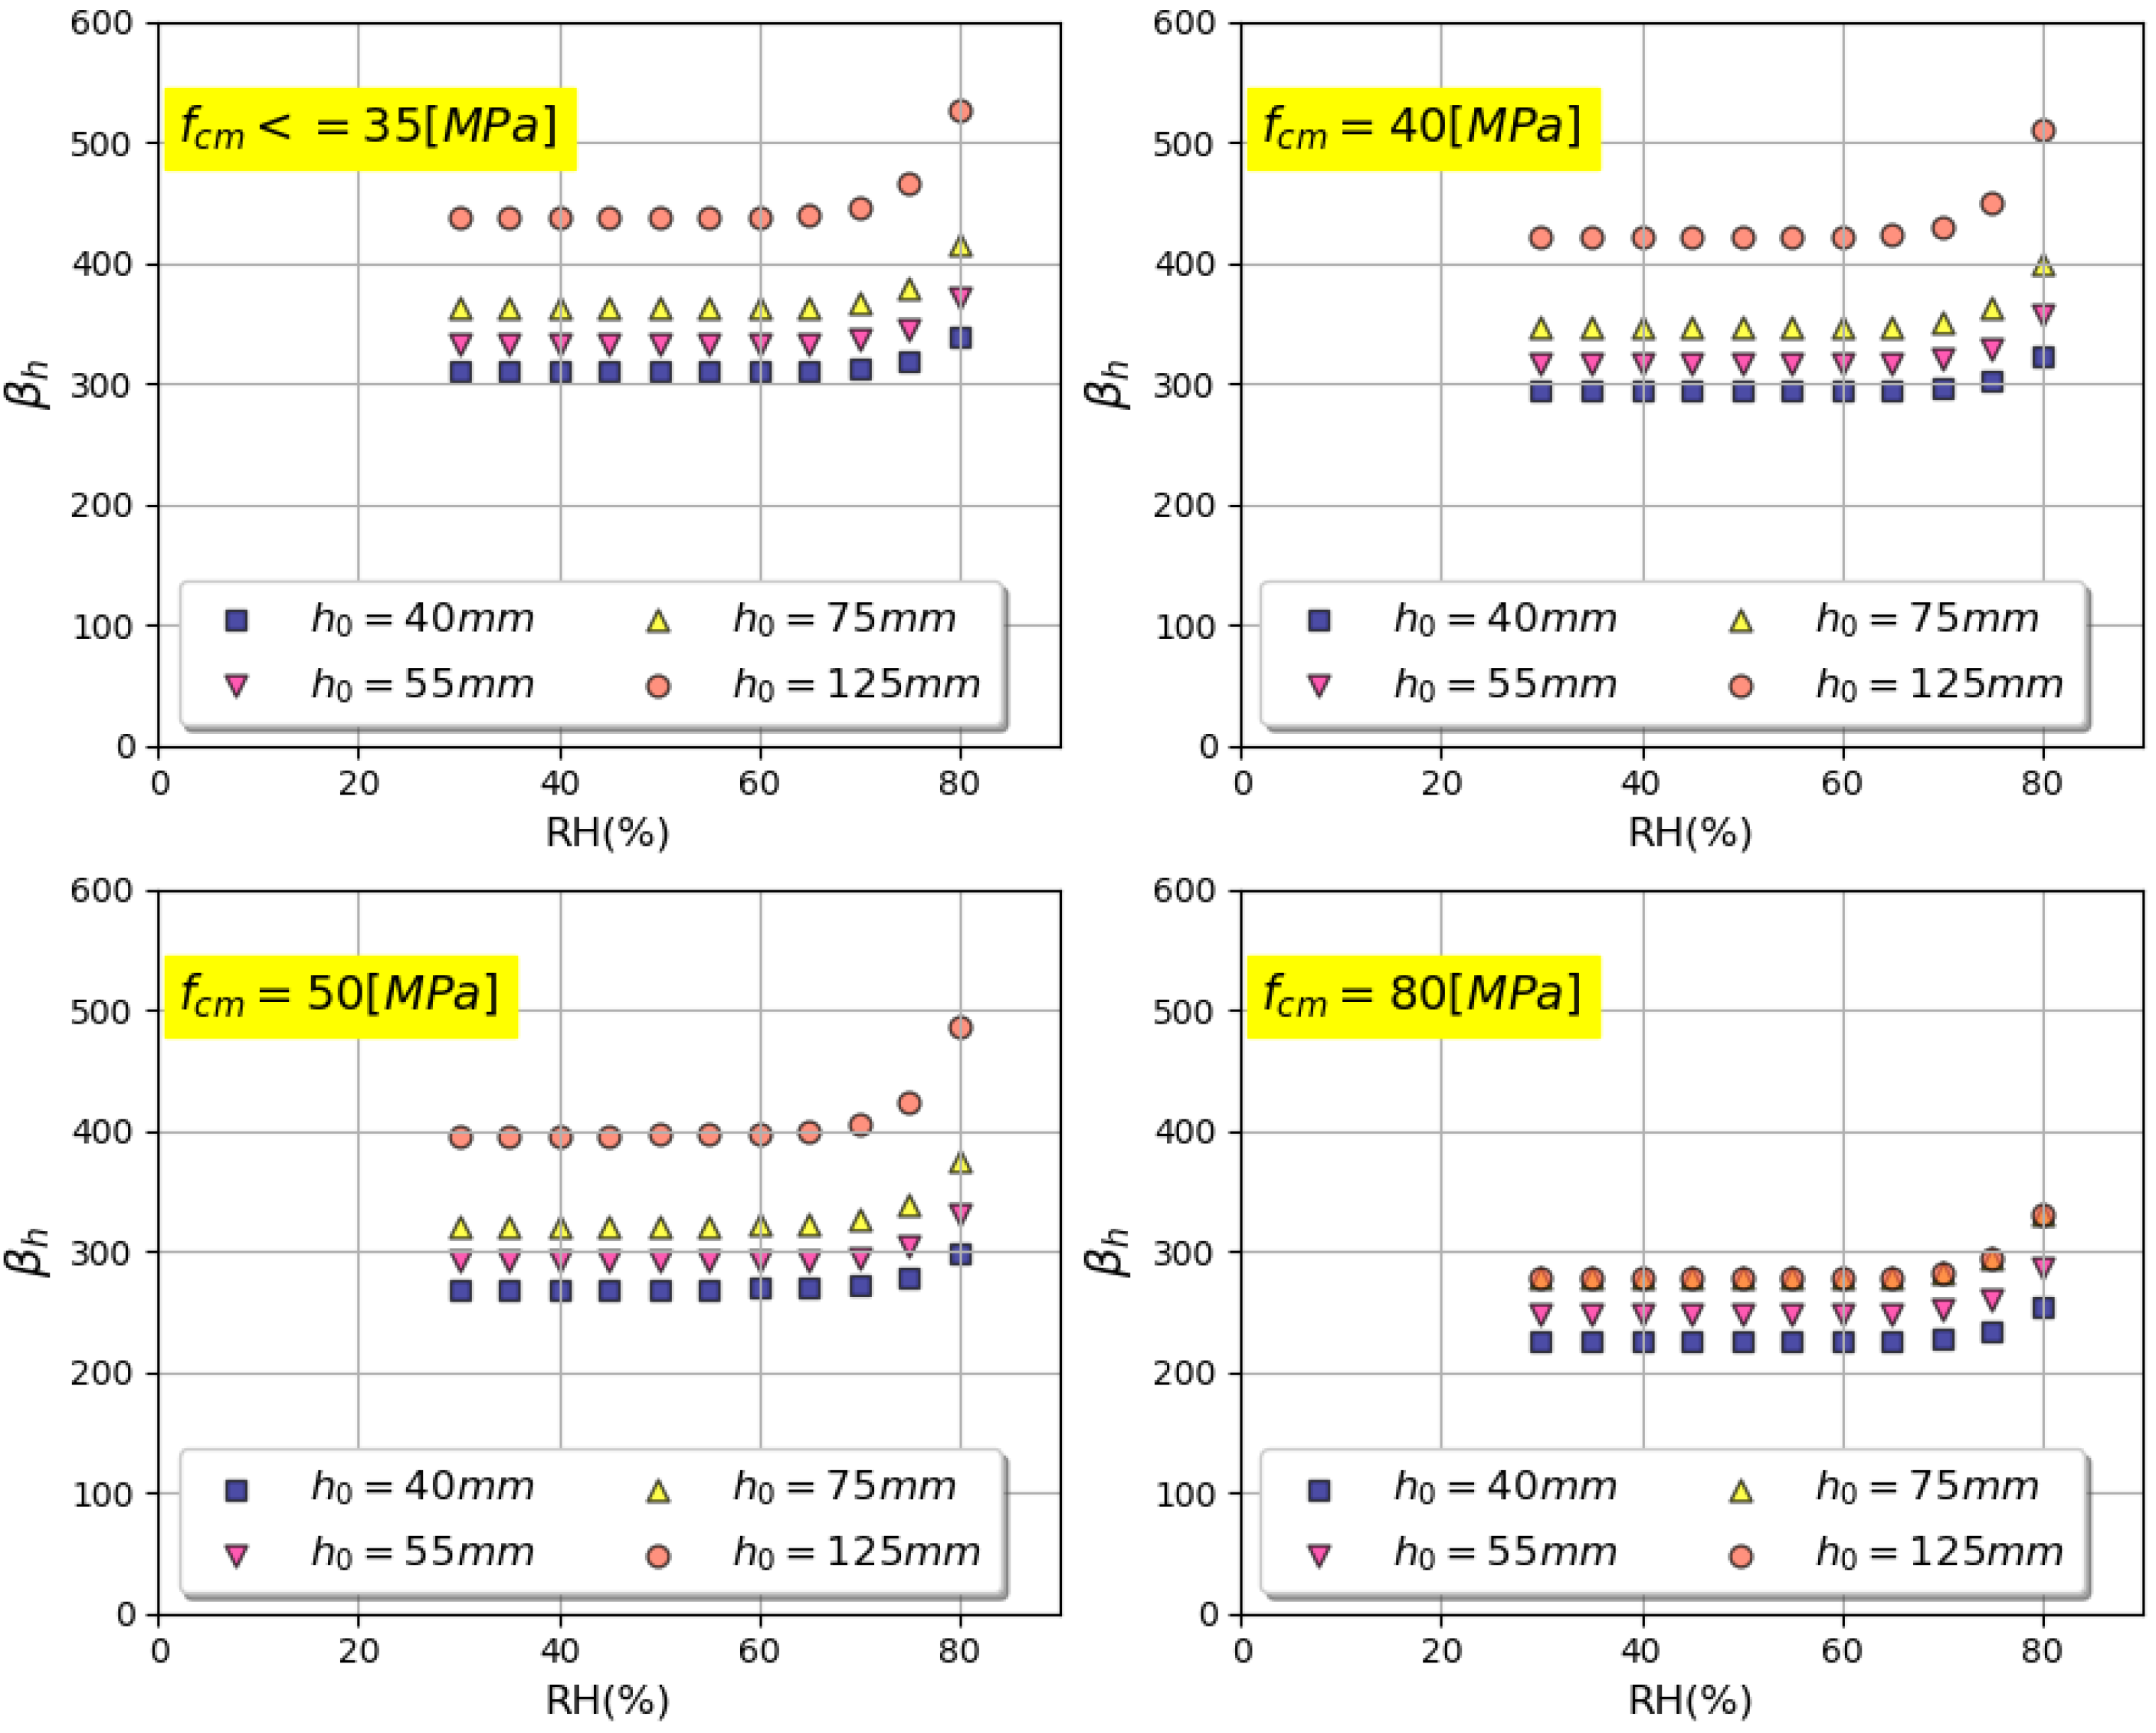
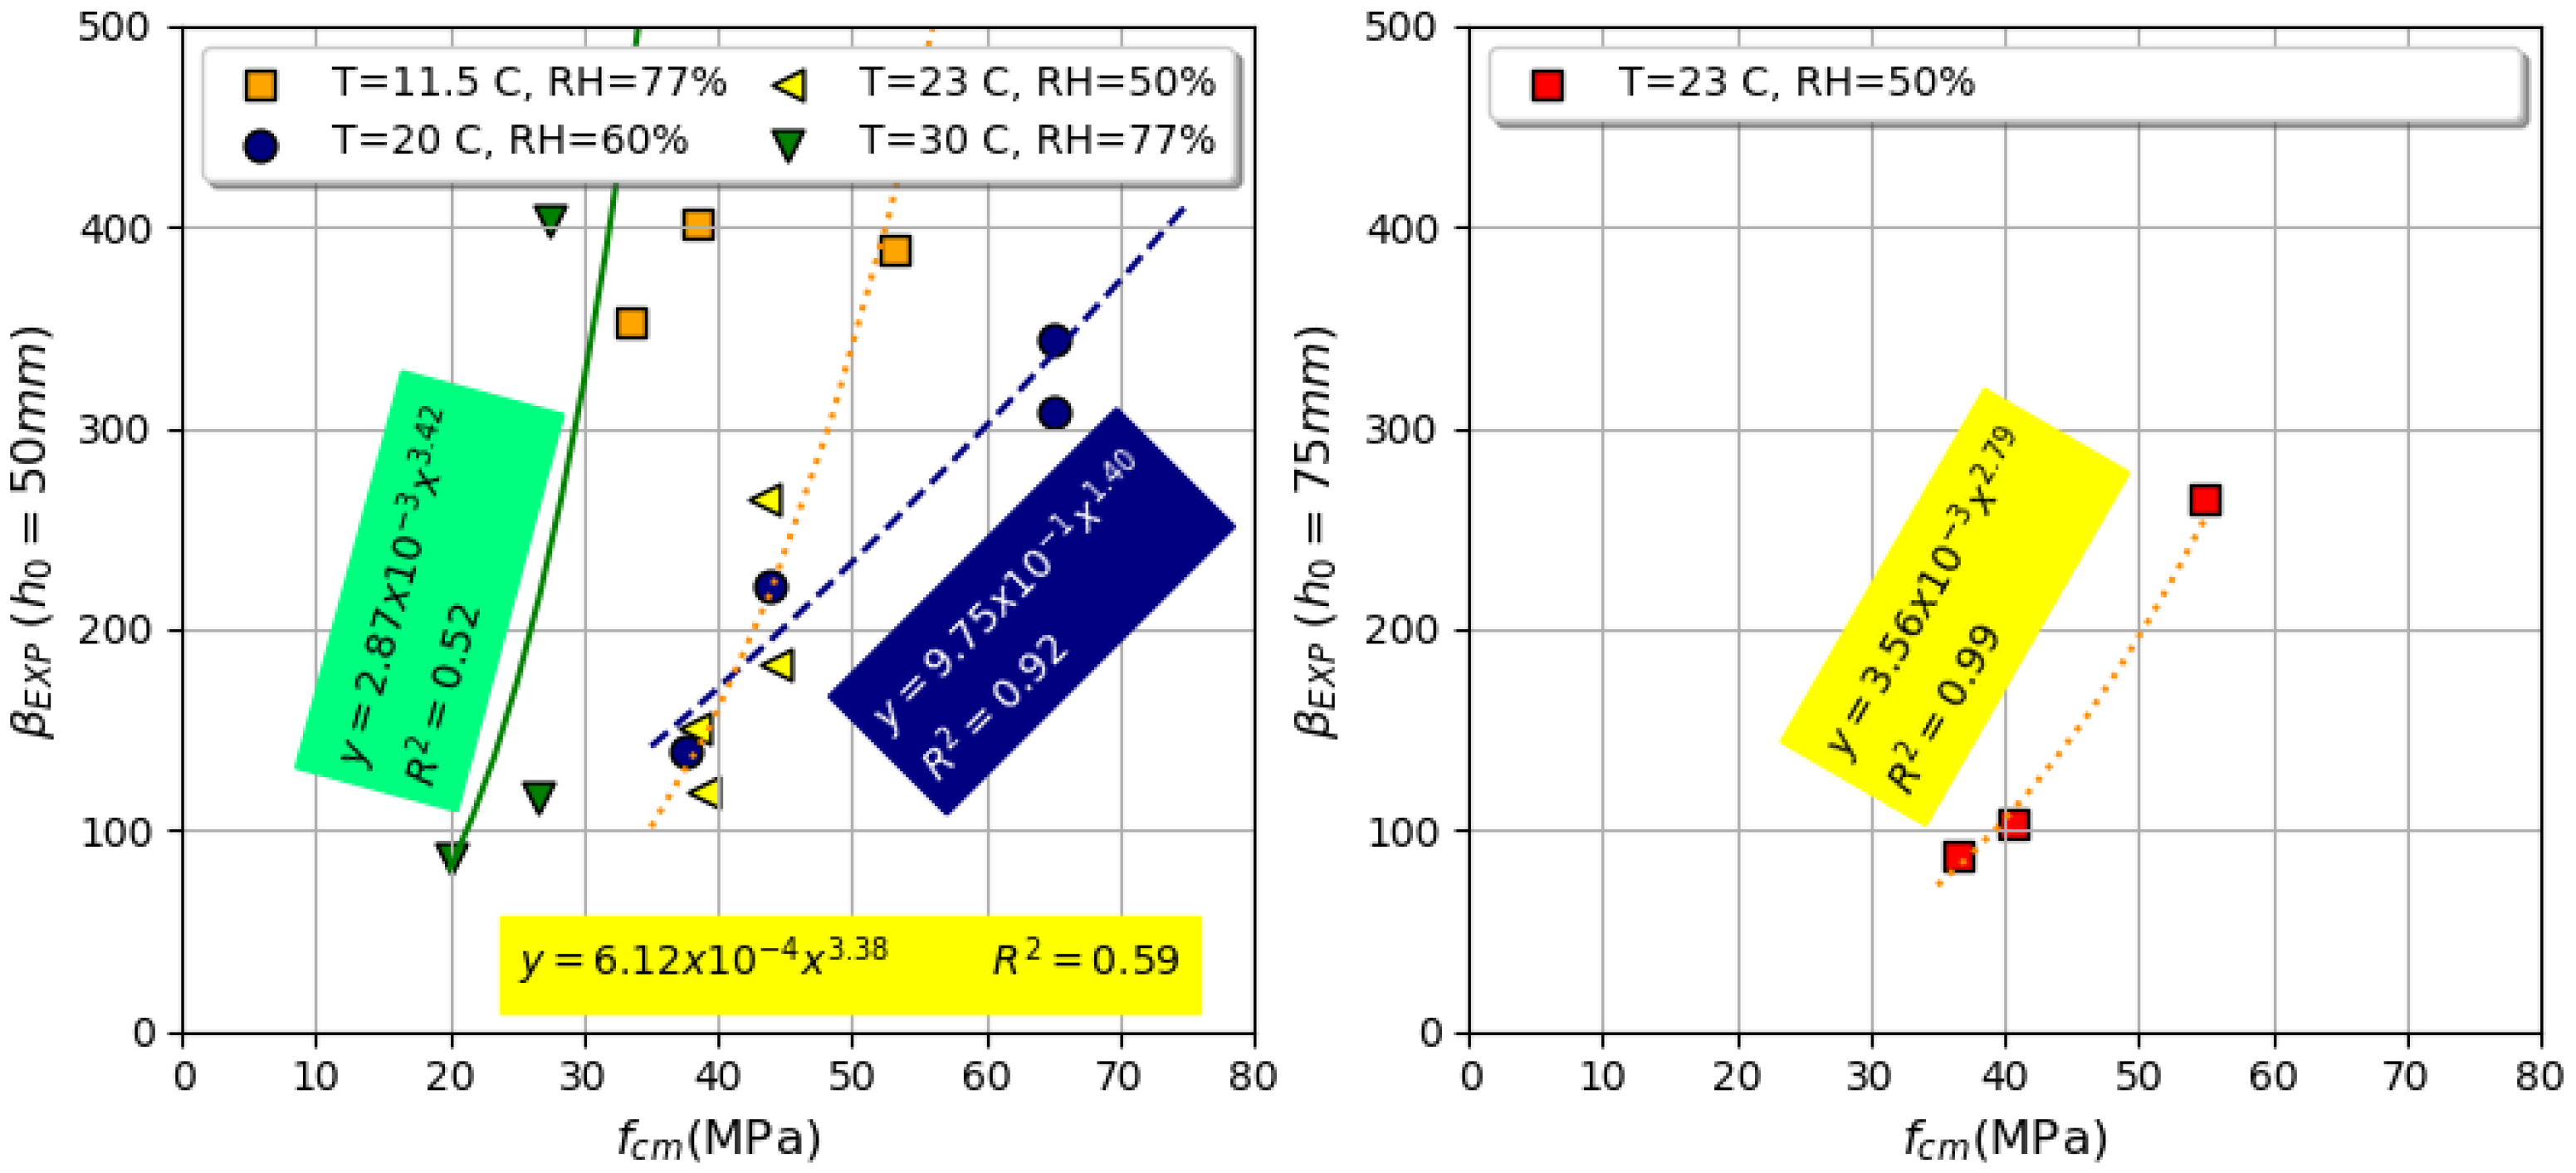
3.1. Creep Parameters’ Sensitivity of EC2 Model
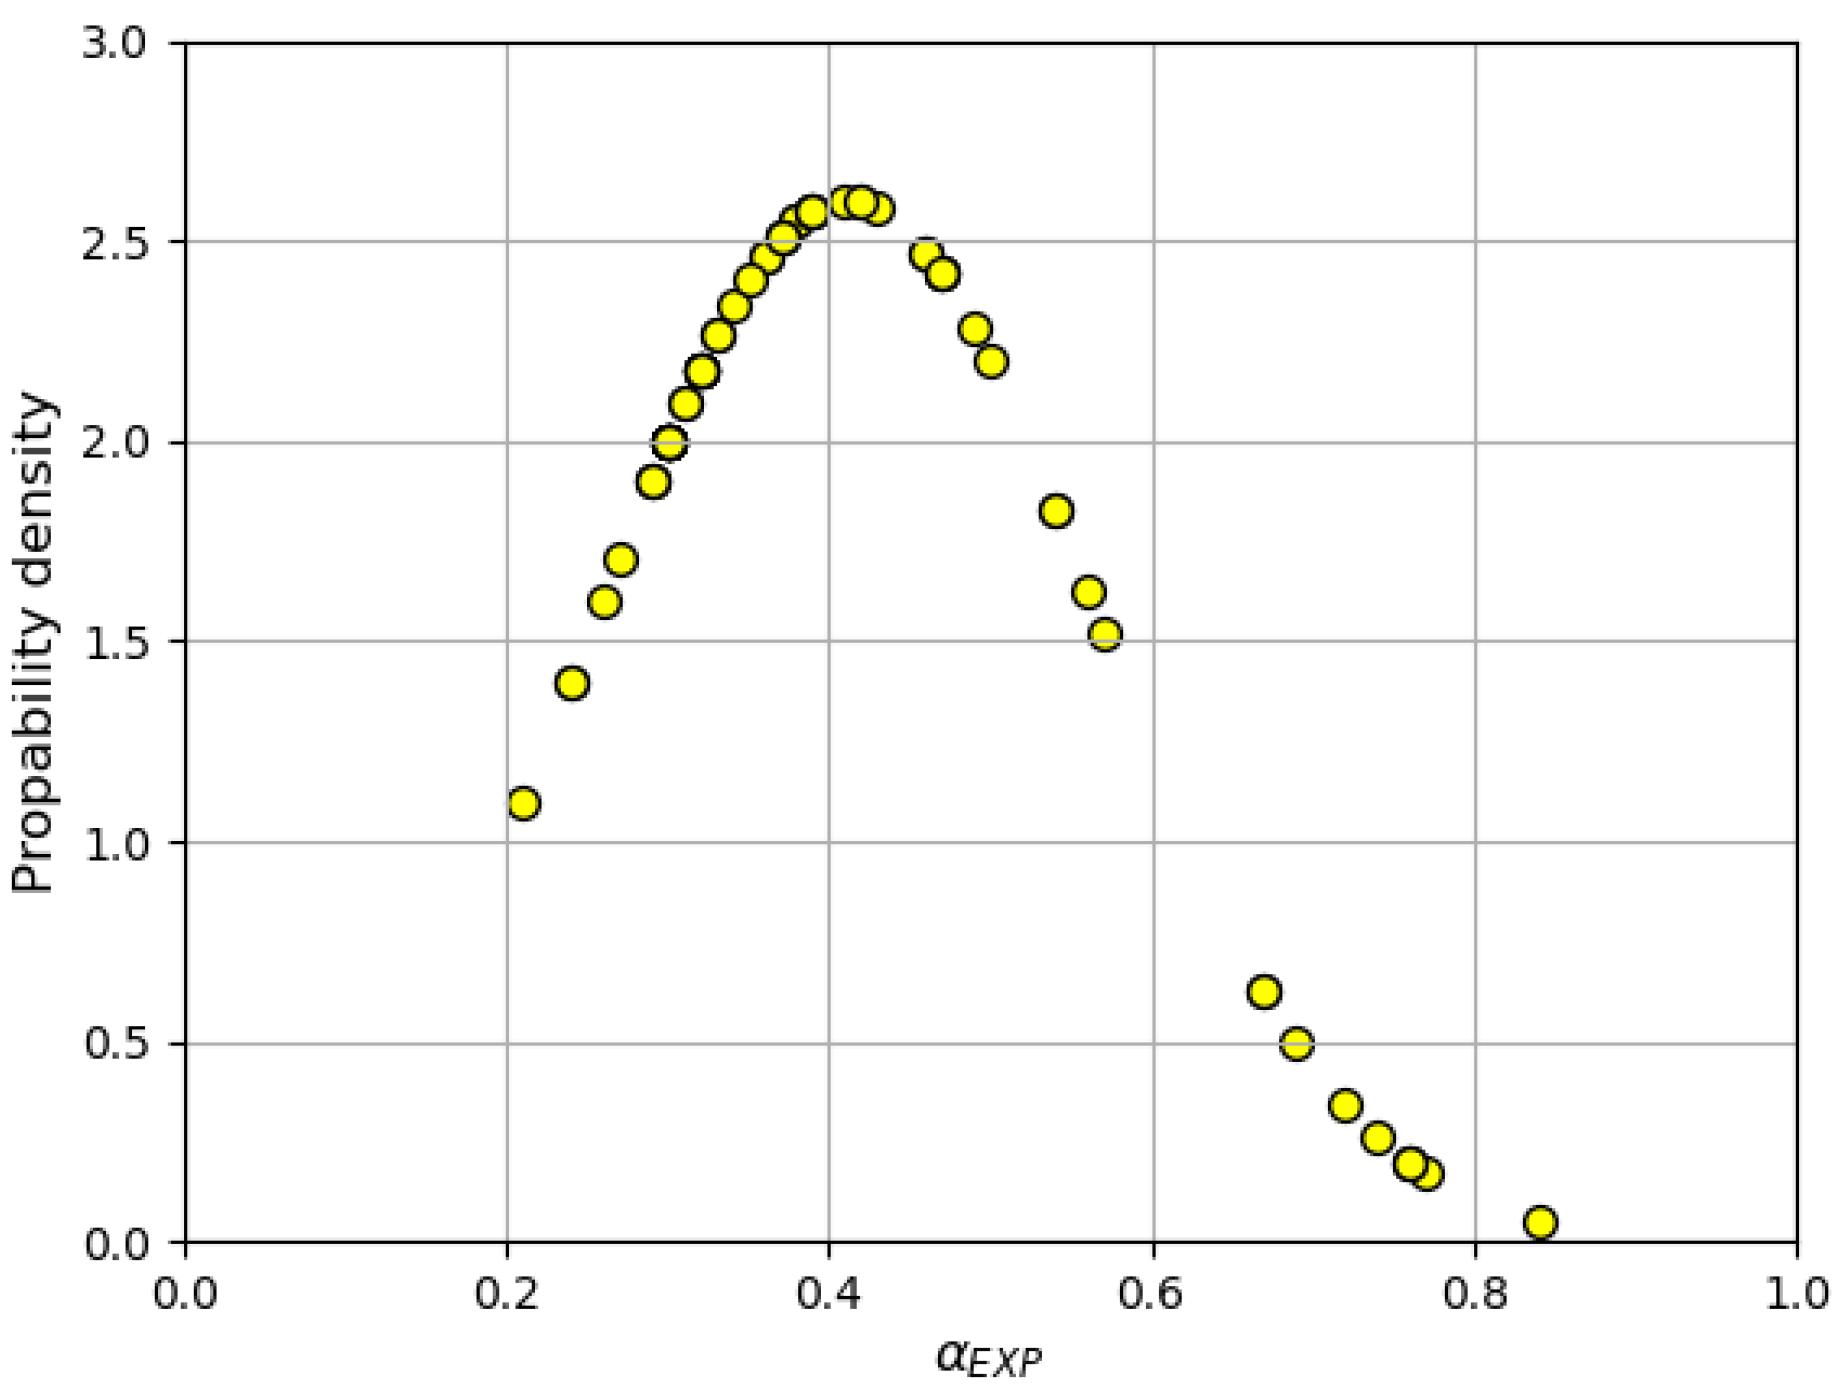
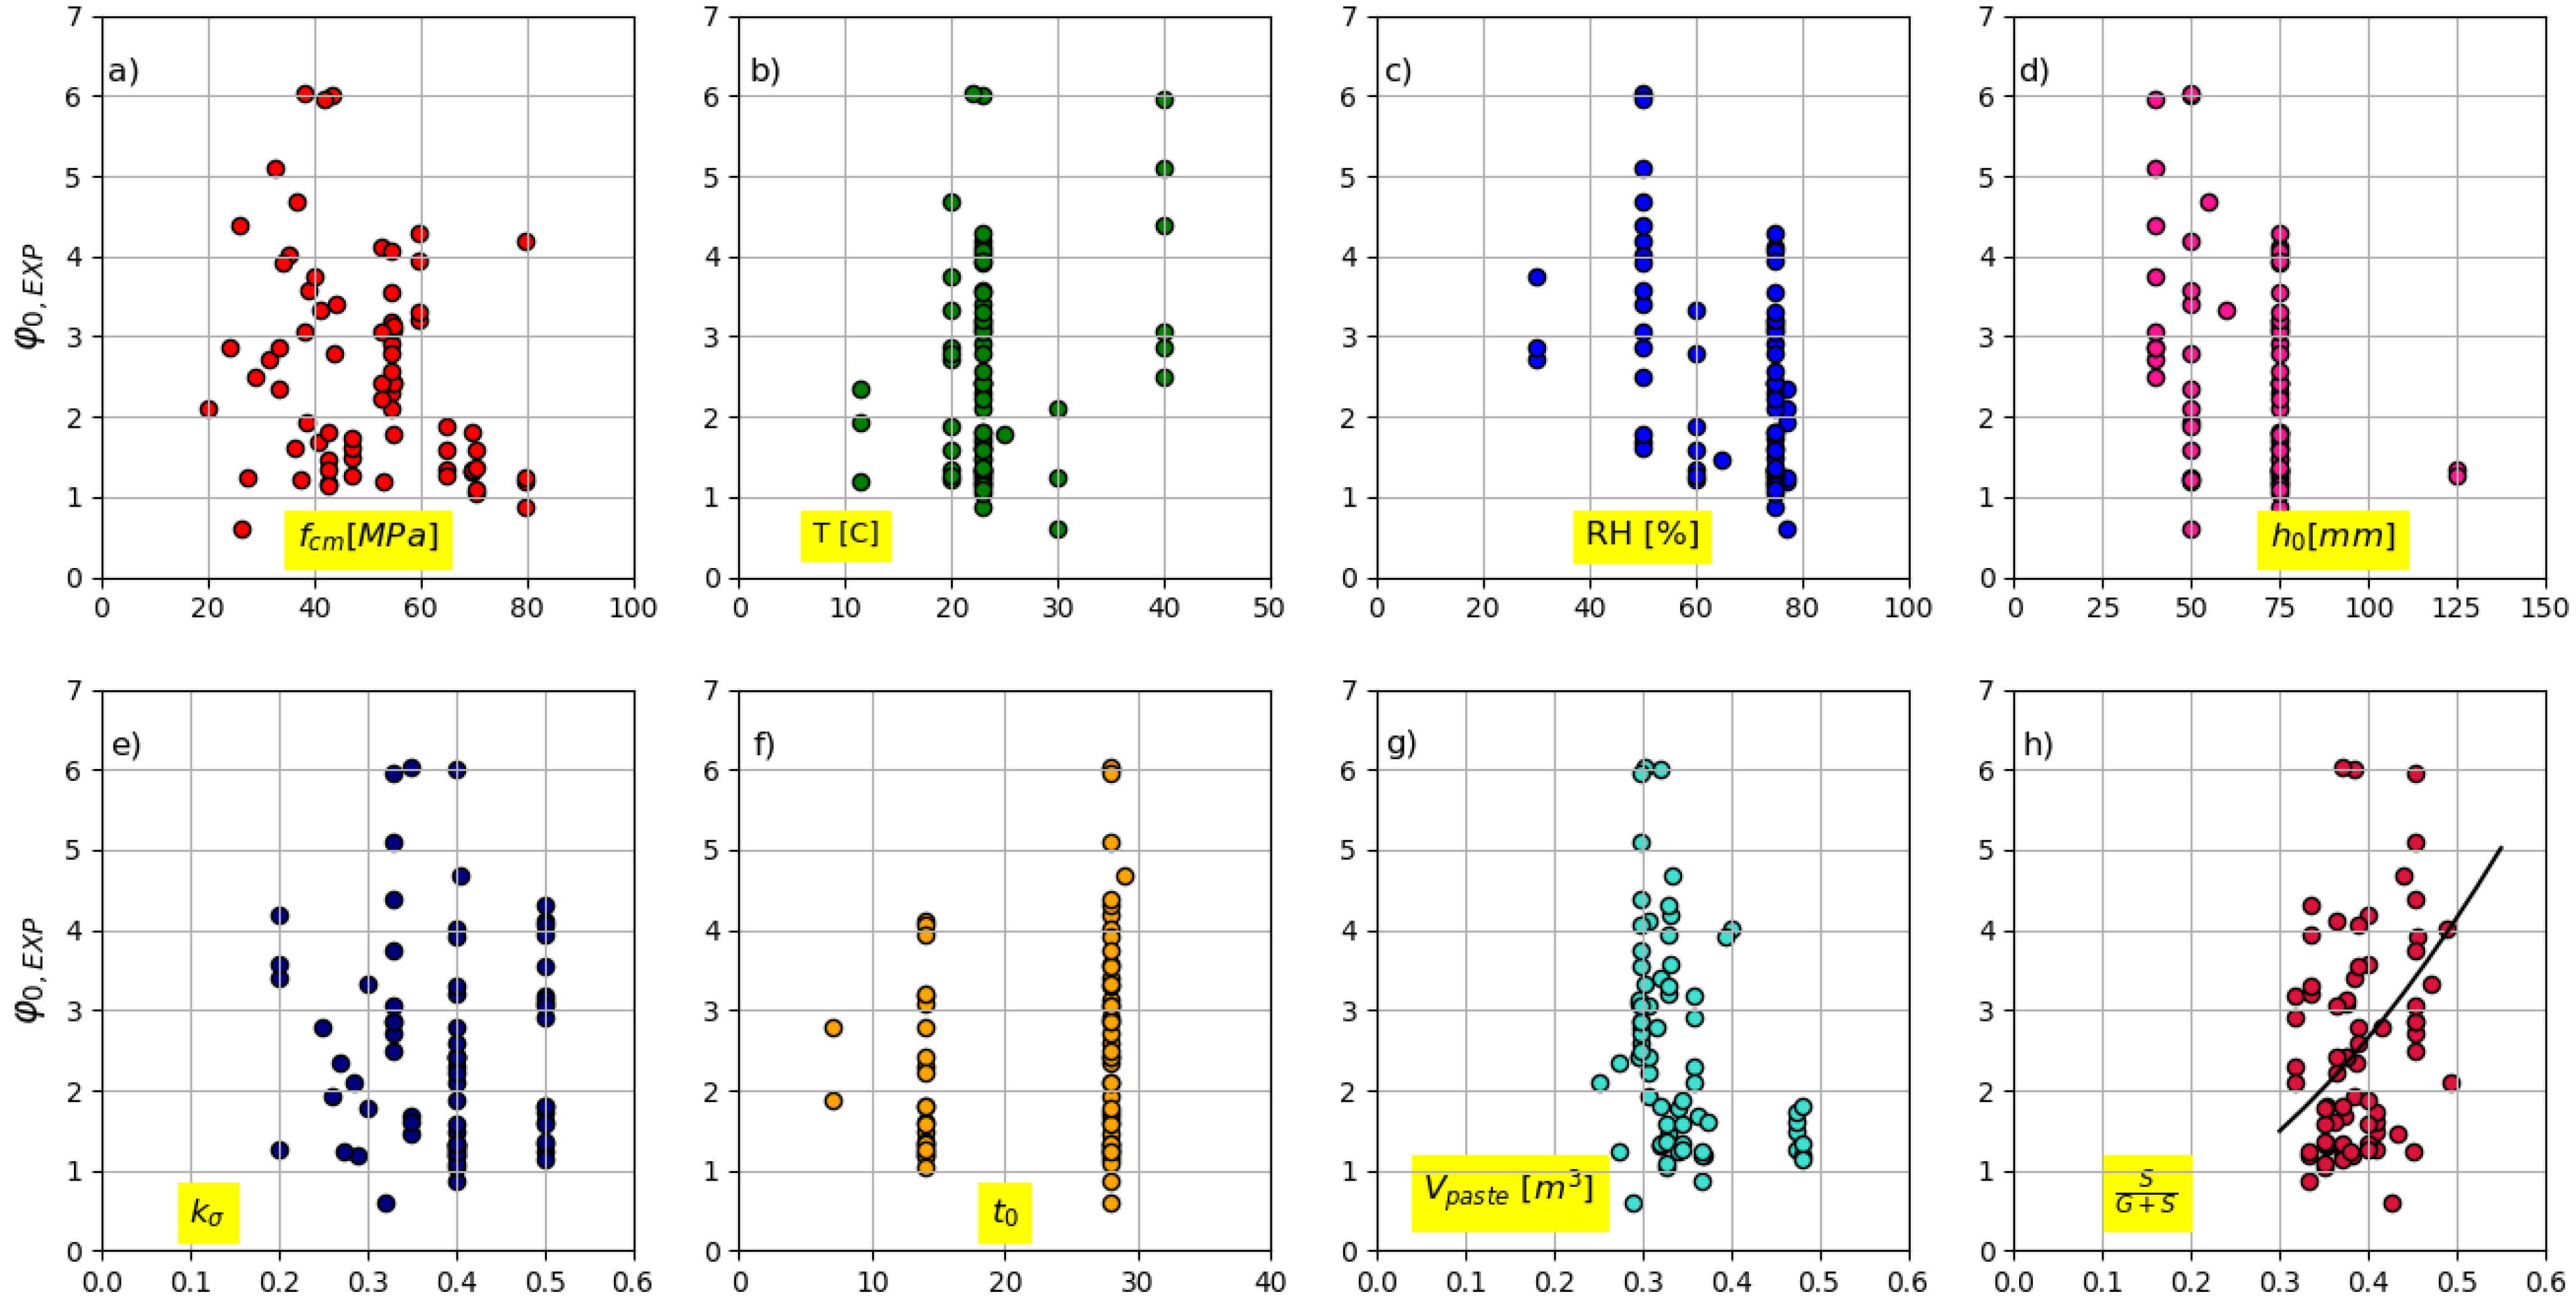
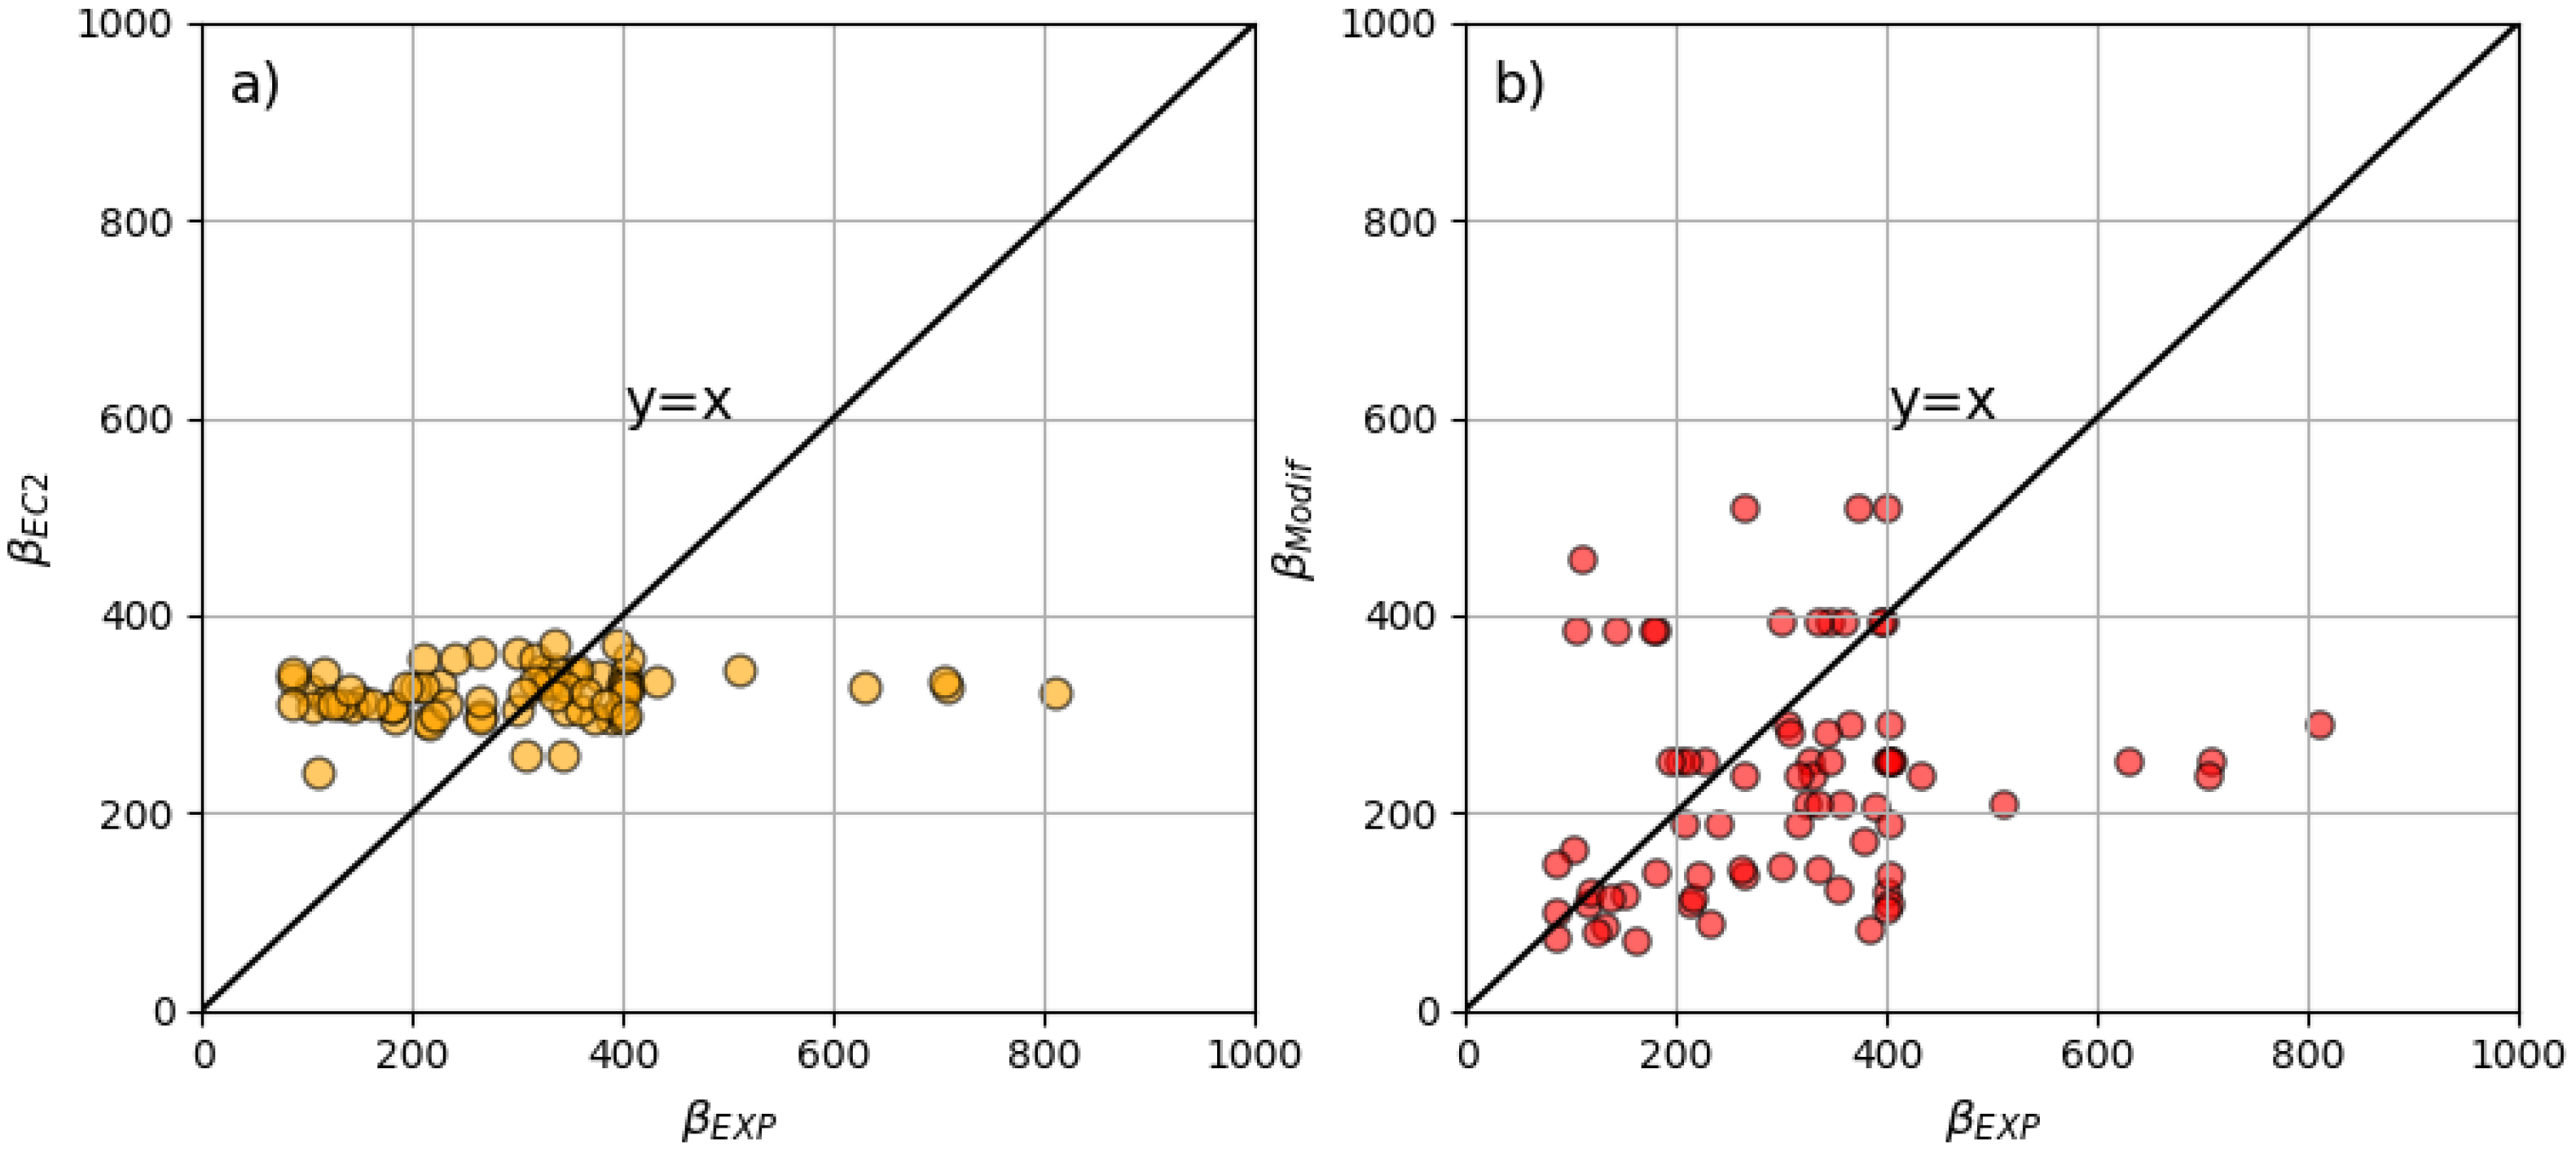
3.2. Identification of Creep Parameters
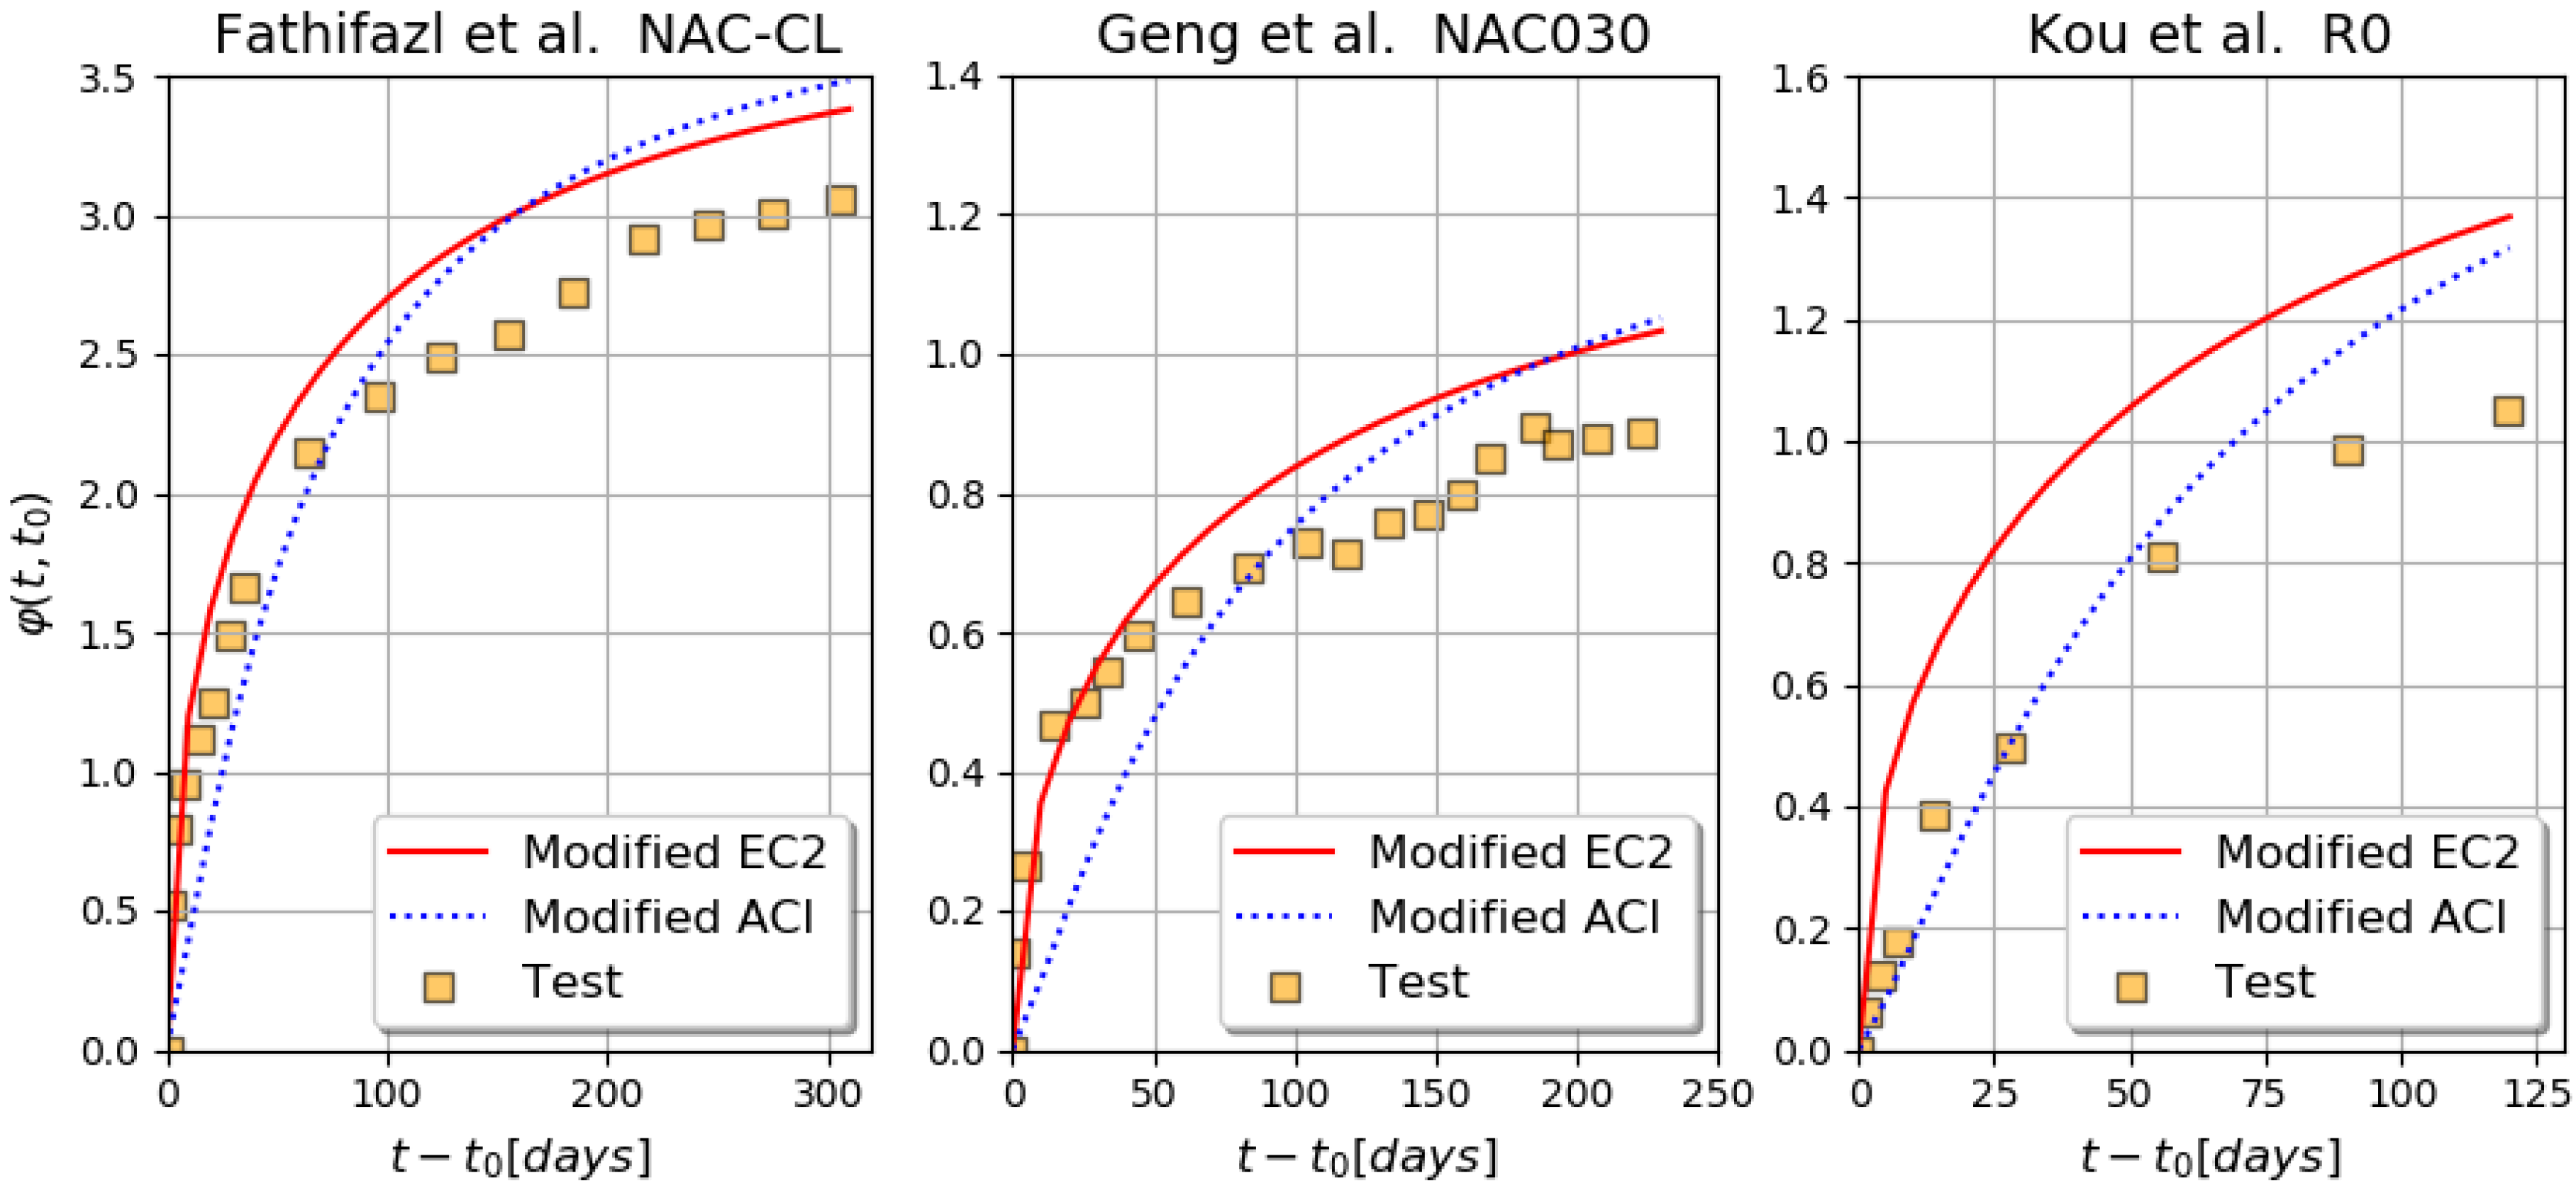
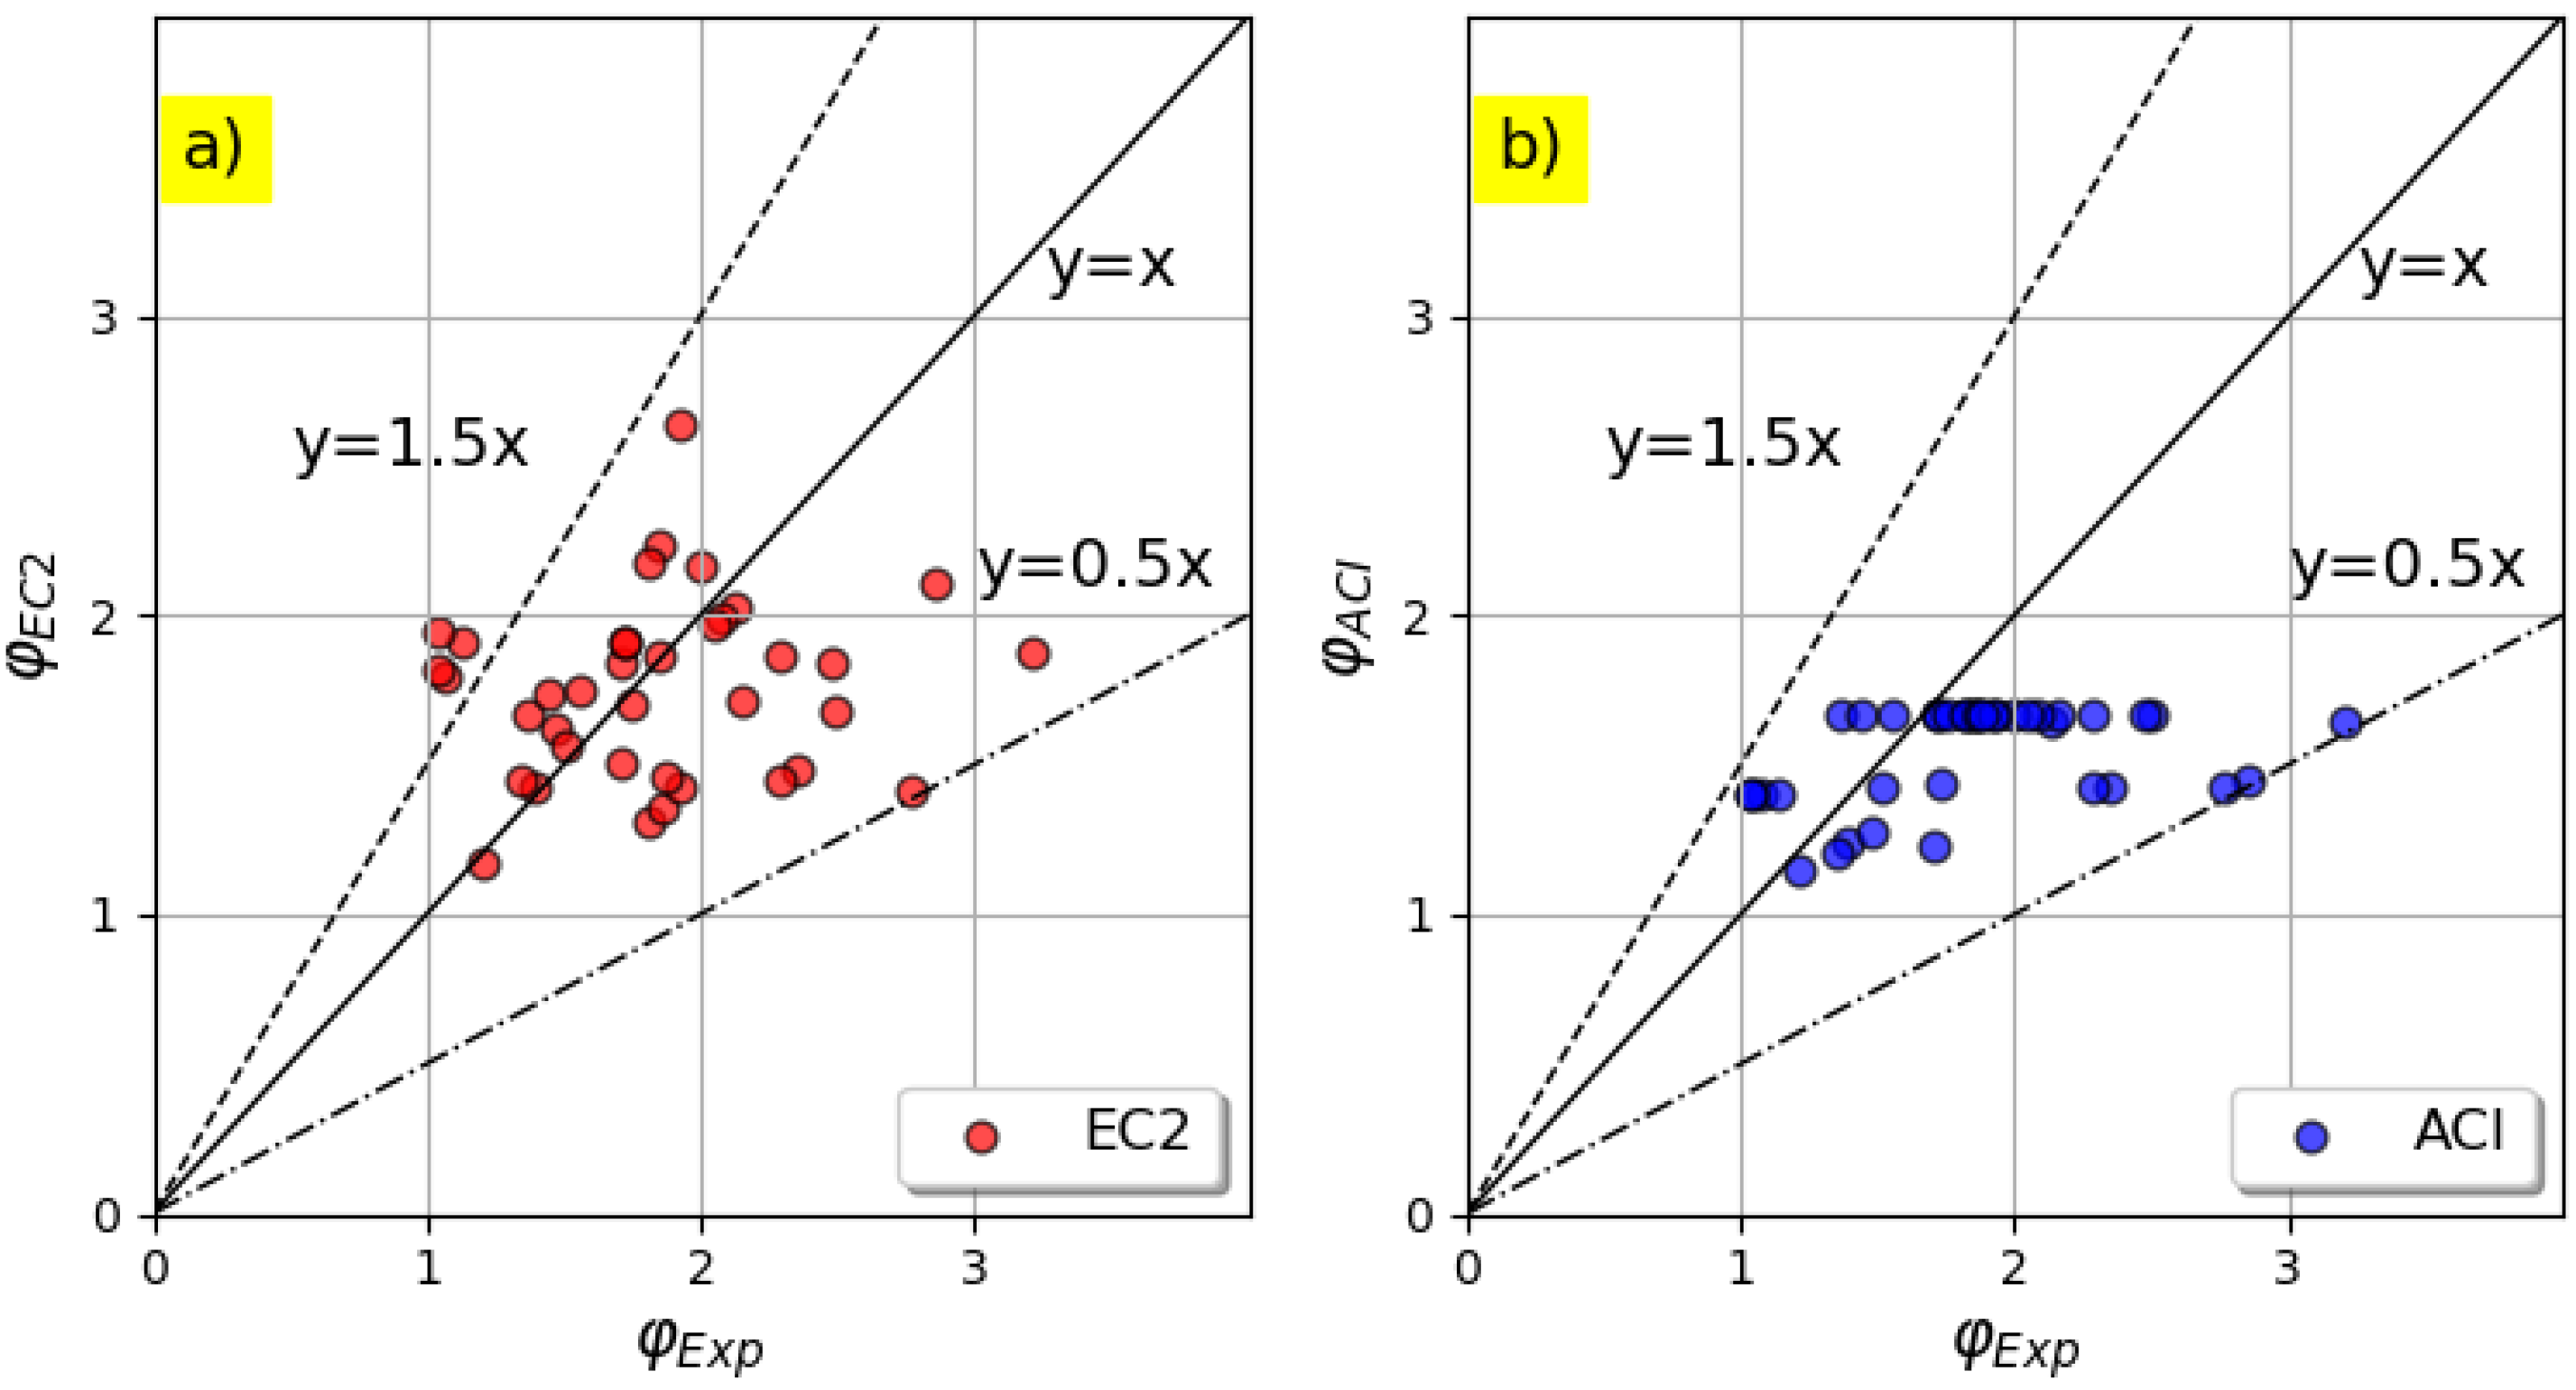
4. Creep Prediction of RAC
5. Conclusions
Author Contributions
Funding
Data Availability Statement
Conflicts of Interest
Abbreviations
| εσ | Elastic strain |
| εc | Creep strain |
| εcσ | Elastic and creep strain |
| φ(t,t0) | Creep coefficient |
| J(t,t0) | Compliance |
| σc(t0) | Constant compressive stress |
| h0 | Notional size of the member (mm) |
| fcm | Mean compressive strength of concrete at the age of 28 days (MPa) |
| t0 | Age of concrete at loading (days) |
| t0,adj | Adjusted age of loading (days) |
| t | Age of concrete at the moment considered (days) |
| NAC | Natural aggregate concrete |
| Wa(%) | Water absorption of the aggregates. |
| Ecm | Secant elastic modulus |
| Ecm (t0) | Secant elastic modulus at the moment of creep loading |
| γc,t0 | Age of loading correction factor |
| γc,RH | Relative humidity correction factor |
| γc,VS | Volume-surface ratio correction factor |
| γc,S | Slump correction factor |
| γc,Ψ | Fine aggregate correction factor |
| γc,α | Air content correction factor |
| V/S | Volume-surface ratio |
| βH | Coefficient depending on the relative humidity |
| RH | Relative humidity (%) |
| W/B | Water to binder ratio |
| Γm | Mass equivalent substitution ratio. |
| RAC | Recycled aggregate concrete |
| RCA | Recycled concrete aggregates |
| h0 | Notional size |
Appendix A

| N° | Parameter | ACI 209R-08 | EC2 | MC 2010 |
|---|---|---|---|---|
| 1 | Concrete strength at 28 days | x * | x | |
| 2 | Type of cement | x | x | x |
| 3 | Curing type | x | ||
| 4 | Relative humidity | x | x | x |
| 5 | Curing temperature | x | x | |
| 6 | Age of concrete at loading | x | x | x |
| 7 | Stress level | x | x | |
| 8 | Age of concrete at curing | |||
| 9 | Volume-surface ratio | x | ||
| 10 | Slump | x | ||
| 11 | Percentage of fine aggregates by weight | x | ||
| 12 | Percentage of air content by volume | x | ||
| 13 | Cross sectional area | x | x | |
| 14 | perimeter of the section in contact with the atmosphere | x | x |
| N° | Variable | ACI 209.2R-08 | EC2 MC 2010 |
|---|---|---|---|
| 1 | Type of cement | Type I and III | - |
| 2 | Slump | 70 mm | - |
| 3 | Air content | ≤6% | - |
| 4 | % Fine aggregate | 50% | - |
| 5 | Cement content | 279 to 446 kg/m3 | - |
| 6 | Length of initial curing (Moist cured) | 7 days | - |
| 7 | Length of initial curing (Steam cured) | 1 to 3 days | - |
| 8 | Curing temperature | 23.2 ± 2 °C | - |
| 9 | Relative humidity (Curing) | ≥95% | - |
| 10 | Concrete temperature | 23.2 ± 2 °C | - |
| 11 | Relative humidity | 40% | - |
| 12 | Volume/Surface | V/S = 38 mm | - |
| 13 | Minimum thickness | 150 mm | - |
| 14 | Concrete age at load application (Moist-cured) | 7 days | - |
| 15 | Concrete age at load application (Steam-cured) | 1 to 3 days | - |
| 16 | During of loading period | Sustained load | Sustained load |
| 17 | Compressive stress | Axial compression | Axial compression |
| 18 | Stress/strength ratio | ≤0.50 | ≤0.50 |
| Author | Year | Studied Models | Suggested Modification |
|---|---|---|---|
| Fathifazl et al. [8]‘ | 2011 | Neville CEB-FIB90 EC2 | Introduction of residual mortar volume fraction |
| Fan et al. [19] | 2014 | Neville | Introduction of residual mortar volume fraction |
| Fathifazl and Razaqpur [18] | 2013 | ACI 209.2R–08 4 rheological models | RCA coefficient taking into account the presence of attached mortar |
| Silva et al. [20] | 2015 | EC2. ACI 209-R. Bazant B3 and GL2000 | Correction factor for creep coefficient |
| Knaack and Kurama [15] | 2015 | ACI 209R | Modification of the ultimate creep by a correction factor |
| Lye et al. [17] | 2015 | ACI 209. CEB-FIB90. EC2. GL2000. Bazant B3and Hong Kong Code | Correction factor based on RCA content |
| Geng et al. [21] | 2016 | Creep coefficient (Equation (3)) | Correction using density or water absorption of RCA |
| Pan and Meng [22] | 2016 | CEB-FIP 90 | Modification of the ultimate creep coefficient and the power of time development function |
| Tošic et al. [9] | 2019 | MC 2010 | Correction factor based on RCA ratio |
| Geng et al. [23] | 2019 | Neville | Correction factors based on the residual cement paste |
| Author | Year | Type of Cement | W/B | S/(S + G) | t0 (Days) | Load Duration (Days) | Load Level | RH (%) | Γm |
| Sriravindrarajah and Ravindrarajah and Tam [35] | 1985 | Portland Type I (28) | 0.51–0.73 | 0.43–0.49 | 28 | 56 | 0.27–0.32 | 77 | 0–0.51 |
| Tia et al. [36] | 2005 | Portland Type I (28) | 0.24–0.44 | 0.32–0.41 | 14, 28 | 91 | 0.4–0.5 | 75 | - |
| Kou et al. [34] | 2007 | Portland Type I (28) | 0.55 | 0.36–0.37 | 28 | 120 | 0.35 | 50 | 0–0.61 |
| Domingo-Cabo et al. [11] | 2009 | CEM I 42.5 N/SR | 0.50 | 0.433 | 28 | 180 | 0.35 | 65 | 0–0.55 |
| Ghodousi et al. [37] | 2009 | Portland Type II (28) | 0.43 | 0.454 | 28 | 120 and 200 | 0.33 | 30, 50 | - |
| Fathifazl et al. [8] | 2011 | Portland Type I (28) | 0.45 | 0.46–0.49 | 28 | 330 | 0.4 | 50 | 0–0.50 |
| Manzi et al. [32] | 2013 | CEM II-A/LL 42.5 R | 0.48 | 0.471 | 28 | 500 | 0.3 | 60 | - |
| Tang et al. [33] | 2014 | Portland Type I (28) | 0.50 | 0.35 | 28 | 270 | 0.3 | 50 | - |
| Knaack and Kurama [15] | 2015 | Portland Type I (28) | 0.44 | 0.383 | 28 | 240 | 0.2–0.4 | 50 | 0–0.59 |
| Surya et al. [38] | 2015 | Portland Type I (28) | 0.40 | 0.371 | 28 | 90 | 0.35 | 50 | 0–0.61 |
| Zhao et al. [29] | 2016 | Portland (28) | 0.45 | 0.38 | 28 | 360 | 0.4 | 60 | - |
| Recybeton [30] | 2016 | CEM II/A-L 42.5 N | 0.49 | 0.44 | 28 | 200 | 0.41 | 50 | 0–0.52 |
| Geng et al. [21] | 2016 | Portland Type I (28) | 0.3–0.6 | 0.38–0.39 | 28 | 230 | 0.26–0.29 | 77 | 0–0.64 |
| Pan and Meng [22] | 2016 | - | 0.33 | 0.4 | 7, 28 | 500 and 600 | 0.2–0.4 | 60 | - |
| Gholampour and Ozbakkaloglu [16] | 2018 | Portland Type I (28) | 0.27–0.50 | 0.4 | 28 | 450 | 0.2 | 50 | 0–0.57 |
| He et al. [31] | 2017 | - | 0.40 | 0.415 | 7 | 180 | 0.25 | 60 | - |
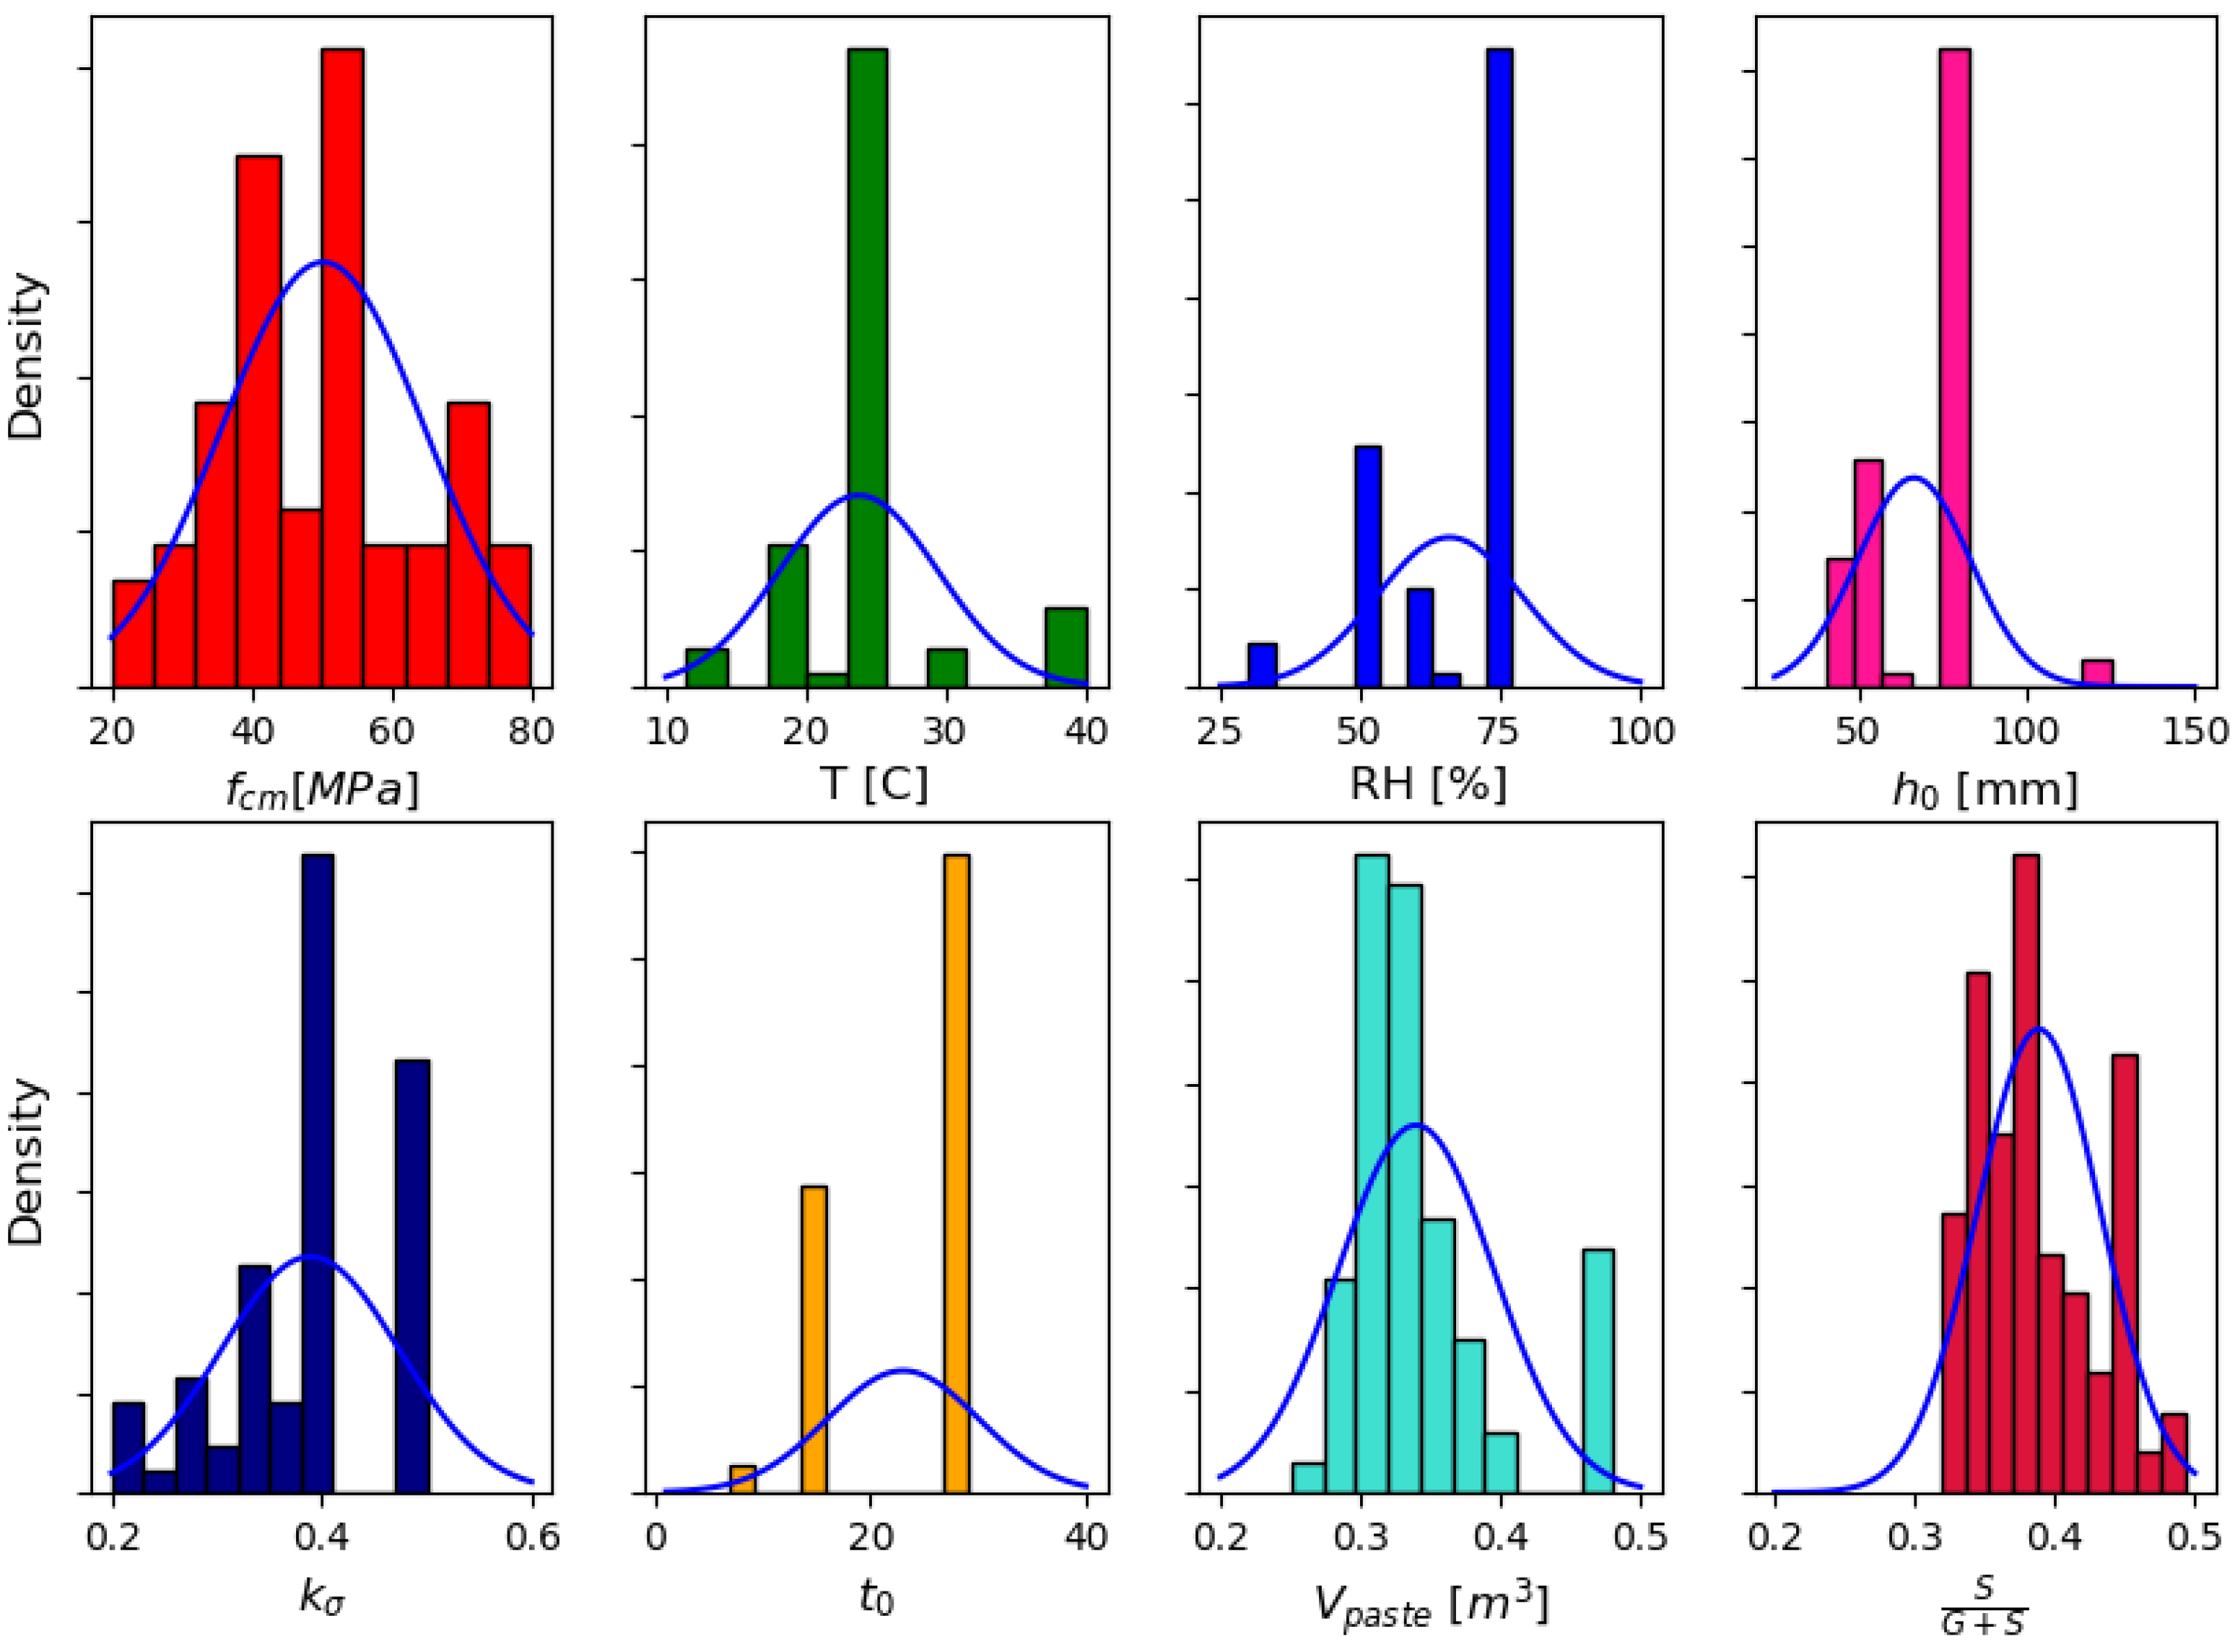
| Input Variables | NAC Values (73) | RAC Values (48) |
|---|---|---|
| fcm28 (MPa) | 20.0–79.8 | 18.5–80.1 |
| w/c | 0.24–0.73 | 0.29–0.75 |
| Wa. (%) | 0.44–4.18 | 1.89–4.55 |
| Cement content (kg/m3) | 117–600 | 275–600 |
| Type of cement | Portland Type I/Portland Type II CEM II/A-L 42.5 N/ CEM I 42.5 N/SR | Portland Type I/ CEM II/A-L 42.5 N/ CEM I 42.5 N/SR |
| Curing time | >7 days | >7 days |
| t–t0 (days) | 56–600 days | 56–450 days |
| t0 (days) | 7–28 days | 7–113 days |
| Loading level | 0.2–0.5 | 0.2–0.43 |
| h0 (mm) | 40–125 | 50–75 |
| RH (%) | 30–77 | 50–77 |
| T (°C) | 11.5–40 | 11.5–30 |
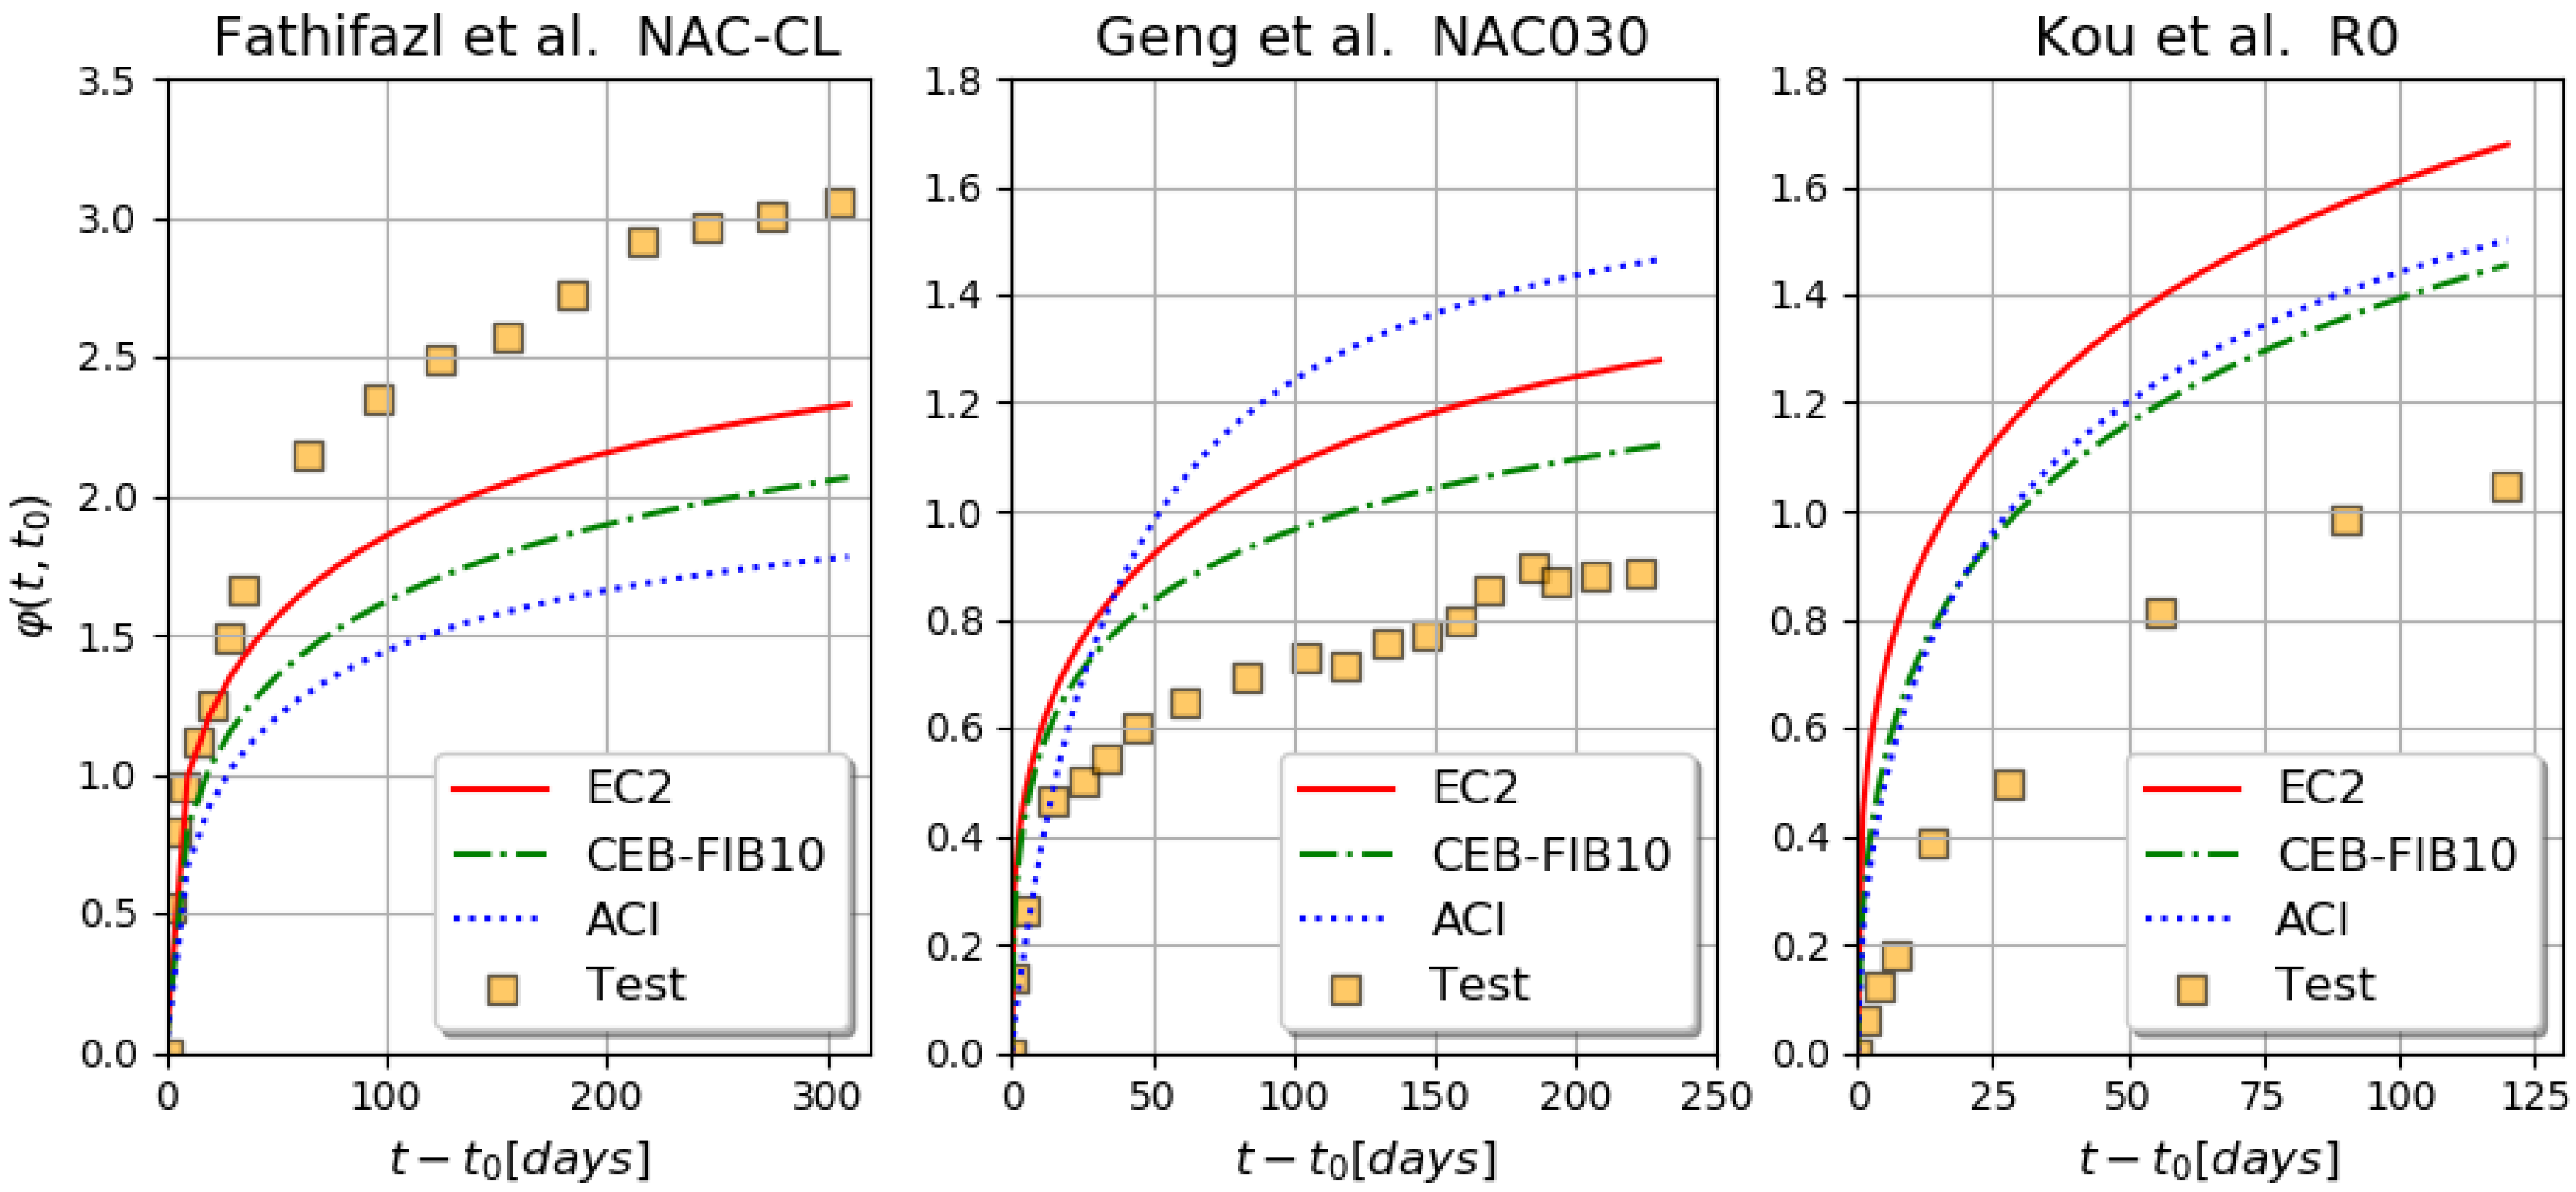
| Time (Day) | Experimental | EC2 | MC2010 | ACI | Modified EC2 Equation (11) | Modified ACI Equation (12) |
|---|---|---|---|---|---|---|
| 0 | 0.00 | 0.00 | 0.00 | 0.00 | 0.00 | 0.00 |
| 10 | 1.01 | 0.99 | 0.81 | 0.67 | 1.20 | 0.39 |
| 20 | 1.23 | 1.21 | 1.02 | 0.88 | 1.58 | 0.80 |
| 30 | 1.54 | 1.36 | 1.16 | 1.02 | 1.84 | 1.16 |
| 40 | 1.76 | 1.47 | 1.26 | 1.12 | 2.04 | 1.46 |
| 50 | 1.95 | 1.56 | 1.35 | 1.20 | 2.20 | 1.72 |
| 60 | 2.09 | 1.64 | 1.42 | 1.27 | 2.33 | 1.94 |
| 70 | 2.20 | 1.70 | 1.48 | 1.32 | 2.44 | 2.12 |
| 80 | 2.27 | 1.76 | 1.53 | 1.37 | 2.54 | 2.28 |
| 90 | 2.32 | 1.81 | 1.58 | 1.41 | 2.62 | 2.42 |
| 100 | 2.37 | 1.86 | 1.62 | 1.44 | 2.70 | 2.54 |
| 110 | 2.42 | 1.90 | 1.66 | 1.47 | 2.76 | 2.64 |
| 120 | 2.47 | 1.93 | 1.69 | 1.50 | 2.82 | 2.73 |
| 130 | 2.51 | 1.97 | 1.72 | 1.53 | 2.88 | 2.81 |
| 140 | 2.53 | 2.00 | 1.75 | 1.55 | 2.93 | 2.89 |
| 150 | 2.55 | 2.03 | 1.78 | 1.57 | 2.97 | 2.95 |
| 160 | 2.59 | 2.06 | 1.81 | 1.59 | 3.01 | 3.01 |
| 170 | 2.63 | 2.09 | 1.83 | 1.61 | 3.05 | 3.06 |
| 180 | 2.69 | 2.11 | 1.85 | 1.63 | 3.09 | 3.11 |
| 190 | 2.76 | 2.13 | 1.88 | 1.64 | 3.12 | 3.16 |
| 200 | 2.82 | 2.15 | 1.90 | 1.66 | 3.15 | 3.20 |
| 210 | 2.88 | 2.17 | 1.91 | 1.67 | 3.18 | 3.23 |
| 220 | 2.92 | 2.19 | 1.93 | 1.69 | 3.20 | 3.27 |
| 230 | 2.94 | 2.21 | 1.95 | 1.70 | 3.23 | 3.30 |
| 240 | 2.95 | 2.23 | 1.97 | 1.71 | 3.25 | 3.33 |
| 250 | 2.97 | 2.24 | 1.98 | 1.72 | 3.27 | 3.36 |
| 260 | 2.98 | 2.26 | 2.00 | 1.73 | 3.29 | 3.38 |
| 270 | 3.00 | 2.27 | 2.01 | 1.74 | 3.31 | 3.40 |
| 280 | 3.02 | 2.29 | 2.03 | 1.75 | 3.33 | 3.43 |
| 290 | 3.04 | 2.30 | 2.04 | 1.76 | 3.35 | 3.45 |
| 300 | 3.05 | 2.32 | 2.05 | 1.77 | 3.36 | 3.47 |
References
- Goel, R.; Kumar, R.; Paul, D.K. Comparative Study of Various Creep and Shrinkage Prediction Models for Concrete. J. Mater. Civ. Eng. 2007, 19, 249–260. [Google Scholar] [CrossRef]
- Tam, V.W.Y.; Xiao, J.; Liu, S.; Chen, Z. Behaviors of recycled aggregate concrete-filled steel tubular columns under eccentric loadings. Front. Struct. Civ. Eng. 2019, 13, 628–639. [Google Scholar] [CrossRef]
- Arezoumandi, M.; Ezzell, M.; Volz, J.S. A comparative study of the mechanical properties, fracture behavior, creep, and shrinkage of chemically based self-consolidating concrete. Front. Struct. Civ. Eng. 2014, 8, 36–45. [Google Scholar] [CrossRef]
- Shao, X.; Li, L.; Yang, J. Experimental research on the creep behavior and bearing capacity of repeatedly prestressed concrete beam. Front. Arch. Civ. Eng. China 2007, 1, 305–311. [Google Scholar] [CrossRef]
- Ladaoui, W.; Vidal, T.; Sellier, A.; Bourbon, X. Analysis of interactions between damage and basic creep of HPC and HPFRC heated between 20 and 80 °C. Mater. Struct. 2013, 46, 13–23. [Google Scholar] [CrossRef]
- Hassoun, M.N.; Akthem Al, M. Structural Concrete: Theory and Design, 6th ed.; Wiley: Hoboken, NJ, USA, 2015. [Google Scholar]
- Hubler, M.H.; Wendner, R.; Bažant, Z.P. Statistical justification of Model B4 for drying and autogenous shrinkage of concrete and comparisons to other models. Mater. Struct. 2015, 48, 797–814. [Google Scholar] [CrossRef]
- Fathifazl, G.; Razaqpur, A.G.; Isgor, O.B.; Abbas, A.; Fournier, B.; Foo, S. Creep and drying shrinkage characteristics of concrete produced with coarse recycled concrete aggregate. Cem. Concr. Compos. 2011, 33, 1026–1037. [Google Scholar] [CrossRef]
- Tošić, N.; De La Fuente, A.; Marinković, S. Creep of recycled aggregate concrete: Experimental database and creep prediction model according to the fib Model Code 2010. Constr. Build. Mater. 2019, 195, 590–599. [Google Scholar] [CrossRef]
- Xiao, J.; Li, L.; Tam, V.W.; Li, H. The state of the art regarding the long-term properties of recycled aggregate concrete. Struct. Concr. 2014, 15, 3–12. [Google Scholar] [CrossRef]
- Domingo-Cabo, A.; Lázaro, C.; López-Gayarre, F.; Serrano-López, M.; Serna, P.; Castaño-Tabares, J. Creep and shrinkage of recycled aggregate concrete. Constr. Build. Mater. 2009, 23, 2545–2553. [Google Scholar] [CrossRef]
- Akono, A.-T.; Chen, J.; Zhan, M.; Shah, S.P. Basic creep and fracture response of fine recycled aggregate concrete. Constr. Build. Mater. 2020, 266, 121107. [Google Scholar] [CrossRef]
- ACI Committee. Guide for Modeling and Calculating Shrinkage and Creep in Hardened Concrete; American Concrete Institute: Farmington Hills, MI, USA, 2008. [Google Scholar]
- Comite Euro-International Du Beton. CEB-FIP, Model Code, 1990; ICE: London, UK, 2015. [Google Scholar]
- Knaack, A.M.; Kurama, Y.C. Creep and shrinkage of normal-strength concrete with recycled concrete aggregates. ACI Mater. J. 2015, 112, 451–462. [Google Scholar] [CrossRef]
- Gholampour, A.; Ozbakkaloglu, T. Time-dependent and long-term mechanical properties of concretes incorporating different grades of coarse recycled concrete aggregates. Eng. Struct. 2018, 157, 224–234. [Google Scholar] [CrossRef]
- Lye, C.-Q.; Dhir, R.K.; Ghataora, G.S.; Li, H. Creep strain of recycled aggregate concrete. Constr. Build. Mater. 2016, 102, 244–259. [Google Scholar] [CrossRef]
- Fathifazl, G.; Razaqpur, A.G. Creep Rheological Models for Recycled Aggregate Concrete. ACI Mater. J. 2013, 110. [Google Scholar] [CrossRef]
- Fan, Y.; Xiao, J.; Tam, V.W.Y. Effect of old attached mortar on the creep of recycled aggregate concrete. Struct. Concr. 2014, 15, 169–178. [Google Scholar] [CrossRef]
- Silva, R.; de Brito, J.; Dhir, R. Comparative analysis of existing prediction models on the creep behaviour of recycled aggregate concrete. Eng. Struct. 2015, 100, 31–42. [Google Scholar] [CrossRef]
- Geng, Y.; Wang, Y.; Chen, J. Time-dependent behaviour of steel tubular columns filled with recycled coarse aggregate concrete. J. Constr. Steel Res. 2016, 122, 455–468. [Google Scholar] [CrossRef]
- Pan, Z.; Meng, S. Three-level experimental approach for creep and shrinkage of high-strength high-performance con-crete. Eng. Struct. 2016, 120, 23–36. [Google Scholar] [CrossRef]
- Geng, Y.; Zhao, M.; Yang, H.; Wang, Y. Creep model of concrete with recycled coarse and fine aggregates that accounts for creep development trend difference between recycled and natural aggregate concrete. Cem. Concr. Compos. 2019, 103, 303–317. [Google Scholar] [CrossRef]
- Eurocode 2: Design of Concrete Structures: Part 1-1: General Rules and Rules for Buildings; EN 1992-1-1; CEN: Brussels, Belgium, 2004.
- FIB. fib Model Code for Concrete Structures 2010; Wiley: Hoboken, NJ, USA, 2013. [Google Scholar]
- Neville, A.M. Creep of concrete as a function of its cement paste content. Mag. Concr. Res. 1964, 16, 21–30. [Google Scholar] [CrossRef]
- Neville, A.M. Properties of Concrete, 5th ed.; Pearson Education Limited: London, UK, 2013. [Google Scholar]
- Mija, R.W.; Hubler, H.; Bažant, Z.P. Comprehensive Database for Concrete Creep and Shrinkage: Analysis and Recommendations for Testing and Recording. ACI Mater. J. 2015, 112. [Google Scholar] [CrossRef]
- Zhao, Q.; Yu, J.; Geng, G.; Jiang, J.; Liu, X. Effect of fiber types on creep behavior of concrete. Constr. Build. Mater. 2016, 105, 416–422. [Google Scholar] [CrossRef]
- Recybeton, Projet National Recybeton. Available online: http://www.pnrecybeton.fr (accessed on 2 January 2012).
- He, Z.-H.; Li, L.-Y.; Du, S.-G. Creep analysis of concrete containing rice husk ash. Cem. Concr. Compos. 2017, 80, 190–199. [Google Scholar] [CrossRef]
- Manzi, S.; Mazzotti, C.; Bignozzi, M.C. Short and long-term behavior of structural concrete with recycled concrete ag-gregate. Cem. Concr. Compos. 2013, 37, 312–318. [Google Scholar] [CrossRef]
- Tang, W.; Cui, H.; Wu, M. Creep and creep recovery properties of polystyrene aggregate concrete. Constr. Build. Mater. 2014, 51, 338–343. [Google Scholar] [CrossRef]
- Kou, S.C.; Poon, C.S.; Chan, D. Influence of Fly Ash as Cement Replacement on the Properties of Recycled Aggregate Concrete. J. Mater. Civ. Eng. 2007, 19, 709–717. [Google Scholar] [CrossRef]
- Ravindrarajah, R.S.; Tam, C.T. Properties of concrete made with crushed concrete as coarse aggregate. Mag. Concr. Res. 1985, 37, 29–38. [Google Scholar] [CrossRef]
- Tia, M.; Liu, Y.; Brown, D. Modulus of Elasticity, Creep and Shrinkage of Concrete; University of Flordia: Gainesville, FL, USA, 2009. [Google Scholar]
- Ghodousi, P.; Afshar, M.H.; Ketabchi, H.; Rasa, E. Study of Early-Age Creep and Shrinkageof Concrete Containing Iranian Pozzolans: An Experimental Comparative Study. Sci. Iran. 2009, 16, 126–137. [Google Scholar]
- Surya, M.; Rao, V.L.K.; Lakshmy, P. Mechanical, durability, and time-dependent properties of recycled aggregate concrete with fly ash. ACI Mater. J. 2015, 112, 653–661. [Google Scholar] [CrossRef]
- Ghorbel, E.; Wardeh, G.; Fares, H. Mechanical and fracture properties of recycled aggregate concrete in design codes and empirical models. Struct. Concr. 2019, 20, 2156–2170. [Google Scholar] [CrossRef]
- Geng, Y.; Wang, Y.; Chen, J. Creep behaviour of concrete using recycled coarse aggregates obtained from source concrete with different strengths. Constr. Build. Mater. 2016, 128, 199–213. [Google Scholar] [CrossRef]
| Model | Equation | Validity |
|---|---|---|
| EC2 * [24] | ||
| MC 2010 [25] | ; | |
| Standard | ||
| ACI 209.2R–08 [13] | ; c |
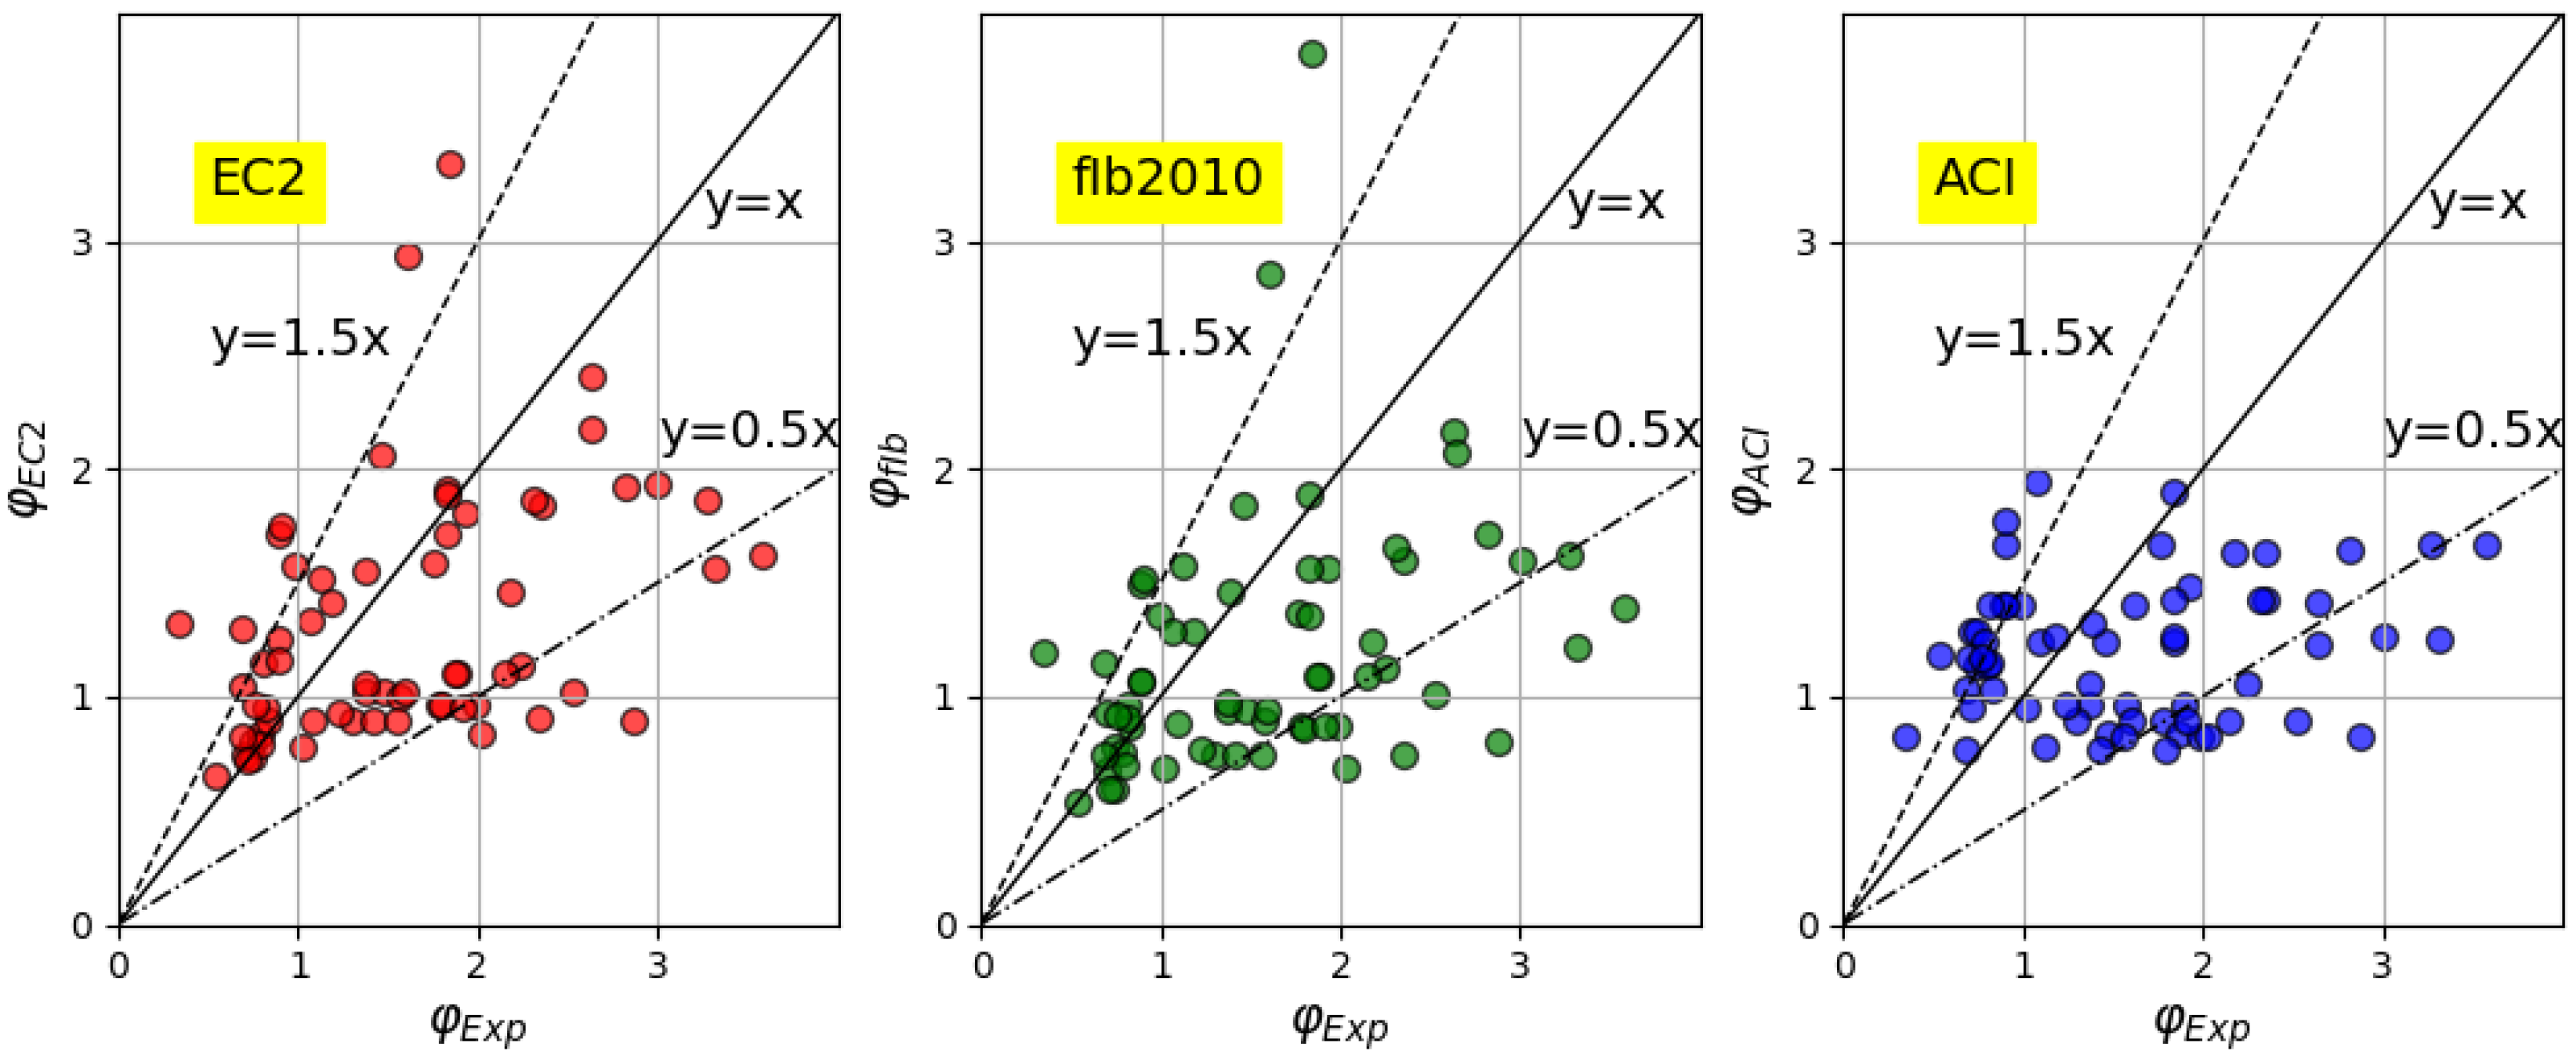
| Mean φ | Covariance, Cov | R² | |
|---|---|---|---|
| Experimental | 1.49 ± 0.7 | - | - |
| EC2 | 1.62 ± 0.82 | 0.093 | 0.49 |
| ACI 209.2R-08 | 1.21 ± 0.30 | 0.043 | 0.37 |
| MC 2010 | 1.60 ± 1.01 | 0.068 | 0.39 |
| Modified Models | Mean φ | Covariance, Cov | R² |
|---|---|---|---|
| Modified EC2 | 1.21 ± 0.69 | 0.41 | 0.81 |
| Modified ACI 209.2R-08 | 1.06 ± 0.77 | 0.52 | 0.77 |
| Without Modification | Modified Models | |||||
|---|---|---|---|---|---|---|
| Mean | Cov | R² | Mean | Cov | R² | |
| Experimental values | 1.43 ± 0.93 | |||||
| EC2 | 1.34 ± 0.65 | 0.49 | 0.62 | 1.36 ± 0.81 | 0.67 | 0.79 |
| ACI 209.2R-08 | 1.0 5± 0.63 | 0.51 | 0.56 | 1.13 ± 0.93 | 0.77 | 0.69 |
| CEB FIP 2010 | 1.2 ± 0.63 | 0.44 | 0.52 | - | - | - |
Publisher’s Note: MDPI stays neutral with regard to jurisdictional claims in published maps and institutional affiliations. |
© 2021 by the authors. Licensee MDPI, Basel, Switzerland. This article is an open access article distributed under the terms and conditions of the Creative Commons Attribution (CC BY) license (https://creativecommons.org/licenses/by/4.0/).
Share and Cite
Torres, P.P.; Ghorbel, E.; Wardeh, G. Towards a New Analytical Creep Model for Cement-Based Concrete Using Design Standards Approach. Buildings 2021, 11, 155. https://doi.org/10.3390/buildings11040155
Torres PP, Ghorbel E, Wardeh G. Towards a New Analytical Creep Model for Cement-Based Concrete Using Design Standards Approach. Buildings. 2021; 11(4):155. https://doi.org/10.3390/buildings11040155
Chicago/Turabian StyleTorres, Pablo Peña, Elhem Ghorbel, and George Wardeh. 2021. "Towards a New Analytical Creep Model for Cement-Based Concrete Using Design Standards Approach" Buildings 11, no. 4: 155. https://doi.org/10.3390/buildings11040155
APA StyleTorres, P. P., Ghorbel, E., & Wardeh, G. (2021). Towards a New Analytical Creep Model for Cement-Based Concrete Using Design Standards Approach. Buildings, 11(4), 155. https://doi.org/10.3390/buildings11040155