Article

Mechanical Behavior and Frost-Resistance of Alkali-Activated Cement Concrete with Blended Binder at Ambient Curing Condition

Structural Concrete Institute, Leipzig University of Applied Sciences (HTWK Leipzig), 04277 Leipzig, Germany
*
Author to whom correspondence should be addressed.
Buildings 2021, 11(2), 52; https://doi.org/10.3390/buildings11020052
Submission received: 28 December 2020 / Revised: 29 January 2021 / Accepted: 1 February 2021 / Published: 4 February 2021

Abstract

:
Concrete is the most commonly used construction material because of its various advantages, such as versatility, familiarity, strength, and durability, and it will continue to be in demand far into the future. However, with today’s sensitivity to environmental protection, this material faces unprecedented challenges because of its high greenhouse gas emissions, mainly during cement production. This paper investigates one of the promising cement replacement materials, alkali-activated cement (AAC) concrete. Being produced mainly from byproduct materials and having a comparable structural performance to conventional concrete, AAC concrete can transform the construction industry. Mechanical properties such as compressive and flexural strength and the relationship between them are studied. Different source materials such as fly ash (FA), ground granulated blast furnace slag (GGBS), silica fume (SF), and Metakaolin (MK) are used. The effect of the source materials and the activator solutions on the concrete performance is studied. Furthermore, the freeze-thaw resistance of the concrete is studied. The study results showed that the behavior of AAC depends highly on the source material combinations and type used. The effect of the alkaline solution is also dependent on the source material used. Mixes with higher GGBS content showed the highest strength, while mixes with MK showed the highest flexural strength. The freeze-thaw test results showed that proper design of AAC concrete with lower water content is critical to achieving a good resistance.

1. Introduction

Concrete is the most commonly used construction material, and because of its versatility, familiarity, strength, durability, and more, it will continue to be in demand far into the future. However, with today’s sensitivity to environmental issues, this material is facing unprecedented challenges. This is primarily related to its main binder, cement. Global cement production has increased more than 30-fold since 1950 and almost four-fold since 1990 [1]. The production of cement requires the combustion of limestone, which releases CO2 into the atmosphere. Despite the various progress made to improve the cement production efficiency, about a ton of CO2 is released for every ton of cement production [2]. The cement industry, therefore, contributes about 8% of the global CO2 emission [1]. This has led the scientific community to look for a binder with less environmental footprint.
Alkali-activated cement (AAC) concrete is finding momentum in the construction industry because of its environmental advantages and comparable structural performance to conventional concrete. AAC concrete is a concrete produced from industry byproduct materials such as fly ash and slag. It has highly desirable characteristics such as high strength, excellent fire resistance, and acid resistance [3,4,5,6]. Most importantly, AAC is much more environmentally friendly than conventional concrete because of its zero cement consumption.
The behavior of AAC concrete depends on various parameters of the concrete mixture. One such parameter is the aluminosilicate source material used. Fly ash (FA), ground granulated blast furnace slag (GGBS), metakaolin (MK), silica fume (SF), rice husk ash (RHA), and other similar alumina and silica-rich materials have been successfully used for AAC [7,8,9,10]. Because of the different chemical composition, fineness, particle shape, and other material specific behaviors, AAC’s performance vary with the source material used. Despite the various studies on AAC’s behavior and performance containing the individual source materials [11,12,13,14,15], there is only limited research on AAC ’with blended binder systems. Moreover, most of the available literature is in the area of heat-cured AAC concrete systems with limited research in ambient-cured AAC systems with a blended binder.
Hadi et al. [16] observed that the inclusion of FA, MK, and SF as partial replacement of GGBS reduced the compressive strength while increasing the setting time and workability of ambient-cured AAC concrete. Similarly, Fang et al. [17] reported a decrease in workability and setting time with the increase of GGBS content in FA-GGBS-based AAC concrete. Rajamma et al. [18] found adding MK to FA-based mortar increased the compressive strength of the heat-cured AAC concrete. Samson et al. [19] performed a detailed investigation on the setting time, mass loss, shrinkage, and compressive strength of ambient-cured AACs with blended binder systems. Their results showed that MK-GGBS-blended source materials result in high early strength, and the association of MK and GGBS in the right proportion enables to reduce shrinkage significantly. These studies reveal that optimum design of concrete mixture is possible by mixing two or more source materials. However, more information on the mechanical behavior, specifically flexural strength and durability, such as frost resistance of such blended binder systems at ambient temperature, are still required.
For understanding the potential of blended binder systems cured at ambient temperature, a research program was initiated at the Structural Concrete Institute to study the effect of combinations of FA, GGBS, MK, SF, and RHA. Both mechanical performance and durability aspects of the AAC concrete are studied. The effect of mix proportion parameters on compressive and flexural strength and the relationship between them are studied. In terms of durability, the freeze-thaw resistance is studied.

2. Experimental Program
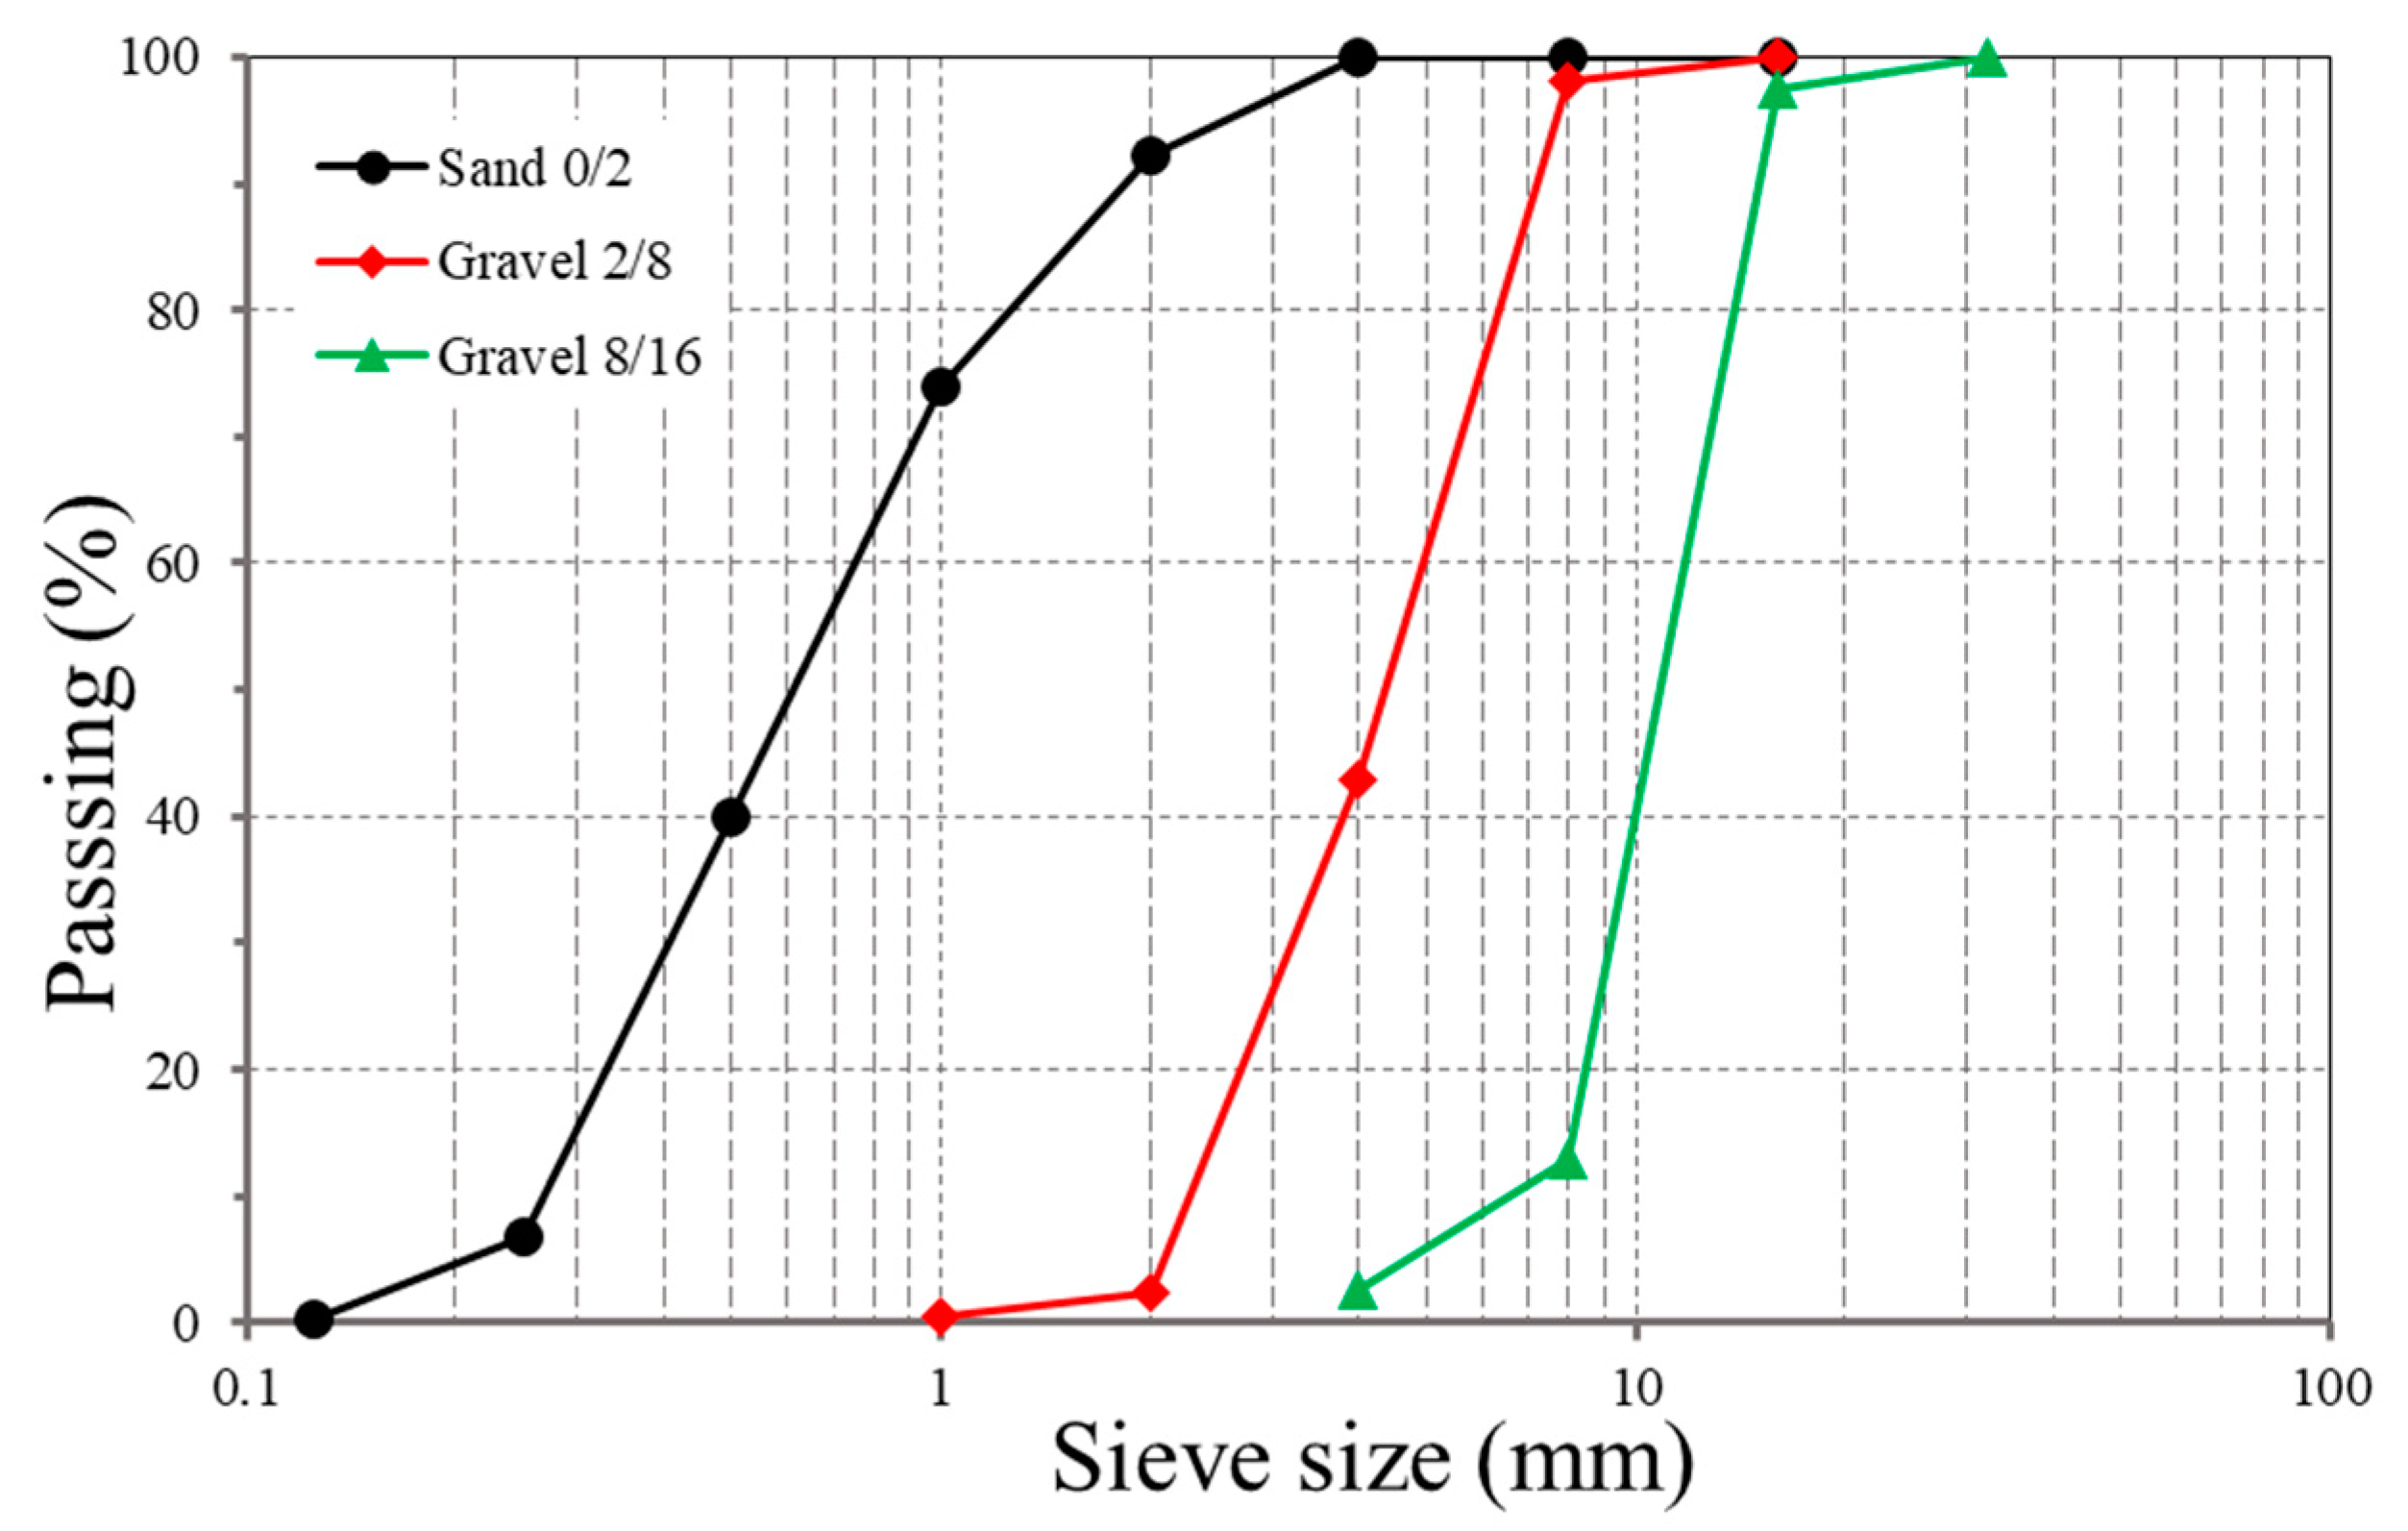
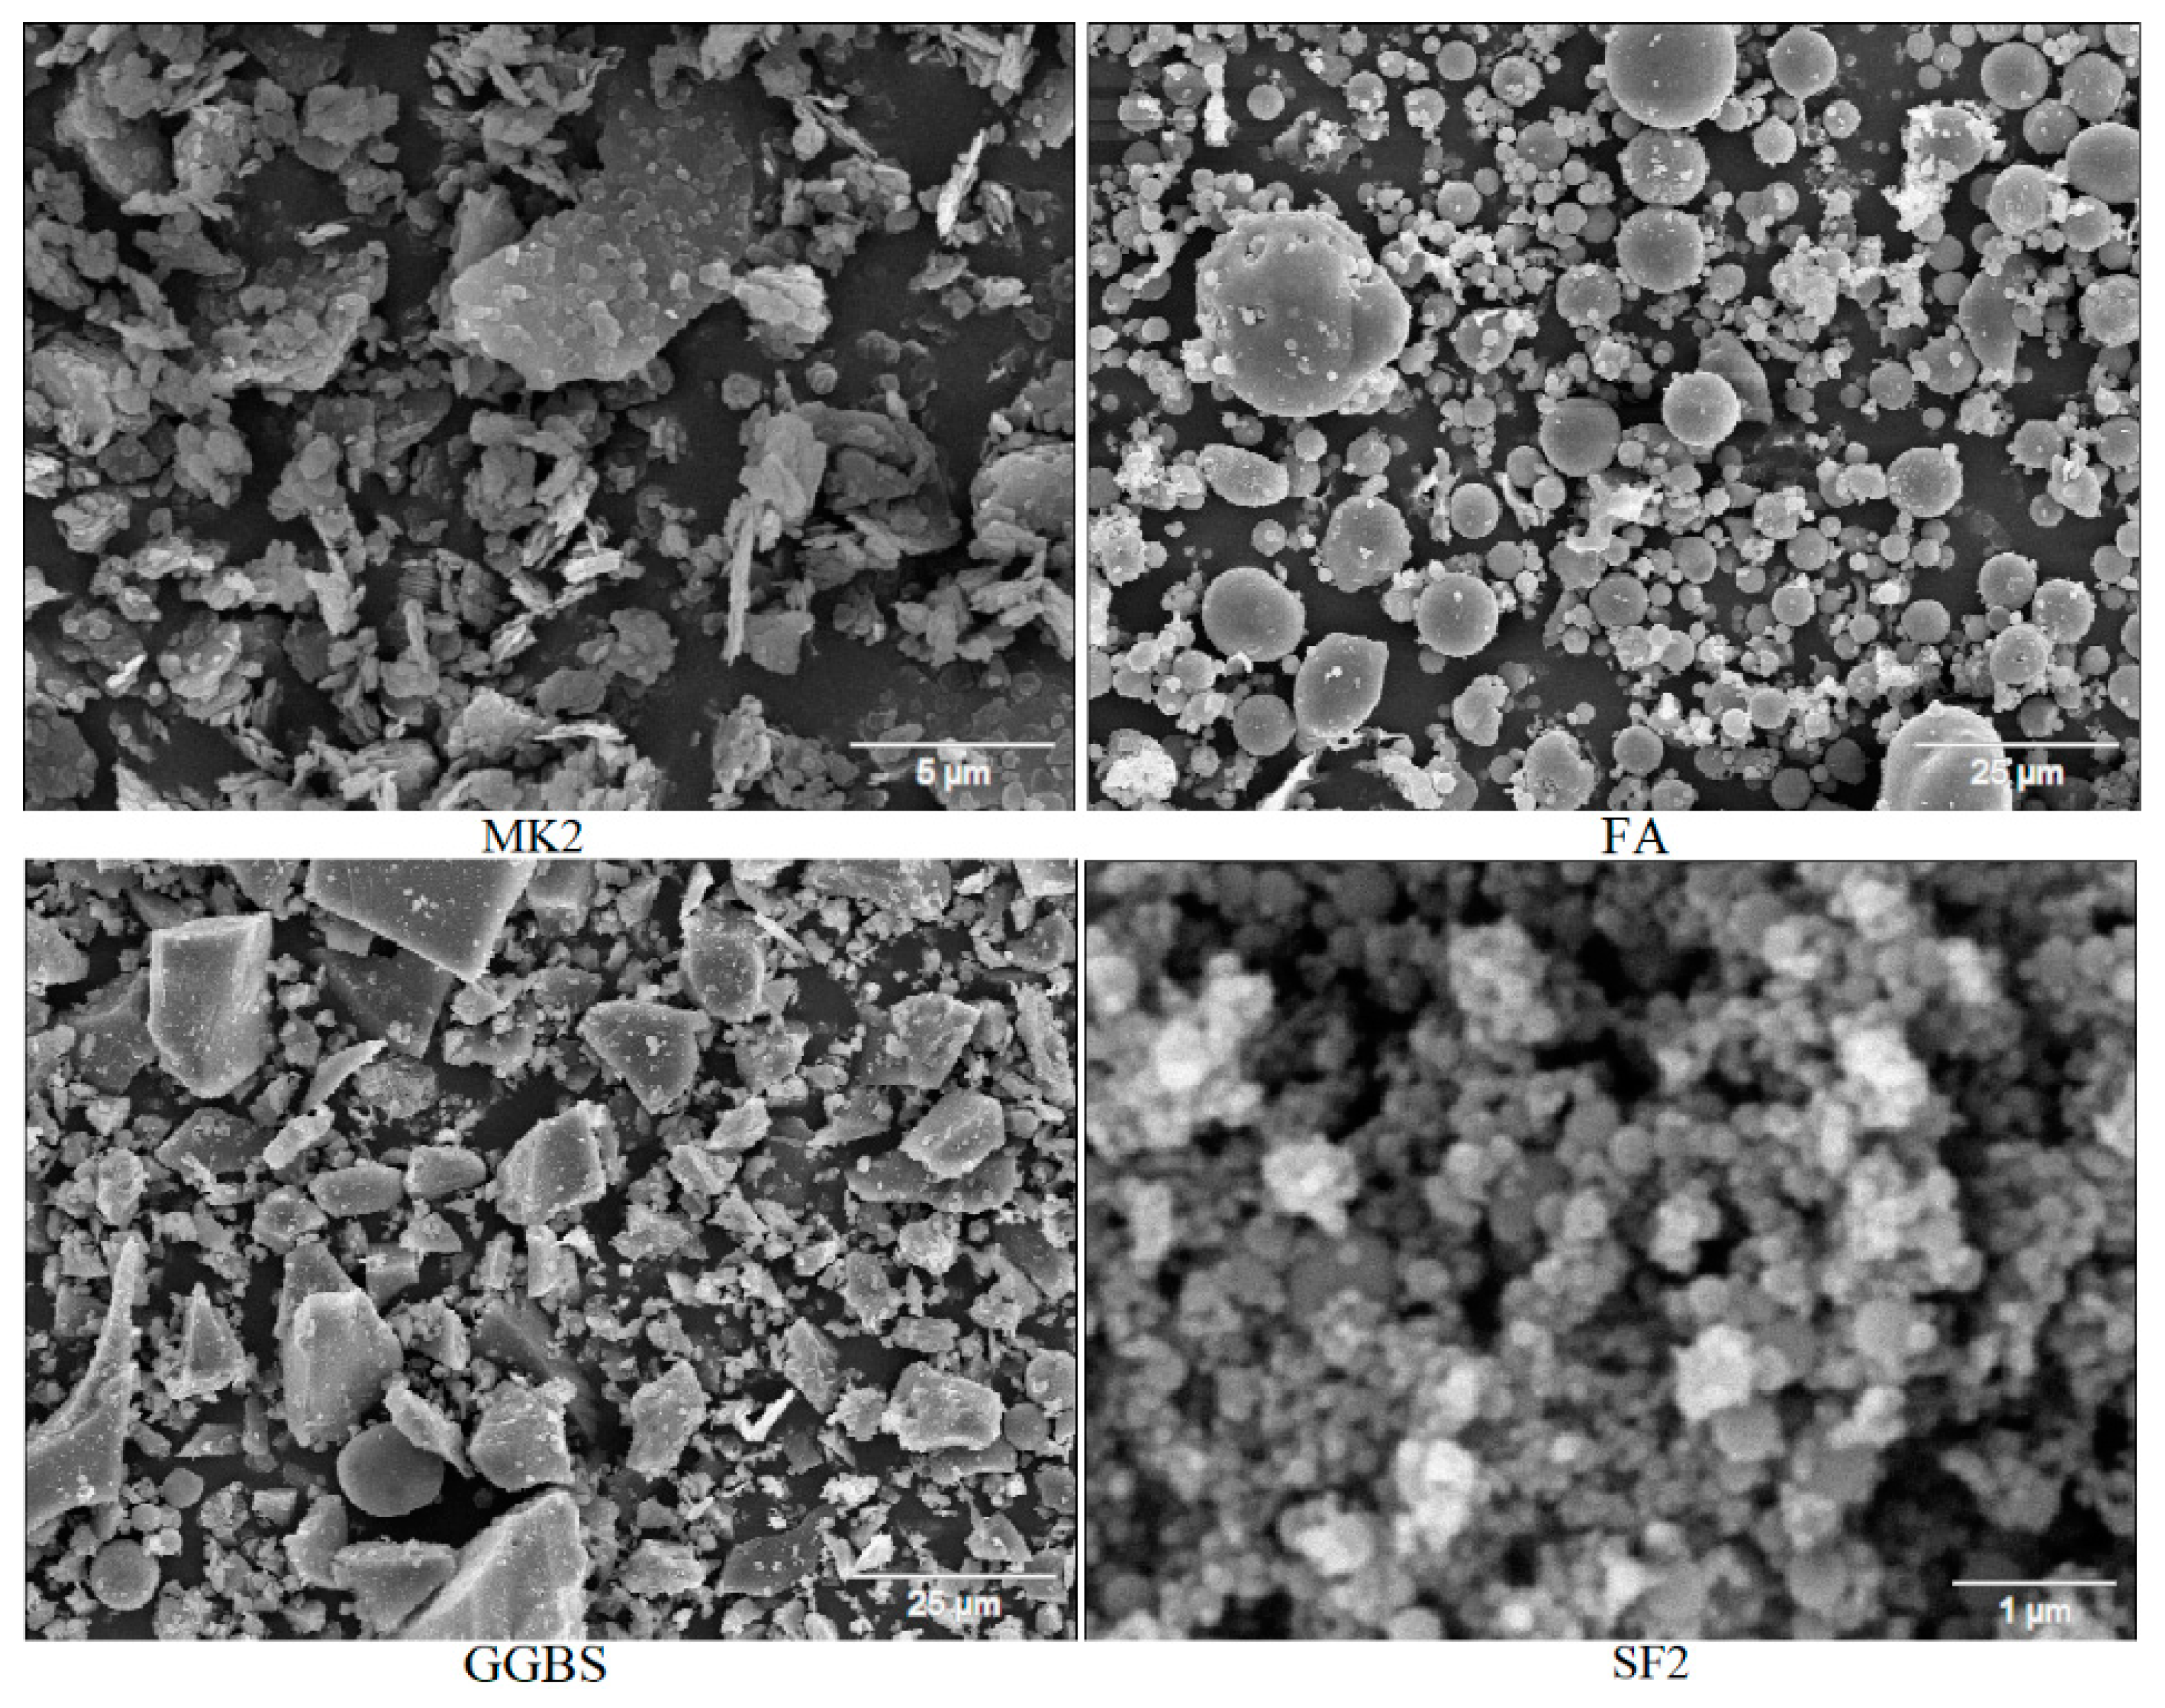
2.1. Materials

Fly ash (FA), ground granulated blast furnace slag (GGBS), silica fume (SF), metakaolin (MK), and rice husk ash (RHA) were used as the source materials. Two types of SF, SF1 and SF2 and two MK, MK1 and MK2 were used. The chemical compositions of these source materials are summarized in Table 1. The activator solution used is a mixture of sodium silicate and sodium hydroxide. The sodium silicate solution included 26.82% silicate, 8.2% sodium oxide, and 64.98% water. The sodium hydroxide was a 50% by weight solution. Furthermore, a fine aggregate with a maximum size of 2 mm and a coarse aggregate with a maximum size of 8 mm was used. A 16 mm coarse aggregate was also used for the freeze-thaw resistance specimens. In the case of 8 mm maximum aggregate size, 40% fine and 60% coarse aggregate proportion was used, while in the case of 16 mm, 40% fine, 30% 2/8 gravel, and 30% 8/16 gravel was used. The aggregate grading curve for each of the aggregate is as shown in Figure 1.
Figure 2 shows the scanning electron microscope (SEM) image of some of the source materials.

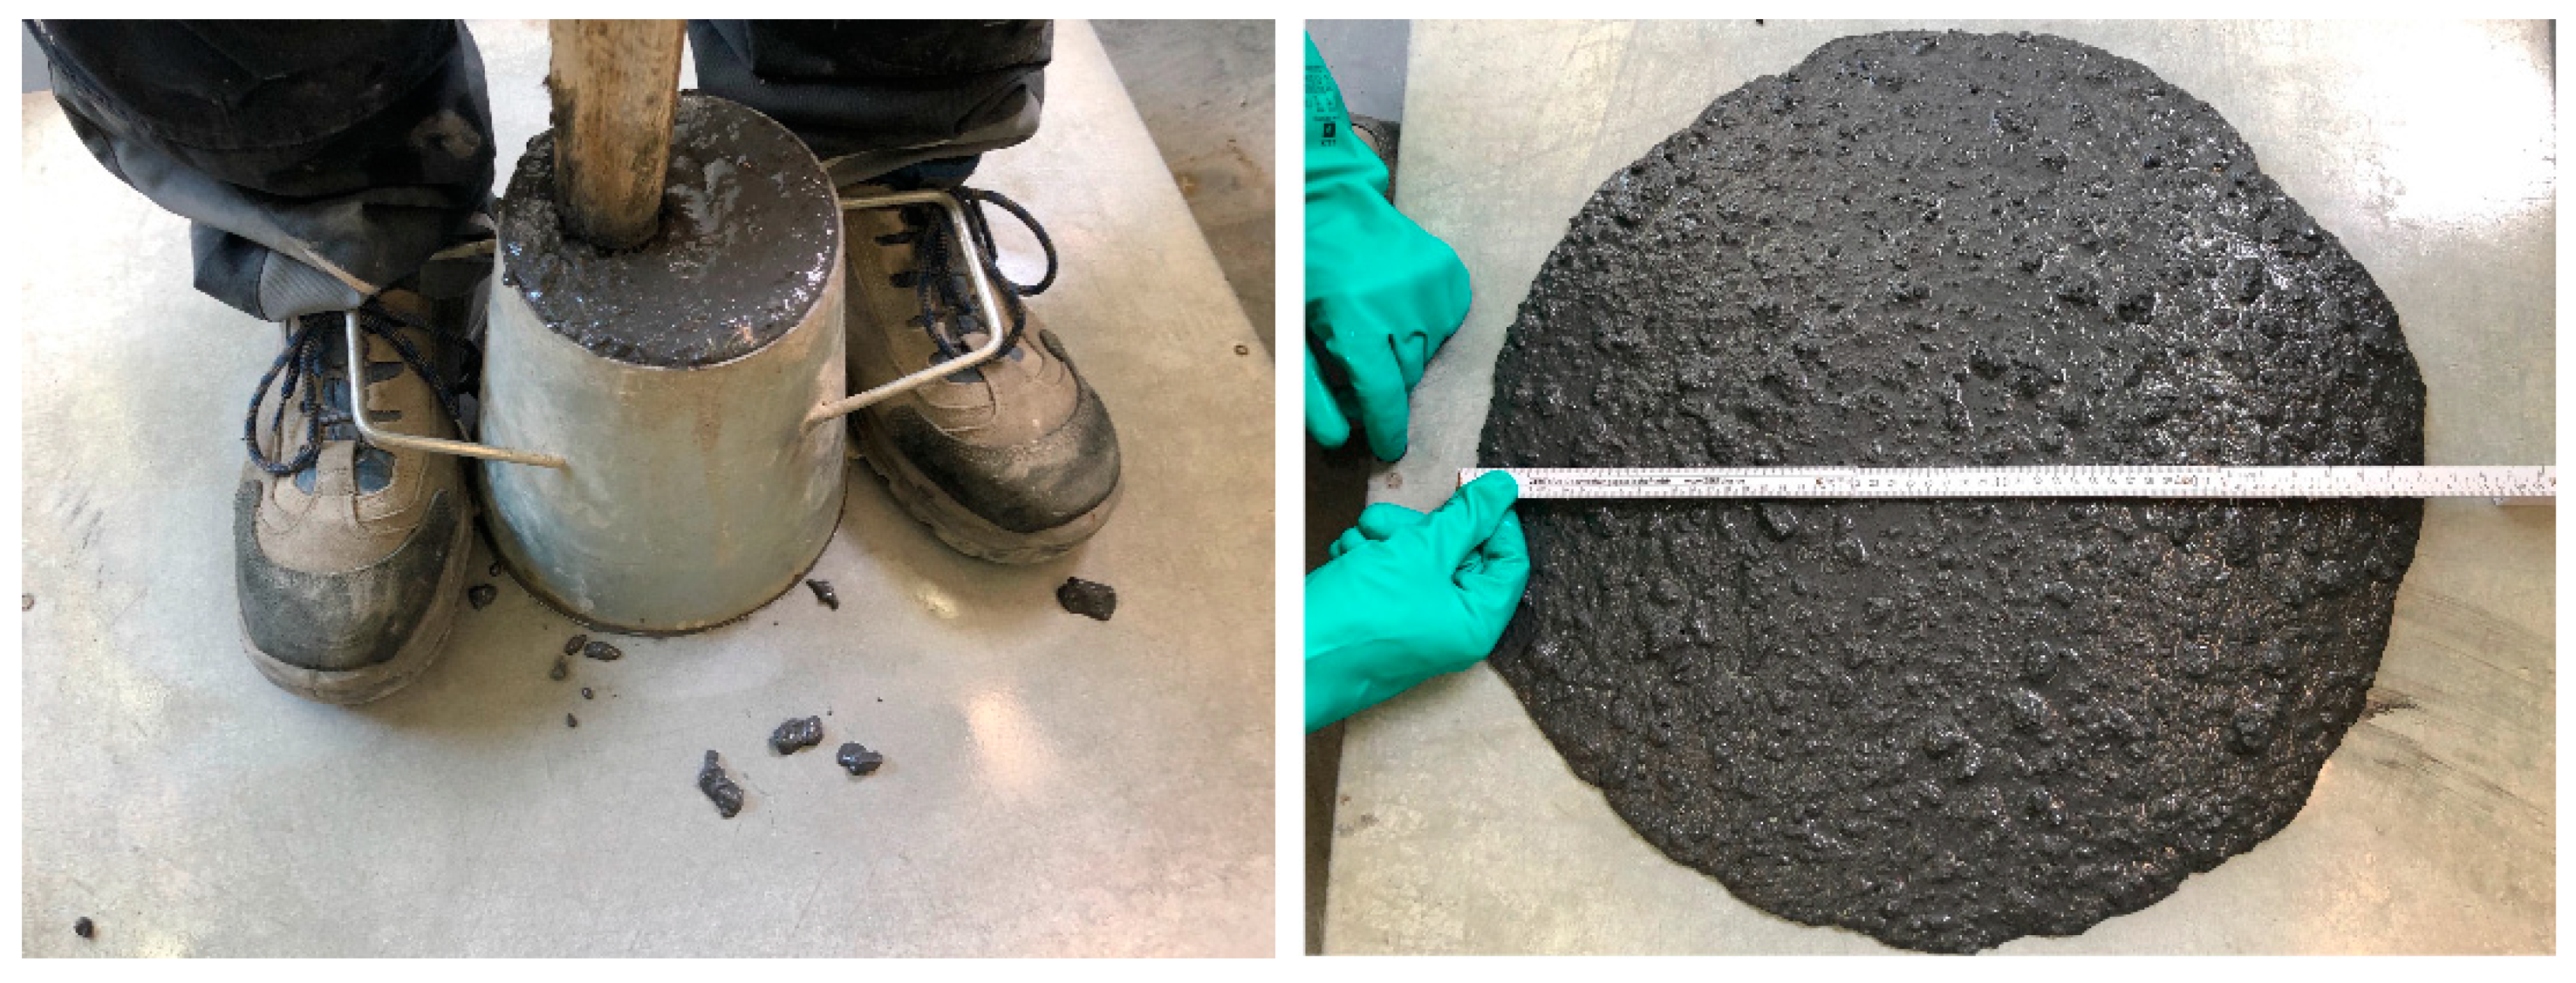
2.2. Specimen Preparations and Test Methods

The sodium silicate and sodium hydroxide solutions were mixed in the required proportion at least 24 h before mixing to bring the solution to room temperature. During mixing, care was taken to keep the temperature below 40 °C to prevent precipitation of solids, which was observed when the temperature was higher. AAC specimens were prepared by first mixing the dry materials (sand and binder) in a mixer for about two minutes. Afterward, the prepared alkaline solution was mixed with the additional water, added slowly to the dry mixture, and mixed for about four minutes. The freshly mixed concrete with a maximum aggregate size of 8 mm was then placed into 40 mm × 40 mm × 160 mm prisms or 150 mm cubes in case of 16 mm aggregates for compressive and flexural or splitting tensile strength tests. Three specimens were prepared for each of the mixes. These specimens were cast in two layers, and each layer was vibrated. After casting, the specimens were left in the lab covered with plastic for the first 24 h. After demolding, the specimens were placed in water at room temperature until the test day. The flexural strengths of the prisms were measured according to DIN EN 196-1 [21]. The compressive strength was then measured on the six fractured portions of the prisms as per the same standard. The tests were carried out on the 7th and 28th day. Freeze-thaw resistance was tested according to DIN EN 12390-9 [22] using the capillary suction of deionized water and the freeze-thaw test (CIF) method. Two different mixes were investigated, and for each mix, five samples were tested. The scaled mass was measured at 14, 28, 42, and 56 cycles for each sample.

2.3. Mix Proportions

To understand the influence of the mix proportion, different AAC concrete mixtures were designed and tested. These mixes are divided into three main groups based on the main source material used, i.e., FA, GGBS, and MK. In addition to the source material, the amount of the activator, the water content, and the type of the source material (different type of MK and SF) were also varied to understand their effect. The total source material content was kept at 400 kg/m3, while the ratio of the sodium silicate and sodium hydroxide solutions was kept at 2.5. Table 2, Table 3 and Table 4 summarize the mix proportions for FA-, GGBS-, and MK-based concretes. In these tables, AS/B means the ratio of the total alkaline solid to the total source materials, and TW/TS means the ratio of the total water (water from the alkaline solutions and the free water) to the total solids in the binder system (solids from the alkaline solution plus the source materials). All the mixes have a maximum aggregate size of 8 mm, with the exceptions shown in Table 2 and Table 3.
As concrete’s workability is of high importance for application, the mixes were targeted at getting good workability in the range of F4 and F5 according to DIN EN 206 [23]. Figure 3 shows G50M33R17-11 mix during the workability assessment.

3. Results and Discussions

The experimental program results for 7-day and 28-day compressive strength and flexural strength are summarized in the mix design tables, Table 2, Table 3 and Table 4. The following sections present the analysis and discussion on the results.

3.1. Effect of Parameters

The water content and the alkaline to binder ratios were varied in addition to the source materials and the type of source materials. The water content, investigated by TW/TS ratio, has a negative effect on the strength of the concrete. This is due to the porous structure the water leaves after evaporation. The effect of the alkaline content, which was investigated by AS/B ratio, was dependent on the type of source material used. The influence of source material and alkaline content is investigated in detail in the following section.

3.1.1. Effect of Source Material

Out of the FA-, GGBS-, and MK-based mixes, the GGBS-based mixes resulted in the highest strength. G52M30R18-8 with 0.26 AS/B and 0.49 TW/TS resulted in a 7 and 28-day strength of 41.46 and 64.14 MPa, respectively. F63G37-2 with the same AS/B and 0.43 TW/TS resulted in a 7 and 28-day strength of 34.48 and 52.90 MPa, respectively. The higher strength of G52M30R18-8, despite its higher water content, shows the influence of GGBS on the strength. The effect of GGBS can also be observed by comparing mix F63G37-1 and F80G20-6. Mix F63G37-1 showed higher strength than mix F80G20-6 despite its higher TW/TS ratio, the main cause being its higher GGBS content. This is due to the high CaO content of GGBS. An increase in CaO content leads to mixed phases of aluminosilicate polymer networks and hydrate phases such as calcium silicate hydrates (C–S–H)-phases [24,25]. Depending on the CaO content, the reaction products can be dominated by either aluminosilicate network or C–S–H. A CaO content between 20–40% leads to a mixed system, and over 40% leads to C–S–H dominated reaction products [26]. Higher CaO content results in improved mechanical properties such as high early strength and final strength which is observed in the mixes with GGBS in this study [24]. The incorporation of MK is another reason for the higher strength of the mixes with GGBS and MK as in G52M30S18 mixes. MK is rich in Al2O3, which in general has a positive effect on the strength [27,28].
Two types of MK, MK1, and MK2 were used. Mixes with MK2 resulted in higher strength. This can be observed by comparing mix M75S25-4 and 5. Here mix M75S25-5 with MK1 had low compressive strength. The mix was still in the plastic state after 24 h showing the slow development of compressive strength. Mix M75S25-4 with MK2, on the other hand, resulted in a much higher compressive strength. The effect of MK2 can also be observed by comparing G52M30S18-4 and 5, where the use of MK2 in G52M30S18-5 resulted in higher strength. MK2 has a considerably smaller average particle size, as shown in Table 1, resulting in an enhanced reactivity, hence a better strength. Furthermore, MK2 also has a high amount of Al2O3 compared to MK1. Higher Al2O3 content increases the compressive strength of the MK-based geopolymer concrete, as reported by Kuoamo [27]. Hence, higher Al2O3 could also be another reason for the higher strength of mixes with MK2.
Two types of SF were used, SF1 and SF2. As can be observed from G52M30S18-1 and G52M30S18-5 mixes, SF1 resulted in a higher strength than SF2. The combination of SF1 and MK2 (G52M30S18-5) resulted in the highest strength of all the mixes investigated in this study. In terms of chemical composition, SF1 and SF2 show no significant difference. The higher performance of SF1 could be from other factors such as fineness, morphology, or reactivity.
Source materials have a critical effect on the performance of the AAC concrete. In addition to the proportion of the source materials, the source materials’ type also significantly affects the concrete’s behavior. This is so because different types of the same class of source materials can have different physical and chemical behaviors.

3.1.2. Effect of Alkaline Solution

The binder content and the silicate to hydroxide solutions ratio are kept constant at 400 kg/m3 and 2.5, respectively. The only variables in addition to the type and proportion of the source materials are the AS/B and the TW/TS ratios. The TW/TS ratio increase has a negative effect on the strength because of the increase in pore volume with water in the hardened concrete [29]. The AS/B ratio, on the other hand, did not show a consistent trend. This is because this ratio’s effect depends on the type of source material used and the value of the ratio. Different source materials are known to consume different amounts of alkali [19]. At lower AS/B ratios, the strength increases with the increase of the ratio; however, after an optimum level for that specific source material is attained, strength decreases with the increase of the ratio [30,31]. In G52M30S18-1 to 3 mixes, the compressive strength first increased when the AS/B increased from 0.25 to 0.29 and then decreased as AS/B further increased to 0.33. In the case of F63G37 mixes, the increase of the AS/B ratio from 0.21 to 0.26 resulted in a slight decrease in the strength of the concrete. However, for F80G20-6 to 8 mixes, the increase in the AS/B ratio from 0.21 to 0.25 and further to 0.28 increased both the 7 and 28-day strengths showing that the AS/B required varies depending on the source material. Such behaviors were also observed by Samson et al. [19].

3.2. Strength Development

Strengths were measured at 7 and 28 days. The strength development over this period, i.e., the 28-day strength ratio to the 7-day strength, has been found to vary with the type of source materials used. In the case of mixes with GGBS, this ratio increased as the percent of GGBS decreased. For instance, in the case of FA and GGBS mixes, a 20% GGBS as in F80G20 resulted in an average ratio of 1.69, while a 37% GGBS as in F63G37 resulted in a lower ratio of 1.49. In G52M30S18 mixes, a higher GGBS percentage was used, which resulted in an even lower ratio of 1.31, meaning a higher early strength, as can be observed from Table 3. A high early strength was also observed by Samson et al. [19] in the case of MK-GGBS mixes. In the case of M75S25 mixes, a ratio of 1.22 was found.
GGBS has the highest CaO content than all the other source materials, as shown in Table 1. The high CaO content increases the early formation of calcium silicate hydrate (C–S–H) in addition to aluminosilicate polymer networks resulting in mixed phase hydrates and aluminosilicates [24,25]. This, in turn, results in a higher early age strength. Hence the concrete, in the case of high GGBS, attains its strength early, resulting in a lower 28-day to 7-day strength ratio. The high Al2O3 content of MK can also facilitate the early reaction between the source materials and the alkaline solution resulting in a higher early strength hence a lower strength ratio similar to GGBS.
The AS/B ratio also affected the strength development. The increase of AS/B, as can be observed in mixes G52M30S18-1 to 3, significantly reduced the 28-day to 7-day strength ratio. Similar trends can be observed for F80G20-6 to 8 and M75S25-1 and 2 mixes. This is because a high activator content facilitates early dissolution of the source materials resulting in high early strength. Higher water content can also facilitate the dissolution of the source materials resulting in a higher relative early age strength and a lower ratio of 28-day to 7-day strength. This can be observed by comparing F63G37-1 and 3 as well as G52M30-3 and 8. In the case of F63G37, for instance, at the same AS/B ratio, the TW/TS ratio increased from 0.43 to 0.50, and the respective strength ratio decreased from 1.58 to 1.35.

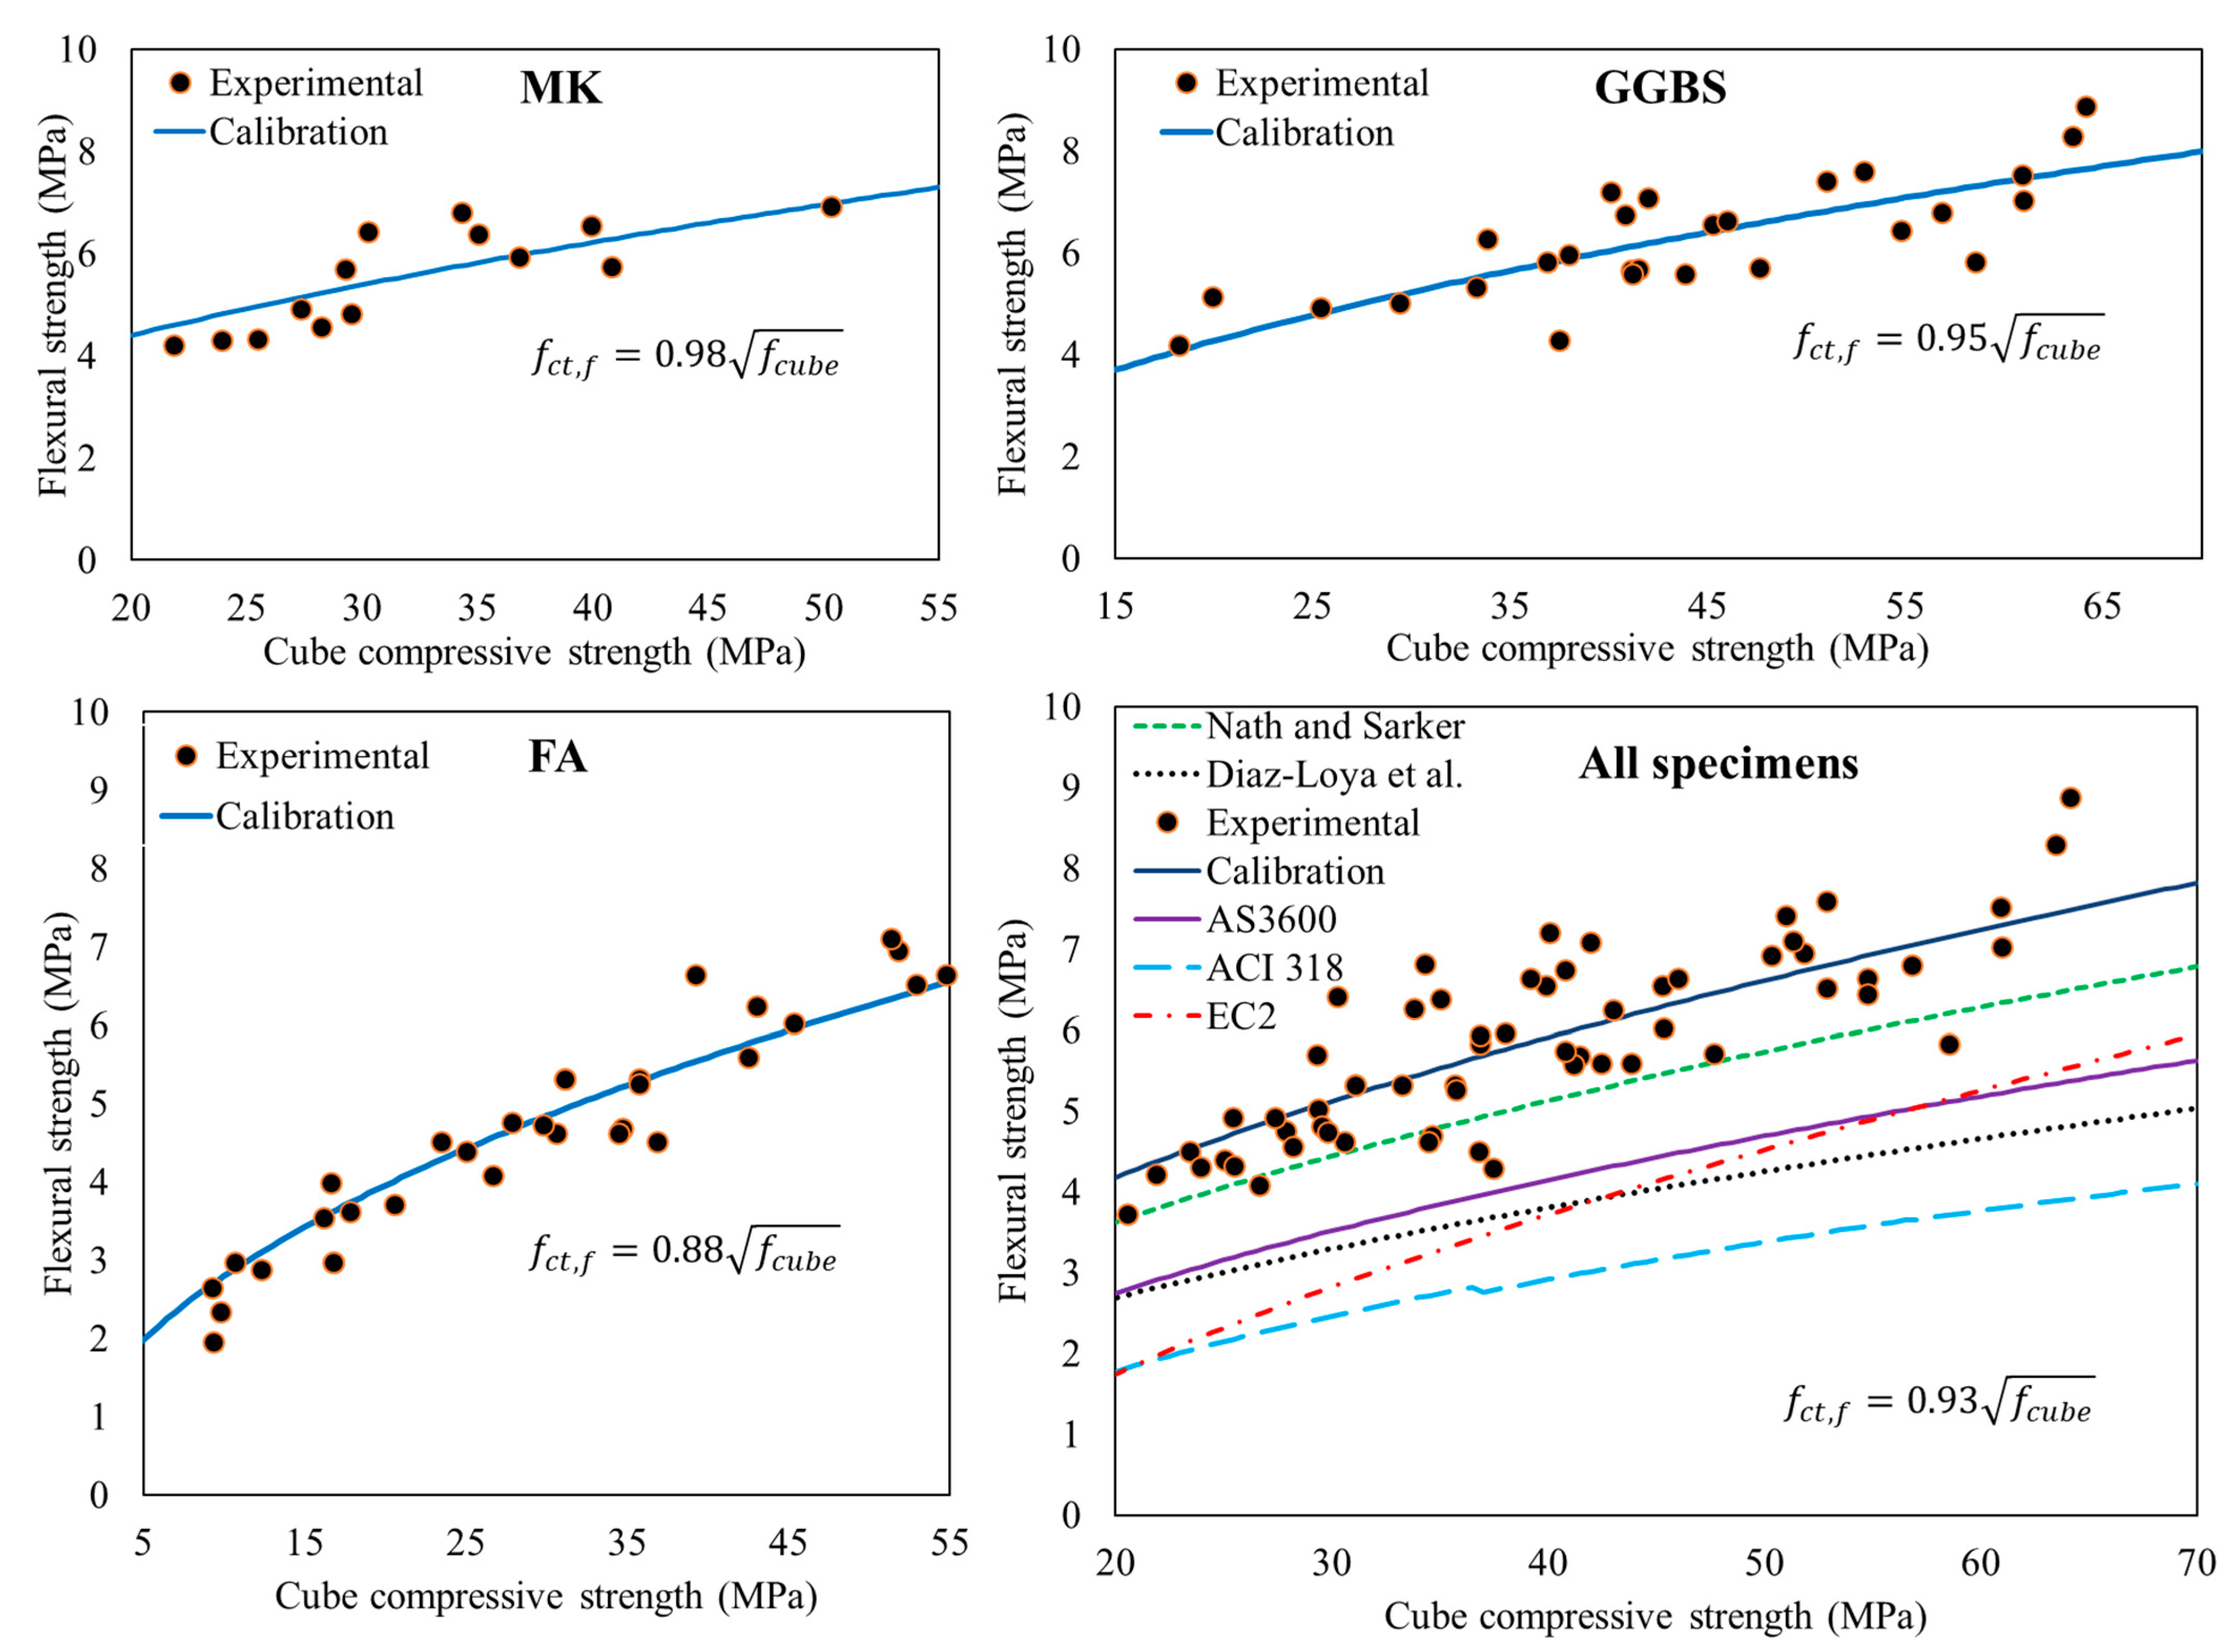
3.3. Flexural Strength

The flexural strength of concrete is another important mechanical property representing the material’s ability to resist bending. It is highly related to the compressive strength of the concrete. Various standards give recommendations on the relationship between the flexural strength and compressive strength for ordinary Portland cement (OPC) concrete. In this study, the ACI 318, AS 3600, and EC 2 are used to predict the flexural strength of ambient-cured AAC concrete [32,33,34].
ACI 318 recommends Equation (1) as the relationship between flexural strength ( f ct , f ) and characteristic cylinder compressive strength ( f c ). The relationship between the characteristic strength and the mean compressive strength ( f cm ) are given by Equations (2)–(4). In all the following equations, Equations (1)–(12), stress is in MPa and length in mm.
f ct , f = 0.62 f c
f c = f cm 7   ( MPa )   for   f c < 21   MPa  
f c = f cm 8.3   ( MPa )   for   21 < f c 35   MPa
f c = ( f cm 5.0   ( MPa ) ) / 1.1   for   f c > 35   MPa
AS 3600 uses Equation (5) to calculate the characteristic flexural strength ( f ct , f ) of concrete. The mean value of the flexural strength as per this standard is determined by multiplying the characteristic value by 1.4. The relationship between the mean compressive strength and the characteristic strength is given by Equation (6) for a concrete grade in the range of 25 to 65 MPa.
f ct , f = 0.6 f c
f c = 0.9 f cm 3   ( MPa )
For characteristic cylinder strength less than 50 MPa, EC 2 recommends Equation (7) to calculate the flexural strength from the mean axial tensile strength ( f ctm ), where h is the total depth of the flexural specimen in mm (40 mm) and f ctm as per the same standard is given by Equation (8). For characteristic strengths greater than 50 MPa, the standard recommends Equation (9). The relationship between the mean compressive strength and the characteristic strength is given by Equation (10).
f ct , f = max { ( 1.6 h 1000 ) f ctm ; f ctm }
f ctm   = 0.3 f c 2 / 3
f ctm = 2.12 × ln ( 1 + ( f cm 10 ) )
f c = f cm 8
Researchers have also developed empirical equations to estimate the flexural strength from compressive strength by calibrating experimental results. Diaz-Loya [35] and Gomaa et al. [36] developed an equation for heat-cured AAC, while Nath and Sarker [37] developed the same for ambient-cured AAC. For comparative purposes, Equations (11) and (12), developed respectively for heat-cured AAC by Diaz-Loya [35] and for ambient-cured AAC by Nath and Sarker [37], are used in the current study.
f ct , f = 0.69 f cm
f ct , f = 0.93 f cm
As the specimens’ size and shape in the above studies and standards are different from the current study, all the equations were first converted to flexural strength as a function of cube strength based on the current study’s specimen size. A conversion factor of 0.76 from cube (40 mm) to cylinder (100 mm diameter by 200 mm height) based on Yi et al. [38] study was used. The resulting relationship for cube compressive strength vs. flexural strength is shown in Figure 4 (additional results from trial mixes are also used in developing these relationships).
As can be observed in Figure 4, the flexural strength’s experimental values are higher than the predicted values for all the standards investigated. From the standards, AS 3600 resulted in a better prediction of the flexural strength. The equation developed for heat-cured concrete underpredicted the flexural strength of the ambient-cured AAC of this study. It showed a better performance compared to the ACI 318 standard, but the AS 3600 performed better. Equation (12) was found to be the best performing one.
A least-square optimization was also performed on the experimental results for each of the MK-, GGBS-, and FA-based mix and for all the mixes together. As shown in Figure 4, a variation was observed on the calibration coefficient between the different mix types. MK-based mixes resulted in the highest flexural strength, which is approximately the square root of the cube compressive strength. On the other hand, the FA-based mixes resulted in the lowest flexural strength, which is about 0.88 times the square root of the cube compressive strength. This could be due to the particle shape of the source materials. MK as can be seen in Figure 2 has a plate-like morphology while FA has a spherical morphology. Equation (12), when converted to cube strength, has a coefficient of 0.81. This is close to the FA-based mixes than the other mixes. This is because Nath and Sarker’s [37] mixes are FA-based concretes, with a minimum of 85% FA and a maximum of 15% GGBS.

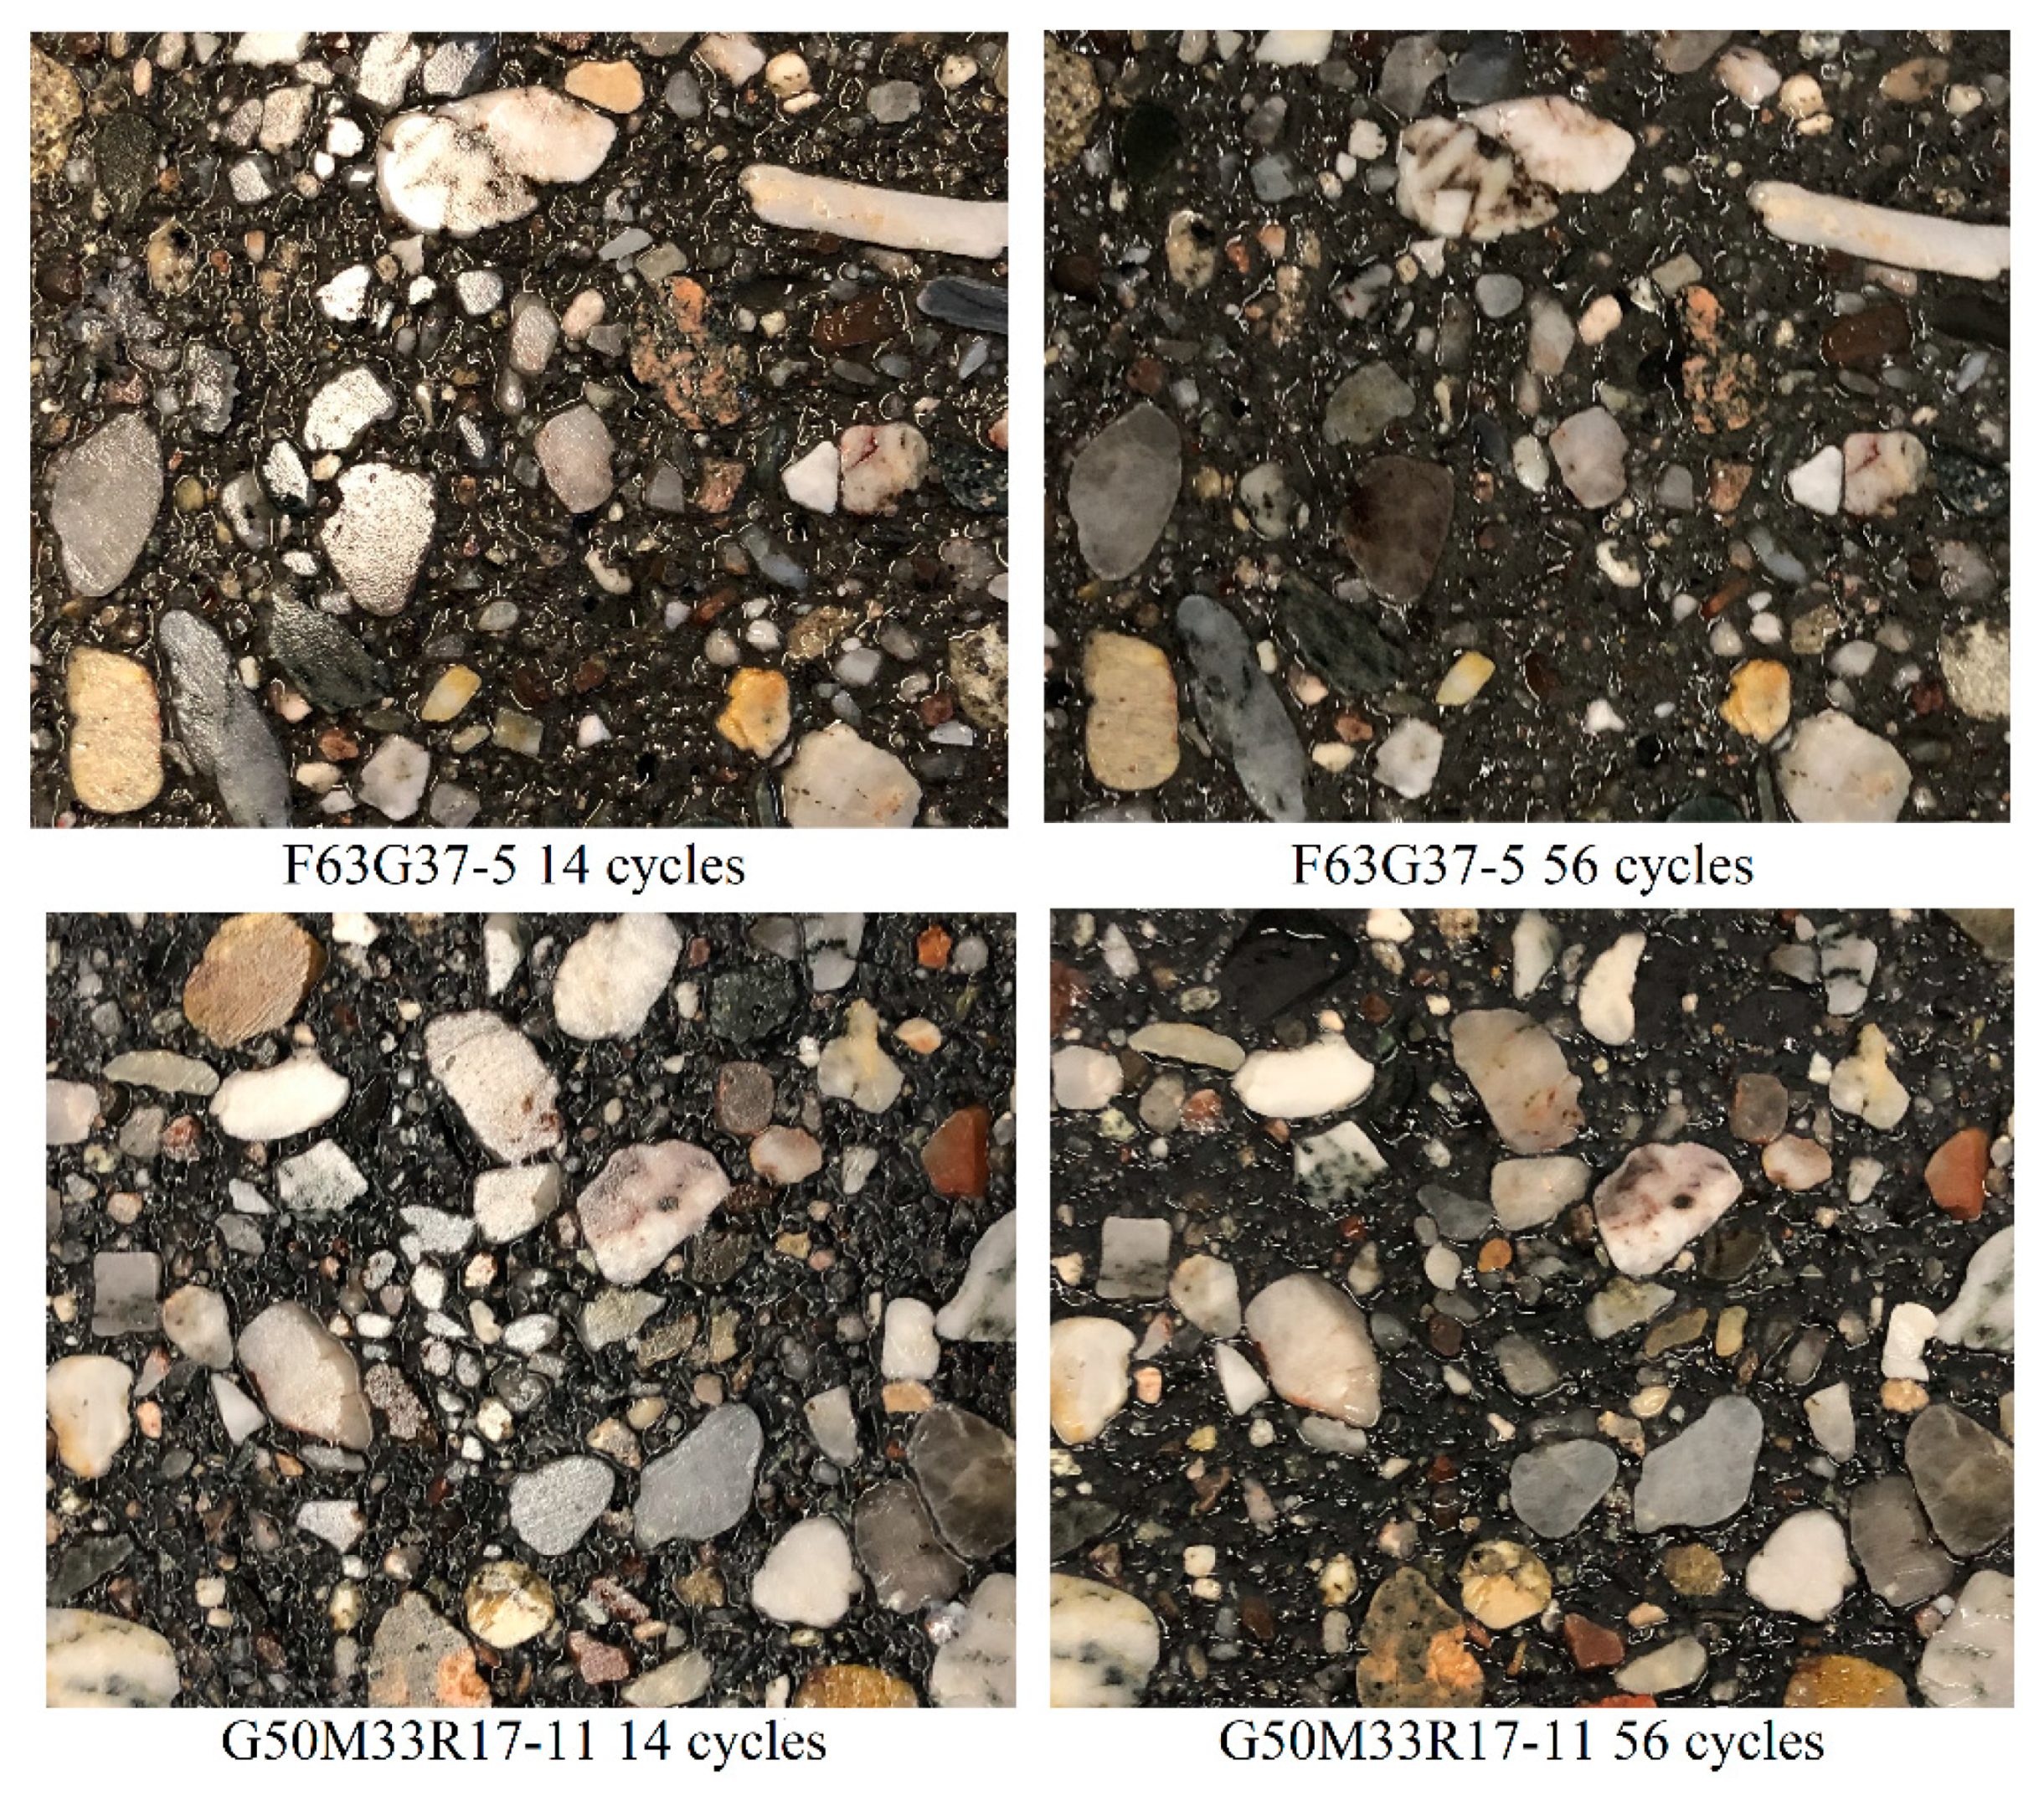
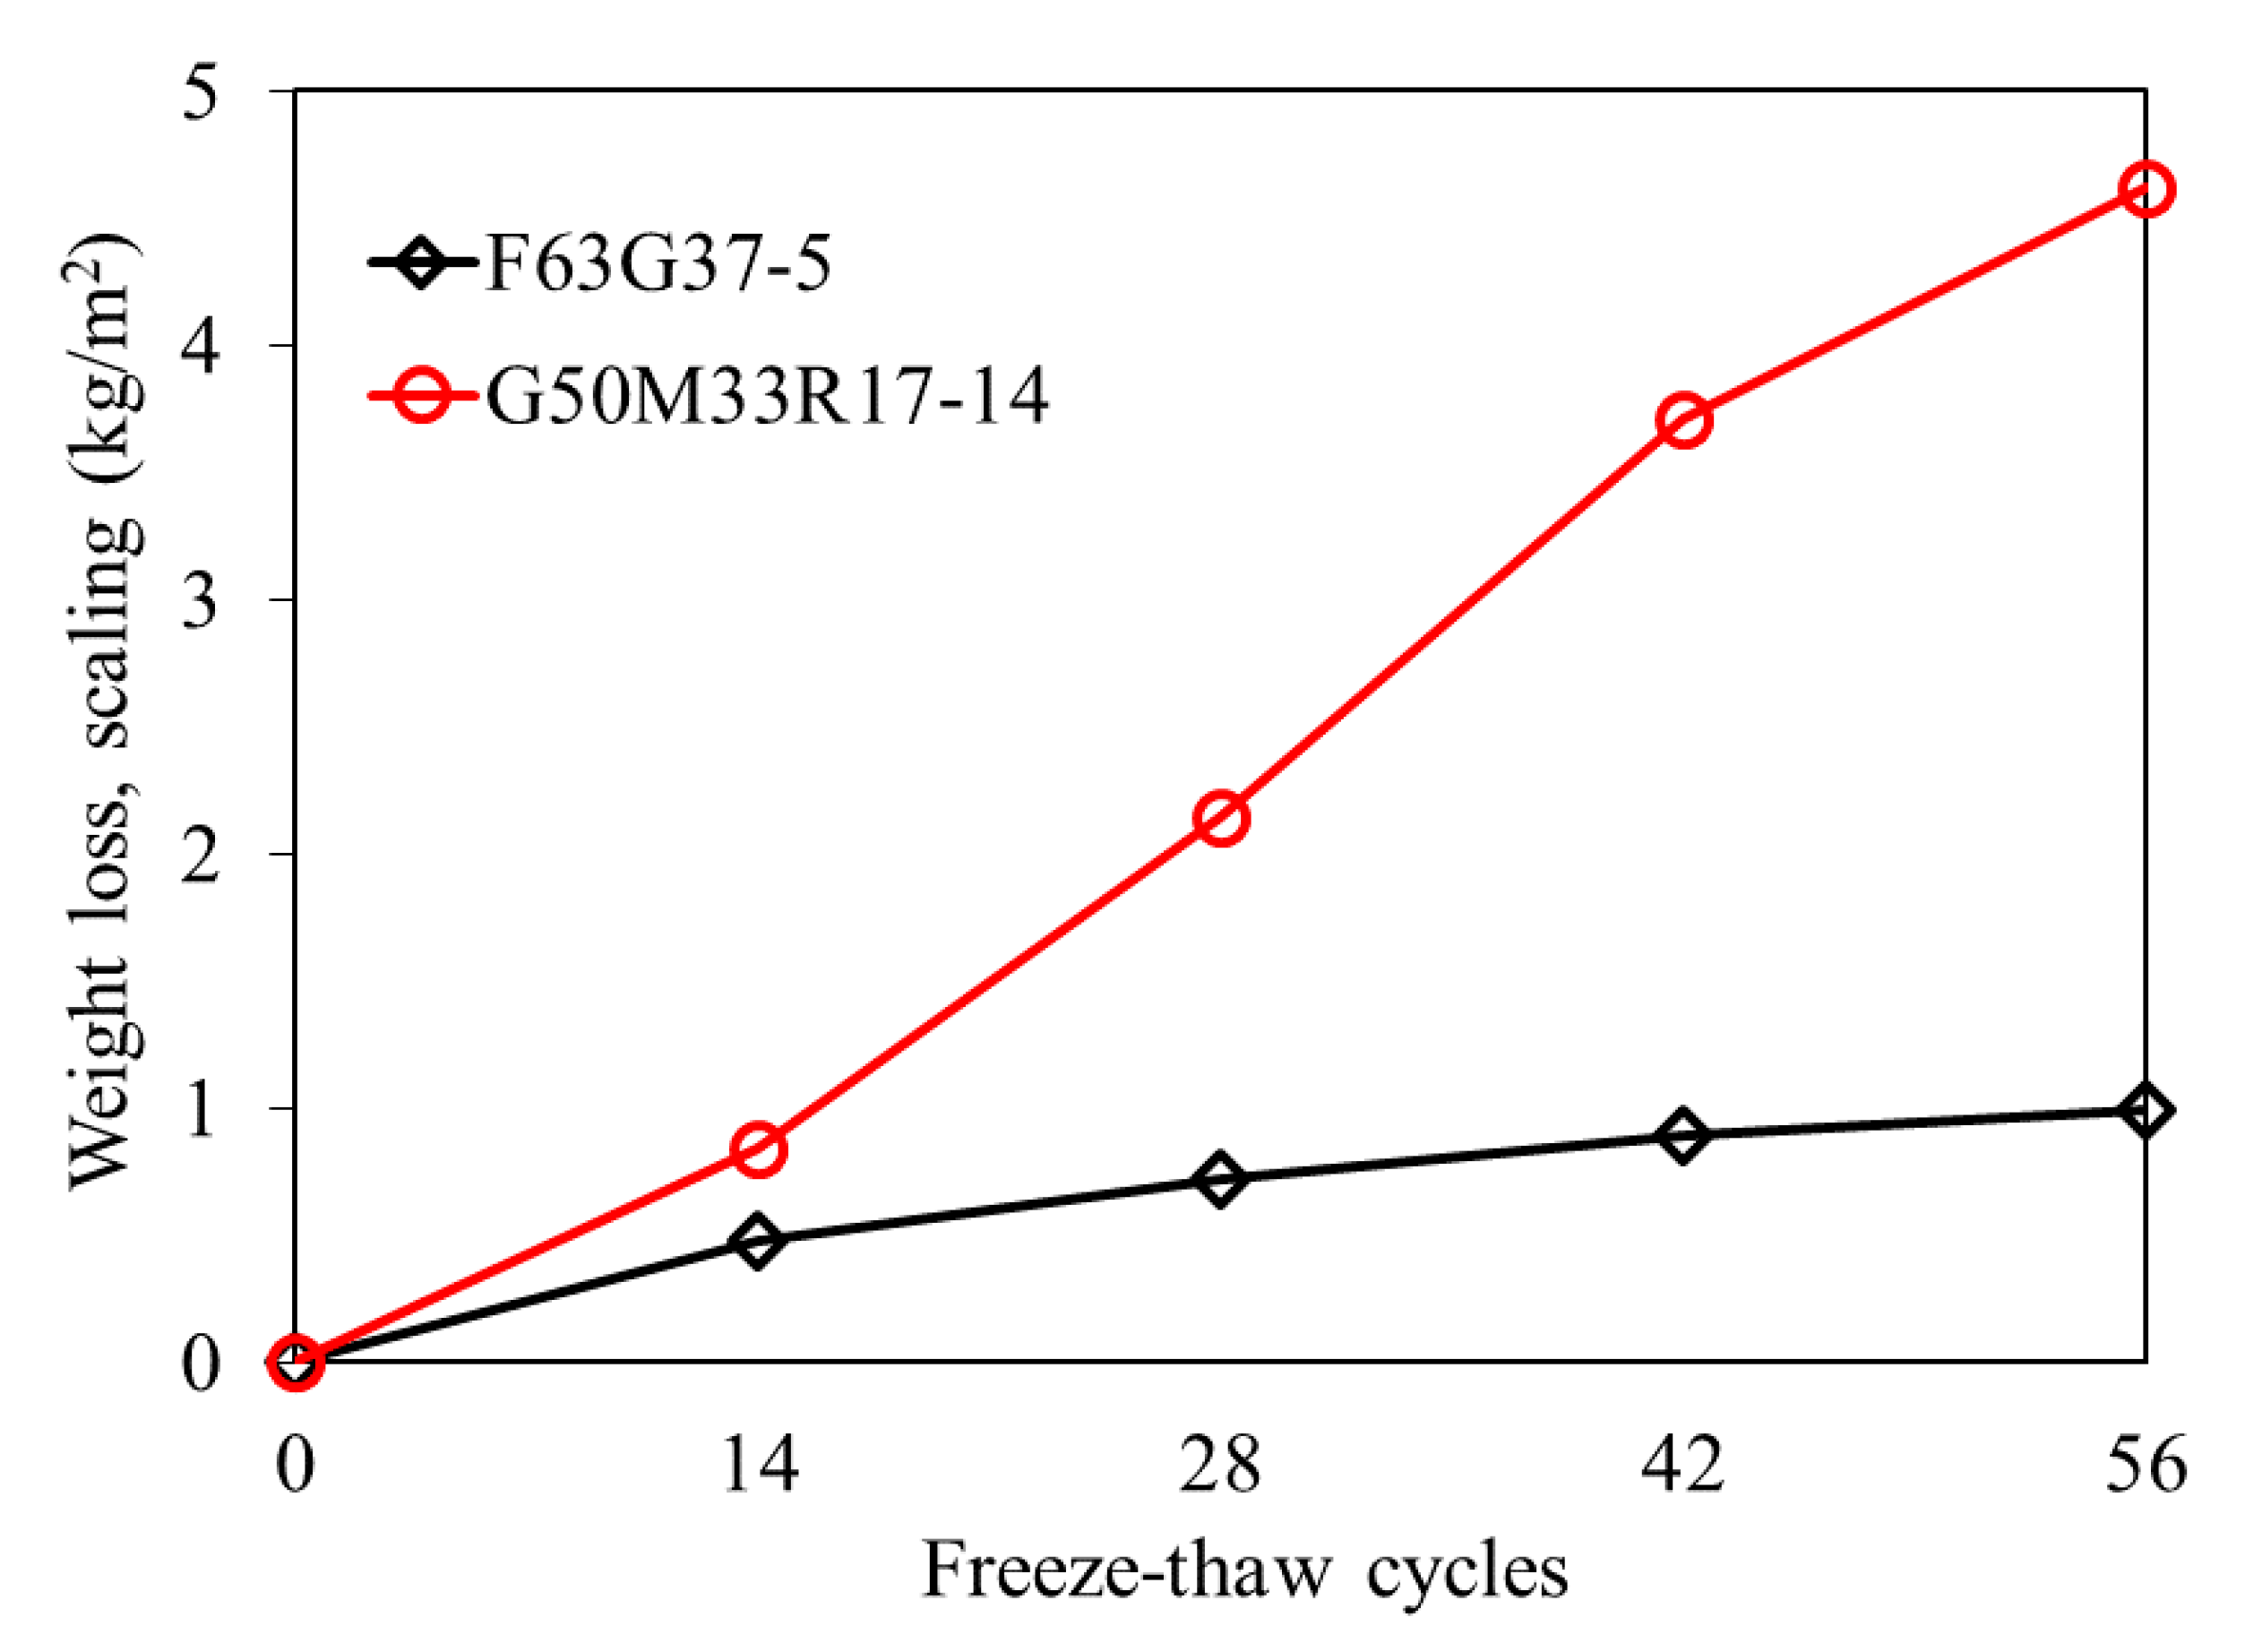
3.4. Freeze-Thaw Resistance

The durability problems of concrete in cold weather can generally be internal cracking due to freezing and thawing cycles and surface scaling due to freezing in the presence of de-icing salts [39]. These problems depend on the porous network of the materials. The porous nature of AAC, like OPC, makes them susceptible to frost attack. Because of the limited researches available on the topic and the different types of AAC, it is challenging to make a conclusive remark on the frost resistance of AAC. Bilek et al. [40] reported that the frost resistance of AAC can, in general, be considered as good. Gomaa et al. [41] found that high calcium fly ash-based AAC concrete has a higher freeze-thaw resistance than OPC concrete. Fu et al. [42] reported the excellent freeze-thaw resistance of alkali-activated slag concrete. On the other hand, Coppola et al. [43] reported the lower freeze-thaw resistance of one-part alkali-activated slag-based mortars compared to Portland cement mortars.
The frost resistance of AAC concrete, like OPC concrete, depends on the type of binder used and the concrete’s various mix proportion parameters [44]. Sodium silicate is reported to have a better frost resistance than other activators such as sodium carbonate [39,45]. Cai et al. [46], in their study on freeze-thaw resistance of alkali-slag concrete, found that activator to slag ratio and slag content are the most prominent factors affecting the freeze-thaw resistance. The addition of nanoparticles such as silica, alumina, and clay has been reported to improve the freeze-thaw resistance of AAC [47,48]. Gomaa et al. [41] reported that addition rubber can significantly improve the freeze-thaw resistance of high calcium FA-based AAC.
In this study, freeze-thaw resistance was tested according to DIN EN 12390-9 using the capillary suction of deionized water and freeze-thaw test (CIF) method. Two mixes, i.e., F63G37-5 and G50M33R17-11 were tested. For each mix, five samples were tested. The scaled mass was measured at 14, 28, 42, and 56 cycles for each sample. Table 5 shows the average total scaled mass for each of the specimens at different cycles. Figure 5 shows some of the specimens at the 14 and 56 freeze-thaw cycles for both F63G37-5 and G50M33R17-11 mixes.
Figure 6 shows the weight loss as a function of the freeze-thaw cycle. As can be observed in this figure, Mix F63G37-5 performed much better at any of the cycles. F63G37-5 mix uses only FA and GGBS as the source material and has a 28-day compressive strength of 64 MPa. G50M33R17-11, on the other hand, uses GGBS, FA, MK, and RHA and has a higher water content than F63G37-5, resulting in a lower 28-day compressive strength of 54 MPa. The higher water content of G50M33R17-11 is believed to be the main cause of its lower performance. Mix F63G37-5 has a TW/TS ratio of 0.26, while G50M33R17-11 has 0.39. For non-air-entrained concretes, water to binder ratio of less than 0.3 is usually needed to reach an acceptable durability level [39]. This explains the difference in freeze-thaw resistance between the two mixes. Winnefeld et al. [49], in their study with GGBS-based and FA-based AACs, reported that higher strength mixes offer a better freeze-thaw resistance for both types of AACs.
Setzer and Auberg [50], in their scaling test study, found that all concrete meeting strictly all the design specifications of standards have a mean scaling below 1.5 kg/m2 at 28 cycles. Hence they recommended this value to classify a high freeze-thaw resistance concrete. Mix F63G37-5 met this requirement with a scaling of 0.7 kg/m2 at 28 freeze-thaw cycles and even at 56 cycles with about 1.0 kg/m2 scaling. Mix G50M33R17-11, on the contrary, has a scaling factor of 2.1 kg/m2 at 28 cycles hence did not meet the requirement.
As observed from the freeze-thaw results in this study, with proper designing of AAC mixtures with lower TW/TS, AAC concrete with good freeze-thaw resistance can be prepared. Hence, as in OPC concrete, the mix design of AAC concrete is also critical on their freeze-thaw resistance. Furthermore, AAC concretes’ freeze-thaw resistance performance can be improved using air-entraining agents [39,41,43]. These admixtures improve the freeze-thaw resistance by enhancing the air-void networks. EN 206-1 [23] recommends 4.0 vol.% air content for XF2 to XF4 exposure classes.

4. Conclusions

Based on the experimental results presented in this study, the following conclusions are drawn:
  • The performance of AAC concrete depends on both the relative proportion of the source materials and the type of source material used. Mixes with high CaO and Al2O3 content result in higher strength.
  • The effect of the alkaline solid to binder ratio depends on the source material used and the value of the ratio. Strength increases until an optimum ratio is reached, and then it decreases.
  • Mixes with high GGBS and MK levels resulted in high early-age strength, while mixes with high FA developed their strength slower.
  • The flexural strength of AAC concrete showed a good correlation with the square root of the compressive strength. MK-based mixes showed the highest flexural to compressive strength ratio.
  • The freeze-thaw test results showed that it is possible to design a frost resistance AAC concrete mixture.

Author Contributions

Conceptualization, P.L., B.H. and K.H.; methodology, P.L. and B.H.; formal analysis, B.H.T.; investigation, B.H.T.; writing—original draft preparation, B.H.T.; writing—review and editing, B.H.T., P.L. and K.H.; visualization, B.H.T., P.L. and B.H.; supervision, K.H.; project administration, K.H., P.L. and B.H.; funding acquisition, K.H., P.L. and B.H.T. All authors have read and agreed to the published version of the manuscript.

Funding

This research was funded by German Federal Ministry for Economic Affairs and Energy as part of the ZIM-Project (ZF4007605KI7) and Alexander von Humboldt Foundation.

Institutional Review Board Statement

Not applicable (study not involving humans or animals).

Informed Consent Statement

Not applicable (study not involving humans).

Data Availability Statement

The data presented in this study are available on request from the corresponding author.

Conflicts of Interest

The authors declare no conflict of interest.

References

  1. Andrew, R.M. Global CO2 emissions from cement production. Earth Syst. Sci. Data 2018, 10, 195–217. [Google Scholar] [CrossRef] [Green Version]
  2. Garcia-Lodeiro, I.; Palomo, A.; Fernández-Jiménez, A. (Eds.) Handbook of Alkali-Activated Cements, Mortars and Concretes; Elsevier: Amsterdam, The Netherlands, 2015; ISBN 9781782422761. [Google Scholar]
  3. Juenger, M.C.G.; Winnefeld, F.; Provis, J.L.; Ideker, J.H. Advances in alternative cementitious binders. Cem. Concr. Res. 2011, 41, 1232–1243. [Google Scholar] [CrossRef]
  4. Bakharev, T.; Sanjayan, J.G.; Cheng, Y.-B. Resistance of alkali-activated slag concrete to acid attack. Cem. Concr. Res. 2003, 33, 1607–1611. [Google Scholar] [CrossRef]
  5. Xie, T.; Visintin, P.; Zhao, X.; Gravina, R. Mix design and mechanical properties of geopolymer and alkali activated concrete: Review of the state-of-the-art and the development of a new unified approach. Constr. Build. Mater. 2020, 256, 119380. [Google Scholar] [CrossRef]
  6. Pacheco-Torgal, F.; Abdollahnejad, Z.; Camões, A.F.; Jamshidi, M.; Ding, Y. Durability of alkali-activated binders: A clear advantage over Portland cement or an unproven issue? Constr. Build. Mater. 2012, 30, 400–405. [Google Scholar] [CrossRef] [Green Version]
  7. John, L.P.; Palomo, A.; Shi, C. Advances in understanding alkali-activated materials. Cem. Concr. Res. 2015, 78, 110–125. [Google Scholar] [CrossRef]
  8. Provis, J.L.; van Deventer, J.S.J. Geopolymers. Structure, Processing, Properties and Industrial Applications; Provis, J.L., van Deventer, J.S.J., Eds.; CRC: Oxford, UK; Woodhead: Boca Raton, FL, USA, 2009; ISBN 9781845694494. [Google Scholar]
  9. Davidovits, J. Geopolymer. Chemistry and Applications, 5th ed.; Institut Géopolymère: Saint-Quentin, France, 2020; ISBN 9782954453118. [Google Scholar]
  10. Torres-Carrasco, M.; Puertas, F. Alkaline activation of different aluminosilicates as an alternative to Portland cement: Alkali activated cements or geopolymers. Rev. Ing. Constr. 2017, 32, 5–12. [Google Scholar] [CrossRef] [Green Version]
  11. Guo, X.; Shi, H.; Dick, W.A. Compressive strength and microstructural characteristics of class C fly ash geopolymer. Cem. Concr. Compos. 2010, 32, 142–147. [Google Scholar] [CrossRef]
  12. Temuujin, J.; van Riessen, A.; MacKenzie, K.J.D. Preparation and characterisation of fly ash based geopolymer mortars. Constr. Build. Mater. 2010, 24, 1906–1910. [Google Scholar] [CrossRef]
  13. Kim, Y.Y.; Lee, B.-J.; Saraswathy, V.; Kwon, S.-J.; Wu, Y. Strength and Durability Performance of Alkali-Activated Rice Husk Ash Geopolymer Mortar. Sci. World J. 2014, 2014, 209584. [Google Scholar] [CrossRef]
  14. Chen, L.; Wang, Z.; Wang, Y.; Feng, J. Preparation and Properties of Alkali Activated Metakaolin-Based Geopolymer. Materials 2016, 9, 767. [Google Scholar] [CrossRef] [Green Version]
  15. Hardjito, D.; Rangan, B.V. Development and Properties of Low-Calcium Fly Ash-Based Geopolymer Concrete; Curtin University of Technology: Perth, Australia, 2005. [Google Scholar]
  16. Hadi, M.N.S.; Farhan, N.A.; Sheikh, M.N. Design of geopolymer concrete with GGBFS at ambient curing condition using Taguchi method. Constr. Build. Mater. 2017, 140, 424–431. [Google Scholar] [CrossRef]
  17. Fang, G.; Ho, W.K.; Tu, W.; Zhang, M. Workability and mechanical properties of alkali-activated fly ash-slag concrete cured at ambient temperature. Constr. Build. Mater. 2018, 172, 476–487. [Google Scholar] [CrossRef]
  18. Rajamma, R.; Labrincha, J.A.; Ferreira, V.M. Alkali activation of biomass fly ash–metakaolin blends. Fuel 2012, 98, 265–271. [Google Scholar] [CrossRef]
  19. Samson, G.; Cyr, M.; Gao, X.X. Formulation and characterization of blended alkali-activated materials based on flash-calcined metakaolin, fly ash and GGBS. Constr. Build. Mater. 2017, 144, 50–64. [Google Scholar] [CrossRef]
  20. Ludwig, H.M.; Egersdörfer, A.; Trümer, A. Leistungsfähigkeit von Metapor@ als Kompositmaterial im Zement; Zement- und Betoneigenschaften, F. A. Finger Institut für Baustoffkunde, Bauhaus-Universität-FIB: Weimar, Germany, 2013. [Google Scholar]
  21. DIN EN 196-1:2016-11. Methods of Testing Cement—Part 1: Determination of Strength, German version EN 196-1:2016; CEN: Brussels, Belgium, 2016. [Google Scholar]
  22. DIN CEN/TS 12390-9:2017-05. Freeze-Thaw Resistance with De-Icing Salts-Scaling, German version CEN/TS 12390-9:2016; CEN: Brussels, Belgium, 2016. [Google Scholar]
  23. DIN EN 206:2017-01. Concrete—Specification, Performance, Production and Conformity; German Version EN 206:2013+A1:2016; CEN: Brussels, Belgium, 2017. [Google Scholar]
  24. Herrmann, A.; Koenig, A.; Dehn, F. Proposal for the classification of alkali-activated binders and Geopolymer binders: Vorschlag zur Klassifizierung von alkalisch-aktivierten Bindemitteln und Geopolymeren. Cem. Int. 2015, 13, 62–69. [Google Scholar]
  25. Herrmann, A.; Koenig, A.; Dehn, F. Structural concrete based on alkali-activated binders: Terminology, reaction mechanisms, mix designs and performance. Struct. Concr. 2018, 19, 918–929. [Google Scholar] [CrossRef]
  26. Buchwald, A. The Influence of Calcium on the Condensation of (Alumino-) Silicates in Alkali-Activated Binders. In German: Der Einfluss des Kalziums auf die Kondensation von (Alumo-)Silikaten in Alkali-Aktivierten Bindern. Habilitationsschrift, der Bauhaus-Universität Weimar, Weimar, Germany, 2012. [Google Scholar]
  27. Kouamo, H.T.; Elimbi, A.; Mbey, J.A.; Sabouang, C.J.N.; Njopwouo, D. The effect of adding alumina-oxide to metakaolin and volcanic ash on geopolymer products: A comparative study. Constr. Build. Mater. 2012, 35, 960–969. [Google Scholar] [CrossRef]
  28. Alanazi, H.; Hu, J.; Kim, Y.-R. Effect of slag, silica fume, and metakaolin on properties and performance of alkali-activated fly ash cured at ambient temperature. Constr. Build. Mater. 2019, 197, 747–756. [Google Scholar] [CrossRef]
  29. Wang, S.-D.; Scrivener, K.L.; Pratt, P.L. Factors affecting the strength of alkali-activated slag. Cem. Concr. Res. 1994, 24, 1033–1043. [Google Scholar] [CrossRef]
  30. Li, L.; Lu, J.-X.; Zhang, B.; Poon, C.-S. Rheology behavior of one-part alkali activated slag/glass powder (AASG) pastes. Constr. Build. Mater. 2020, 258, 120381. [Google Scholar] [CrossRef]
  31. Atiş, C.D.; Görür, E.B.; Karahan, O.; Bilim, C.; İlkentapar, S.; Luga, E. Very high strength (120MPa) class F fly ash geopolymer mortar activated at different NaOH amount, heat curing temperature and heat curing duration. Constr. Build. Mater. 2015, 96, 673–678. [Google Scholar] [CrossRef]
  32. ACI 318-19. Building Code Requirements for Structural Concrete and Commentary; American Concrete Institute: Farmington Hills, MI, USA, 2019. [Google Scholar]
  33. AS 3600. Concrete Structures; Standards Australia: Sidney, Australia, 2018. [Google Scholar]
  34. EC 2. EN 1992-1-1: Design of Concrete Structures—Part 1-1: General Rules and Rules for Buildings; CEN: Brussels, Belgium, 2004. [Google Scholar]
  35. Diaz-Loya, E.I.; Allouche, E.N.; Vaidya, S. Mechanical Properties of Fly-Ash-Based Geopolymer Concrete. ACI Mater. J. 2011, 108. [Google Scholar] [CrossRef]
  36. Gomaa, E.; Sargon, S.; Kashosi, C.; Gheni, A.; ElGawady, M.A. Mechanical Properties of High Early Strength Class C Fly Ash-Based Alkali Activated Concrete. Transp. Res. Rec. 2020, 2674, 430–443. [Google Scholar] [CrossRef]
  37. Nath, P.; Sarker, P.K. Flexural strength and elastic modulus of ambient-cured blended low-calcium fly ash geopolymer concrete. Constr. Build. Mater. 2017, 130, 22–31. [Google Scholar] [CrossRef] [Green Version]
  38. Yi, S.-T.; Yang, E.-I.; Choi, J.-C. Effect of specimen sizes, specimen shapes, and placement directions on compressive strength of concrete. Nucl. Eng. Des. 2006, 236, 115–127. [Google Scholar] [CrossRef]
  39. Cyr, M.; Pouhet, R. The frost resistance of alkali-activated cement-based binders. In Handbook of Alkali-Activated Cements, Mortars and Concretes; Pacheco-Torgal, F., Labrincha, J.A., Leonelli, C., Palomo, A., Chindaprasirt, P., Eds.; Woodhead Publishing: Oxford, UK, 2015; pp. 293–318. ISBN 978-1-78242-276-1. [Google Scholar]
  40. Bilek, V.; Hurta, J.; Done, P.; Zidek, L. Development of alkali-activated concrete for structures—Mechanical properties and durability. Perspect. Sci. 2016, 7, 190–194. [Google Scholar] [CrossRef] [Green Version]
  41. Eslam, Y.; Ahmed, G.; Gheni, A.; ElGawady, M.A. Durability of Class C Fly Ash-Based Alkali Activated Concrete. ACI Symp. Publ. 2019, 334, 185–204. [Google Scholar]
  42. Fu, Y.; Cai, L.; Yonggen, W. Freeze–thaw cycle test and damage mechanics models of alkali-activated slag concrete. Constr. Build. Mater. 2011, 25, 3144–3148. [Google Scholar] [CrossRef]
  43. Coppola, L.; Coffetti, D.; Crotti, E.; Gazzaniga, G.; Pastore, T. The Durability of One-Part Alkali-Activated Slag-Based Mortars in Different Environments. Sustainability 2020, 12, 3561. [Google Scholar] [CrossRef]
  44. Bilek, V.; Hurta, J.; Zidek, L.; Mec, P. Searching for Durable and Friendly Alkali Activated Concrete for Building Elements Constructions. In Engineering Researches and Decisions in Materials Science; Trans Tech Publications Ltd.: Zurich, Switzerland, 2015; pp. 126–131. [Google Scholar]
  45. Gifford, P.M.; Gillott, J.E. Freeze-Thaw Durability of Activated Blast Furnace Slag Cement Concrete. ACI Mater. J. 1996, 93. [Google Scholar] [CrossRef]
  46. Cai, L.; Wang, H.; Fu, Y. Freeze–thaw resistance of alkali–slag concrete based on response surface methodology. Constr. Build. Mater. 2013, 49, 70–76. [Google Scholar] [CrossRef]
  47. Shahrajabian, F.; Behfarnia, K. The effects of nano particles on freeze and thaw resistance of alkali-activated slag concrete. Constr. Build. Mater. 2018, 176, 172–178. [Google Scholar] [CrossRef]
  48. Awoyera, P.; Adesina, A. Durability Properties of Alkali Activated Slag Composites: Short Overview. Silicon 2020, 12, 987–996. [Google Scholar] [CrossRef]
  49. Winnefeld, F.; Gluth, G.J.G.; Bernal, S.A.; Bignozzi, M.C.; Carabba, L.; Chithiraputhiran, S.; Dehghan, A.; Dolenec, S.; Dombrowski-Daube, K.; Dubey, A.; et al. RILEM TC 247-DTA round robin test: Sulfate resistance, alkali-silica reaction and freeze–thaw resistance of alkali-activated concretes. Mater. Struct. 2020, 53, 140. [Google Scholar] [CrossRef]
  50. Setzer, M.J.; Auberg, A. Freeze-thaw and deicing salt resistance of concrete testing by the CDF method CDF resistance limit and evaluation of precision. Mater. Struct. 1995, 28, 16–31. [Google Scholar] [CrossRef]
Figure 1. Aggregate grading curves.
Buildings 11 00052 g001
Figure 2. SEM image of source materials.
Buildings 11 00052 g002
Figure 3. G50M33R17-11 during workability test.
Buildings 11 00052 g003
Figure 4. Comparison of experimental and predicted flexural strengths.
Buildings 11 00052 g004
Figure 5. Freeze-thaw specimens’ surface after 14 and 56 cycles.
Buildings 11 00052 g005
Figure 6. Mean scaling during freeze-thaw cycles.
Buildings 11 00052 g006
Table 1. Chemical compositions of source materials.
Component
(%)
SiO2Al2O3Fe2O3MgOCaOK2ONa2OSO3Average
Particle Size (µm)
FA49.7926.718.572.474.343.361.281.49-
GGBS34.4811.48-7.0842.430.660.562.17-
MK1 [20]54.427.110.74.52.37.90.314.9
MK253.1644.510.54---- -1.3 *
SF1 *93.810.481.490.460.30.770.420.2-
SF296.051.11-0.460.721.20.46-0.15 *
RHA *92111112151.1
* Manufacturer specification.
Table 2. Details of mix proportions and results for FA-based concretes.
Mix IDAS/BTW/TSFlexural (N/mm2)Compressive (N/mm2)
7-Day28-Day7-Day28-Day
F63G37-10.210.434.696.6434.6554.74
F63G37-20.260.434.626.5234.4852.90
F63G37-30.210.504.51-23.4331.61
F63G37-40.210.444.51-36.82-
F63G37-5 *0.210.263.21d3.74d46.1964.32
F80G20-60.210.353.726.6420.5439.19
F80G20-70.250.354.406.2525.0443.03
F80G20-80.280.355.326.9535.7051.81
F37G37M26-90.260.464.095.5926.6642.46
F35G35M30-100.260.464.767.1027.8651.32
F35G35M25S5-110.250.424.636.0330.5745.35
F—FA, G—GGBS, M—MK1, S—SF1, d—splitting tensile strength, * 16 mm aggregate Size, F63G37—63% FA and 37% GGBS, total binder 400 kg/m3.
Table 3. Details of mix proportions and results for GGBS-based concretes.
Mix IDAS/BTW/TSFlexural (N/mm2)Compressive (N/mm2)
7-Day28-Day7-Day28-Day
G52M30S18-10.330.394.297.0837.4641.96
G52M30S18-20.290.395.666.8041.1456.84
G52M30S18-30.250.394.926.7525.4140.80
G52M30S18-4 a0.330.395.71-47.64-
G52M30S18-5 b0.330.395.837.0358.5260.96
G52M30S18-6 b0.260.435.837.4136.8650.99
G52M30R18-70.320.476.558.2945.2663.48
G52M30R18-80.260.495.688.8841.4664.14
G52M30R18-90.260.646.27-33.82-
G52M30R18-100.190.54--15.07-
G50M33R17-11 *0.210.392.25 d3.51 d34.2154.11
M—MK2, S—SF2, * 16 mm aggregate size and MK1, d—splitting tensile strength, a: SF1 and MK1, b: SF1 and MK2, G52M30S18—52% GGBS, 30% MK and 18% SF, total binder 400 kg/m3.
Table 4. Details of mix proportions and results for MK-based concretes.
Mix IDAS/BTW/TSFlexural (N/mm2)Compressive (N/mm2)
7-Day28-Day7-Day28-Day
M75S25-10.390.434.826.3829.5335.04
M75S25-20.340.434.926.8127.3534.30
M75S25-30.310.474.335.7025.4729.30
M75S25-4 b0.390.436.556.9239.9150.30
M75S25-5 a0.390.43--2.606.31
M49G30R13S8-6 a0.280.534.315.9323.9236.83
M44G44S12-7 a0.280.484.565.7428.2240.79
M63G25S12-8 a0.280.484.226.4221.8630.26
M—MK2, S—SF2, a: SF1 and MK1, b: SF1 and MK2, M75S25—75% MK and 25% SF, total binder 400 kg/m3.
Table 5. Freeze-thaw resistance.
MixtureCyclesAverage (kg/m2)Standard Deviation
F63G37-5140.4760.119
280.7260.104
420.8920.089
560.9990.073
G50M33R17-11140.8390.368
282.1450.467
423.7150.166
564.6180.262
Publisher’s Note: MDPI stays neutral with regard to jurisdictional claims in published maps and institutional affiliations.

