Article

Shear Behavior of Reinforced Post-Filling Coarse Aggregate Concrete Beams Produced by Creative Construction Process

1
State Key Laboratory of Coastal and Offshore Engineering, School of Civil Engineering, Dalian University of Technology, Dalian 116024, China
2
Shanghai Municipal Engineering Design Institute Co., Ltd., Shanghai 200092, China
3
Department of Civil and Environmental Engineering, The Hong Kong Polytechnic University, Hong Kong 999077, China
*
Author to whom correspondence should be addressed.
Buildings 2021, 11(12), 576; https://doi.org/10.3390/buildings11120576
Submission received: 7 November 2021 / Revised: 14 November 2021 / Accepted: 17 November 2021 / Published: 24 November 2021
(This article belongs to the Topic Sustainable Building Structures)

Abstract

:
Different from the traditional concrete mixing procedure, the innovative post-filling coarse aggregate concrete (PFCC) reduces the cost of pumping concrete by increasing the coarse aggregate content and reducing the usage of cement. Previous studies have shown that PFCC enhances the compressive strength, elastic modulus, and flexural strength of concrete. In this paper, the shear behavior of 13 post-filling coarse aggregate concrete beams and 3 control beams was tested to determine the relationships between the shear performance of the beam and the post-filling coarse aggregate ratio, concrete strength grade, shear span ratio and stirrup reinforcement ratio. The results showed that the ultimate shear capacity of beam specimen increases first and then decreases with the increase in post-filling coarse aggregate ratio, reaching the maximum at 15% post-filling ratio. The results also indicated that the ultimate shear capacity of the beam increases with the increase in concrete strength grade and stirrup ratio. However, experimental results exhibited that the ultimate shear capacity decreases as the shear span ratio increases. This study provides a reference for the application of post-filling coarse aggregate concrete in engineering practice.

1. Introduction

Post-filling coarse aggregate concrete (PFCC) is a new type of coarse aggregate interlocking concrete [1,2,3]. A certain amount of coarse aggregate is added after the mixing of the first batch is completed, and the concrete is uniformly mixed again. Originally used for pavement concrete, PFCC is used to solve the problem of aggregate suspension [4] and excessive paste of high-performance concrete, which is critical in meeting the working performance requirement. The post-filling coarse aggregate concrete not only reduces the use of cement [5] but also increases the volume percentage of coarse aggregates, which improves the early-age cracking resistance of concrete [6]. In practical application, it has been found that the strength properties [5] of concrete can also be improved. Therefore, the method of post-filling coarse aggregate has a significant effect in reducing concrete cost, reducing shrinkage cracking and increasing compressive strength. With the development of construction technology and facilities, the performance evaluation and application of PFCC could be extended to self-compacting concrete [7], ultra-high-strength concrete [8] and pumping concrete [9].
Since PFCC is produced by adding coarse aggregate in the second mixing stage, it is necessary to investigate the effect of coarse aggregate (type, size, content in concrete) on the mechanical properties of concrete. Consequently, researchers have conducted experimental studies on the influence of coarse aggregate on concrete properties. Rao and Prasad [10] have shown that the shape roundness of the coarse aggregate affects the fluidity of the concrete positively, but influences the compressive strength negatively. Meddah et al. [11] reported that ordinary concrete with continuously graded aggregates has higher strength than discontinuous grades at the same volume content of coarse aggregate. Contradictory results were observed for high-strength concrete. Ozturan and Cecen [12] investigated the influence of type of coarse aggregate on the compressive strength of ordinary and high-strength concrete. For ordinary concrete grades, concrete with limestone coarse aggregate presents the highest strength [13]. For high-strength concrete, basalt aggregate concrete shows the highest strength, and pebble coarse aggregate (which has a round surface normally) concrete has the lowest concrete strength. Meanwhile, Aitcin and Mehta [14] demonstrated that coarse aggregate type shows a significant effect on the properties of high-strength concrete, where the elastic modulus and strength of both limestone and diabase coarse aggregate concrete are higher than those of pebble concrete. Zhou et al. [15] studied the effect of coarse aggregate type on the elastic modulus and compressive strength of high-performance concrete. The authors pointed out that the compatibility between coarse aggregate and the matrix is desired in order to achieve high strength and elastic modulus. Kaplan’s [16] study indicated that the influence of coarse aggregate type on the elastic modulus of concrete is greater than that of compressive strength. Giaccio et al. [17] conducted an experimental study and reported that the elastic modulus of basalt aggregate high-strength concrete is higher than that of limestone aggregate, which is higher than that of granite aggregate. Akcaoglu et al. [18] showed that under the same water–cement ratio and sand ratio, the elastic modulus of concrete increases with the increase in coarse aggregate volume fraction when the total aggregate volume ratio increases from 40 to 66% of concrete [19]. Meddah et al. [11] showed that with the increase in the volume fraction of added coarse aggregate, the compressive strength of ordinary and high-strength concrete was greatly improved. However, it was found that the strength begins to decrease after reaching a certain limit [20], indicating that there exists an optimal content of coarse aggregate.
The technology of post-filling coarse aggregate concrete could reduce cement production and decrease carbon emissions. Furthermore, the compressive strength, elastic modulus and load-carrying capacity of columns of post-filling coarse aggregate concrete were also found to be improved [5,21,22]. The post-filling coarse aggregate ratio (PFR) is the volume fraction of the coarse aggregate in the total volume of the post-filling coarse aggregate concrete. Figure 1 [23] shows the designed construction process for post-filling coarse aggregate concrete in buildings.
In this study, the shear behavior of post-filling coarse aggregate concrete beams with different concrete strength grades (C30, C40 and C50) and different post-filling coarse aggregate ratios (0%, 10%, 15% and 20%) was assessed. Thirteen post-filling concrete beams and three control ordinary concrete beams were tested. The shear performances of the beam specimens were tested and analyzed. The relationships between the shear performance of the beam and the post-filling aggregate ratio, concrete strength grade, shear span ratio and stirrup reinforcement ratio were also studied.

2. Research Significance

Post-filling coarse aggregate concrete is very promising in the application of building and bridge engineering construction in terms of mechanical property enhancement, cost savings and environmental friendliness. So far, the very limited research has only focused on the study of basic material properties, and the structural behavior of concrete elements made of post-filling coarse aggregate concrete has not been studied. This study aimed to investigate the shear behavior of post-filling coarse aggregate concrete beams and the effect of various parameters on the shear capacity of the beam. This study provides research data and guidance for the potential application of post-filling coarse aggregate in design and engineering construction.

3. Experimental Program
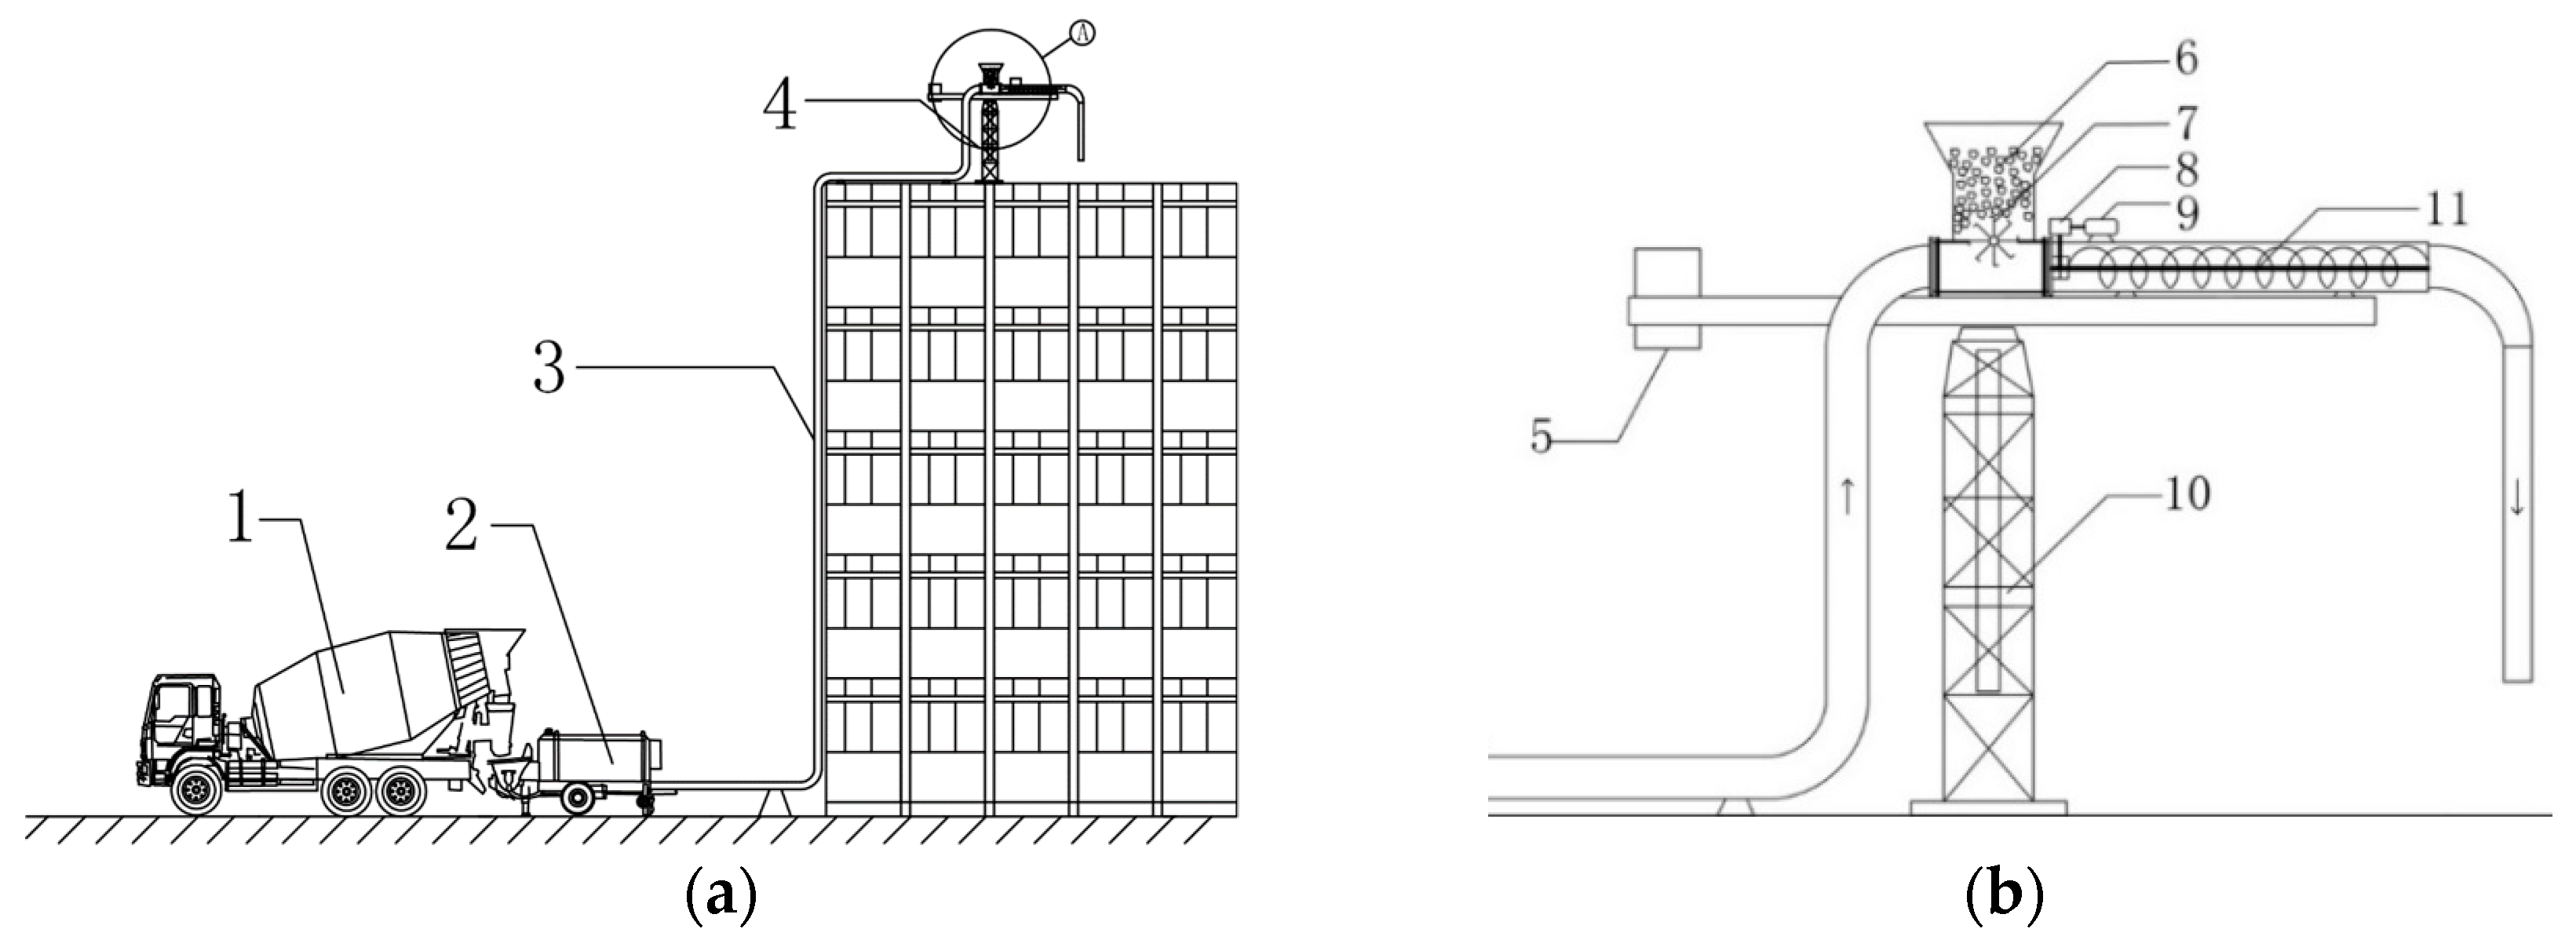
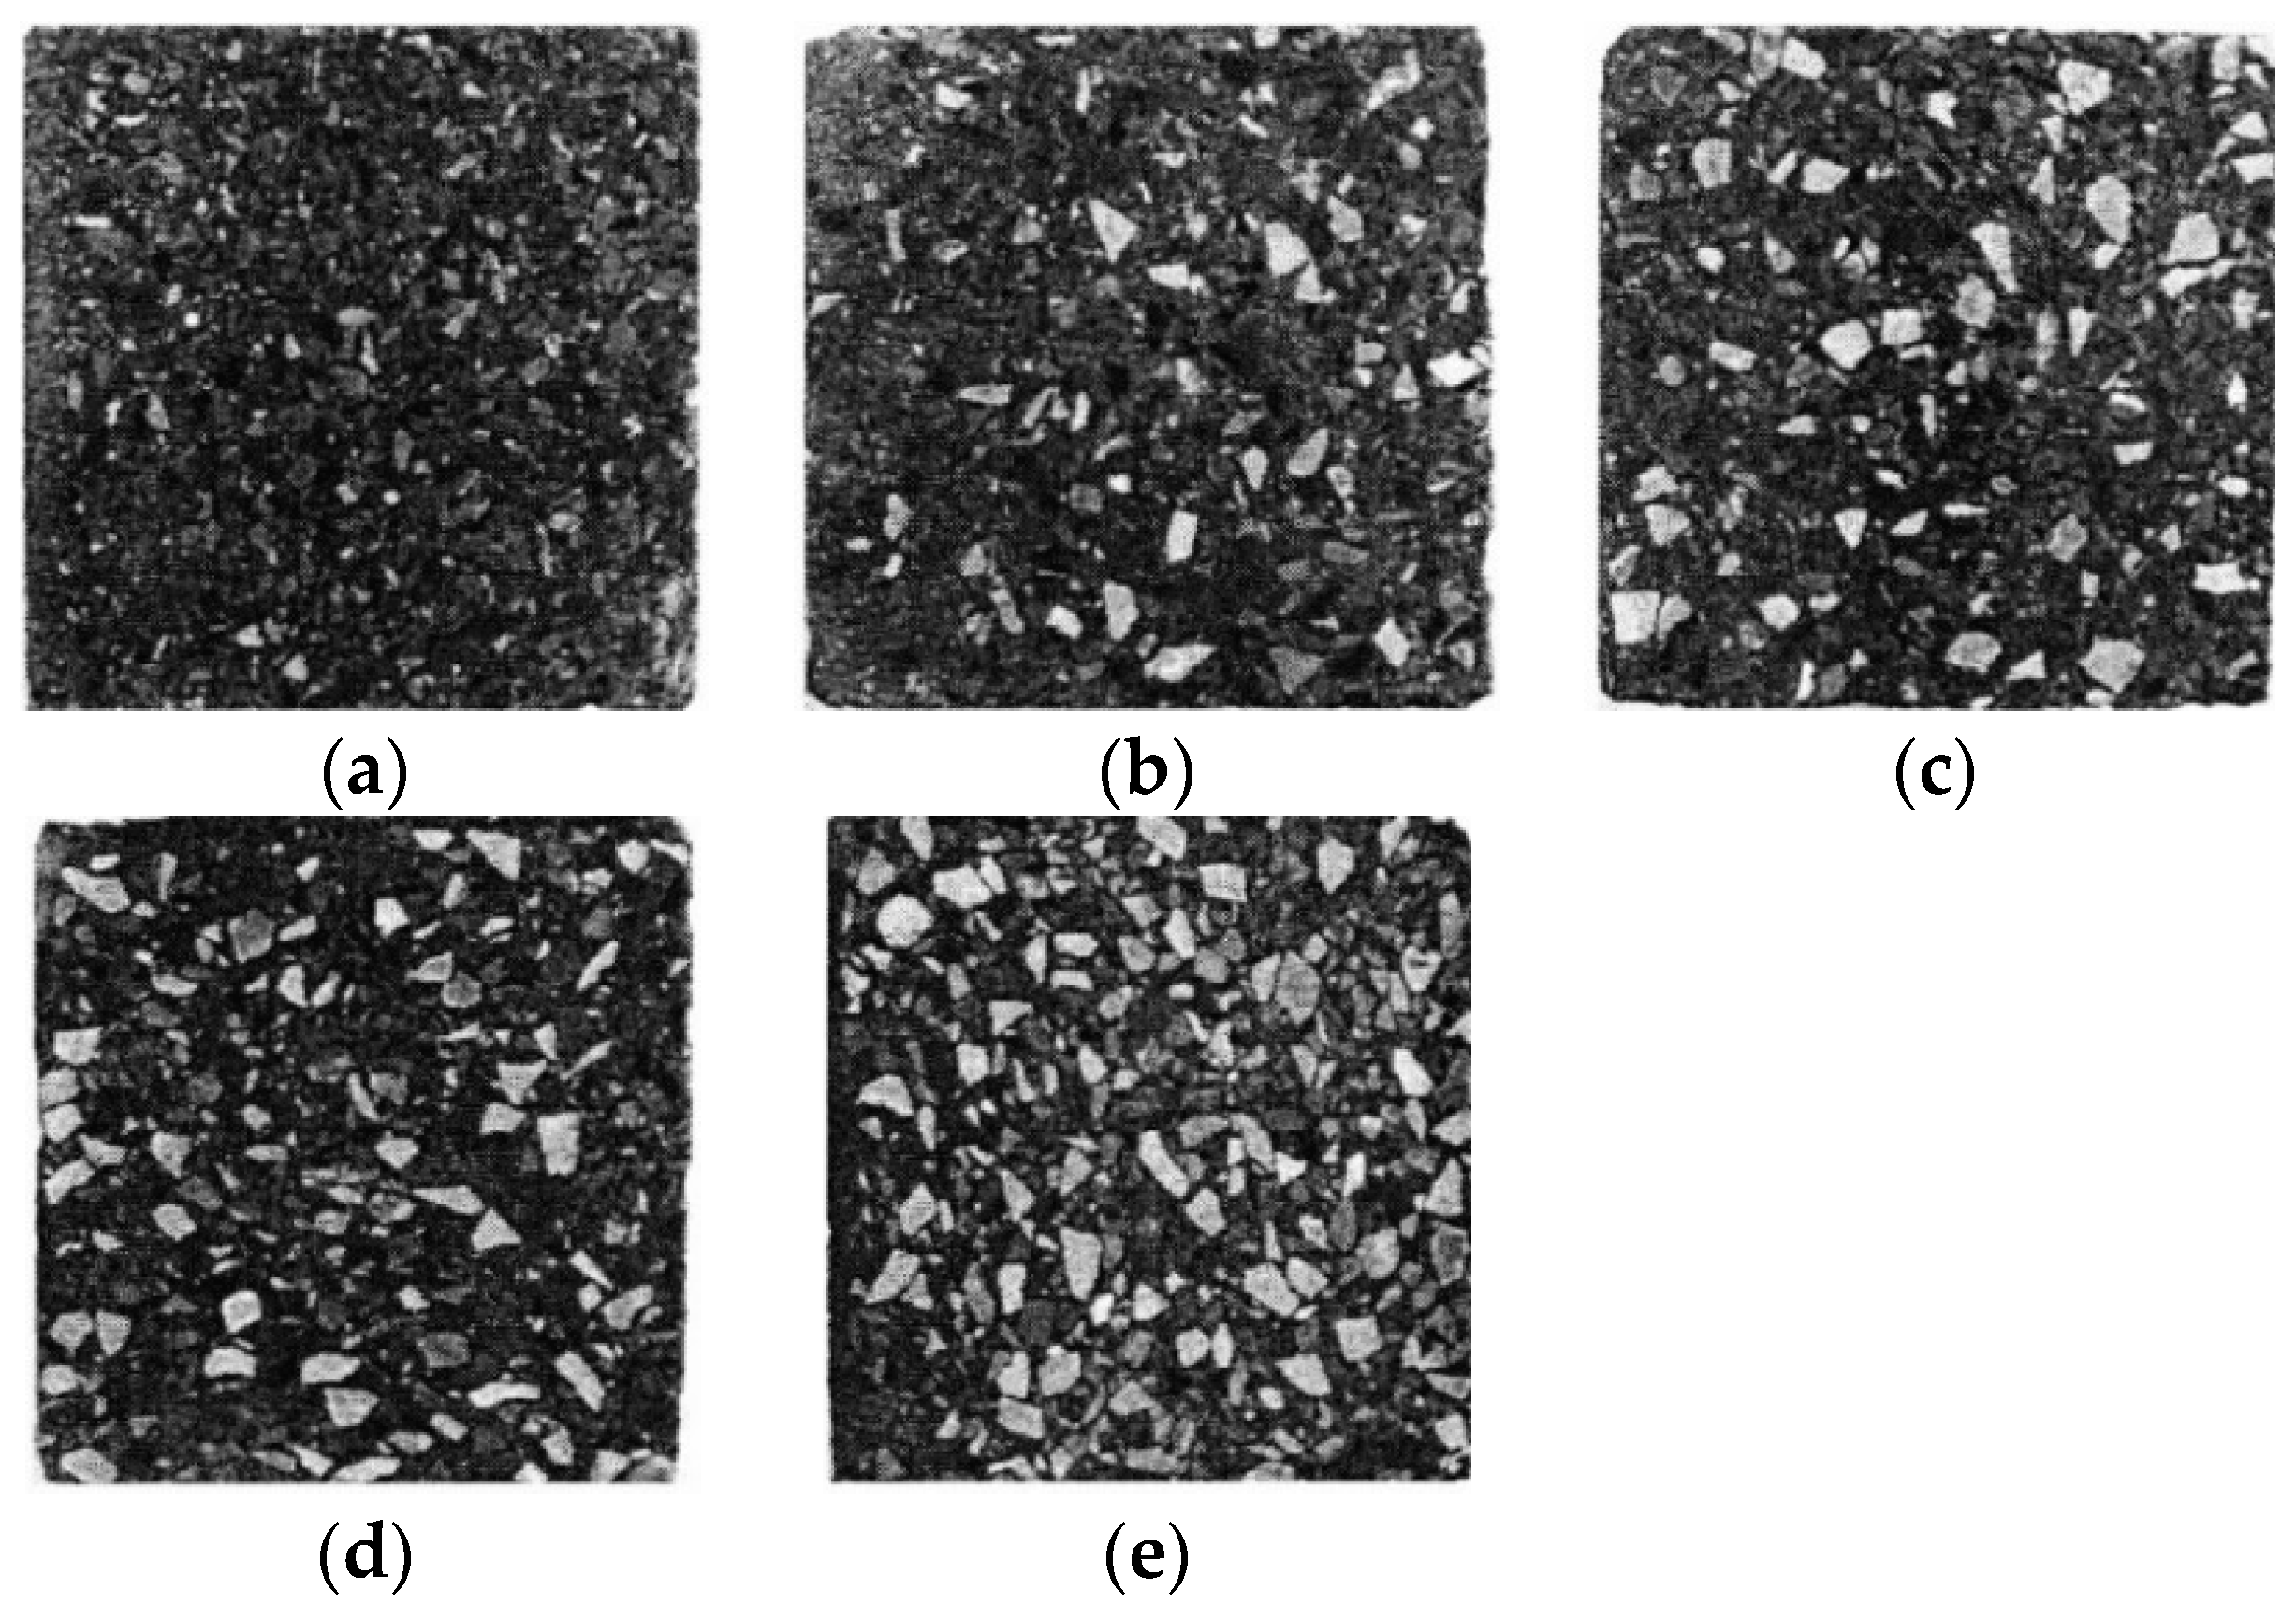
3.1. Mixture Design

The cement used for C30 and C40 was P.O 32.5R. The cement used for C50 was P.O 42.5R. The density of the cement was 3.1 g/cm3. The coarse aggregate was 0–10 mm limestone with bulk density of 2.65 g/cm3. The fine aggregate was natural river medium sand with bulk density of 2.60 g/cm3. The post-filling coarse aggregate was 10–20 mm limestone with bulk density of 2.65 g/cm3. The fly ash was first-class fly ash (according to Chinese code “Technical Code for Application of Fly Ash Concrete” (GB/T 50146-2014) [24]) with density of 2.60 g/cm3. Polycarboxylate superplasticizer-based water reducer was adopted. The design strengths of the concrete in this test were C30, C40 and C50, which have compressive strengths of 30, 40 and 50 MPa, respectively, for cubic specimens. In real practice, the post-filling coarse aggregate is filled into the reference concrete which is pumped to the desired location while the concrete is being agitated. In order to simulate this, in the preparation process of the test specimens [25], the reference concrete was kept agitated in the mixer while the post-filling coarse aggregate was placed into it, and then the concrete mixture was kept evenly mixing before being discharged [26]. In order to avoid excessive hydration of the cement caused by long agitation, the material can be poured with a little stirring after the post-filling coarse aggregate is added. The designed filling ratios of the post-aggregate were 0%, 10%, 15%, 20% and 25%. The slump of concrete at different strength grades and different post-filling ratios, as well as reference concrete, was then measured [27]. The tested slump results are shown in Table 1.
The reference concrete meets the requirement for pumping concrete slump in the Technical Specification for Concrete Pumping Construction (JGJ/T 10-2011) [28], as shown in Table 1. It can be seen that the slump of concrete at various strength grades decreases with the increase in the post-filling ratio. When the filling ratio is less than 20%, the slump of the concrete is greater than 90 mm. The slump values are all greater than 80 mm for all post-filling ratios. In addition, it was observed that at the 25% post-filling ratio, the paste was not evenly distributed in the concrete and the concrete was not homogeneously mixed. Therefore, 20% is the highest post-filling coarse aggregate ratio that could meet the pouring requirement.

3.2. Material Properties

The elastic modulus and compressive strength of post-filling coarse aggregate concrete were tested according to procedures in the GB/T 50152-2012 [29]. Six standard cubic specimens with size of 150 mm × 150 mm × 150 mm were prepared for each post-filling aggregate ratio. The aggregate distributions in cross-section are shown in Figure 2. The 7-day compressive strength fcu (7d) and 28-day compressive strength fcu (28d) are shown in Table 2. The longitudinal reinforcement used was HRB335 (hot-rolled ribbed steel bar). The yield strength was 380 MPa. The ultimate strength and elastic modulus of steel reinforcement were 472 MPa and 200 GPa, respectively.

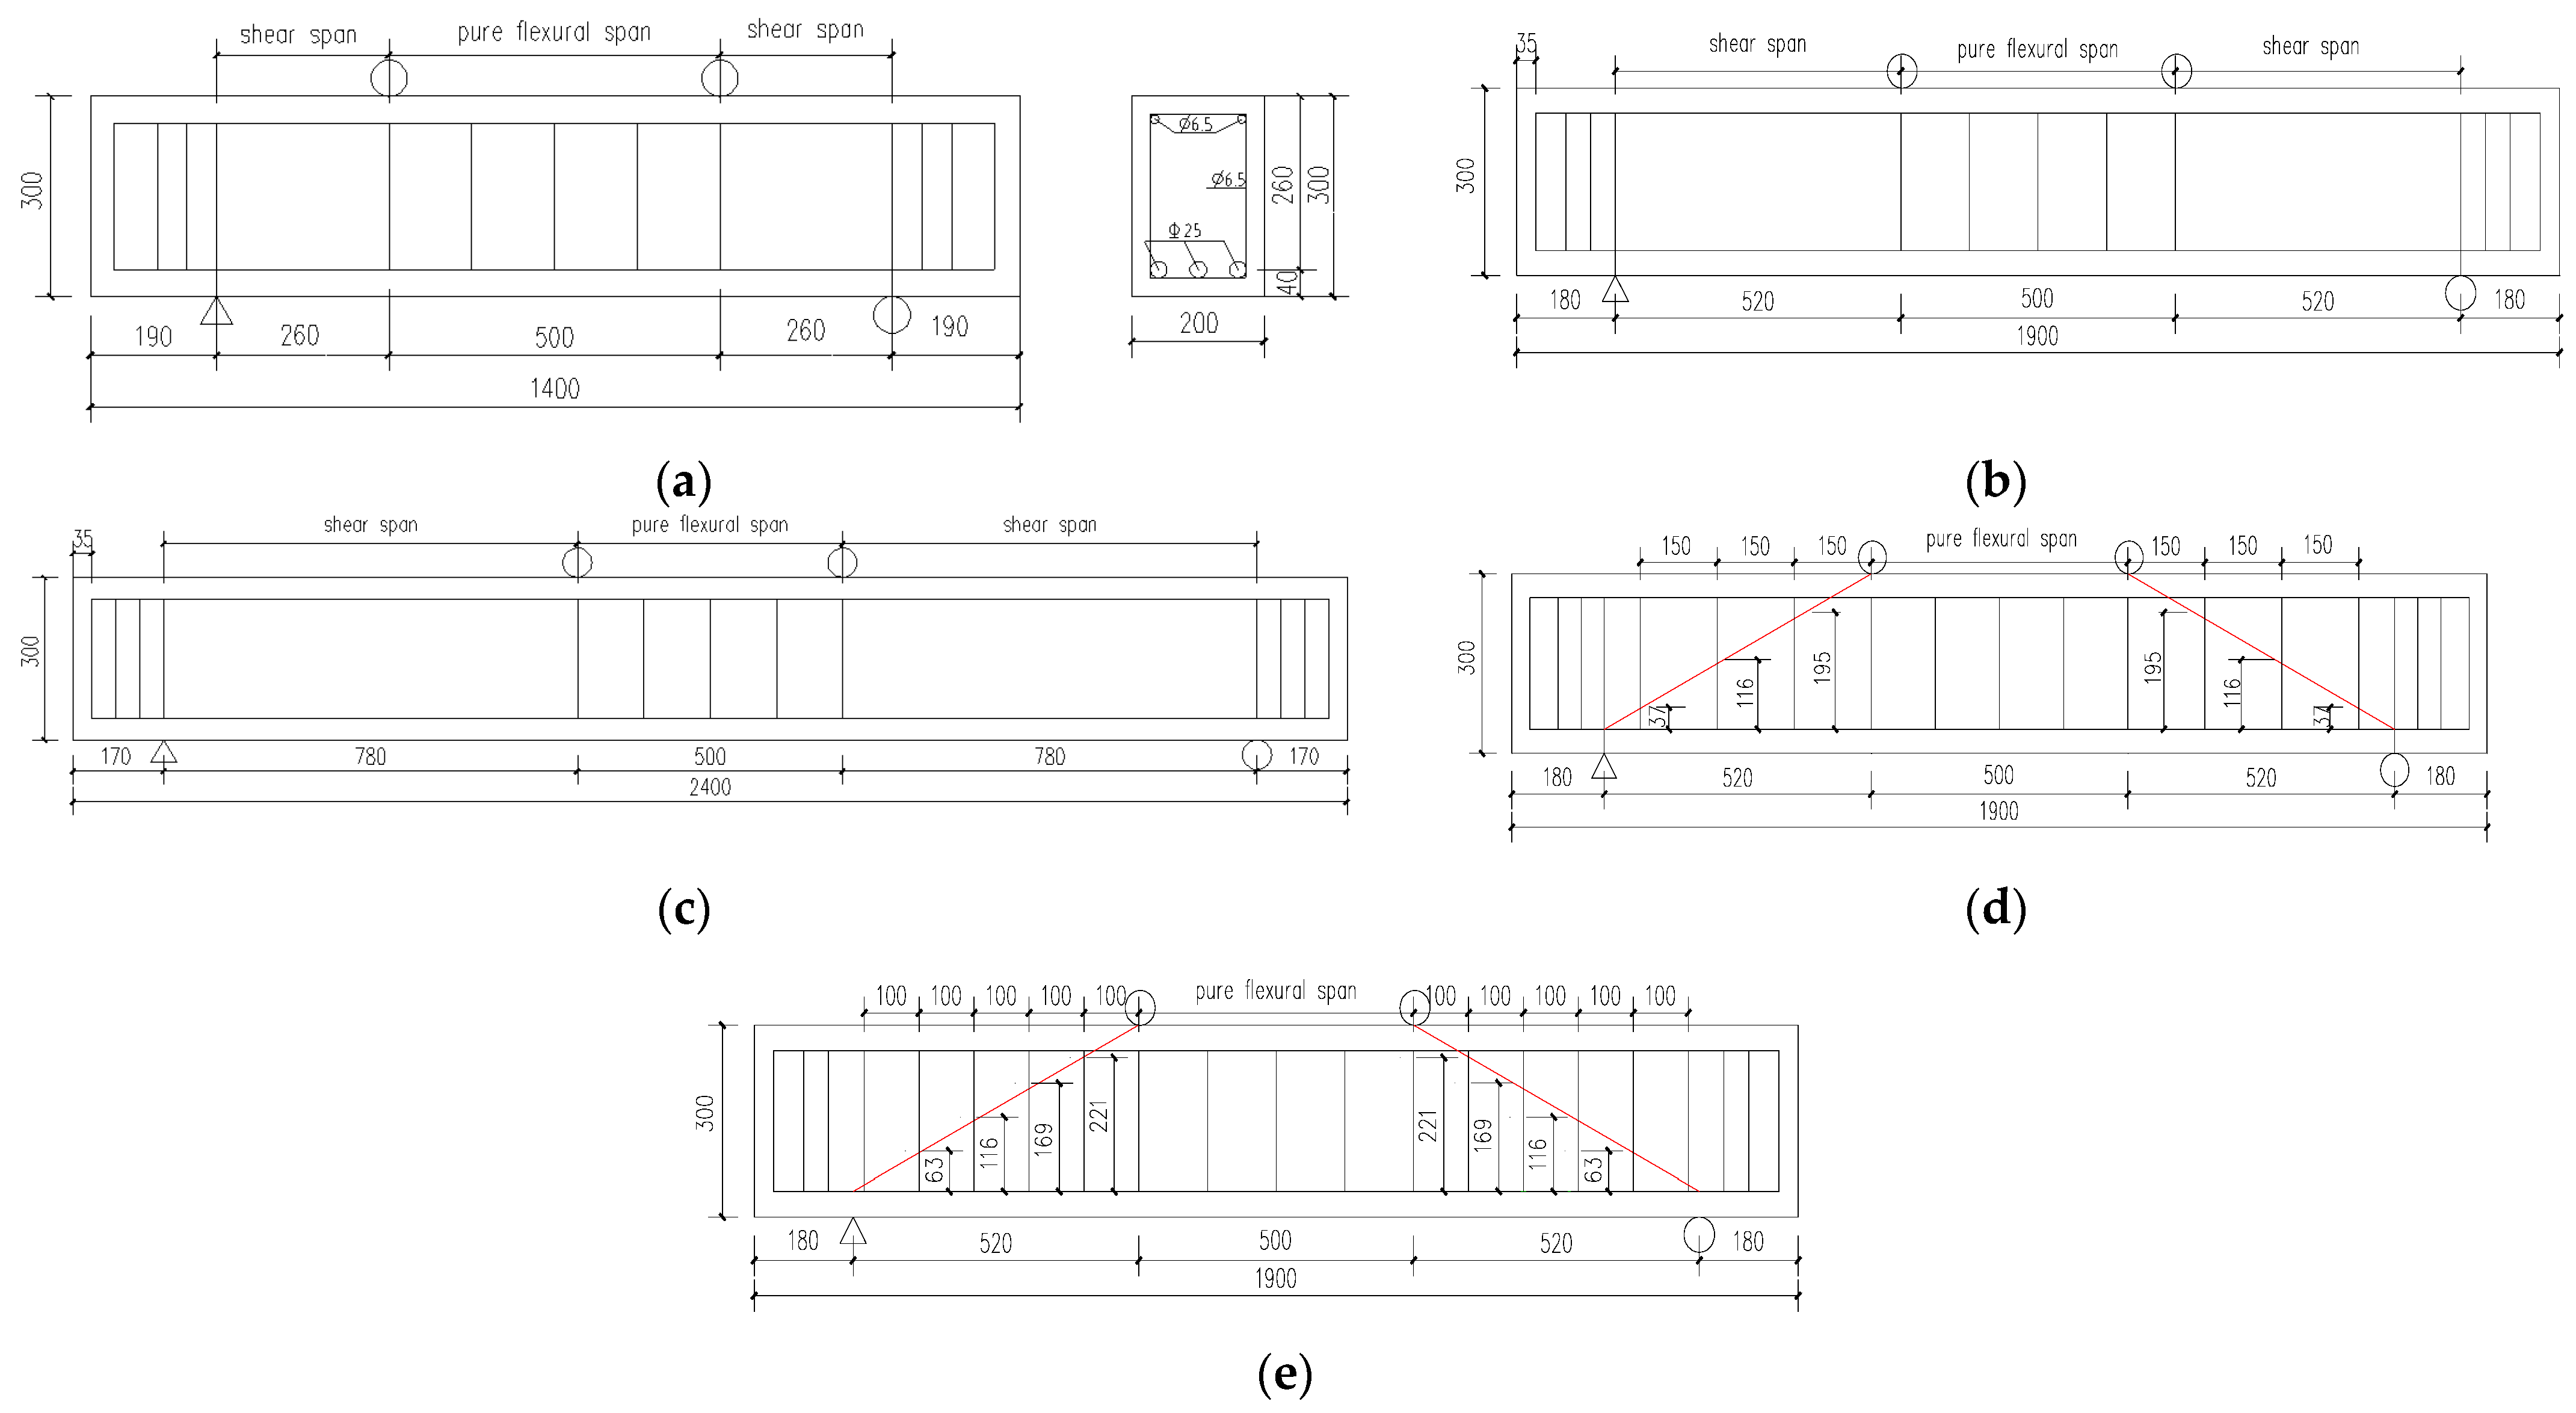
3.3. Beam Specimen Design

Sixteen beam specimens were designed and prepared in this study. The concrete grades were C30, C40 and C50. The cross-section of beam specimens was 200 mm × 300 mm. The filling ratios 0%, 10%, 15% and 20% correspond to the specimens B30-1, B30-2, B30-3 and B30-4 (B40-1, B40-2, B40-3, B50-1, B50-2, B50-3, B50-4). Three beam lengths (1400, 1900 and 2400 mm), three shear span-to-depth ratios (1, 2 and 3) and three stirrup reinforcement ratios (0%, 0.22% and 0.33%) were considered. The longitudinal steel consisted of three ϕ25 steel rebars (nominal diameter of 25 mm and cross-section area of 490.9 mm). The longitudinal reinforcement employed was HRB335 (hot-rolled ribbed steel bar). The yield strength was 380 MPa and the ultimate strength was 472 MPa. The shear reinforcement was composed of double stirrups made of ϕ6.5 steel rebars (nominal diameter of 6.5 mm). The shear steel employed was HPB235 (hot-rolled plain steel bar). The yield strength was 300 MPa and the ultimate strength was 430 MPa. The detailed parameters of beam specimens are shown in Table 3. The dimensions and reinforcement details for all tested beams are shown in Figure 3.

3.4. Test Setup and Loading Protocol

The beam test was carried out on a 10,000 kN electro-hydraulic servo universal testing machine. The test used four-point loading mode, and the loading device is shown in Figure 4. The load was symmetrically applied to the test beam by the distribution beam from the loading actuator. LVDT sensors were arranged at the middle span of the beam and at the supports to measure the deflection. In the meantime, a strain gauge was attached to the tensile steel reinforcement bar to measure the strain in steel reinforcement.
The specimen was loaded in load increments of 20 kN. The loading speed was 0.2 kN/s. The propagation of cracks was observed and the crack width was measured. When the load reached 180 kN, displacement control was applied at a rate of 0.2 mm/min until the shear failure occurred. The beam test setup and measurement configuration are shown in Figure 4 and Figure 5.

4. Results and Discussion

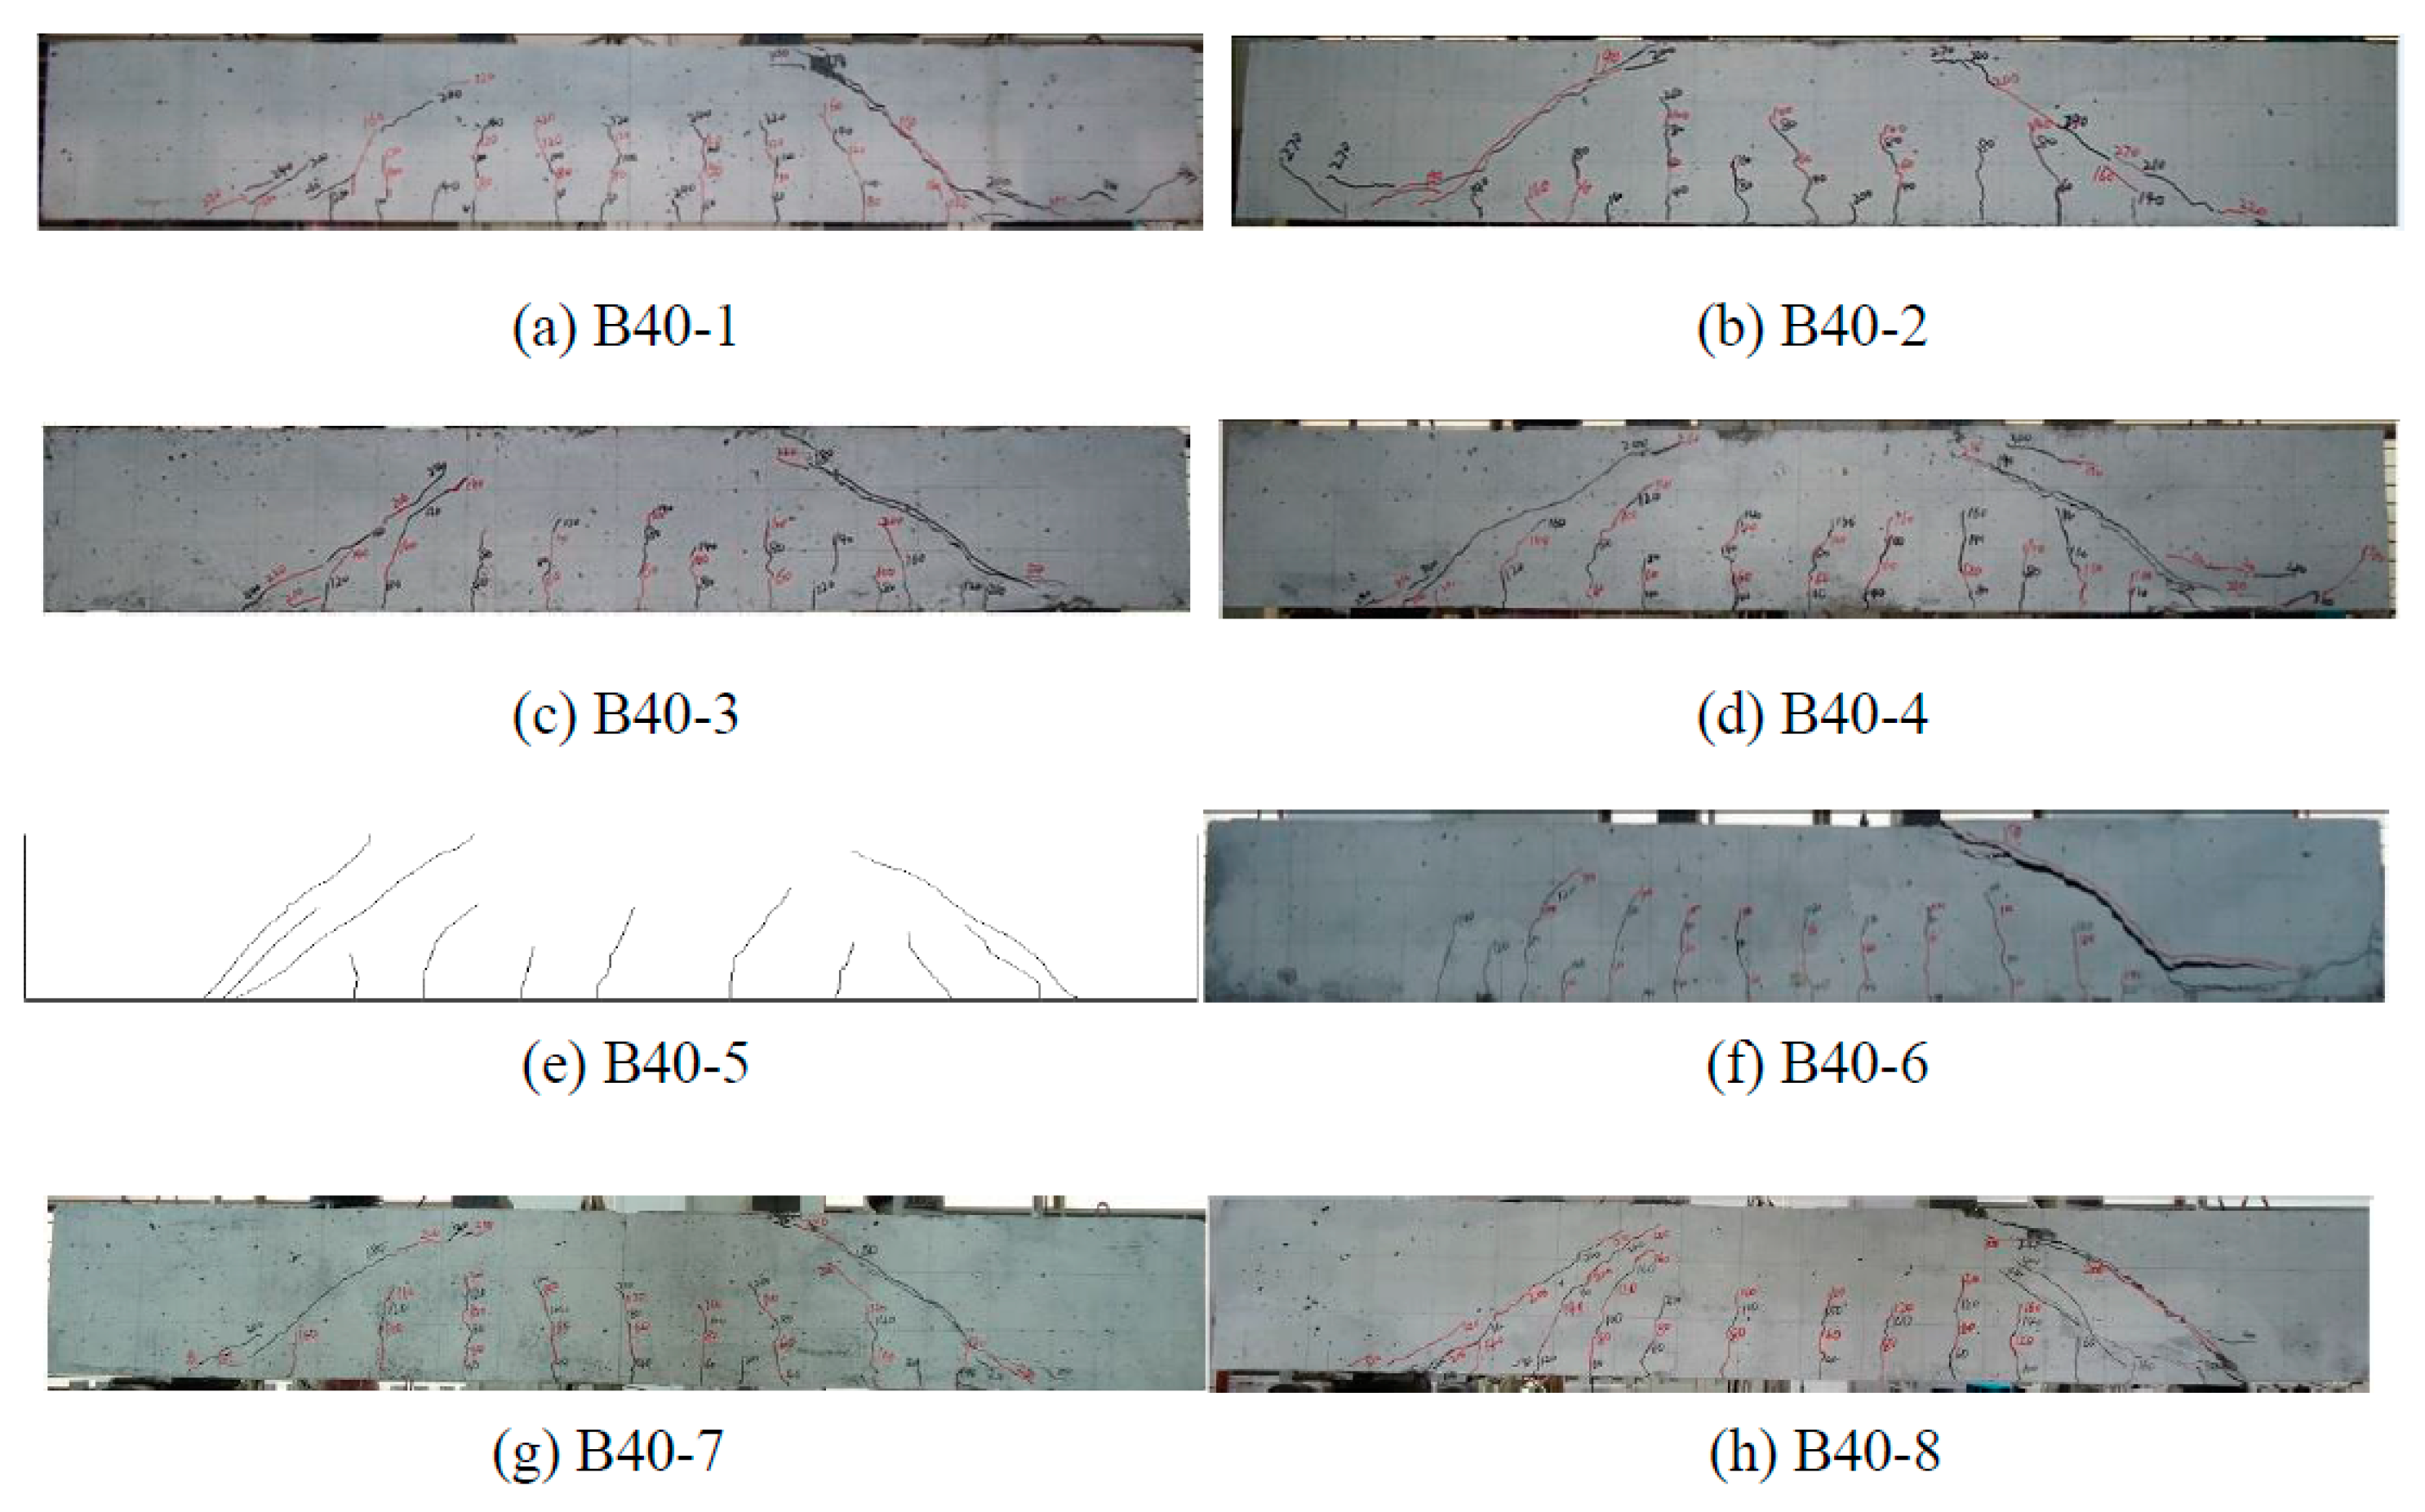
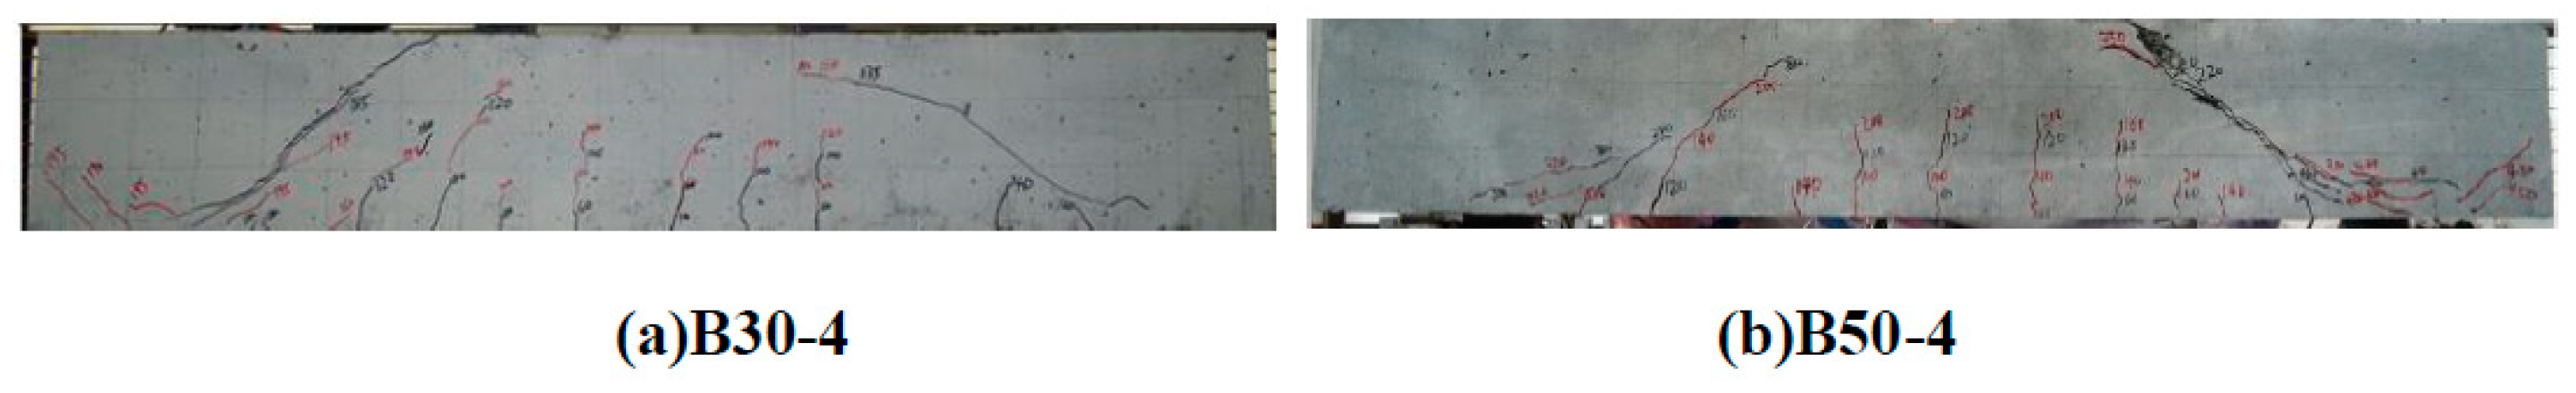
4.1. Experimental Observations

For shear span ratio λ of 2 (specimens other than B40-5 and B40-6), similar failure modes, namely shear failure, were observed for beam specimens. During the test, the vertical flexural crack first appeared in the pure flexural span. Then, vertically flexural cracks developed steadily with increasing load. As the load continued to grow, a smaller number of flexural cracks at the bottom of the shear span started to appear. When the cracking load was approached, the flexural crack in the pure flexural region no longer developed and the height was generally between h/3 and h/2. As the load continued to increase, the diagonal shear crack appeared in the shear span and developed rapidly. The critical main crack was then formed between the loading point and the support on the same side, and the ultimate load capacity was achieved. No significant differences in failure mode were seen in the four beams. The failure modes of the grade C40 concrete beam specimens are shown in Figure 6. The typical failure mode of the grade C30 and C50 concrete beams can be seen in Figure 7.
The concrete beam B40-5 with a shear span ratio of 1 showed diagonal compression shear failure, as shown in Figure 6e. It should be mentioned that the original photo of the failure of B40-5 was lost accidentally and the drawing of cracks at final failure is shown as a replacement. At 140 kN, the first crack appeared in the pure flexural region. A relatively small number of cracks were found and the development of cracks was slow. When the ultimate load capacity was reached, two accompanying cracks appeared next to the critical crack. Concrete was crushed at the top between the diagonal cracks at failure.
Diagonal tension failure was observed for beam specimen B40-6 with a shear span ratio of 3, as shown in Figure 6f. When the load reached 40 kN, several vertical cracks appeared in the pure flexural region. Cracks developed quickly after that. At 60 kN, the vertical cracks extended to 1/3 h. At 80 kN, diagonal cracks began to appear in the shear span and developed rapidly until the ultimate load capacity of 155.6 kN was reached. Figure 6g,h also shows the failure mode of B40-7 and B40-8, beam specimens that contained stirrups. More ductile failure was observed in the failure of specimens B40-7 and B-40-8 compared with specimens without stirrup reinforcement.

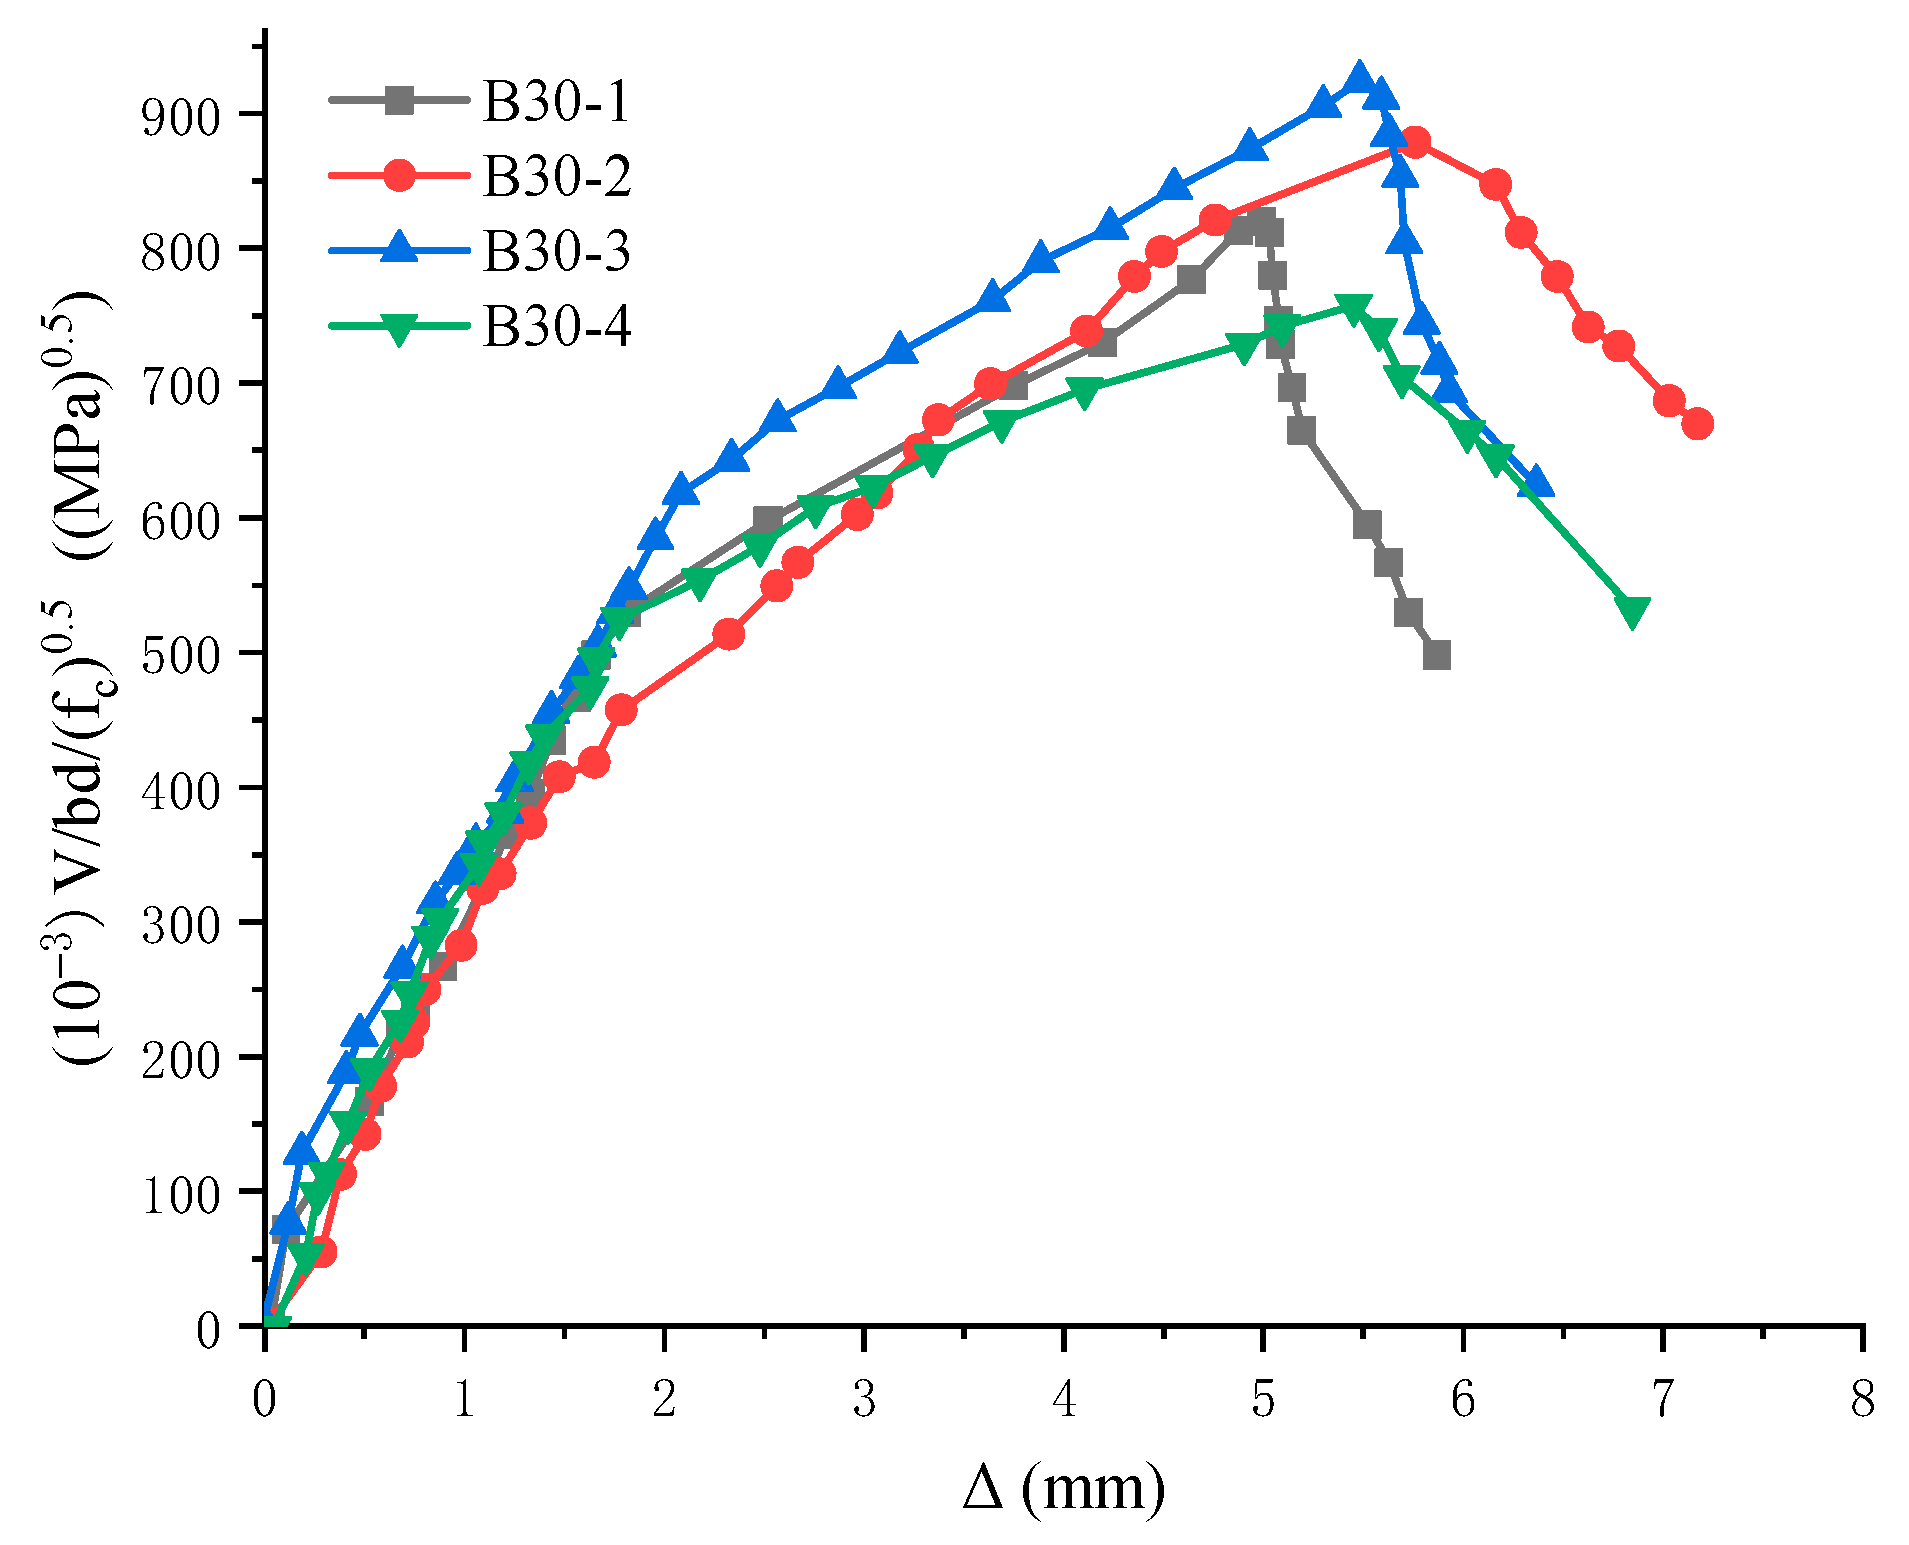
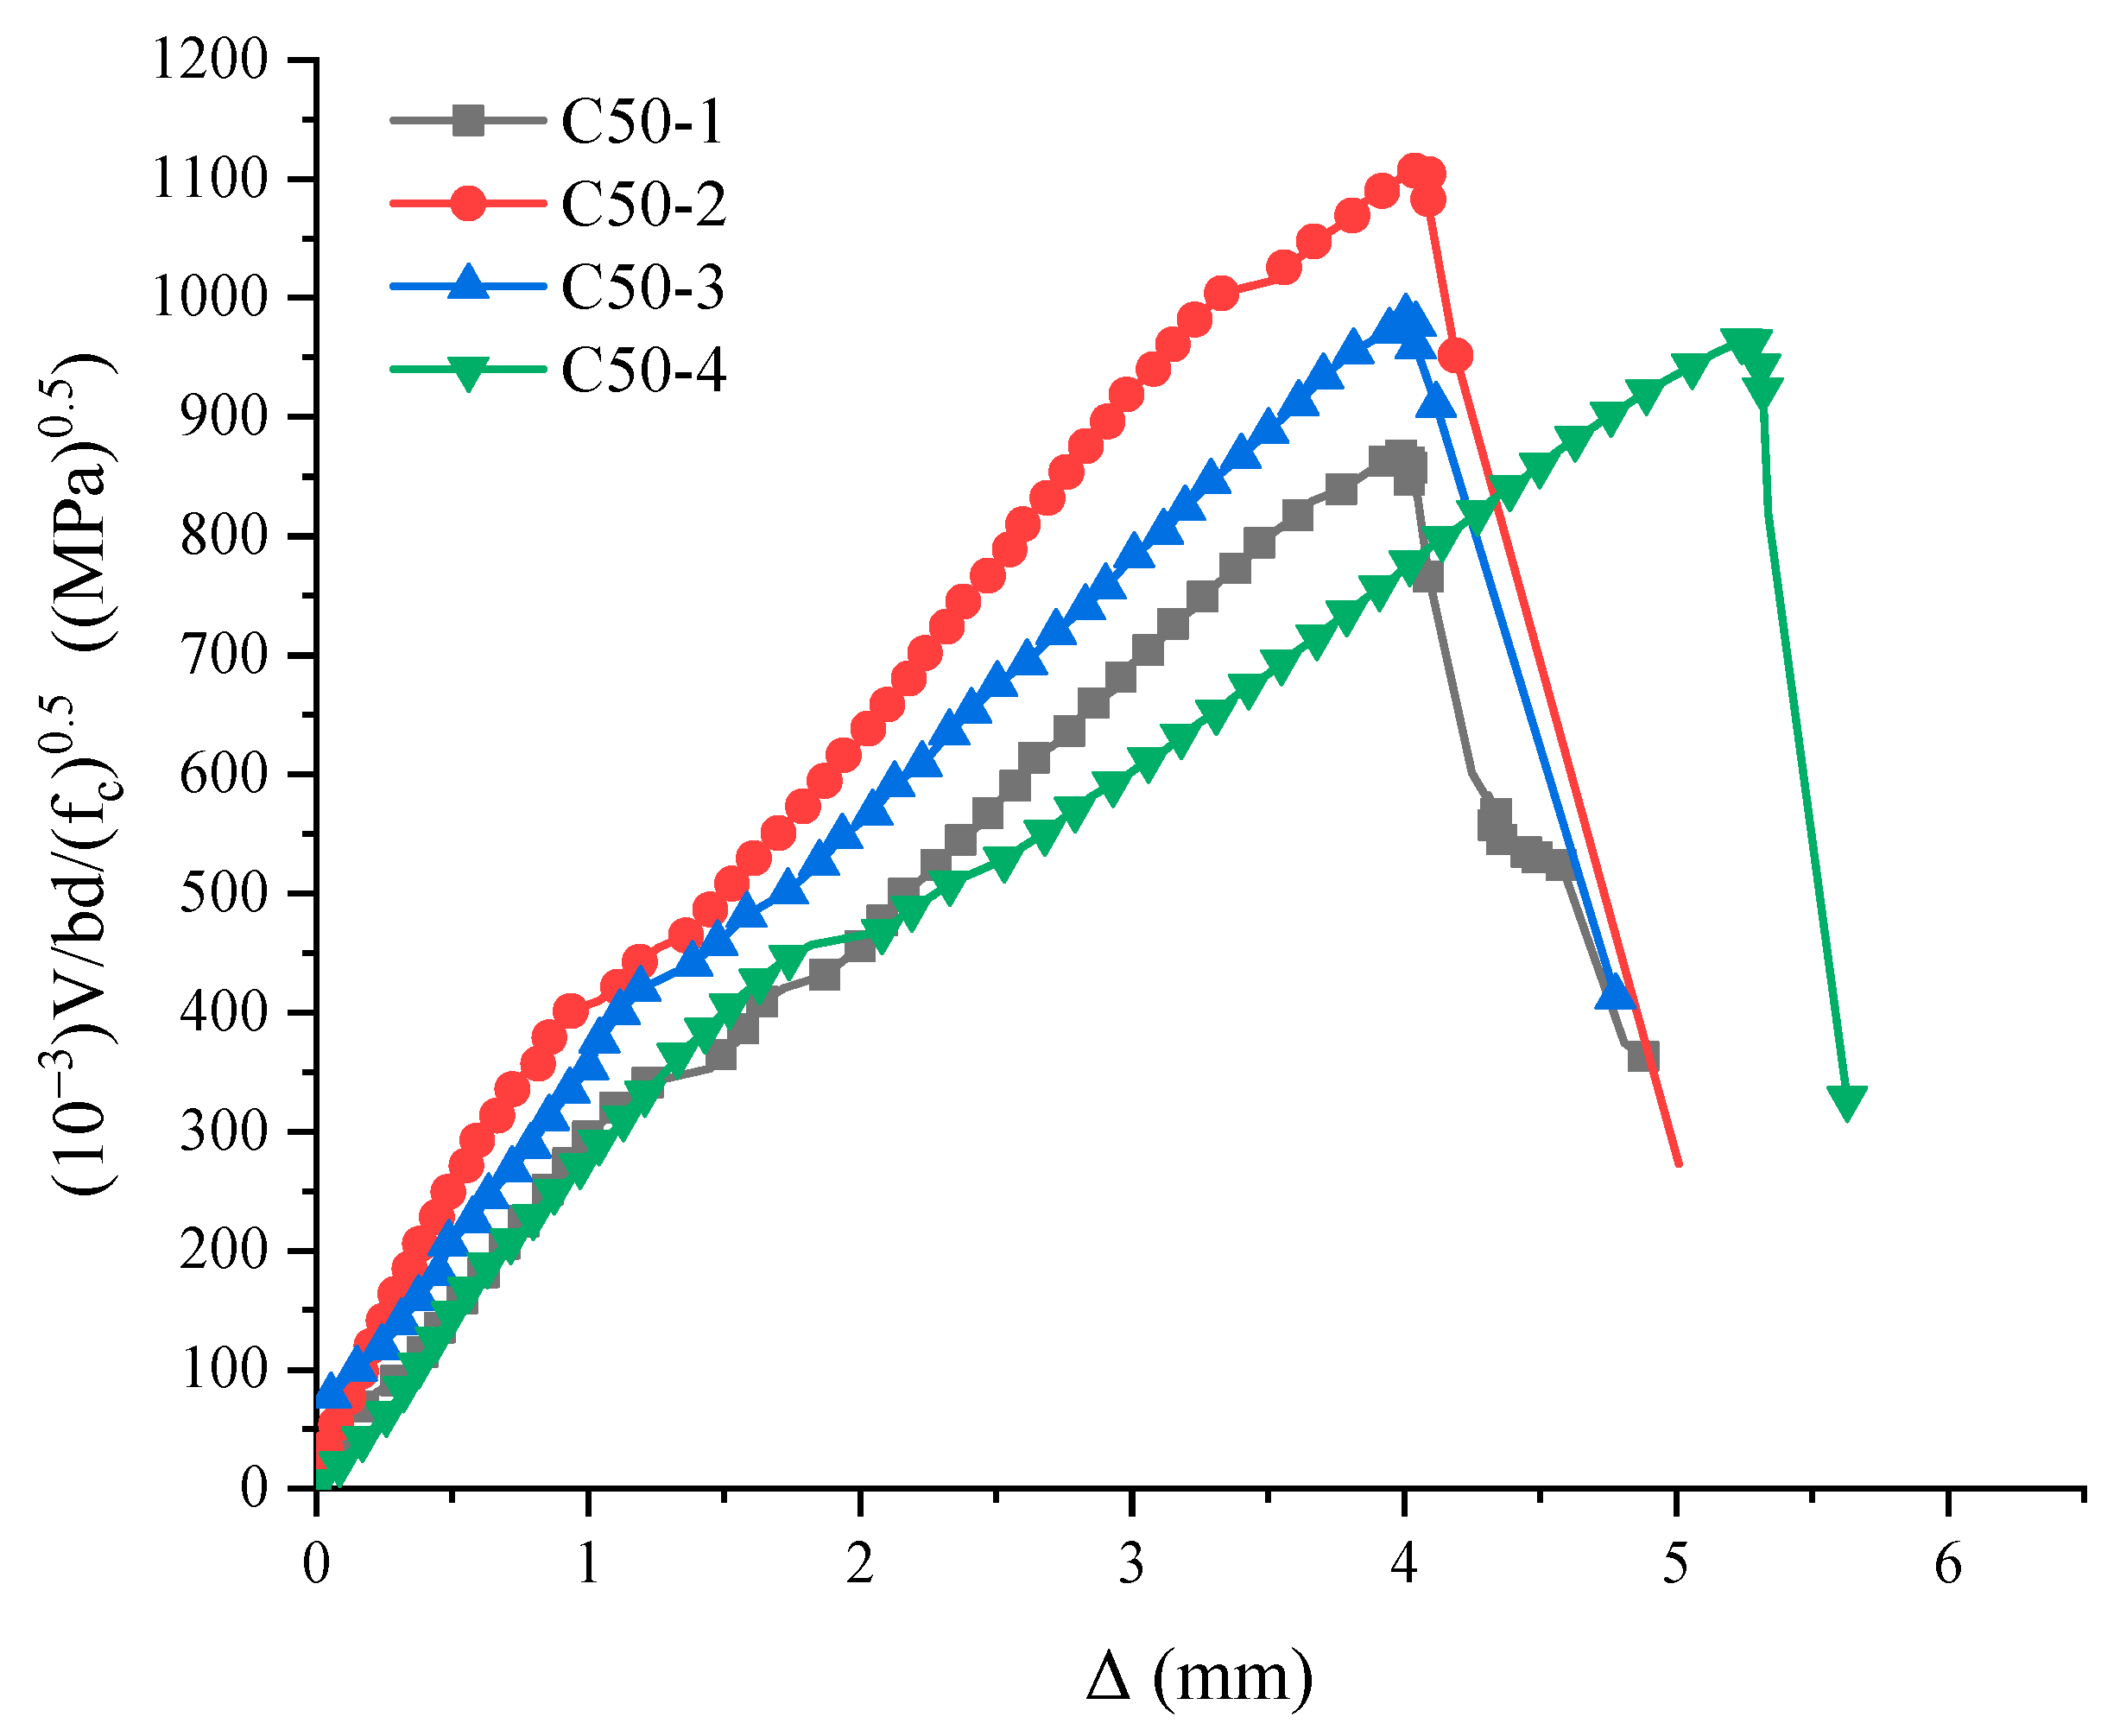
4.2. Influence of Various Factors on the Load–Deflection Curve

The load–deflection curves of C30, C40 and C50 concrete beam specimens at 0–20% filling ratio are shown in Figure 8, Figure 9 and Figure 10. It can be seen that the load–deflection curves consist of three sections. The first section is from the beginning of the test to the cracking of concrete in the tension zone. The beam specimen is in the elastic state and the load–deflection curve is basically close to a straight line. From concrete cracking to longitudinal steel yielding in the second section, the beam specimen is in the service state with cracks. The load–deflection curve is still nearly straight, but the slope of the curve changes after the concrete cracks. From the yield of the tensile steel to the third stage of the beam failure, the test beam is in the yielding stage, until the ultimate load capacity is reached.
The load–deflection curves of C40 grade concrete beam with different shear span ratios λ are shown in Figure 11. It can be seen that with the increase in shear span ratio, the ultimate load capacity of the beam and its corresponding deflection, the stiffness drops rapidly. Among the samples, B40-5 (λ = 1) shows diagonal compression failure, and the ultimate load capacity mainly depends on the compressive strength of concrete. B40-6 (λ = 3) shows diagonal tension failure, and the ultimate load capacity depends on the tensile strength of concrete. Figure 12 shows the load–deflection curves of C40 grade concrete beams at stirrup ratios of 0% (B40-4), 0.22% (B40-7) and 0.33% (B40-8). It is evident that as the shear reinforcement ratio increases, the ultimate shear capacity, the corresponding deflection and the stiffness of the beam all increase.

4.3. The Effect of Post-Filling Aggregate Ratio

The cracking shear load and ultimate shear capacity with the variation of post-filling aggregate ratio of 16 beam specimens are shown in Figure 13. As shown in Figure 13a, when the concrete strength grade is constant, the cracking shear load of the beam increases with the increase in post-filling ratio, except for B30-4 and B40-2. Compared with the reference concrete (0% post-filling aggregate ratio), the cracking shear load of C30, C40 and C50 concrete beam specimens reached the highest levels of 150.2 kN (increase of 24.85%), 195.0 kN (increase of 30.0%) and 217 kN (increase of 43%) at post-filling ratios of 15%, 20% and 15%, respectively. Since the cracking shear load of the concrete beam is related to the tensile strength of the concrete, the tensile strength of concrete increases with the increase in the concrete strength grade and the filling ratio. Therefore, when the post-filling ratio is constant, the cracking shear load of the test beam increases as the concrete grade increases. This trend can be found in Figure 13a, except for specimen B40-2.
From Figure 13b, it can be seen that the ultimate shear capacity of the test beam is generally larger than that of the reference beam after the coarse aggregate is post-filled. For C30 and C40 grade beam specimens, the highest shear capacity is reached at the post-filling aggregate ratio of 15%. For the C50 grade beam specimen, the ultimate shear capacity is achieved when the post-filling ratio is 10%. Compared with the reference concrete (0% post-filling aggregate ratio), the ultimate shear capacity of C30, C40 and C50 concrete beam specimens reached the highest levels of 343.8 kN (increase of 22.4%), 419.2 kN (increase of 19.19%) and 513.2 kN (increase of 34.1%) at post-filling ratios of 15%, 15% and 10%, respectively.

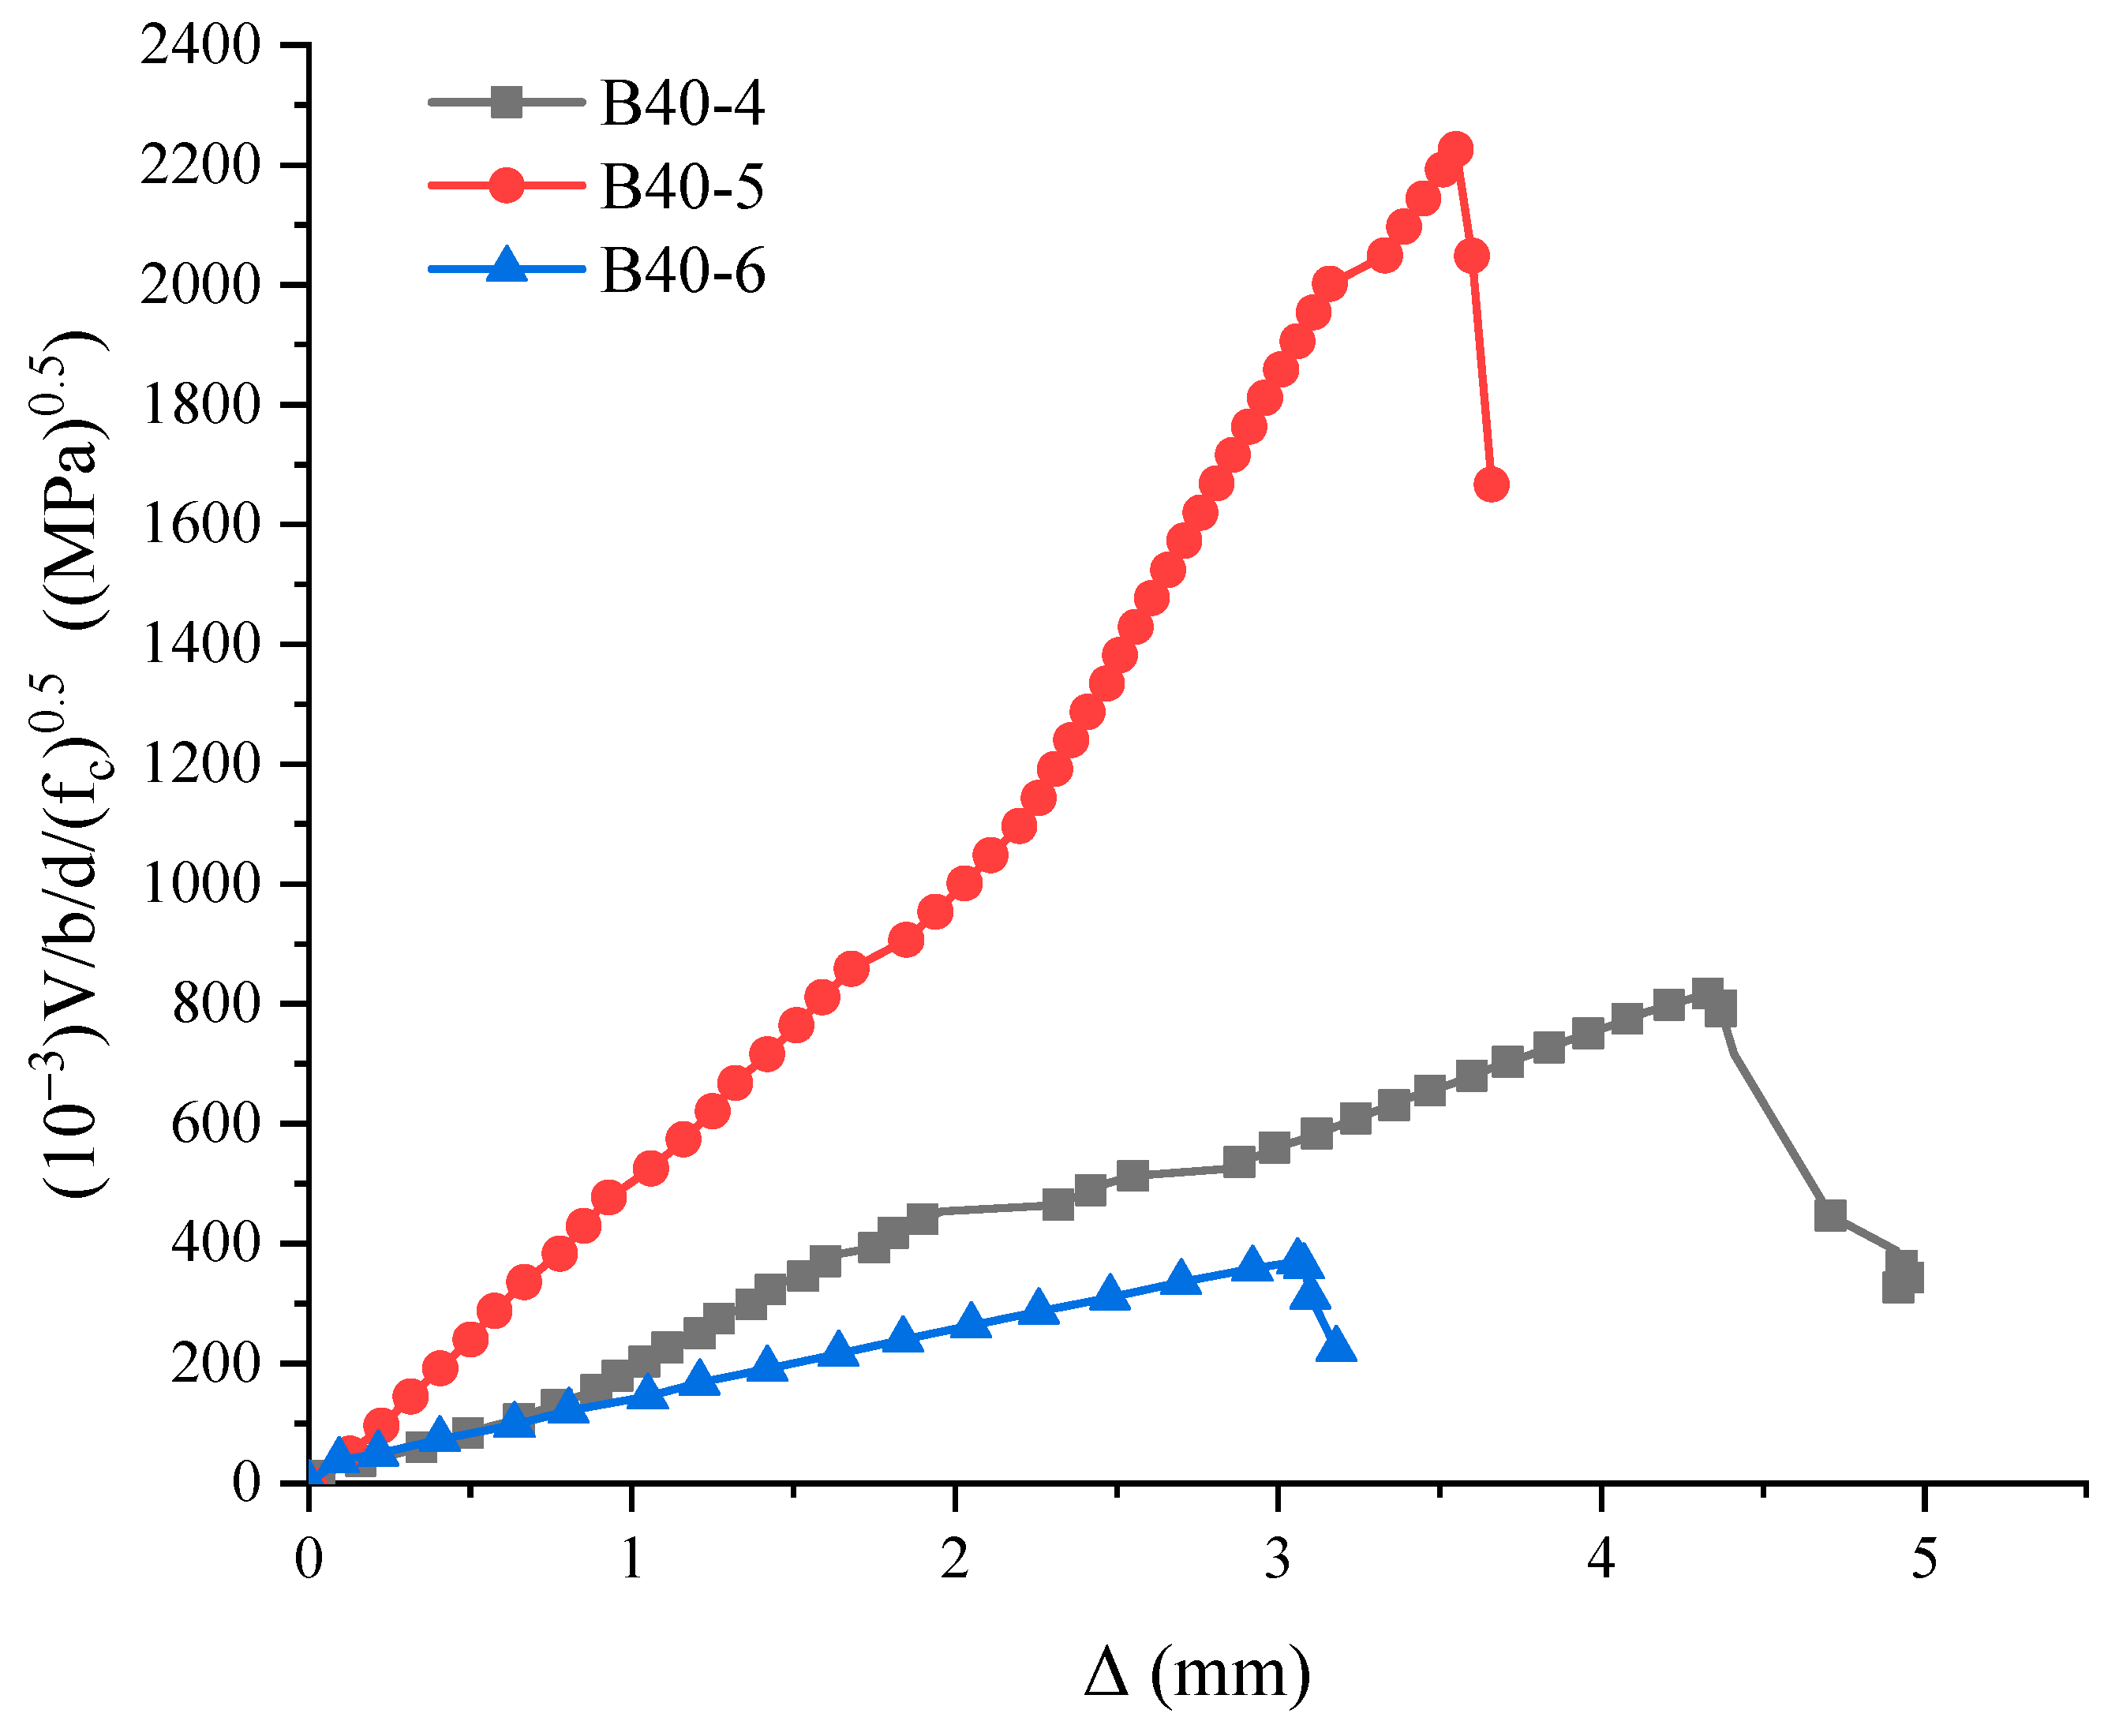
4.4. The Effect of Shear Span Ratio

Figure 14 shows the effect of the shear span ratio λ on the cracking shear force Vcr and the ultimate shear capacity Vu. As the shear span ratio increases, the load transfer mechanism in the beam changes, which in turn affects the stress state of the beam. The failure mode increases with the shear span ratio in the order of diagonal compression failure, shear failure and diagonal tension failure.
From Figure 14, it can be seen that, the cracking shear force and the ultimate shear capacity decrease as the shear span ratio increases. When λ = 3, the cracking shear force is reduced by 203 kN compared with λ = 1, which is reduced by 56.9%. When λ = 3, the ultimate shear capacity is reduced by 796.2 kN compared with λ = 1, which is reduced by 83.82%. This can be explained by the fact that the ultimate shear capacity of λ = 1 (B40-5) depends on the compressive strength of the concrete, and the ultimate shear capacity of λ = 3 (B40-6) depends on the tensile strength of the concrete. Therefore, both the cracking shear strength and the ultimate shear capacity decrease as the shear span ratio increases.

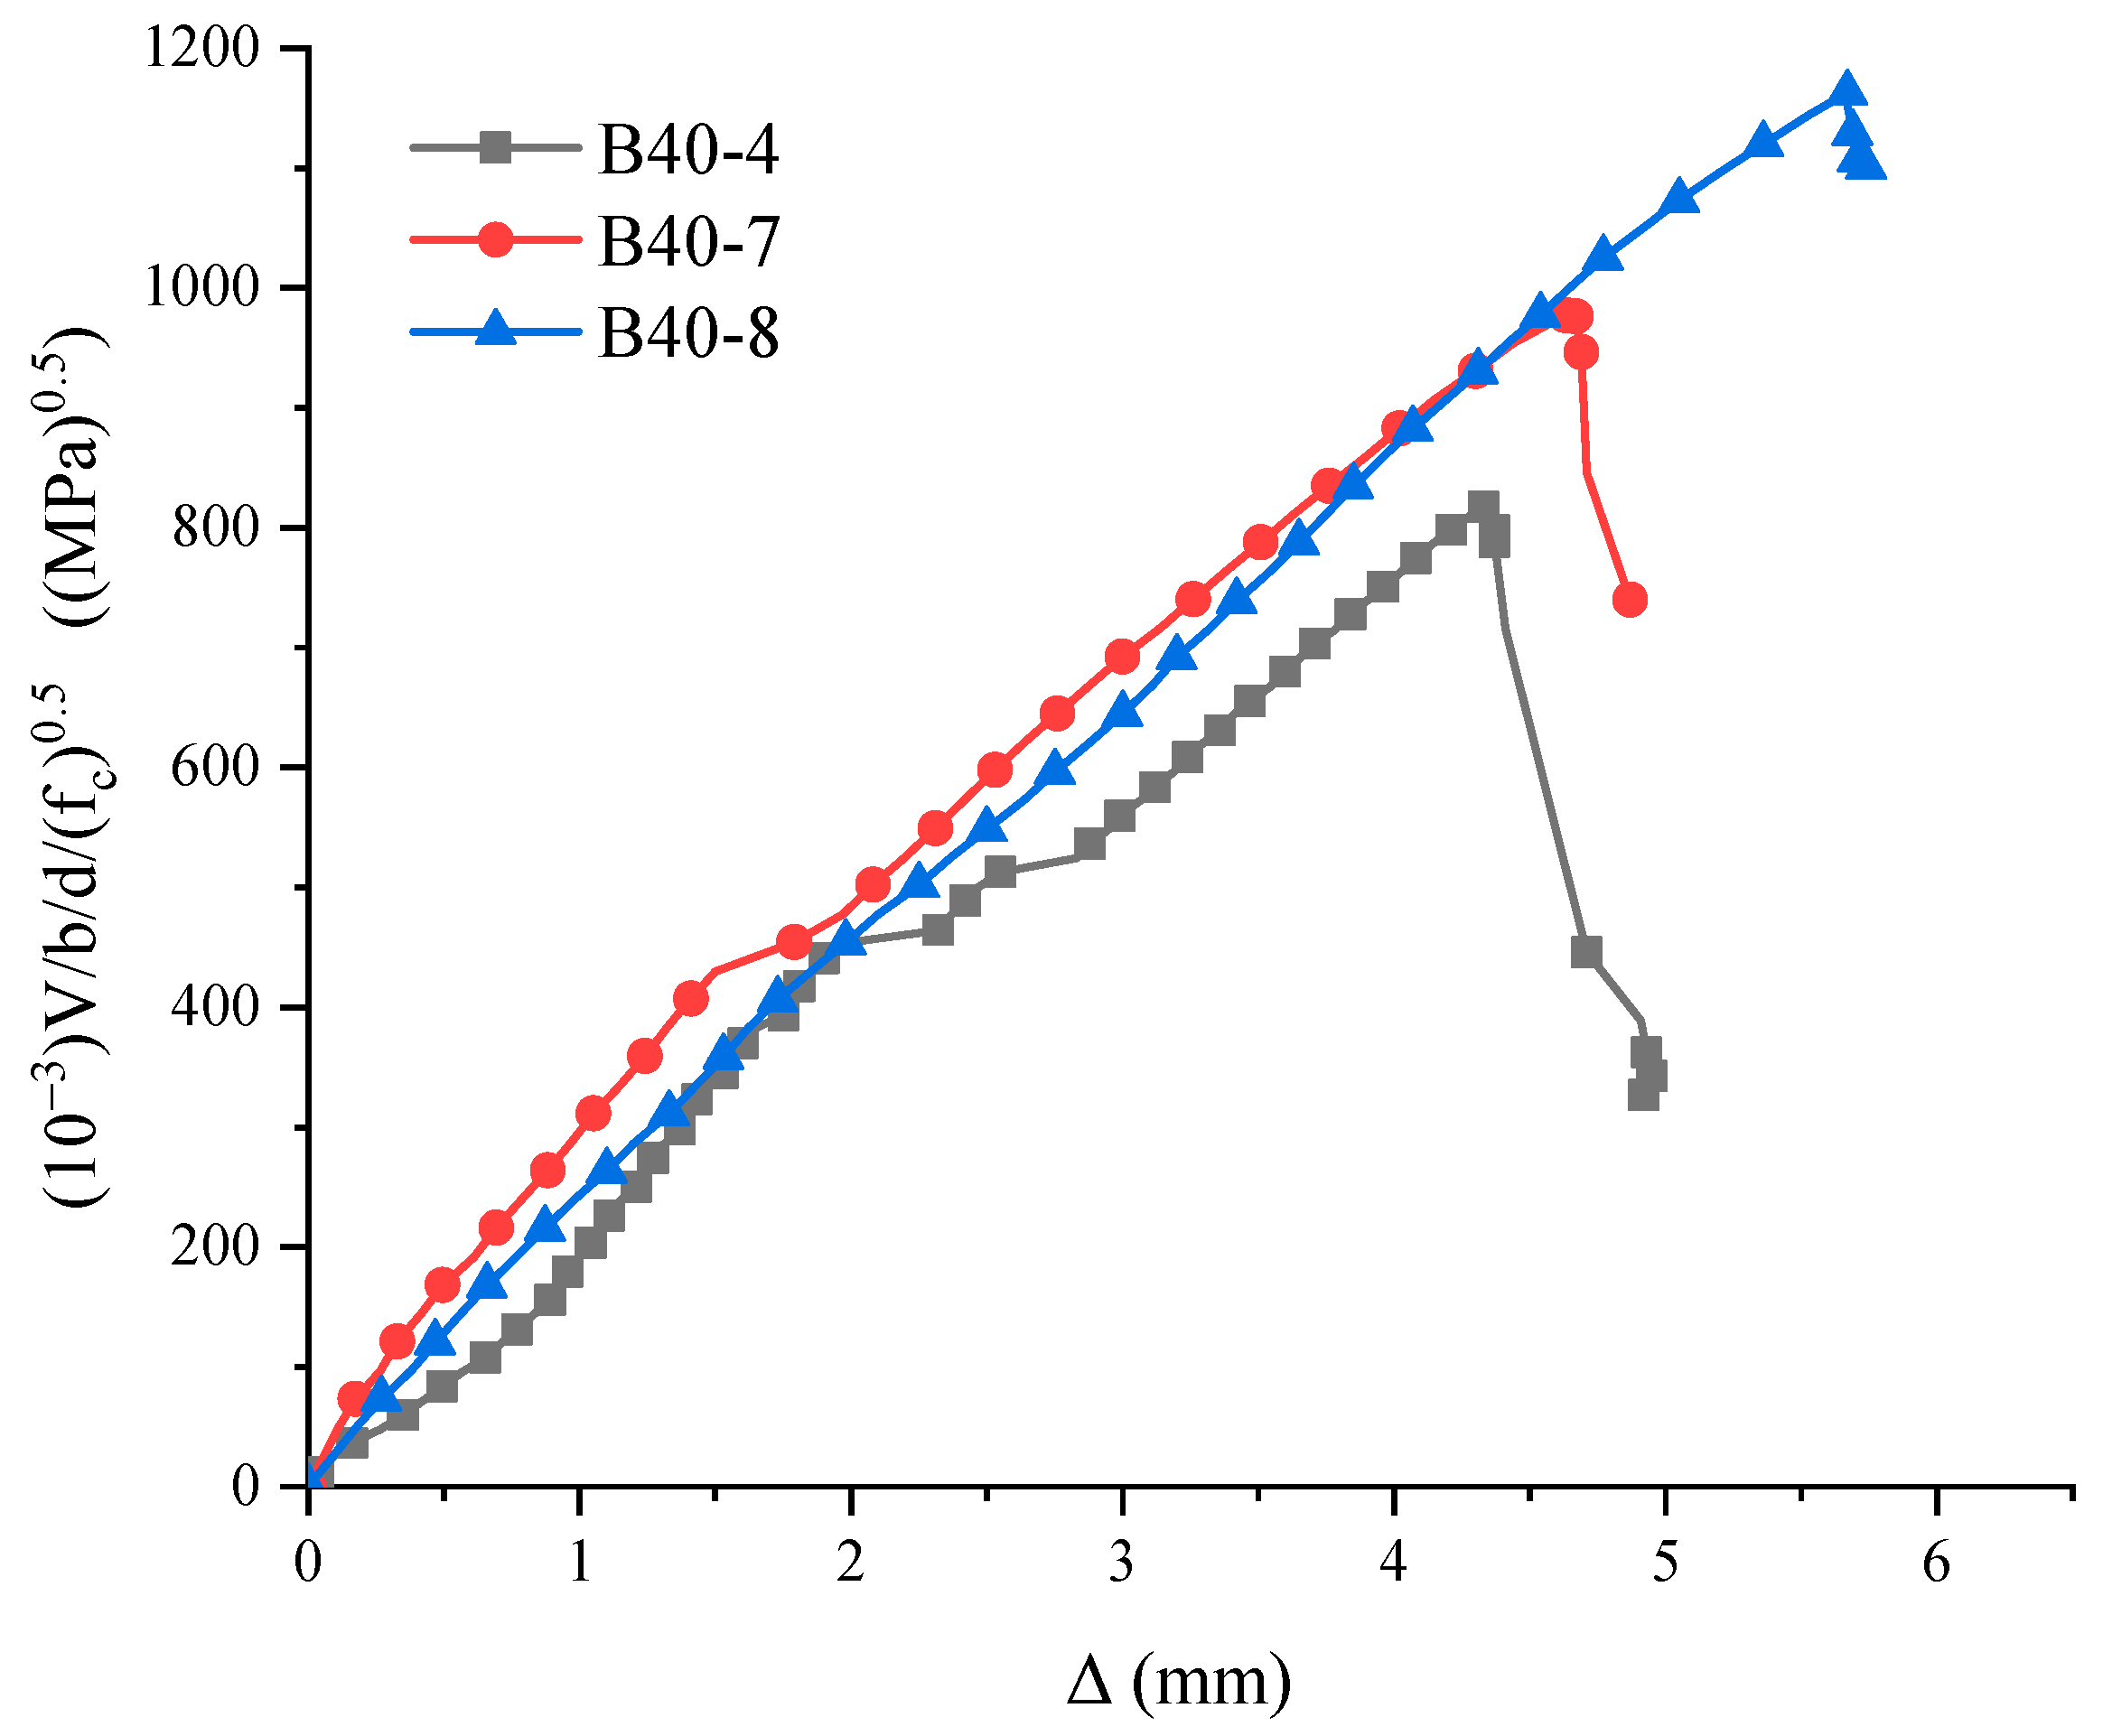
4.5. The Effect of Stirrup Reinforcement Ratio

Figure 15 shows the effect of the stirrup reinforcement ratio ρsv on the ultimate shear capacity Vu of a beam specimen. It exhibits that the ultimate shear capacity of the beam increases with the increase in the stirrup reinforcement ratio. It shows that the stirrup has a significant influence on the improvement of the ultimate shear capacity of the beam. Compared with B40-4, the ultimate shear capacity of B40-8 is increased by about 127.3 kN, which is 36%, by a stirrup reinforcement ratio increase of 0.33%.
Figure 16 shows the relationship between the ultimate shear capacity and the strain of the stirrup. The whole process can be divided into two stages. Before the occurrence of the diagonal crack, it is difficult for the stirrup to form effective confinement on the concrete; i.e., the effects of the stirrup on the improvement of strength of the concrete under the combined stress state and the improvement of the internal microcracks are very weak. The cracking shear load of B40-7 and B40-8 is basically the same; the strain of the stirrup is about 30 με, as can be seen in Table 4 and Figure 16. After the appearance of the diagonal crack, the strain of the stirrup increases rapidly, and there is an approximately linear relationship between the strain of the stirrup and the shear force. Due to the larger stirrup reinforcement ratio, the slope of the Vu–ε of specimen B40-8 is higher than that of specimen B40-7.

4.6. Comparison of Theoretical and Experimental Results

According to the code for design of concrete structures (GB50010-2010) [30], the equations for calculating the ultimate shear capacity Vu of the concrete beams without stirrup reinforcement and with stirrup reinforcement are Equation (1) and Equation (2), respectively, given as follows:
V u 0.7 f t b h 0
V u 0.7 f t b h 0 + f y v A s v s h 0
where fyv is the tensile strength of shear reinforcement, Asv is the area of shear reinforcement and s is the spacing of shear reinforcement. The meaning of other symbols can be found in Notation.
The theoretical shear capacities Vu.cal were calculated according to Equations (1) and (2) and were compared with the experimental results Vu.exp. The results are shown in Table 4. It shows that the ratio of Vu.exp/Vu.cal is in the range of 2.5 to 3.7 for all samples with a shear span-to-depth ratio of 2. The results indicate that the code GB50010 best predicts the specimen B40-6 with Vu.exp/Vu.cal equal to 1.17. In all, the results exhibit that the code GB50010 provides conservative predictions for ultimate shear capacities for all tested beams in this study.

5. Conclusions

Based on the experimental investigation and analysis conducted in this study, the following conclusions can be drawn:
(1)
The compressive strength of concrete increases with the increase in post-filling aggregate filling ratio, reaching the maximum at 20% PFR (post-filling coarse aggregate ratio). The compressive strength decreases at a 25% PFR.
(2)
At the same concrete strength grade, the cracking shear force Vcr of the beam increases with the increase in the PFR ratio. The ultimate shear capacity of concrete beam specimens made of post-filling aggregate is higher than that of reference concrete. At the same PFR ratio, the ultimate shear capacity of the beam increases with the increase in the concrete grade.
(3)
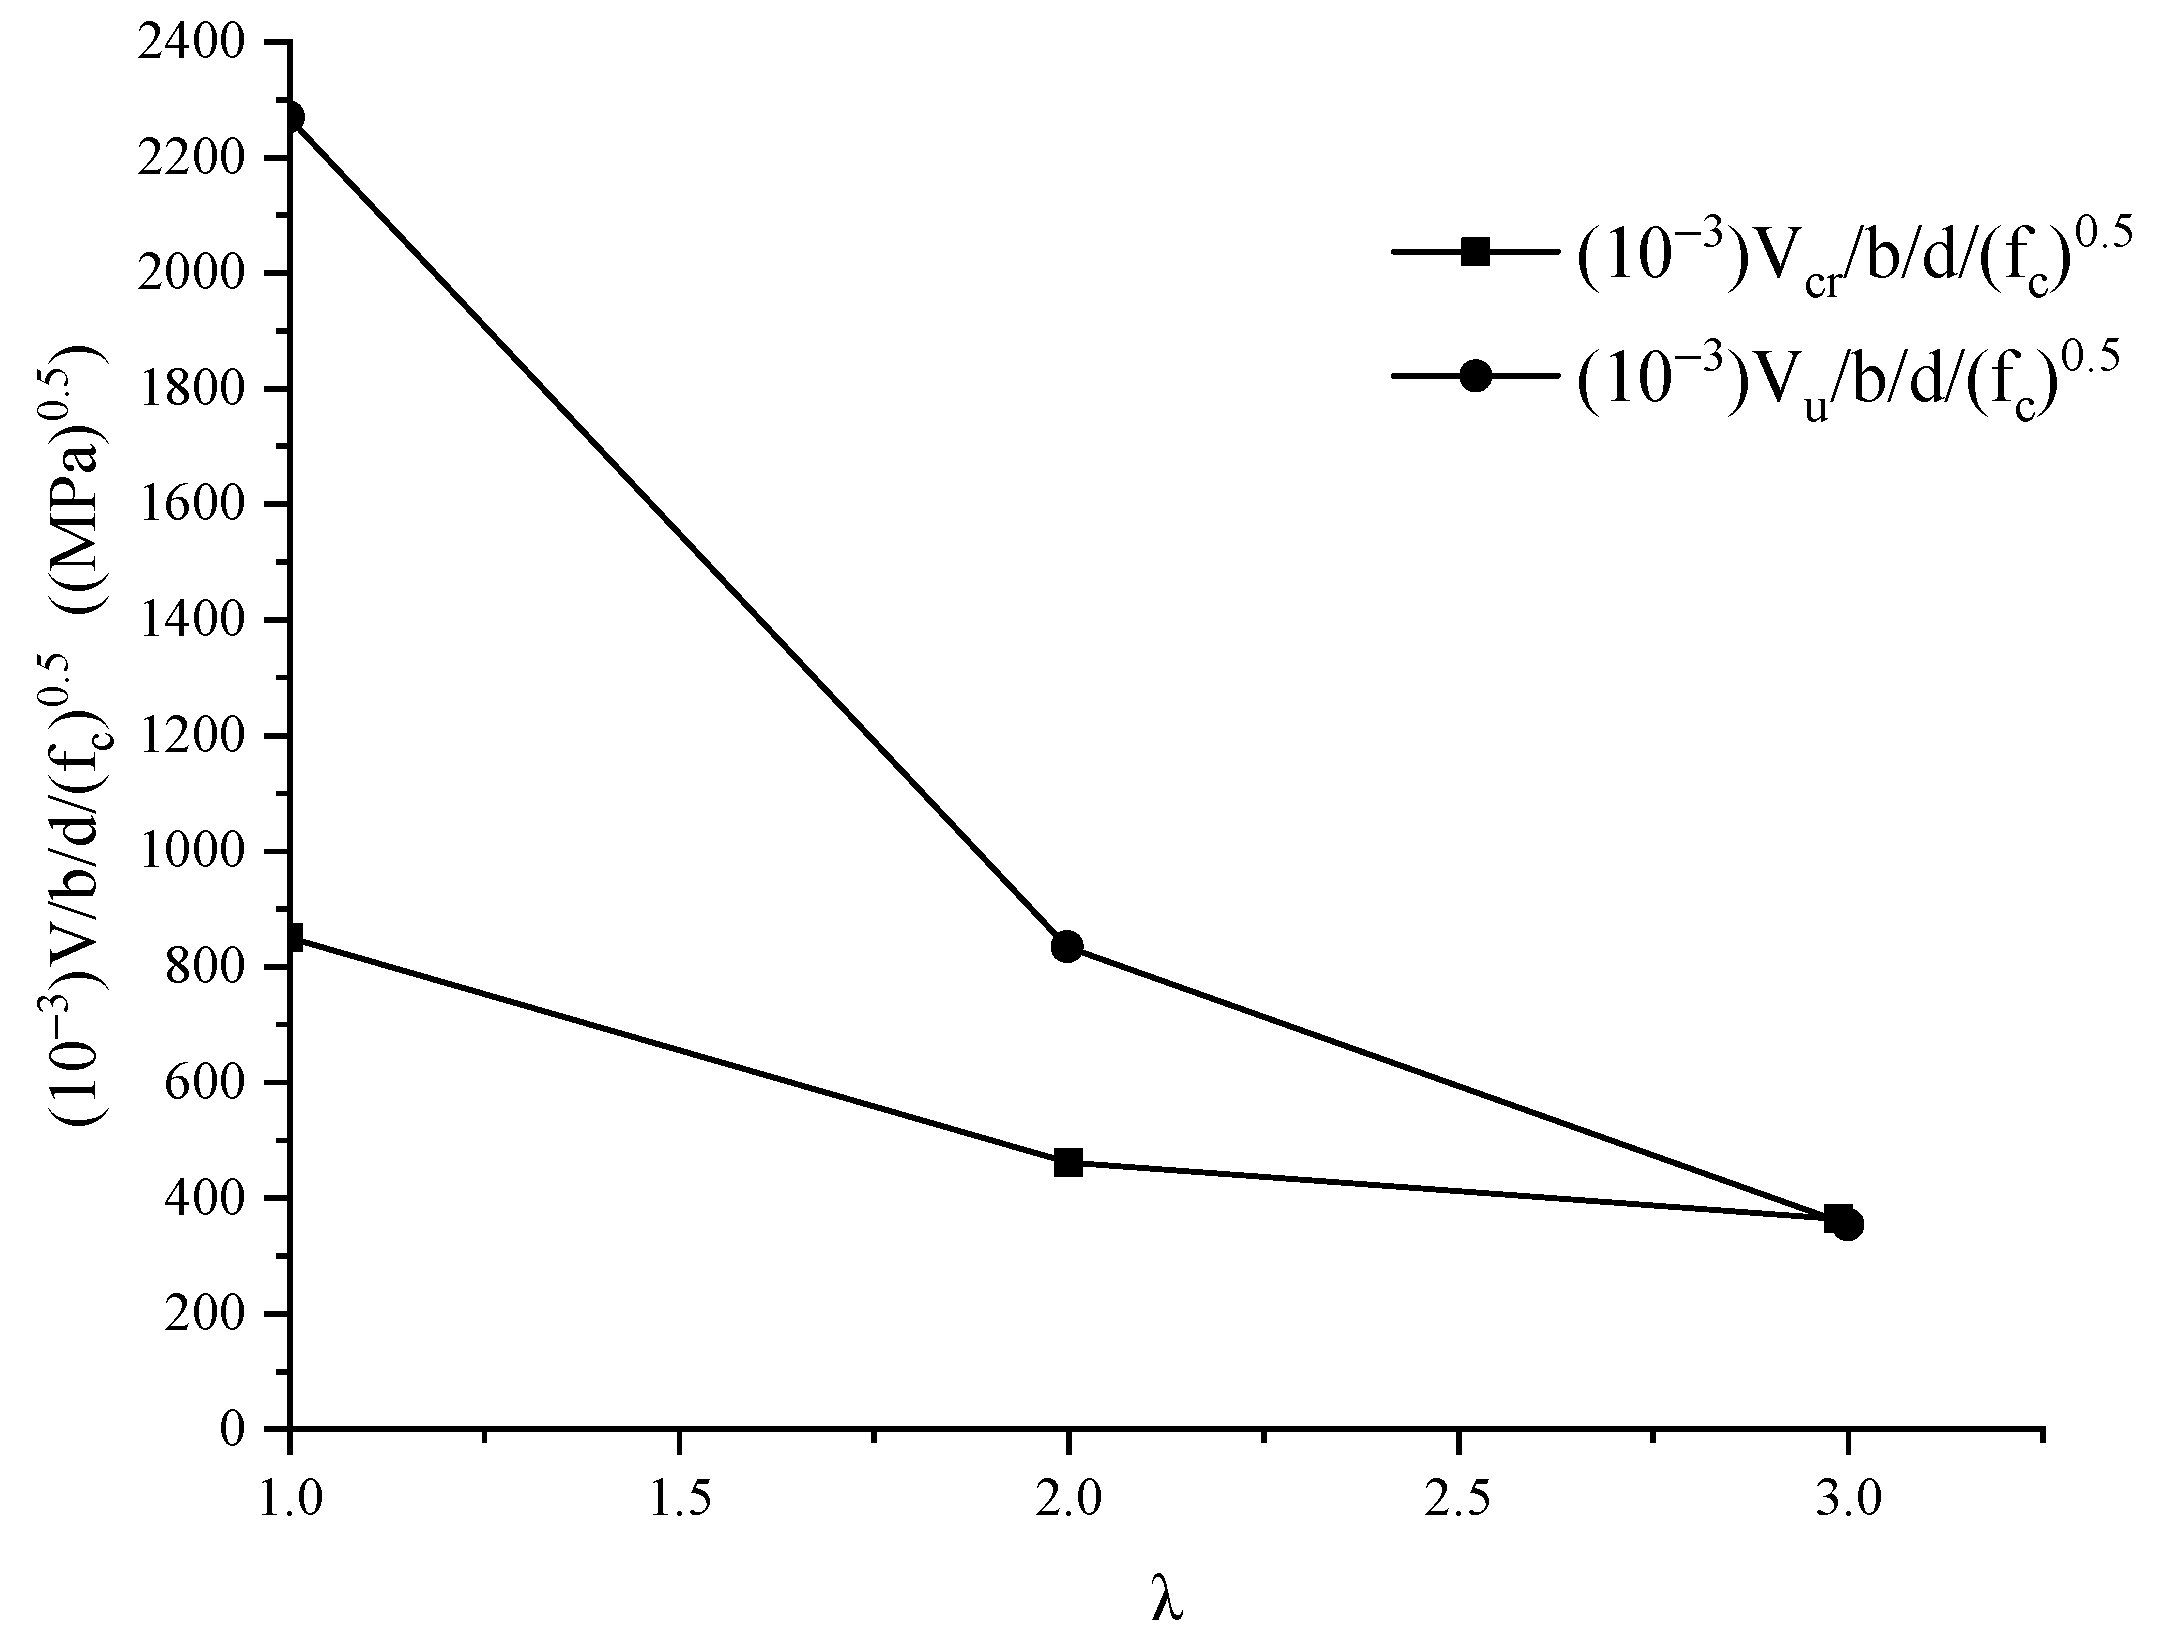
Experimental results show that both the cracking shear force and ultimate shear capacity decrease with the increase in the shear span ratio.
(4)
The ultimate shear capacity of the beam increases with the increase in the stirrup ratio. The stirrup reinforcement ratio exhibits a noticeable influence on the enhancement of the ultimate shear capacity of the beam.
(5)
The code GB50010 provides conservative predictions for ultimate shear capacities Vu for all tested beam specimens.

Author Contributions

Supervision, J.J.; conceptualization, J.J.; funding acquisition, J.J.; investigation, Q.C.; writing—original draft preparation, Q.C.; writing—review and editing Q.C., L.Z.; project administration, L.Z., data curation, Y.H.; Software, Y.H., Z.M. All authors have read and agreed to the published version of the manuscript.

Funding

Authors would like to acknowledge the financial support provided by Foundation for High-Level Talent Innovation Support Program of Dalian (2019RD05), the National Key R&D Program of China (Project No. 2018YFC1505302), the Natural Science Foundation of Liaoning Province (2021-MS-129) and the Fundamental Research Funds for the Central Universities (Project No. DUT20JC02).

Data Availability Statement

The data will be provided by the corresponding author upon request.

Conflicts of Interest

The authors declare no conflict of interest.

Notations

bwidth of concrete beam specimen
hheight of concrete beam specimen
h0effective height of beam specimen
fcucompressive strength of concrete
fttensile strength of concrete
λthe shear span-to-depth ratio
ρsvthe stirrup reinforcement ratio
Vcrthe cracking shear force
Vuthe ultimate shear capacity
Vu, expthe experimental ultimate shear capacity
Vu calthe calculated ultimate shear capacity according to GB50010
Δumid-span deflection at shear ultimate bearing capacity

References

  1. Shen, W. Effect of Scattering-Filling Aggregate Technology on the Mechanical Properties of Concrete. J. Build. Mater. 2007, 10, 711–716. (In Chinese) [Google Scholar]
  2. Shen, W.; Li, J.; An, T.; Wu, H.; Cheng, J.; Zhang, X. Research on The Coarse Aggregate Interlocking High Performance Concrete. J. Wuhan Univ. Technol. 2011, 12, 18–21. (In Chinese) [Google Scholar]
  3. Shen, W. Preparation and Properties of High Strength and High Performance Coarse Aggregate Interlocking Concr. J. Chin. Ceram. Soc. 2007, 35, 624–628. (In Chinese) [Google Scholar]
  4. Li, J. Study on Coarse Aggregate Interlocking Pavement. Ph.D. Thesis, Wuhan University of Technology, Wuhan, China, 2011. (In Chinese). [Google Scholar]
  5. Jia, J.; Cao, Q.; Luan, L.; Wang, Z.; Zhang, L. Mechanical Properties of Large Slump Concrete Made by Post-Filling Coarse Aggregate Mixing Procedure. Materials 2020, 13, 2761. [Google Scholar] [CrossRef]
  6. Wang, D. Experimental Study on Mechanical Properties and Frost Resistance of High Performance Pumping Concrete with After-mixing Coarse Aggregate. Master’s Thesis, Dalian University of Technology, Dalian, China, 2015. (In Chinese). [Google Scholar]
  7. Shen, W.; Cai, Z.; Zhang, T.; Abu, D.; Hu, J.Q.; Zhou, M.K. Influence of Scattering-Filling Coarse Aggregate on Properties of Self-compacting Concrete. J. Build. Mater. 2009, 12, 345–347. (In Chinese) [Google Scholar]
  8. Hong-Kun, M.; Yu, T.; Wei-Guo, S.; Li-Li, C.; Yong-Ming, X.; Li, Z. Preparation and Investigation of Ultra-high Strength Scattering-filling Aggregate Concrete. J. Wuhan Univ. Technol. 2012, 1, 8. (In Chinese) [Google Scholar]
  9. Luan, L. Experimental Study on Mechanical Properties of a New Type of Concrete; Dalian University of Technology: Dalian, China, 2014. (In Chinese) [Google Scholar]
  10. Rao, G.A.; Prasad, B.R. Influence of the roughness of aggregate surface on the interface bond strength. Cem. Concr. Res. 2002, 32, 253–257. [Google Scholar] [CrossRef]
  11. Meddah, M.S.; Zitouni, S.; Belâabes, S. Effect of content and particle size distribution of coarse aggregate on the compressive strength of concrete. Constr. Build. Mater. 2010, 24, 505–512. [Google Scholar] [CrossRef]
  12. Özturan, T.; Çeçen, C. Effect of coarse aggregate type on mechanical properties of concretes with different strengths. Cem. Concr. Res. 1997, 27, 165–170. (In Chinese) [Google Scholar] [CrossRef]
  13. Shi, C. Strength, pore structure and permeability of alkali-activated slag mortars. Cem. Concr. Res. 1996, 26, 1789–1799. [Google Scholar] [CrossRef]
  14. Aïtcin, P.-C.; Mehta, P.K. Effect of coarse aggregate characteristics on mechanical properties of high-strength concrete. Mater. J. 1990, 87, 103–107. [Google Scholar]
  15. Zhou, F.P.; Lydon, F.D.; Barr, B.I.G. Effect of coarse aggregate on elastic modulus and compressive strength of high performance concrete. Cem. Concr. Res. 1995, 25, 177–186. [Google Scholar] [CrossRef]
  16. Kaplan, M.F. Flexural and compressive strength of concrete as affected by the properties of coarse aggregates. J. Proc. 1959, 55, 1193–1208. [Google Scholar]
  17. Giaccio, G.; Rocco, C.; Violini, D.; Zappitelli, J.; Zerbino, R. High-strength concretes incorporating different coarse aggregates. Mater. J. 1992, 89, 242–246. [Google Scholar]
  18. Akçaoğlu, T.; Tokyay, M.; Çelik, T. Effect of coarse aggregate size on interfacial cracking under uniaxial compression. Mater. Lett. 2002, 57, 828–833. [Google Scholar] [CrossRef]
  19. Grassl, P.; Wong, H.S.; Buenfeld, N.R. Influence of aggregate size and volume fraction on shrinkage induced micro-cracking of concrete and mortar. Cem. Concr. Res. 2010, 40, 85–93. [Google Scholar] [CrossRef] [Green Version]
  20. Counto, U.J. The effect of the elastic modulus of the aggregate on the elastic modulus, creep and creep recovery of concrete. Mag. Concr. Res. 1964, 16, 129–138. [Google Scholar] [CrossRef]
  21. Cao, Q.; Jia, J.; Zhang, L.; Ye, H. Steel reinforced post-filling coarse aggregate concrete columns under eccentric compression. Constr. Build. Mater. 2020, 270, 121420. [Google Scholar] [CrossRef]
  22. Cao, Q.; Jia, J.; Zhang, L.; Ye, H.; Lv, X. Experimental study of axial compression of reinforced concrete columns made by environment-friendly post-filling coarse aggregate process. Struct. Concr. 2021. Online. [Google Scholar] [CrossRef]
  23. Jia, J.Q.; Li, H.N.; Tu, B.; Wu, F.; Feng, S.; Gao, J.C. Construction Technology for One Kind of Concrete. Chinese Patent ZL201510416607.2, 2015. (In Chinese). [Google Scholar]
  24. Ministry of Housing and Urban-Rural Construction of the People’s Republic of China. Technical Code for Application of Fly Ash Concrete; GB 50146-2014; China Building Industry Press: Beijing, China, 2014. (In Chinese)
  25. Shih-Wei, C.; Chung-Chia, Y.; Ran, H. Effect of aggregate volume fraction on the elastic moduli and void ratio of cement-based materials. J. Mar. Sci. Technol. 2000, 8, 1–7. [Google Scholar]
  26. Stock, A.F.; Hannantt, D.J.; Williams, R.I.T. The effect of aggregate concentration upon the strength and modulus of elasticity of concrete. Mag. Concr. Res. 1979, 31, 225–234. [Google Scholar] [CrossRef]
  27. Pradhan, S.; Kumar, S.; Barai, S.V. Recycled aggregate concrete: Particle Packing Method (PPM) of mix design approach. Constr. Build. Mater. 2017, 152, 269–284. [Google Scholar] [CrossRef]
  28. Ministry of Housing and Urban-Rural Construction of the People’s Republic of China. Technical Specification for Construction of Concrete Pumping; JGJ/T 10-2011; China Building Industry Press: Beijing, China, 2011. (In Chinese)
  29. Ministry of Housing and Urban-Rural Construction of the People’s Republic of China. Standard for Testing Method of Concrete Structures; GB 50152-2012; China Building Industry Press: Beijing, China, 2012. (In Chinese)
  30. Ministry of Housing and Urban-Rural Construction of the People’s Republic of China. Design Code for Concrete Structures; GB 50010-2010; China Building Industry Press: Beijing, China, 2010. (In Chinese)
Figure 1. Schematic diagram of construction technology for post-filling coarse aggregate concrete. (1) Concrete truck, (2) delivery pump for concrete, (3) conveying line for concrete, (4) distribution spreader, (5) balancing weight for distribution spreader, (6) coarse aggregate storage silo, (7) turbine, (8) speed reducer, (9) motor, (10) support for coarse aggregate distribution spreader, (11) spiral conveyor device. (a) Construction technology for post-filling coarse aggregate concrete. (b) Zoom in view of “A”.
Buildings 11 00576 g001
Figure 2. Cross-sections of concrete with different post-filling coarse aggregate ratios. (a) reference concrete; (b) PFCC with 10% PFR; (c) PFCC with 15% PFR; (d) PFCC with 20% PFR; (e) PFCC with 25% PFR.
Buildings 11 00576 g002
Figure 3. Reinforcement diagram of the test specimens (unit: mm). (a) λ = 1, ρsv = 0. (b) λ = 2, ρsv = 0. (c) λ = 3, ρsv = 0. (d) λ = 2, ρsv = 0.22%. (e) λ = 2, ρsv = 0.33%.
Buildings 11 00576 g003
Figure 4. Test setup.
Buildings 11 00576 g004
Figure 5. Measurement configuration of beam test (unit: mm).
Buildings 11 00576 g005
Figure 6. Failure mode of C40 grade concrete beams.
Buildings 11 00576 g006
Figure 7. Typical failure mode of C30 and C50 grade concrete beams.
Buildings 11 00576 g007
Figure 8. Effect of post-filling coarse aggregate ratio (PFR) on load–deflection response for C30 concrete.
Buildings 11 00576 g008
Figure 9. Effect of PFR on load–deflection response for C40 concrete.
Buildings 11 00576 g009
Figure 10. Effect of PFR on load–deflection response for C50 concrete.
Buildings 11 00576 g010
Figure 11. Effect of λ on load–deflection curves for C40 concrete.
Buildings 11 00576 g011
Figure 12. Effect of ρsv on load–deflection curves for C40 concrete.
Buildings 11 00576 g012
Figure 13. Effect of PFR on (a) normalized cracking shear force Vcr and (b) normalized ultimate shear capacity Vu.
Buildings 11 00576 g013
Figure 14. Effect of λ on normalized Vcr and Vu.
Buildings 11 00576 g014
Figure 15. Effect of stirrup reinforcement ratio ρsv on the normalized ultimate shear capacity Vu.
Buildings 11 00576 g015
Figure 16. Relationship between normalized ultimate shear capacity Vu and stirrup strain.
Buildings 11 00576 g016
Table 1. Concrete mixture proportions and workability.
SpecimenConcrete
Grade
Post-Filling Aggregate Ratio
%
Unit Volume Mass/(kg·m−3)Slump (mm)
Cement
(kg)
Fly Ash (kg)Sand (kg)Coarse Aggregate (kg)Water
(kg)
Water Reducer (kg)Post-Filling Coarse Aggregate (kg)
C30-0C3003528871610742204.40200
C30-10C3010317796449671984.0265150
C30-15C3015299756099131873.7397.5145
C30-20C3020282705738591763.5530120
C30-25C3025264665378061653.3662.5100
C40-0C4003528871610741985.720190
C40-10C4010317796449671785.1265150
C40-15C4015299756099131684.9397.5140
C40-20C4020282705738591584.653090
C40-25C4025264665378061494.3662.580
C50-0C5003889770510581947.280220
C50-10C5010349876359521756.6265170
C50-15C5015330825998991656.2397.5150
C50-20C5020310785648461555.8530115
C50-25C5025291735297941465.5662.590
Table 2. Mechanical properties of concrete.
Concrete
Grade
Post-Filling Aggregate Ratio
(%)
Compressive Strength of Concrete at 7 Days fcu (7 d)
(MPa)
Compressive Strength of Concrete at 28 Days fcu (28d) (MPa)
C30020.532.44
1025.1536.51
1526.0238.22
2026.9439.08
2526.3338.16
C40028.9340.87
1032.6843.42
1535.4146.25
2038.4949.01
253344.1
C50041.154
1046.359.7
1546.460.5
2047.564.8
2540.853.1
Table 3. Design parameters of beam specimens.
SpecimenL
(mm)
Concrete
Grade
Filling
Ratio
(%)
λStirrup
Reinforcement
Ratio ρsv (%)
B30-11900C30020
B30-21900C301020
B30-31900C301520
B30-41900C302020
B40-11900C40020
B40-21900C401020
B40-31900C401520
B40-41900C402020
B40-51400C402010
B40-62400C402030
B40-71900C402020.22
B40-81900C402020.33
B50-11900C50020
B50-21900C501020
B50-31900C501520
B50-41900C502020
Note: The width b and height h of beam specimens are 200 mm and 300 mm.
Table 4. Experimental and calculated results of all beam specimens.
Specimenft
(MPa)
fcu
(MPa)
λρsv
(%)
Vcr
(kN)
Δu
(mm)
Vu
(kN)
Vu, exp
(kN)
Vu, cal
(kN)
Vu, exp/Vu, cal
B30-12.8632.4420120.34.96280.8280.8104.02.70
B30-23.0536.5120131.85.73319.5319.5111.02.88
B30-33.1238.2220150.25.46343.8343.8113.73.02
B30-43.1739.0820138.65.43285.1285.1115.22.47
B40-13.2840.8720150.04.52351.7351.7119.32.95
B40-23.3943.4220192.54.72380.8380.8123.63.08
B40-33.5446.2520179.04.93419.2419.2128.83.26
B40-43.6249.0120195.04.33353.3353.3131.82.68
B40-53.6249.0110356.83.55950.0950.0131.87.21
B40-63.6249.0130153.83.06153.8153.8131.71.17
B40-73.6249.0120.22180.14.66412.0412.0162.82.53
B40-83.6249.0120.33180.25.67480.6480.6178.32.70
B50-13.585420151.53.99382.7382.7130.42.93
B50-23.7959.720161.54.04513.2513.2137.93.72
B50-33.8960.520197.04.00460.4460.4141.43.26
B50-44.0064.820217.05.26466.7466.7145.53.21
Note: ft and fcu are the tensile strength and compressive strength of concrete, respectively; λ is the shear span-to-depth ratio; ρsv is the shear reinforcement ratio; Vcr is cracking load; Vu is the ultimate shear capacity; Vu.exp is the experimental ultimate shear capacity; Vu.cal is the calculated ultimate shear capacity according to GB 50010; Δu is the mid-span deflection at shear ultimate bearing capacity. The width b and effective height h0 of beam specimens are 200 mm and 260 mm.
Publisher’s Note: MDPI stays neutral with regard to jurisdictional claims in published maps and institutional affiliations.

