Article

Effect of Seasonal Ambient Temperature on Sleep and Thermal Comfort in Older People Living in Public Elderly Facilities

1
Department of Architecture, Faculty of Environmental & Urban Engineering, Kansai University, Suita 564-8680, Osaka Prefecture, Japan
2
Faculty of Textile Science and Technology, Shinshu University, Ueda 386-8567, Nagano Prefecture, Japan
3
Faculty of Psychology, Aichi Shukutoku University, Nagoya 464-8671, Aichi Prefecture, Japan
*
Author to whom correspondence should be addressed.
Buildings 2021, 11(12), 574; https://doi.org/10.3390/buildings11120574
Submission received: 26 October 2021 / Revised: 16 November 2021 / Accepted: 22 November 2021 / Published: 23 November 2021
(This article belongs to the Section Building Energy, Physics, Environment, and Systems)

Abstract

:
This study aimed to investigate the thermal environment and thermal comfort of elderly occupants living in elder care facilities and to compare the quality of sleep, in all four seasons, of these elderly occupants. A total of 16 healthy participants with a mean age of 80 ± 5 years (range, 70–87 years) were recruited in two elderly facilities, of which, 13 participated in all four measurements. The sleep parameter was measured by a wrist actigraph which the participants were requested to wear and analyzed with commercial software using the Cole–Kripke algorithm, to assign scores for sleeping and waking patterns. Both ambient temperature (Ta) and relative humidity (Rh) levels were found to be lower in the winter and higher in the summer. The Ta in the summer and Rh in the winter were not within the scope of the Japanese Standard for Maintenance of Sanitation in Buildings, as the central HVAC and air conditioners were turned off due to the absence of facility managers. More than 50% of the elderly occupants used fans and increased airflow by opening windows during the summer nights as an adaptive thermal approach. The slope of the relationship between prevailing mean outdoor temperature and indoor Ta determined in this study was similar to the adaptive model and the regression line lies over the upper limits of the adaptive model. No significant difference was found in the sleep parameter among the four seasons; however, a sex difference was found in the sleep latency and length of waking period during the sleep. The sleep parameters such as sleep efficiency indexes were significantly better for elderly women than men. The adaptive approach is not enough to improve the sleep efficiency of sleeping elderly people even within the acceptable temperature range based on the thermal comfort, especially for elderly men.

1. Introduction

People spend about one-third of their lives sleeping [1]. Complaints related to difficulty in initiating and maintaining sleep increase with age [2,3,4]. Moreover, thermoregulation during exposure to heat or cold also deteriorates with aging [5,6,7]. The sleep quality of older people is found to be influenced by the surrounding environment and the total sleep time is found to be shorter due to higher temperature in the summer than in other seasons due to longer wakefulness [8,9]. This finding is attributed to the fact that older people were unable to not control their surrounding environment during the period of nocturnal sleep in the summer season because they lived independently and sustained themselves in detached old houses in suburban areas. The proportion of older people is currently expanding at its highest rate in Japan [10]. As a consequence, the necessity for nursing home care is increasing markedly. In urban areas there are many facilities built and run by non-governmental management. In contrast, low-cost social welfare facilities for the aged are managed by local government authorities. Nursing homes for older people are superintended by managers and their indoor environment is controlled by air-conditioning systems. However, not much is known about the thermal environments present around the occupants of these elderly facilities.
In Japan, general buildings must be controlled to comply with the Japanese Standard for Maintenance of Sanitation in Buildings [11], which specifies that buildings with a gross floor area of more than 3000 m2 must have an air conditioning facility or a mechanical centrally controlled ventilation system. The Standard for Maintenance of Sanitation in Buildings stipulates 17–28 °C for Ta, 40–70% for Rh, and less than 0.5 m/s for air velocity, irrespective of occupant age or gender, while recommending that adaptive comfort temperature is not dependent on outdoor temperature. The elder care facility is one of the special-purpose buildings which does not need to comply with the Japanese Standard for Maintenance of Sanitation in Buildings. The most-used general thermal comfort standards, ASHRAE Standard 55 [12] and ISO 7730 [13], are based on subject experiments in a climatic chamber. Furthermore, there are abundant field studies on the thermal environment and thermal comfort in offices, schools, and residential buildings all over the world [14]. An adaptive approach to thermal comfort would be based on the findings of thermal comfort surveys conducted in the field [15]. As a result, people evaluate the climate differently in buildings where they can open windows and influence the indoor thermal climate. Particularly in periods with higher outdoor temperatures, higher indoor temperatures in such buildings are more acceptable than Fanger’s model predicts [16]. Although adaptive thermal comfort may promote energy savings and occupants’ sensations, the suitable and comfortable temperature for work performance, academic success, daily activities, and behaviors including sleep have not been investigated much. This is because adaptive thermal comfort is not confined to building use, occupant behavior, and other contexts for comfort temperature. Moreover, most respondents to questionnaire surveys are young healthy people in the field study of thermal comfort. Only a few thermal comfort studies have been conducted in nursing home environments [17,18,19,20,21]. There appears to be a lack of consensus on how the indoor environment is perceived by elderly people.
This study aimed at investigating the temperature and humidity levels for four seasons around the older people residing in public elderly facilities, in addition to the occupants’ sleeping habits and thermal comfort among the four seasons.

2. Methods

2.1. Participants

For participants in the present study, sample size calculations were based on the G*Power [22]. According to the G*Power for repeated analysis of variance measurements, a sample of 8 men and 8 women to detect α = 0.05, power = 80%, and effects size = 0.31 was estimated. The study was approved by the ethics committee of the Institute of Advanced Industrial Science and Technology (AIST).
The study was conducted in two elderly facilities during the four seasons: spring (May), summer (August), fall (November), and winter (February) in Nagoya (35.17° N, 136.77° E), Japan. The study site has a hot and moist climate with south-eastern winds blowing from the Pacific Ocean in summer and dry and cold winds from Siberia in winter. The mean monthly outside temperature reached its maximum in August (Tavg. = 28.2 °C; Tmin. = 24.7 °C; Tmax. = 33.2 °C). The mean relative humidity reached its maximum of 69 % in August. The mean monthly outside temperature reached its minimum in January (Tavg. = 5.5 °C; Tmin. = 1.4 °C; Tmax. =10.5 °C). The mean relative humidity reached its minimum of 60% in February. The buildings are located in the middle of the city and constructed using a reinforced concrete structure which has higher heat capacity. The characteristics of the facilities are presented in Table 1. The participants were recruited in two public elderly facilities; the residents are required to live independently in these elderly facilities. The facilities include three meals per day and hot bathing and showering three times per week. Before the study began, the volunteers answered a questionnaire regarding their physical and mental health, and their sleep patterns. Based on the volunteers’ responses to a questionnaire, some volunteers were excluded if they suffered from a chronic disease or insomnia, required regular medication, had recently been hospitalized, or slept for an extremely long or short duration. The participants were evaluated not to have dementia by the managers after expression of their intention to participate in this study. Based on their answers, 16 participants (8 men and 8 women) were selected for this study. All participants were informed about the study protocol and provided written informed consent to participate. Of these, 13 participants (5 men and 8 women) completed the study for all four seasons. The physical characteristics (expressed as mean ± standard deviation) of the volunteers measured were age (79.6 ± 8.0 years and 79.4 ± 5.6 years for men and women, respectively), height (159.7 ± 1.6 cm and 144.6 ± 5.0 cm), and weight (53.6 ± 8.7 kg and 46.7 ± 7.4 kg).

2.2. Measurements and Data Collection

In order to examine the relation between the participants’ sleep parameters and thermal environment, the sleep parameters and ambient temperature (Ta) with relative humidity (Rh) were continuously measured and recorded for a week. The data logger (RS-12; Espec Mic Corporation, Aichi, Japan) consisted of both a sensor probe including a thermistor and hygrometer with a 0.5 m long cable, and a memory module to record Ta and Rh at 2 min intervals. The participants were asked to keep the sensor outside the waist pack in order for the sensor to be exposed to the same ambient air as that to which the participants were exposed during the daytime. During nocturnal sleep, the participants were asked to remove the waist pack and leave the data logger on the headboard of the bed or near the pillow in their rooms.
The participants were requested to wear a wrist actigraph (Actigraph Basic or Micro mini; AMI, Ardsley, NY, USA) on the non-dominant hand and monitor physical activity to record activity movement levels and intensity over time. An accelerometer generates a variable voltage that is digitally processed and sampled. Then, a value is calculated from the rate of zero-crossing of movements with a threshold value of 0.01 G/rad/sec or more. The value is expressed as an activity count and is recorded in its board memory. These activity counts correlate with sleep–wake patterns. The actigraphic recordings were analyzed with commercial software (AW2, AMI, Ardsley, NY, USA), using the Cole–Kripke algorithm, to assign scores for sleeping and waking patterns [23]. In addition, participants were asked to maintain a written sleep diary in order to track sleeping time, waking time, mealtimes, bathing time, and times during which the actigraph was temporarily removed. Over the course of the recordings, the time in bed (TIB; defined as the primary sleeping period during which participants were trying to sleep) was determined every night, according to the participants’ sleep diaries. Additionally, sleep latency (time between attempting to sleep and sleep onset) [23], sleep period time (SPT, time from sleep onset to the end of the last sleep episode in the morning), wake after sleep onset (total waking time scored in SPT), sleeping time (after sleeping onset the total duration of segments classified as sleep per session), and sleep efficiency index (SEI, percentage of sleeping time in SPT) were also calculated by the software of algorithm-defined thresholds of activity.
We could not continuously measure the air velocity and radiant temperature at night because the measurements were limited by local authority, which allowed the use of equipment without an external power source. The air velocity of the fan and the glove temperature were measured during daytime as a reference.

2.3. Questionnaires

The participants filled out the questionnaires before and after the sleep as shown in Table 2. Subjective evaluations for sleep quality were performed with a questionnaire after sleep and responses to the questionnaire were obtained from each participant for a week. Questions regarding thermal comfort were asked before and after the sleep when they were going to sleep and woke up. Moreover, the participants indicated their retrospective thermal comfort during the sleeping period when they woke up.
The questionnaires on bedding, clothing, and adaptive behavior were administrated for each season and the participants’ answers were confirmed by the managers and investigators. Bedding insulation was estimated by the investigators using the insulation values from a checklist, where the participants answered questions about the number or kind of their bedding or covering used in the present study, because the insulation used by each participant was difficult to directly measure by a thermal manikin. The checklist included the insulation of many typical beddings or coverings that had been measured by a thermal manikin. The clothing insulation (clo value) of typical beddings is shown in the table in Appendix A. The estimated clothing-insulation value was calculated based on the values of similar garments measured by ISO9920:2007 [24].

2.4. Procedure

The participants were requested to live normally for a week and answer questionnaires before and after sleep every day. During the one-week investigation period, the actigraph, Ta and Rh logger, and questionnaire data were collected. Ta and Rh data were measured every 2 min and averaged every hour. The outdoor Ta and Rh data were obtained hourly from the Nagoya Meteorological Observatory [25] and the prevailing outdoor mean was calculated based on the ASHRAE Standard [1].

2.5. Statistical Analysis

Initially, both Ta and Rh data of the bedroom were averaged during sleeping time in the investigated week of each season for each participant, separately. The sleep parameters were also averaged during the investigated week of each season for each participant. The score of total subjective sleep was calculated as a count of the 4 questions for subjective sleep sensations in Table 2.
To test the significance of the data, a one-way analysis of variance (ANOVA) with repeated measures was used to determine the effect of seasonal variation and sex on Ta and Rh data, sleep parameters, and subjective sensations. The Tukey–Kramer method was applied to compare the two groups of sex–season. Statistical significance at p < 0.05 is shown in the table. The relationship between two factors, i.e., thermal sensation and Ta, was examined by correlation analysis and considered when r was less than −0.4 or more than 0.4. The regression lines are shown on the figures whenever statistical significance was found (p < 0.05).

3. Results

3.1. Thermal Environment

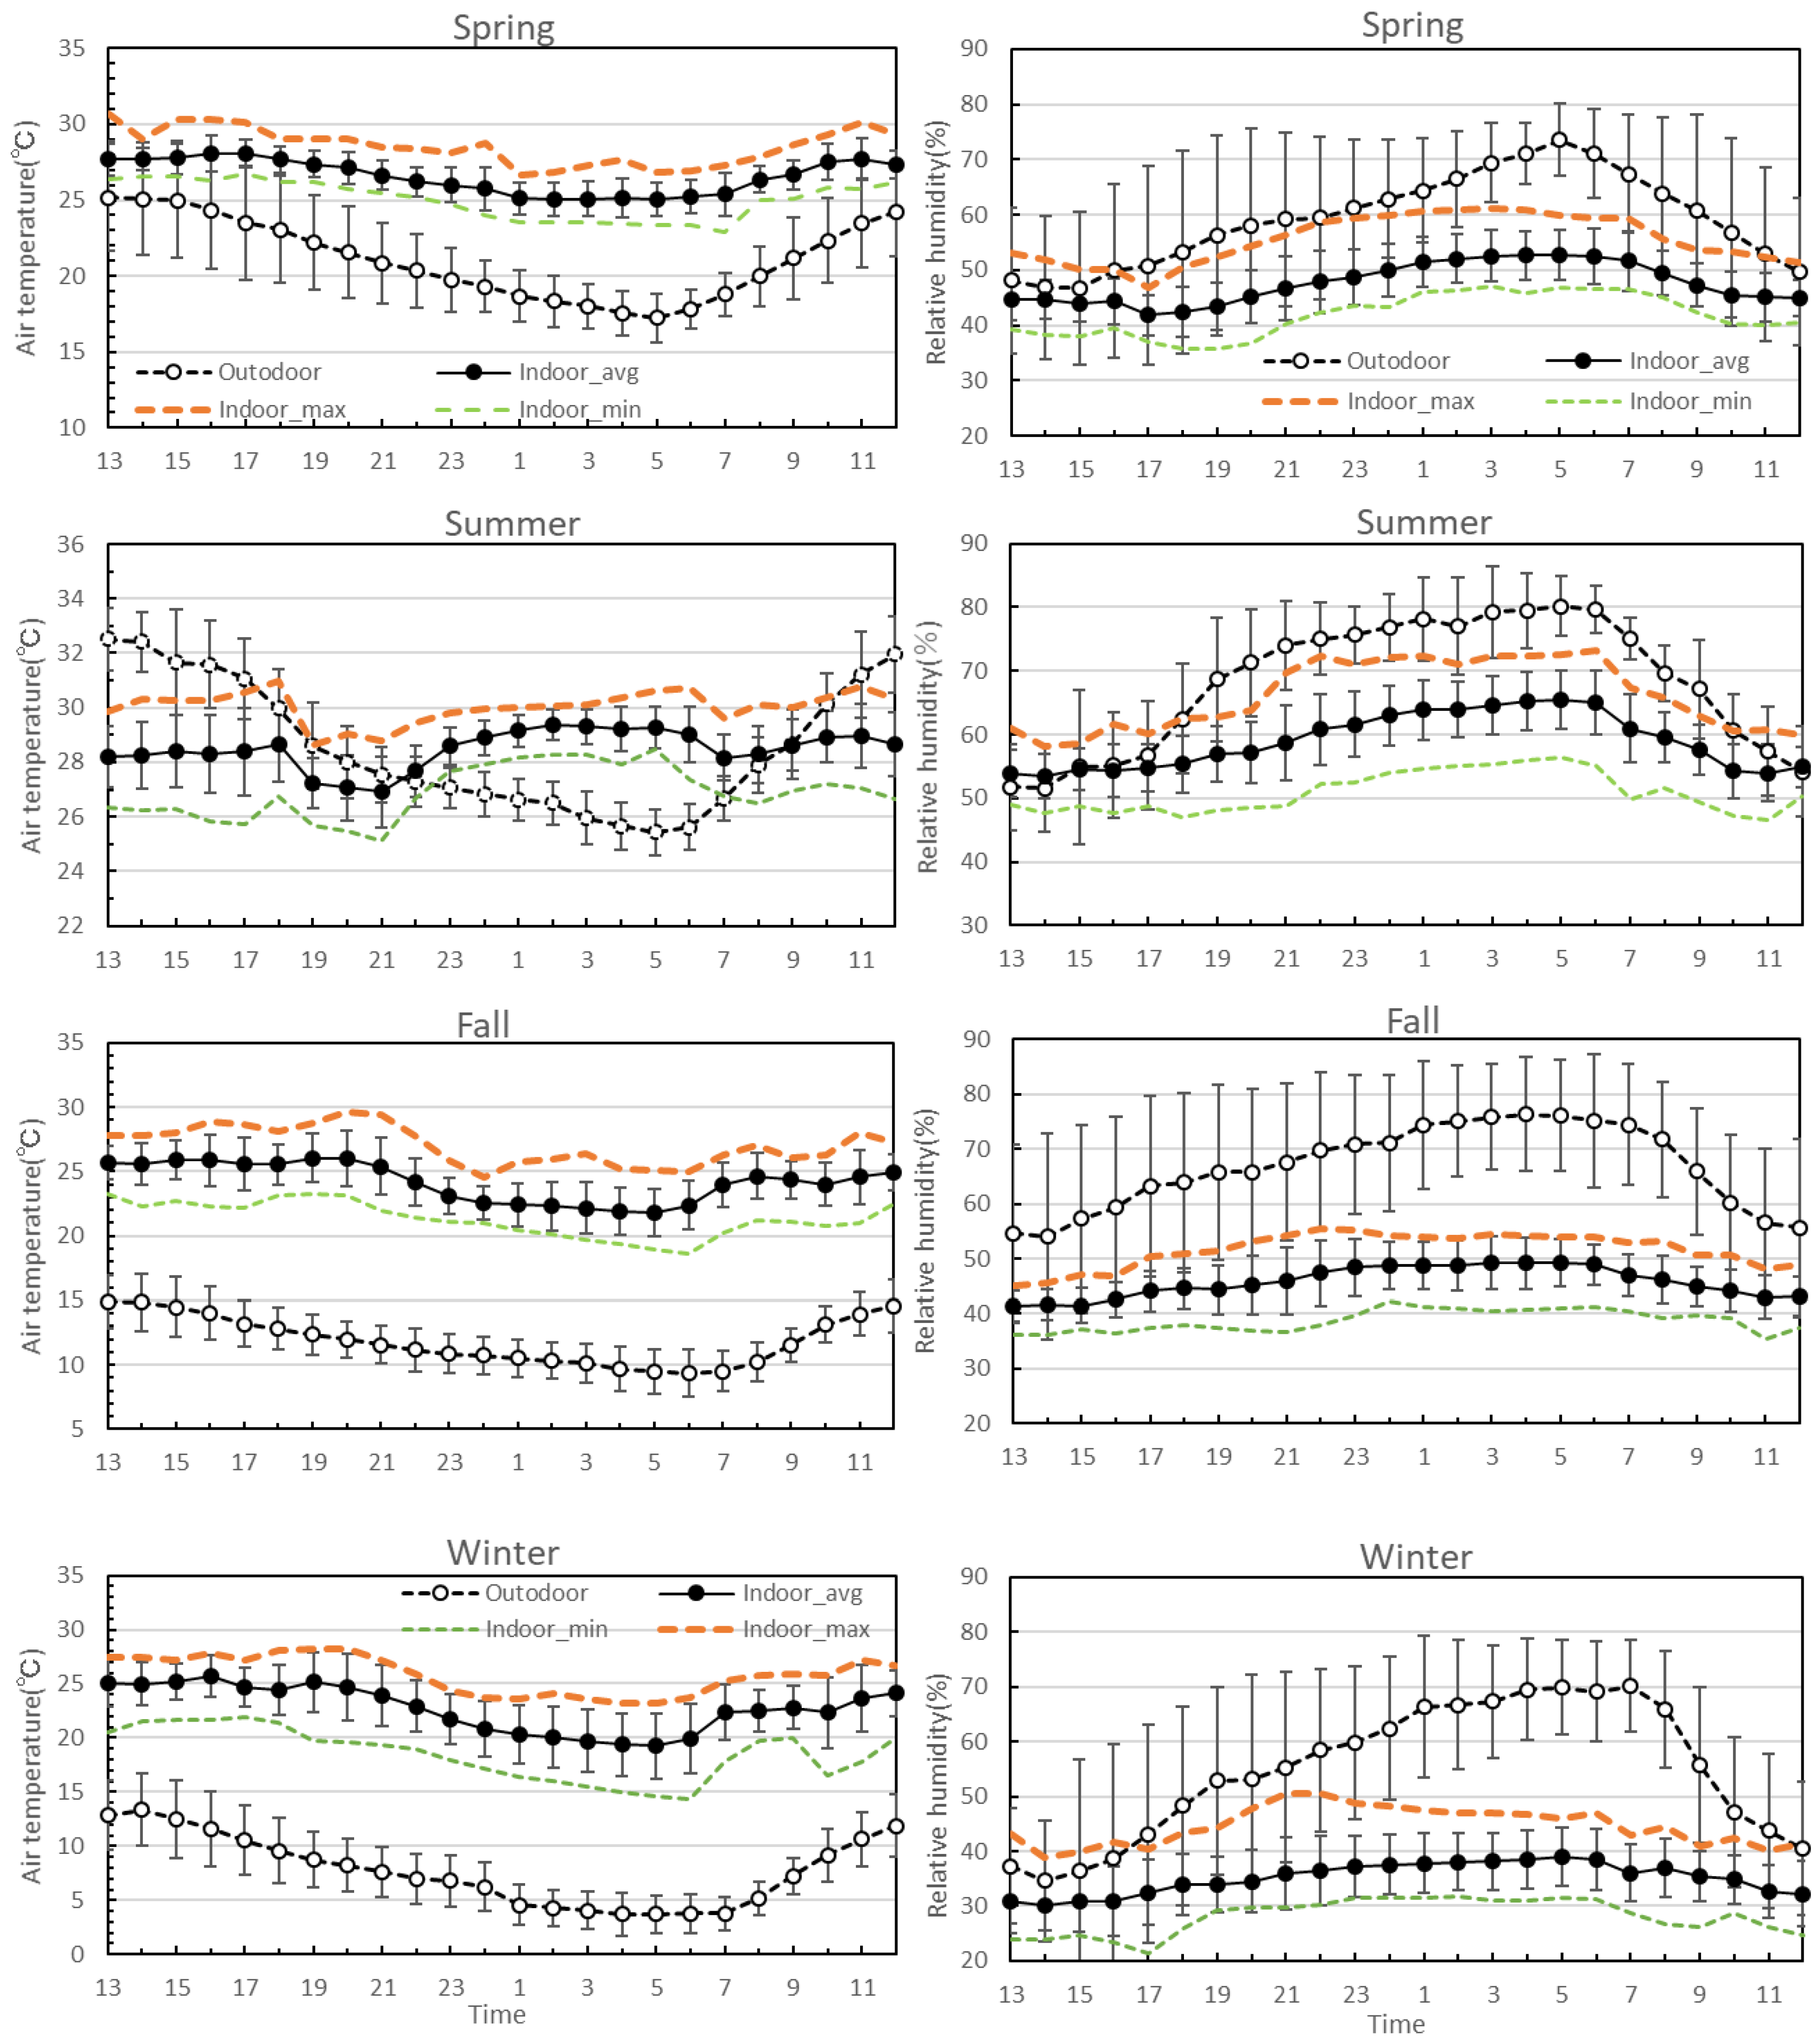
Figure 1 shows the changes in average indoor and outdoor Ta and Rh over the four seasons. The most extreme values of both indoor Ta and Rh were obtained in the summer and winter seasons; highest values of both Ta and Rh were measured in summer, and lowest values in the winter. The Ta and Rh did not change as much during the lights-out period from 21:00 to 6:00 because the central air conditioners were switched off. Before turning off the air conditioner, the Ta values in the bedroom were almost at 27 °C in the spring and summer between 19:00 and 21:00, even though the outdoor Ta was 18.8 °C in spring and 26.5 °C in summer. After the air conditioner was turned off around 21:00, the Ta gradually decreased in the spring. However, the Ta gradually increased in the summer and exceeded 28 °C after 22:00. The average Ta was 29 °C between 0:00 and 6:00 in the morning in the summer. Because the buildings under study were located in the center of the city and constructed using a concrete structure, it is possible they had stored heat in their skeletons during the daytime exposure to solar radiation, especially in summer. After turning off the air conditioner, the stored heat in the skeleton of the buildings may have transferred to the indoor environment where the elderly people slept, and the indoor Ta increased. Excluding summer, the average Ta for the three other seasons slightly decreased during the night. In the winter, average Ta was not lower than 17 °C. The Rh slightly increased during the lights-out period from 21:00 to 6:30. However, average Rh was lower than 40% in winter, although average Rh was close to 70% in summer. The Ta in summer and Rh in winter were outside of the recommended range in the Japanese Standard for Maintenance of Sanitation in Buildings [6]. Of particular note, the average Ta exceeded 28 °C, which is the upper limit of Ta in given in the standard, during most of the night time in summer.
The average (SD) of the thermal environment during the sleeping periods is shown in Table 3. Significant seasonal variation was also observed in bedrooms’ Ta and Rh, although no sex difference was found in Ta and Rh when comparing rooms of men and women. All combinations of the two seasons showed significant differences in Ta and Rh.
Appendix B shows the average (SD) air velocity values around four people lying down.
Table 4 shows the average (SD) clo values for clothes and bedding, and percentages of men and women using adaptive approaches over the four seasons. Insulation of total bedding and underlay bedding showed no significant difference for sex or season, although insulation of the overlay bedding showed significant differences among the four seasons but not between sexes. The insulation, sleepwear, underwear, and total clothing for the occupants were compared over the four seasons. Insulation from clothes did not show any significant difference for the genders, however, significant seasonal differences were found. Clothing insulation in the fall was significantly higher than in the summer and winter. Clothing insulation in the spring was significantly higher than in the summer. These results show that clothing insulation in the autumn compensates for bedding insulation compared to the winter. Adaptive approaches were found in the spring and summer, such as using electric fans and opening windows, and in the winter using electric warmers inside the bedding. However, the percentage of adaptive approaches was halved in both seasons. Notably, in the fall, clothing insulation increased instead of using electric warmers inside bedding.

3.2. Sleep Parameter

The averages (SD) of the sleep parameters are summarized in Table 5. There were no significant differences in the sleep parameters for the seasons, however, significant differences were found in the total sleep time, wake time, sleep efficiency index, and sleep latency between women and men. Although the interactions of sex and season were not found in the sleep parameters, the sleep parameters were compared between men and women in each season. Wake time in the summer was significantly longer for the men than the women and the men showed a tendency to be awake longer in fall and winter than the women. The sleep latency was significantly longer for the men than the women. The sleep efficiency index for the women was significantly higher than that of the men in the summer and tended to be higher in the fall and winter. In the comparison between the seasons, the women rose significantly earlier in the spring than the winter, although no difference was found in other parameters among the seasons. During the daytime there was a significant difference in sleeping time between men and women although no noteworthy difference was found among the four seasons. The total sleep time was shorter, and the activity was higher in the women than the men during the daytime. This may be reason why the women slept better than the men during the night.

3.3. Subjective Sensation

Table 6 shows average (SD) sensation for thermal comfort and subjective evaluations of sleep for men and women among the four seasons. Before going to sleep there were no significant differences in season and sex, and for the interaction between season and sex on the thermal sensation for the whole body, only thermal sensation of the foot was found to be significantly different between sexes. For the men, thermal sensations for the whole body and the foot were warmer in spring than in fall. In winter the men’s feet felt significantly warmer than those of the women. The comfort sensation statistically showed a difference between sex, but not between seasons, whereas the sweating feeling showed seasonal differences. The comfort sensation for women was more comfortable than for the men in fall and winter.
In the morning after sleeping, a significant seasonal difference was found in thermal sensation for whole body, whereas differences in thermal comfort and sex were found in the feeling of sweating. For the men, the thermal sensation for the whole body was significantly warmer in the spring and summer than in the fall, and also in summer than winter. The thermal sensation for the foot was found to be significantly warmer in the men than the women in fall and winter, and in spring and summer than the fall for the men. The comfort sensation was found to be more comfortable in spring than the summer for the men. The more significantly experienced a feeling of sweating in summer than in spring, fall, and winter. In summer the men felt much more sweating than the women. A sex difference in thermal sensation for the foot was found, and seasonal and sex differences were found in the comfort sensations. The seasonal difference was found in the feeling of sweating. In the thermal sensation for whole body, the men were found to be significantly warmer in the summer than the fall, and the men felt significantly warmer than the women. Regarding the comfort sensation, the men felt more discomfort than the women. The women felt significantly more discomfort in the summer than the winter. In the subjective sleep sensations, the women showed significantly more ease of falling asleep than the men, although no other sex or seasonal differences were found.
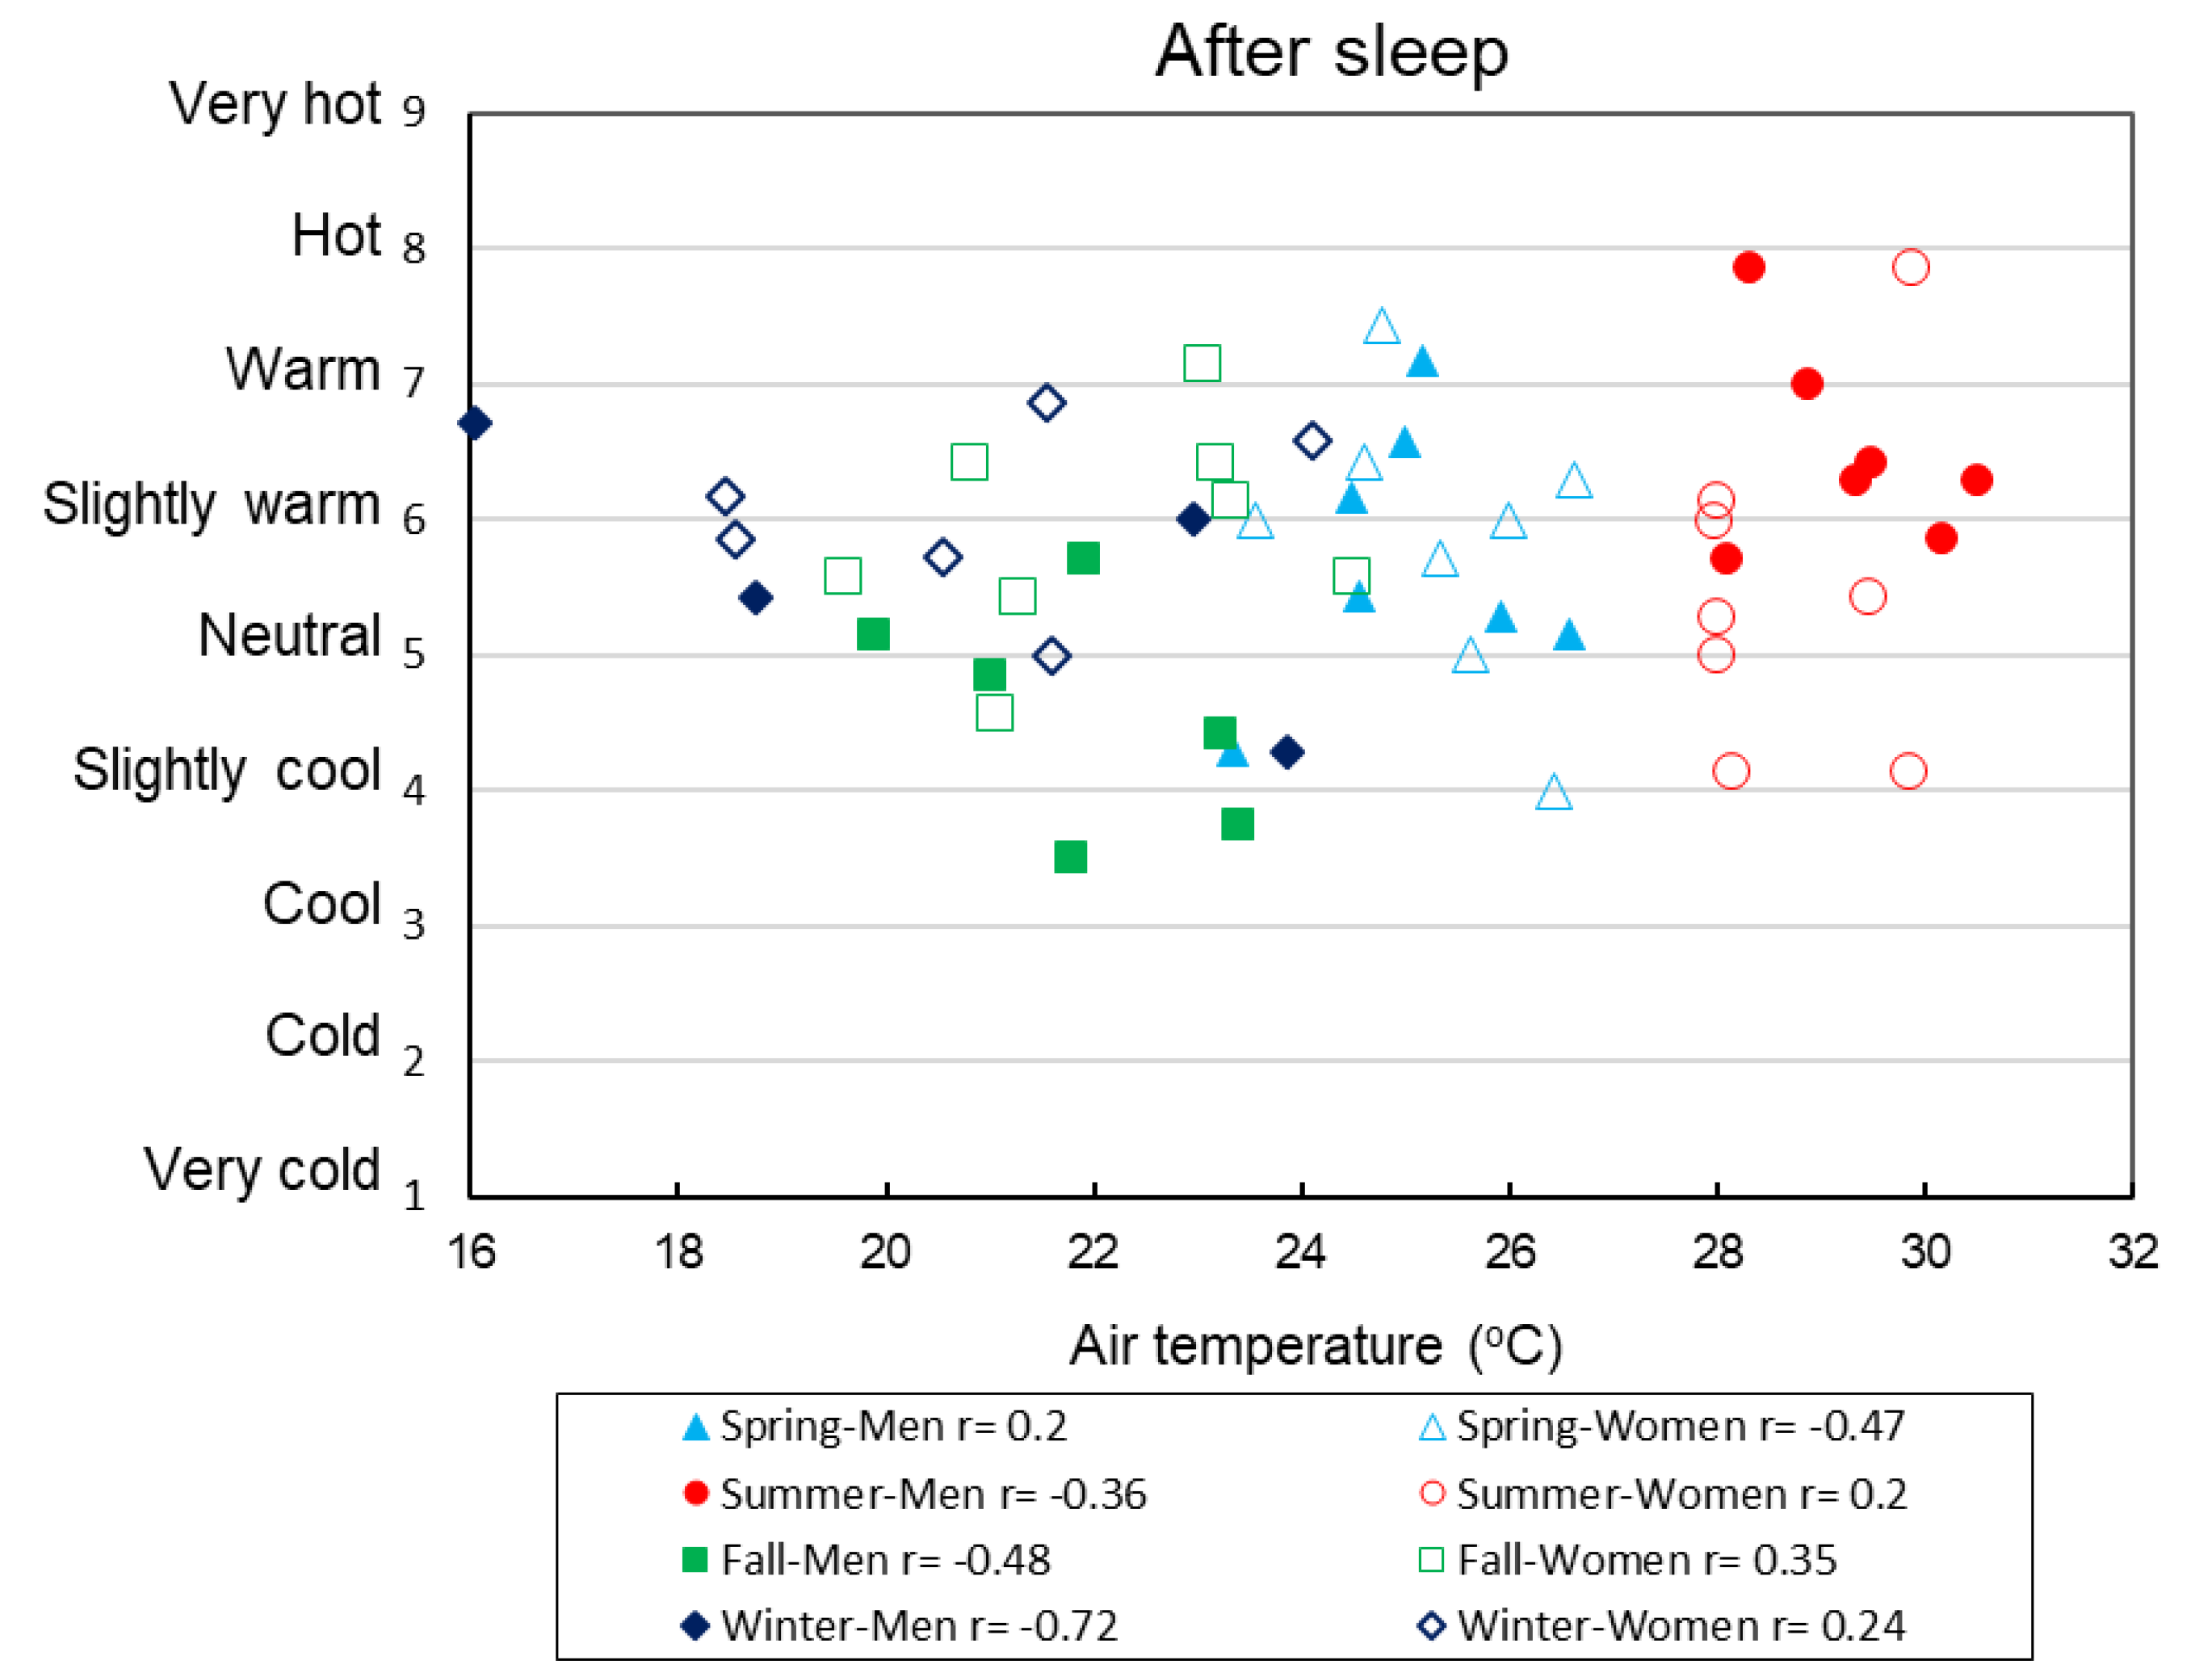
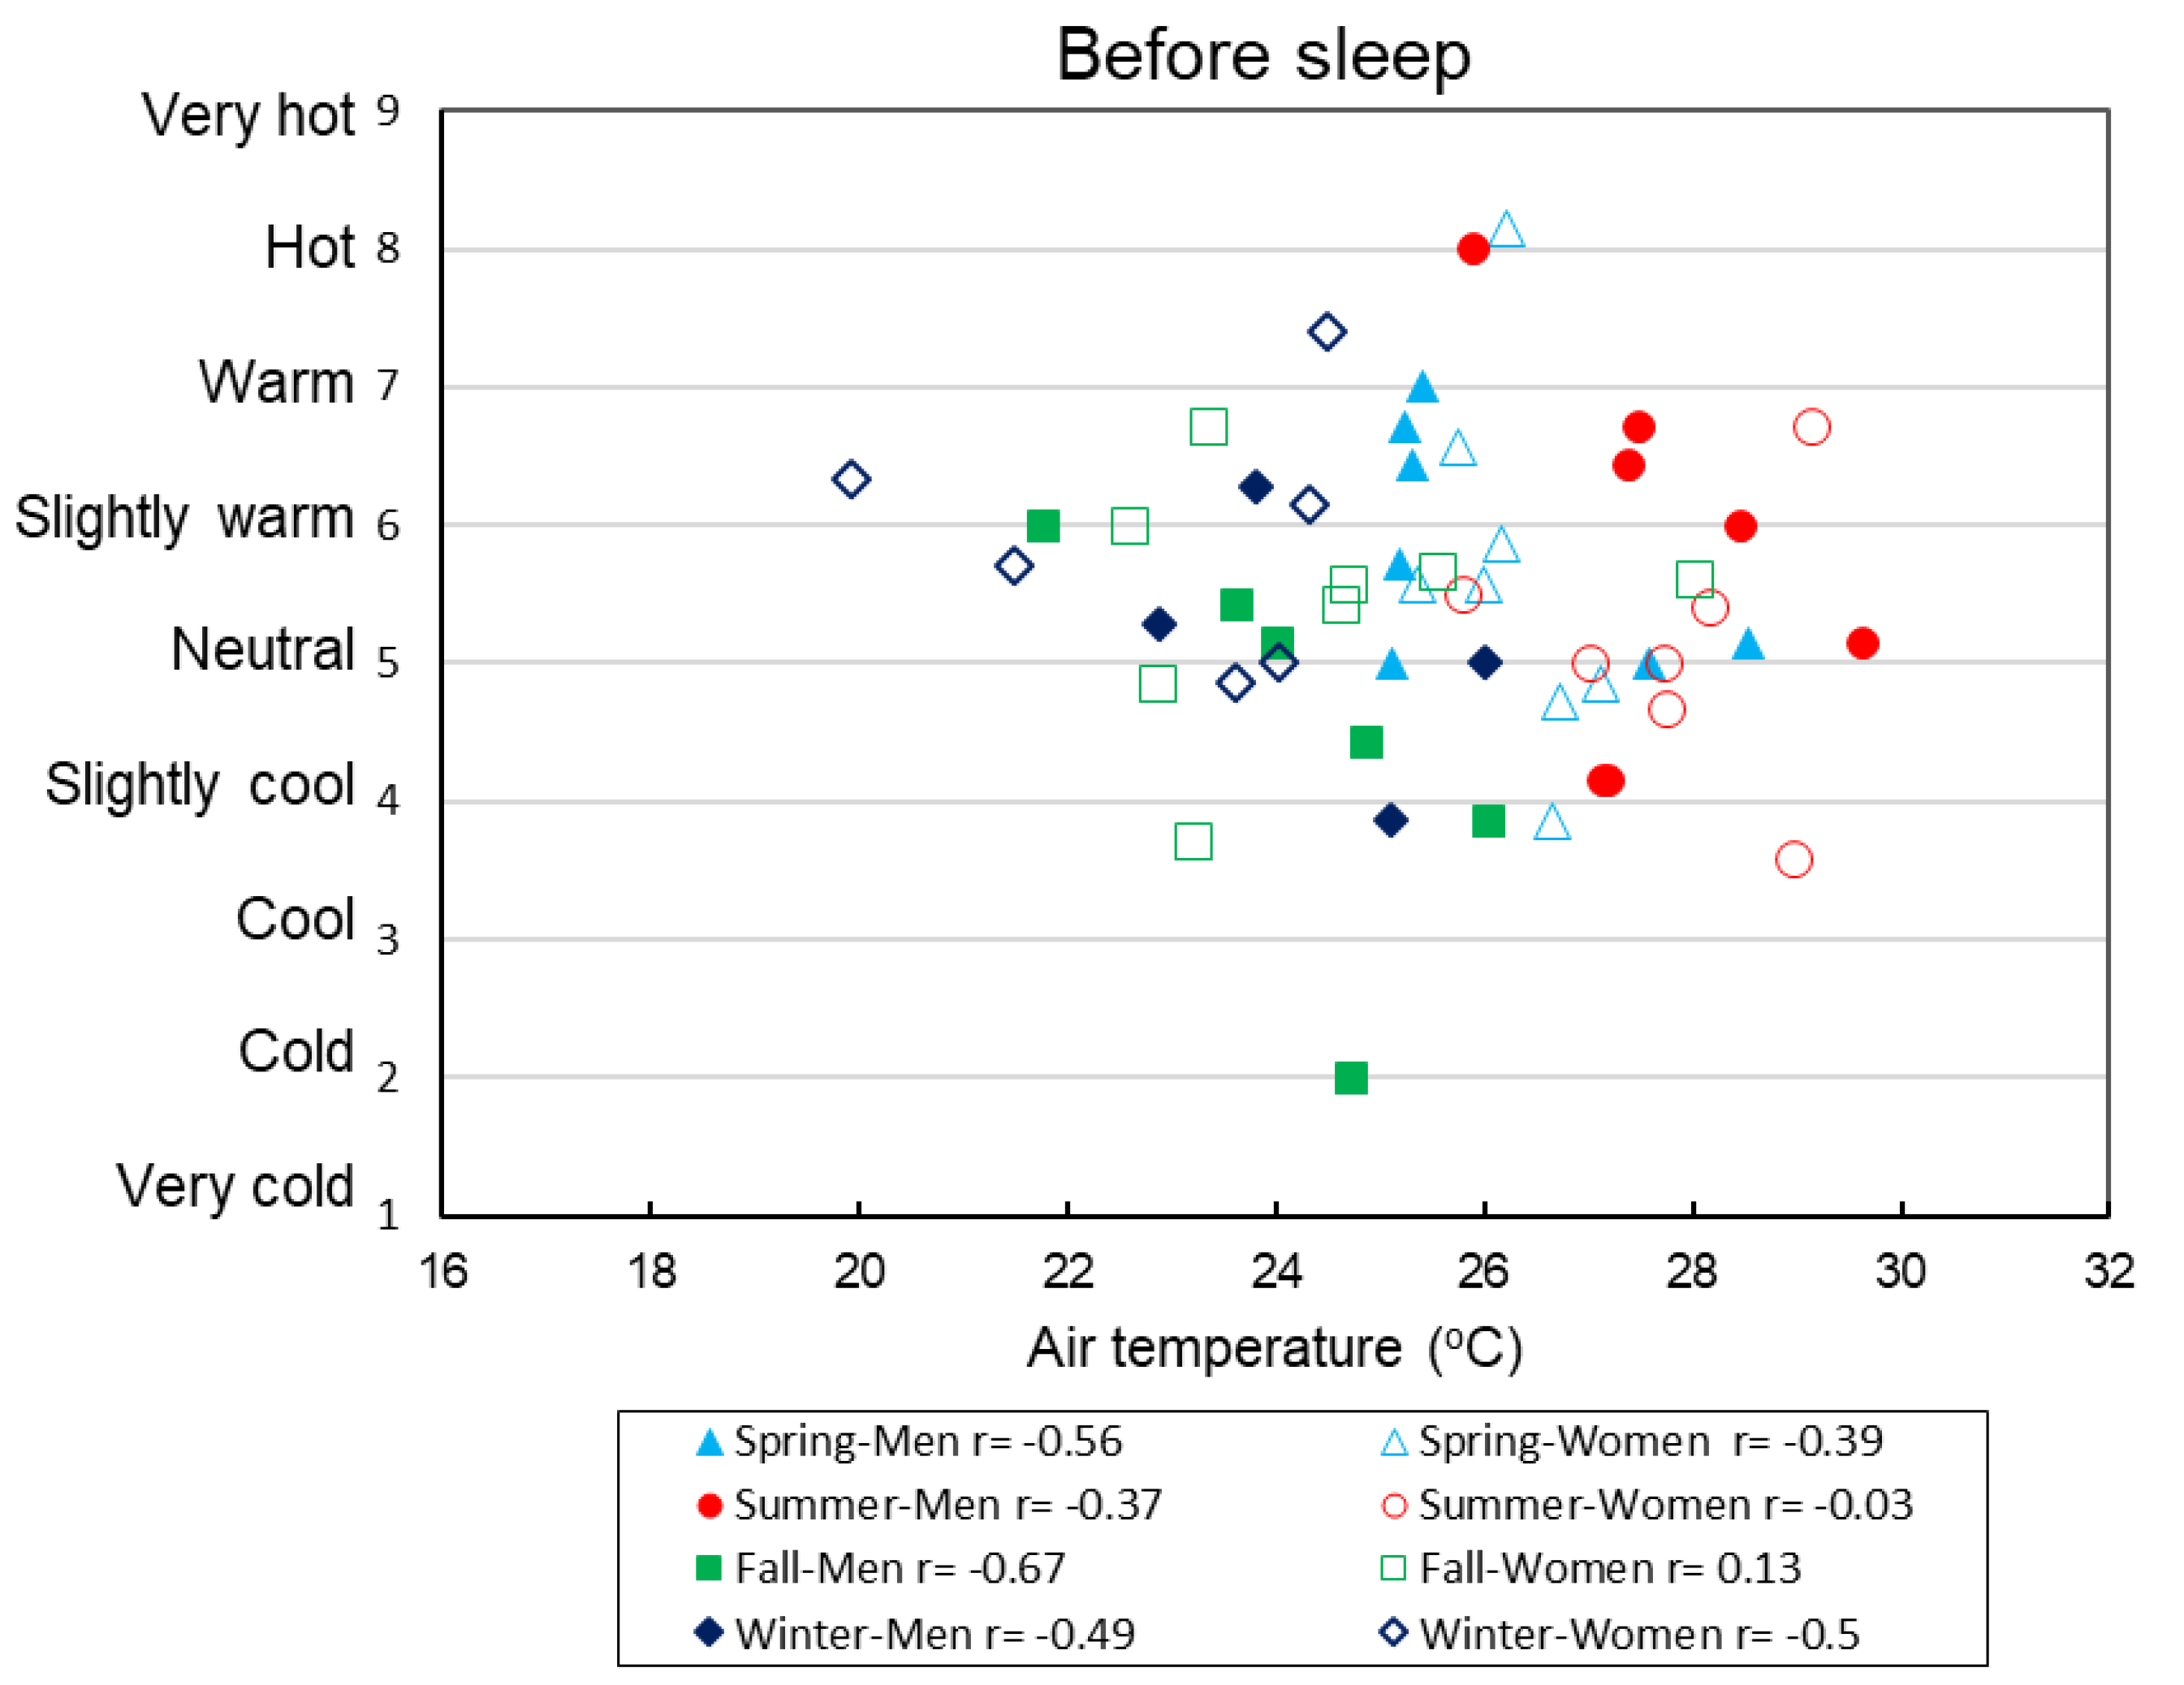
Figure 2 shows the relationship between Ta and thermal sensation for each season in men and women before they slept. The correlation coefficients between Ta and thermal sensation for combinations of season and participants’ sex showed strong relationships and were negative for men–spring, men–fall, men–winter, and women–winter. The correlation coefficient was not observed to be statistically significant. The negative correlation means that the participants felt cooler with increased Ta, which constituted the opposite of a normal relationship between Ta and thermal sensation because thermal sensation usually becomes warmer in accordance with an increase in Ta. After sleeping, the correlation coefficients between Ta and thermal sensation were also negative and strong for women–spring, men–fall, and men–winter. The negative correlation means that the participants felt cooler with increased Ta, in addition to before sleeping. As a whole, neutral sensations were found between 23–30 °C before sleep and 19–28 °C after sleep, depending on the season as the clothing differed.
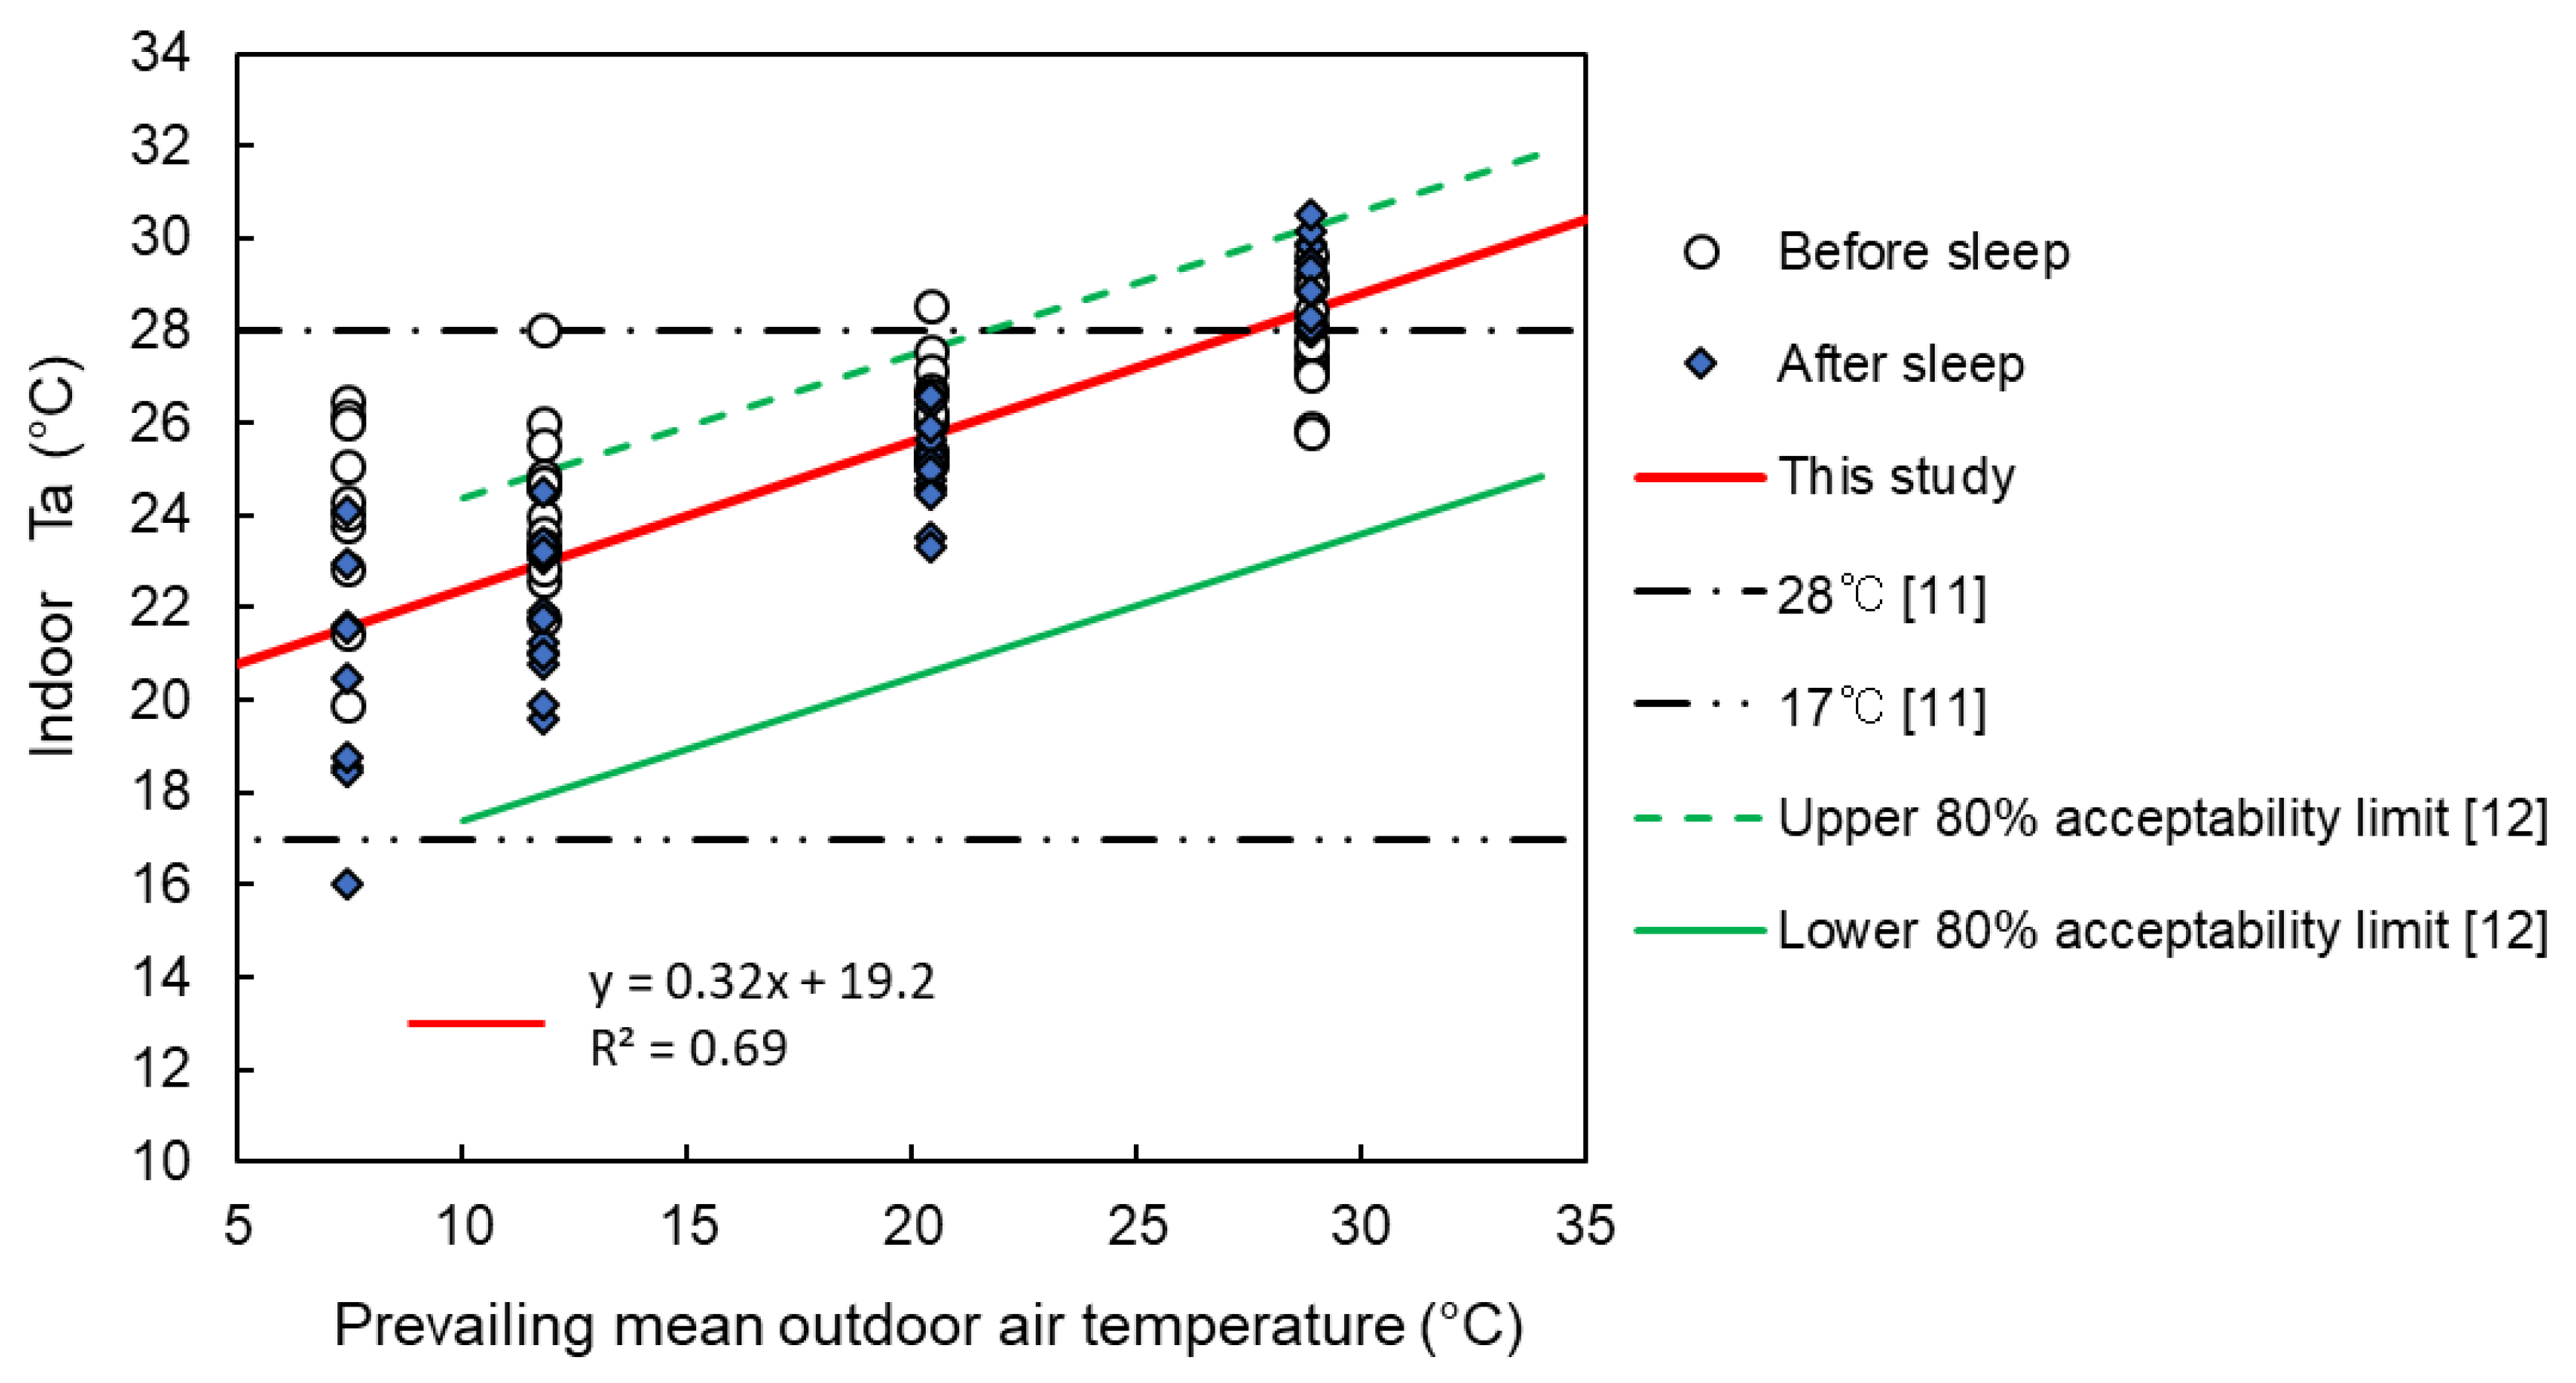
Figure 3 shows the relationship between the prevailing mean outdoor temperature and the comfortable temperature before and after sleep. The prevailing mean outdoor temperature was calculated based on meteorological data for the previous seven days [12]. The comfortable temperatures for winter, fall, and spring were between 17 and 28 °C, although the comfortable temperature for summer deviated to a higher temperature. The slope of the regression equation between the prevailing mean outdoor temperature and the comfortable temperature was similar to the slope of the adaptive model. The upper limit of the comfortable temperature for fall, spring, and summer based on the survey was also the same as, or slightly higher than, the upper 80% acceptability limit of the adaptive model. These results show that the present data of summer increase to the higher temperature of the adaptive model and also conform to the adaptive model.

4. Discussion

This study investigated the thermal environment, thermal comfort, and sleeping quality of residents living in elder care facilities in Japan, over the four seasons. The buildings operated in mixed-mode [26], where the HVAC system was not in operation at night. The air conditioners were turned off while the caregivers were absent from the facilities during the night. Excluding summer, the average Ta was between 17 and 28 °C in the three seasons, which complies with the Japanese Standard for Maintenance of Sanitation in Buildings [11]. Between 7 pm and 9 pm, before turning off the air conditioners, the Ta in the bedrooms was almost 27 °C in spring and in summer. After the air conditioners were turned off around 9 pm, the Ta gradually decreased in spring, however, the Ta gradually increased in summer and, exceeded 28 °C after 10 pm. Between 0 am and 6 am in summer, the average Ta was 29 °C. The buildings under study were constructed from reinforced concrete and were located in the center of the city. It is possible that the elevated indoor Ta at night in summer was due to the stored heat in their concrete structure from the daytime exposure to solar radiation. After turning off the air conditioners, the stored heat in the building structure may have transferred to the indoor environment where the elderly people slept, causing the increase in indoor Ta while the outdoor Ta remained around 26 °C. In this study, neutral sensations were found between 23 and 30 °C before sleep and 19–28 °C after sleep, depending on the season as the clothing differed. In previous studies on nursing homes for elderly people conducted in Australia [20], the long-term monitoring of indoor temperature and humidity showed the neutral temperature in bedrooms in winter and summer was 21.2 °C and 22.9 °C, respectively, which meant the HVAC was operating day and night in both seasons. Hwang and Chen [21] observed that the neutral temperature for the elderly was 25.2 °C, and Wong et al. [19] estimated that the neutral temperature for residents who were living in Hong Kong nursing homes was 25.8 °C. These previous results support the results of the current study, even though the previous studies did not investigate thermal comfort at night or early morning. Figure 4 shows that the slope of the relationship between the prevailing mean outdoor Ta and indoor comfort temperature determined in this study was similar to that of the adaptive model. This regression line lies between the 80% acceptability limiting lines of ASHRAE [12] and the adaptive model [15]. The Ta in the summer did not comply with the Japanese Standard; however, it conformed to the adaptive model. Some residents used adaptive behavior to deal with the heat. Four of the seven male occupants used an electric fan and three of the eight female occupants tried to increase air velocity in the rooms by opening windows during summer nights. Thermal comfort is greatly influenced by air velocity. Although air velocity could not be continuously measured in this study, it can be assumed that air velocity was higher after opening windows and using fans, and this helped the occupants to reduce the heat load resulting from the higher temperatures. Appendix B shows the average (SD) air velocity around people lying down. Airflow (1.7 m/s) has been reported to improve the sleep quality of young people by reducing the heat load in a hot humid environment (32 °C with 80% Rh) [27]. However, the thermal comfort was not improved by the airflow. In this study, thermal comfort of the participants may not have been improved by the airflow during the sleeping period because the air velocity was not sufficiently high to reduce the heat load. Moreover, the sleep efficiency among men did not improve even with the use of a fan. The adaptive behavior of using a fan or opening a window was observed in more than 50 % of participants in summer. The other participants, however, did nothing. This suggests that adaptive behavior of the elderly themselves should not be expected. Monitoring Ta and using an air conditioner at night by the manager were necessary.
The interesting hypothesis that sleep quality of elderly people is worse in summer due to higher temperatures [8,9] was not supported by the case of women in this study. This study found no seasonal difference in the sleep parameters; however, significant differences were found in the total sleep time, wake time, sleep efficiency index, and sleep latency between women and men. The sleep efficiency index was significantly lower for men than for women, especially in summer. Neither the sleep efficiency index nor the length of wake time during the sleeping period were different for elderly women in the different seasons. These results mean that sleep quality was better for women than for men regardless of the season. Women were not poor sleepers, because their sleep efficiency was over 85%, which has been used as a cut-off value for poor sleepers [28]. However, the men’s sleep efficiency was less than 80%, which is consistent with previous research indicating that sleep efficiency below 80% substantially increased mortality risk in elderly people [29]. The sleep quality for elderly men was worse in summer; these results are supported by a study on younger elderly men [9]. However, no statistically significant differences in subjective sleep evaluations were found between men and women in either season, although the women felt significantly more difficulty in falling asleep than the men. These results are supported by a population-based study [30]. The difference in subjective sleep quality and objective sleep quality for elderly men and women presented by actigraphic sleep measurements showed poorer sleep for men than for women. However, elderly women reported shorter and poorer sleep than men in a diary or interview [30]. Although women’s sleep onset latency and sleep period were longer, movement during sleep did not show differences between elderly men and women [31]. Unfortunately, these studies did not consider the effects of the seasons, nor the ambient temperature or lighting. When thermal environment and thermal sensation were investigated in the elderly nursing home in August, the temperature and humidity were 25–26 °C and 45–70%Rh, respectively. In a questionnaire, these parameters were evaluated as good by the elderly occupants [32]. Although the objective sleep parameters were not investigated and subjective sleep sensation did not show any difference relative to sex [33], the seasonal effects on sleep parameters for the elderly, especially for those living in elderly care facilities or nursing homes, were not fully investigated, and the results are somewhat limited. Recent studies have focused on lighting or illumination levels during sleep [34,35] and on sleep–wake cycles [36]. When objective measures of sleep patterns and subjective sleep quality for 16 senior people (aged 72–99 years) living in a care home were compared in summer and winter across a suite of blue light, illuminance levels, and health and well-being indicators [37], seasonal differences were found relative to lighting. However, there was no significant difference in sleep parameters, although daytime physical activity level was higher in proportion to the lighting level. Seasonal effects on the sleep–wake cycle, the rest–activity rhythm, and quality of life for Japanese and Thai senior people were examined, and the data showed that both sets of participants had a shorter sleep time in summer. However, there was no significant difference in sleep efficiency during the four seasons in Japan or the three seasons in Thailand [36], although lighting and physical activity were significantly higher in summer. A field study investigated the relation between sleep and lighting in both summer and winter seasons [9]. Although the periods when participants were exposed to lighting over 1000 lx and 3000 lx were longer in summer, there was no significant difference observed in the sleep parameters relative to the season. Moreover, no seasonal effects were shown on sleep parameters even though the lighting and activity levels were higher in summer than in winter.
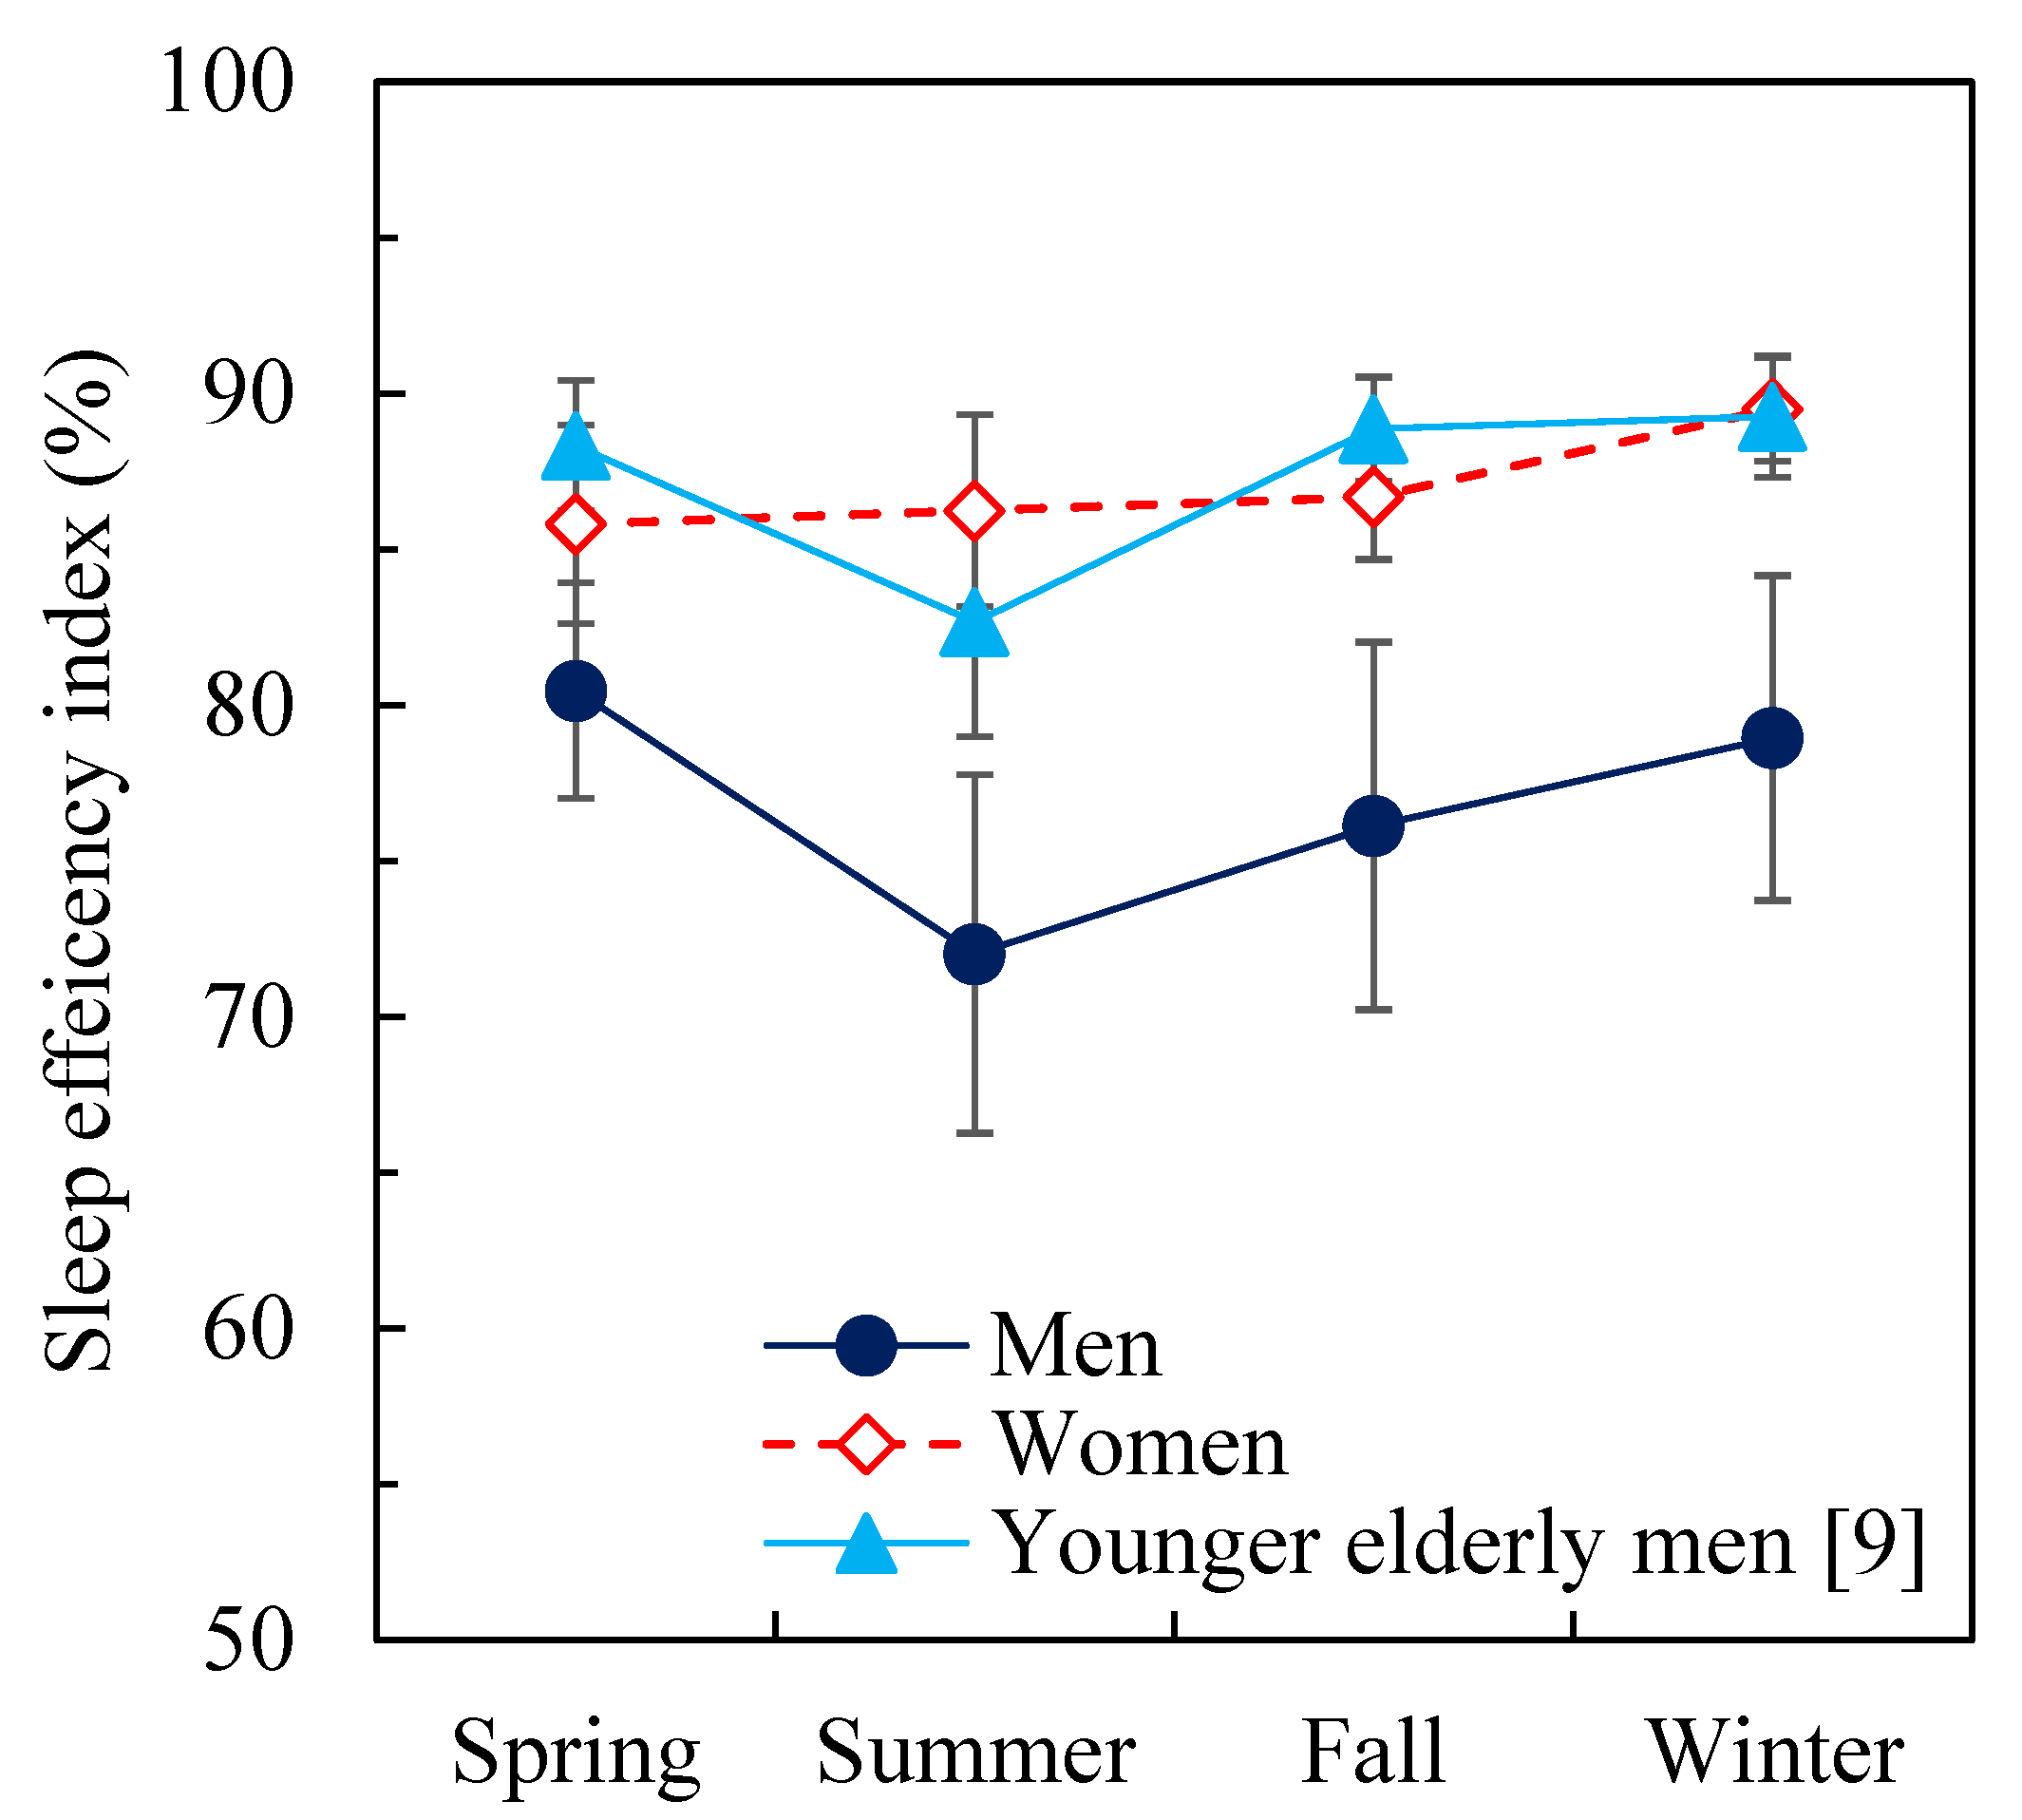
Thermoregulation during heat exposure changes with aging. Older male subjects who are awake exhibit lower heat tolerance than younger men [5,6,7]. The ability to maintain a core body temperature and the sweating response during heat exposure appears to be reduced [7]. In our previous study, thermoregulation and sleep for elderly men (average 69 years old) were compared in two cases—at 26 °C and at 32 °C, while the Rh in both cases was maintained at 50% [34]. The results showed that a decrease in rectal temperature was suppressed and the sleep efficiency index was significantly lower due to increased wakefulness at 32 °C as compared to 26 °C when the elderly men wore short sleeve pajamas. In a previous experimental study, the duration of wakefulness was minimal at 29 and 34 °C in comparison to 21, 24, and 37 °C for young men during the sleeping period without clothing and bedding [38]. This discrepancy may be due to the age of the subjects. In the current study, the Ta in the bedroom was maintained at 29 °C at night, which can be expected to present a heat load on the human body during sleep because the ability of thermoregulation deteriorated for the elderly men. It can be expected that elderly men would have worse sleep quality, although elderly women did not seem to be influenced by the temperature. Moreover, the adaptive behavior was limited for the elderly women. The adaptive approach assumes people change their behavior. The adaptive approach of turning on a fan or opening a window is difficult for sleeping people, although sleeping people can sometimes move or remove the bedding covers unconsciously. Although more than 50% of the male participants used a fan during the sleeping period, the male participants demonstrated a waking time that was twice that of the female participants in summer. The sleep efficiency index of the male participants was reduced by more than 10% when compared to the women and the younger elderly men in our previous study [9], as shown in Figure 4. This fact means that the adaptive approach is not enough to improve the sleep efficiency of sleeping elderly people even within the acceptable temperature range based on the thermal comfort, especially for elderly men. The adaptive approach should be limited to waking elderly people or during the daytime. The HVAC should continue to operate while elderly people occupy the facilities, regardless of whether the caregivers or managers are absent. We strongly recommend that indoor temperature is monitored by the caregivers, managers, or local government authorities.
No large-scale survey was approved by the facility. Although we recruited 20 people, only 16 people were able to complete the first spring experiment. This is also because the standard requirements for the health of the subjects were strict. Although the number of subjects was limited, not only the measurement of the thermal environment in the building, but also the questionnaire survey of thermal comfort and the sleep measurement using the actigraph, showed that indoor environment had an adverse effect on the elderly residents at night in summer. This study started with 16 elderly participants—8 men and 8 women—in two facilities. Two men passed away after the summer experiments, and one more was hospitalized after the fall experiment. The age of the participants in the present study was around 80 years old (70–87 years old) for both men and women. At the time when this field survey was undertaken in Japan, the average life expectancy was 79 and 85 years of age for men and women, respectively. The missing data of the three men may be due to life expectancy. The sleep quality was worse for the men in summer, and, was worse for the men than for the women in all four seasons. It is still unclear why the sleeping quality of elderly women in summer season did not deteriorate as it did for men. It is necessary to investigate thermoregulation and sleep quality of the elderly women during sleep. The co-existence of other factors—not yet disclosed in the present study—in addition to the thermal environment, may also influence the sleep quality of senior people.
There are certain limitations to the study as follows:
The air velocity and radiant temperature could not be measured continuously during the night because the researchers could not stay overnight. Moreover, other physiological parameters were also not measured because the ethical committee did not accept the procedure to measure physiological responses by means other than an actigraph. One of the largest limitations was the small sample size used to investigate the thermal comfort for elderly people. Moreover, the assessments of clothing and bed cover insulation levels are likely to introduce uncertainties.
5. Conclusions

The currently presented results are from a field study on thermal environment, thermal comfort, and sleep quality in two elderly living facilities in Nagoya, Japan over four seasons. The main conclusions are as follows:
The indoor environment was conditioned by an HVAC system operating in mixed-mode—the air conditioners were turned off while the caregivers were absent from the facilities during the night. The indoor thermal environment in the elderly facilities, except in summer, complied with the Japanese Standard for Maintenance of Sanitation in Buildings [6]. The indoor temperature exceeded 28 °C during the night in summer and the occupants used adaptive approaches such as fans and opening windows to increase the air velocity and mitigate the effects of heat. The adaptive behaviors of using a fan or opening a window were observed in more than 50% of participants in summer. However, the other participants took no action. This suggests that adaptive behavior of the elderly themselves should not be expected.
More than 50% of the male participants used fans in summer. The sleep efficiency index was significantly lower for men than for women. These results suggest that the elderly men did not sleep well even within the acceptable temperature range. Thus, this study shows that adaptive behavior is not sufficient for improving the sleep of elderly people even when indoor temperatures are acceptable for waking elderly people exhibiting adaptive behavior. The adaptive approach should be limited to waking people who are healthy and able to control their surrounding environment.
New procedures to ensure the indoor temperature does not exceed the upper limit set by the Japanese Standard for Maintenance of Sanitation in Buildings [11] during the night should be adopted for the operation of HVACs in surveyed facilities, such as elderly residences, regardless of whether the caregivers or managers are absent.

Author Contributions

K.T. and Y.S. designed the study. K.T., Y.S. and T.S. collected and analyzed the data. K.T. wrote the manuscript and provided resources and funding support, reviewed, edited the manuscript, and supervised the research. All authors have read and agreed to the published version of the manuscript.

Funding

This research was supported by JSPS KAKENHI Grant Number 25282016, 19H02296 & Hibi science foundation (2018–19).

Institutional Review Board Statement

The study was conducted according to the guidelines of the Declaration of Helsinki, and approved by the research ethics committee of the Institute of Advanced Industrial Science and Technology (AIST).

Informed Consent Statement

Informed consent was obtained from all participants involved in the study. All participants agreed to the experimental procedure and the publication of data.

Data Availability Statement

The authors confirm that the data supporting the findings of this study are available within the article. Permission to reproduce material from other sources was not applicable.

Acknowledgments

We are grateful to the staff of the elderly care facilities, and to all of the participants, who have contributed to the data collection over the year.

Conflicts of Interest

The authors declare no conflict of interest.

Appendix A

Table A1. Clo Value.
Covering(clo)
Towelket0.6
Blanket0.84
Woolen quilt1.5
Quilt1.62
Down quilt3.9
Bedding
Bed sheets0.2
Quilted pad for beds0.4
Blanket0.56
Futon mattress1.48
Mattress2.12

Appendix B

Table A2. Air Velocity.
ParticipantAir Velocity (m/s)
11.77 (0.14)
21.18 (0.19)
31.14 (0.09)
40.73 (0.13)
Average (SD)1.20 (0.14)

References

  1. Carskadon, M.A.; Dement, W.C. Chapter 2 Normal human sleep: An overview. In Principles and Practice of Sleep Medicine, 5th ed.; Kryger, M.H., Roth, T., Dement, W.C., Eds.; Elsevier Inc.: Philadelphia, PA, USA, 2011; pp. 16–26. [Google Scholar]
  2. Monk, T.H. Sleep and circadian rhythms. Exp. Gerontol. 1991, 26, 233–243. [Google Scholar] [CrossRef]
  3. Monk, T.H.; Reynolds, C.F.; Buysse, D.J.; Hoch, C.C.; Jarrett, D.B.; Jennings, J.R.; Kupfer, D.J. Circadian characteristics of healthy 80-year-olds and their relationship to objectively recorded sleep. J. Gerontol. 1991, 46, M171–M175. [Google Scholar] [CrossRef] [PubMed]
  4. Dorsey, C.M.; Teicher, M.H.; Cohen-Zion, M.; Stefanovic, L.; Satlin, A.; Tartarini, W.; Harper, D.; Lukas, S.E. Core body temperature and sleep of older female insomniacs before and after passive body heating. Sleep 1999, 22, 891–898. [Google Scholar] [CrossRef] [PubMed] [Green Version]
  5. Sagawa, S.; Shiraki, K.; Mohamed, K.; Miki, K. Sweating and cardiovascular responses of aged men to heat exposure. J. Gerontol. 1988, 43, M1–M8. [Google Scholar] [CrossRef] [PubMed]
  6. Inoue, Y.; Nakao, M.; Araki, T.; Murakami, H. Regional differences in the sweating responses of older and younger men. J. Appl. Physiol. 1991, 71, 2453–2459. [Google Scholar] [CrossRef] [PubMed]
  7. Inoue, Y.; Nakao, M.; Araki, T.; Ueda, H. Thermoregulatory responses of young and older men to cold exposure. Eur. J. Appl. Physiol. Occup. Physiol. 1992, 65, 492–498. [Google Scholar] [CrossRef]
  8. Okamoto-Mizuno, K.; Tsuzuki, K. Effects of season on sleep and skin temperature in the elderly. Int. J. Biometeorol. 2010, 54, 401–409. [Google Scholar] [CrossRef] [PubMed]
  9. Tsuzuki, K.; Mori, I.; Sakoi, T.; Kurokawa, Y. Effects of seasonal illumination and thermal environments on sleep in elderly men. Build. Environ. 2015, 88, 82–88. [Google Scholar] [CrossRef]
  10. White Papers & Reports Annual Health. In Labour and Welfare Report 2009–2010; Cabinet Office: Tokyo, Japan, 2010.
  11. Standard for Maintenance of Sanitation in Buildings; Ministry of Health, Labour and Welfare: Tokyo, Japan, 1970.
  12. ASHRAE, ANSI/ASHRAE Standard 55–2017, Thermal Environmental Conditions for Human Occupancy; American Society of Heating, Refrigerating and Air-Conditioning Engineers, Inc.: Atlanta, GA, USA, 2017.
  13. ISO 7730 Ergonomics of the Thermal Environment—Analytical Determination and Interpretation of Thermal Comfort Using Calculation of the PMV and PPD Indices and Local Thermal Comfort Criteria; International Organization for Standardization: Geneva, Switzerland, 2005.
  14. Rupp, R.F.; Vásquez, N.G.; Lamberts, R. A review of human thermal comfort in the built environment. Energy Build. 2015, 105, 178–205. [Google Scholar] [CrossRef]
  15. Nicol, J.F.; Humphreys, M.A. Adaptive thermal comfort and sustainable thermal standards for buildings. Energy Build. 2002, 34, 563–572. [Google Scholar] [CrossRef]
  16. De Dear, R.J.; Brager, G.S.; Reardon, J.; Nicol, F. Developing an adaptive model of thermal comfort and preference. ASHRAE Trans. 1998, 104, 145. [Google Scholar]
  17. Yang, J.; Nam, I.; Sohn, J.R. The influence of seasonal characteristics in elderly thermal comfort in Korea. Energy Build. 2016, 128, 583–591. [Google Scholar] [CrossRef]
  18. Wong, L.T.; Fong, K.N.K.; Mui, K.W.; Wong, W.W.Y.; Lee, L.W. A field survey of the expected desirable thermal environment for older people. Indoor Built Environ. 2009, 18, 336–345. [Google Scholar] [CrossRef]
  19. Wong, J.K.W.; Skitmore, M.; Buys, L.; Wang, K. The effects of the indoor environment of residential care homes on dementia suffers in Hong Kong: A critical incident technique approach. Build. Environ. 2014, 73, 32–39. [Google Scholar] [CrossRef] [Green Version]
  20. Tartarini, F.; Cooper, P.; Fleming, R. Thermal perceptions, preferences and adaptive behaviours of occupants of nursing homes. Build. Environ. 2018, 132, 57–69. [Google Scholar] [CrossRef] [Green Version]
  21. Hwang, R.L.; Chen, C.P. Field study on behaviors and adaptation of elderly people and their thermal comfort requirements in residential environments. Indoor Air 2010, 20, 235–245. [Google Scholar] [CrossRef] [PubMed]
  22. Faul, F.; Erdfelder, E.; Lang, A.-G.; Buchner, A. G*Power 3: A flexible statistical power analysis program for the so-cial, behavioral, and biomedical sciences. Behav. Res. Methods 2007, 39, 175–191. [Google Scholar] [CrossRef] [PubMed]
  23. Cole, R.; Kripke, D.; Gruen, W.; Mullaney, D.; Gillin, J. Automatic sleep/wake identification from wrist activity. Sleep 1992, 15, 461–469. [Google Scholar] [CrossRef] [PubMed]
  24. ISO 9920 Ergonomics of the Thermal Environment—Estimation of Thermal Insulation and Water Vapour Resistance of a Clothing Ensemble; International Organization for Standardization: Geneva, Switzerland, 2007.
  25. Available online: http://www.jma.go.jp/jma/menu/menureport.html (accessed on 25 August 2021).
  26. Rupp, R.; de Dear, R.; Ghisi, E. Field study of mixed-mode office buildings in Southern Brazil using an adaptive thermal comfort framework. Energy Build. 2018, 158, 1475–1486. [Google Scholar] [CrossRef]
  27. Tsuzuki, K.; Okamoto-Mizuno, K.; Mizuno, K.; Iwaki, T. Effects of airflow on body temperatures and sleep stages in a warm humid climate. Int. J. Biometeorol. 2008, 52, 261–270. [Google Scholar] [CrossRef] [PubMed]
  28. Desjardins, S.; Lapierre, S.; Hudon, C.; Desgagné, A. Factors involved in sleep efficiency: A population-based study of community-dwelling elderly persons. Sleep 2019, 42, zsz038. [Google Scholar] [CrossRef] [PubMed] [Green Version]
  29. Lacks, P.; Morin, C.M. Recent advances in the assessment and treatment of insomnia. J. Consult. Clin. Psychol. 1992, 60, 586–594. [Google Scholar] [CrossRef] [PubMed]
  30. van den Berg, J.F.; Miedema, H.M.; Tulen, J.H.; Hofman, A.; Neven, A.K.; Tiemeier, H. Sex differences in subjective and actigraphic sleep measures: A population-based study of elderly persons. Sleep 2009, 32, 1367–1375. [Google Scholar] [CrossRef] [PubMed]
  31. Reyner, A.; Horne, J.A. Gender- and age-related differences in sleep determined by home-recorded sleep logs and actimetry from 400 adults. Sleep 1995, 18, 127–134. [Google Scholar] [PubMed]
  32. Okamoto, K.; Kudoh, Y.; Yokoya, T.; Okudaira, N. A Survey of Bedroom and Bed Climate of the Elderly in a Nursing Home. Appl. Hum. Sci. 1998, 17, 115–120. [Google Scholar] [CrossRef] [PubMed]
  33. Okamoto-Mizuno, K.; Yokoya, T.; Kudoh, Y. Effects of activity of daily living and gender on circadian rhythms of the elderly in a nursing home. J. Physiol. Anthropol. 2000, 19, 53–57. [Google Scholar] [CrossRef] [PubMed] [Green Version]
  34. Nioi, A.; Roe, J.; Gow, A.; McNair, D.; Aspinall, P. Seasonal Differences in Light Exposure and the Associations With Health and Well-Being in Older Adults: An Exploratory Study. HERD 2017, 10, 64–79. [Google Scholar] [CrossRef] [PubMed] [Green Version]
  35. Aarts, M.P.J.; Stapel, J.C.; Schoutens, T.A.M.C.; van Hoof, J. Exploring the Impact of Natural Light Exposure on Sleep of Healthy Older Adults: A Field Study. J. Daylighting 2018, 5, 14–20. [Google Scholar] [CrossRef] [Green Version]
  36. Kume, Y.; Makabe, S.; Singha-Dong, N.; Vajamun, P.; Apikomonkon, H.; Griffiths, J. Seasonal effects on the sleep-wake cycle, the rest-activity rhythm and quality of life for Japanese and Thai older people. Chronobiol. Int. 2017, 34, 1377–1387. [Google Scholar] [CrossRef] [PubMed]
  37. Okamoto-Mizuno, K.; Tsuzuki, K.; Mizuno, K. Effects of mild heat exposure on sleep stages and body temperature in older men. Int. J. Biometeorol. 2004, 49, 32–36. [Google Scholar] [CrossRef] [PubMed]
  38. Haskell, E.H.; Palca, J.W.; Walker, J.M.; Berger, R.J.; Heller, H.C. The effects of high and low ambient temperatures on human sleep stages. Electroencephalogr. Clin. Neurophysiol. 1981, 51, 494–501. [Google Scholar] [CrossRef]
Figure 1. Changes in indoor and outdoor Ta and Rh across 24 h among the four seasons.
Buildings 11 00574 g001
Figure 2. Relationship between Ta and thermal sensation before and after sleep.
Buildings 11 00574 g002aBuildings 11 00574 g002b
Figure 3. Relationship between prevailing mean outdoor temperature and indoor temperature.
Buildings 11 00574 g003
Figure 4. Sleep efficiency index in four seasons when compared to the younger elderly men in previous study [9].
Buildings 11 00574 g004
Table 1. Characteristics of the elderly facilities.
Nursing HomeGrandfloor -AreaTotal floor AreaBuilding StructureNumber of Private RoomMaximum CapacityRoom TypePrivate RoomApplianceBathing
EF12711 m23471 m2Nine-story building made of reinforced concrete100 rooms100 personsSingle room9.7 m2, closet, kitchen, WC, balconyAir-conditioner, sprinklerTwo public baths: three times per week except summer, summer is every day
EF24049 m25917 m2Six-story building made of reinforced concrete148 rooms160 personsSingle room9.7 m2, closet, kitchen, WC, balconyAir-conditioner, sprinklerTwo public baths: every day
Single room for a couple12.2 m2, closet, kitchen, WC, balconyAir-conditioner, sprinkler
Table 2. Questionnaire survey for subjective sleep and thermal comfort.
Subjective sleep
Do you fall asleep easily?
1. difficultly, 2. rather difficultly, 3. neutral, 4. rather well, 5. well
How do you feel when you wake up in the morning?
1. sleepy, 2. rather sleepy, 3. neutral, 4. rather refreshed, 5. refreshed
Do you have enough time to sleep?
1. deficient, 2.rather deficient, 3.neutral, 4.rather enough, 5.enough
Do you sleep deeply?
1. lightly, 2. rather lightly, 3. neutral, 4. rather deeply, 5. deeply
Did you sleep well compared to last week?
1. badly, 2. rather badly, 3. neutral, 4. rather well, 5. well
Thermal comfort
The whole-body thermal sensation
1. very cold, 2. cold, 3. cool, 4. slightly cool, 5. neutral, 6. slightly warm, 7. warm, 8. hot, 9. very hot
Comfort sensation
1. very uncomfortable, 2. uncomfortable, 3. slightly uncomfortable, 4. neutral, 5. slightly comfortable, 6. comfortable, 7. very comfortable
Table 3. Average (SD) indoor air temperature and relative humidity before, after and during the sleeping time among the four seasons.
SpringSummerFallWinter
WomenMenWomenMenWomenMenWomenMen
Before sleep
Bedroom temperature (°C) *26.3 (0.6)26 (1.4)27.6 (1.1)27.6 (1.2)24.4 (1.8)24.2 (1.4)23.7 (2.6)24.4 (1.4)
Bedroom relative humidity (%) *48.5 (5.3)48 (2.4)59.5 (6)59.7 (6.3)46.7 (4.7)45.2 (5.1)35.5 (3.2)37.2 (8.7)
In the morning
Bedroom temperature (°C) *25.3 (1.1)25 (1)28.6 (0.9)29.2 (0.9)22.1 (1.6)21.9 (1.3)20.8 (2.1)20.4 (3.7)
Bedroom relative humidity (%) *53 (5.3)52.5 (2.8)63.7 (3.5)64.2 (4.4)50 (4.3)47.4 (3.7)38.9 (4.6)40.6 (6.3)
Outdoor temperature (°C)18.8 (1.2)26.5 (0.8)10.4 (0.7)5.7 (1.3)
Outdoor relative humidity (%)65.8 (5.2)77.5 (2.1)73.3 (3.1)64.1 (5.7)
Average (SD); * Significant difference between seasons.
Table 4. Average (SD) clo values for clothes and overlay bedding, and percentages of using adaptive approaches for men and women over four seasons.
SpringSummerFallWinter
MenWomenMenWomenMenWomenMenWomen
Clothes (clo) *0.47 (0.28)0.55 (0.2) f0.37 (0.22) a0.31 (0.12) eg0.62 (0.32) bd0.69 (0.14) fh0.48 (0.28) c0.44 (0.19) g
Overlay bedding (clo) *1.3 (0.6) c1.4 (0.7) gh0.8 (0.4) c1.2 (0.5) gh2.0 (1.0) ab2.4 (1.0) ef2.7 (0.9)2.6 (1.8) ef
Total bedding (clo) 4.8 (1.3)5.2 (1.4)4.9 (1.8)4.7 (1.5)5.9 (1.6)5.8 (2.5)6.2 (1.5)6 (1.9)
Percentage of using electric fan (%)13057130000
Percentage of opening windows (%)13130380000
Percentage of using electric warmer inside the bedding (%)0000005013
Average (SD); *: Significant difference between seasons; a: Significant difference from Men–Spring, p < 0.05; b: Significant difference from Men–Summer, p < 0.05; c: Significant difference from Men–Fall, p < 0.05; d: Significant difference from Men–Winter, p < 0.05; e: Significant difference from Women–Spring, p < 0.05; f: Significant difference from Women–Summer, p < 0.05; g: Significant difference from Women–Fall, p < 0.05; h: Significant difference from Women–Winter, p < 0.05.
Table 5. Sleep parameters for the two groups among the four seasons.
SpringSummerFallWinter
MenWomenMenWomenMenWomenMenWomen
Night time
Bedtime (h:m)21:35 (1:16)21:00 (1:21)21:18 (1:16)21:58 (0:47)22:05 (0:42)21:05 (1:38)22:09 (0:44)21:45 (1:01)
Wake-up time (h:m)5:42 (0:37)5:53 (1:40)5:51 (0:41)5:25 (0:47)6:08 (0:26)5:39 (0:38)6:05 (0:33)5:44 (0:33)
Time in bed (h:m)7:27 (0:53)7:44 (1:39)8:34 (1:30)7:27 (0:48)8:05 (0:42)8:08 (1:12)7:56 (0:53)8:00 (1:04)
Total sleep time (h:m) #5:56 (0:20)6:38 (1:25)6:14 (1:38)6:27 (1:11)6:05 (0:46)7:04 (1:08)6:11 (0:33)7:09 (0:51)
Wake (min) #91 (49)65 (51)140 (67) f60 (33) b120 (79)65 (30)106 (77)52 (27)
Sleep efficiency index (%) #80 (8)86 (9)72 (14) f86 (9) b76 (14)87 (6)79 (13)89 (5)
Sleep latency (min) #16 (6)17 (11)26 (19)18 (10)20 (9)11 (3)26 (12) h10 (3) d
Longest wake episode (min) 25 (4)24 (16)37 (13)31 (20)30 (18)27 (12)22 (7)19 (7)
Activity index #27 (11)17 (8)44 (30) f19 (12) b32 (17)18 (7)29 (16)14 (5)
Daytime
Activity index185 (27)209 (27)204 (88)204 (36)177 (41)209 (28)187 (25)214 (28)
Sleep time (min) #67 (40)33 (26)93 (84)44 (39)83 (62)48 (44)58 (45)20 (19)
Average (SD); #: Significant difference between sexes; b: Significant difference from Men–Summer, p < 0.05; f: Significant difference from Women–Summer, p < 0.05; d: Significant difference from Men–Winter, p < 0.05; h: Significant difference from Women–Winter, p < 0.05.
Table 6. Sensation for thermal comfort and subjective evaluations of sleep.
SpringSummerFallWinter
MenWomenMenWomenMenWomenMenWomen
Before sleep
Thermal sensation for whole body5.9 (0.9) c5.6 (1.3)5.8 (1.4)4.8 (0.7)4.5 (1.4) a5.4 (0.9)5.1 (0.9)5.7 (0.9)
Thermal sensation for foot #5.8 (0.7) c6.1 (1.2)5.6 (1)5.4 (1.2)4.5 (1.4) a5.3 (1.3)5 (0.9) h6.3 (0.5) d
Comfort sensation #3.4 (0.4)2.9 (0.5)3.5 (0.3)3.2 (0.6)3.7 (0.4) g2.9 (0.6) c3.7 (0.4) h2.7 (0.8) d
Feeling of sweating *1.5 (0.4)1.4 (0.6)1.7 (0.5) cd1.2 (0.2)1.1 (0.2) b1.1 (0.1)1 (0.1) b1.1 (0.1)
After sleep
Thermal sensation for whole body *5.7 (1.1) c5.4 (1.1)6.7 (0.8) cd5.3 (0.7)4.4 (1) ab5.4 (0.9)4.8 (1.3) b5.3 (0.9)
Thermal sensation for foot #5.8 (0.9) c6 (1.1)6 (1) c5.6 (1.4)4.5 (1.1) afg5.7 (1) c4.7 (1.3) h6.1 (0.9) d
Comfort sensation *3.5 (0.5) b3.3 (0.7)4 (0.3) a3.7 (0.6)3.8 (0.3)3.3 (0.6)3.7 (0.4)3.4 (0.7)
Feeling of sweating *1.4 (0.4) b1.3 (0.4)2 (0.3) acdf1.4 (0.3) b1 (0.1) b1.1 (0.3)1.2 (0.3) b1.2 (0.2)
Subjective sleep
Do you fall asleep easily? #3.8 (0.7)3.5 (1.2)3.3 (0.7)3.4 (1.1)3.8 (0.5)3.2 (1.1)3.8 (0.5)3.2 (1.2)
How do you feel when you wake ip in the morning?3.3 (0.4)3.4 (0.8)3 (0.5)2.9 (0.8)3.2 (0.5)3.1 (1.1)3.4 (0.4)3.4 (1.2)
Do you have enough time to sleep? 3.9 (0.4)3.8 (1.2)3.4 (0.7)3.6 (1.2)3.8 (0.2)3.6 (1.3)4 (0.3)3.8 (1.3)
How do you sleep deeply?3.5 (0.7)3.6 (1.1)3 (0.8)3.5 (1.2)3.4 (0.5)3.4 (1.2)3.7 (0.6)3.6 (1.3)
Do you sleep well compared to the last week?3.8 (0.4)3.8 (0.9)2.9 (0.4)3.6 (1.3)3.5 (0.5)3.6 (1.3)3.7 (0.5)3.6 (1.2)
Average (SD); #: Significant difference between sexes; *: Significant difference between seasons; a: Significant difference from Men–Spring, p < 0.05; b: Significant difference from Men–Summer, p < 0.05; c: Significant difference from Men–Fall, p < 0.05; d: Significant difference from Men–Winter, p < 0.05; f: Significant difference from Women–Summer, p < 0.05; g: Significant difference from Women–Fall, p < 0.05; h: Significant difference from Women–Winter, p < 0.05.
Publisher’s Note: MDPI stays neutral with regard to jurisdictional claims in published maps and institutional affiliations.