Abstract
In terms of the European Green Deal’s objectives, an environmentally responsible and climate responsive architecture seems to be fully desirable in the next decades. From the perspective of health-oriented design, atria and inner courtyards are gaining in significance due to their potential for regulating indoor air temperature and quality, especially if they are properly technically equipped and supported by appropriate landscaping. In this particular approach, the “atrium effect” is discussed in the presented study, in contrast to the specific method of forming the upwardly opened lobby. In the search for a method to optimize the use of the biophilic elements in semi-open built environments, the authors use ENVI-met v. 4.4.4. software to assess their impact on physical parameters of the environment.
1. Introduction
The atrium, as an open-air or skylight-lit integral part of the building, is gaining in significance in modern architecture due to its potential for adaptation to climate change. In the original sense, the atrium meant a central reception space in a Roman house, illuminated and ventilated through a roof opening and protected by walls against wind and extreme temperatures. The impluvium (in Latin a small pool filled with rainwater, flowing down the roofs through a hole called compluvium) had a significant impact on the stabilization of temperatures inside the building. Water, warming up more slowly than the surroundings, became a nice source of coolness during the day, while at night it slowly released heat to the air. As a result, daily temperature differences were reduced, positively affecting the well-being of the residents. In many cultures, internal courtyards performed a similar regulatory function, though not so obvious, because of the various purposes of the surrounding buildings. They were usually much larger than the atria and their proper adiabatic zone was formed by the roof overhangs and canopies protecting external corridors, staircases, porches or other semi-open spaces along the walls.
Nowadays, thanks to light transparent roof constructions, the possibilities of using the climate “atrium effect” are constantly growing, both in newly designed houses as well as in the case of renovating and reinforcing connections between existing structures at the level of courtyards. As a tool of climate-responsive architecture, in combination with the human-oriented and biophilic design, the atrium raises growing consideration among architects and landscape architects for their good embedding in long-term policies and strategies implemented after the Paris Climate Agreement (Paris 2015). An increase in designers’ declarative activity was observed in the period prior to the European Green Deal (Brussels 2019), where “building and renovating” was recognized as one of the flagship programmes [1]. In this context, the “RIBA Sustainable Outcomes Guide” deserves particular attention as a kind of the action plan with well-defined goals that need to be achieved by 2030 and 2050 [2].
In many respects, this document can serve as a reference plane in countries such as Poland, where architects feel the lack of clearly established “green” search directions, knowing at the same time the nature of the climate threats. Pilot prognostic analyses for 44 Polish cities indicate that, regardless of the catastrophic phenomena such as cloudbursts, storms or prolonged drought, heat stress will be the major environmental factor threatening citizens’ health [3]. All climatic scenarios show that the temperature will continue to rise for the present century. Warm periods will probably occur more frequently and last longer [4]. The trends observed in Poland will be analogous to changes in other European countries. There will be an increase in temperature in all seasons, with slight changes in precipitation and a decrease in relative humidity [5].
In practice, this means the need for shading and cooling of large parts of public spaces, especially in the immediate vicinity of homes, schools, hospitals, workplaces and other areas mostly frequented by people. A conscious shaping of indoor and outdoor climate seems therefore fully desirable, and, in this particular approach, the “atrium effect” is discussed in this study, in contrast to the specific method of forming the entrance zone of the building, through connecting staircases and galleries on several floors around the upwardly opened lobby [6]. Moderation of an indoor climate should be combined with similar outdoor regulatory efforts, because the urban heat island effect accelerates the consequences of climate change, affecting the number of deaths [7,8,9]. In response to these challenges, tools have been created such as the urban heat vulnerability map of Vienna, indicating the distribution of areas that are a) the most heated and b) inhabited by the most vulnerable population. The map facilitates selection of the places appropriate for “cooling parks” and “cooling streets”, which are seasonally equipped with devices (like mist nozzles) reducing the ambient temperature. The pilot project, established in 2019, was assessed with the ENVI-met software, which showed the potential decrease of the temperature in the immediate surroundings up to 5 K (5 °C) [10,11]. In the Viennese case, there were no measurements of real condition conducted, but there were subsequent studies in different climate zones showing that the ENVI-met model is well correlated with field data [12,13].
Within the same limits, one can lower the temperature inside the facilities using the atrium effect, for example the “air trees” at the bioclimatically conditioned public space in Vallecas, Spain designed by Ecosistema Urbano in 2007, or in properly shaped inner courtyards, which have insolation-optimized proportions in plans and cross-sections, as well as a well-organized ventilation system [14]. As a model example of such a “bioclimate generator”, we may consider the Austrian pavilion at Expo 2015 designed by the breathe.austria team. It was correctly constructed in terms of shading and aeration and planted with perfectly matched species imitating the Alpine forest ecosystem [15]. However, while the technical principles of shaping inner courtyards and atrium-related spaces have been quite well recognised in the literature [16], much less is known about improving air quality through the use of biophilic design methods.
From the other side there are numerous studies that show a positive impact on the site microclimate by implementing blue and green infrastructure. A lot of analyses on urban air temperatures reduction suggest that urban parks are cooler by 1K (1 °C) in comparison to the non-vegetated surroundings [17]. Intensive green roofs’ cooling effect can achieve between 0.5–1.7 K (0.5–1.7 °C), while the impact of extensive roofs is estimated from 0.4–0.7 K (0.4–0.7 °C), dependent on spatial arrangement, vegetation density and other factors [18]. Regarding the effect of green walls on the microclimate, the most often measured parameter is the surface temperature of the wall covered with vegetation [19]. The studies vary in the data from pointing to no effect on air temperature, even at one metre from the wall [20,21], up to an ambient temperature reduction of 3.33 K (3.33 °C) at the distance of 15 cm [22]. The green efficiency depends on many variables such as exposure [23,24] or canopy density [24]. A review of 28 studies on the effect of using water mist in outdoor spaces suggests that the average maximum temperature drop may reach 8 K (8 °C). The quoted review also suggests a decrease in mist cooling efficiency when the temperature is higher than 303.15 K (30 °C) [25].
Between 2009 and 2010 at Kostakii Campus of the Technological Education Institute of Epirus, Greece, a study was conducted on the effect of a hydroponic pergola on the microclimate of the atrium, when its surface was covered by a 0%-, 50%- or 100%-planted structure. According to the authors, simulations carried out using the microclimate ENVI-met (V4) model after comparison with the actual effects found during the experiment confirmed the high compliance of the predicted changes [26]. Another experiment carried out in the same atrium included both pergola and hydroponic green walls. Also in this case, high compliance of the predicted and obtained effects was confirmed [27]. Both reference examples point to the usefulness of the ENVI-met (V4) software as a useful tool for assessing atrium development variants at the design stage. However, a number of questions remain unanswered. It is not known, for example, what impact on the interior temperature the pergola/ green wall structure would have itself after filling with water, and two to three months after planting.
The above data are dispersed in various sources, which hinders the formation of a less intuitive picture of biophilic changes in terms of climate [28]. In this context, the aim of the presented analyses was to assess the suitability of the ENVI-met v. 4.4.4 software for the design of the “atrium effect” by using natural elements, such as water, green walls, a green roof and a roof made of climbing plants.
2. Materials and Methods
As mentioned above, the software used for modelling and simulation was ENVI-met v. 4.4.4. The tool was used to build, in reference to the existing state, an artificial environment to check the impact on the microclimate and justify the future solutions implemented in the reality. The area of interest was a part of a hospital building placed in Lodz in central Poland (Figure 1). The atrium “A” was modelled on the basis of the real structure, of which the horizontal dimensions are 49.5 m on the east-west axis and 15.4 m on the north-south axis. Due to the software’s limitation (the software allows researchers to model objects in a 1 × 1 × 1 m grid), the atrium in the computer model had dimensions of 49 × 15 m. Also, the building height of 12.8 m was approximated to 13 m. On the north side of this space there is a lower staircase body with a height of 10 m and dimensions in the plan view of 12 × 7 m. The dimensions of the entire model are 250 × 180 × 45 m.
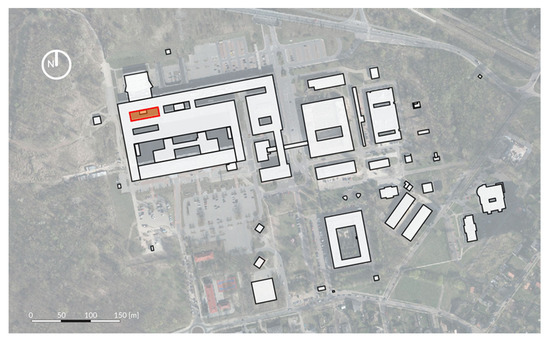
Figure 1.
The clinical hospital of Medical University of Lodz: the atrium is placed in the northwestern part of the complex and marked in the picture with the red border. Figure by authors.
The second atrium is situated from the southern side of the atrium “A” one and more hidden in the shadow of the high building, which was not taken into account in the simulations presented. The 3D model omitted other cubature objects of the hospital, adjacent to selected buildings from the south, east and north, because the purpose of the study was to assess the effect on air temperature as a result of interventions simulated inside atrium “A”. In this context, the model’s surroundings were treated as a flat surface, taking into account, however, the real physical properties of the existing coverage. In fact, both atria let the natural light into the complex architectural structure and are located in its northwestern part. The initial state of atrium “A”’s environment (smooth lawn without trees and bushes) was then compared with the temperature changes that four different, separately considered elements of green infrastructure could introduce in it. There were four tested impact scenarios:
1. Introduction of a 2 m-high water curtain consisting of five nozzles, which was placed in the eastern part of the atrium; 2 a–d. placing a green wall consecutively on each of the building elevations: eastern, northern, western and southern (the software does not provide for the possibility of greening part of the wall); 3. placing a green roof above the staircase; 4. covering the atrium with a roof made of climbing plants.
Simulation of the impact on ambient temperature was made for August 9, 2018, the hottest day of the year in Lodz [29]. The maximum air temperature reached 305.45 K (32.3 °C) on that day, with a minimum temperature of 292.65 K (19.5 °C) and an average wind speed of 2.1 m/s. Only these data were entered into the model because the basic mode was used for the calculations. The simulation lasted eight hours. Each scenario was calculated and compared with the initial state in terms of potential air temperature and relative humidity. A height of 1.5 m was used as the horizontal reference plane because it has a direct impact on people. Vertical sections were made at characteristic points: the cutting plane and the view direction are described in each photo.
3. Results
3.1. The Initial State
The spatial orientation and proportions of the atrium mean that the light access is limited, even with a relatively long day and high summer sun position (Figure 2). The longer part of the space is oriented along the east–west axis, so the floor on the south side of the courtyard stays in the shade for most of the day. The estimated atrium surface is 650 sq m. Only less than 1% of which remained in the sun for eight or more hours on the modelled day. About 22% of the area was in the sun for less than 59 min. In total, about 40% of the surface was illuminated for more than 4 h.
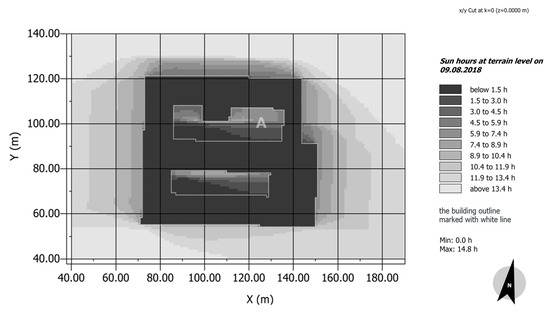
Figure 2.
The sun hours at terrain level on August 9, 2018 in the context of the whole model – the atrium is placed in the north part of the complex, marked with the letter A. Figure by authors.
The recorded air temperature on August 9, 2018 was between 292.15 and 305.45 K (19.5 and 32.3 °C), which made it the warmest day of the year at the tested location. The model has shown that the air temperature has reached its maximum after four o’clock. Figure 3 demonstrates the spatial arrangement of the potential air temperature: it rises with the southeast shift, which is determined by the presence of the buildings coated with gray roofing felt. The terrain covered with vegetation, adjacent from the northwestern side, determines the modelled air temperature difference of almost 2.0 K. The atrium floor is grass and the air temperature at 1.5 m above ground level is between 303.34 and 303.67 K (30.19 °C and 30.52 °C), on average 303.45 K (30.3 °C).
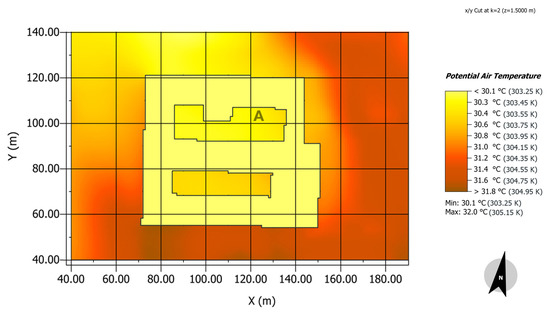
Figure 3.
Potential air temperature at 16:00 on August 9, 2018 in the modelled situation. The model building walls are marked with black line. As there is a section made at the 1.5 m height, a temperature of below 30.1 °C refers to the inner space of the adjacent structures. The atrium is marked with the letter A. Figure by authors.
The maximum surface temperature was reached in the modelled situation at 14 o’clock with 320.75 K (47.6 °C). The temperature of the parking lot, placed in the upper right side of Figure 4, made from gray paving brick is above 310.15 K (37.0 °C). It differs from the niches covered with vegetation located among parking places, where the surface temperature is approximately 306.05 K (32.9 °C). In the atrium the surface temperature is on average 302.55 K (29.4 °C): it varies from 300.55K (27.4 °C) to 314.35 K (41.2 °C) and depends mostly on the shading. Considering an influence on the atrium microclimate with different scenarios, only the water curtain may affect the surface. Other models did not have a significant impact on the surface temperature, which was tested during the study. Therefore all of the cases have been collated on the basis of air temperature and relative humidity data.
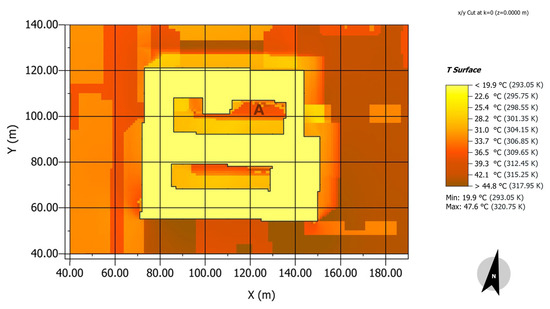
Figure 4.
Surface temperature at 14:00 on August 9, 2018 in the modelled situation. The building walls are marked with black lines. Temperatures of below 19.9 °C refer to the inner space of the structure. The atrium is marked with the letter A. Figure by authors.
3.2. The Water Curtain Scenario
The water curtain model was placed in the eastern part of the atrium and was distant from the eastern wall by 6 m and by 4 m from the northern wall. It was composed of five nozzles, each spouting water from a height of 2 m. Two nozzles are exposed to the sun for less than four hours, three of them for five to six and half hours. The water curtain spatial impact was assessed to be 15 by 15 m (Figure 5).
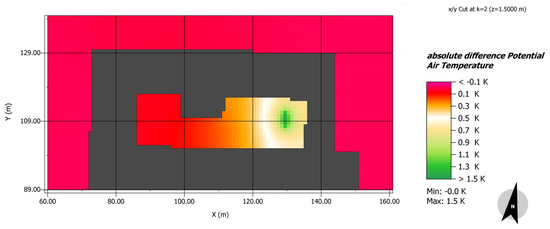
Figure 5.
The difference of air temperature between absolute current state and the reference water curtain scenario. Figure by authors.
As referring to the maximum air temperature at a 1.5 m height on the modelled day, placing the water curtain in the atrium had an impact mostly on the eastern part of the site. The spatial range can be estimated on 15 × 15 m: from the southern to the northern wall and from the eastern plane 15 m deep into the yard. Regarding the whole space, the average of absolute air temperature difference is 0.28 K, with a median of 0.17 K. In the context of a 15 × 15 m square, the average was 0.65 K and the median 0.66 K. The air temperature of water spray in the middle of the fountain was 1.5 K lower than absolute air temperature and 0.4 K lower on the edge, in the distance of 7 to 8 m from the water curtain.
The vertical section of the water curtain scenario was made on the east–west axis with the view on the northern part (Figure 6). There is a staircase section visible at the cross cut. The spatial impact of the fountain in the vertical dimension was noticeable even in the height of more than 10 m. An air temperature difference of up to 0.5 K was read to the height of 6 m. The air temperature in the water curtain scenario was 1.0 K lower above the water sheaf to the height of 3 m.
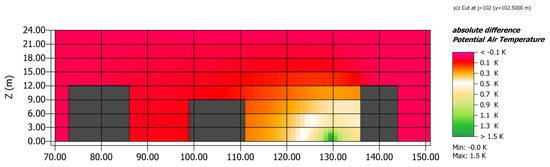
Figure 6.
The difference of air temperature between the absolute current state and the reference water curtain scenario in the cross cut; view in north direction. Figure by authors.
Comparing the relative humidity data of the initial state with the reference of water curtain scenario, a 7.6% difference in favour of the fountain scenario could be seen (Figure 7). In the spatial context, the positive influence up to 1% difference was noticeable at the distance of 27 m from the eastern wall to the west and at the length of 20 m counting form the water source. Considering the context of the whole atrium, the median and mean were calculated with the result of, respectively, 1.24% and 1.68% more compared to the current situation.
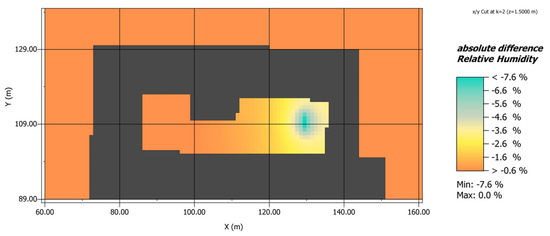
Figure 7.
The comparison of initial state with reference water curtain scenario relative humidity at the height of 1.5 m. Figure by authors.
3.3. The Green Wall Scenarios
There were four scenarios for green walls tested in the model (Figure 8, Figure 9). In each case, the green wall was placed on one wall inside the atrium. To simplify the case estimations, it was assumed that the planting covered the whole plane, from the floor to the eaves. The northern wall was covered excluding the staircase. The structure exposure should be considered when justifying outcomes in the context of real interventions—as it is a matter of plants varieties regarding the light conditions.
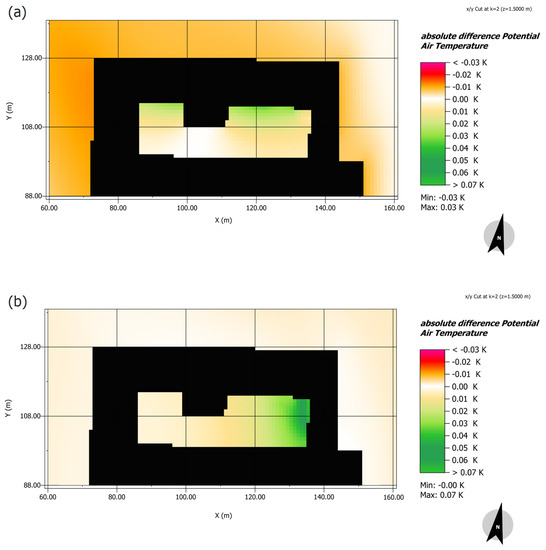
Figure 8.
The green wall air temperature scenario with greenery placed on the northern (a) and eastern (b) wall. Figure by authors.
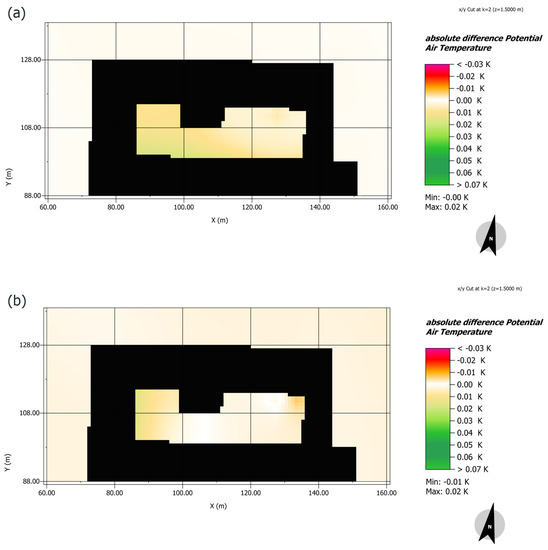
Figure 9.
The green wall air temperature scenario with greenery placed on the southern (a) and western (b) wall. Figure by authors.
Comparing the impact of each location on the lowering of air temperature at 1.5 m height inside the atrium, the most effective model was a green wall placed on an eastern wall with maximum 0.07 K difference as a reference to the “0” scenario. The structure located on the northern site lowered the air temperature by 0.03 K compared with the initial state. In the model of the green wall placed on the western and southern site of the atrium, the maximum air temperature difference was 0.02 K. In both the cases of the eastern and northern wall, the greater difference—in comparison with western and southern plane—was determined not only by the presence of plants but also by the exposure to the sun, as the air temperature in the atrium at this time varies from 303.35 K (30.2 °C) up to 303.65 K (30.5 °C) depending on the locus.
There were also means and medians calculated for each case of planar cut at the height of 1.5 m. They are summarized in the Table 1. In the context of the whole atrium interior, the three cases of the eastern, northern and southern locations had the same median value by 0.01 K. A green wall placed on the western plane had the impact of about 0.00 K regarding tested building inner space.

Table 1.
Means and medians for different cases of placing green wall in the context of the whole atrium interior air temperature.
Regarding the spatial impact of the modelled solution, there was a range of 0.02 K difference in the measured and compared distance from the wall. In the cases of the western and southern walls, the extent is 1 m; in the example of northern site it measured 4 m. The longest distance, 14 m, was noted in the case of eastern wall. The vertical spatial impact has been illustrated in Figure 10 and Figure 11. In both the cases of eastern and western location, the vertical section was made on the north–south axis including the staircase, with the view on the northern part. In the models of the northern and southern setting, the vertical cross cut was made on the east-west axis in the eastern part of the atrium with the view on the western part.
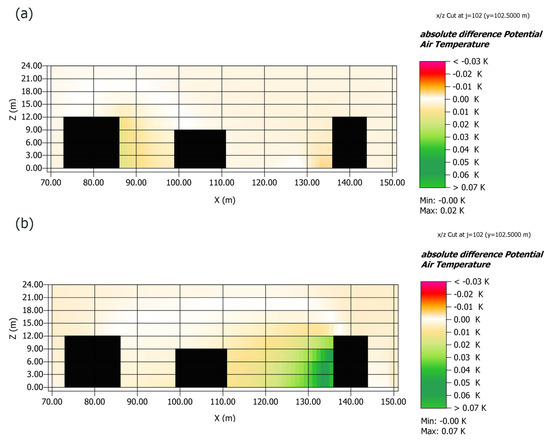
Figure 10.
The difference of air temperature between absolute current state and the reference state of green wall on the western (a) and eastern (b) plane; view in north direction. Figure by authors.
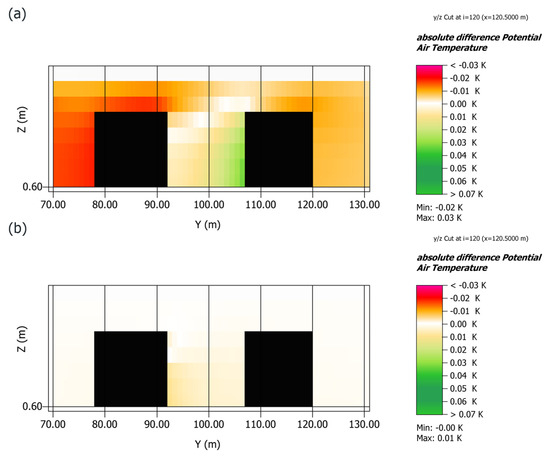
Figure 11.
The difference of air temperature between absolute current state and the reference state of green wall on the southern (a) and northern (b) plane; view in west direction. Figure by authors.
The spatial impact of a green wall on both the western and eastern planes in the vertical dimension was noticeable even in the height of more than 12 m. The greatest value in the western case, 0.02 K, was read at the height of almost 9 m. In the model for the eastern location, the greatest value is 0.07 K. The value was read at the height of 6 m. Between the height of 6 and 9 m, in this section, the difference was 0.06 K. Comparing the models on the opposite southern and northern walls in the place of making the cross cut and analyzing the absolute air temperature difference of 0.01 K, which is the maximum for the southern case in the section, the vertical range was 6 m high in the southern wall case and above 12 m in the northern wall case. The greenery placed on this wall lowered the air temperature in reference to the “0” state by 0.03 K up to 6 m and by 0.02 K up to 12 m.
Regarding the relative humidity factor in the cases of the various green wall scenarios, the greatest difference was read in the model of eastern wall with 1.14% more compared to the current situation. Subsequent results are: (−)0.84% for the northern case, (−)0.56% for the southern case and (−)0.34% for western location (Figure 12, Figure 13). There were also means and medians calculated for each scenario and summarized in Table 2. In all of the cases the relative humidity value increased compared to the initial state. To sum up, the greatest impact on the relative humidity value at the tested time have southern and northern locations. It is most likely related to the surface of vegetation and the proportions of the atrium’s interior. Regarding the factor of placement and the green wall size, the modelled eastern location outcome, with a mean (−)0.31% and median (−)0.24%, was relatively high in comparison with other scenarios.
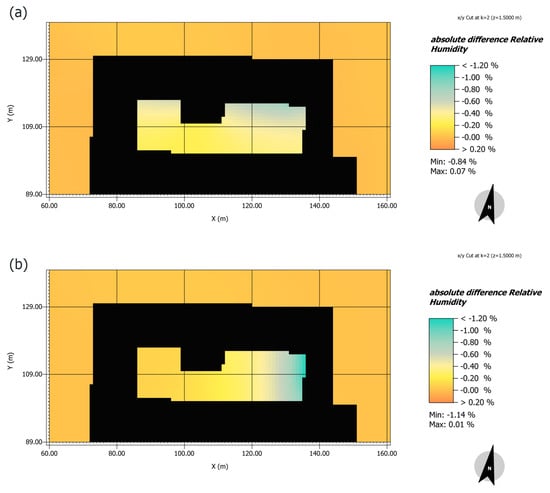
Figure 12.
The comparison of initial state with reference green wall relative humidity at the height of 1.5 m in the scenario with greenery placed on the northern (a) and eastern (b) wall. Figure by authors.
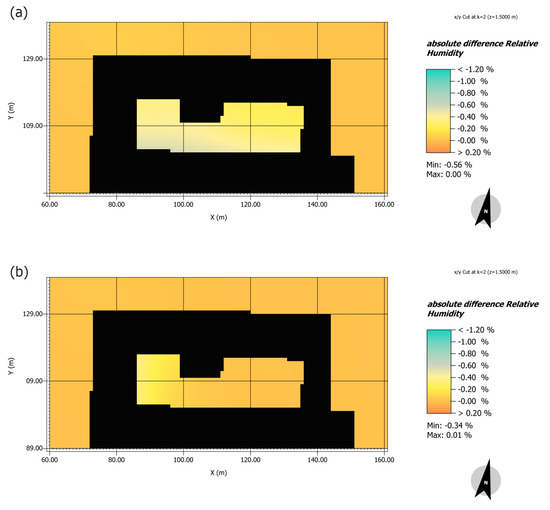
Figure 13.
The comparison of initial state with reference green wall relative humidity at the height of 1.5 m in the scenario with greenery placed on the southern (a) and western (b) wall. Figure by authors.
Table 2.
Means and medians for different cases of placing green wall in the context of the whole atrium’s interior relative humidity. Numbers with minus signs should be read as an increase from the initial state.
3.4. The Green Roof Scenario
The scenario of extensive green roof location at the staircase top was considered. It was assumed that it is covering the whole plane of 12 by 7 m. The staircase roof was placed at the height of 10 m, which makes a difference of about 3 m when comparing with surrounding buildings. There were four planar sections at the heights of 1.5, 4.5, 7.5 and 10.5 m, made to find out if the green roof affected the atrium’s microclimate (Figure 14, Figure 15). Those results, illustrated in Figure 14 and Figure 15, but also a simulation with a vertical cross-section (Figure 16) show that the green roof has no positive effect on the air temperature below its location. A maximum difference of 0.02 K was noted above the vegetated layer at up to 2 m above.
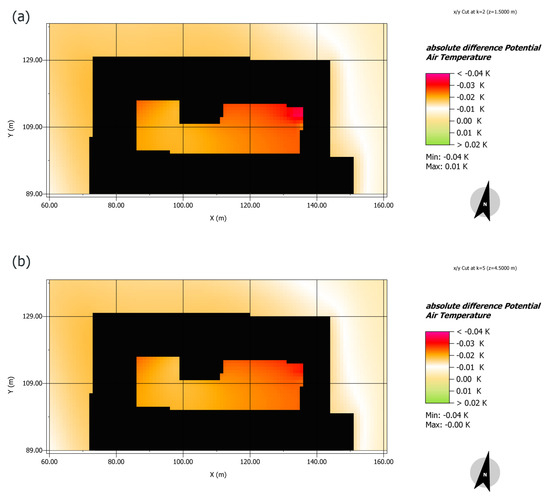
Figure 14.
The initial state and green roof air temperature difference comparison in horizontal cross sections at the height of 1.5 m (a) and 4.5 m (b). Figure by authors.
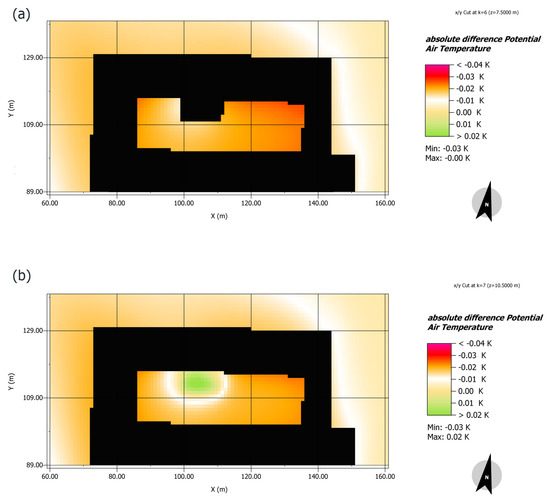
Figure 15.
The initial state and green roof air temperature difference comparison in horizontal cross sections at the height of 7.5 m (a) and 10.5 m (b). Figure by authors.
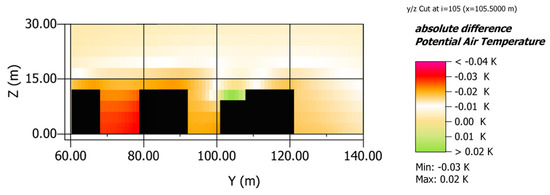
Figure 16.
The initial state and green roof air temperature difference comparison in vertical cross section on the north-south axis with the west side view; the atrium is on the right part of the picture. Figure by authors.
Regarding the green roof scenario from the angle of means and medians calculated for each planar cut at different heights in the context of the whole atrial space, there is a negative impact on the potential air temperature seen in every case (Table 3). Comparing the variables of wind speed and direction of the initial state and reference green roof scenario, there was a change seen that could have impacted the air temperature difference of the case study.
Table 3.
Means and medians for next planar cuts of green roof case in the context of the whole atrium interior air temperature.
As for air temperature factor, also in the case of relative humidity when regarding the whole inner space, there was a negative impact seen at the height of 1.5, 4.5 and 7.5 m (Table 4). Considering each case separately (Figure 17, Figure 18), there was a rise in relative humidity seen sequentially by the value of 0.06%, 0.07% and 0.13%. There was a visible positive impact on humidity in the northwestern part of the atrium in comparison to the initial state. As it can be observed in Figure 18, in the space above the green roof, relative humidity even increased by 0.49%. When calculating a mean and median for the case, there was no significant increase in humidity in the relation to the atrium space (Table 4).
Table 4.
Means and medians for next planar cuts of green roof case in the context of the whole atrium interior relative humidity. Numbers with minus signs should be read as an increase from the initial state.
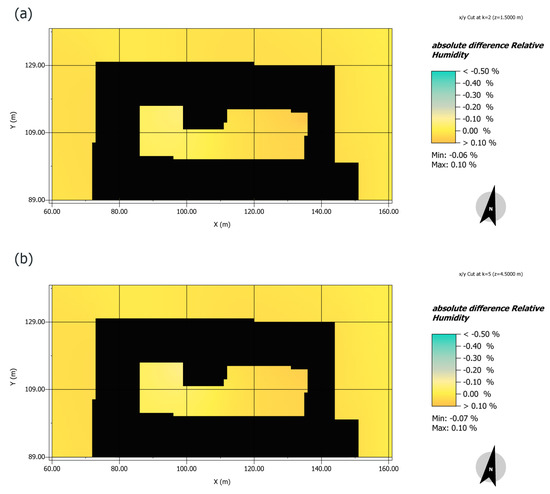
Figure 17.
The comparison of initial state with reference green roof relative humidity in horizontal cross sections at the height of 1.5 m (a) and 4.5 m (b). Figure by authors.
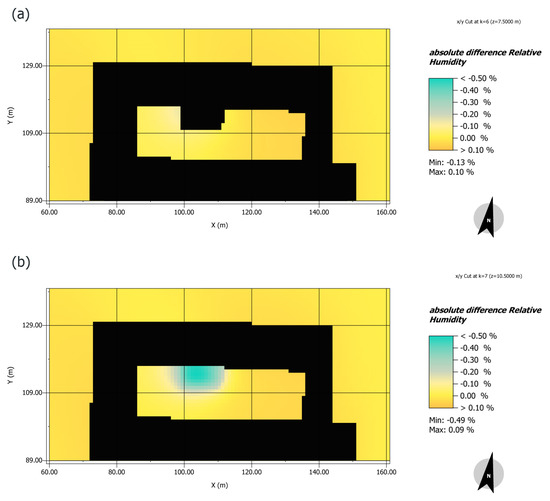
Figure 18.
The comparison of initial state with reference green roof relative humidity in horizontal cross sections at the height of 7.5 m (a) and 10.5 m (b). Figure by authors.
3.5. The Green Roofing Scenario
The last tested solution was to cover the atrium space with roofing made of creepers. It was modelled with software as a 3D plant that has a crown of dense foliage at 12 m. It was assumed that it covered the space to shade it, excluding the room above the staircase and the 1 m gap between the roofing and the building walls, so there is a space for air exchange. Regarding the effect of the tested solution on the potential air temperature at 1.5 m height, there was a difference of impact on the eastern and western side (Figure 19). There was a higher potential seen in the western corner and lower in the eastern of roofing case in comparison with the initial state. The absolute air temperature difference extended from −0.23 K to 0.12 K with a mean of −0.10 K and median of −0.11 K. It means that covering the atrium space in that manner has potentially a negative effect on air temperature at 1.5 m height on a very hot, almost windless day. Taking into consideration the vertical relation of temperature and looking at the cross section (Figure 20), there was a visible diagonal temperature distribution: with higher in a top-western site (0.24 K more in roofing case in comparison with initial state) and lower in a bottom-eastern site (0.13 K less). In that modelled case the creeper roofing seems to be too dense to let the air flow freely in those extreme temperature conditions. There was also an impact on the air above the vegetated roof visible in the vertical section: the potential air temperature was up to 0.10 K lower in comparison to the initial state.
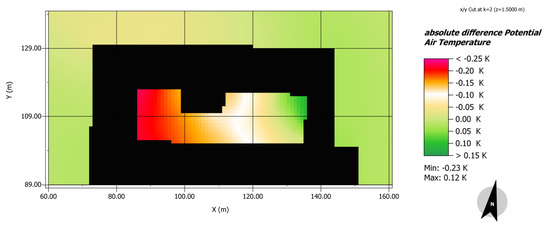
Figure 19.
The initial state and creepers roofing scenario air temperature difference in horizontal cross-sections at the height of 1.5 m (figure by authors).
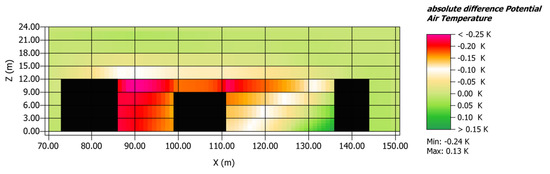
Figure 20.
The initial state and creepers roofing scenario air temperature difference in vertical cross section on the east–west axis from the north side view. Figure by authors.
Considering relative humidity in the comparison of the initial state with reference to the vegetated roofing scenario, there was an increase in humidity recorded up to 0.92% when the climbing plants were applied (Figure 21). There was no negative impact in the modelled case. The minimum increase is 0.07%, referring to the initial state. The mean for the whole interior is (−)0.36% and median was (−)0.31%, so that the impact in numbers was comparable to the northern and southern green walls cases.
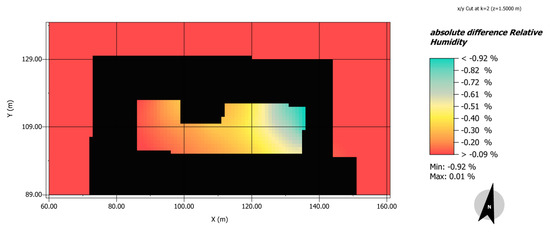
Figure 21.
The comparison of initial state with reference creepers roofing scenario relative humidity at the height of 1.5 m. Figure by authors.
Summarizing the research results, there was a case of an atrium space during the day with the highest recorded air temperature in a given year modelled. The simulation has shown that the maximum surface temperature was achieved at two o’clock, whereas the maximum air temperature was achieved at four o’clock. The initial state with the greatest temperatures was compared with different scenarios of implementing a water source, a green wall on every plane, a green roof on the staircase and green roofing with creepers, which had all been supposed to affect the microclimate of the atrium” A” interior.
The impact on the surface temperature was visible in the models comparison only in the case of water curtain. The spatial range of the impact was perceivable within a radius of over 7 m from the water source with the average 0.45 K of absolute temperature surface difference. The impact on air temperature on the edge radius was 0.4 K lower in the comparison with the initial state, with the average of 0.65 K for the range and 0.28 K for the whole atrium. Comparing the water implementation scenario with different types of greenery, it had the greatest effect on lowering the air temperature within the tested interior. Considering the fountain case median relative humidity in the context of the whole atrium, it was 1% higher than the best result for the wall placed on the eastern plane and was 0.93% higher that the green roofing with creepers.
Regarding the green wall placement cases, the eastern location model had the greatest impact on the atrium microclimate. It lowered air temperature by 0.07 K. In comparison with other locations, the same result of 0.02 K absolute air temperature was noticeable in the longest distance of 14 m. In the vertical dimension, the value of 0.07 K was read to the height of 6 m. Compared to other air temperature-lowering implements, the green roof was not a passable solution for the considered atrium space. The creepers roofing scenario shall be tested in different spatial and thermal layouts.
4. Discussion
Simulations of the impacts of individual natural elements on air temperature and humidity in a semi-open atrium proved that they would be negligible in the extreme heat conditions on an annual basis. Relatively, the best effects can be expected when using a more extensive water curtain (scenario 1) with the additional use of the numerous mist nozzles, which were not taken into account in the calculations. The cooling effect of green walls (scenario 2) was within limits imperceptible to potential users, despite the fact that (due to software limitations) the model was simulated with much greater green facade coverage than would be possible in reality. The impact of the green roof was practically limited to its contour (scenario 3) and would have a negligible impact on potential users staying at ground level, while the dense shading of the atrium from above by roofing covered with creepers (scenario 4) turned out to be a wrong solution, if the possibility of letting hot air out is not taken into account.
Although atrial buildings are a centuries-old tradition in Europe, the need to regulate the microclimate in this type of interiors will have a different character in each climate zone. Moreover, even in the same region, factors such as the surface of the atrium, the height and exposure of the surrounding walls, the material used to finish the facade, the possibility of organising an air flow or the introduction of water mean that solutions appropriate for one place may not work in another. Therefore, research related to the microclimate should be tailored to the specific situation, which shifts the focus from standard solutions to standard procedures and tools [2]. ENVI-met (V4) software seems to be such a tool.
Extended heat waves in Poland have become a relatively new phenomenon and a serious threat to the health of people accustomed to the different weather conditions [3,7,8,9]. For this reason, it was decided that the first tests using the ENVI-met (V4) software are to focus on a) an extreme summer temperature, b) the possibility of providing thermal comfort at this extreme temperature inside the atrium, which has a pre-established architectural concept. The research presented above was carried out as a simulation of the microclimatic effects of introducing a green wall onto the atrium staircase at the Medical University of Lodz. After the planned renovation, the atrium is to serve as a place of relaxation and conference events. The analysis did not take into account the transparent roof above the atrium, because the arrangements regarding its construction and that of the ventilation system of the entire interior were underway. Apart from the southern exposure unfavorable for plants, which appeared in the design concept, three other locations of the green wall and three additional scenarios of introducing the other biophilic elements have been taken into account. The final results are comparable to the low values obtained in referenced model carried out at Kostakii Campus in Arta, which have been positively verified during the field tests [26,27].
According to the outdated but still cited Polish standard PN-78/ B-03421, thermal comfort for people who are at rest or at average physical activity should be estimated in the winter months between 291.15 and 295.15 K (18–22 °C), and between 294.15 and 300.15 K (21–27 °C) during the summer season. The analyses carried out for extreme high temperatures in Lodz proved that the expected thermal comfort cannot be achieved under the initially adopted design assumptions. Plants, however irreplaceable from the point of view of air quality, have apparently a negligible cooling effect. At the same time the conducted tests confirmed the usefulness of the ENVI-met (V4) software as reliable tool, both for the designer and a client, to estimating the correctness of architectural concepts in terms of expected microclimatic effects. At this stage of the study, the authors did not have the option of their own calibration of the software tool with real conditions. However, that is planned at the next stage, after a year of measuring the temperature and humidity of the air in the atrium before its renovation. The new atrium project will be supported by more complex tests using the ENVI-met software and after completion of construction works; our own calibration is planned in the cycle of subsequent annual measurements.
5. Conclusions
The obtained calculations indirectly confirm the results of the research of various authors cited in the introduction. The climatic effect of tested “green solutions”, during heatwaves, is imperceptible to humans in terms of their thermal comfort, as it changes the potential air temperature on average from 0.00 K to 0.01 K, with a maximum median of 0.07 K in the case of green walls, and even shows a negative effect in the case of green roofs and climbing plants, due to the lack of appropriate ventilation. The intuitive solution of the water spray effect on the ambient temperature decrease have been confirmed in the case, but the maximum of a 1.5 K lower temperature could be felt merely locally. Taking into consideration the median of the whole interior, it is only 0.17 K lower, compared with no intervention scenario. Moreover, it shall be considered economically in each implementation, because of high operational costs. Therefore it can be said that the main effects in terms of thermal comfort may be obtained thanks to the appropriate combination of technical solutions, such as controlled air movement, mobile shading elements or water spray devices. Only when tied with the elements of built environment can plants prove to be more efficient, especially if trees are included. However, it should be remembered that the analyses did not take into consideration other ecosystem services, especially their influence on human well-being, views from the windows on particular floors, or improving air quality due to aromas, phytoncides or increased oxygen supply. Research has also shown that, on a single atrium scale, the ENVI-met v. 4.4.4. software leads to far-reaching simplifications for plants and, moreover, when attempting a more synergistic approach, waiting time for results can discourage designers. This indicates the need for further work on improving the software in cooperation with architects, because, on the other hand, the obtained material authenticates or corrects the intuitive approach to climate responsive architecture.
Author Contributions
Both authors have contributed to the research to the same extent. All authors have read and agree to the published version of the manuscript.
Funding
This research received no external funding.
Acknowledgments
The authors are grateful to Wroclaw Centre for Networking and Supercomputing and Wroclaw University of Science and Technology for granting access to the computing infrastructure built in the projects No. POIG.02.03.00-00-028/08 “PLATON - Science Services Platform” and No. POIG.02.03.00-00-110/13 “Deploying high-availability, critical services in Metropolitan Area Networks (MAN-HA)”.
Conflicts of Interest
The authors declare no conflict of interest. The other persons had no role in the design of the study; in the collection, analyses, or interpretation of data; in the writing of the manuscript, or in the decision to publish the results.
References
- European Commission. Communication from the Commission to the European Parliament, the European Council, the Council, the European Economic and Social Committee and the Committee of the Regions. The European Green Deal; COM(2019) 640 final; European Commission: Brussels, Belgium, 2019; pp. 10–11. [Google Scholar]
- Clark, G. RIBA Sustainable Outcomes Guide; Royal Institute of British Architects: London, UK, 2019; Available online: https://www.architecture.com/-/media/GatherContent/Test-resources-page/Additional-Documents/RIBASustainableOutcomesGuide2019pdf.pdf (accessed on 20 December 2019).
- Ministry of Environment. Plany Adaptacji do Zmian Klimatu 44 Miast Polskich. Publikacja Podsumowująca; Ministry of Environment: Warsaw, Poland, 2018; (In Polish). Available online: http://44mpa.pl/wp-content/uploads/2018/12/MPA_NET-PL-20-12.pdf (accessed on 20 December 2019).
- IPCC. Climate Change 2014: Synthesis Report, 1st ed.; Intergovernmental Panel on Climate Change: Geneva, Switzerland, 2015; pp. 36–91. [Google Scholar]
- Wibig, J.; Jakusik, E. (Eds.) Climate and Oceanographic Conditions in Poland and on the Southern Baltic—Expected Changes and Guidelines for Developing Adaptation Strategies in the National Economy, 1st ed.; Polish Institute of Meteorology and Water Management—National Research Institute: Warsaw, Poland, 2012; pp. 7–133. (In Polish) [Google Scholar]
- Rice, C. Interior Urbanism. Architecture, John Portman and Downtown America; Bloomsbury Academic: London, UK; Oxford, UK; New York, NY, USA; New Delhi, India; Sydney, Australia, 2016; pp. 13–20. [Google Scholar]
- Gabriel KM, A.; Endlicher, W.R. Urban and rural mortality rates during heat waves in Berlin and Brandenburg, Germany. Environ. Pollut. 2011, 159, 2044–2050. [Google Scholar] [CrossRef] [PubMed]
- Heaviside, C.; Vardoulakis, S.; Cai, X.M. Attribution of mortality to the urban heat island during heatwaves in the West Midlands, UK. Environ. Health 2016, 27, 49–59. [Google Scholar] [CrossRef] [PubMed]
- Tan, J.; Zheng, Y.; Tang, X.; Guo, C.; Li, L.; Song, G.; Zhen, X.; Yuan, D.; Kalkstein, A.J.; Li, F.; et al. The urban heat island and its impact on heat waves and human health in Shanghai. Int. J. Biometeorol. 2009, 54, 75–84. [Google Scholar] [CrossRef] [PubMed]
- Stadt Wien. Energieplanung. Available online: https://www.wien.gv.at/stadtentwicklung/energie/pdf/hitzekarte-methode.pdf (accessed on 20 December 2019).
- Stadt Wien “Coole Strassen”. Available online: https://www.wien.gv.at/stadtentwicklung/energie/pdf/coolestrasse-zusammenfassung.pdf (accessed on 20 December 2019).
- Gusson, C.S.; Duarte, D.H.S. Effects of Built Density and Urban Morphology on Urban Microclimate—Calibration of the Model ENVI-met V4 for the Subtropical Sao Paulo, Brazil. Procedia Eng. 2016, 169, 2–10. [Google Scholar] [CrossRef]
- Yang, X.; Zhao, L.; Bruse, M.; Meng, Q. Evaluation of a microclimate model for predicting the thermal behavior of different ground surfaces. Build. Environ. 2013, 60, 93–104. [Google Scholar] [CrossRef]
- Rutkowski, R.; Wojciechowski, L. [ecosistema urbano]. Theor.Meltdown 2009, 79, 54–55. [Google Scholar] [CrossRef]
- Breathe Earth Collective, Die Geschichte: Breathe. Austria Österreichischer. Expo-Pavillon in Mailand 2015. Airship.01 A Hybrid Prototype. 2019, pp. 12–15. Available online: https://www.austriatourism.com/fileadmin/user_upload/Media_Library/Downloads/Presse/Broschuere_Airship.pdf (accessed on 20 December 2019).
- Gritch, T.; Eason, B. Atria Systems. Whole Building Design Guides. Available online: www.wbdg.org/guides-specifications/building-envelope-design-guide/atria-systems (accessed on 20 December 2019).
- Bowler, D.E.; Buyung-Ali, L.; Knight, T.M.; Pullin, A.S. Urban greening to cool towns and cities: A systematic review of the empirical evidence. Landsc. Urban. Plan. 2010, 97, 147–155. [Google Scholar] [CrossRef]
- Francis, L.F.M.; Bergen Jensen, M. Benefits of green roofs: A systematic review of the evidence for three ecosystem services. Urban. Forestry Urban. Green. 2017, 28, 167–176. [Google Scholar] [CrossRef]
- Medl, A.; Stangl, R.; Florineth, F. Vertical greening systems—A review on recent technologies and research advancement. Build. Environ. 2017, 125, 227–239. [Google Scholar] [CrossRef]
- Perini, K.; Ottelé, M.; Fraaij, A.L.A.; Haas, E.M.; Raiteri, R. Vertical greening systems and the effect on air flow and temperature on the building envelope. Build. Environ. 2011, 46, 2287–2294. [Google Scholar] [CrossRef]
- Razzaghmanesh, M.; Razzaghmanesh, M. Thermal performance investigation of a living wall in a dry climate of Australia. Build. Environ. 2017, 112, 45–62. [Google Scholar] [CrossRef]
- Wong, N.H.; Tan, A.Y.K.; Chen, Y.; Sekar, K.; Tan, P.Y.; Chan, D.; Chiang, K.; Wong, N.C. Thermal evaluation of vertical greenery systems for building walls. Build. Environ. 2010, 45, 663–672. [Google Scholar] [CrossRef]
- Cuce, E. Thermal regulation impact of green walls: An experimental and numerical investigation. Appl. Energy 2017, 194, 247–254. [Google Scholar] [CrossRef]
- Skarżyński, D.; Pęczkowski, G.; Pływaczyk, A.; Szawernoga, K. Thermal Impacts of Vertical Greenery Systems in the Conditions of Lower Silesia. Ann. Set Environ. Protect. 2018, 20, 989–1006. [Google Scholar]
- Ulpiani, G. Water mist spray for outdoor cooling: A systematic review of technologies, methods and impacts. Appl. Energy 2019, 254. [Google Scholar] [CrossRef]
- Kittas, C.; Antoniadis, D.; Katsoulas, N.; Tsirogiannis, I.; Varras G, E.; Bartzanas, T. Measurements and Simulation of Microclimatic Effects of a Horizontal Hydroponic Pergola. In Proceedings of the 7th International Conference on Information and Communication Technologies in Agriculture, Food and Environment, Kavala, Greece, 17–20 September 2015; pp. 255–262. [Google Scholar]
- Katsoulas, N.; Antoniadis, D.; Tsirogiannis, I.; Labraki, E.; Bartzanas, T.; Kittas, C. Microclimatic effects of planted hydroponic structures in urban environment: Measurements and simulations. Int. J. Biometeorol. 2017, 61, 943–956. [Google Scholar] [CrossRef] [PubMed]
- International Living Future Institute. Biophilic Design Exploration Guidebook. Living Building ChallengeSM 3.1. A Visionary Path to a Regenerative Future; International Living Future Institute: Seattle, WA, USA, 2017; Available online: https://living-future.org/wp-content/uploads/2017/12/Biophilic-Design-Exploration-Guidebook.pdf (accessed on 30 October 2019).
- Developed IMGW Data. Available online: https://meteomodel.pl/dane/srednie-miesieczne/ (accessed on 30 November 2019).
© 2020 by the authors. Licensee MDPI, Basel, Switzerland. This article is an open access article distributed under the terms and conditions of the Creative Commons Attribution (CC BY) license (http://creativecommons.org/licenses/by/4.0/).