Indoor and Outdoor Concentrations of Particulate Matter in an Airport Terminal Building: A Pilot Study at Soekarno-Hatta International Airport in Indonesia


Abstract
1. Introduction
2. Materials and Methods
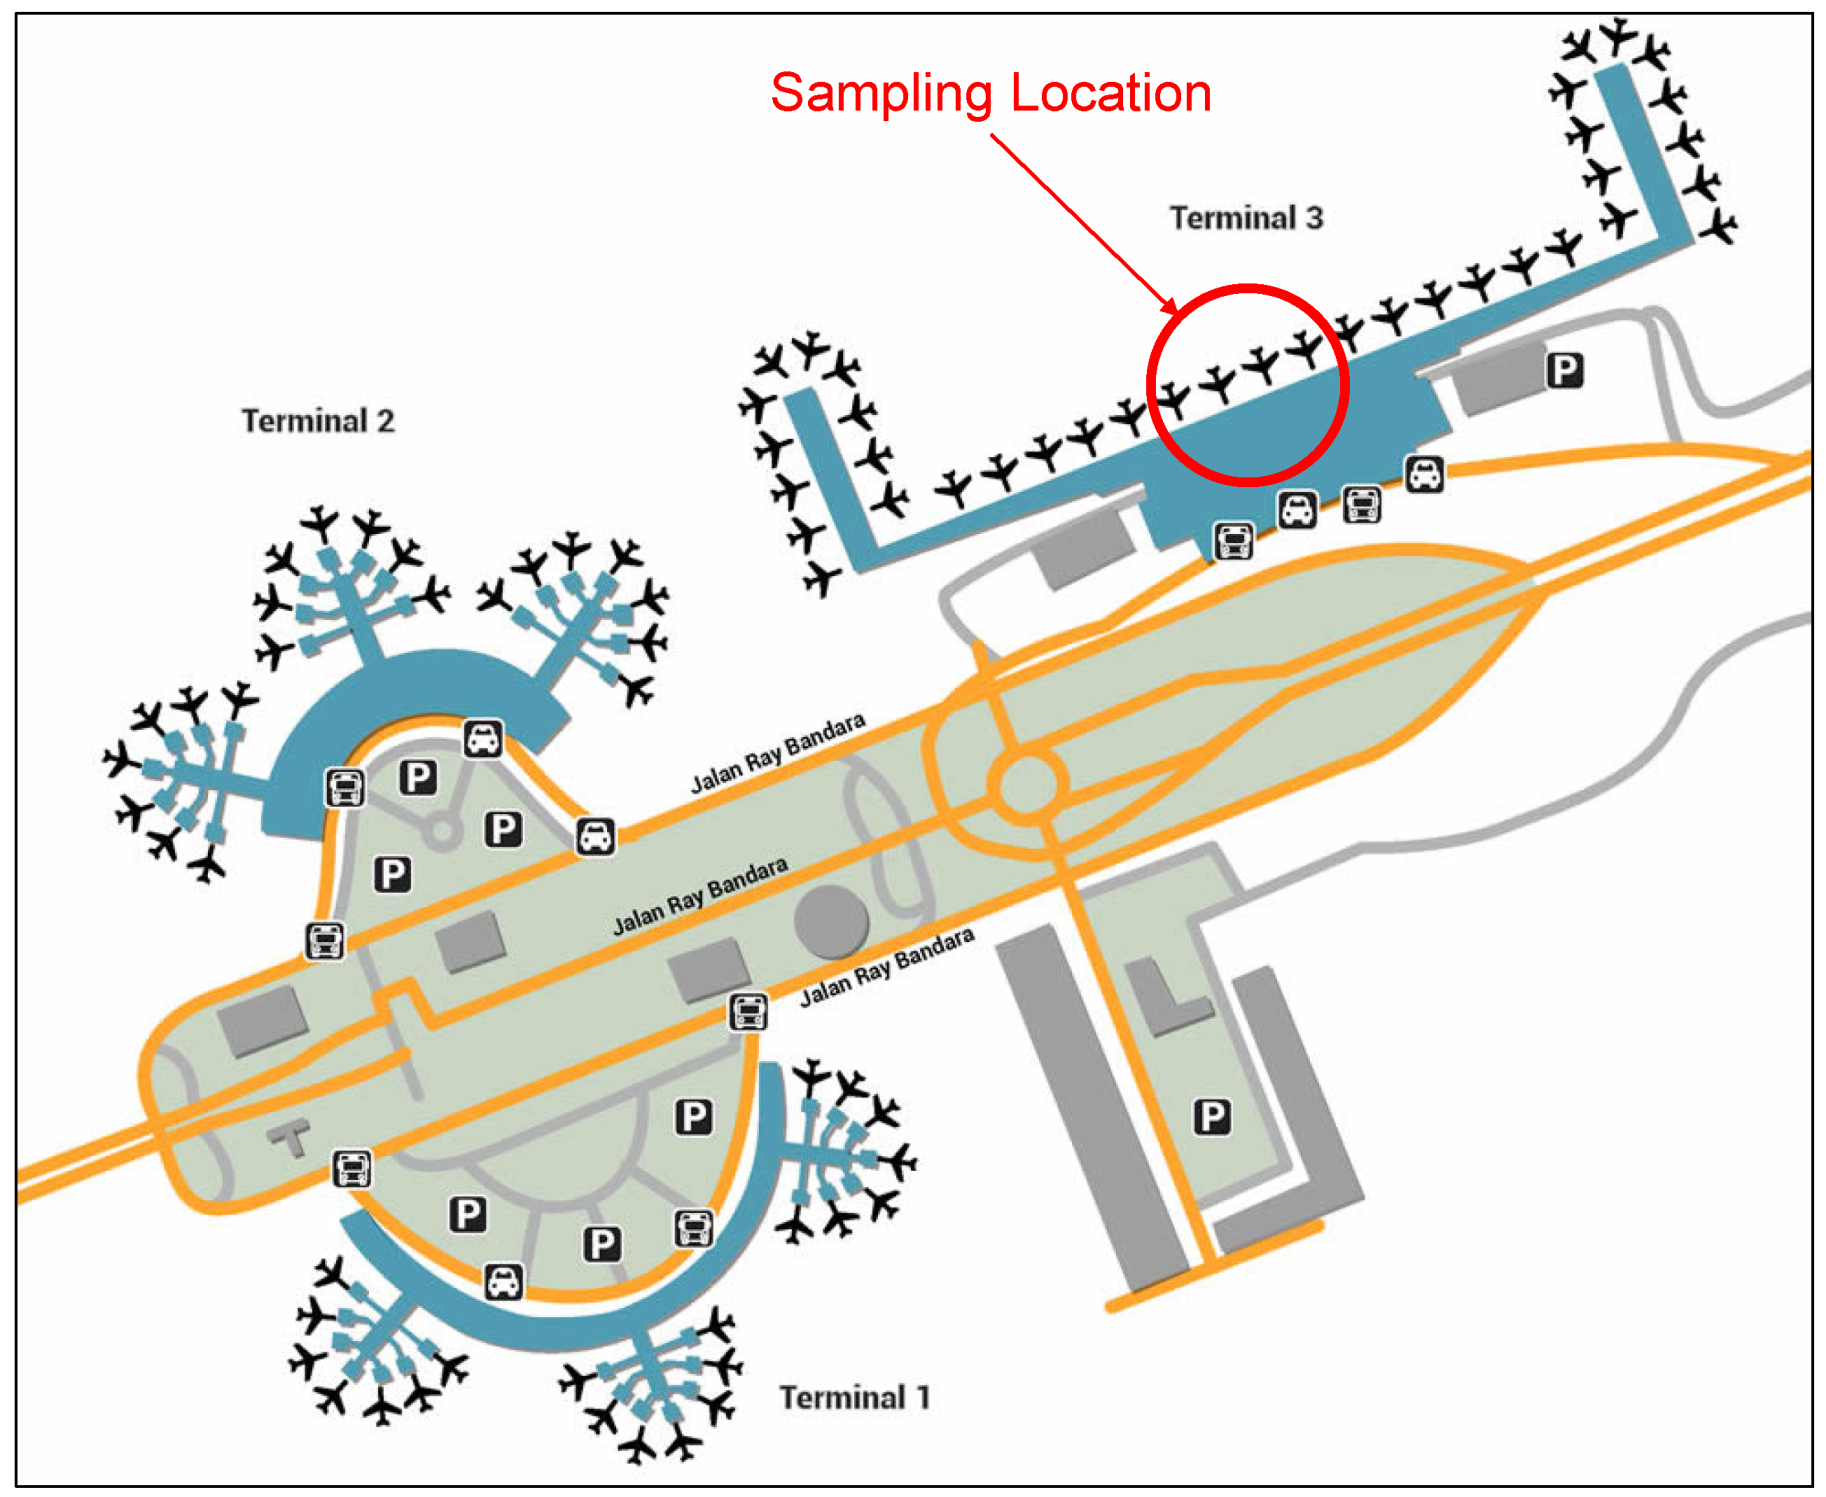
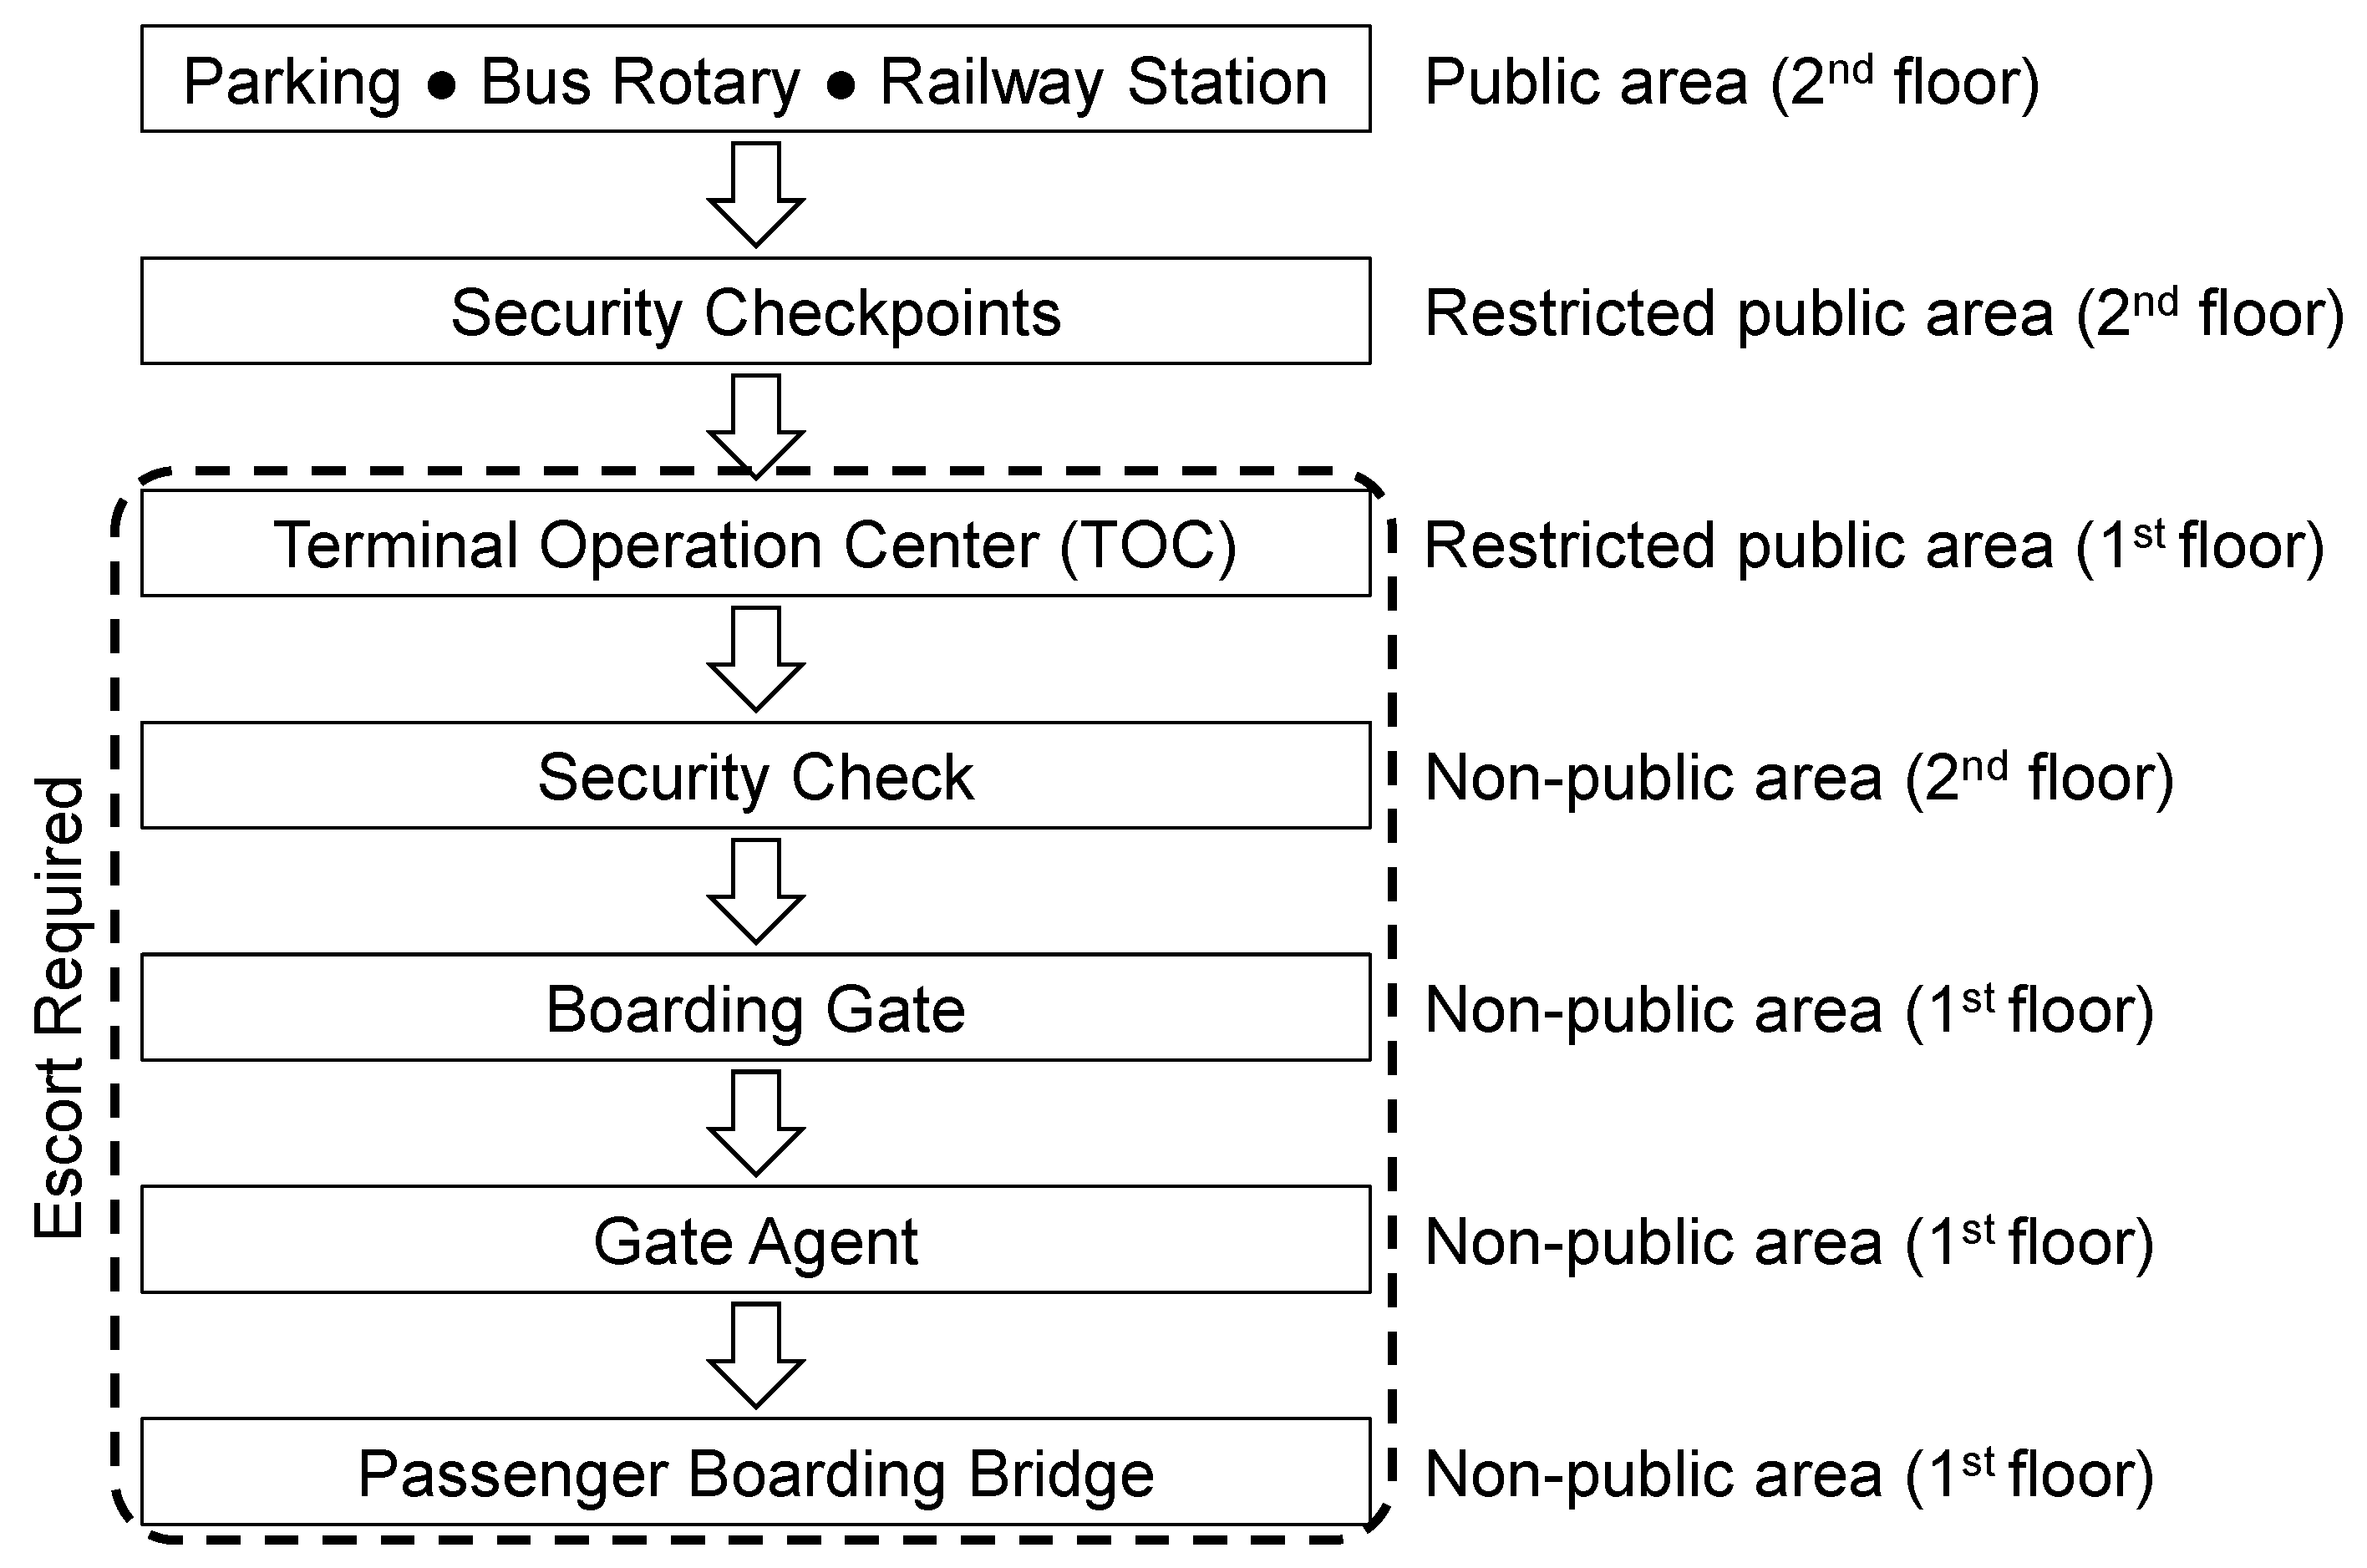
2.1. Study Site
2.2. Data Collection
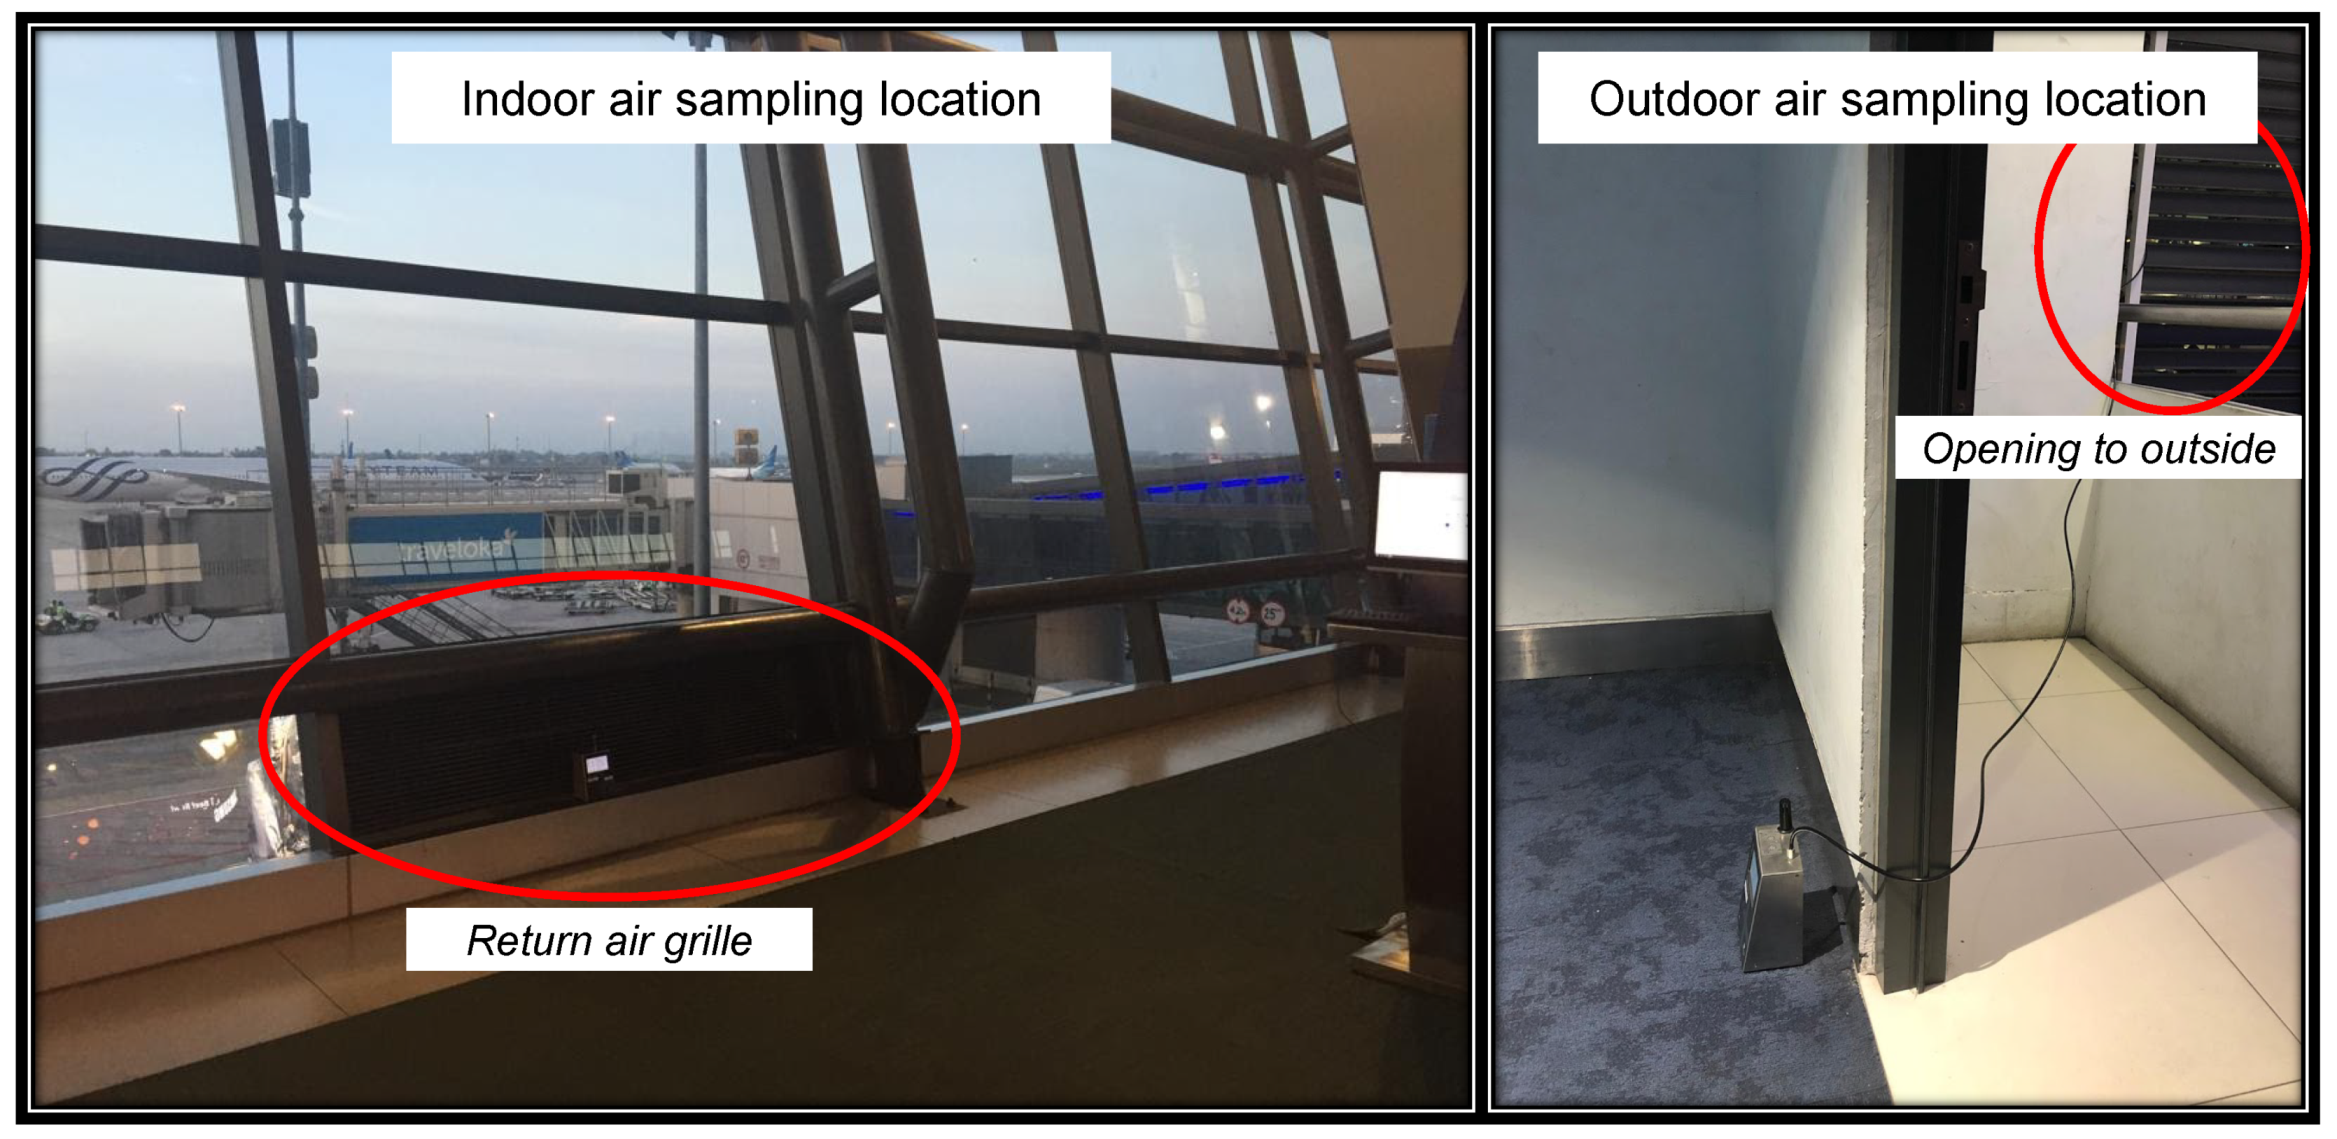
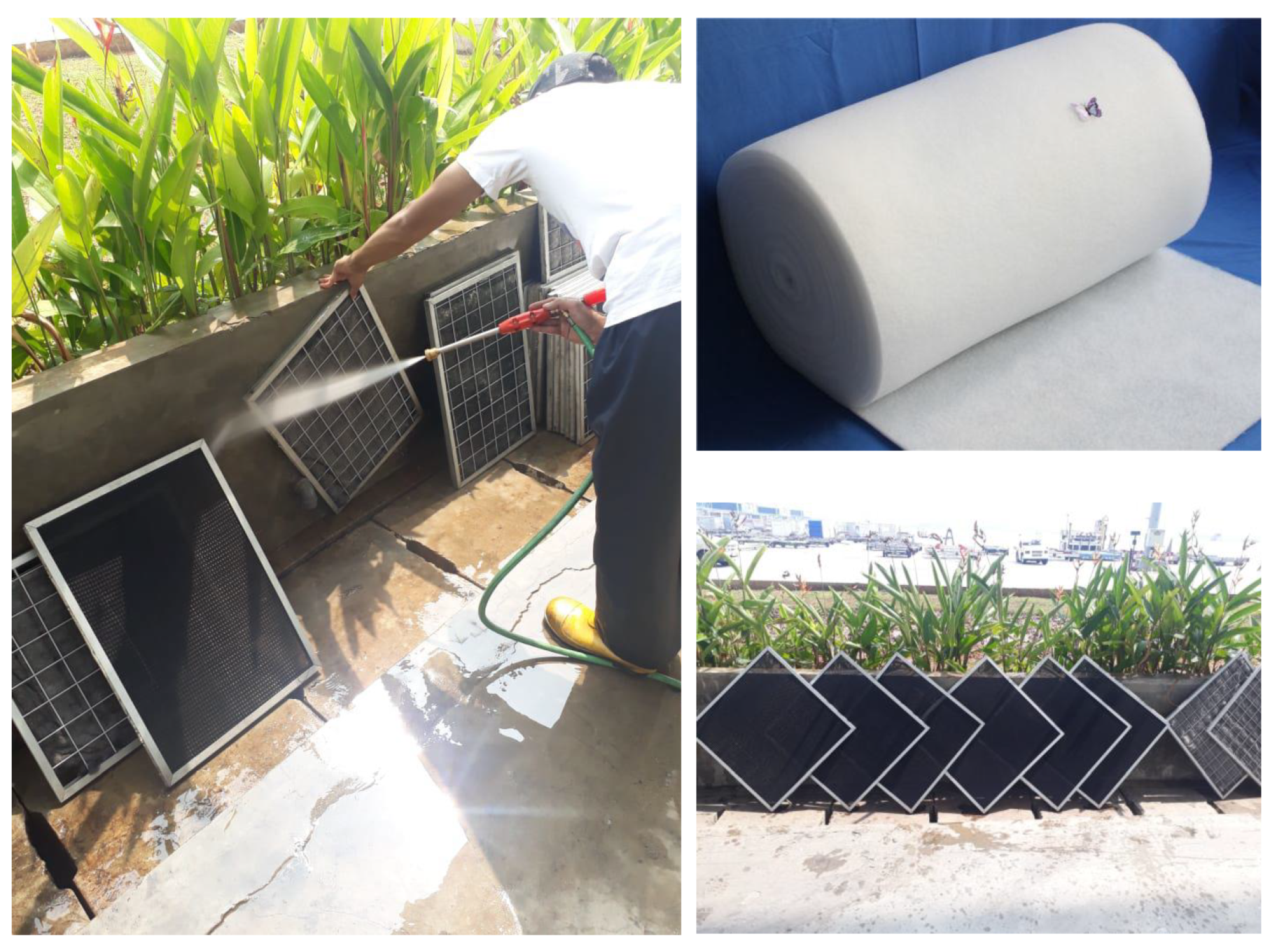
2.2.1. Primary Data
2.2.2. Secondary Data
2.3. Data Analysis
2.3.1. Particle Mass Concentration Estimate
2.3.2. Statistical Methods
3. Results
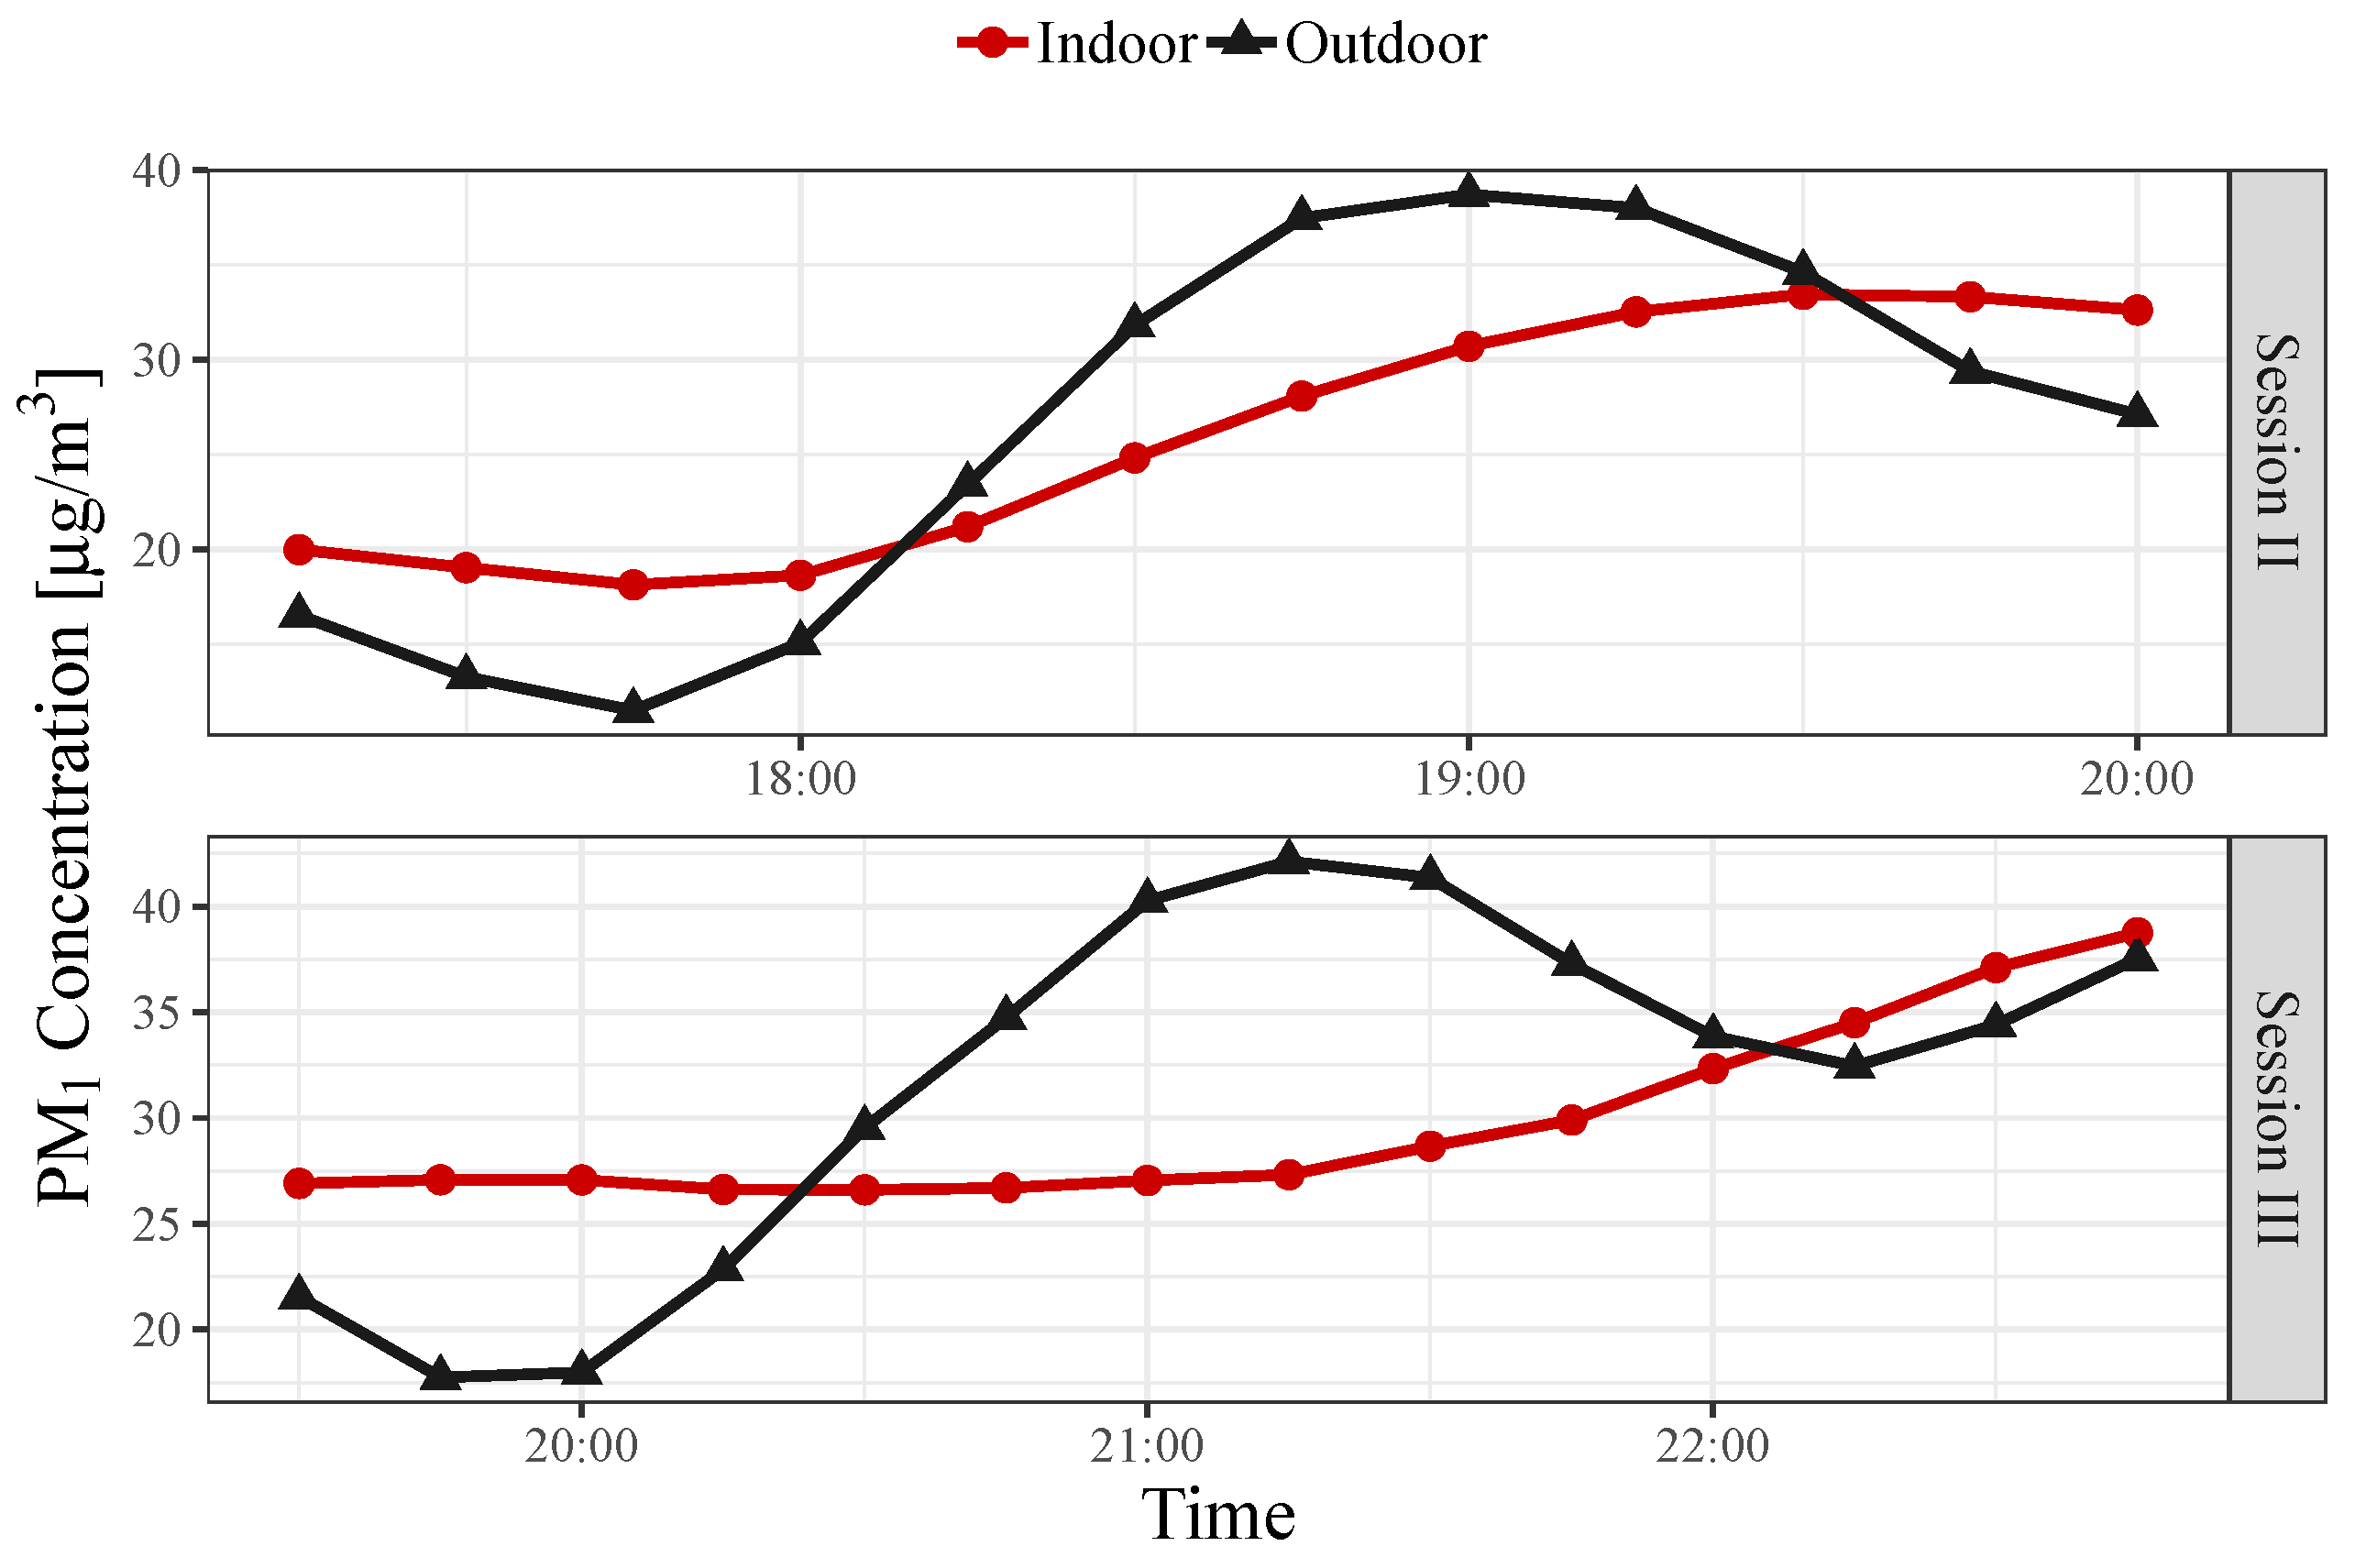
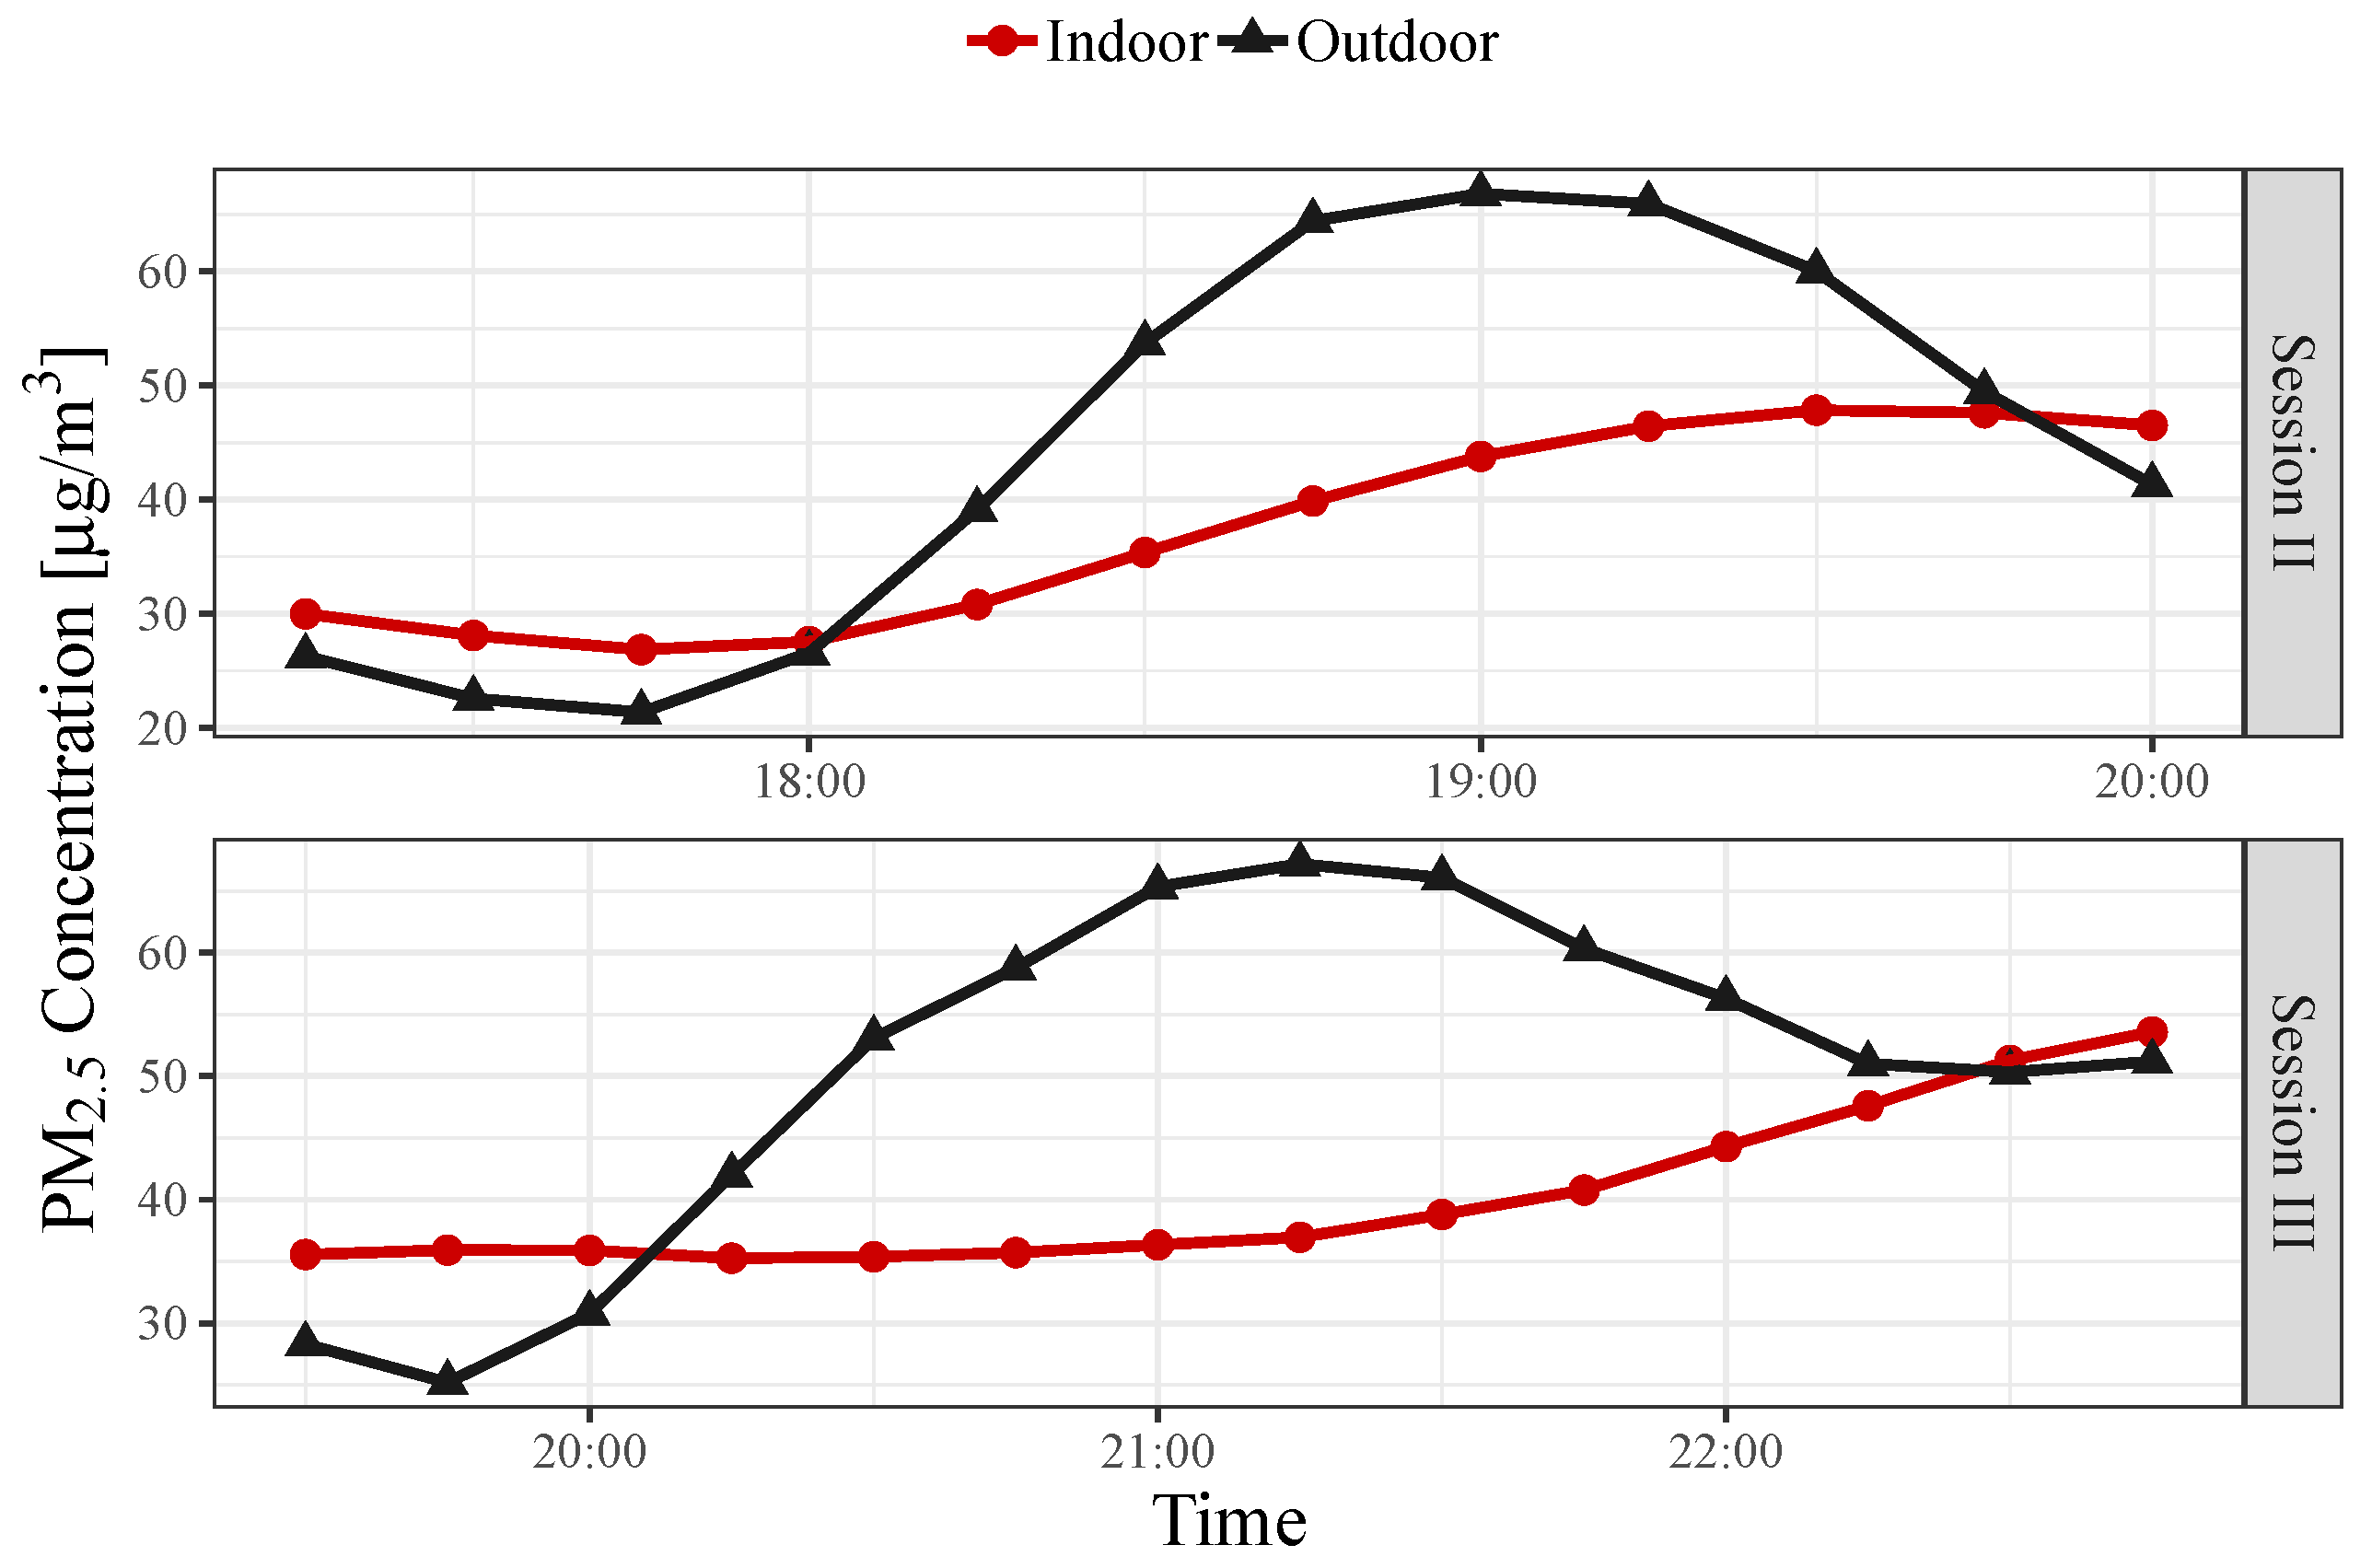
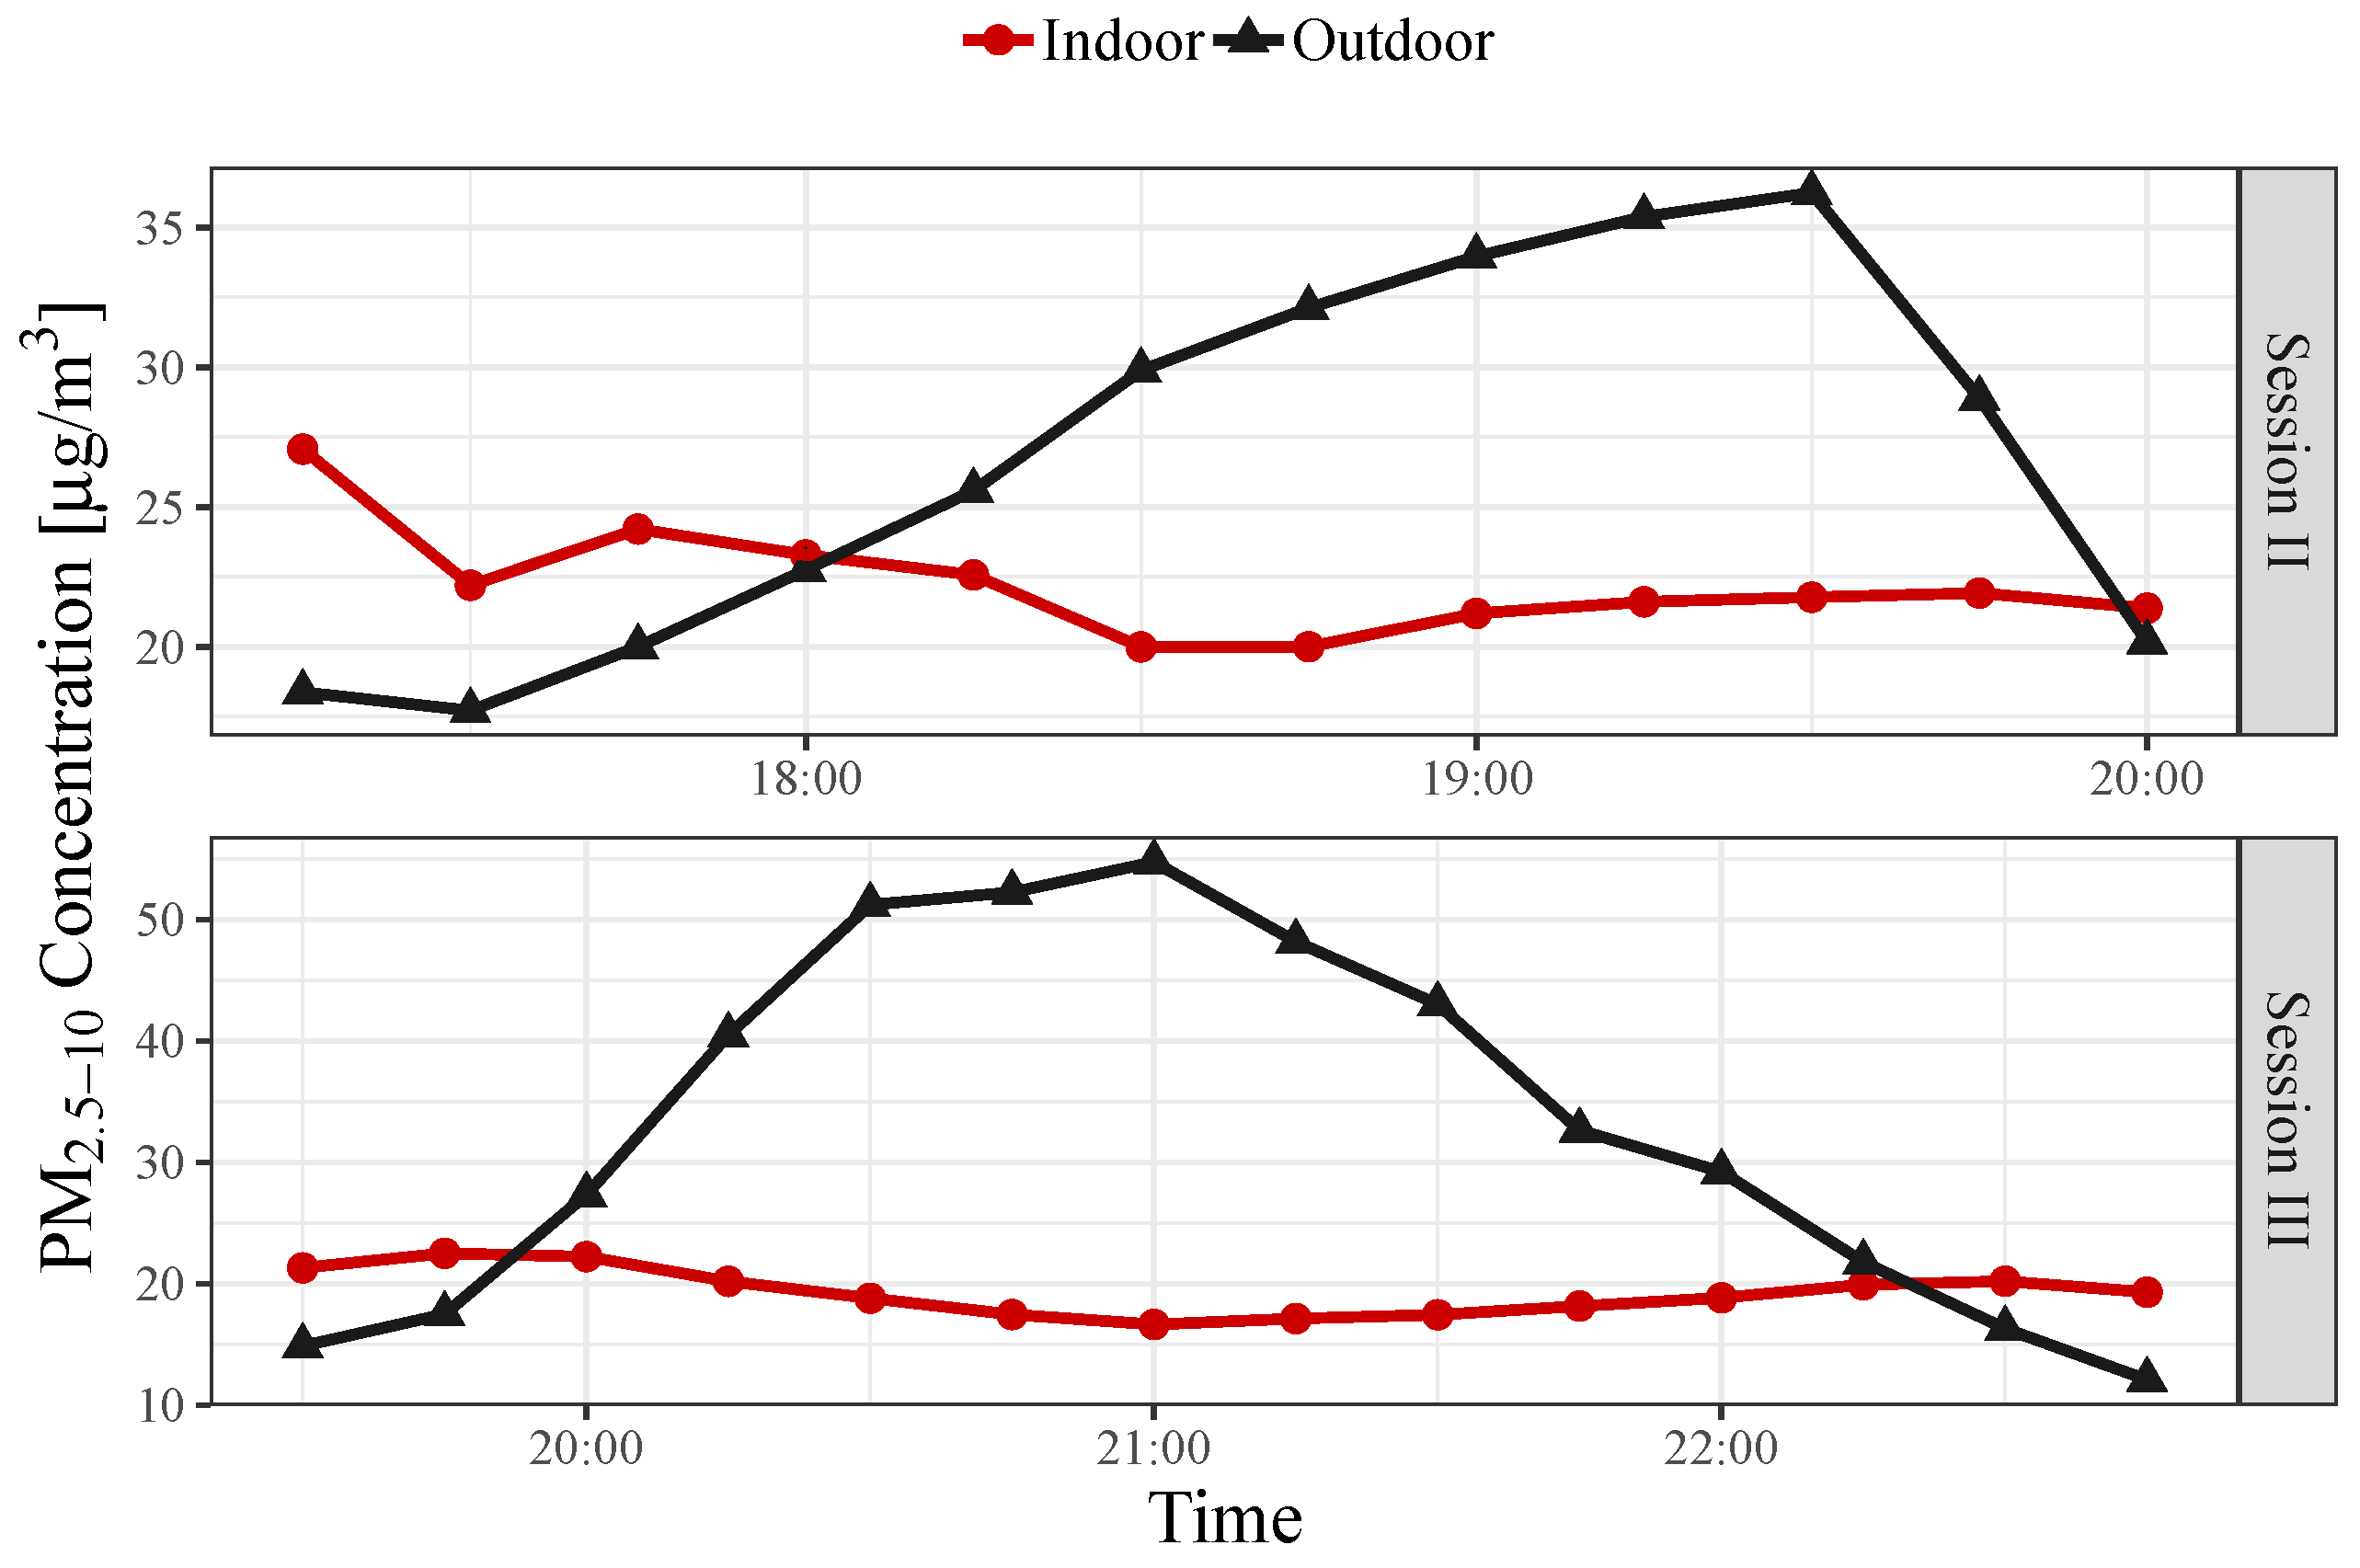
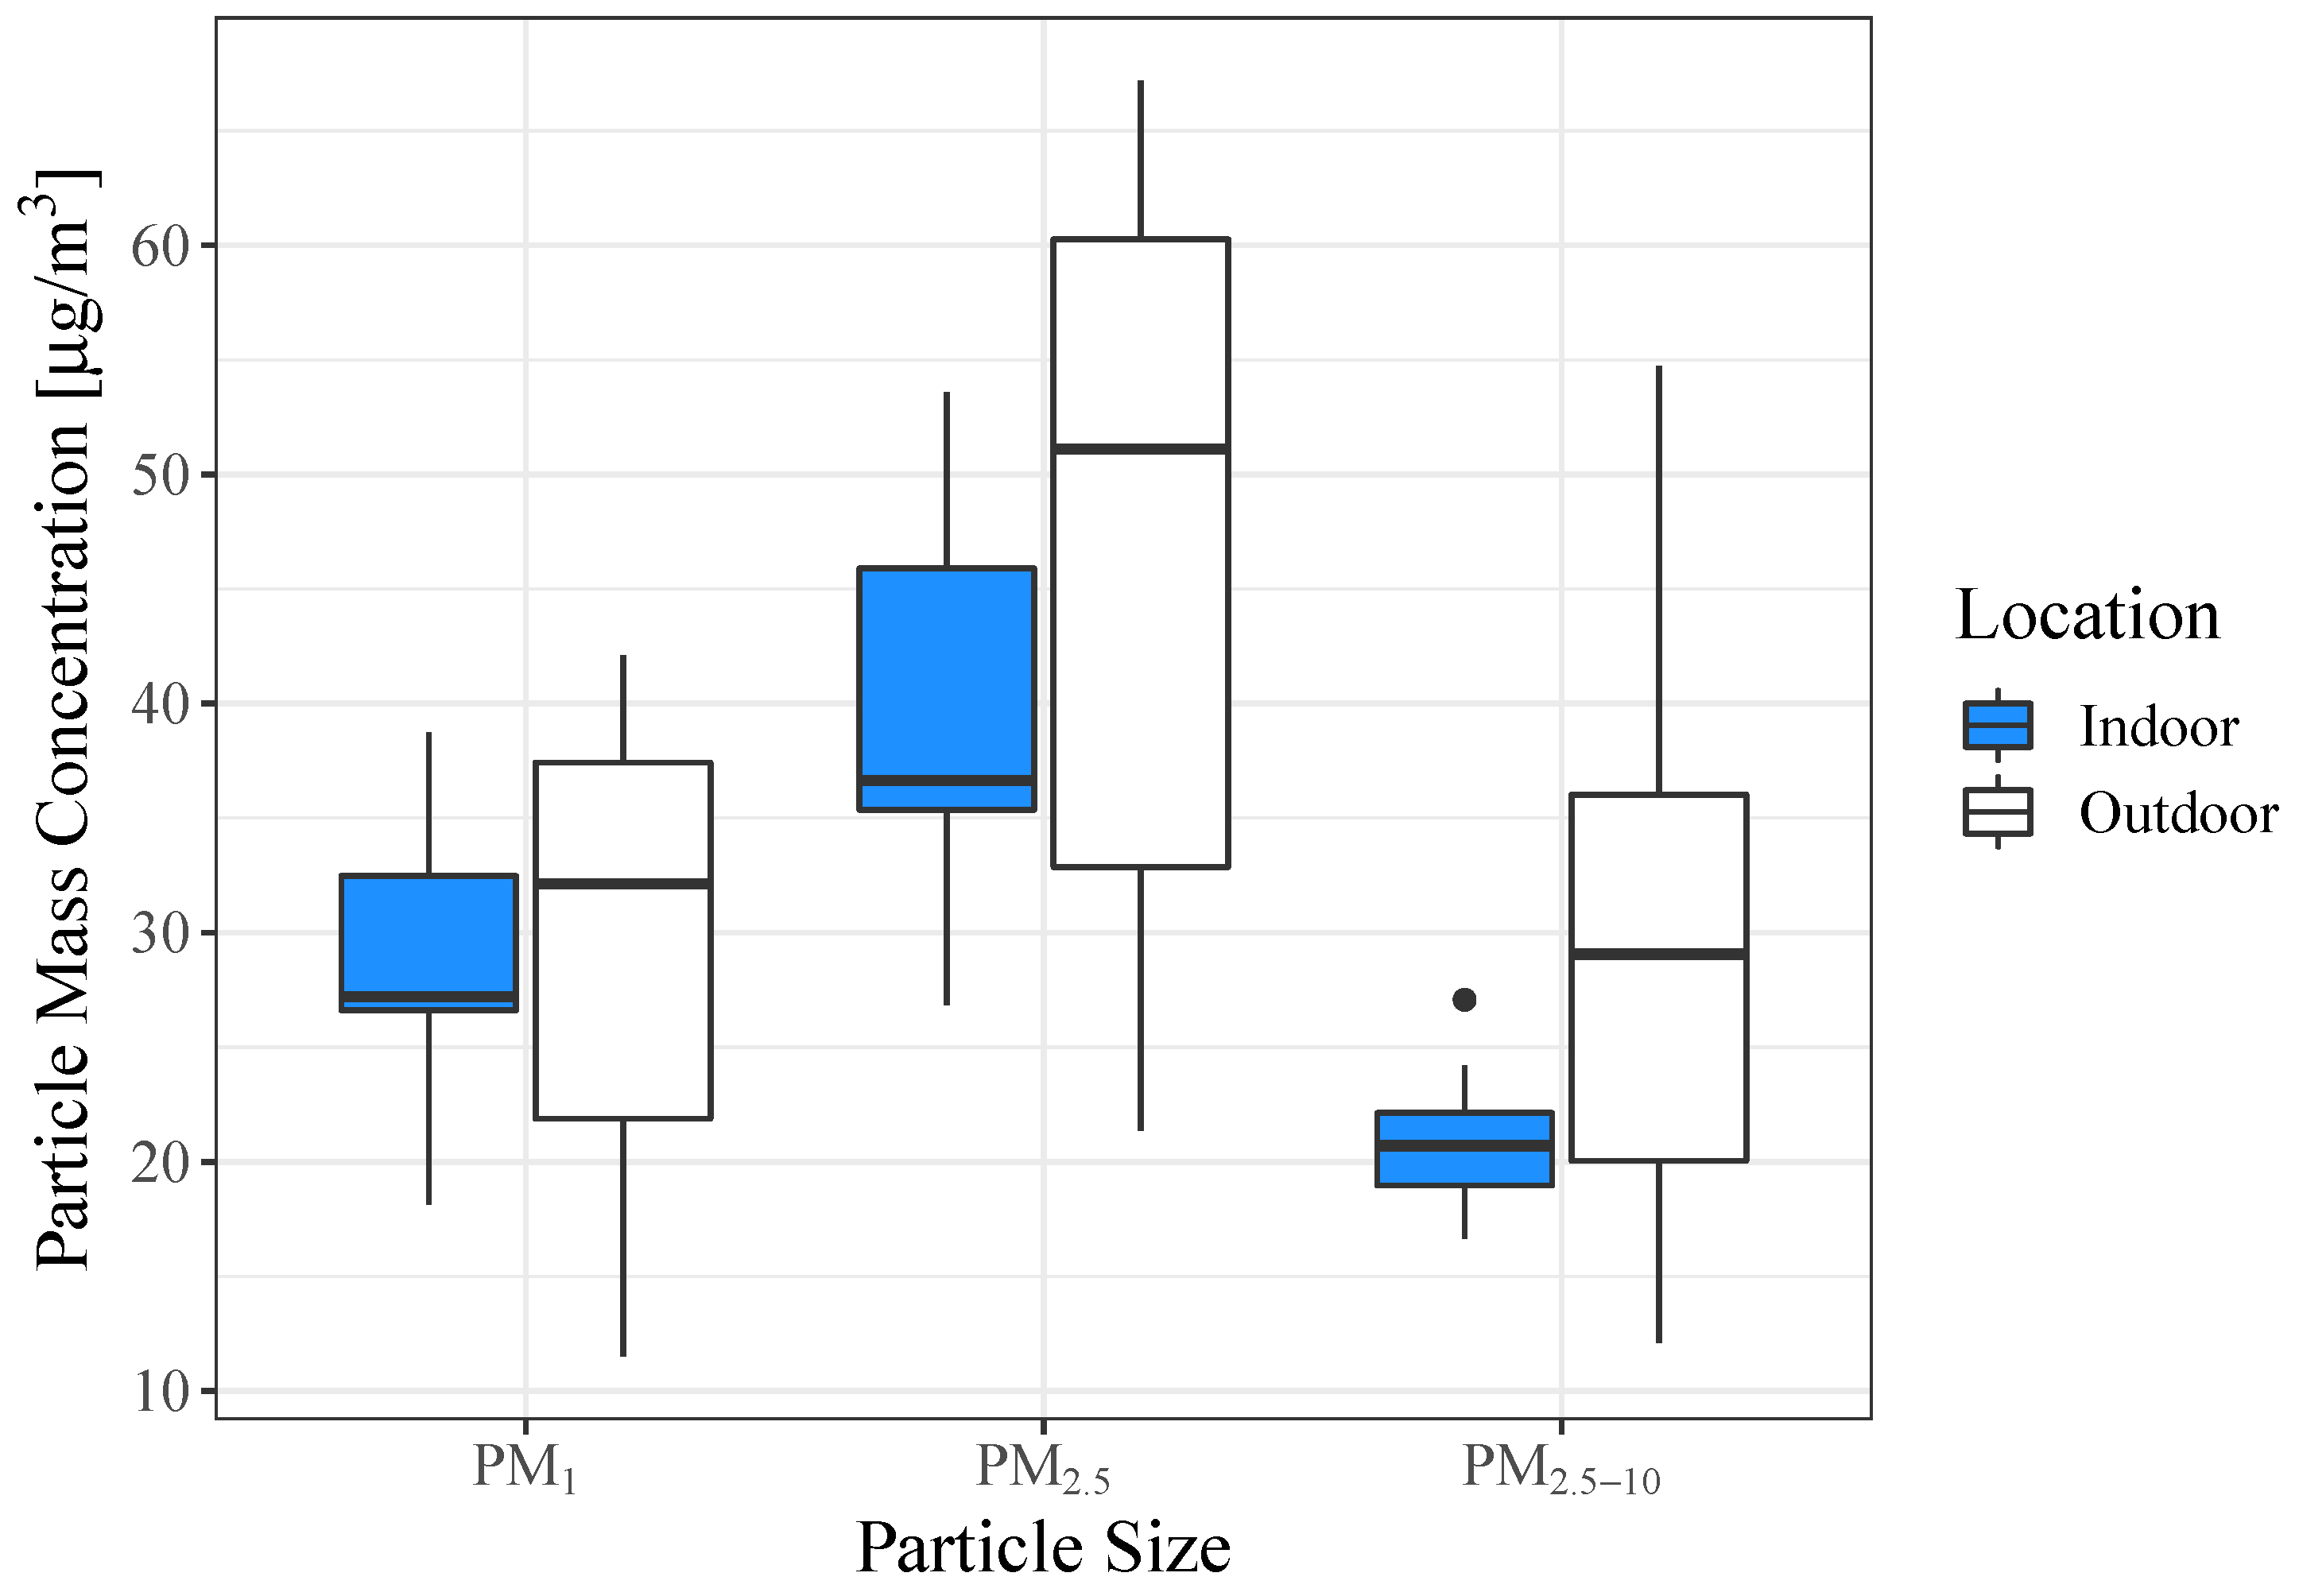
3.1. Descriptive Statistics
3.2. I/O Ratio
3.3. ANCOVA
4. Discussion
Author Contributions
Funding
Acknowledgments
Conflicts of Interest
References
- Kazda, A.; Caves, R.E. Airport Design and Operation; Elsevier Ltd.: Amsterdam, The Netherlands, 2007. [Google Scholar]
- Helmis, C.G.; Assimakopoulos, V.D.; Flocas, H.A.; Stathopoulou, O.I.; Sgouros, G.; Hatzaki, M. Indoor air quality assessment in the air traffic control tower of the Athens Airport, Greece. Environ. Monit. Assess. 2008, 148, 47–60. [Google Scholar] [CrossRef] [PubMed]
- Mokalled, T.; Gérard, J.A.; Abboud, M.; Liaud, C.; Nassreddine, R.; Calvé, S.L. An assessment of indoor air quality in the maintenance room at Beirut-Rafic Hariri International Airport. Atmos. Pollut. Res. 2018. [Google Scholar] [CrossRef]
- Tsakas, M.P.; Siskos, P.A. Indoor Air Quality in the Control Tower of Athens International Airport, Greece. Indoor Built Environ. 2010, 20, 284–289. [Google Scholar] [CrossRef]
- Lee, K.; Hahn, E.J.; Robertson, H.E.; Whitten, L.; Jones, L.K.; Zahn, B. Air quality in and around airport enclosed smoking rooms. Nicotine Tob. Res. 2010, 12, 665–668. [Google Scholar] [CrossRef] [PubMed]
- Kungskulniti, N.; Charoenca, N.; Peesing, J.; Trangwatana, S.; Hamann, S.; Pitayarangsarit, S.; Chitanondh, H. Assessment of secondhand smoke in international airports in Thailand, 2013. Tob. Control 2014, 24, 532–535. [Google Scholar] [CrossRef]
- Hsu, H.H.; Adamkiewicz, G.; Houseman, E.A.; Vallarino, J.; Melly, S.J.; Wayson, R.L.; Spengler, J.D.; Levy, J.I. The relationship between aviation activities and ultrafine particulate matter concentrations near a mid-sized airport. Atmos. Environ. 2012, 50, 328–337. [Google Scholar] [CrossRef]
- Hsu, H.H.; Adamkiewicz, G.; Houseman, E.A.; Zarubiak, D.; Spengler, J.D.; Levy, J.I. Contributions of aircraft arrivals and departures to ultrafine particle counts near Los Angeles International Airport. Sci. Total Environ. 2013, 444, 347–355. [Google Scholar] [CrossRef]
- Stacey, B. Measurement of ultrafine particles at airports: A review. Atmos. Environ. 2019, 198, 463–477. [Google Scholar] [CrossRef]
- Hudda, N.; Gould, T.; Hartin, K.; Larson, T.V.; Fruin, S.A. Emissions from an International Airport Increase Particle Number Concentrations 4-fold at 10 km Downwind. Environ. Sci. Technol. 2014, 48, 6628–6635. [Google Scholar] [CrossRef]
- Masiol, M.; Harrison, R.M.; Vu, T.V.; Beddows, D.C.S. Sources of sub-micrometre particles near a major international airport. Atmos. Chem. Phys. 2017, 17, 12379–12403. [Google Scholar] [CrossRef]
- Masiol, M.; Vu, T.V.; Beddows, D.C.S.; Harrison, R.M. Source apportionment of wide range particle size spectra and black carbon collected at the airport of Venice (Italy). Atmos. Environ. 2016, 139, 56–74. [Google Scholar] [CrossRef]
- Fanning, E.; Yu, R.C.; Lu, R.; Froines, J. Monitoring and Modeling of Ultrafine Particles and Black Carbon at the Los Angeles International Airport; Resreport 04-325; Unviersity of California: Los Angeles, CA, USA, 2007; Available online: http://citeseerx.ist.psu.edu/viewdoc/download?doi=10.1.1.483.5919&rep=rep1&type=pdf (accessed on 5 March 2019).
- Qian, J.; Peccia, J.; Ferro, A.R. Walking-induced particle resuspension in indoor environments. Atmos. Environ. 2014, 89, 464–481. [Google Scholar] [CrossRef]
- Tian, Y.; Sul, K.; Qian, J.; Mondal, S.; Ferro, A.R. A comparative study of walking-induced dust resuspension using a consistent test mechanism. Indoor Air 2014, 24, 592–603. [Google Scholar] [CrossRef] [PubMed]
- Johnson, G.R.; Mazaheri, M.; Ristovski, Z.D.; Morawska, L. A Plume Capture Technique for the Remote Characterization of Aircraft Engine Emissions. Environ. Sci. Technol. 2008, 42, 4850–4856. [Google Scholar] [CrossRef]
- Tunnicliffe, W.S.; O’Hickey, S.P.; Fletcher, T.J.; Miles, J.F.; Burge, P.S.; Ayres, J.G. Pulmonary function and respiratory symptoms in a population of airport workers. Occup. Environ. Med. 1999, 56, 118–123. [Google Scholar] [CrossRef]
- Yang, C.Y.; Wu, T.N.; Wu, J.J.; Ho, C.K.; Chang, P.Y. Adverse Respiratory and Irritant Health Effects in Airport Workers in Taiwan. J. Toxicol. Environ. Heal. Part A 2003, 66, 799–806. [Google Scholar] [CrossRef]
- Møller, K.L.; Thygesen, L.C.; Schipperijn, J.; Loft, S.; Bonde, J.P.; Mikkelsen, S.; Brauer, C. Occupational Exposure to Ultrafine Particles among Airport Employees— Combining Personal Monitoring and Global Positioning System. PLoS ONE 2014, 9, e106671. [Google Scholar] [CrossRef]
- Zanni, S.; Lalli, F.; Foschi, E.; Bonoli, A.; Mantecchini, L. Indoor Air Quality Real-Time Monitoring in Airport Terminal Areas: An Opportunity for Sustainable Management of Micro-Climatic Parameters. Sensors 2018, 18, 3798. [Google Scholar] [CrossRef]
- Ren, J.; Cao, X.; Liu, J. Impact of atmospheric particulate matter pollutants to IAQ of airport terminal buildings: A first field study at Tianjin Airport, China. Atmos. Environ. 2018, 179, 222–226. [Google Scholar] [CrossRef]
- Brunekreef, B.; Forsberg, B. Epidemiological evidence of effects of coarse airborne particles on health. Eur. Respir. J. 2005, 26, 309–318. [Google Scholar] [CrossRef]
- Deng, Q.; Deng, L.; Miao, Y.; Guo, X.; Li, Y. Particle deposition in the human lung: Health implications of particulate matter from different sources. Environ. Res. 2019, 169, 237–245. [Google Scholar] [CrossRef] [PubMed]
- Airports Council International. Preliminary World Airport Traffic Rankings Released; Airports Council International: Montreal, QC, Canada, 2019; Available online: https://aci.aero/news/2019/03/13/preliminary-world-airport-traffic-rankings-released/ (accessed on 5 October 2019).
- OAG Aviation Worldwide. Megahubs International Index 2018—The World’s Most Internationally Connected Airports; OAG Aviation Worldwide: Luton, UK, 2018; Available online: https://www.oag.com/hubfs/Free_Reports/Megahubs/2018/Megahubs_International_Index_2018.pdf?hsCtaTracking=cb970431-e381-4ada-b54b-b168f98d9eb7%7Cf52e0462-7e9f-4091-a2e7-91d2eda51d07 (accessed on 5 October 2019).
- Particles Plus, Inc. 7301-AQM and 7302-AQM Remote Air Quality and Environmental Monitor; Particles Plus, Inc.: Stoughton, MA, USA, 2019; Available online: https://particlesplus.com/7301-iaq-remote-particle-counter/ (accessed on 28 May 2019).
- Thermoplastic Processes. Bev-A-Line XX Tubing; Thermoplastic Processes: Georgetown, DE, USA, 2019; Available online: http://www.thermoplasticprocesses.com/excelon-extruded-plastic-products/beverage-tubing/products-bev-a-line-xx-html/ (accessed on 28 May 2019).
- BMKG. Meteorological, Climatological and Geophysical Agency; BMKG: Jakarta, Indonesia, 2019.
- Weather Underground. Tangerang, Indonesia History; The Weather Company: Brookhaven, GA, USA, 2019; Available online: https://www.wunderground.com/history/daily/id/tangerang/WIII/date (accessed on 29 May 2019).
- Sioutas, C.; Kim, S.; Chang, M.; Terrell, L.L.; Gong Jr., H. Field evaluation of a modified DataRAM MIE scattering monitor for real-time PM2.5 mass concentration measurements. Atmos. Environ. 2000, 34, 4829–4838. [Google Scholar] [CrossRef]
- Day, D.E.; Malm, W.C.; Kreidenweis, S.M. Aerosol Light Scattering Measurements as a Function of Relative Humidity. J. Air Waste Manag. Assoc. 2000, 50, 710–716. [Google Scholar] [CrossRef] [PubMed]
- Chakrabarti, B.; Fine, P.M.; Delfino, R.; Sioutas, C. Performance evaluation of the active-flow personal DataRAM PM2.5 mass monitor (Thermo Anderson pDR-1200) designed for continuous personal exposure measurements. Atmos. Environ. 2004, 38, 3329–3340. [Google Scholar] [CrossRef]
- Custom Advanced Connections. Dacron Filter Bags; Custom Advanced Connections: Webster, TX, USA, 2019; Available online: https://www.customadvanced.com/dacron-filter-bags.html (accessed on 5 October 2019).
- Hasheminassab, S.; Pakbin, P.; Delfino, R.J.; Schauer, J.J.; Sioutas, C. Diurnal and seasonal trends in the apparent density of ambient fine and coarse particles in Los Angeles. Environ. Pollut. 2014, 187, 1–9. [Google Scholar] [CrossRef][Green Version]
- Badan Standardisasi Nasional (BSN). Standar Nasional Indonesia (Indonesian National Standardization) SNI 03-6572:2001 Tata Cara Perancangan Sistem Ventilasi dan Pengkondisian Udara pada Bangunan Gedung; BSN: Jakarta, Indonesia, 2001; Available online: http://staffnew.uny.ac.id/upload/132100514/pendidikan/perencanaan-pendingin.pdf (accessed on 7 May 2019).
- The Government of the Province of Jakarta Capital Special Territory. Jakarta Green Building User Guide; The Government of the Province of Jakarta Capital Special Territory: Jakarta, Indonesia, 2012. Available online: https://greenbuilding.jakarta.go.id/index-en.html (accessed on 7 May 2019).
- R Core Team. R: A Language and Environment for Statistical Computing; R Foundation for Statistical Computing: Vienna, Austria, 2019; Available online: https://www.R-project.org/ (accessed on 7 May 2019).
- Shapiro, S.S.; Wilk, M.B. An Analysis of Variance Test for Normality (Complete Samples). Biometrika 1965, 52, 591–611. [Google Scholar] [CrossRef]
- Allen, R.; Larson, T.; Sheppard, L.; Wallace, L.; Liu, L.J.S. Use of Real-Time Light Scattering Data To Estimate the Contribution of Infiltrated and Indoor-Generated Particles to Indoor Air. Environ. Sci. Technol. 2003, 37, 3484–3492. [Google Scholar] [CrossRef]
- Han, Y.; Qi, M.; Chen, Y.; Shen, H.; Liu, J.; Huang, Y.; Chen, H.; Liu, W.; Wang, X.; Liu, J.; et al. Influences of ambient air PM2.5 concentration and meteorological condition on the indoor PM2.5 concentrations in a residential apartment in Beijing using a new approach. Environ. Pollut. 2015, 205, 307–314. [Google Scholar] [CrossRef]
- Zuo, J.; Ji, W.; Ben, Y.; Hassan, M.A.; Fan, W.; Bates, L.; Dong, Z. Using big data from air quality monitors to evaluate indoor PM2.5 exposure in buildings: Case study in Beijing. Environ. Pollut. 2018, 240, 839–847. [Google Scholar] [CrossRef]
- National Academies of Sciences, Engineering, and Medicine. Health Risks of Indoor Exposure to Particulate Matter; National Academies Press: Washington, DC, USA, 2016. [Google Scholar] [CrossRef]
- Ferro, A.R.; Kopperud, R.J.; Hildemann, L.M. Source Strengths for Indoor Human Activities that Resuspend Particulate Matter. Environ. Sci. Technol. 2004, 38, 1759–1764. [Google Scholar] [CrossRef]


| Session | Measurement Date | Arrive | Depart |
|---|---|---|---|
| I | 2 February 2019 | 4:00 p.m. | 10:00 p.m. |
| II | 2 March 2019 | 6:00 p.m. | 11:00 p.m. |
| Location | Particle Size | Min | Mean | Max | SD |
|---|---|---|---|---|---|
| Indoor | PM1 | 18.13 | 28.04 | 38.75 | 5.54 |
| PM2.5 | 26.85 | 39.00 | 53.59 | 7.47 | |
| PM2.5–10 | 16.65 | 20.67 | 27.07 | 2.39 | |
| Outdoor | PM1 | 11.51 | 29.25 | 42.12 | 9.50 |
| PM2.5 | 21.35 | 47.82 | 67.20 | 15.70 | |
| PM2.5–10 | 12.09 | 30.11 | 54.74 | 12.31 |
| Particle Size | Sample Size | Indoor | Outdoor | ||
|---|---|---|---|---|---|
| W | p-Value | W | p-Value | ||
| PM1 | 26 | 0.955 | 0.298 | 0.920 | 0.045 * |
| PM2.5 | 26 | 0.951 | 0.251 | 0.898 | 0.014 * |
| PM2.5–10 | 26 | 0.966 | 0.528 | 0.941 | 0.140 |
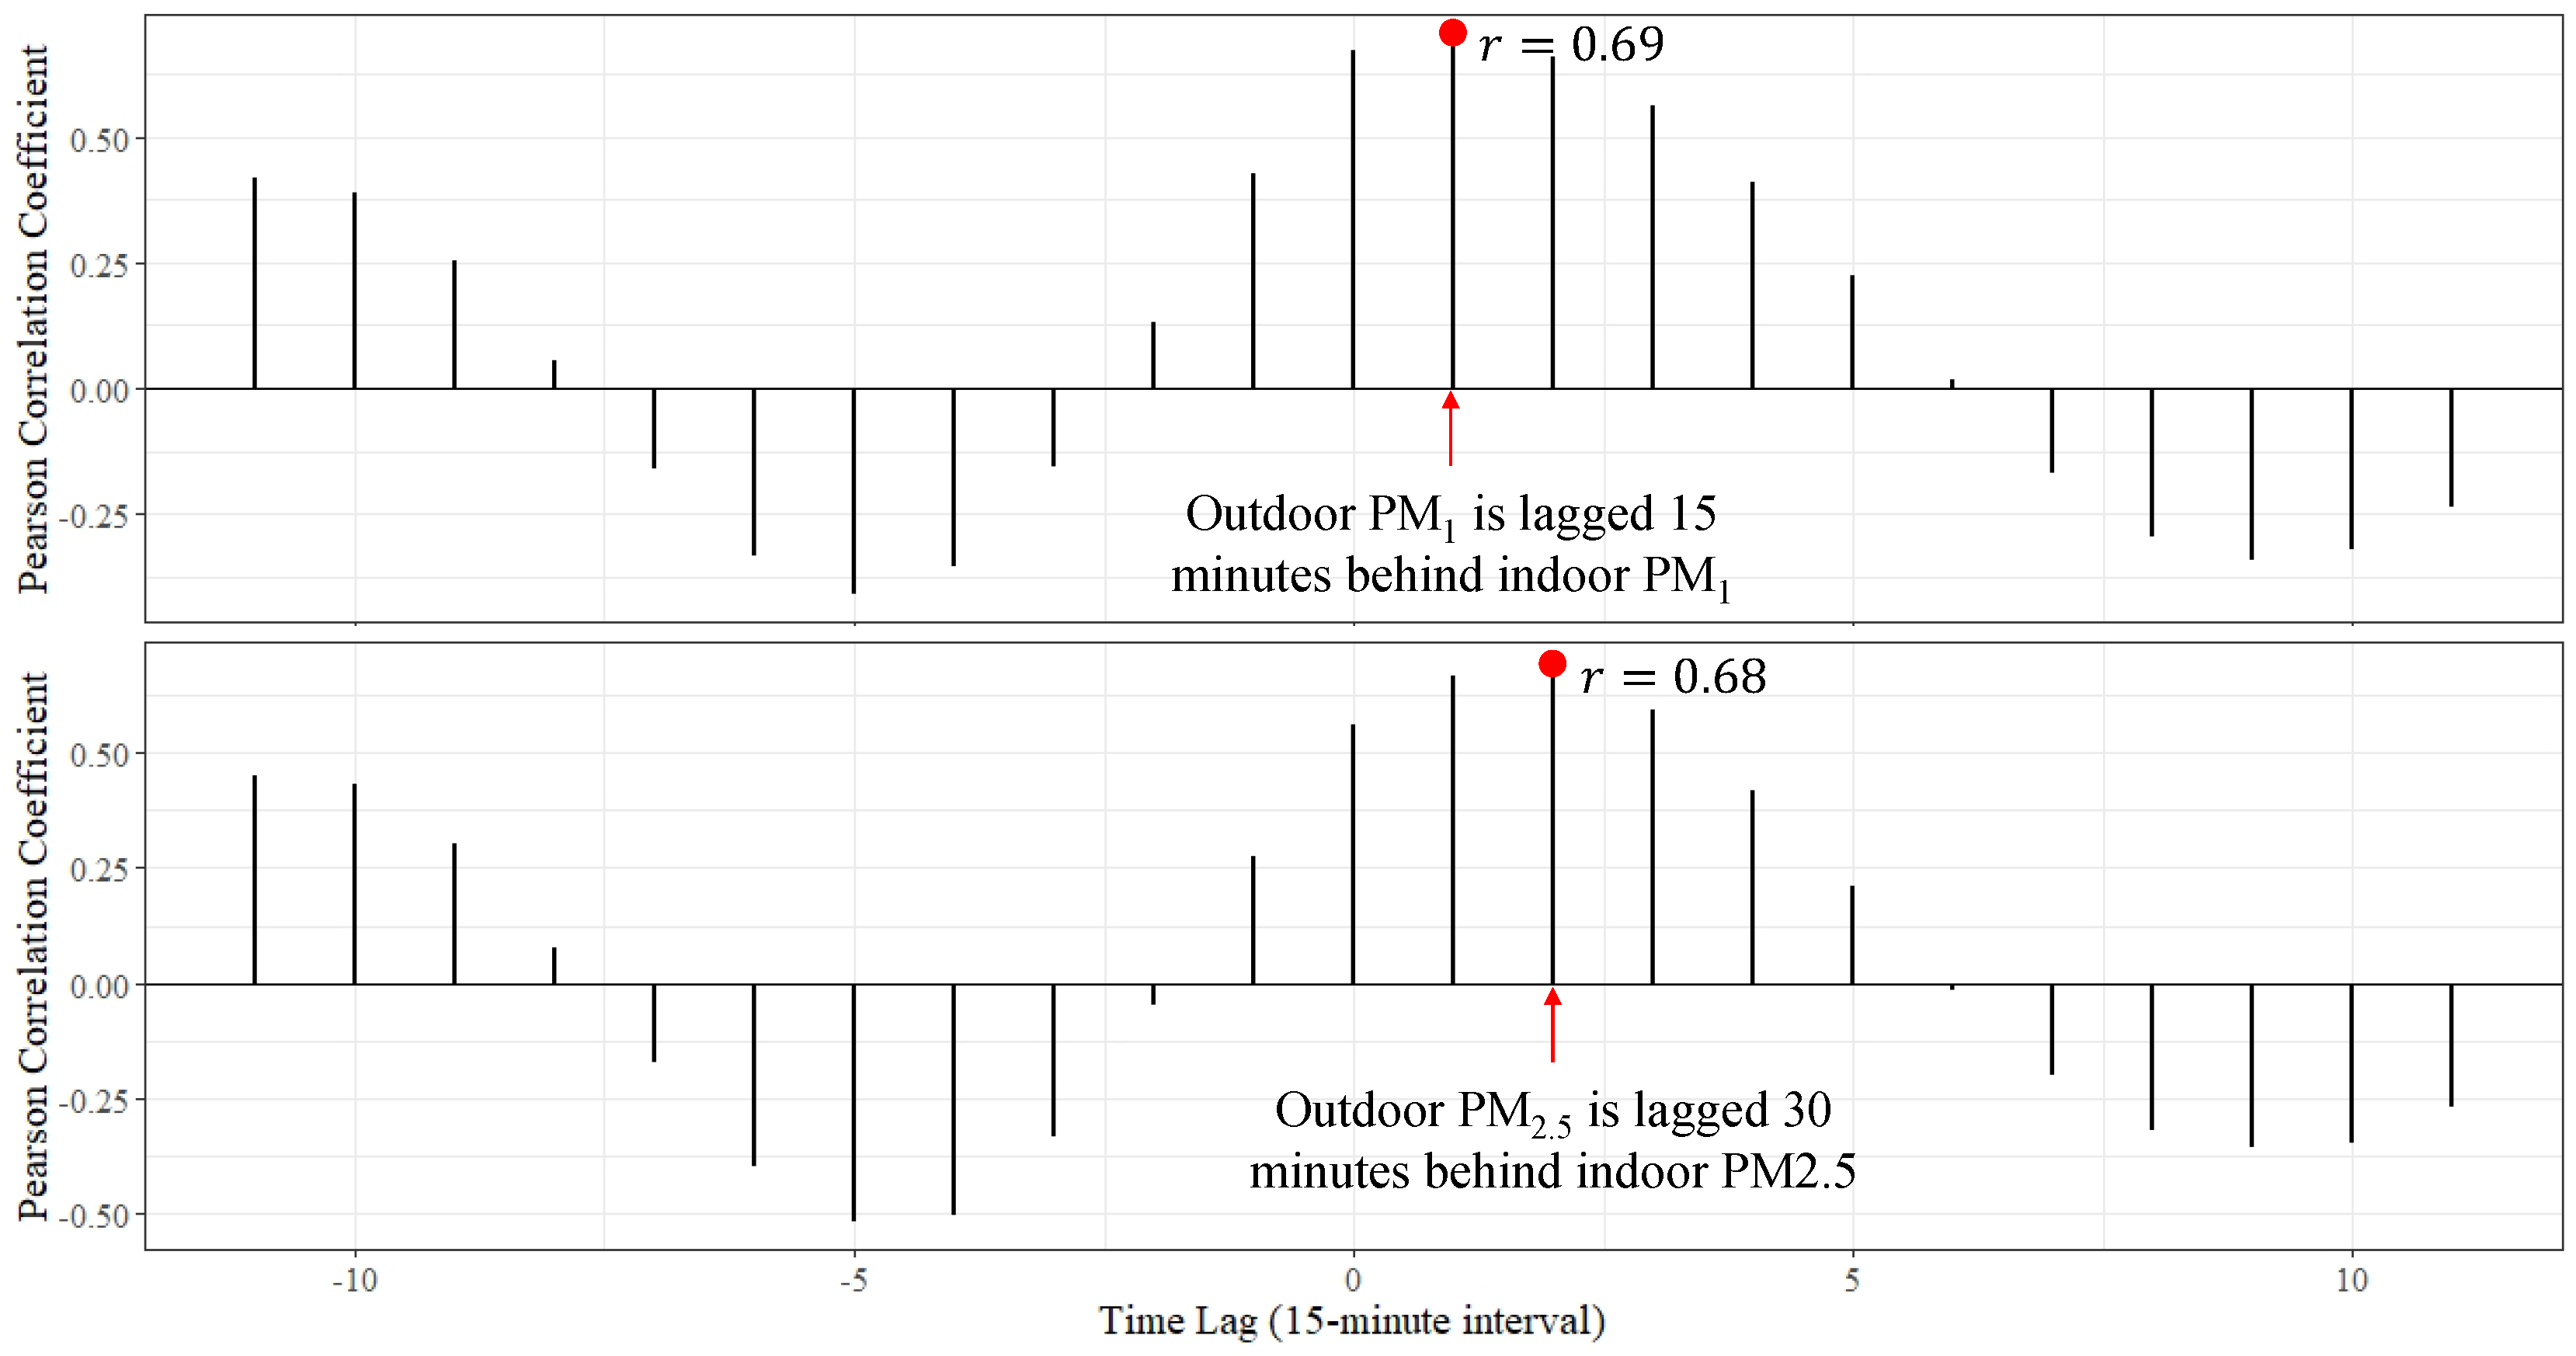
| Particle Size | Time Lag (min) | Intercept | I/O Ratio | |
|---|---|---|---|---|
| PM1 | 15 | 16.357 | 0.416 | 0.521 |
| PM2.5 | 30 | 24.676 | 0.325 | 0.542 |
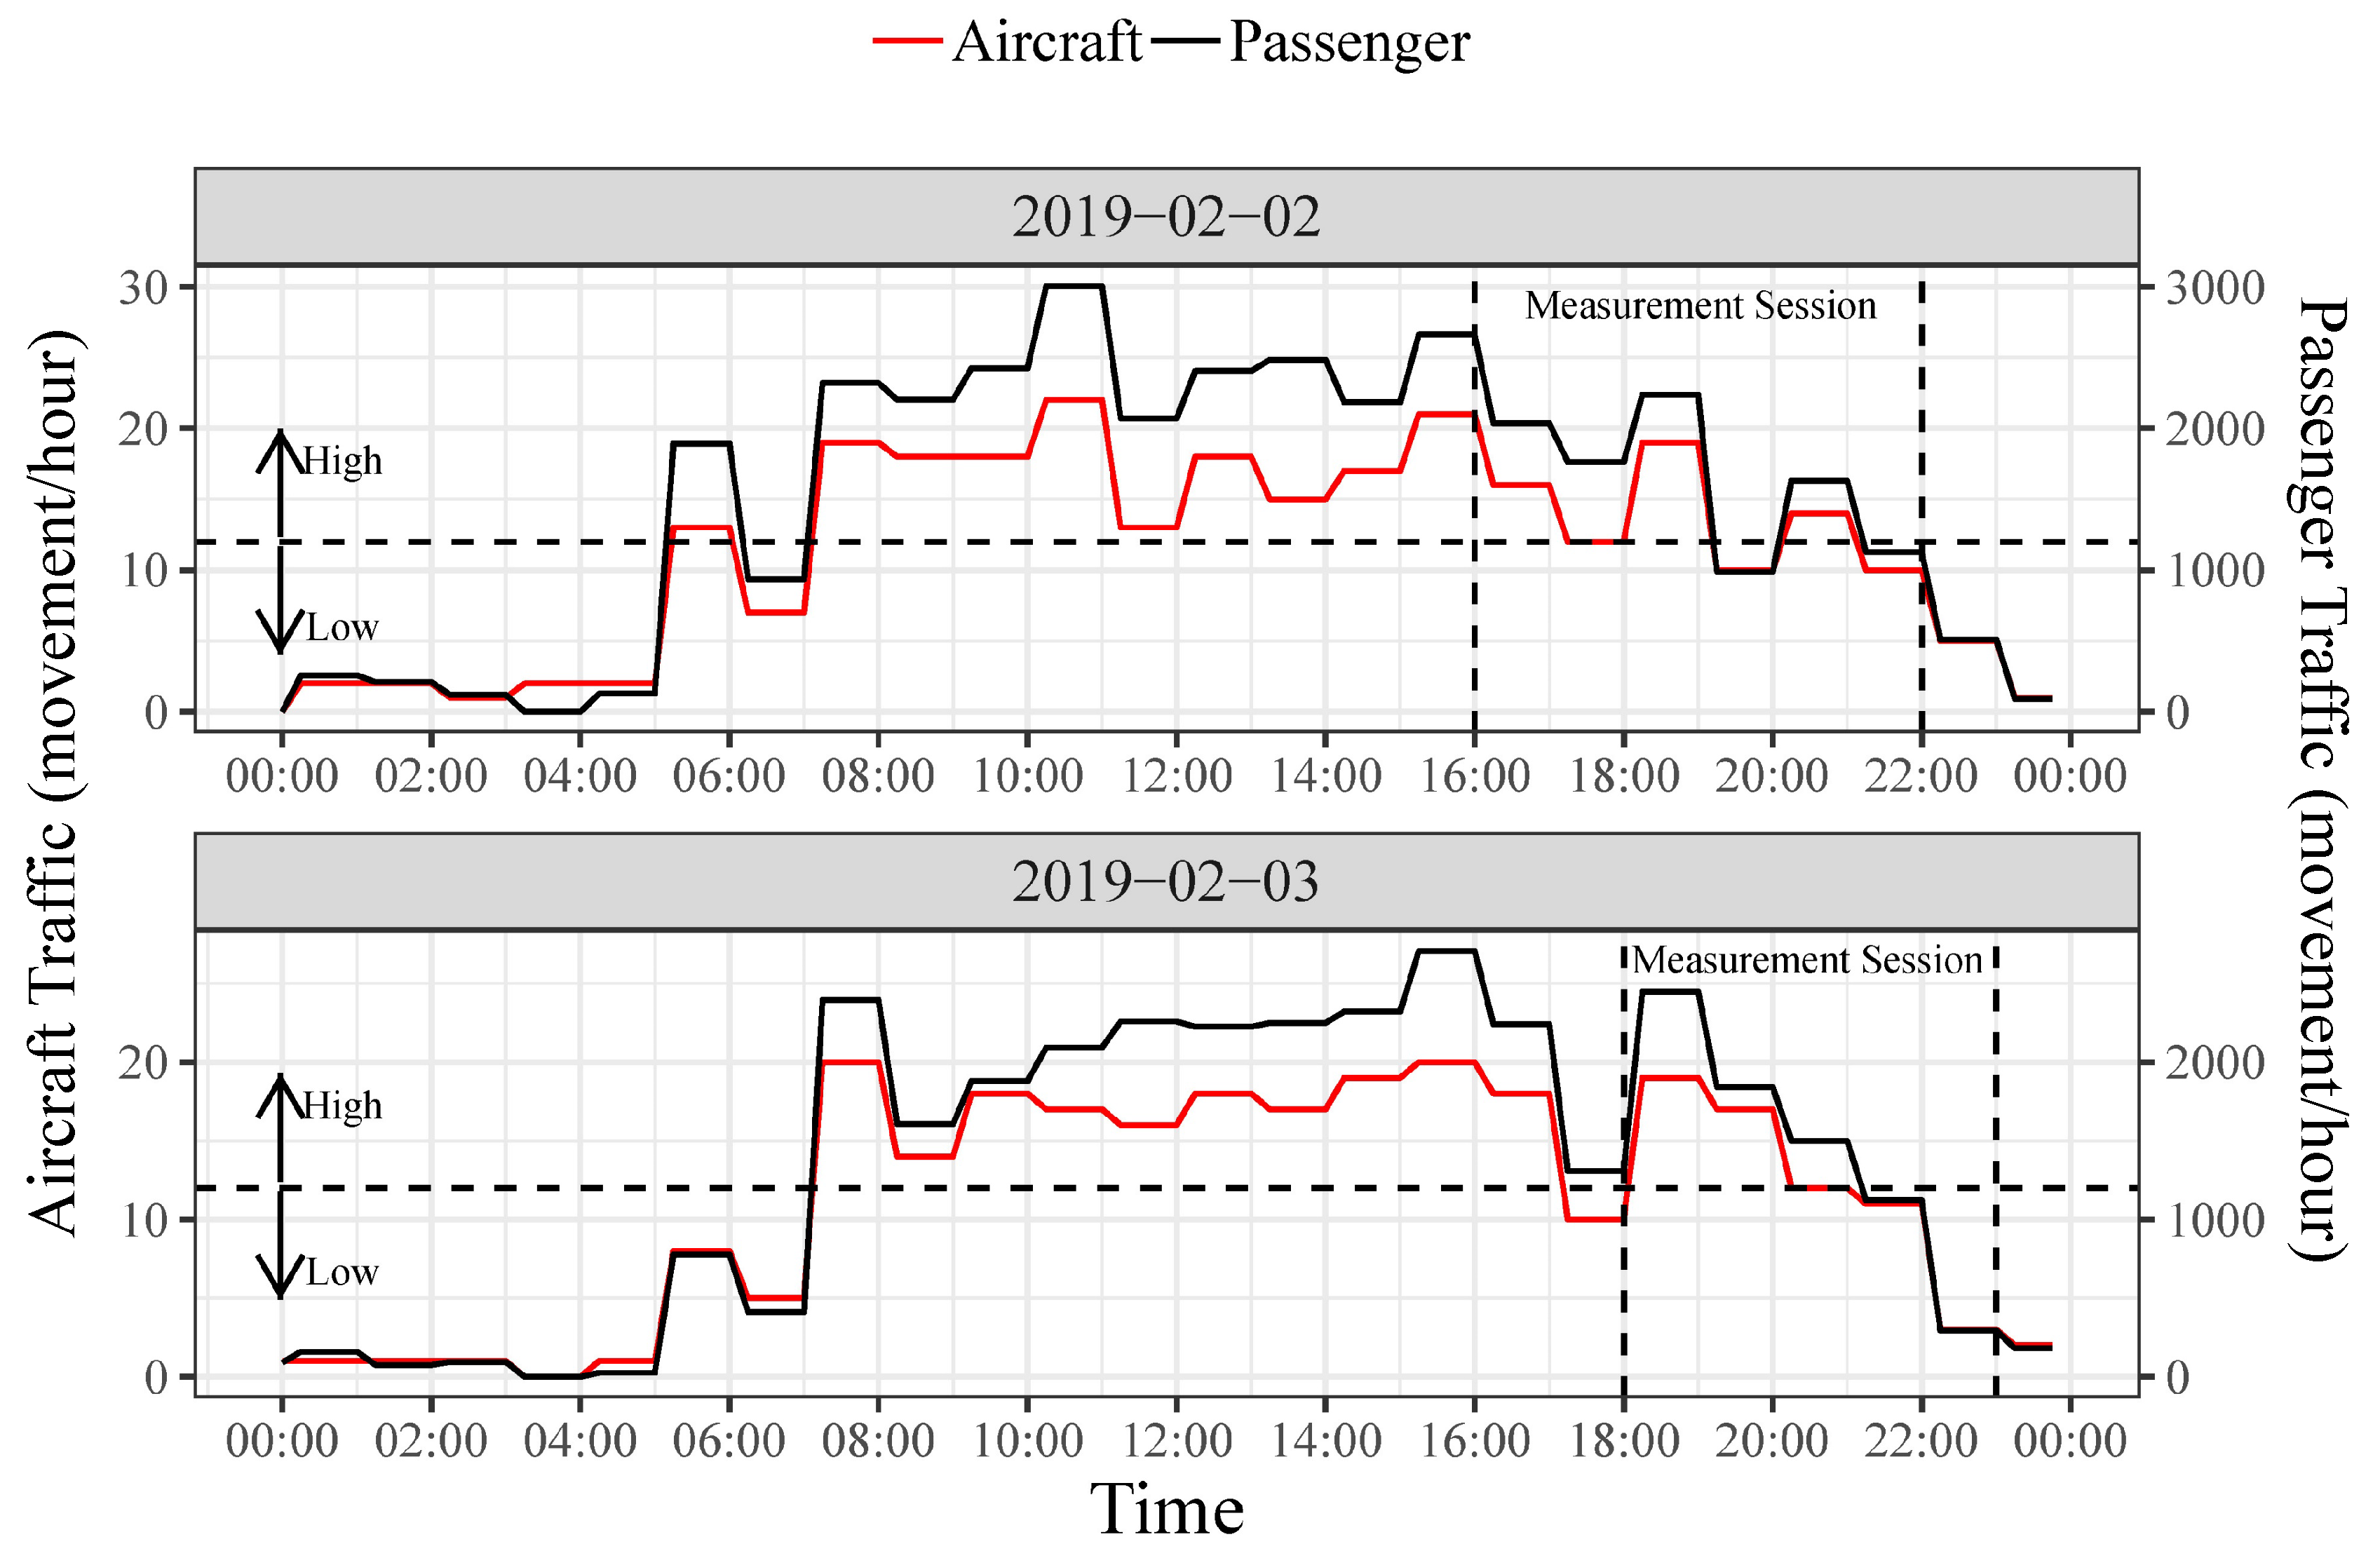
| Category | Aircraft Traffic (movement/hour) | Passenger Traffic (movement/hour) |
|---|---|---|
| High | >12 | >1200 |
| Low | ≤12 | ≤1200 |
| Particle Size | Factor | SS | DF | p-Value |
|---|---|---|---|---|
| PM1 | Outdoor PM1,t-1 | 5.30 | 1 | 0.40 |
| Indoor PM1,t-1 | 1.34 | 1 | 0.67 | |
| Aircraft Traffic | 34.06 | 1 | 0.05 ** | |
| Passenger Traffic | 8.83 | 1 | 0.29 | |
| Residuals | 93.03 | 13 | ||
| PM2.5 | Outdoor PM2.5,t-1 | 12.65 | 1 | 0.41 |
| Indoor PM2.5,t-1 | 4.81 | 1 | 0.61 | |
| Aircraft Traffic | 69.12 | 1 | 0.07 * | |
| Passenger Traffic | 7.93 | 1 | 0.52 | |
| Residuals | 231.02 | 13 | ||
| PM2.5–10 | Outdoor PM2.5–10,t-1 | 2.60 | 1 | 0.32 |
| Indoor PM2.5–10,t-1 | 7.43 | 1 | 0.10 * | |
| Aircraft Traffic | 2.18 | 1 | 0.36 | |
| Passenger Traffic | 16.57 | 1 | 0.02 ** | |
| Residuals | 30.99 | 13 |
© 2020 by the authors. Licensee MDPI, Basel, Switzerland. This article is an open access article distributed under the terms and conditions of the Creative Commons Attribution (CC BY) license (http://creativecommons.org/licenses/by/4.0/).
Share and Cite
Kim, A.; Medal, L.; Wang, S.; Larson, T. Indoor and Outdoor Concentrations of Particulate Matter in an Airport Terminal Building: A Pilot Study at Soekarno-Hatta International Airport in Indonesia. Buildings 2020, 10, 25. https://doi.org/10.3390/buildings10020025
Kim A, Medal L, Wang S, Larson T. Indoor and Outdoor Concentrations of Particulate Matter in an Airport Terminal Building: A Pilot Study at Soekarno-Hatta International Airport in Indonesia. Buildings. 2020; 10(2):25. https://doi.org/10.3390/buildings10020025
Chicago/Turabian StyleKim, Amy, Lysandra Medal, Shuoqi Wang, and Timothy Larson. 2020. "Indoor and Outdoor Concentrations of Particulate Matter in an Airport Terminal Building: A Pilot Study at Soekarno-Hatta International Airport in Indonesia" Buildings 10, no. 2: 25. https://doi.org/10.3390/buildings10020025
APA StyleKim, A., Medal, L., Wang, S., & Larson, T. (2020). Indoor and Outdoor Concentrations of Particulate Matter in an Airport Terminal Building: A Pilot Study at Soekarno-Hatta International Airport in Indonesia. Buildings, 10(2), 25. https://doi.org/10.3390/buildings10020025