Article

Effect of Different Additives on Reaction Characteristics of Fluorapatite During Coal-Based Reduction of Iron Ore

School of Resources and Civil Engineering, Northeastern University, Shenyang 110819, China
*
Author to whom correspondence should be addressed.
Metals 2019, 9(9), 923; https://doi.org/10.3390/met9090923
Submission received: 22 July 2019 / Revised: 17 August 2019 / Accepted: 21 August 2019 / Published: 23 August 2019

Abstract

:
In the coal-based reduction of high phosphorus oolitic hematite, it is particularly important to study the mechanism of phosphorus regulation during the formation of iron metals for the efficient development and utilization of iron ore. In this study, the thermodynamics of the coal-based reduction process of fluorapatite in different mineral systems, effect mechanism of the reduction degree, kinetics, mineral composition, and morphology of structural evolution samples were systematically investigated using FactSage software, single factor analysis, the isothermal method, X-ray diffraction (XRD), scanning electron microscope (SEM), and an energy dispersive spectrometer (EDS). Thermodynamic analysis indicates that the effect of the SiO2–Fe2O3–C system on reducing the initial reduction temperature of fluorapatite was stronger than that of the Al2O3–Fe2O3–C system. The effect mechanism of the reduction degree demonstrates that increasing the dosage of silica, iron oxide, carbon, reduction time, and reduction temperature could promote the reduction reaction of fluorapatite under certain conditions. Dynamics analysis shows that the best kinetic mechanism functions of the SiO2–Fe2O3–C system and the Al2O3–Fe2O3–C system were A1/3 = 1/3(1 − α)[−ln(1 − α)]−2 and A1/2 = 1/2(1 − α)[−ln(1 − α)]−1, respectively. The activation energy and pre-exponential factor of the reduction kinetics equation in the system containing silica were significantly lower than that in the system containing alumina, which explained that the catalytic effect of silica on the reduction of calcium fluorophosphate was far greater than that of alumina. XRD and SEM/EDS analysis indicate that the solid–solid reaction of alumina, silica, iron, and fluorapatite occurred during the reduction process, while calcium aluminate, calcium silicate, and calcium oxide were formed at the contact point. Among them, iron could absorb P2 gas so that it played a greater role in promoting the reduction of fluorapatite. Increasing the reduction temperature and prolonging the reduction time were beneficial to the reduction of fluorapatite.

1. Introduction

In recent years, due to the rapid development of the iron and steel industry and the shortage of high-quality iron ore resources, the field of mineral processing and metallurgy has paid more attention to complex refractory iron ore [1,2]. As a typical complex refractory iron ore, high phosphorus oolitic hematite (phosphorus content is 0.4–1.8%) accounts for about 7% of the total iron ore resources in China, with a total amount of 3.72 billion tons [3]. However, owing to its complex mineral composition, unique oolitic structure, fine grain size, and high content of harmful phosphorus, it is considered to be one of the most difficult iron ores to separate and utilize in the world [4,5,6,7,8]. Many scholars at home and abroad have carried out a large number research works on high-phosphorus oolitic hematite, which were mainly traditional mineral processing technologies, including magnetic separation and flotation, magnetization roasting technology, a leaching process, and a smelting process [9,10,11,12,13,14,15,16,17]. However, due to the complex mineralogical characteristics of high-phosphorus oolitic hematite, they have failed to meet the ideal separation index and environmental requirements.
Due to the traditional beneficiation methods not being effective enough for the treatment of high-phosphorus oolitic hematite, this study broke through the beneficiation–sintering–smelting process and firstly proposed coal-based reduction followed by magnetic separation technology for the treatment of high-phosphorus oolitic hematite and other complex refractory ores [18,19,20]. The complex refractory iron ore that cannot be directly used as blast furnace raw material is reduced to metallic iron at higher temperature and stronger reduction atmosphere than magnetized roasting. By controlling the reduction conditions, the metallic iron grows into an iron particle with a certain size, and the iron element tends to be Fe2O3 → Fe3O4 → FeO → Fe during coal-based reduction. Products with stable composition, uniform particle size, high grade, high recovery, and a high metallization rate can be obtained after grinding and magnetic separation. Although the iron element can be efficiently enriched and recovered from high-phosphorus oolitic hematite by coal-based reduction followed by magnetic separation, the phosphorus minerals in the high-phosphorus oolitic hematite can be reduced to elemental phosphorus in the process. The reduced phosphorus element migrates to the metallic iron phase and binds with the elemental iron to form iron phosphide [3]. As a harmful element in the process of smelting, phosphorus is easy to cause cold brittleness in steel [21]. Therefore, many researchers have carried out a series of works on the reaction characteristics of phosphorus minerals and the regulation of phosphorus elements in the reduction process [22,23,24]. Two processes containing coal-based reduction for dephosphorization and coal-based reduction for phosphorus enrichment have been proposed. For the dephosphorization process, the effects of ore particle size, reduction temperature, alkalinity of the slag phase, dosage of reductant, and dephosphorization agent on the dephosphorization effect of high-phosphorus oolitic hematite were studied. The coal-based reduction–phosphorus enrichment process that promotes the enrichment of most phosphorus in the ferrous metal phase by controlling the coal-based reduction conditions for ores that have a high phosphorus content and are difficult to effectively dephosphorize. After the reduction products are efficiently separated, the reduced iron powder with phosphorus content of more than 1.5% can be obtained. Although the regulation of phosphorus (mainly in fluoroapatite) in the coal-based reduction of high-phosphorus oolitic hematite has gradually become the focus of scientific researchers, the current research work is still focused on the selection of dephosphorizing agents and the optimization of process parameters. The reduction reaction regulation of phosphorus minerals, as well as the factors and mechanisms affecting the reduction reaction of phosphorus minerals have not been carried out, which makes it difficult to make breakthroughs in the direction and control of phosphorus element.
In this study, the thermodynamic simulation software FactSage 6.4 was used to calculate the reduction reaction of phosphorus minerals in different systems, and the effect of the main components in high-phosphorus oolitic hematite on the reduction of phosphorus minerals was analyzed. Coal-based reduction experiments of phosphorus minerals were carried out. In order to lay a foundation for the regulation of the trend of phosphorus element, by analyzing and calculating the reduction degree of phosphorus minerals at different reduction times, the reduction kinetics model of phosphorus minerals in different systems was established. XRD and SEM were used to detect the coal-based reduction products of phosphorus minerals, and the interfacial reaction behavior and phase evolution between phosphorus minerals and reducing agents and additives under different reduction conditions were obtained.

2. Materials and Methods

2.1. Materials

The apatite used in the experiment is produced from an apatite mine in Hubei Province, which is located in the central part of China. The grade of phosphorus is 18.23%, and the theoretical grade of phosphorus in fluorapatite is 18.53%. Therefore, the content of apatite can be calculated as high as 98.38%. XRD phase analysis is shown in Figure 1. The results show the main mineral of apatite was fluorapatite. The reducing agent used in the test was coke. The analysis results are shown in Table 1. Table 1 shows that the fixed carbon content of the reductant was 85.44%, the ash and volatile content were 12.46% and 1.26%, respectively, and the sulfur content was 0.62%. The reagents used in this experiment are shown in Table 2.

2.2. Methods and Equipment

FactSage 6.4 was used to simulate the reduction process of phosphorus minerals in various systems. The main component of apatite chosen in this study is fluoroapatite; therefore, Ca10(PO4)6F2 was used as the chemical formula of phosphorus minerals in thermodynamic analysis. Fe2O3, SiO2, CaO, and Al2O3 are the main components of high-phosphorus oolitic hematite; in order to explore their effects on the reduction of phosphorus minerals, they are used as additives [1,3]. Meanwhile, the thermodynamic analysis of Ca10(PO4)6F2–Al2O3–Fe2O3–C and Ca10(PO4)6F2–SiO2–Fe2O3–C were carried out using carbon as a reducing agent. The mass ratio of the two additives to Ca10 (PO4) 6F2 was 1:1:10. The C/O molar ratio of each system is 2.0.
Coal-based reduction experiments of various systems of phosphate minerals were carried out in a laboratory muffle furnace. A certain amount of phosphorus minerals, additives, and coke were mixed evenly according to the test conditions. The carbon distribution coefficient in this study is expressed by the C/O molar ratio. When the C/O molar ratio is 1, the amount of carbon required is the fixed carbon required to completely reduce fluoroapatite and iron mineral to phosphorus and iron, while carbon is oxidized to CO. The uniformly mixed material was put into a graphite crucible, and a layer of coke powder was covered on the surface of the crucible to keep the reducing atmosphere in the crucible. The crucible with material was put into the furnace after the temperature reaches the specified value. This process takes a very short time, and has little effect on the temperature change; the target temperature can be reached in a few minutes after the crucible with material was put into furnace. When the temperature in the furnace rises to the target temperature, the timing begins. The crucible is taken out for water quenching treatment when the reduction proceeds to a specified time. After water quenching, the reduction material is grinded to the particle size of 85 wt.% minus 74 µm. The grinded material is put into the oven to dry, and 15-g representative products are taken out. The fined material begins magnetic separation by a XCSG-50 magnetic separator under the condition of 107 kA/m magnetic field intensity. The phosphorus in magnetic separation concentrate belongs to a reduced phosphorus, while the phosphorus in the magnetic separation tailings (a gangue phase) belongs to unreduced phosphorus; the phosphorus content is determined after weighing the magnetic separation tailings, and the reduction degree of apatite can be calculated by Equation (1):
α = ( 1 m × γ S × w P m P ) × 100
where α is the fluoroapatite reduction degree, wt.%; m is the mass of the reduced product, g; γS is the mass ratio of magnetic separation tailings to magnetic separation feeds; wP is the phosphorus content in magnetic separation tailings, wt.%; and mP is the phosphorus mass in phosphorus minerals at each test, g.
In order to explore the reaction mechanism and the expression of the reaction rate of phosphorus minerals under different conditions, we determined the limiting link of the reaction process and obtained the influence of various factors on the reduction rate. In order to select suitable reduction conditions and realize the regulation of the reduction of phosphorus minerals, the kinetics experiments of Ca10(PO4)6F2–Al2O3–Fe2O3–C and Ca10(PO4)6F2–SiO2–Fe2O3–C systems were carried out by the isothermal method. Under isothermal conditions, the kinetic equations of homogeneous or heterogeneous chemical reactions are shown in Equation (2). The integral form of Equation (2) is shown in Equation (3):
r = d α d t = k ( T ) f ( α )
where T is the reduction time, min; k(T) is the reaction rate constant, min−1; and f (a) is the reaction mechanism function.
G ( α ) = 0 α d α f ( α ) = 0 t k ( T ) d t = k ( T ) t
The kinetic models of chemical reaction mainly include the Avrami–Erofeev equation, diffusion model, power function rule, shrinkage core model, and chemical reaction model [23,24]. Sixteen commonly used kinetic mechanism function models were selected to study the linear relationship between G(α) and the reduction time. The f(α) corresponding to G(α) with the highest linear correlation was the best mechanism function for the reduction of fluorapatite in this system, and the slope of the regression line was the reaction rate constant k(T). Table 3 shows the differential and integral forms of 16 commonly used kinetic mechanism functions. For a given chemical reaction, the reaction rate constant k(T) is temperature-dependent, and can be expressed by the Arrhenius equation, as shown in Equations (4) and (5).
k ( T ) = A exp ( E a R T )
ln k ( T ) = E a R T + ln A
where A is the pre-exponential factor, min−1; T is the reduction temperature, K; Ea is the apparent activation energy of the reaction, J·mol−1; and R is the gas constant, R = 8.314 J·mol−1·K−1.
A Hitachi F-7000 fluorescence spectrophotometer was used to detect the content of phosphorus in the reduction products. Detailed phase information of the reduction products was detected by X-ray diffraction (XRD) with Cu Kα radiation, where the operating voltage and current were 40 kV and 40 mA, respectively. The diffraction angle was scanned from 5° to 90° with the scanning rate of 12°/min. Hitachi S-3400N scanning electron microscopy (SEM, Hitachi Technology Co., Ltd. from Tokyo, Japan) was used to characterize the microstructures of the products obtained under different reduction conditions. The working parameters have an acceleration voltage of 20 kV. An energy dispersive spectrometer (EDS) was used for surface scanning element analysis.

3. Results and Discussion

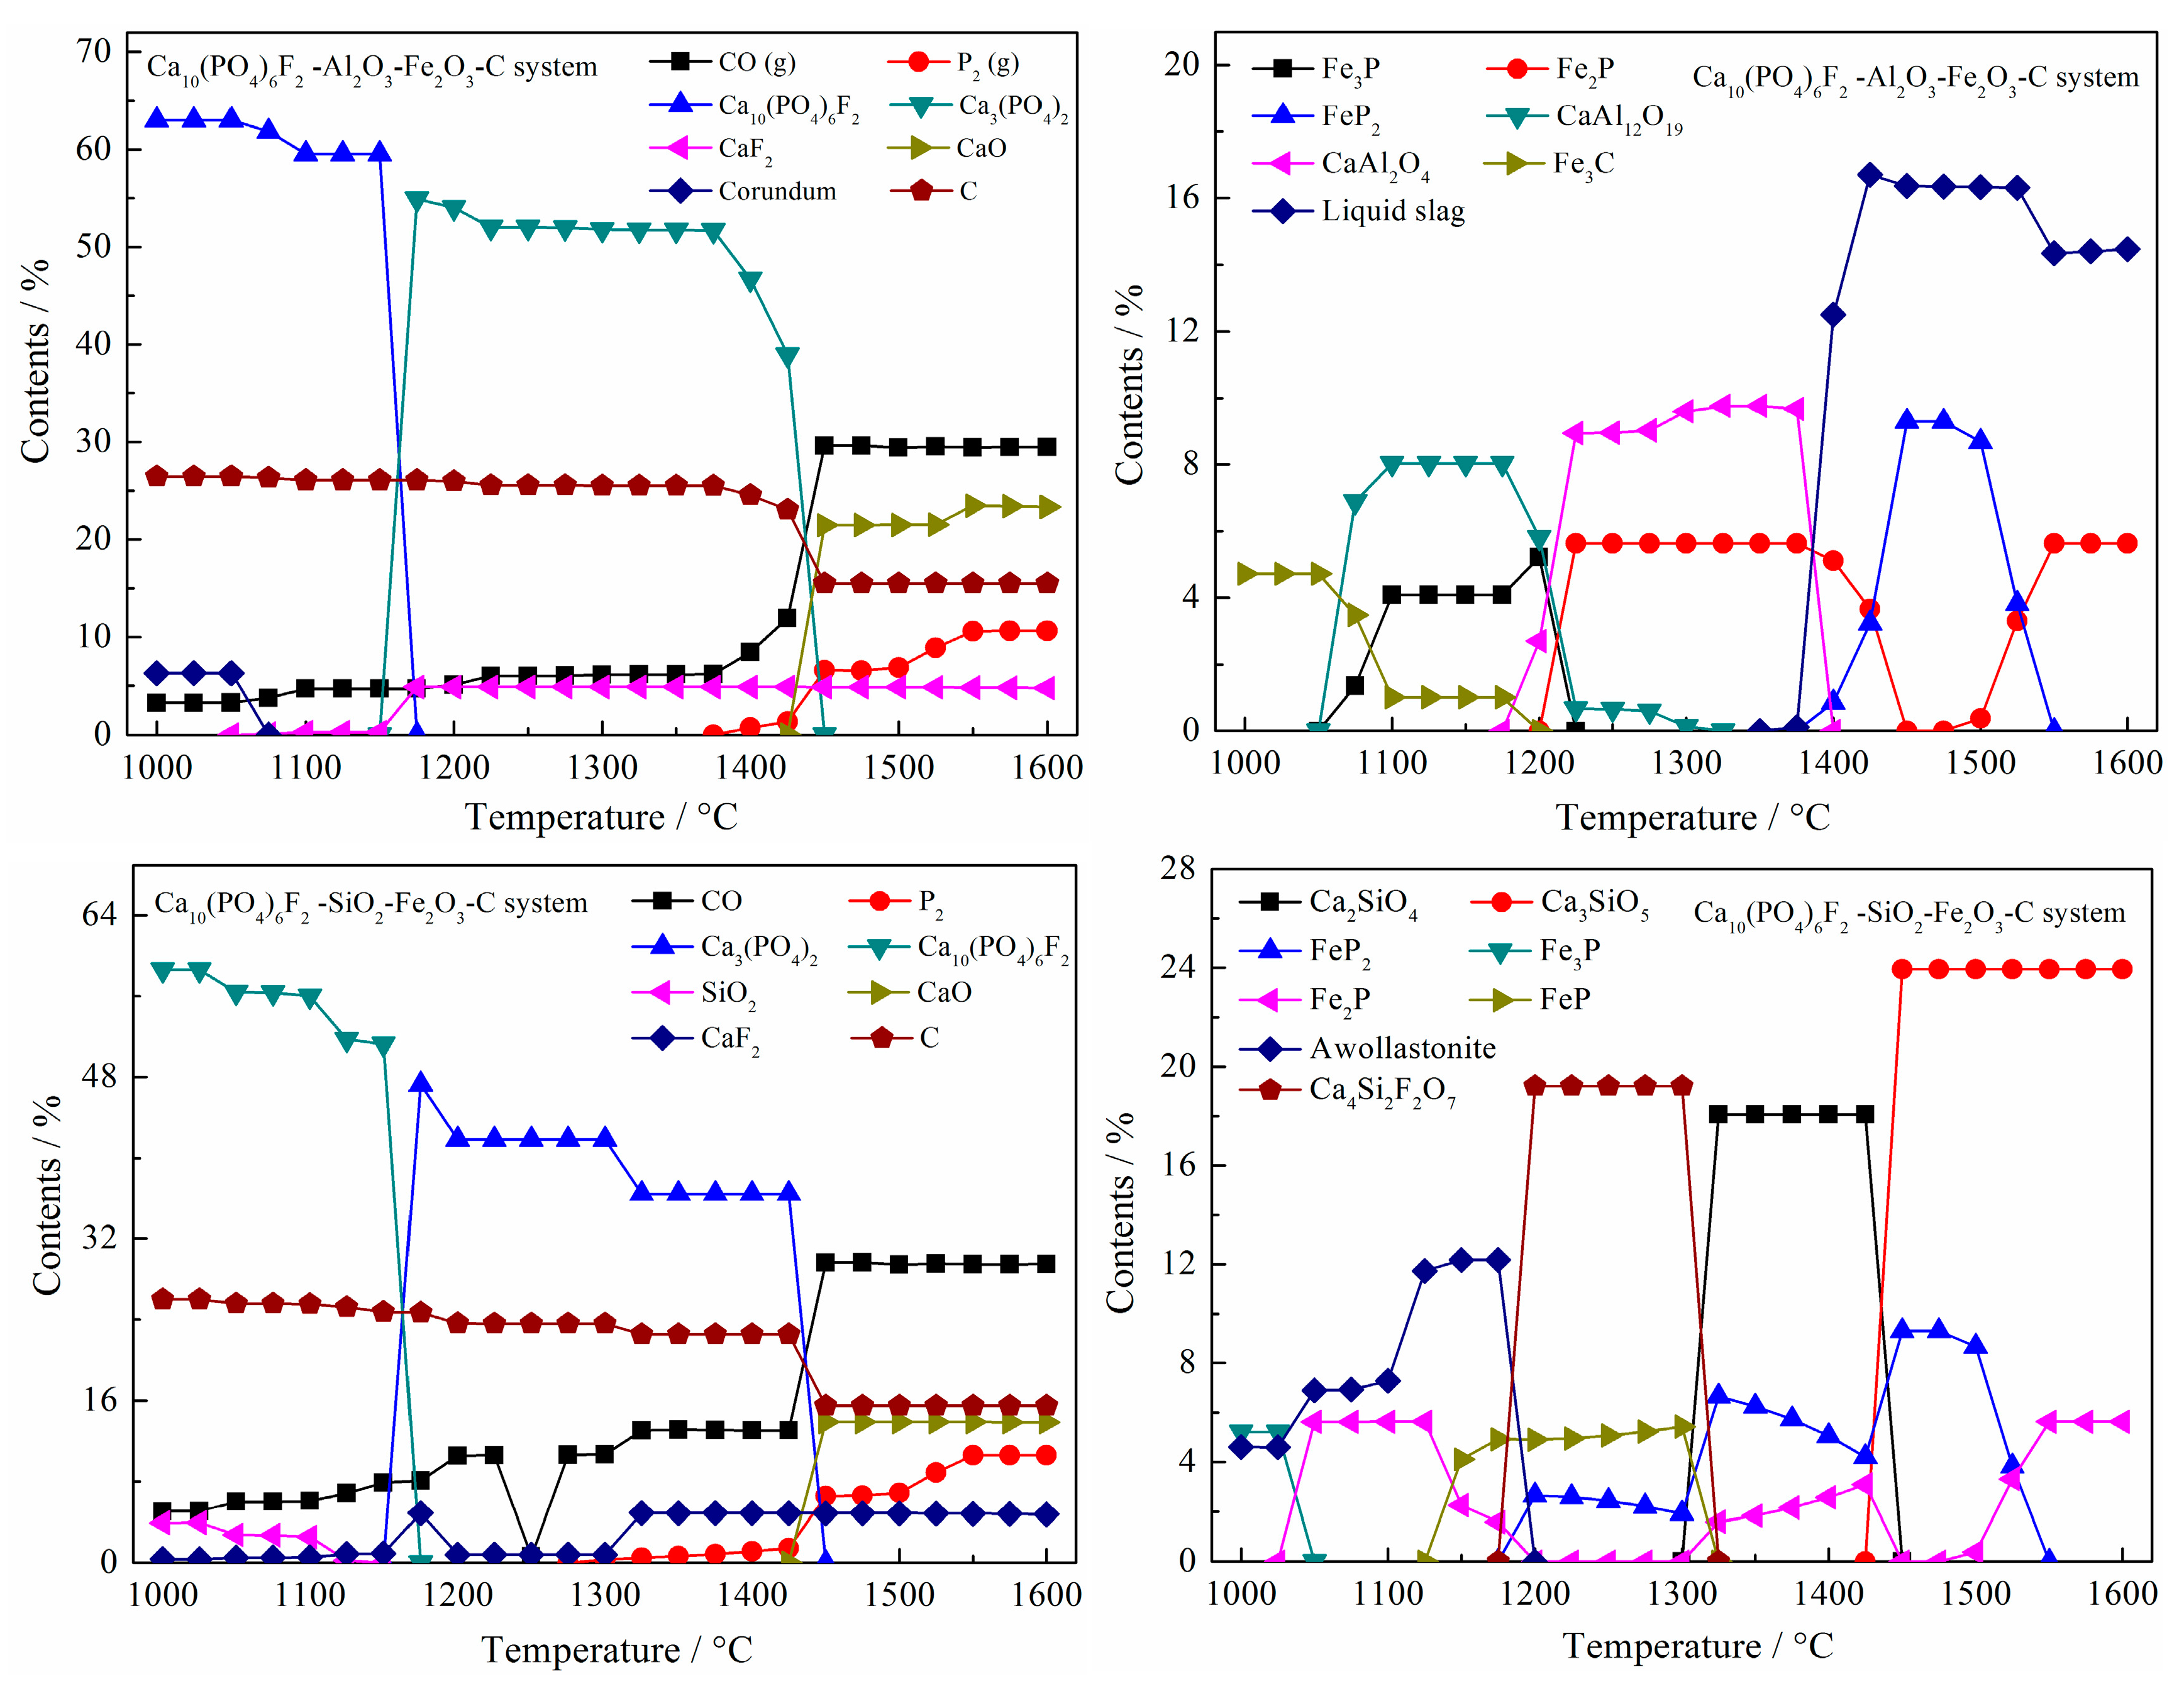
3.1. Thermodynamic Analysis

The Equilib module in FactSage 6.4 was used to calculate the equilibrium phase composition of the two systems in the range of 1000 °C to 1600 °C. The thermodynamic calculation of the possible chemical reactions in the two systems was carried out using a reaction module, as shown in Figure 2.
As can be seen from Figure 2, in the Ca10(PO4)6F2–Al2O3–Fe2O3–C system, a small amount of calcium fluorophosphate had been reduced, and CaAl12O19 and Fe3P had been formed when the calculating temperature was lower than 1175 °C, which was necessary for the defluorination reaction of fluoroapatite. The chemical equation of the reduction reaction is shown in Equation (6). With the increase of calculating temperature, the reaction products of fluorapatite with alumina and iron were mainly CaAl2O4 and FexP. When the calculating temperature was higher than 1400 °C, a large number of liquid slag was formed in the system. The liquid slag was mainly composed of Al2O3 and CaO. By calculating the relationship between Gibbs free energy and temperature in the range of 1000 °C to 1600 °C, the initial temperature of Equation (6) was 1059 °C.
Ca10(PO4)6F2 + 54Al2O3 + 15C + 18Fe = CaF2 + 9CaAl12O19 + 6Fe3P + 15CO
In the Ca10(PO4)6F2–SiO2–Fe2O3–C system, when the calculating temperature was 1000 °C, with the promotion of silicon dioxide and iron, when the reaction reaches equilibrium, fluorapatite had been reduced to wollastonite (CaSiO3) and Fe3P products in this system. The chemical equation of the reduction reaction is shown in Equation (7). With the increase of calculating temperature, the order of formation of different forms of calcium silicate was: CaSiO3, Ca4Si2F2O7(Ca2Si2O7), Ca2SiO4, Ca3SiO5. The Gibbs free energy of reaction 7 in the range of 900 °C to 1600 °C was calculated. The initial temperature of Equation (7) was 985 °C.
Ca10(PO4)6F2 + 9SiO2 + 15C + 18Fe = CaF2 + 9CaSiO3 + 6Fe3P + 15CO

3.2. Reduction Degree Analysis

The factors affecting the reduction of fluorapatite were studied. The effects of reduction time, temperature, carbon content, and additives on the reduction of fluorapatite were investigated. The results are shown in Figure 3, Figure 4, Figure 5 and Figure 6.

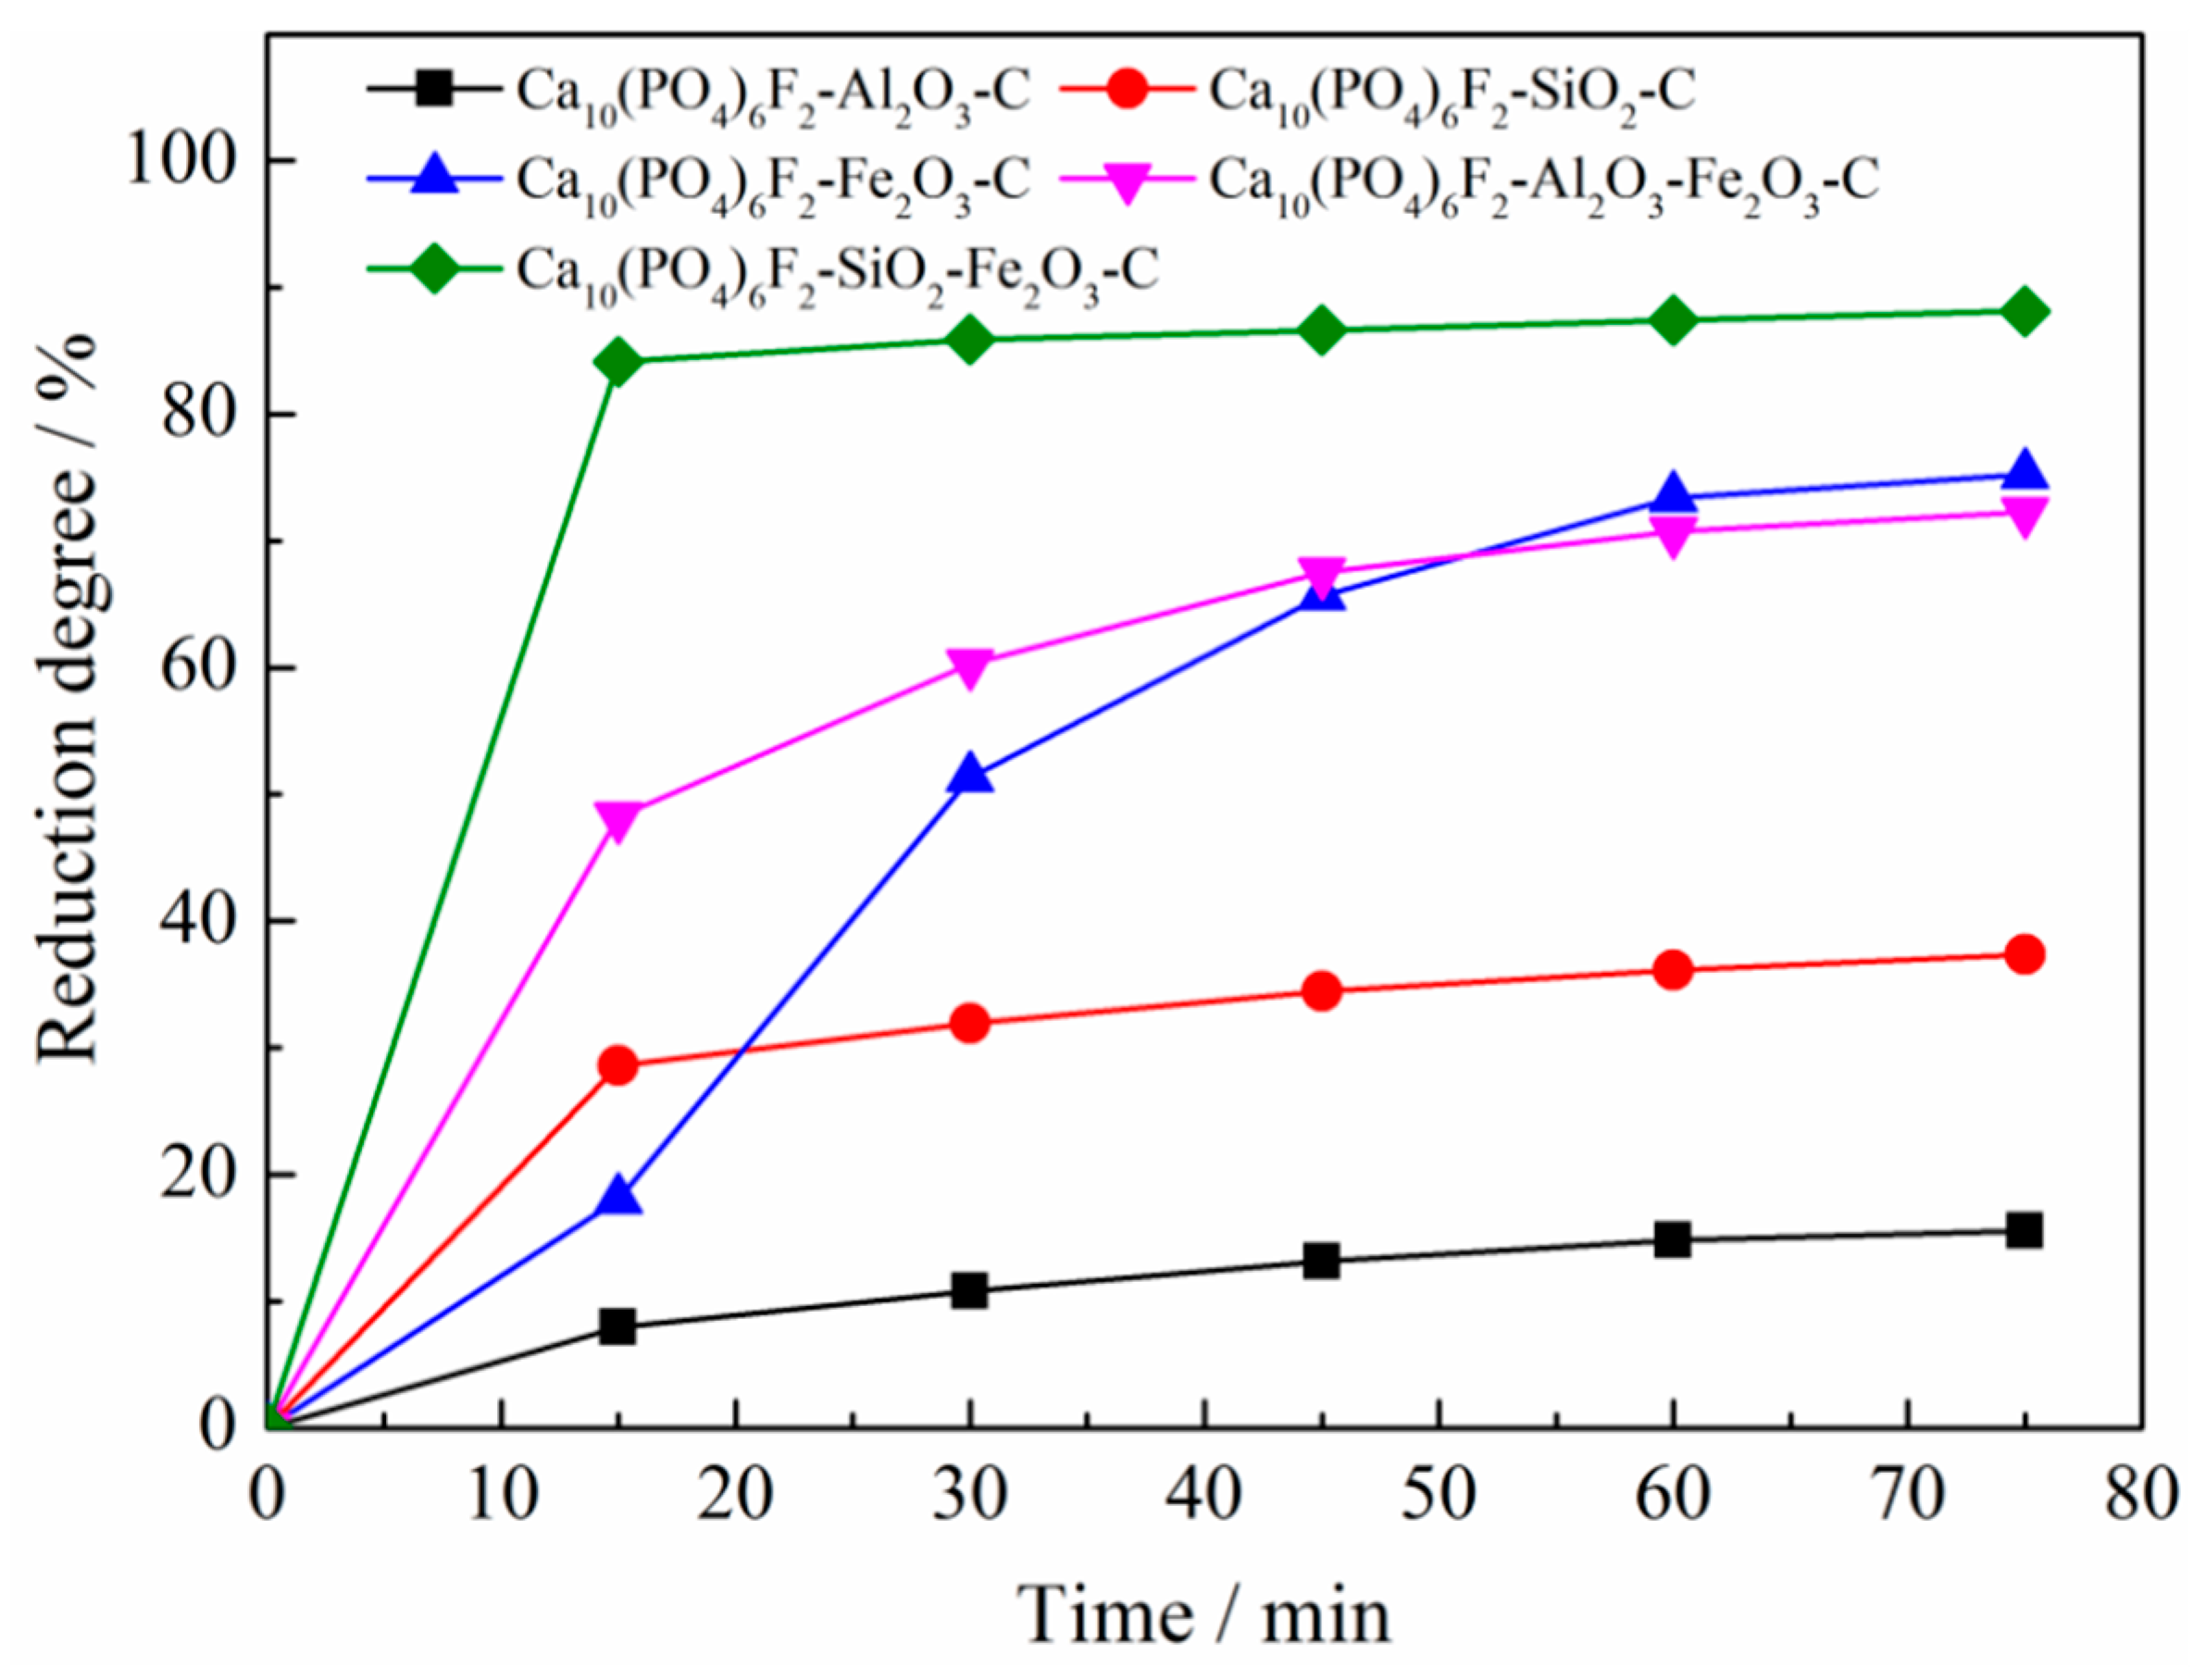
3.2.1. Effects of Reduction Time

Figure 3 indicates that the reduction degree of fluorapatite increased with the increase of reduction time when the additive was SiO2 or Al2O3. However, the content of reductant decreased gradually with the increase of reduction time; in addition, the phase interface reaction of fluorapatite was hindered by the newly formed reductive products, which resulted in the decrease of the growth rate of reduction degree. When the additive was Fe2O3, in the initial stage of the reaction, the reduction rate of metal iron increased slightly because of the small amount of iron, which promoted the reduction of fluorapatite; the growth rate of the reduction degree of fluorapatite increased first and then decreased with the increase of reduction time.

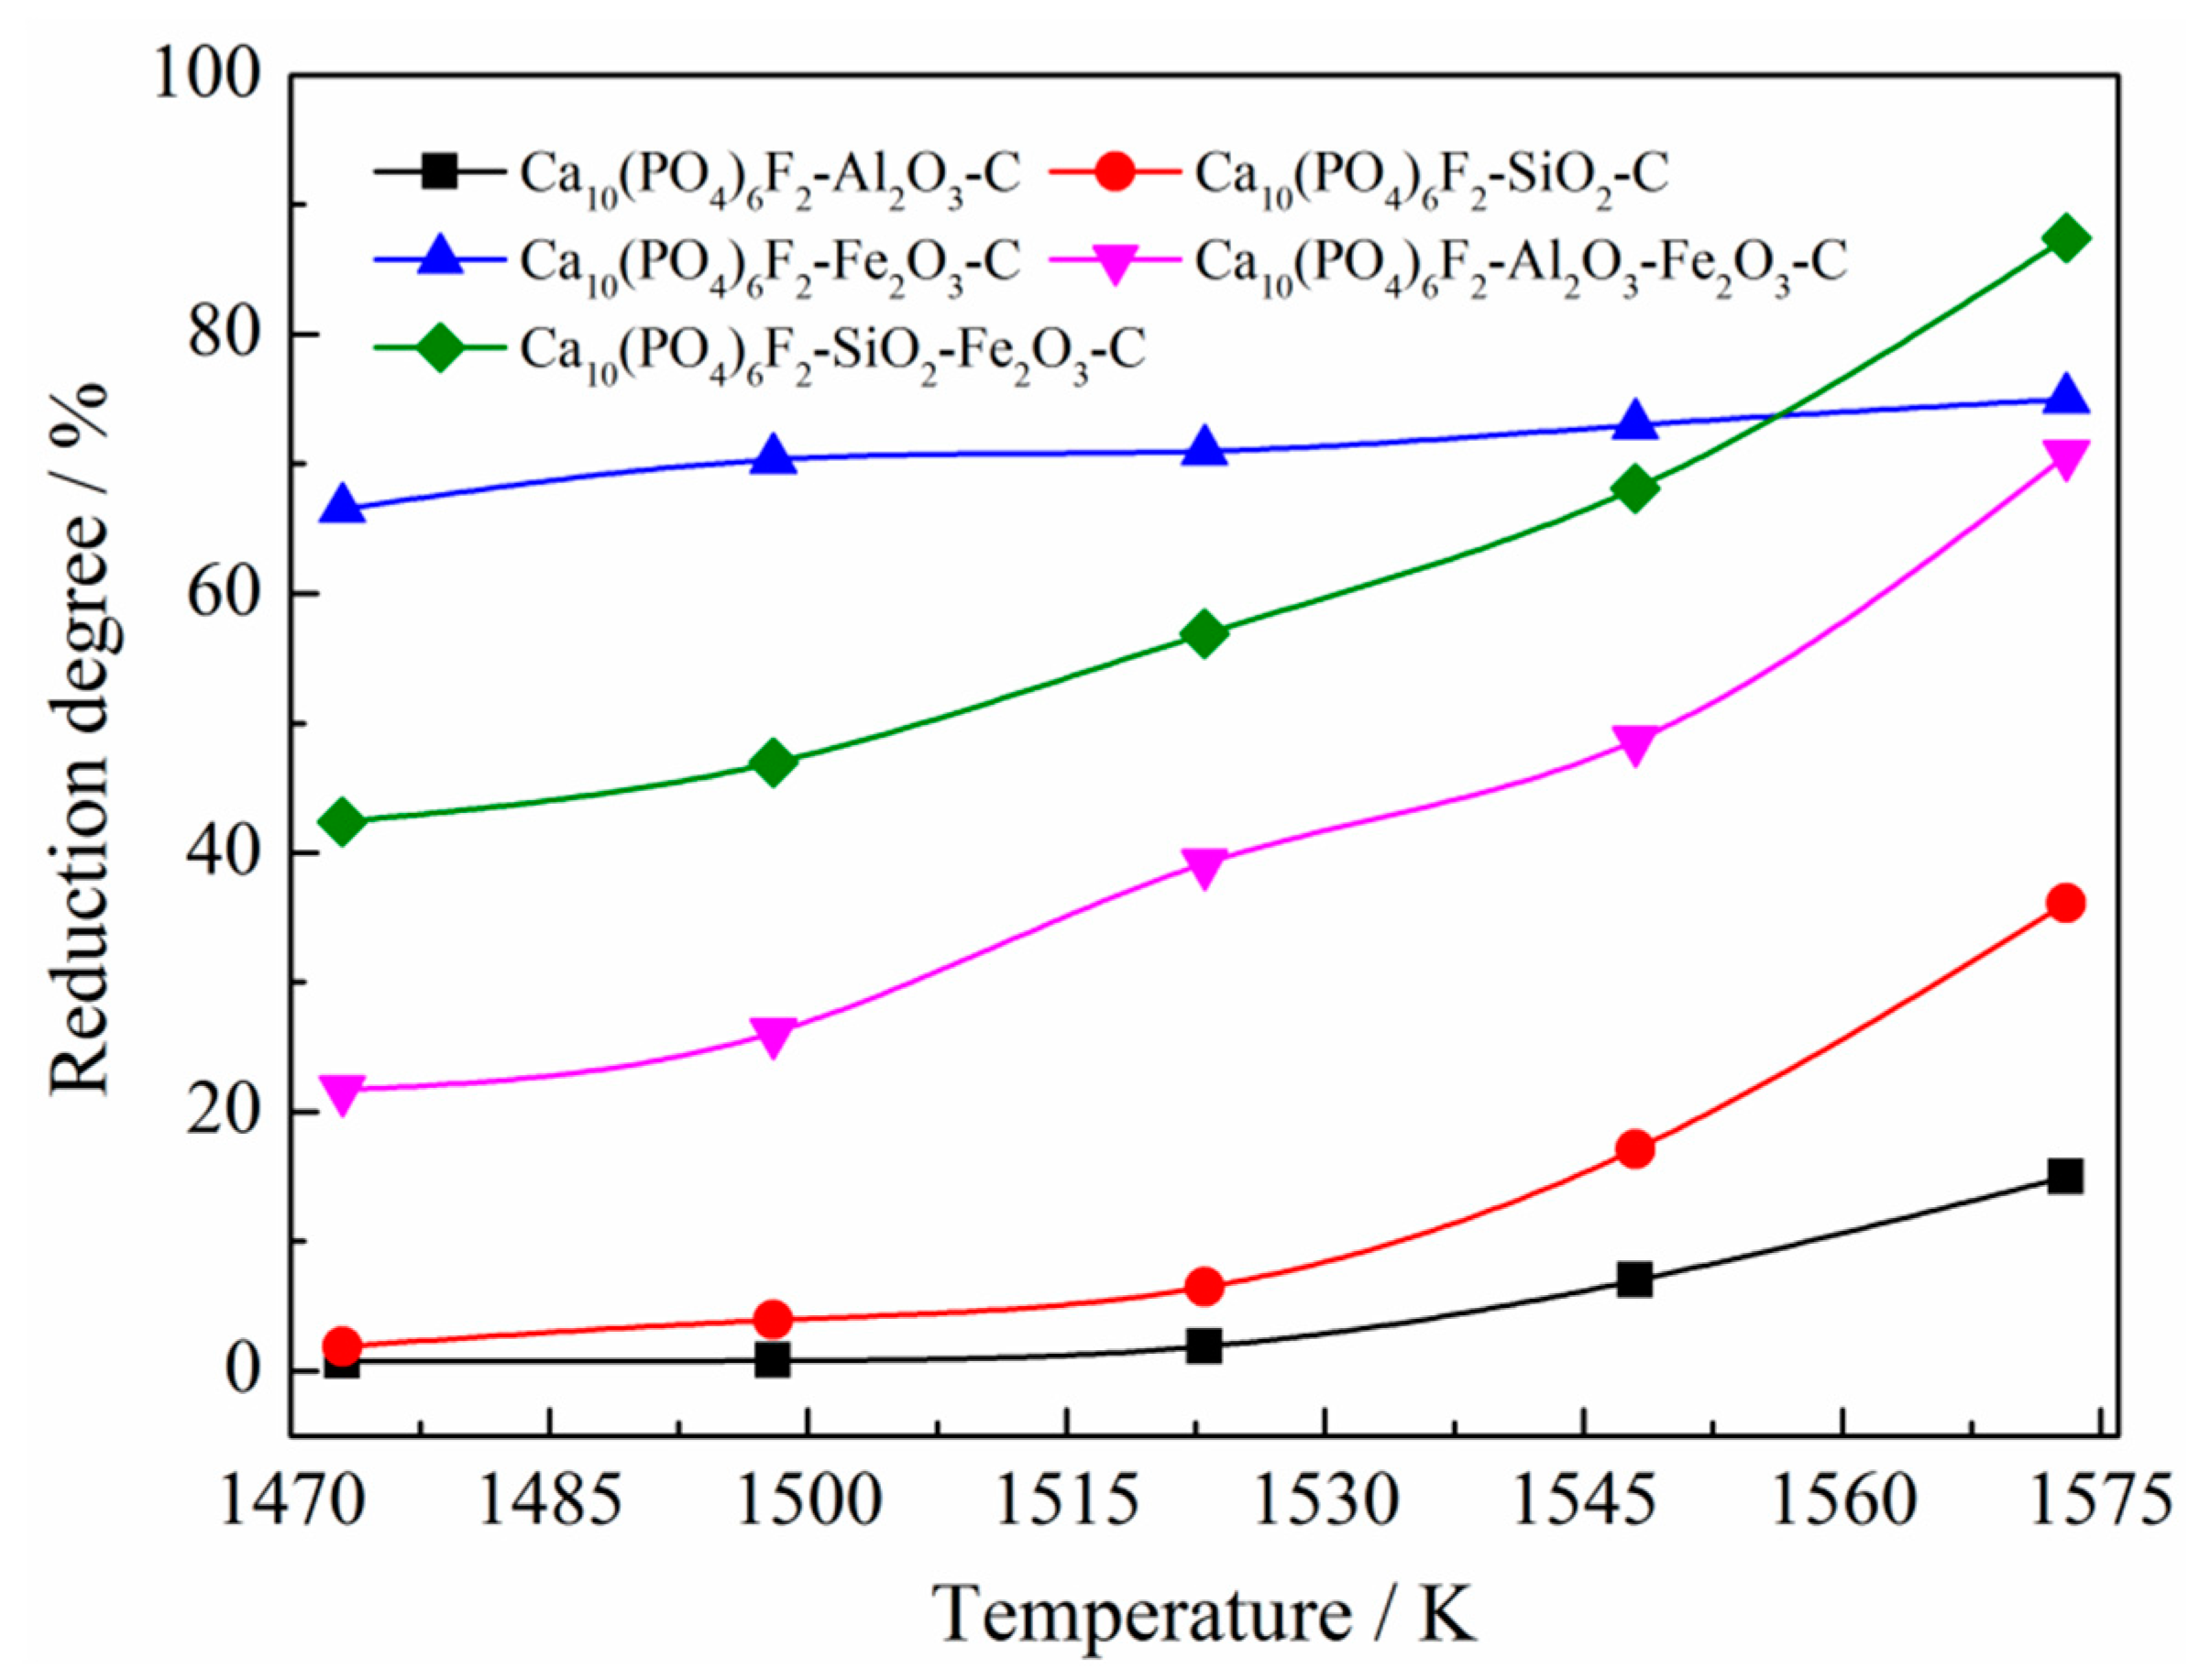
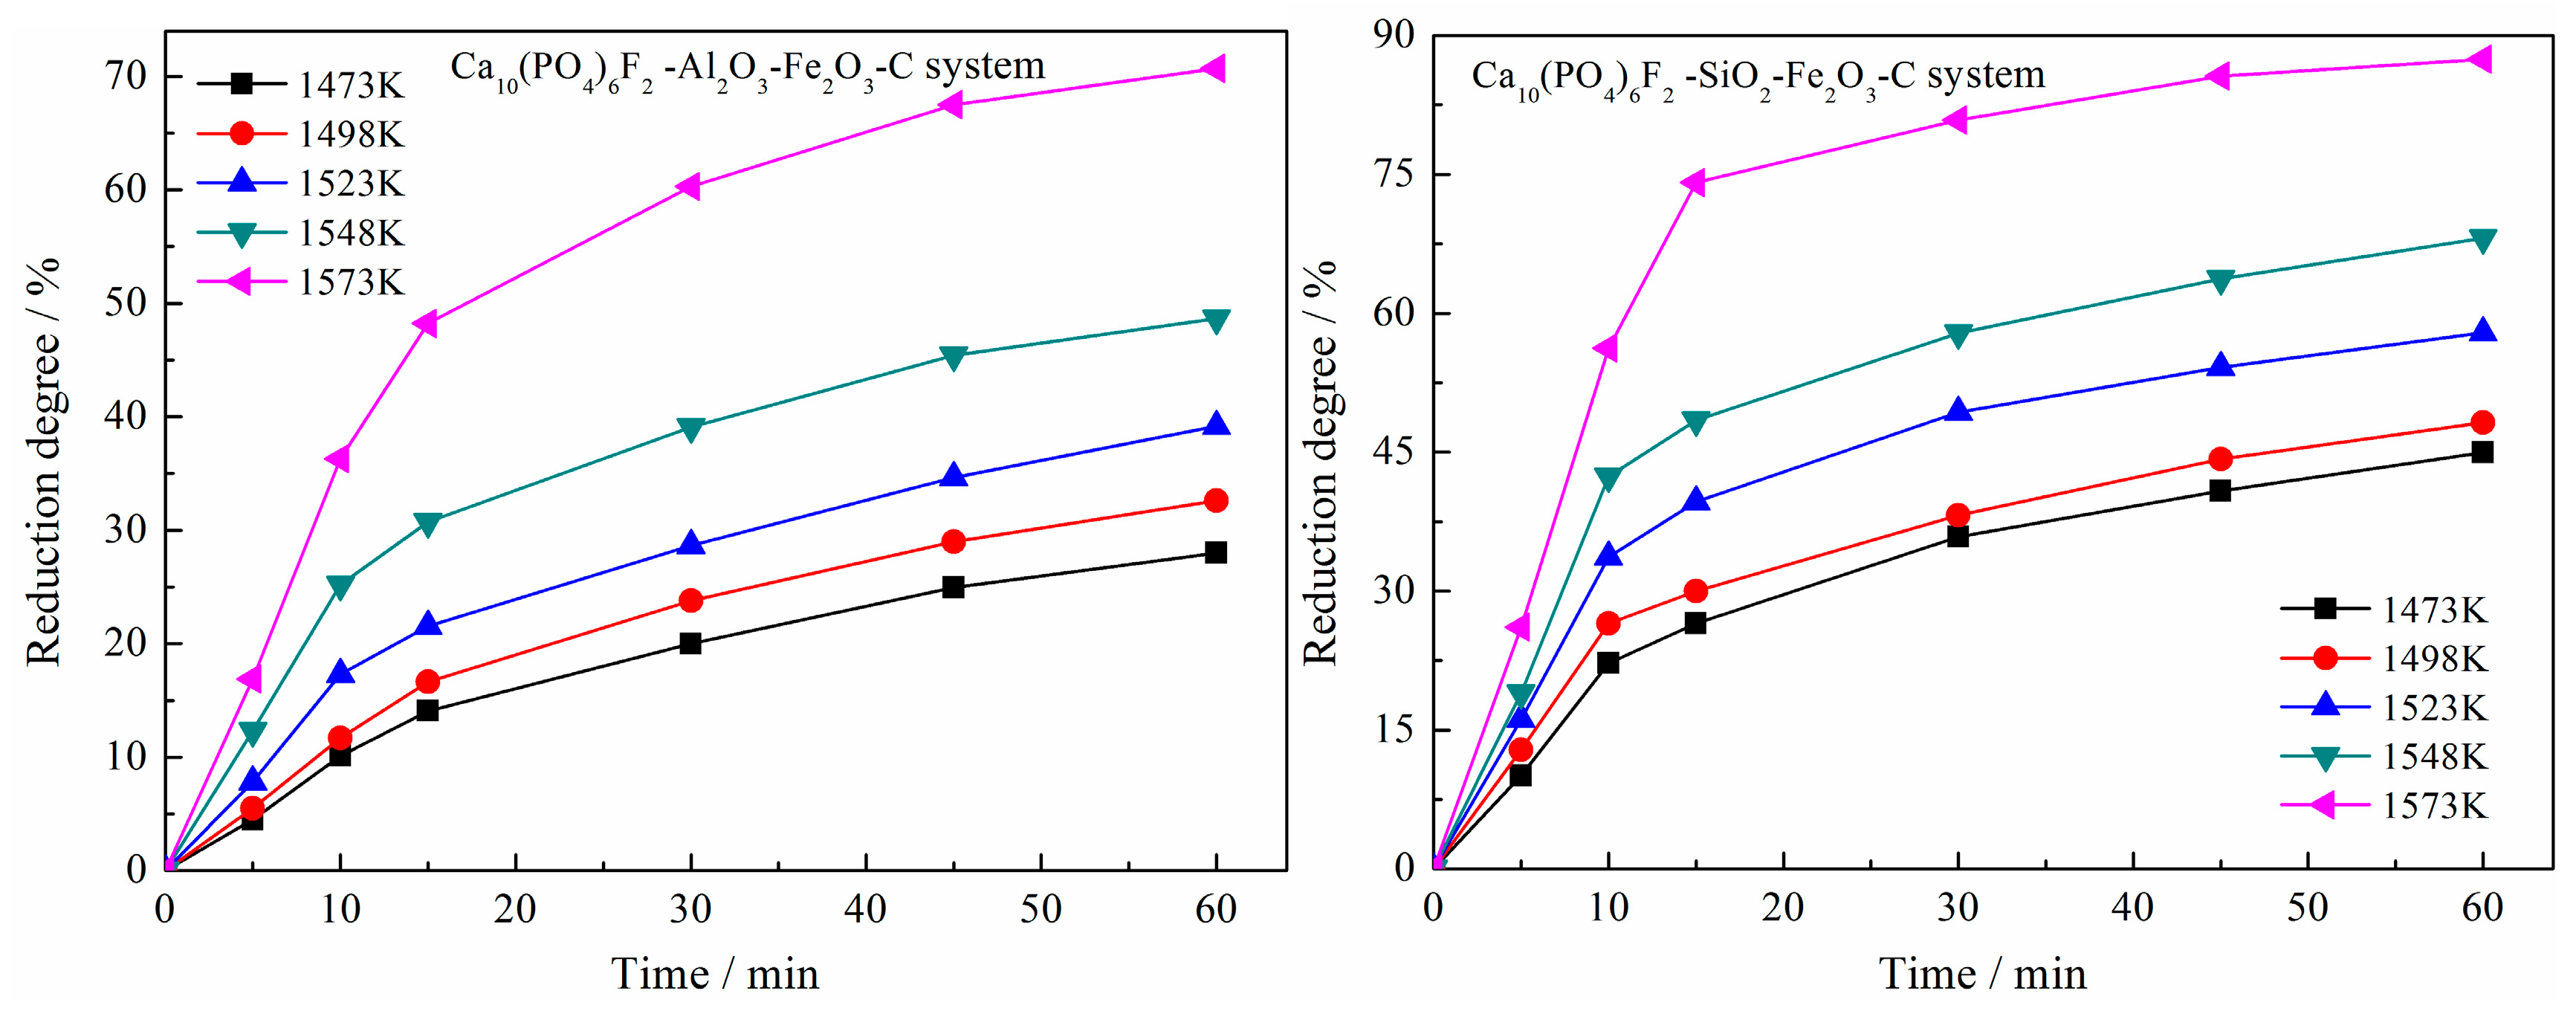
3.2.2. Effects of Reduction Temperature

Figure 4 shows that increasing the reduction temperature was conducive to the occurrence of various reduction reactions, thereby increasing the reduction degree. When the additive was Fe2O3–SiO2 or Fe2O3–Al2O3, fluorapatite was mainly reduced by carbon under the promotion of silica (alumina) at a lower reduction temperature, while iron oxide played a more prominent role at a higher temperature.

3.2.3. Effects of Carbon Content

Figure 5 exhibits that the molar ratio of C/O that was the most conducive to the reduction of fluorapatite was 2.0. Increasing the molar ratio of C/O would increase the contact area between fluorapatite and the reductant, which was conducive to the reduction of fluorapatite. When the reductant was excessive, coke would reduce the fusibility of materials and hinder the reaction between the additives and fluorapatite, which was not conducive to the reduction of fluorapatite.

3.2.4. Effects of Additive Contents

Figure 6 illustrates that the reduction degree of fluorapatite increased with the increase of the dosage of additives Al2O3, SiO2, and Fe2O3, at the following the reduction conditions: a molar ratio of C/O 2.0, reduction time of 1 h, and reduction temperature of 1300 °C. When the content ratio of Al2O3, SiO2, and Fe2O3 to fluorapatite reached 0.6, 1.8 and 1.8 in turn, the continuous increase of additives would hinder the contact between fluorapatite and the reductant. At this time, the growth rate of the reduction degree gradually approached zero or even became negative. When the mass ratios of Al2O3, SiO2, and Fe2O3 to fluorapatite are less than 0.6, 1.8, and 1.8, respectively, the reduction degree of fluorapatite increases in order of abundance with the following additives: Fe2O3, SiO2, and Al2O3.

3.3. Kinetic Analysis

The ratios of Al2O3, SiO2, and Fe2O3 to fluoroapatite in Ca10(PO4)6F2–Al2O3–Fe2O3–C and Ca10(PO4)6F2–SiO2–Fe2O3–C systems were adjusted to 0.6, 1.8, and 1.8, respectively. The coal-based reduction experiments were carried out under the conditions of a C/O molar ratio of 2.0, reduction temperatures of 1473 K, 1498 K, 1523 K, and 1573 K, and reduction times of 15 min, 30 min, 45 min, 60 min, and 75 min, respectively. The content of phosphorus in the reduction products was tested, and the relationship between the reduction degree and reduction time of fluorapatite under different conditions in the two systems were obtained as shown in Figure 7.
The reduction degree and reduction time of fluorapatite were introduced into Equation (3) at different reduction temperatures for the Ca10(PO4)6F2–Al2O3–Fe2O3–C and Ca10(PO4)6F2–SiO2–Fe2O3–C systems. Linear fitting between G(α) and the reduction time was performed under 16 kinetic mechanism function models as shown in Table 3, and the linear correlation coefficients were calculated as shown in Table 4. From the correlation coefficients in Table 4, it can be seen that the optimal kinetic mechanism functions of the reduction reaction of fluorapatite in Ca10(PO4)6F2–Al2O3–Fe2O3–C and Ca10(PO4)6F2–SiO2–Fe2O3–C systems were A1/2: 1/2(1 − α)[−ln(1 − α)]−1 and A1/3: 1/3(1 − α)[−ln(1 − α)]−2, respectively. The slope of each regression line corresponding to the mechanism function was the apparent reaction rate. The reaction rate k(T) at each temperature was substituted into Equation (3), and the linear fitting of lnk(T) and 1/T was carried out. The fitting curve was shown in Figure 8. The activation energy and pre-exponential factor of the selected reduction mechanism function of fluorapatite in Ca10(PO4)6F2–Al2O3–Fe2O3–C and Ca10(PO4)6F2–SiO2–Fe2O3–C systems were obtained by calculating the slope and intercept of the regression line, as shown in Table 5.
Comparing the two systems, the activation energy and pre-exponential factor of the reduction kinetics equation of calcium fluorophosphate in the system containing silica were significantly lower than those in the system containing alumina. The chemical reactions tended to proceed along the pathway of lower activation energy. The activation energy could be considered as the energy needed to overcome in the reaction process, which indicated that calcium fluorophosphate was easier to reduce in the system containing silica than in the system containing alumina, and this conclusion was consistent with the thermodynamic analysis results. According to the transition state theory, the chemical reaction was carried out in two steps. First, the reactant molecules collided to form an active complex; then, they decomposed into products. Therefore, the higher the number of effective collisions between molecules, the easier the chemical reactions would occur. The pre-exponential factor, which is also known as the frequency factor, depended on whether the collision between molecules was effective. The higher the number of effective collisions, the lower the frequency of collisions required, and the lower the pre-exponential factor. The pre-exponential factor in the reduction kinetics equation of calcium fluorophosphate in the system containing silica was much lower than that in the system containing alumina, which further indicated that silica could promote the reduction of calcium fluorophosphate more than alumina.

3.4. Phase Transformation

In order to explore the phase change law of the coal-based reduction process in Ca10(PO4)6F2–Al2O3–Fe2O3–C, an X-ray diffraction analyzer (XRD) was used to analyze the phase change at reduction temperatures of 1473 K, 1523 K, and 1573 K respectively, with a reduction time of 60 min, a molar ratio of C/O of 2.0, a dosage ratio of additives Al2O3 and Fe2O3 to Ca10(PO4)6F2 of 0.6 and 2.2. The results are shown in Figure 9.
Figure 9 shows that the XRD spectra of the reduced products appeared at diffraction peaks for Ca10(PO4)6F2, Al2O3, Fe3O4, CaAl12O19, and Fe3P when the reduction temperature was 1473 K. At this time, the intensity of the diffraction peaks of Fe3P and CaAl12O19 was relatively weak, which indicated that the reduction reaction of fluorapatite occurred mainly under the co-promotion of elemental iron and alumina at lower reduction temperatures. When the reduction temperature was 1523 K, a new diffraction peak of Ca3(PO4)2 appeared in the XRD diagram, the relative intensity of the diffraction peaks of Fe3P and CaAl12O19 increased, and the number of the diffraction peaks of Fe3P increased, while the relative intensity of the diffraction peaks of Ca10(PO4)6F2 and Al2O3 decreased significantly. This phenomenon shows that with the increase of the reduction temperature, the effect of metal iron on the reduction of apatite increased. When the reduction temperature was 1573 K, the diffraction peaks of CaAl4O7 appeared; at present, the number of diffraction peaks of CaAl12O19 increased and the relative intensity increased. The relative intensity of the diffraction peaks of Fe3P and Ca3(PO4)2 increased, while the relative intensity of the diffraction peaks of Ca10(PO4)6F2 and Al2O3 continued to decrease. The reaction process of the above reaction could be greatly promoted, and CaAl4O7 could be produced by the interaction of fluorapatite and alumina.
At different reduction temperatures, the coal-based reduction products of the Ca10(PO4)6F2–SiO2–Fe2O3–C system were analyzed by XRD under a reduction time of 60 min, C/O molar ratio of 2.0, and SiO2 and Fe2O3 to Ca10(PO4)6F2 content ratios of 1.8 and 1.8, respectively. The results are shown in Figure 10.
Figure 10 shows that when the reduction temperature was 1473 K, the diffraction peaks of Ca10(PO4)6F2, SiO2, Fe3O4, Fe3P, Ca3Si2O7, and CaSiO3 appeared. With the increase of reduction temperature, no new peaks appeared, but the relative intensity of the peaks of Fe3P, Ca3Si2O7, and CaSiO3 increased, while the relative intensity of the diffraction peaks of Ca10(PO4)6F2 and SiO2 decreased significantly. The results show that when the reduction temperature was 1473 K, calcium fluorophosphate was reduced by carbon with the promotion of silicon dioxide and iron to form Fe3P, Ca3Si2O7, and CaSiO3 products. The increase of temperature promoted the reaction process, but no new reaction occurred, which indicated that the initial temperature of each reaction was lower under the promotion of both silicon dioxide and iron.

3.5. Morphology Structure Characterization

The reduction products of the Ca10(PO4)6F2–Al2O3–Fe2O3–C system were analyzed by elemental scanning electron microscopy (SEM/EDS) under the conditions of a reduction temperature of 1473 K and reduction time of 60 min. The results are shown in Figure 11.
It can be seen from Figure 11 that the main elements in the gray–white area in point 1 were Ca, P, O, and a small amount of F, which was composed of fluorapatite that has not been reduced. The bright white area in point 2 mainly contained Fe and a small amount of P, which indicated that only a small amount of fluorapatite was reduced in the area where point 1 is located. The area in point 3 mainly contained Al, O, and Ca elements, which was composed of calcium aluminate and unreacted alumina. The above analysis shows that when the reduction temperature was 1473 K, fluorapatite reacted mainly with alumina and carbon, and the phosphorus content in the ferrous phase was less, and the promotion effect of ferrous metal on the reduction of fluorapatite was weaker.
The reduction products of the Ca10(PO4)6F2–Al2O3–Fe2O3–C system were analyzed by elemental scanning electron microscopy (SEM/EDS) under the conditions of a reduction temperature of 1573 K and a reduction time of 10 min. The results are shown in Figure 12.
Figure 12 indicates that the gray–black area in point 6 was mainly composed of alumina, while the area in point 4 was a metal iron particle, which contained a certain amount of phosphorus, indicating that the metal iron played a certain role in promoting the reduction of fluorapatite. It can be seen from the surface scan that the gray–white area in point 5 contained many fine iron particles on the surface of alumina. The EDS energy spectrum shows that the area was mainly composed of calcium aluminate, which was the reaction product of fluorapatite and alumina. The above analysis shows that fluorapatite could be reduced by carbon under the co-promotion of alumina and iron at 1573 K.
The reduction products of the Ca10(PO4)6F2–Al2O3–Fe2O3–C system were analyzed by elemental scanning electron microscopy (SEM/EDS) under the conditions of a reduction temperature of 1573 K and reduction time of 60 min. The results are shown in Figure 13.
Figure 13 states clearly that the content of P was very low outside the ferrous metal area in point 8, while the content of P in the ferrous metal area was relatively high, which indicated that the fluorapatite in the area in point 8 had been reduced completely. Comparing the EDS spectra in points 7 and 9, it can be seen that the relative content of Ca was higher near the metal iron phase. Combining with thermodynamic analysis, it can be seen that the metal iron promoted the formation of calcium aluminate.
The reduction products of the Ca10(PO4)6F2–SiO2–Fe2O3–C system were analyzed by elemental scanning electron microscopy (SEM/EDS) under the conditions of a reduction temperature of 1473 K and reduction time of 60 min. The results are shown in Figure 14.
Figure 14 exhibits that the bright white area in point 1 was mainly composed of iron and phosphorus, the gray white area in point 2 was mainly composed of silica, fluorapatite, and calcium silicate, and the gray black area in point 3 was composed of silica.
The reduction products of the Ca10(PO4)6F2–SiO2–Fe2O3–C system were analyzed by elemental scanning electron microscopy (SEM/EDS) under the conditions of a reduction temperature of 1573 K and reduction time of 10 min. The results are shown in Figure 15.
Figure 15 shows the phosphorus content in the gray–white area of point 5 was low, and the area was almost composed of calcium silicate, while the phosphorus content in the iron particles of point 4 was relatively high, which indicated that the fluorapatite in the area of point 5 was almost completely reduced by the action of nearby metal iron and silicon dioxide.
The reduction products of the Ca10(PO4)6F2–SiO2–Fe2O3–C system were analyzed by elemental scanning electron microscopy (SEM/EDS) under the conditions of a reduction temperature of 1573 K and reduction time of 60 min. The results are shown in Figure 16.
Figure 16 shows that there was no fluorapatite aggregate in the region, and the P element was almost completely present in the ferrous phase of the region in point 7. The structure of SiO2 was completely destroyed. The dark gray part of point 9 was residual SiO2, and the light gray part of point 8 was mainly composed of calcium silicate.
From the above analysis, silica (or alumina) promoted the reduction of fluorapatite by forming calcium silicate (or calcium aluminate) at the contact surface with fluorapatite. At a lower reduction temperature or early stage of the reduction reaction, CaSiO3(or CaAl12O19) was mainly formed by the interaction of calcium fluorophosphate and silica (or alumina), while Ca3Si2O7(or CaAl4O7) and calcium fluorophosphate were produced by the interaction with silica (or alumina). The fluorine reaction mainly occurred in the middle and late stages of the reduction reaction and at a higher reduction temperature. With the prolongation of reduction time, the position of reaction between fluorapatite and silica (or alumina) extended from the two-phase contact to the inner phase. The structure of fluorapatite and silica (or alumina) was gradually destroyed, and the reduction degree of fluorapatite was greatly improved. The reduction product of iron oxide could react with fluorapatite to form calcium oxide and iron phosphide. The reaction mainly occurred at the interface between iron particles and fluorapatite. Increasing the reduction temperature and prolonging the reduction time were conducive to the growth of iron particles and the reduction of fluorapatite. When the additives were silicon dioxide, alumina, and iron oxide, the effect of metal iron on the reduction of fluorapatite was lower at a lower reduction temperature or shorter reduction time, but with the increase of the reduction temperature and longer reduction time, the effect of metal iron became larger.

4. Conclusions

(1)
The effect of SiO2 and Fe2O3 on reducing the initial reduction temperature of fluorapatite was stronger than that of Al2O3 and Fe2O3; the initial reduction temperature of fluorapatite was reduced to 985 °C and 1059 °C, respectively. When the mass ratios of Al2O3, SiO2, and Fe2O3 to fluorapatite were less than 0.6, 1.8, and 1.8, respectively, the reduction reaction of fluorapatite could be promoted by increasing the dosage of silica, iron oxide, carbon, reduction time, and reduction temperature.
(2)
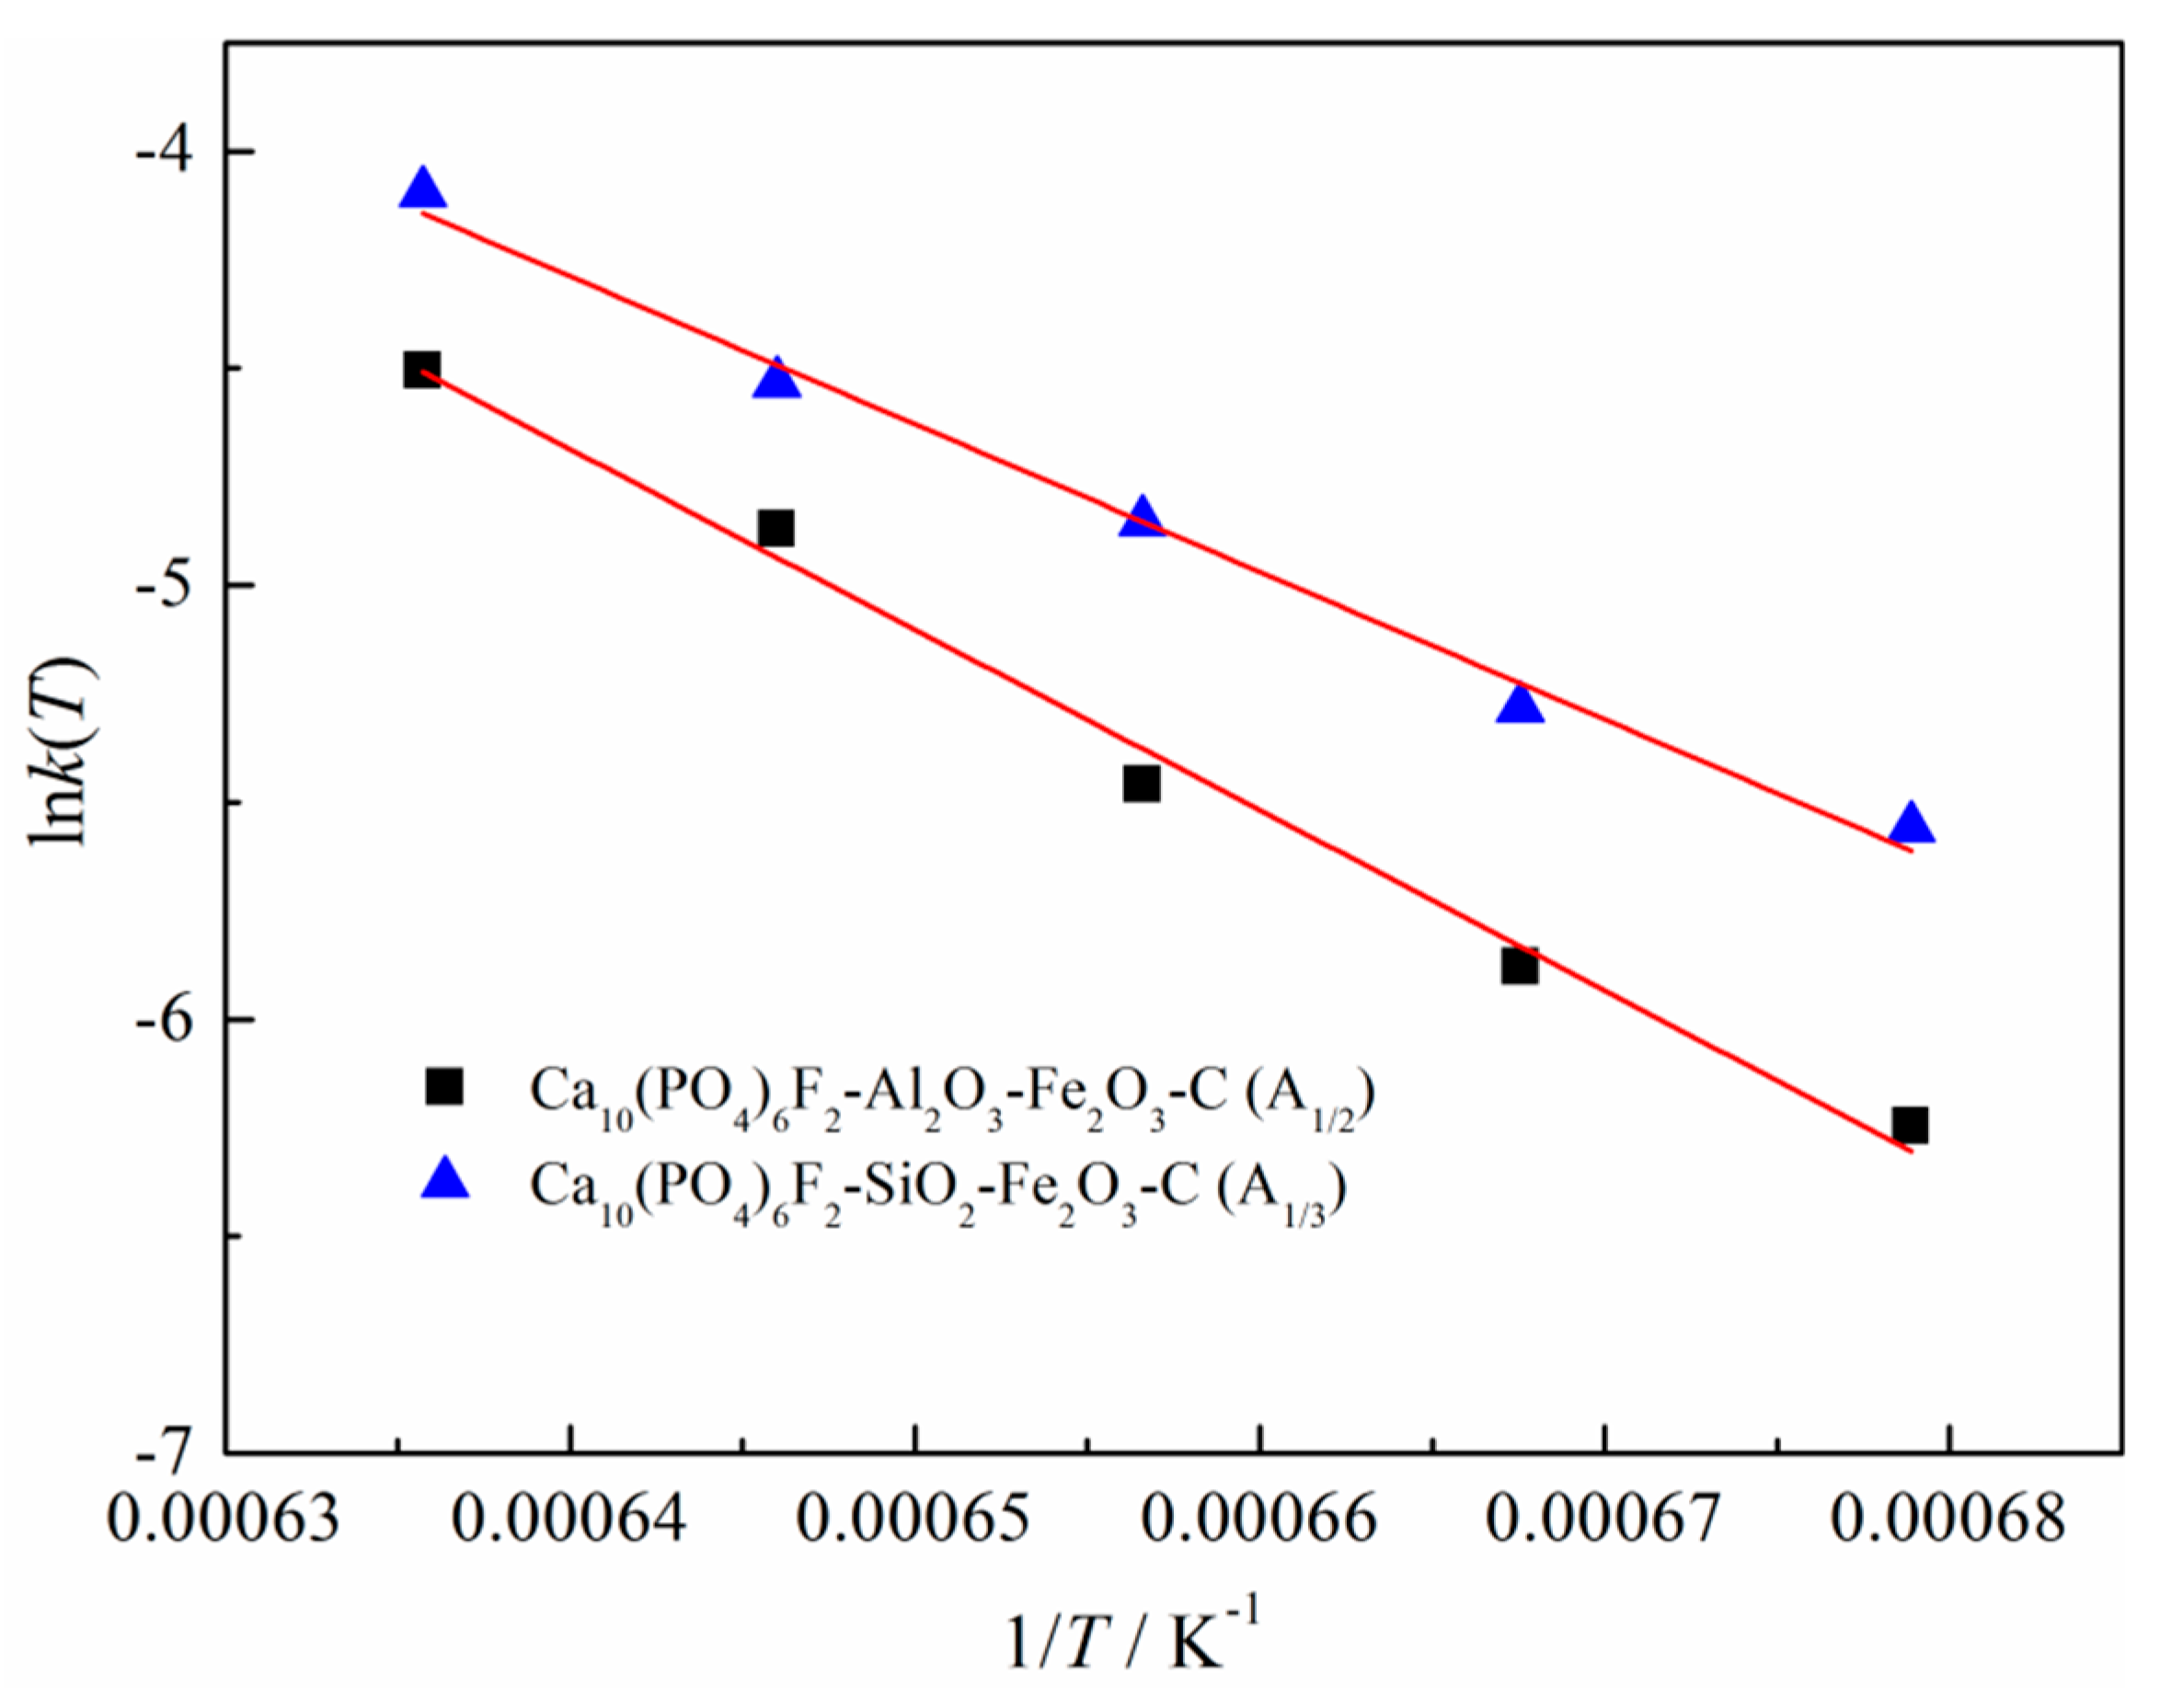
The best kinetic mechanism functions of the SiO2–Fe2O3–C system and the Al2O3–Fe2O3–C system were A1/3 = 1/3(1 − α)[−ln(1 − α)]−2 and A1/2 = 1/2(1 − α)[−ln(1 − α)]−1, respectively. Among them, the pre-exponential factor of the kinetics equation of fluorapatite reduction with the Al2O3 system was 3.26789 × 10⁹ min−1, the activation energy was 345.479 kJ/mol, the pre-exponential factor of the kinetics equation with the SiO2 system was 3.89033 × 10⁷ min−1, and the activation energy was 282.748 kJ/mol. The activation energy and pre-exponential factor of the reduction kinetics equation in the system containing silica were significantly lower than those in the system containing alumina, which explained that the catalytic effect of silica on the reduction of calcium fluorophosphate was far greater than that of alumina.
(3)
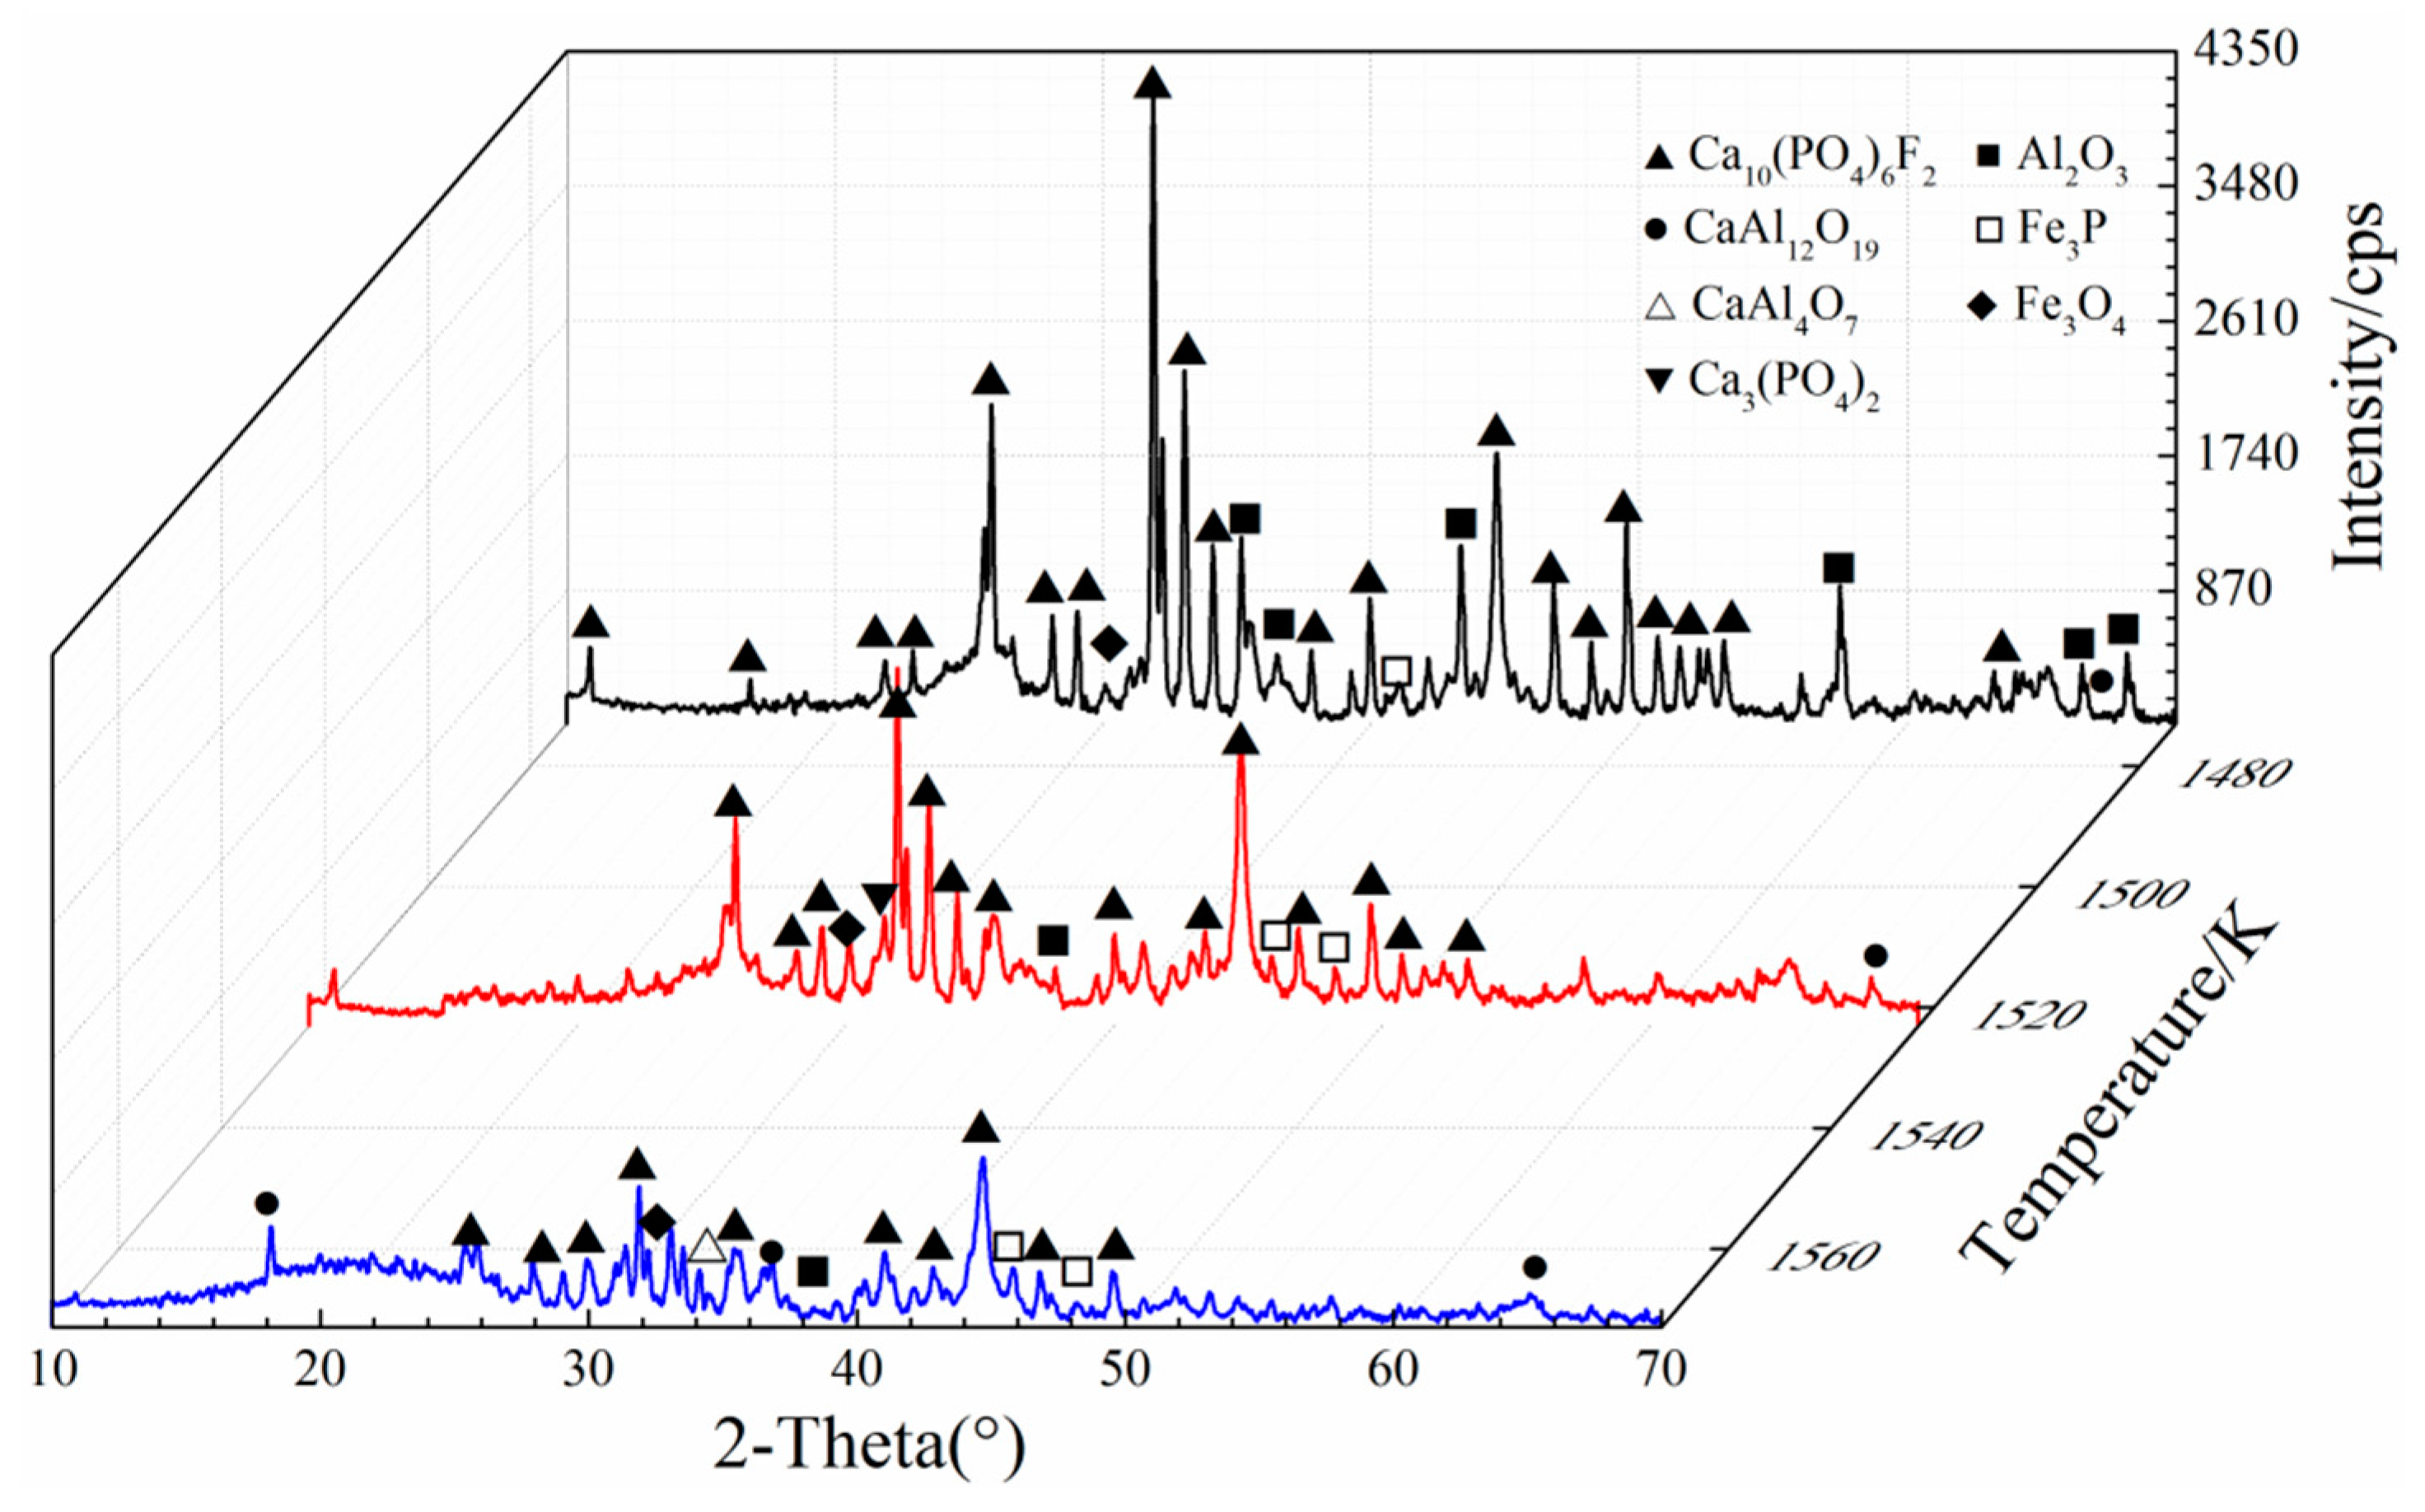
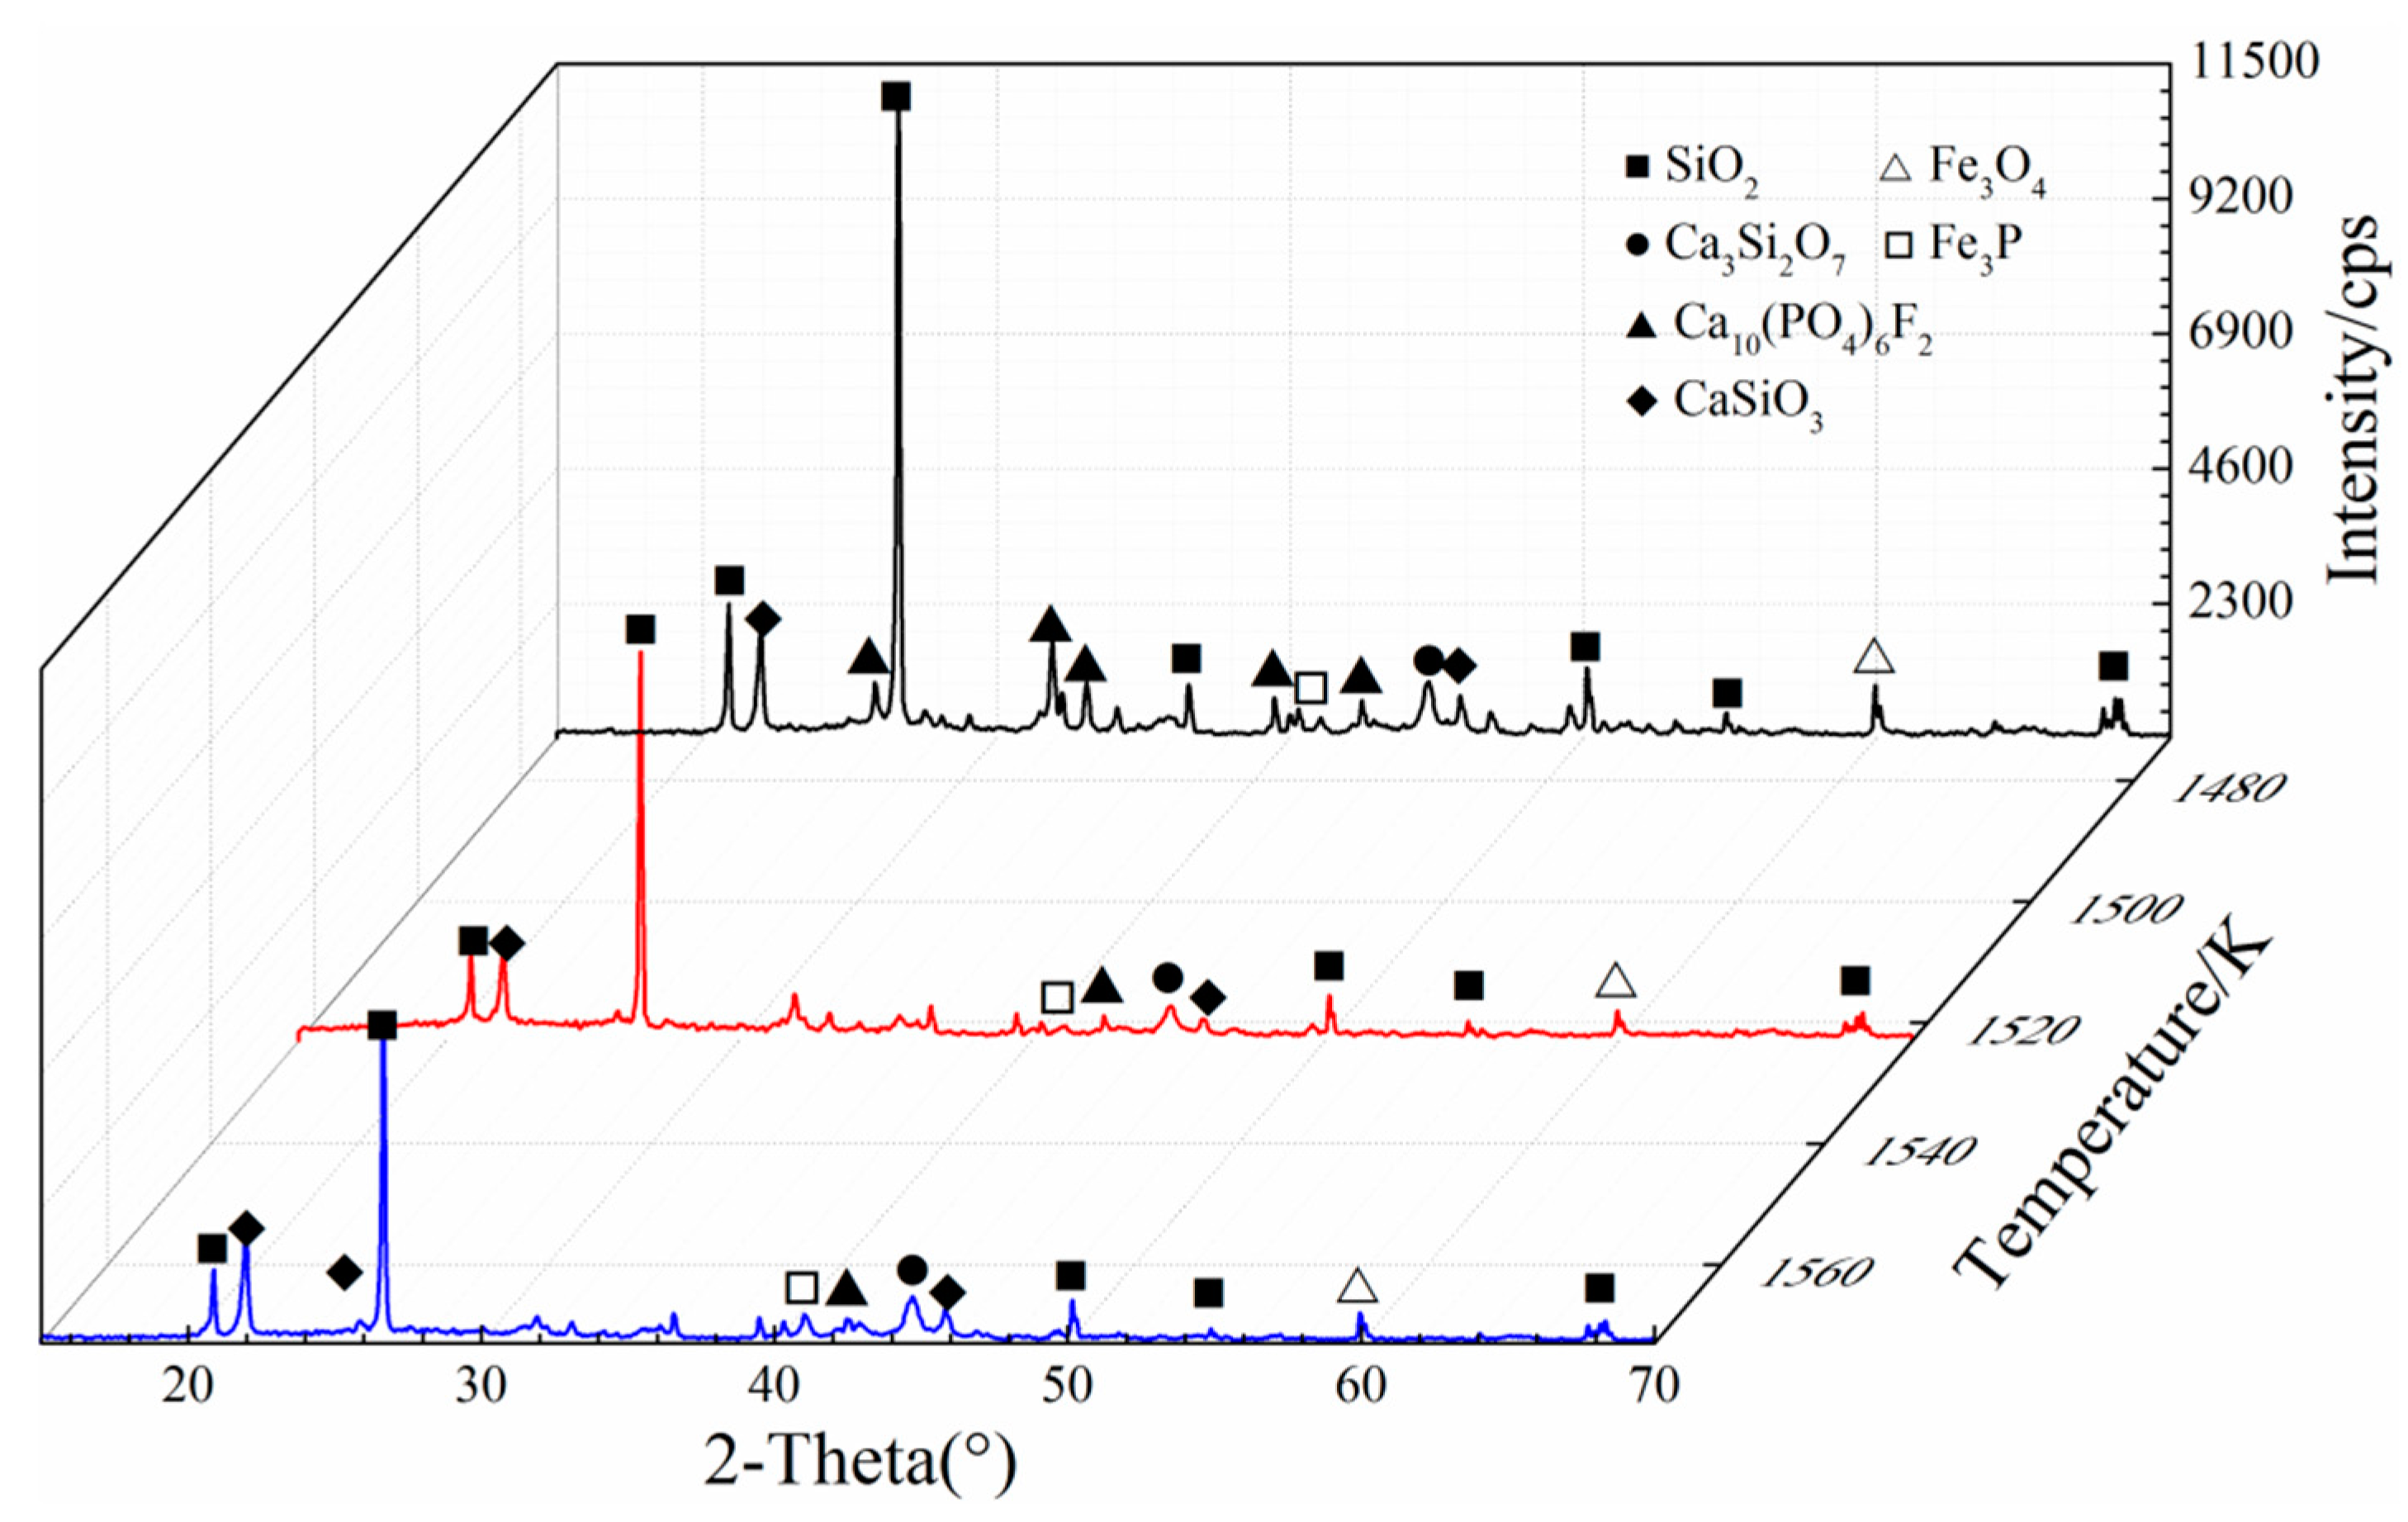
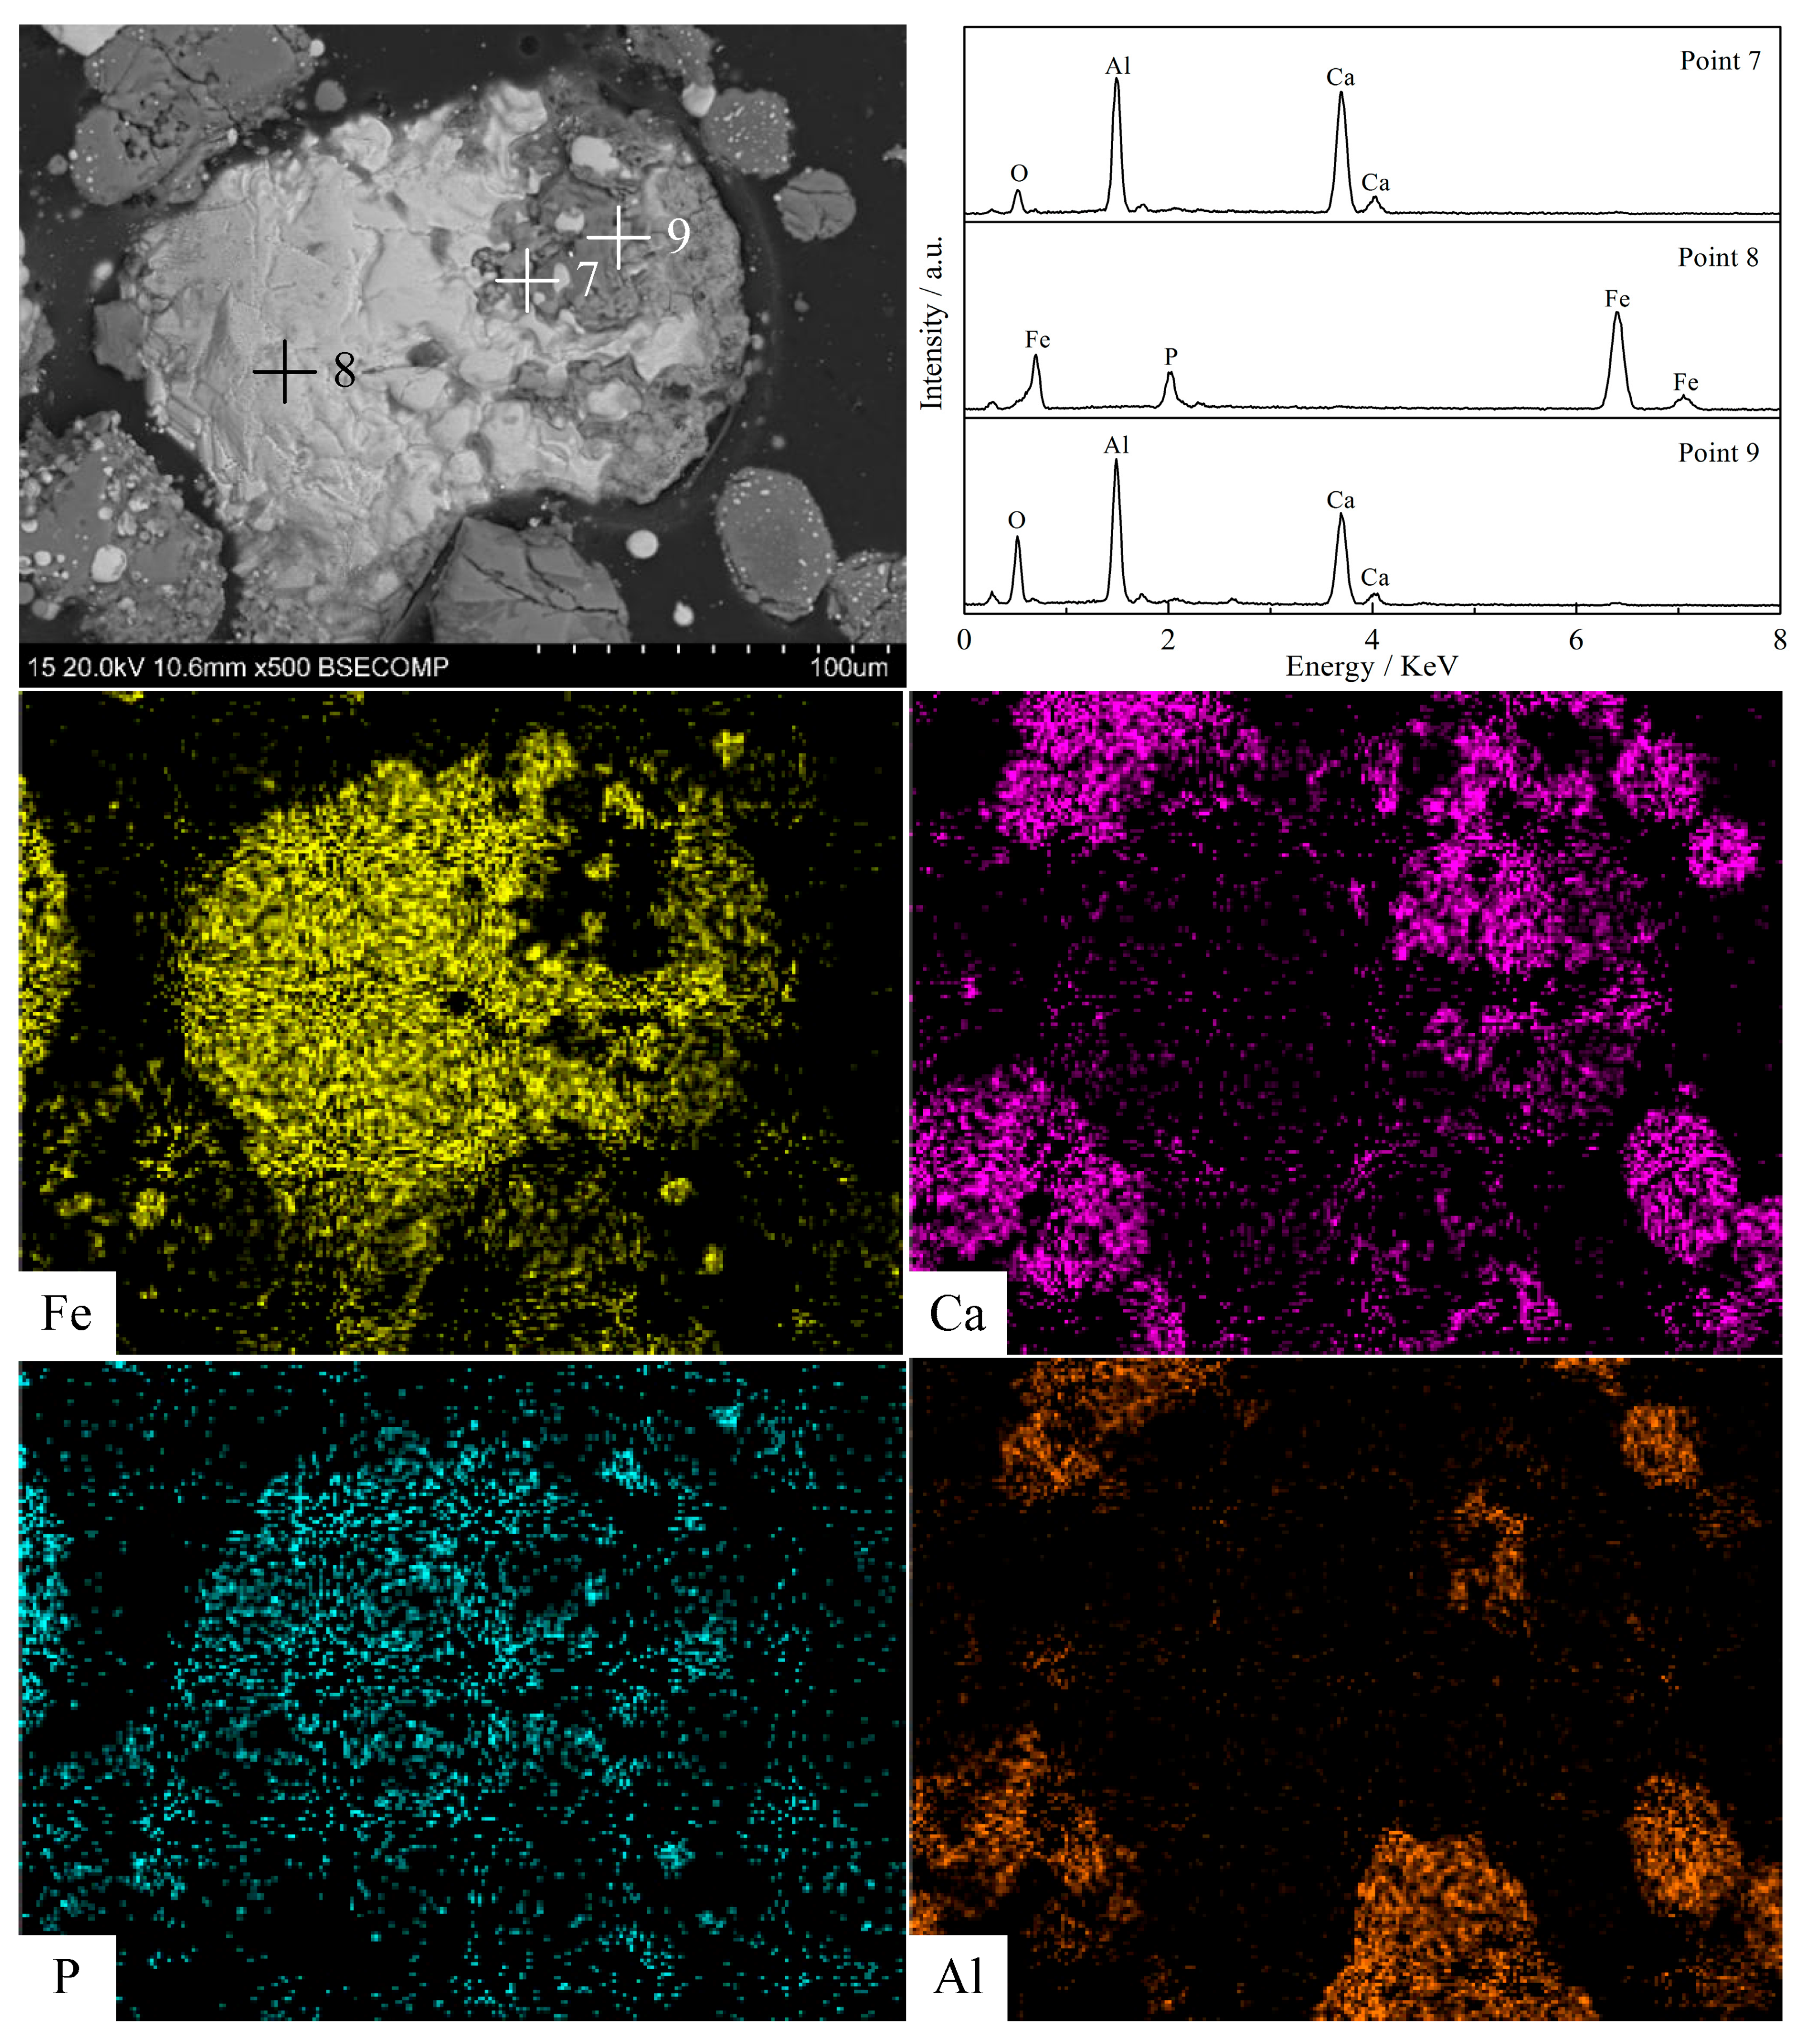
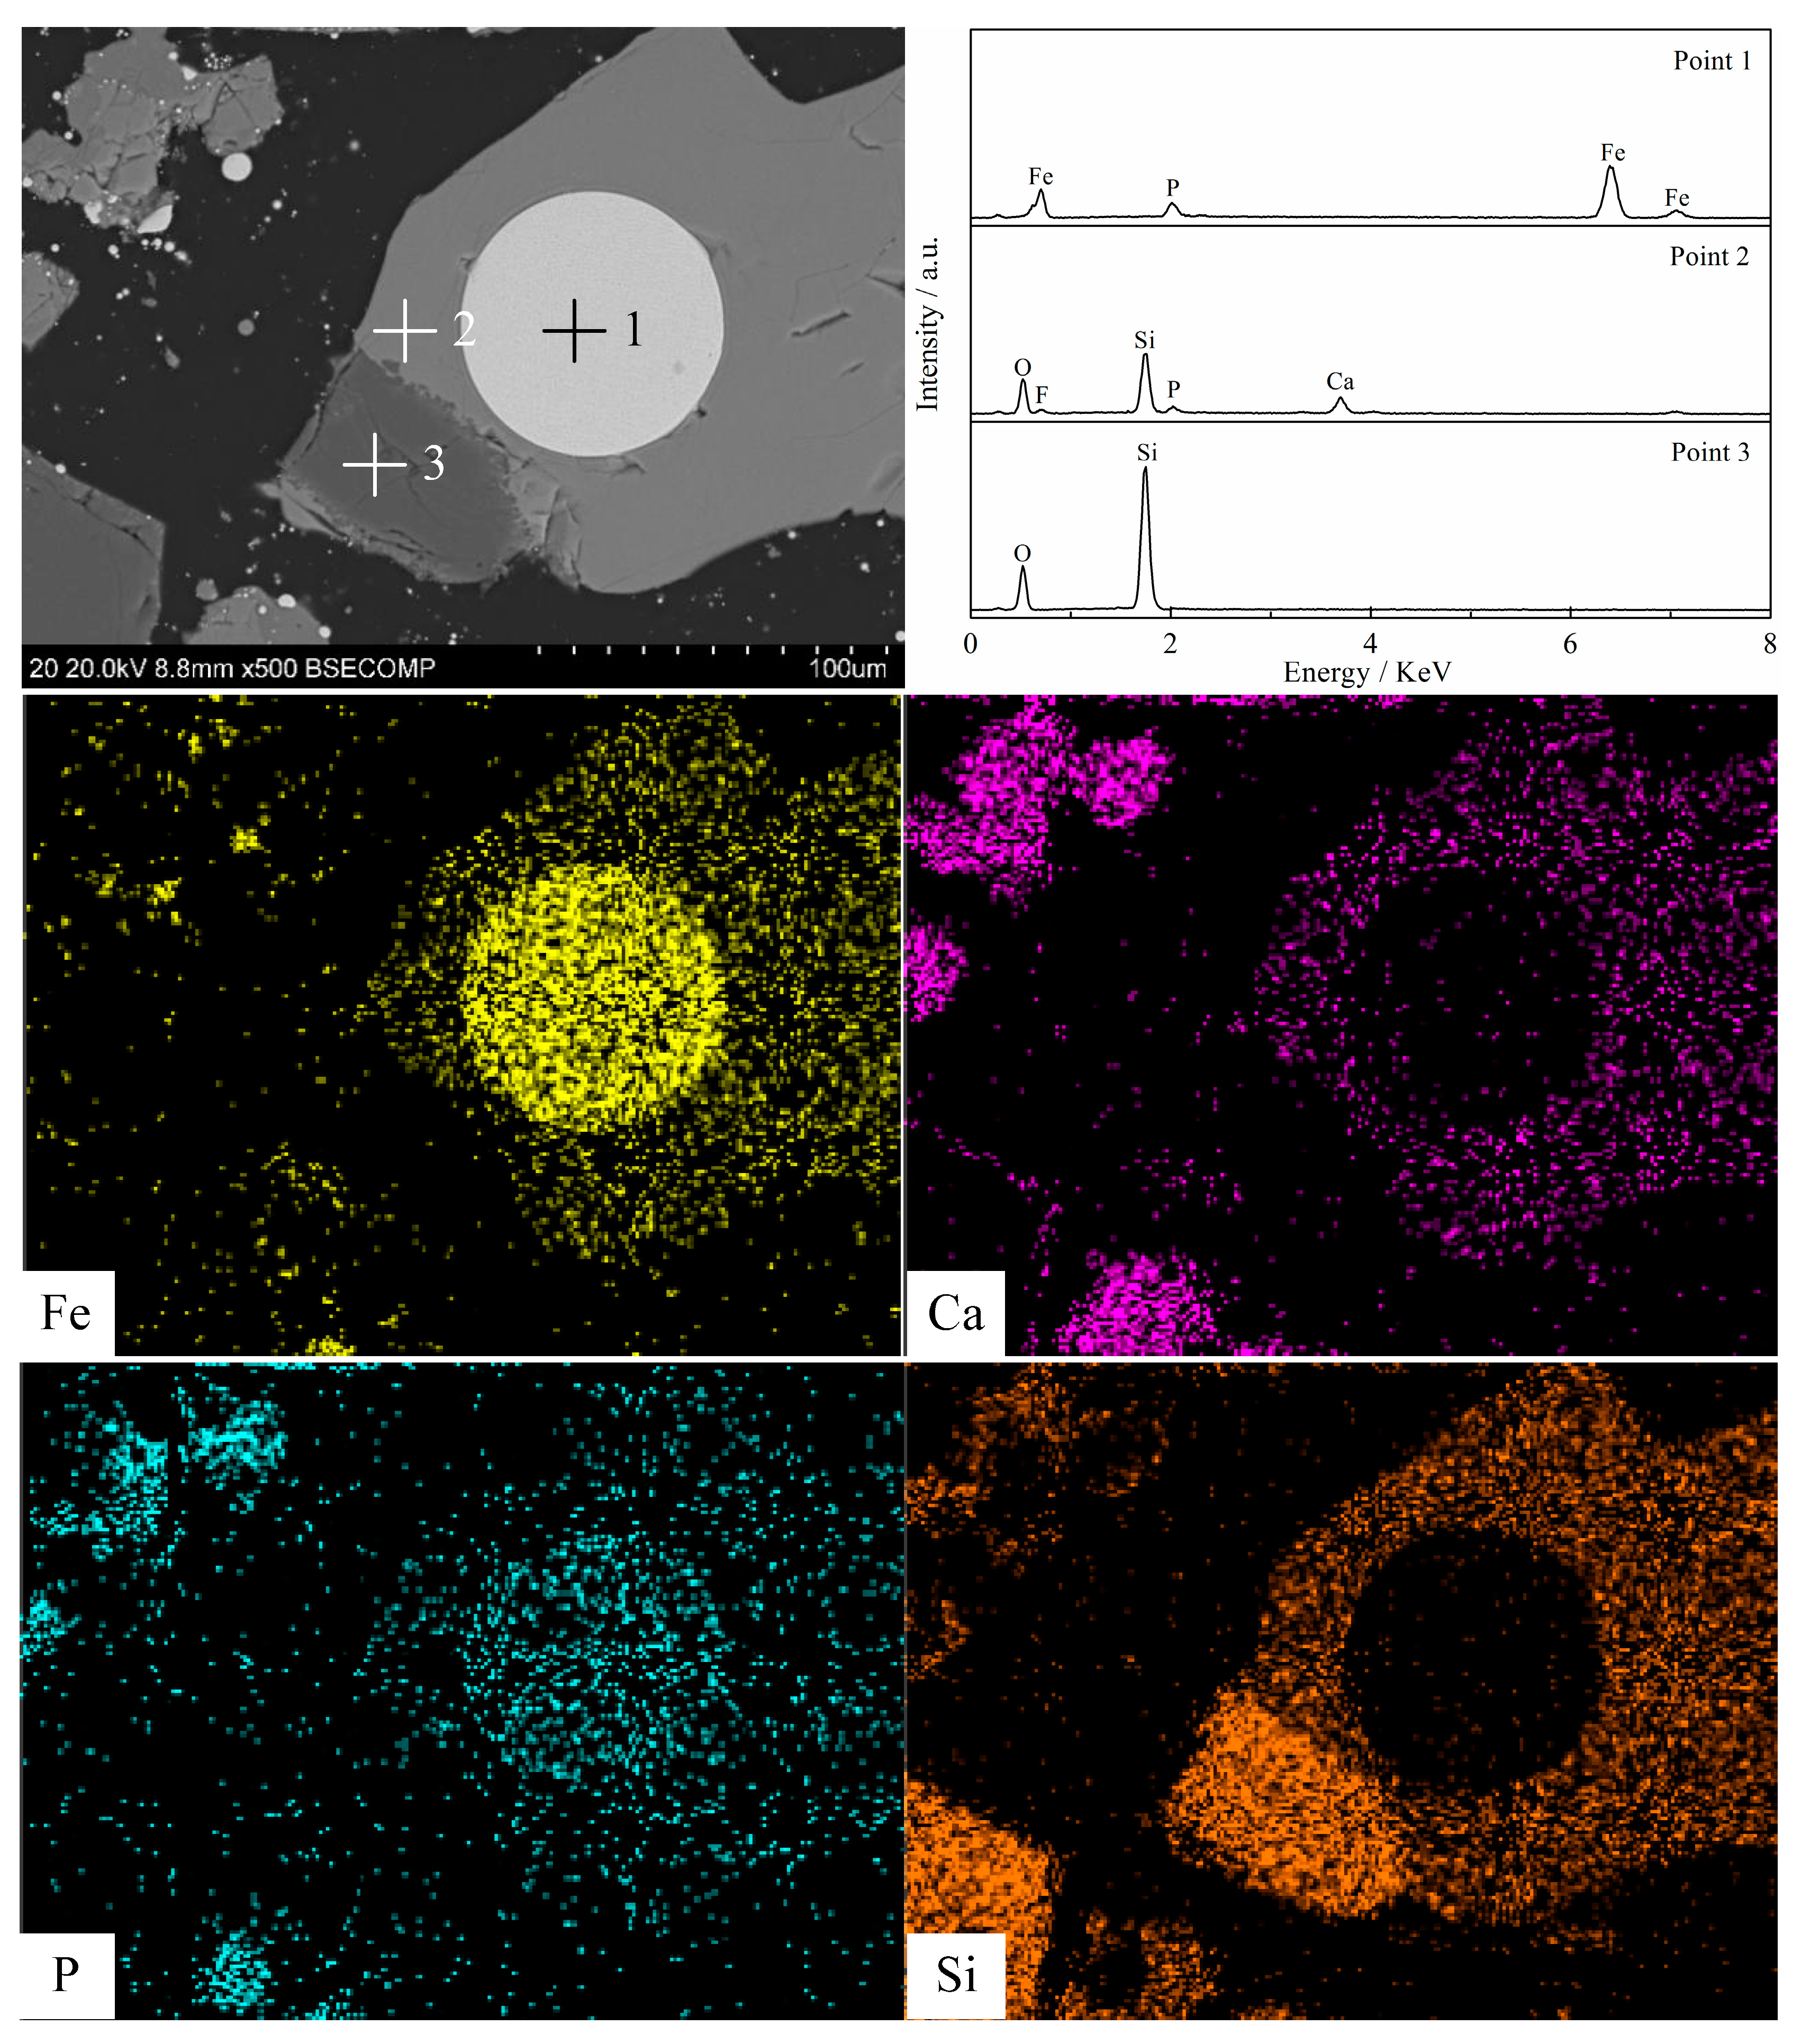
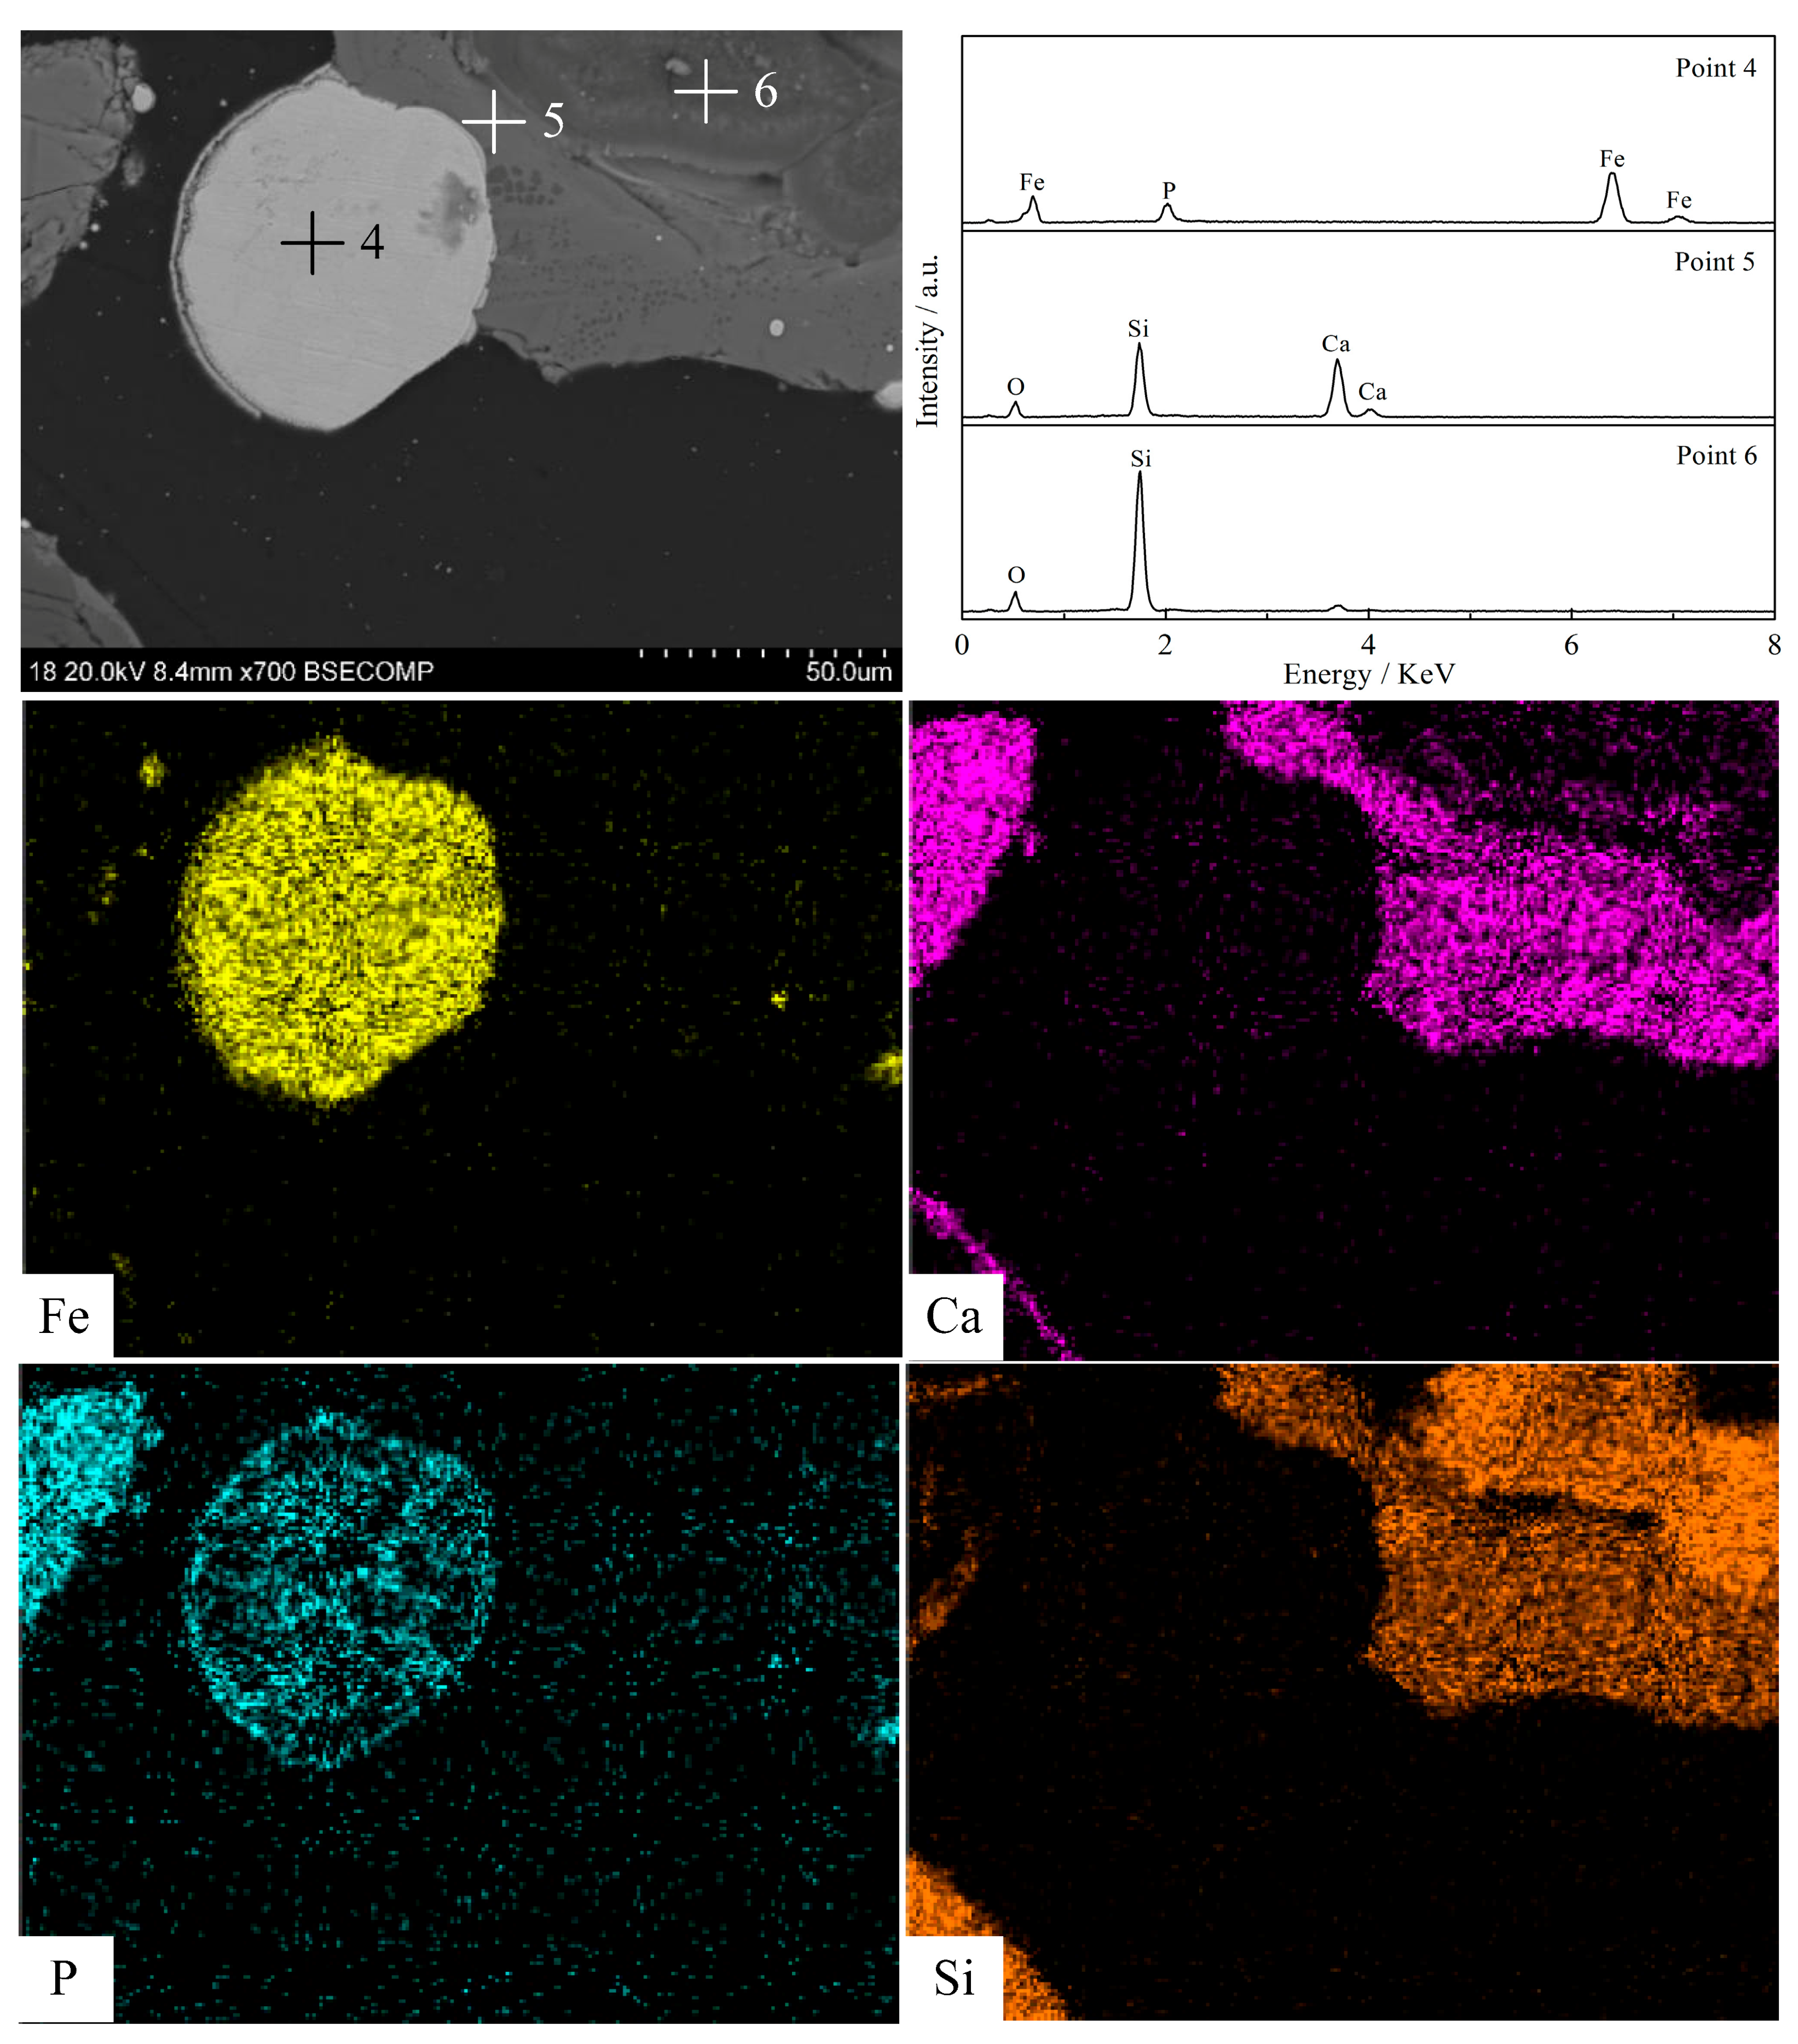
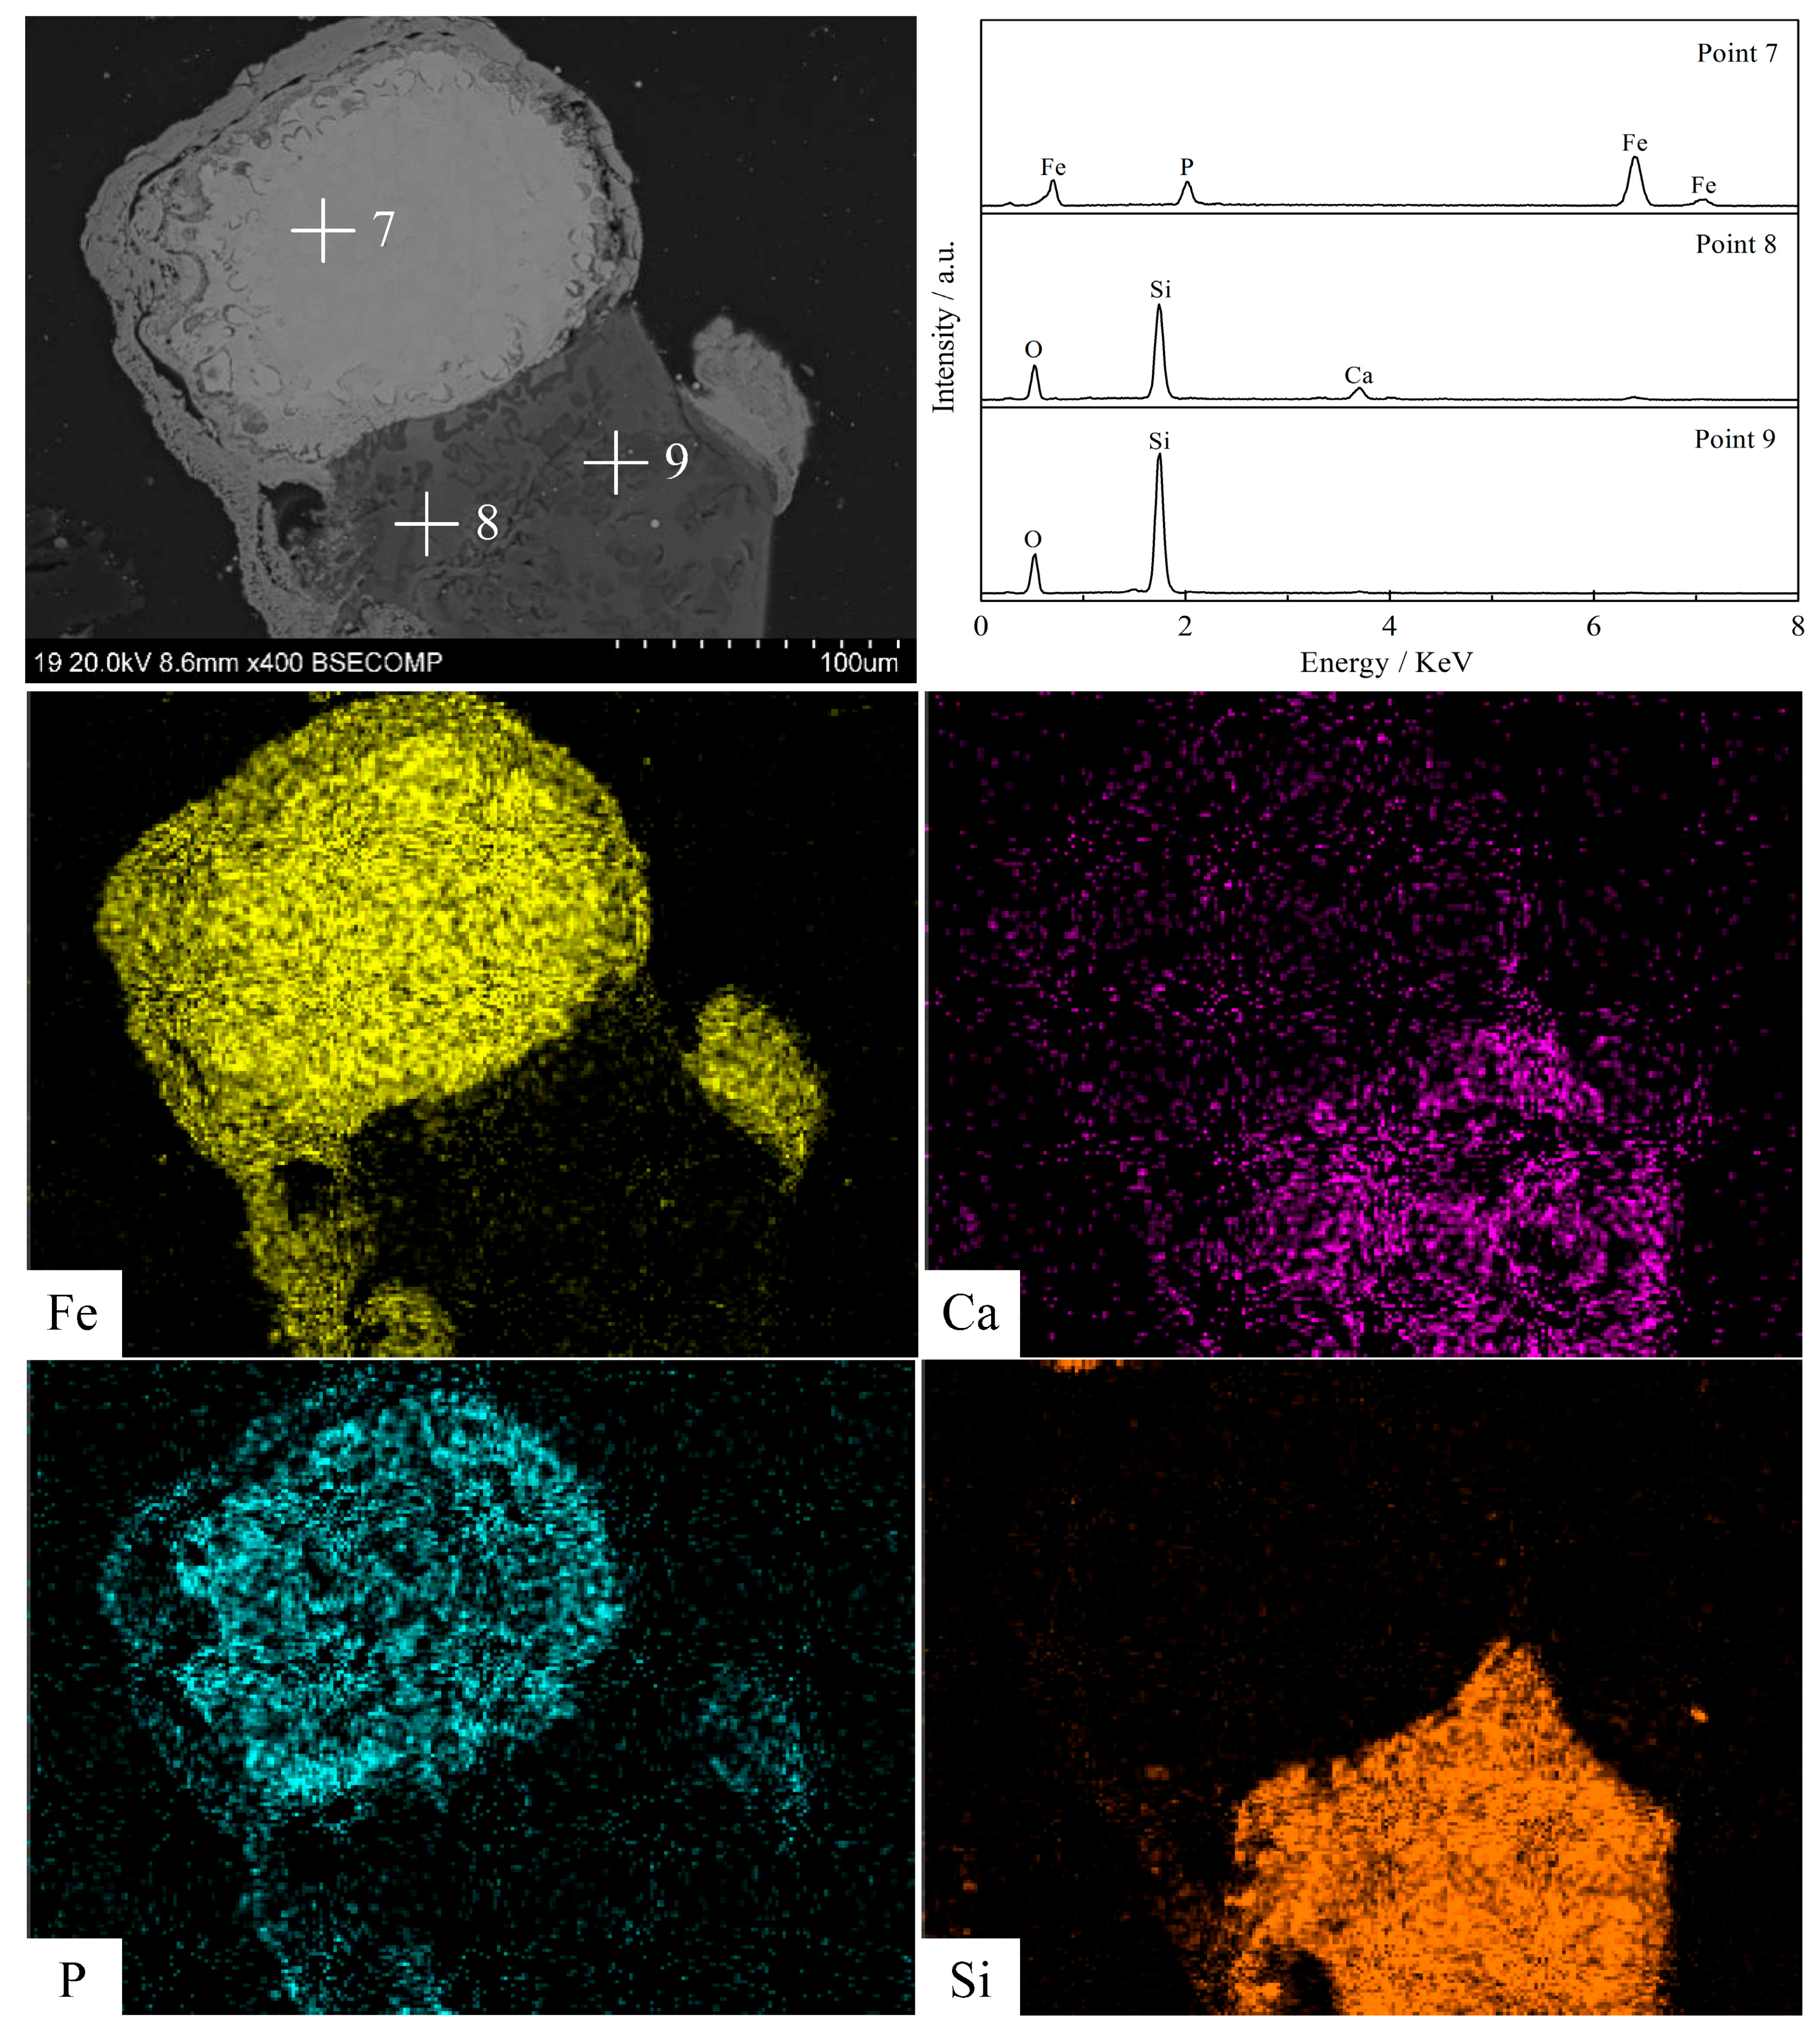
Silica (or alumina) promoted the reduction of fluorapatite by forming calcium silicate (or calcium aluminate) at the interface between fluorapatite and silica (or alumina); CaSiO3 (or CaAl12O19) was mainly formed in the early stage, while Ca3Si2O7(or CaAl4O7) was mainly produced and defluorinated in the later stage. Increasing the reduction temperature and prolonging the reduction time were beneficial to the formation and growth of iron particles and the reduction of fluorapatite.

Author Contributions

Y.S. provided fundings support, designed the experiment and analyzed the characteristics of data mechanism. W.Z. contributed to the operation of the experiment and the writing of the manuscript. Y.H. and Y.L. contributed to the guidance of the experiment and the writing of the manuscript respectively.

Funding

This research was funded by the National Natural Science Foundation of China (Grant No. 51604063), the Liao Ning Revitalization Talents Program (No. XLYC1807111) and the Fundamental Research Funds for the Central Universities of China (No. N180105030).

Acknowledgments

The authors would like to thank the National Natural Science Foundation of China (Grant No.51604063), the Liao Ning Revitalization Talents Program (No. XLYC1807111) and the Fundamental Research Funds for the Central Universities of China (No. N180105030) for financial support.

Conflicts of Interest

The authors declare no conflict of interest.

References

  1. Sun, Y.S.; Zhu, X.R.; Han, Y.X.; Li, Y.J. Green magnetization roasting technology for refractory iron ore using siderite as a reductant. J. Clean. Prod. 2019, 206, 40–50. [Google Scholar] [CrossRef]
  2. Tang, H.Q.; Guo, Z.C.; Zhao, Z.L. Phosphorus removal of high phosphorus iron ore by gas-based reduction and melt separation. J. Iron Steel Res. Int. 2010, 17, 1–6. [Google Scholar] [CrossRef]
  3. Sun, Y.S.; Zhang, Q.; Han, Y.X.; Gao, P.; Li, G.F. Comprehensive utilization of iron and phosphorus from high-phosphorus refractory iron ore. JOM 2018, 70, 144–149. [Google Scholar] [CrossRef]
  4. Cao, Y.Y.; Zhang, Y.R.; Sun, T.C. Dephosphorization behavior of high-phosphorus oolitic hematite-solid waste containing carbon briquettes during the process of direct reduction magnetic separation. Metals 2018, 8, 897. [Google Scholar] [CrossRef]
  5. Wang, H.H.; Li, G.Q.; Zhao, D. Dephosphorization of high phosphorus oolitic hematite by acid leaching and the leaching kinetics. Hydrometallurgy 2017, 171, 61–68. [Google Scholar] [CrossRef]
  6. Zhang, X.L.; Han, Y.X.; Sun, Y.S.; Li, Y.J. Innovative utilization of refractory iron ore via suspension magnetization roasting: A pilot-scale study. Powder Technol. 2019, 352, 16–24. [Google Scholar] [CrossRef]
  7. Tang, H.Q.; Qin, Y.Q.; Qi, T.F. Application of wood char in processing oolitic high-phosphorus Hematite for phosphorus removal. J. Iron. Steel. Res. Int. 2016, 2, 109–115. [Google Scholar] [CrossRef]
  8. Mamdouh, O.; Timo, F.; Riku, M. Thermally assisted liberation of high phosphorus oolitic iron ore: A comparison between microwave and conventional furnaces. Powder Technol. 2015, 269, 7–14. [Google Scholar]
  9. Zhang, H.Q.; Zhang, Z.Q.; Luo, L.Q.; Yu, H. Behavior of Fe and P during reduction magnetic roasting-separation of phosphorus-rich oolitic hematite. Energy Sources Part A 2019, 1, 47–64. [Google Scholar] [CrossRef]
  10. Kang, Y. Desiliconisation and dephosphorisation behaviours of various oxygen sources in uot metal pre-treatment. Metals 2019, 9, 251. [Google Scholar] [CrossRef]
  11. Ionkov, K.; Gaydardzhiev, S. Amenability for processing of oolitic iron ore concentrate for phosphorus removal. Miner. Eng. 2013, 46–47, 119–127. [Google Scholar] [CrossRef]
  12. Salama, W. Paleoenvironmental significance of aluminum phosphate-sulfate minerals in the upper Cretaceous ooidal ironstones, E-NE Aswan area, southern Egypt. Int. J. Earth Sci. 2014, 103, 1621–1639. [Google Scholar] [CrossRef]
  13. Mamdouh, O.; Timo, F.; Riku, M. Effect of microwave pre-treatment on the magnetic properties of iron ore and its implications on magnetic separation. Sep. Purif. Technol. 2014, 136, 223–232. [Google Scholar]
  14. Mamdouh, O.; Timo, F.; Riku, M. Influence of microwave radiation on the magnetic properties of molybdenite and arsenopyrite. Powder Technol. 2017, 15, 276–281. [Google Scholar]
  15. Xia, W.T.; Ren, Z.D.; Gao, Y.F. Removal of phosphorus from high phosphorus iron ores by selective HCl leaching method. J. Iron Steel Res. Int. 2011, 18, 1–4. [Google Scholar] [CrossRef]
  16. Wang, J.C.; Shen, S.B.; Kang, J.H.; Li, H.X.; Guo, Z.C. Effect of ore solid concentration on the bioleaching of phosphorus from high-phosphorus iron ores using indigenous sulfur-oxidizing bacteria from municipal wastewater. Process. Biochem. 2010, 45, 1624–1631. [Google Scholar] [CrossRef]
  17. Delvasto, P.; Ballester, A.; Muñoz, J.A.; González, F.; Blázquez, M.L.; Igual, J.M.; Valverde, A.; García-Balboa, C. Mobilization of phosphorus from iron ore by the bacterium Burkholderia caribensis FeGL03. Miner. Eng. 2009, 22, 1–9. [Google Scholar] [CrossRef]
  18. Gao, P.; Li, G.F.; Han, Y.X.; Sun, Y.S. Reaction behavior of phosphorus in coal-based reduction of an oolitic hematite ore and pre-dephosphorization of reduced iron. Metals 2016, 6, 82. [Google Scholar] [CrossRef]
  19. Li, K.Q.; Ni, W.; Zhu, M. Iron extraction from oolitic iron ore by a deep reduction process. J. Iron Steel. Res. Int. 2011, 8, 9–13. [Google Scholar] [CrossRef]
  20. Han, H.; Duan, D.; Yuan, P. Recovery of metallic iron from high phosphorus oolitic hematite by carbothermic reduction and magnetic separation. Ironmak. Steelmak. 2014, 7, 542–547. [Google Scholar] [CrossRef]
  21. Grabke, H.J. Grain boundary segregation of impurities in iron and effects on steel properties. Mater. Eng. ISIJ. 1999, 13, 143–192. [Google Scholar]
  22. Sun, Y.S.; Han, Y.X.; Gao, P.; Wang, Z.H.; Ren, D.Z. Recovery of iron from high phosphorus oolitic iron ore using coal-based reduction followed by magnetic separation. Int. J. Miner. Metall. Mater. 2013, 20, 411–419. [Google Scholar] [CrossRef]
  23. Xu, C.Y.; Sun, T.C.; Kou, J.; Li, Y.L.; Mo, X.L.; Tang, L.G. Mechanism of phosphorus removal in beneficiation of high phosphorous oolitic hematite by direct reduction roasting with dephosphorization agent. Trans. Nonferrous Met. Soc. China. 2012, 22, 2806–2812. [Google Scholar] [CrossRef]
  24. Yu, W.; Sun, T.C.; Kou, J.; Wei, Y.X.; Xu, C.Y.; Liu, Z.Z. The function of Ca(OH)2 and Na2CO3 as additive on the reduction of high-phosphorus oolitic hematite-coal mixed pellets. ISIJ Int. 2013, 53, 427–433. [Google Scholar] [CrossRef]
Figure 1. XRD pattern of phosphorite.
Metals 09 00923 g001
Figure 2. Relationship between equilibrium composition (wt.%) and temperature of the system of Ca10(PO4)6F2–Al2O3–Fe2O3–C and Ca10(PO4)6F2–SiO2–Fe2O3–C.
Metals 09 00923 g002
Figure 3. Effect of reduction time on the reduction degree of fluorapatite.
Metals 09 00923 g003
Figure 4. Effect of reduction temperature on the reduction degree of fluorapatite.
Metals 09 00923 g004
Figure 5. Effect of C/O molar ratio on the reduction degree of fluorapatite.
Metals 09 00923 g005
Figure 6. Effect of additive contents on the reduction degree of fluorapatite.
Metals 09 00923 g006
Figure 7. Effect of reduction time on the reduction degree of fluorapatite in systems of Ca10(PO4)6F2–Al2O3–Fe2O3–C and Ca10(PO4)6F2–SiO2–Fe2O3–C.
Metals 09 00923 g007
Figure 8. Linear fitting of lnk(T) versus 1/T.
Metals 09 00923 g008
Figure 9. XRD pattern of the product of reduction at different temperature in the Ca10(PO4)6F2–Al2O3–Fe2O3–C system.
Metals 09 00923 g009
Figure 10. XRD pattern of the product of reduction at different temperatures in the Ca10(PO4)6F2–SiO2–Fe2O3–C system.
Metals 09 00923 g010
Figure 11. SEM image and energy dispersive spectrometer (EDS) spectra and line-by-line scanning analysis of the reduction product in the Ca10(PO4)6F2–Al2O3–Fe2O3–C system (reduction temperature of 1473 K and reduction time of 60 min).
Metals 09 00923 g011
Figure 12. SEM image and EDS spectra and line-by-line scanning analysis of the reduction product in the Ca10(PO4)6F2–Al2O3–Fe2O3–C system (reduction temperature of 1573 K and reduction time of 10 min).
Metals 09 00923 g012
Figure 13. SEM image and EDS spectra and line-by-line scanning analysis of the reduction product in the Ca10(PO4)6F2–Al2O3–Fe2O3–C system (reduction temperature of 1573 K and reduction time of 60 min).
Metals 09 00923 g013
Figure 14. SEM image and EDS spectra and line-by-line scanning analysis of the reduction product in the Ca10(PO4)6F2–SiO2–Fe2O3–C system (a reduction temperature of 1473 K and reduction time of 60 min).
Metals 09 00923 g014
Figure 15. SEM image and EDS spectra and line-by-line scanning analysis of the reduction product in the Ca10(PO4)6F2–SiO2–Fe2O3–C system (a reduction temperature of 1573 K and reduction time of 10 min).
Metals 09 00923 g015
Figure 16. SEM image and EDS spectra and line-by-line scanning analysis of the reduction product in the Ca10(PO4)6F2–SiO2–Fe2O3–C system (reduction temperature of 1573 K and reduction time of 60 min).
Metals 09 00923 g016
Table 1. Chemical compositions of coke (mass%).
Fixed CarbonVolatileAshWaterS
85.441.2612.460.220.62
Table 2. Reagents used in experiments.
Reagent NameChemical FormulaSpecifications
Silicon dioxideSiO2Analytical Purity
AluminaAl2O3Analytical Purity
Ferric oxideFe2O3Analytical Purity
Table 3. Differential and integral expressions of common reaction mechanism functions.
CodeReaction ModelDifferential f(α)Integral G(α)
AmAvrami–Erofeevm(1 − α)[−ln(1 − α)](m − 1)/m[−ln(1 − α)]1/m
A1m = 11 − α−ln(1 − α)
A2m = 22(1 − α)[−ln(1 − α)]1/2[−ln(1 − α)]1/2
A3m = 33(1 − α)[−ln(1 − α)]2/3[−ln(1 − α)]1/3
A4m = 44(1 − α)[−ln(1 − α)]3/4[−ln(1 − α)]1/4
A3/2m = 3/23/2(1 − α)[−ln(1 − α)]1/3[−ln(1 − α)]2/3
A1/4m = 1/41/4(1 − α)[−ln(1 − α)]−3[−ln(1 − α)]4
A1/3m = 1/31/3(1 − α)[−ln(1 − α)]−2[−ln(1 − α)]3
A1/2m = 1/21/2(1 − α)[−ln(1 − α)]−1[−ln(1 − α)]2
DmDiffusion
D1One-dimensional diffusion1/2α−1α2
D22-D diffusion (Valensi)[−ln(1 − α)]−1α + (1 − α)ln(1 − α)
D32-D diffusion (Jander)(1 − α)1/2[1 − (1 − α)1/2]−1[1 − (1 − α)1/2]2
D43-D diffusion (anti-Jander)3/2(1 + α)2/3[(1 + α)1/3 − 1]−1[(1 + α)1/3 − 1]2
D53-D diffusion (Z-L-T)3/2(1 − α)4/3[(1 − α)−1/3 −1]−1[(1 − α)−1/3 − 1]2
D63-D diffusion (Jander, n = 2)3/2(1 − α)2/3[1 − (1 − α)1/3]−1[1 − (1 − α)1/3]2
D73-D diffusion (Jander, n = 1/2)6(1 − α)2/3[1 − (1 − α)1/3]1/2[1 − (1 − α)1/3]1/2
D83-D diffusion (G-B)3/2[(1 − α)]−1/3 − 1]−11 − 2/3α − (1 − α)2/3
Table 4. Correlation coefficients calculated using common reaction mechanism functions.
Function Code Experimental Conditions/K
Ca10(PO4)6F2–Al2O3–Fe2O3–CCa10(PO4)6F2–SiO2–Fe2O3–C
1473149815231548157314731498152315481573
Correlation Coefficients R2, ×10−4
AmAvrami–Erofeev Equation, f(x) = m(1 − x)[−ln(1 − x)](m − 1)/m
A19433943693678944886390308993852985087879
A28590862784748029788580848071752273686765
A38208826380807656747976917695713069266342
A47998806478677458726374827497692766986124
A3/28923894488218370825384408415788877827165
A1/49331933492089754978996599646990497549910
A1/39777979597319962995099539937999399769805
A1/29984999199779848980299069884968197509263
DmDiffusion
D1994399279891948289549623954589718708 6820
D29963995799369626929497369683924191257657
D39971996999539695946697899747937693348186
D49902987098089290863594619355867083046363
D59986999599729916992499579940982799049705
D69977997999669753959898349800948994978591
D78508853183407840752879137881725669826112
D89968996699489673940997729727933192658004
Table 5. Kinetics parameters of apatite reduction.
Mechanism Functionk(T)R2
A1/2
(Ca10(PO4)6F2–Al2O3–Fe2O3–C)
k ( T ) = ( 3.26789 × 10 9 ) exp ( 345.478 × 10 3 R T ) 0.9892
A1/3
(Ca10(PO4)6F2–SiO2–Fe2O3–C)
k ( T ) = ( 3.89033 × 10 7 ) exp ( 282.748 × 10 3 R T ) 0.9904

