Article

The Zinc-Rich Corner of the Fe-Si-Sn-Zn Quaternary System at 450 °C

1
Key Laboratory of Materials Design and Preparation Technology of Hunan Province, School of Materials Science and Engineering, Xiangtan University, Xiangtan 411105, Hunan, China
2
Jiangsu Key Laboratory of Materials Surface Science and Technology, School of Materials Science and Engineering, Changzhou University, Changzhou 213164, Jiangsu, China
*
Authors to whom correspondence should be addressed.
Metals 2019, 9(8), 908; https://doi.org/10.3390/met9080908
Submission received: 31 July 2019 / Revised: 15 August 2019 / Accepted: 16 August 2019 / Published: 19 August 2019

Abstract

:
The 450 °C isothermal sections of the Fe-Si-Sn-Zn quaternary system with Zn composition fixed at 70 and 93 at.% were determined experimentally using optical microscopy, scanning electronic microscopy coupled with energy dispersive X-ray spectroscopy (SEM-EDS), and X-ray diffractometry (XRD). Five four-phase regions were identified in the 70 at.% Zn section, whereas no four-phase region was found in the 93 at.% Zn section. The liquid phase was found to be in equilibrium with almost all phases in the two sections, including the FeSn, FeSi, FeSi2, Γ1, δ, ζ, and α-Fe phases. The solubility of Sn in the ζ, FeSi, and FeSi2 phases was rather limited; however, the maximum solubility of Si in the FeSn phase was 0.5 wt.%. No quaternary compound was found in the study.

1. Introduction

Hot dip galvanizing is one of the most versatile anti-corrosion technologies of steel [1,2,3,4,5], for which Zn and its alloys are mainly used amongst various materials. Since the galvanized coating is easily interfered by Si in steels, its anti-corrosion effect is greatly reduced. The effect of silicon-containing impurities on the galvanized layer has become an important task in corrosion resistance today. Si has been introduced to steels as either a de-oxidant or strengthening alloying element [6]. However, the presence of silicon in steels can result in abnormal thickness of coating, brittleness, and poor adherence. This phenomenon is commonly referred to as Si reactivity [7,8,9,10,11]. To solve this problem, high-temperature galvanizing and alloy-element additions to the Zn bath have been used in practice. The addition of alloy elements, such as Al, Ni, Ti, and V [12,13,14,15], has proven to be effective for Si-reactivity control. At present, Ni additive has been used widely for Si-containing galvanizing, although it is effective only when the Si content of steels is less than 0.2 wt.%. To study the effect of controlling Si reactivity, Sn and its alloys have been added to the Zn bath by scholars [8,16,17], but few have provided a solid mechanism.
Adding Sn to a zinc bath has an effect on the microstructure of hot-dip galvanizing Si-containing steels, but its mechanism is not clear. In fact, galvanizing Si-containing steels in an Sn-containing bath involves the Fe-Si-Sn-Zn quaternary system. The annealing temperature of the phase equilibrium of the Zn-rich corner isothermal sections is 450 °C, which is the conventional galvanizing temperature. In this experiment, the quaternary phase equilibrium Fe-Si-Sn-Zn of the zinc-rich corner isothermal sections at 450 °C, which was used in the formation of the coating’s microstructure on Si-containing steel with different Sn additions, provided the theoretical foundation for the effect of Sn on Si reactivity. In this study, 450 °C isothermal sections of the Fe-Si-Sn-Zn quaternary system with Zn fixed at 70 and 93 at.% were studied by using optical microscopy, scanning electron microscopy coupled with energy dispersive X-ray spectroscopy (SEM-EDS), and X-ray diffractometry (XRD).

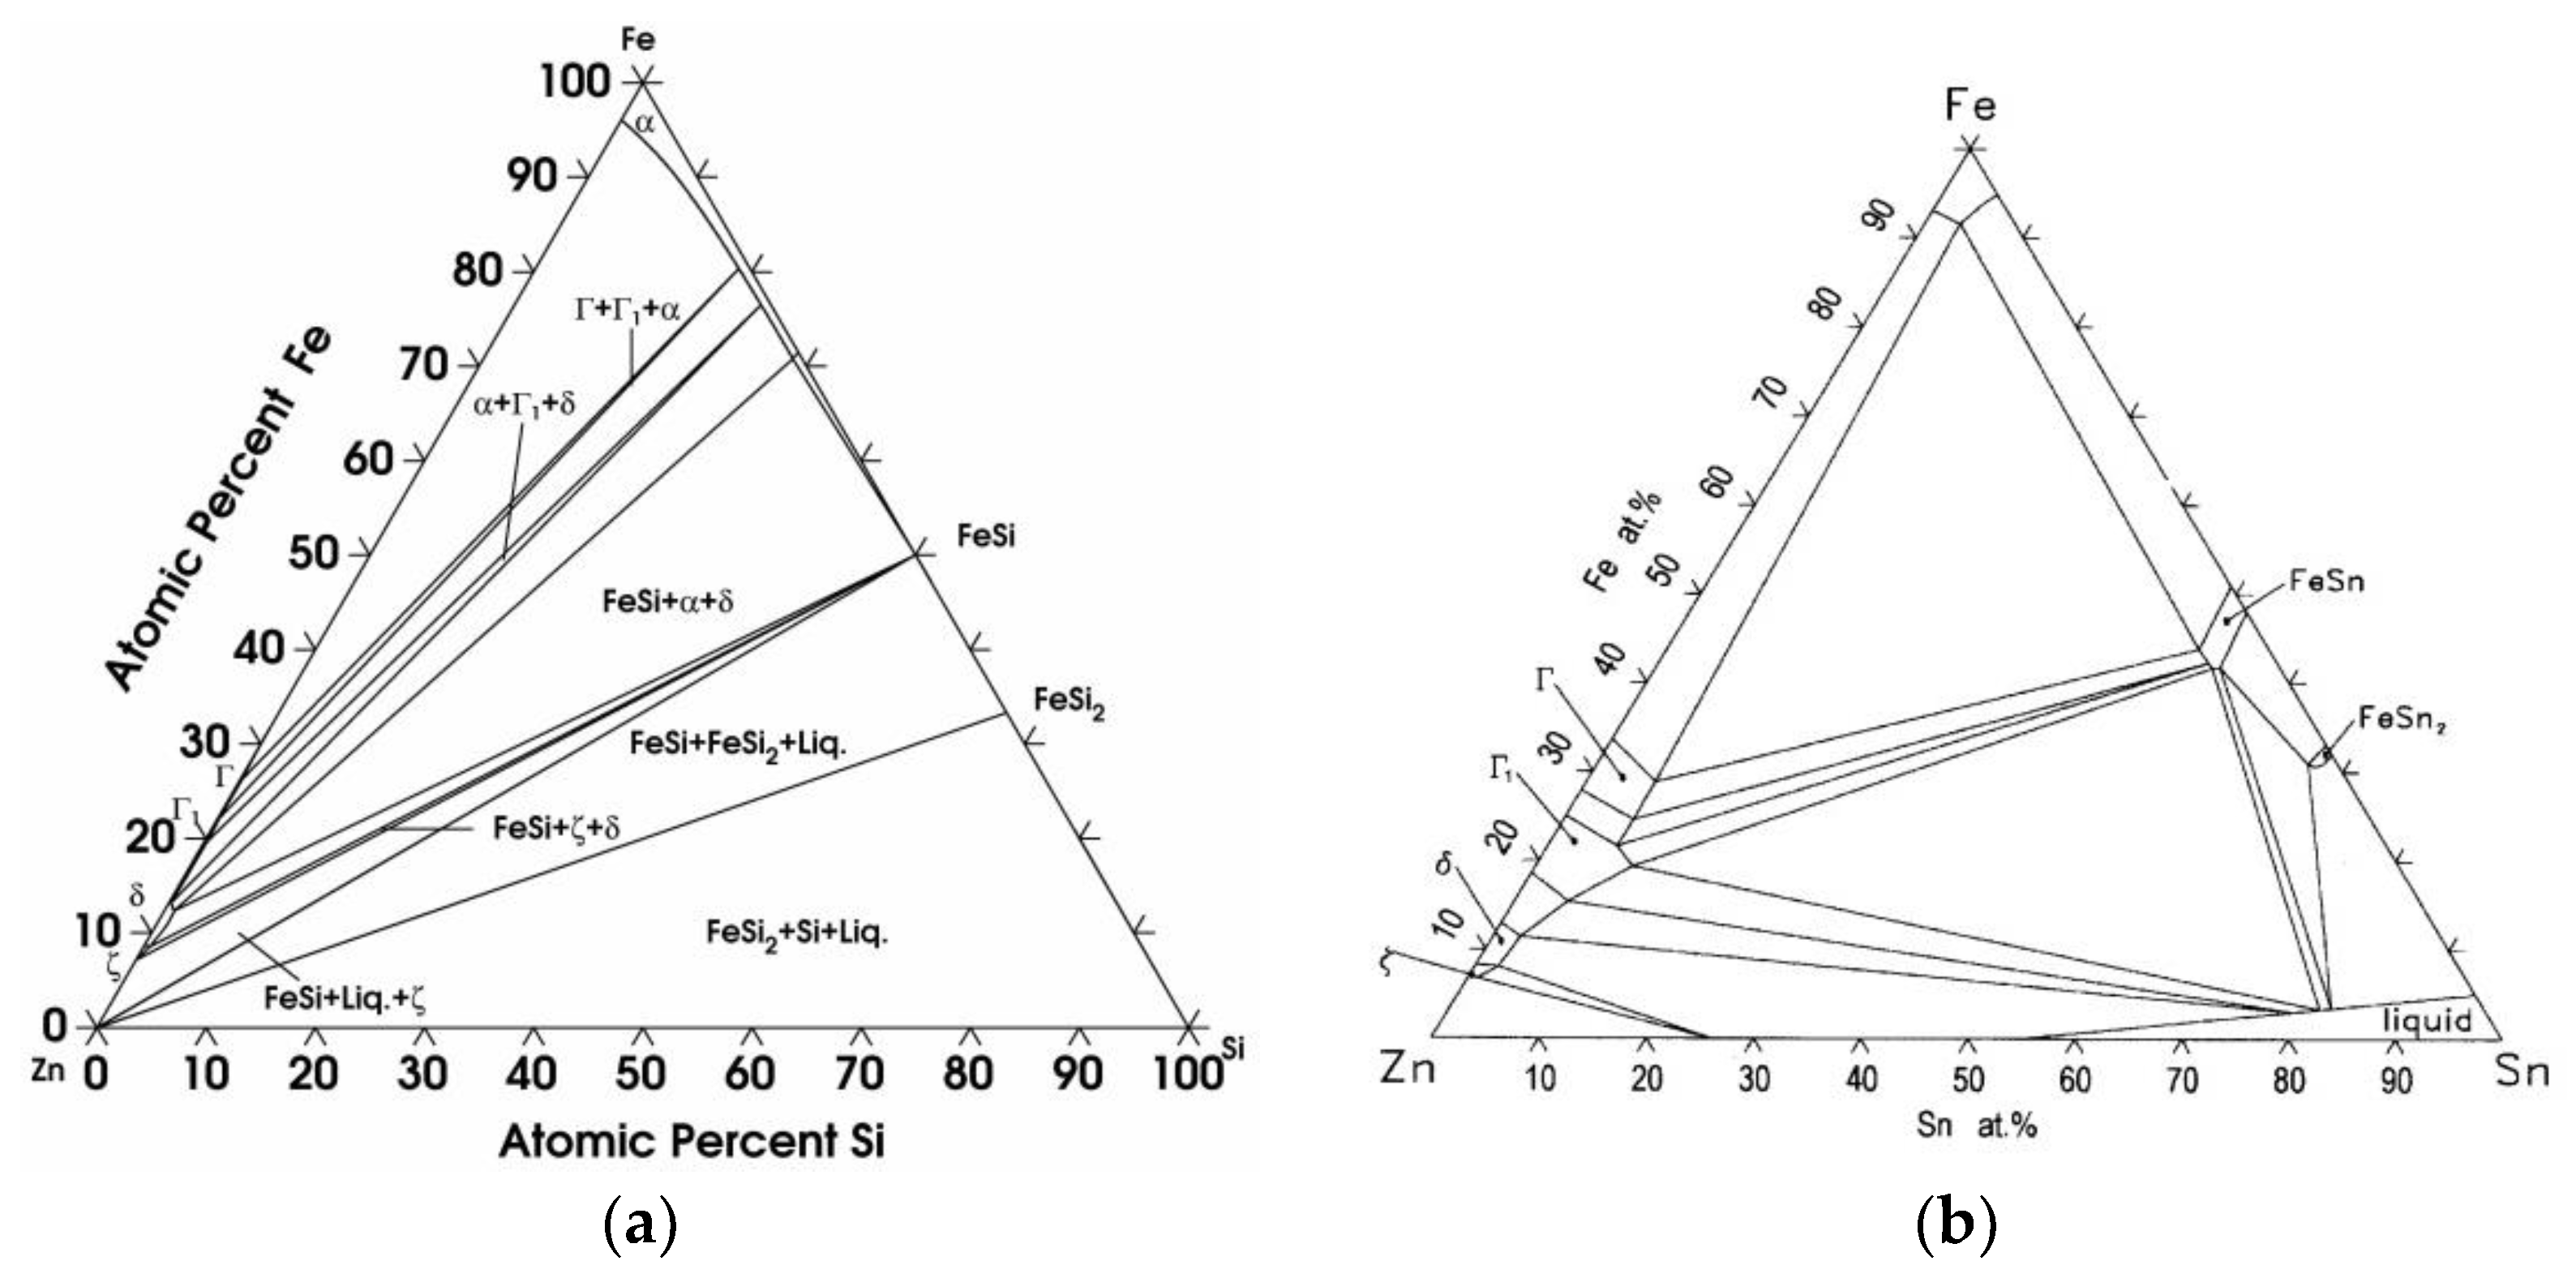
2. Literature Review

The aim of the present work is to study the phase equilibrium of the Zn-rich corner. Information regarding binary and ternary systems relevant to Zn is important for the establishment of the Fe-Si-Sn-Zn quaternary system. A considerable amount of attention has been paid to the Zn-Fe binary system because it plays a critical role in the galvanizing industry [18,19,20,21]. Su et al. [18] redrew the Zn-Fe phase diagram and revealed the stable phases in the Zn-rich corner, including Γ, Γ1, δ, and ζ. Table 1 documents the binary compounds involved in the study and their nominal compositions. [20,22,23]
To study the mechanism of Si reactivity, several research groups have investigated the Zn-Fe-Si system [24,25,26,27,28,29,30]. Köster [24] has reported that the FeSi compound was equilibrated with the ζ phase in the 450 °C isothermal section [24]. However, based on the experimental work by Bretez et al. [25] and thermodynamic calculations conducted by Perrot and Dauphin [26], Foct et al. [27] have proposed the 450 °C isothermal section of the Zn-Fe-Si system. The result suggested the Zn-Fe-Si phase diagram included an equilibrium state among the liquid, δ, and FeSi phases. This result contrasted with the phase diagrams proposed by Köster [24]. Most recently, the Zn-Fe-Si system reinvestigated by Su et al. [26] confirmed all phase equilibrium states proposed by Köster [24]. As shown in Figure 1a [28], they found that ζ coexisted with FeSi.
Tang et al. [31] determined the Zn-rich corner of the Zn-Fe-Sn ternary system at 450 °C. As shown in Figure 1b [31], they found that the liquid can coexist with three Fe-Zn compounds, namely, the ζ, δ, and Γ1 phases, and two Fe-Sn compounds, namely, FeSn and FeSn2.

3. Experimental Methods

The isothermal sections of the Fe-Si-Sn-Zn quaternary system for the Zn-rich corner at 450 °C were determined using the equilibrated alloy method. The alloys were prepared using metal powders and bulky particles. The purity of all the raw materials was 99.99%. All specimens were prepared by carefully weighing Fe, Si, Sn, and Zn, and the total weight was 10 g, which was determined using an electronic balance with an accuracy of 0.0001 g. The prepared samples were mixed and sealed under Ar atmosphere in an evacuated quartz tube. Then, the mixture was heated to the liquid state and kept for 48 h, followed by water quenching. A bottom-quenching technique [28] was used to minimize Zn loss due to vaporization and reduce the porosity in the quenched samples. The samples were finally annealed at 450 °C for 45 days followed by water quenching.
The samples were prepared in the conventional way for microstructure examination. A nital solution was used for revealing the microstructure details. The morphology and chemical compositions of various phases in the samples were analyzed using a scanning electron microscope (SEM)(JSM-6560LV, JEOL, Tokyo, Japan) equipped with an energy dispersive X-ray spectroscope(EDS)( MCA X-STREAM, Oxford instruments, London, UK). The operation voltage of the SEM was 20 kV. The phase makeup of the alloys was further determined by analyzing X-ray diffraction patterns generated by an advanced X-ray diffractometer(XRD)( Bruker D8, Billerica, MA, USA), operating at 40 kV and 40 mA with Cu-Ka radiation.

4. Results and Discussion

Twenty-two alloys were prepared for the study of the Fe-Si-Sn-Zn quaternary system at 450 °C. The designed composition of each sample is listed in Table 2 for the isothermal sections, with Zn fixed at 70 and 93 at.% (Column 2). These phase fields are also listed in Table 2 (Column 3) together with the chemical compositions of the equilibrated phases (Columns 4–6). These compositions were determined by using the SEM-EDS technique, and each tabulated composition value represented the average of at least five measurements.

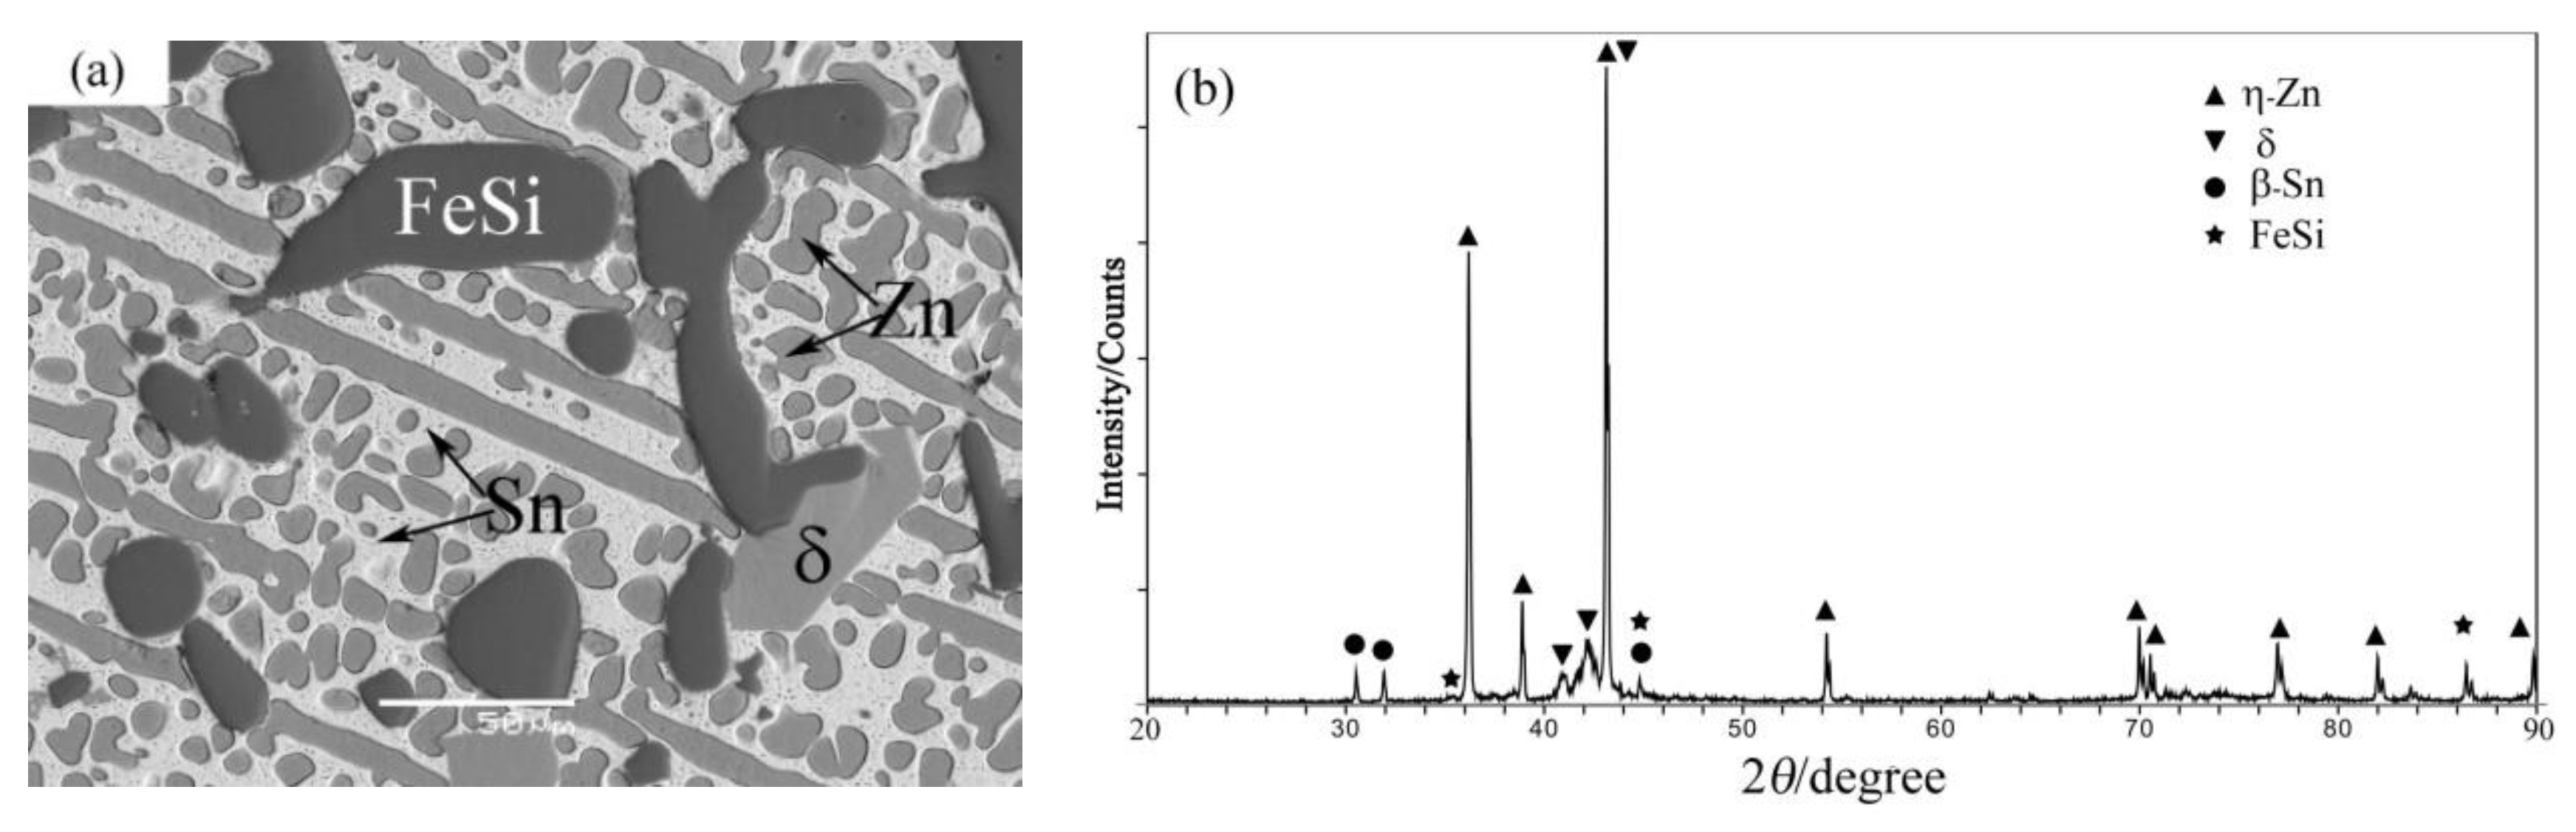
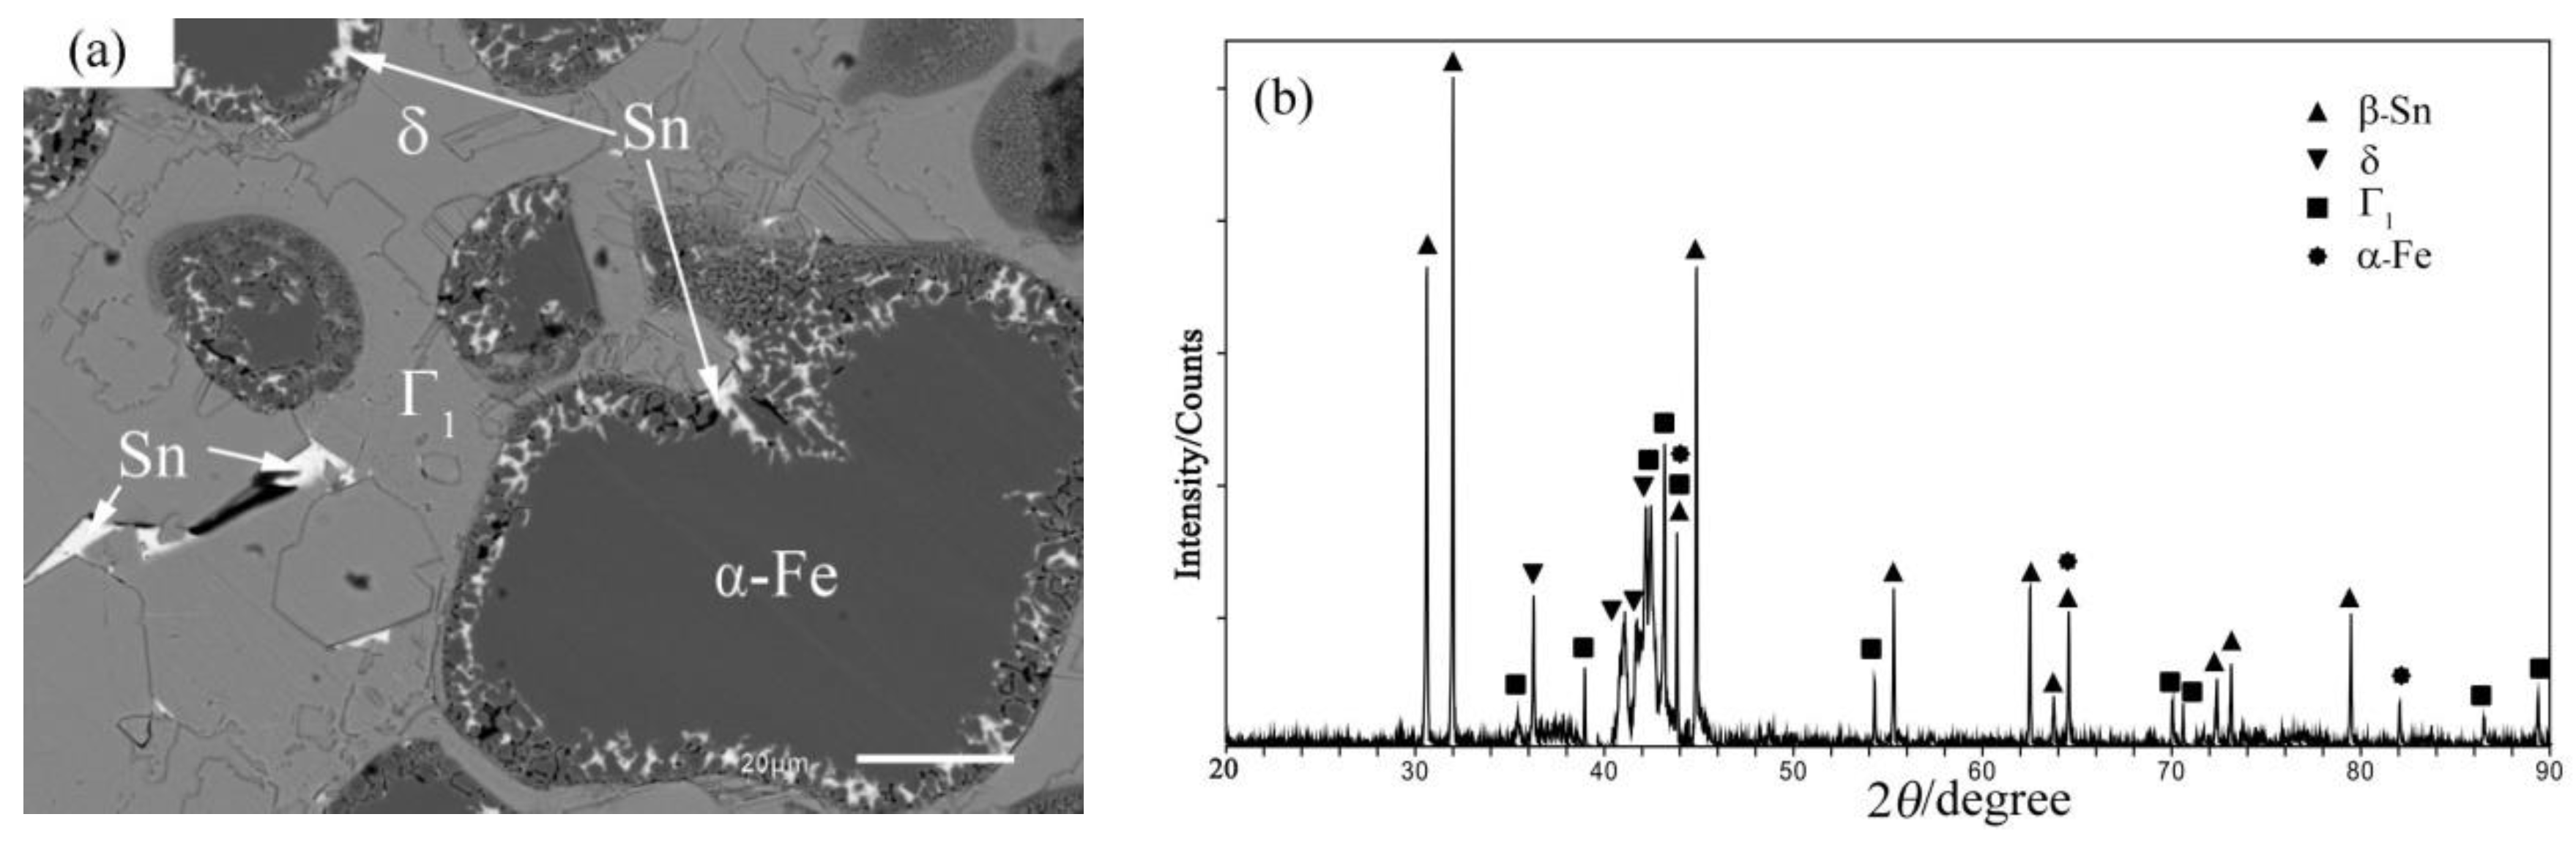
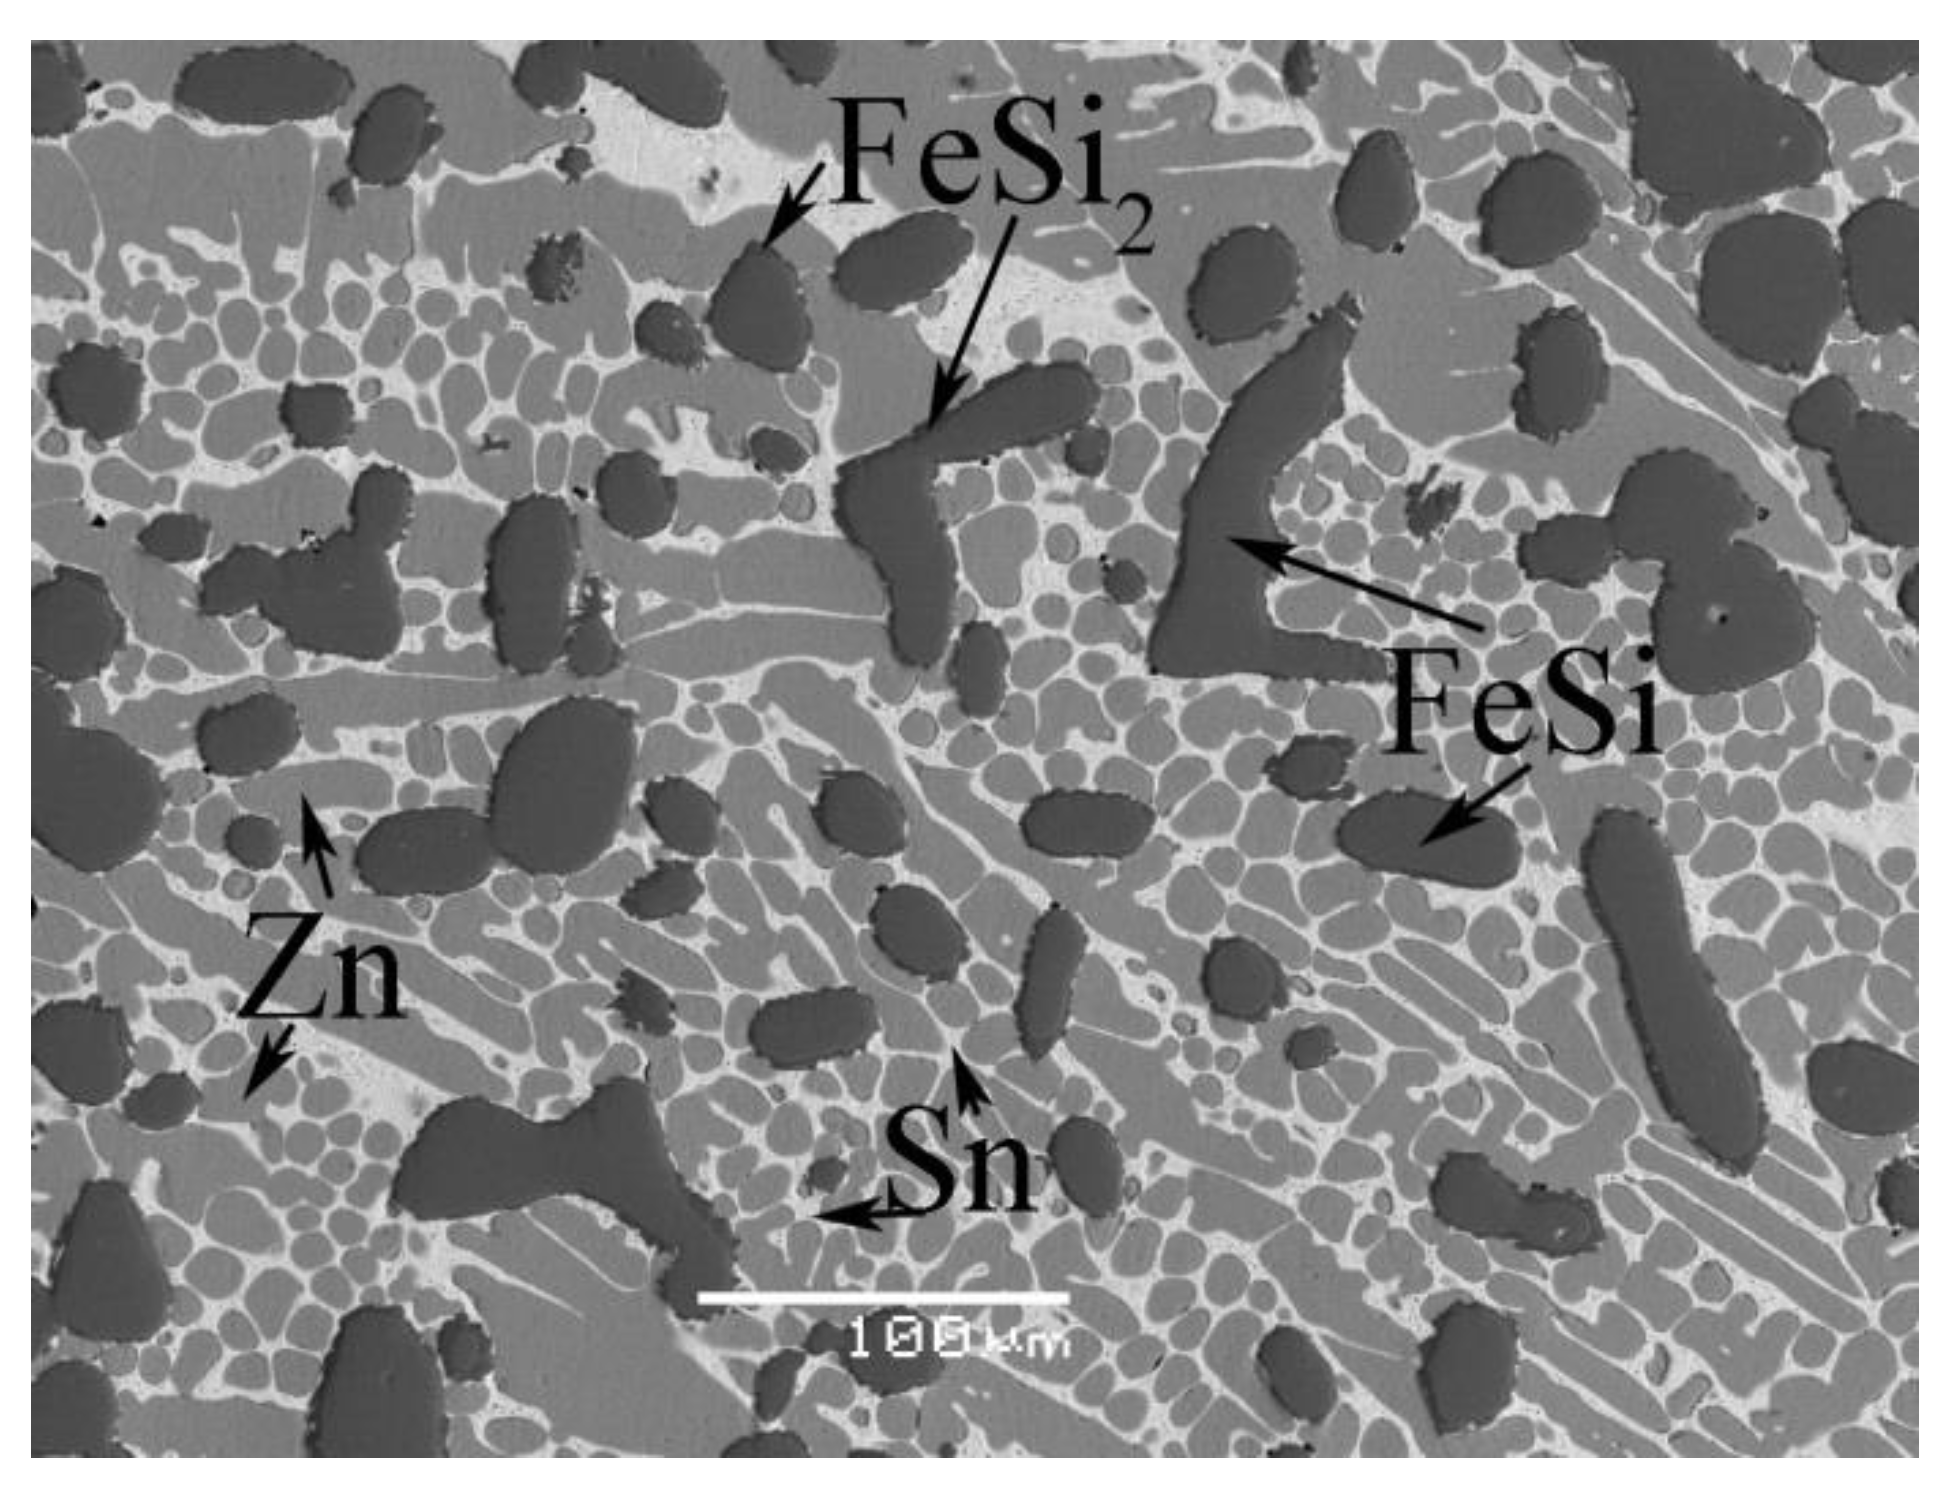
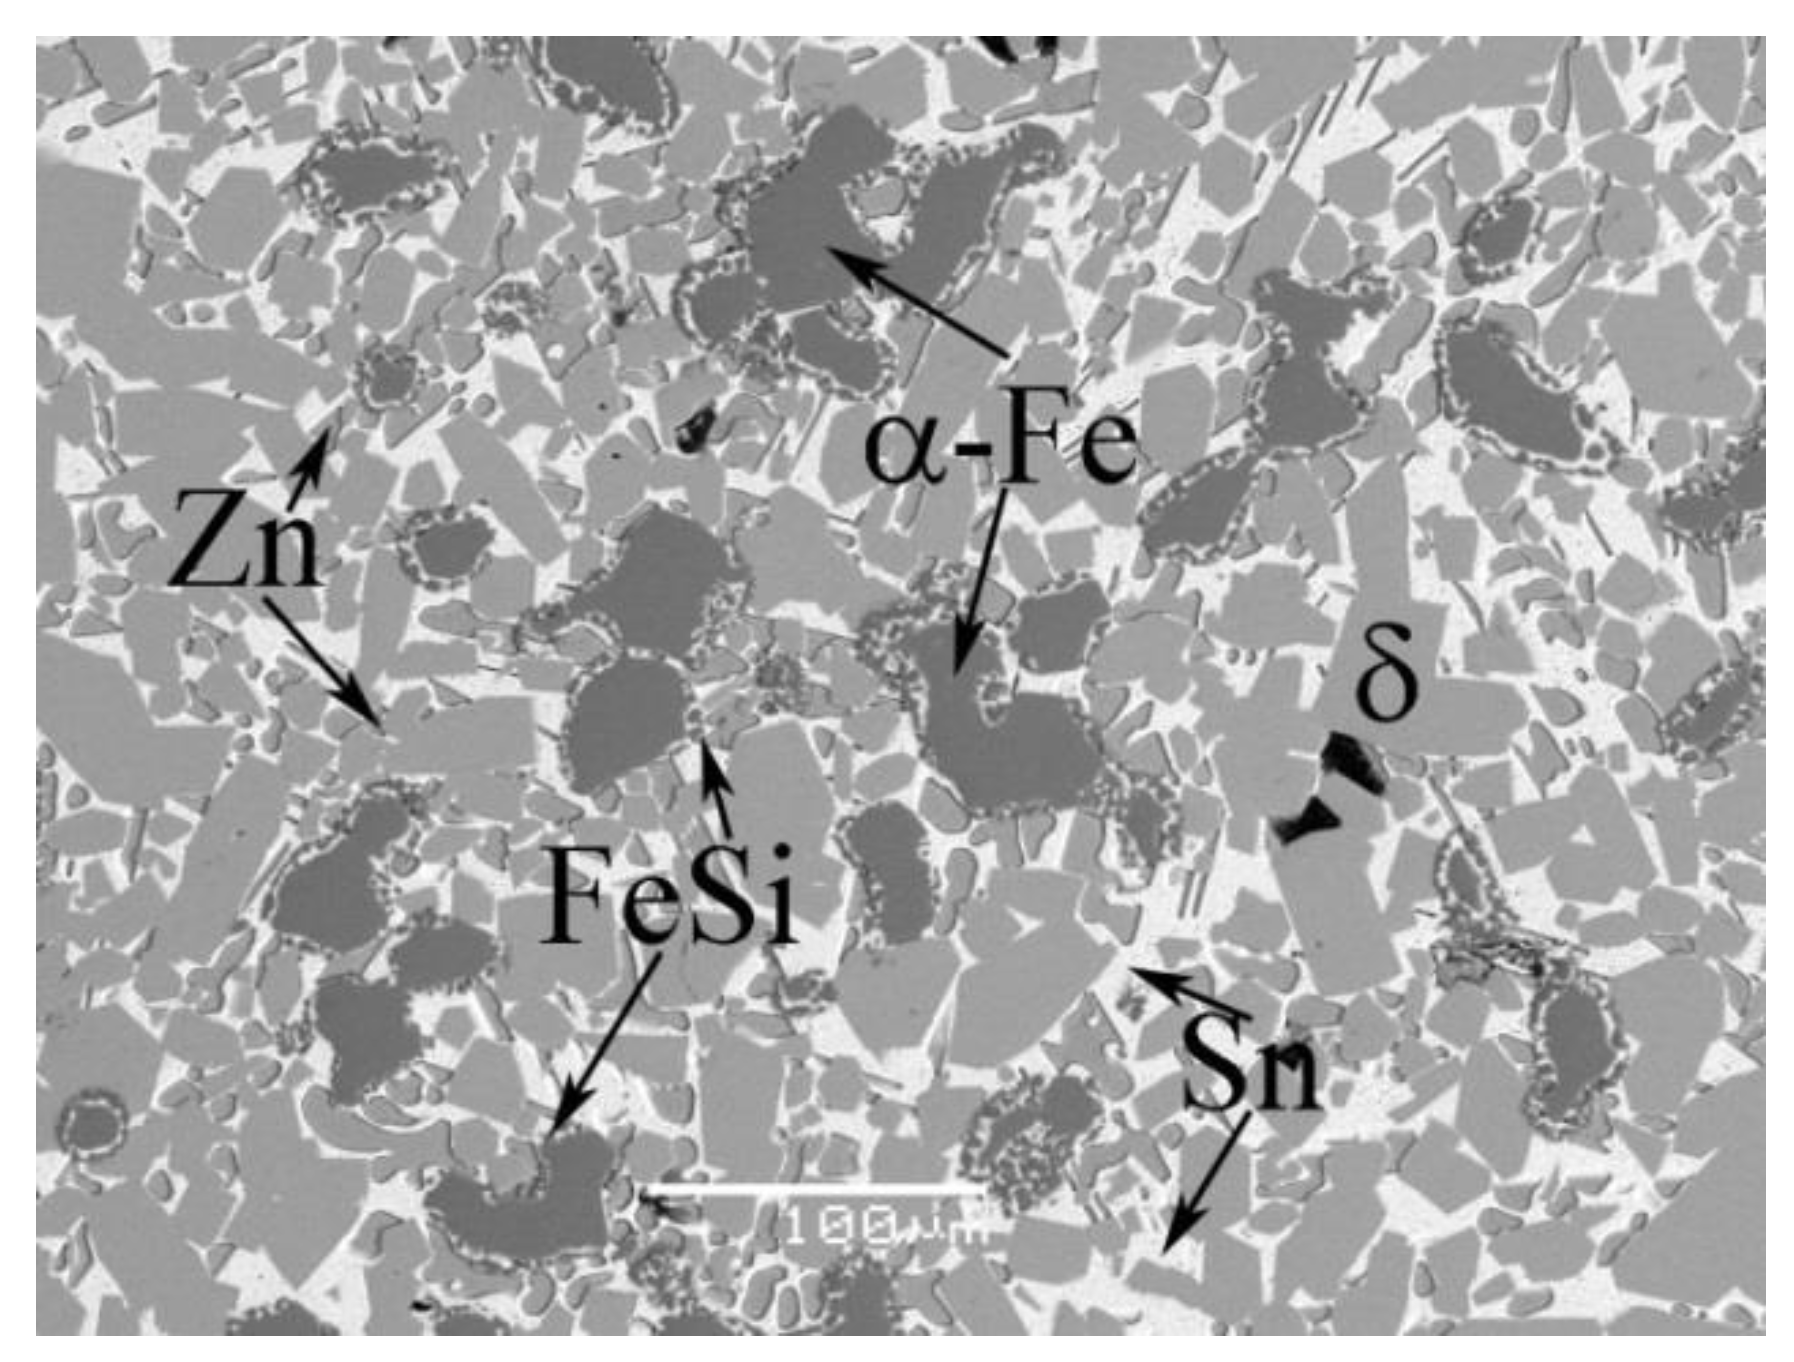
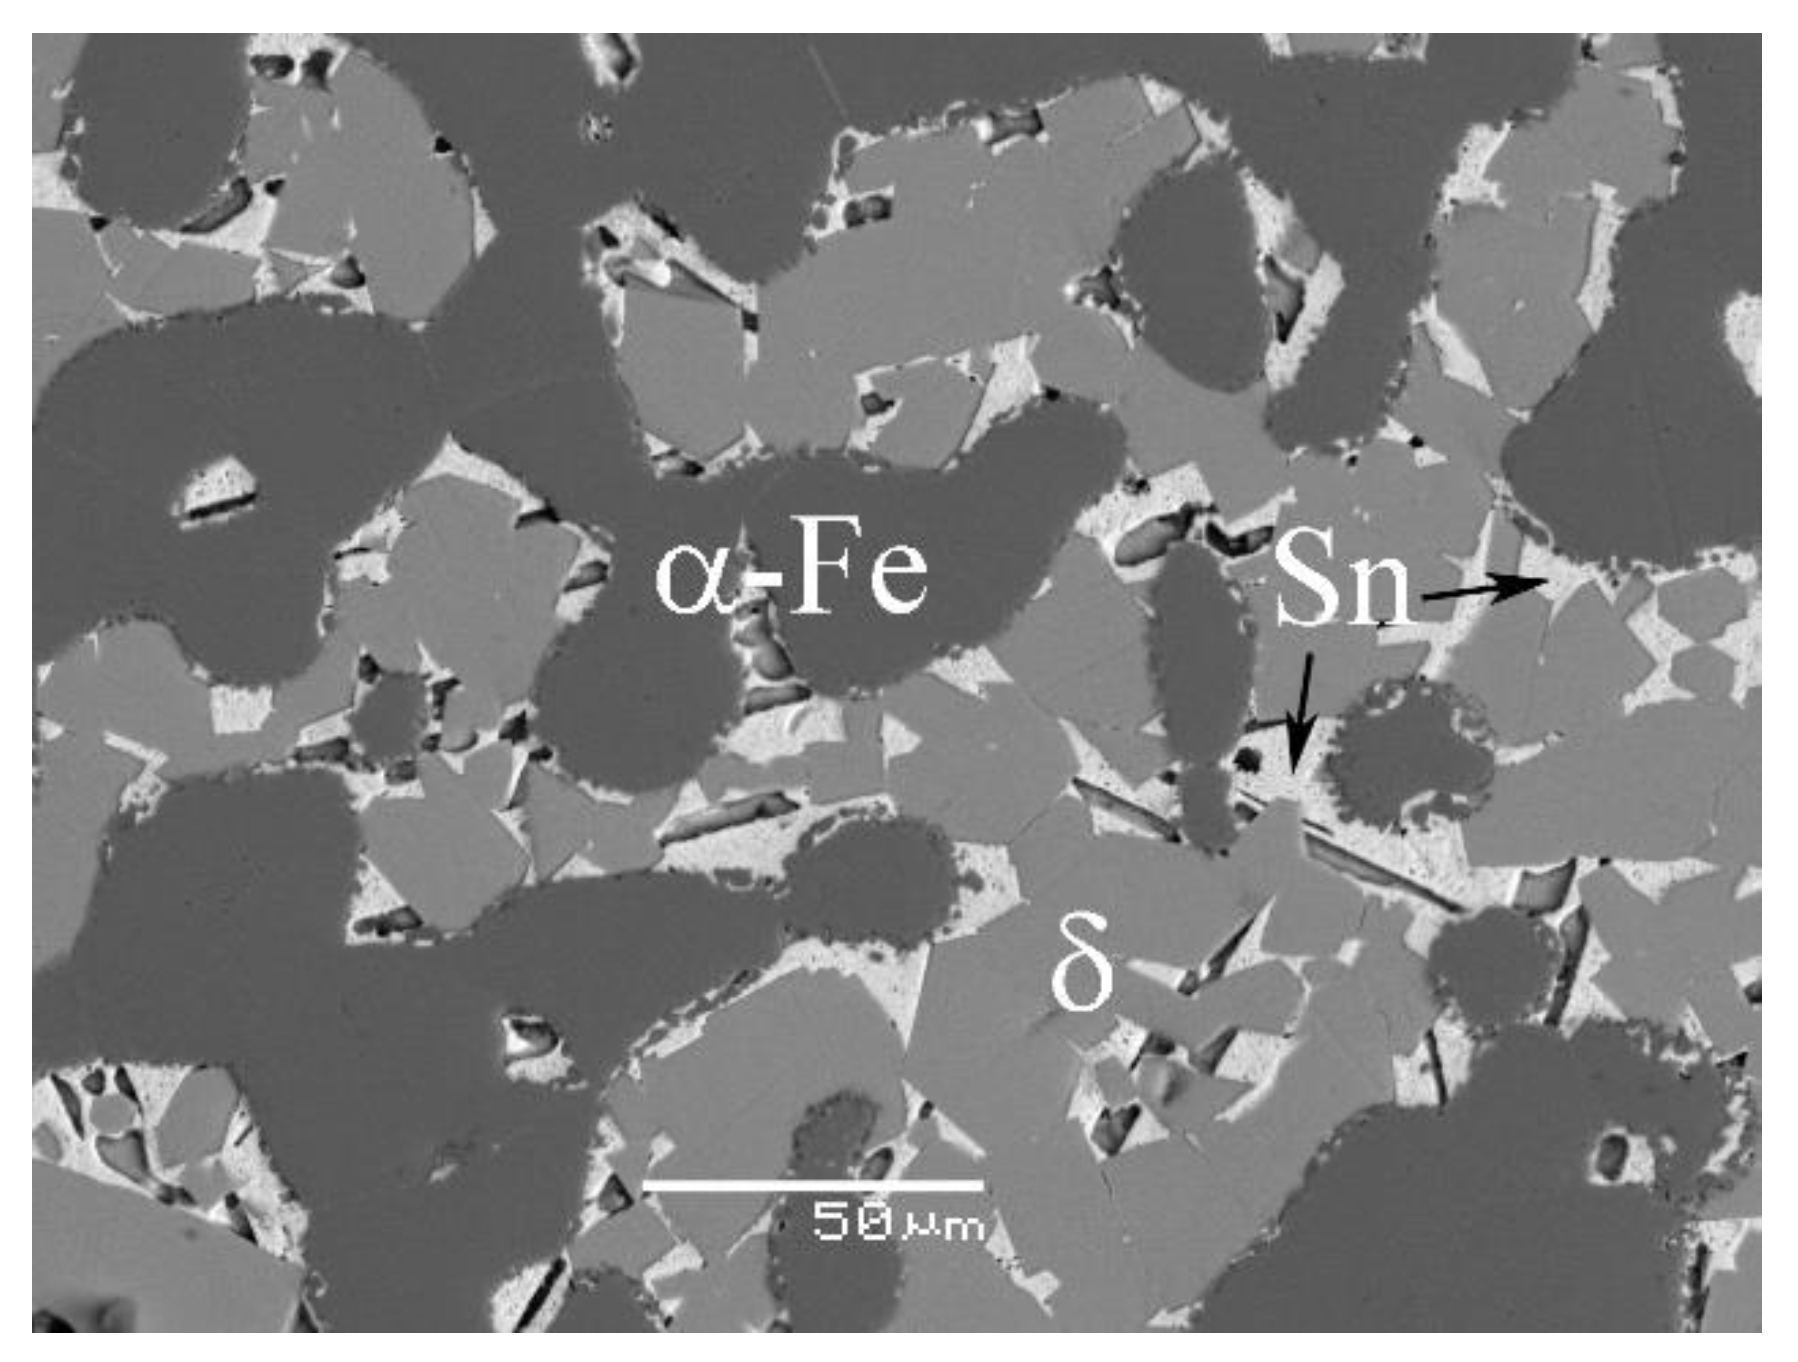
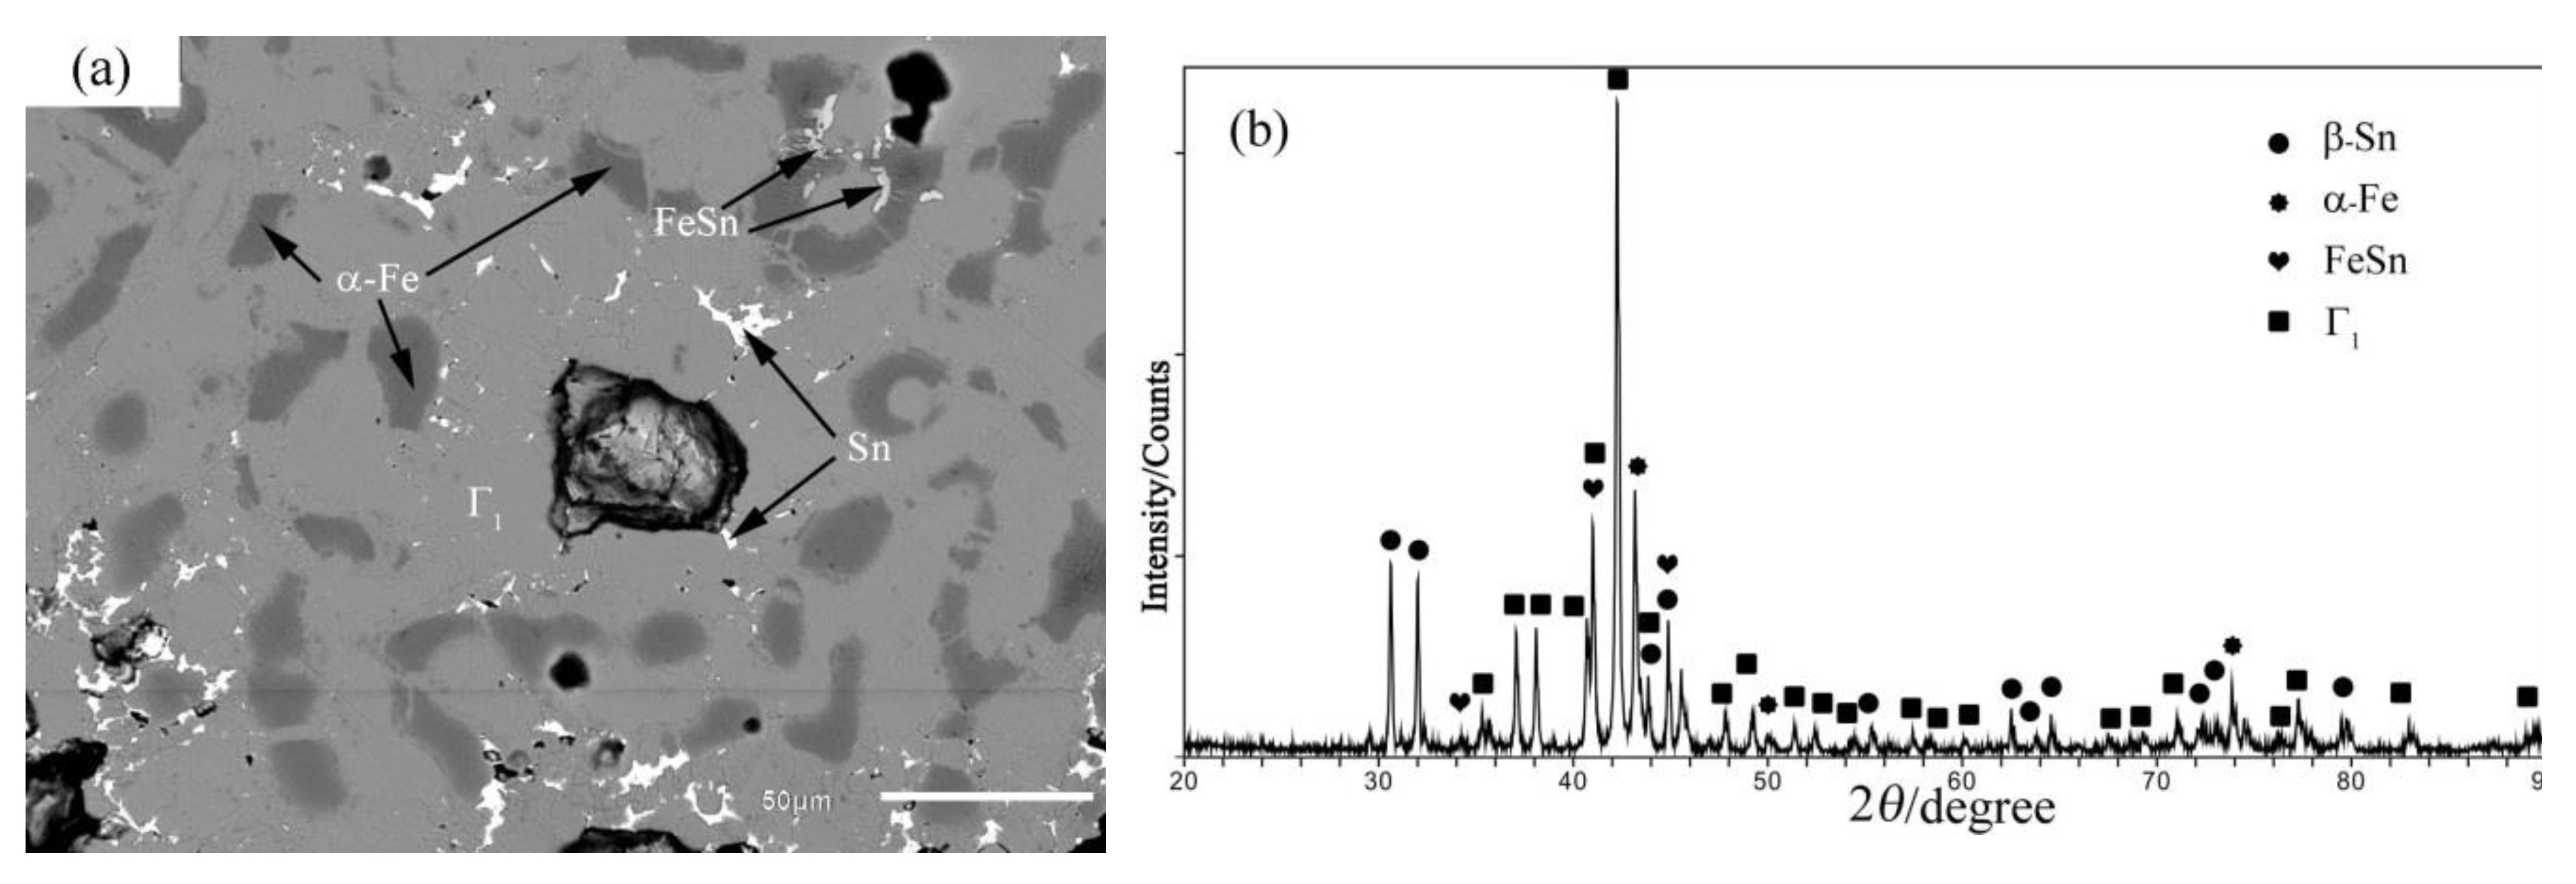
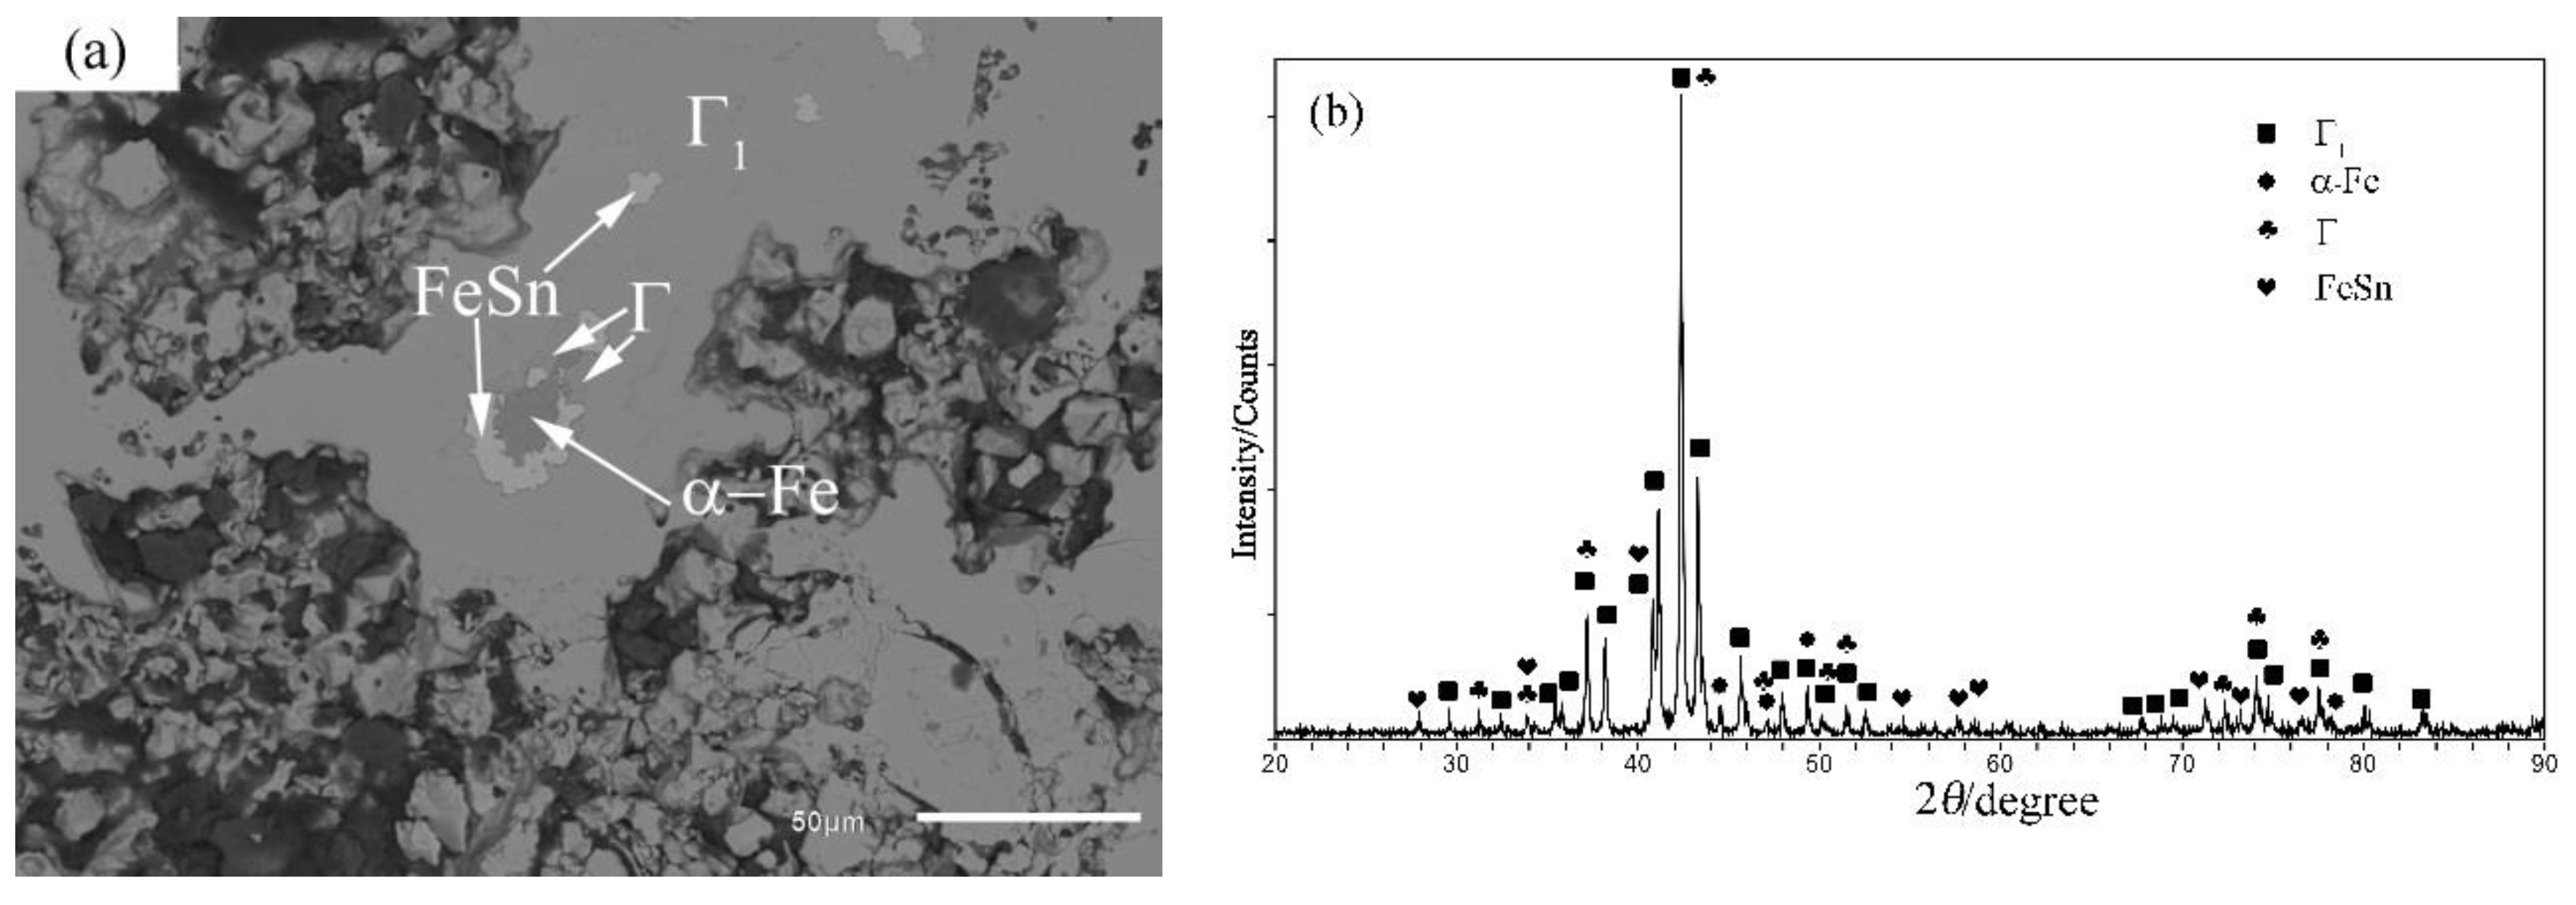
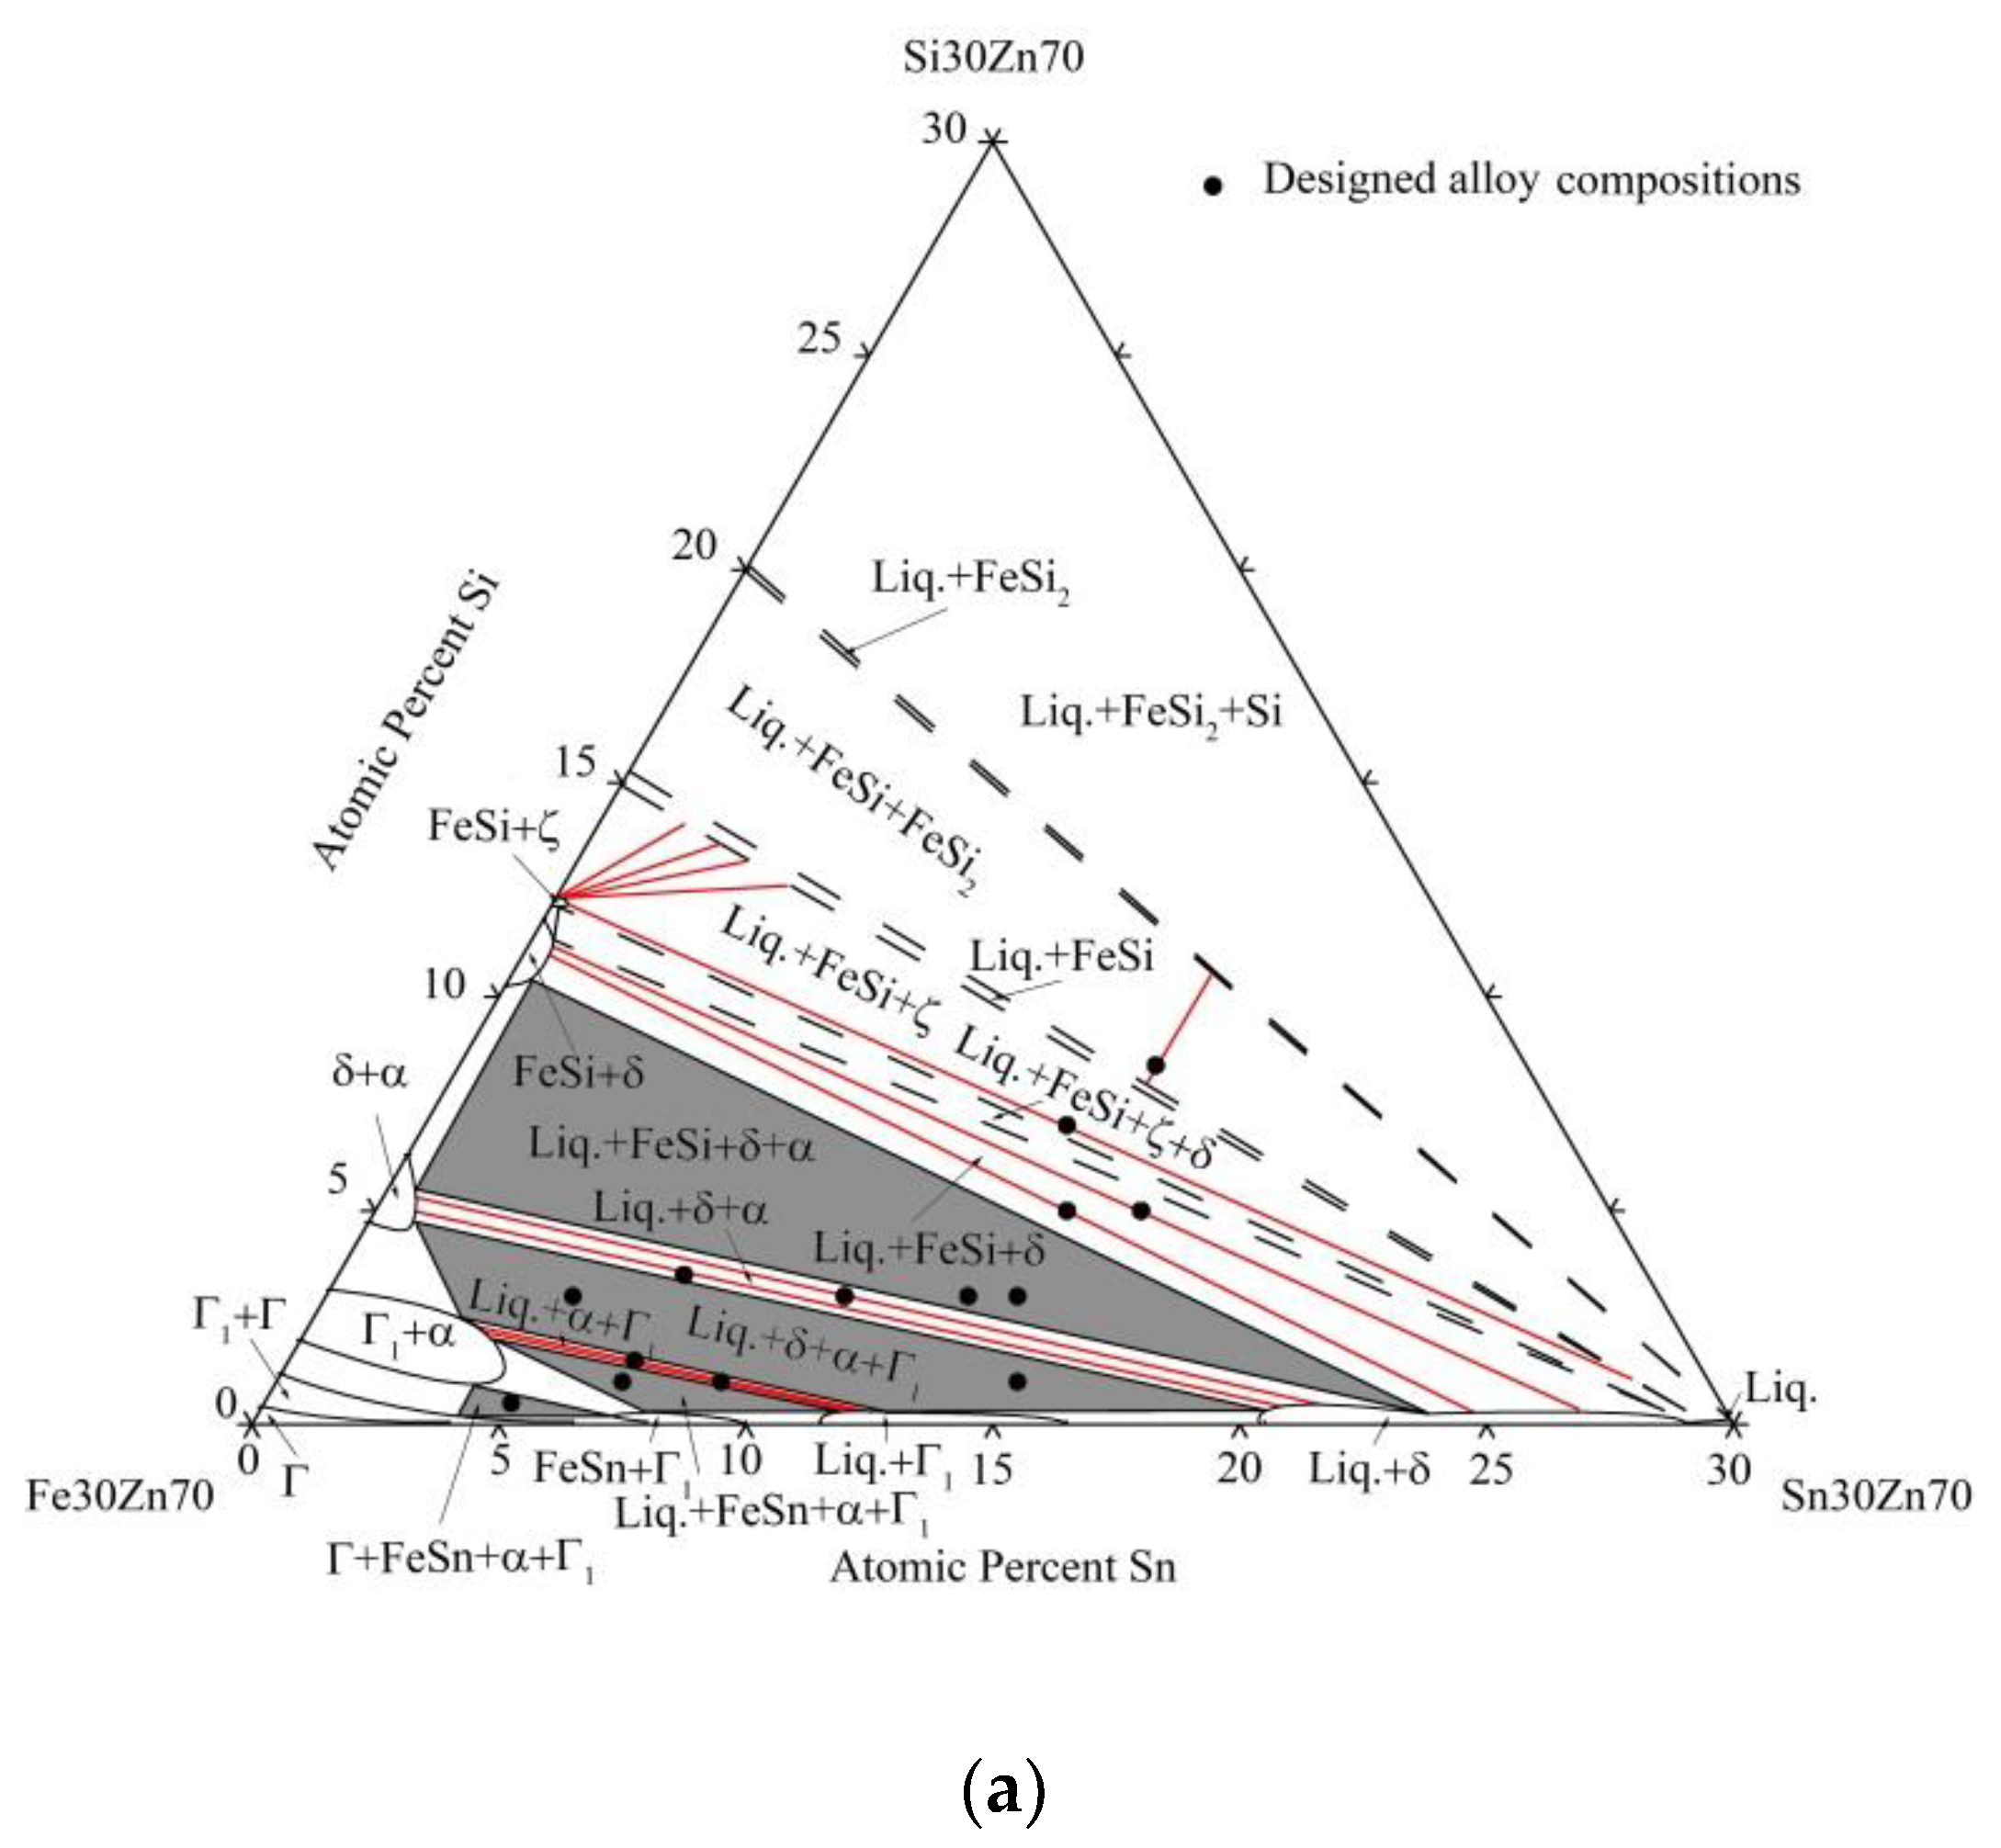
4.1. Phase Equilibrium of the Fe-Si-Sn-Zn Quaternary System at 450 °C with Zn Fixed at 70 at.%

Alloys marked as A1-A14 were prepared for determining the phase equilibriums in the 70 at.% section.
As shown in Figure 2 (Alloy A1), the larger dark phases are FeSi and the darker phases surrounding them are FeSi2. The matrix is the eutectic of η-Zn and β-Sn formed from the liquid phase (Liq.) during cooling. In the ternary system, the liquid solidifies as a degenerated eutectic mixture when its Sn content is lower than approximately 26 at.%. As the liquid solidifies into the mixtures of β-Sn and η-Zn, it is more reasonable to consider the result of the measured area as the actual composition. In conclusion, Alloy A1 consists of three phases at 450 °C: Liq., FeSi, and FeSi2.
Figure 3a indicates the presence of four phases in Alloy A2: FeSi, ζ, β-Sn, and η-Zn phases. The dark particles represent the FeSi phase, and the ζ phase exists as blocky crystallites in the matrix. The matrix is the eutectic of β-Sn and η-Zn, which is similar to that in A1. The ζ phase contains less than 0.3 at.% Sn and practically no Si, whereas the FeSi phase contains 1.1 at.% Zn and 0.4 at.% Sn. The XRD pattern of this alloy is shown in Figure 3b. As the matrix was consistent with eutectic compositions, the Zn and Sn peaks were the highest.
An examination of the microstructures of Alloys A3 and A4 indicates that they consisted of three phases at 450 °C: Liq., δ, and FeSi. As shown in Figure 4a, the dark FeSi grain and light-gray blocky δ phase coexist in the η-Zn and β-Sn matrix. The white phase is identified as β-Sn and the neighboring light-gray phase is identified as η-Zn. The XRD pattern of Alloy A3 (Figure 4b) indicates the existence of η-Zn and β-Sn. The solubility of Sn in the δ compound is 0.6 at.%.
The microstructures of Alloys A5 and A6 are similar, consisting of grey blocky phases, dark blocky phases, small dark particles, white phases and light grey phases(Figure 5). The SEM-EDS analysis suggests that the gray blocky area is a quaternary extension of the δ phase containing approximately 0.3 at.% Si and 0.5 at.% Sn. The dark blocky area is measured as 72.6 at.% Fe, 25.6 at.% Si, 0.9 at.% Zn, and 0.9 at.% Sn, suggesting that it is the α-Fe phase. The EDS analyses indicate that the small dark particles around the α-Fe phase contain almost the same atomic fraction of Fe and Si, suggesting that this area is the FeSi phase. The white areas are the β-Sn phases and the light-gray areas are the η-Zn phases, which were both formed by liquid similar to Alloy A1. The η-Zn and δ phases can be easily recognized because of their different reliefs.
Alloy A7 corresponds to the Liq. + α-Fe + δ three-phase equilibrium state, while the dark α-Fe and gray blocky δ phases coexist with the Liq. phase, as shown in Figure 6. In this alloy, the liquid phase mainly contains Sn (63.4 at.%) and the solubility of Sn in the α-Fe compound is 0.5 at.%. Moreover, the phase equilibrium in Alloy A8 is similar to that in Alloy 7.
The coexistence of the Liq., δ, α-Fe, and Γ1 phases can be identified through the SEM-EDS analyses of Alloys A9 and A10. Figure 7a shows the microstructure of Alloy A9. The solubility of Sn and Si in the Γ1 phase is 3.3 and 0.3 at.%, respectively. The XRD pattern obtained from Alloy A9 is shown in Figure 7b, in which the peaks can be contributed to the δ, α-Fe, Γ1, and β-Sn phases.
The microstructures of Alloys A11 (Figure 8) and A12 are similar. The result of the EDS indicates that the white β-Sn and locked η-Zn coexist with the dark α-Fe phases in the matrix of the gray Γ1 phase. Similarly to Alloy A1, η-Zn and β-Sn formed from the liquid phase (Liq.) during the cooling. Hence, Alloy A11 corresponded to the Liq. + Γ1 + α-Fe three-phase equilibrium state at 450 °C.
Figure 9a displays the microstructure of Alloy A13, which consists of two intermetallic phases and two solid-solution phases. The major component formed a matrix with other embedded minor phases. The SEM-EDS analyses and XRD suggest that the major, dark, and white areas represent the Γ1, α-Fe, and β-Sn phases, respectively, and the light gray areas adjacent to the dark areas represent the FeSn intermetallic phase. An XRD pattern obtained from the alloy is shown in Figure 9b. The peak at 2θ = 44.6° confirms the existence of the FeSn phase.
Figure 10a presents the microstructure of Alloy A14, which consists of four structural features: three intermetallic phases and a solid-solution phase. The intermetallic phases can be identified through XRD as the Γ, Γ1, and FeSn phases. The Sn solubility is 3.9 at.% in the Γ phase. The dark gray α-Fe phase is in equilibrium with the Γ, Γ1, and FeSn phases at 450 °C. Among the four phases, the Γ1 phase represents the matrix in Alloy A14. The XRD, as shown in Figure 10b, proves that the Γ1 phase has the highest intensity.

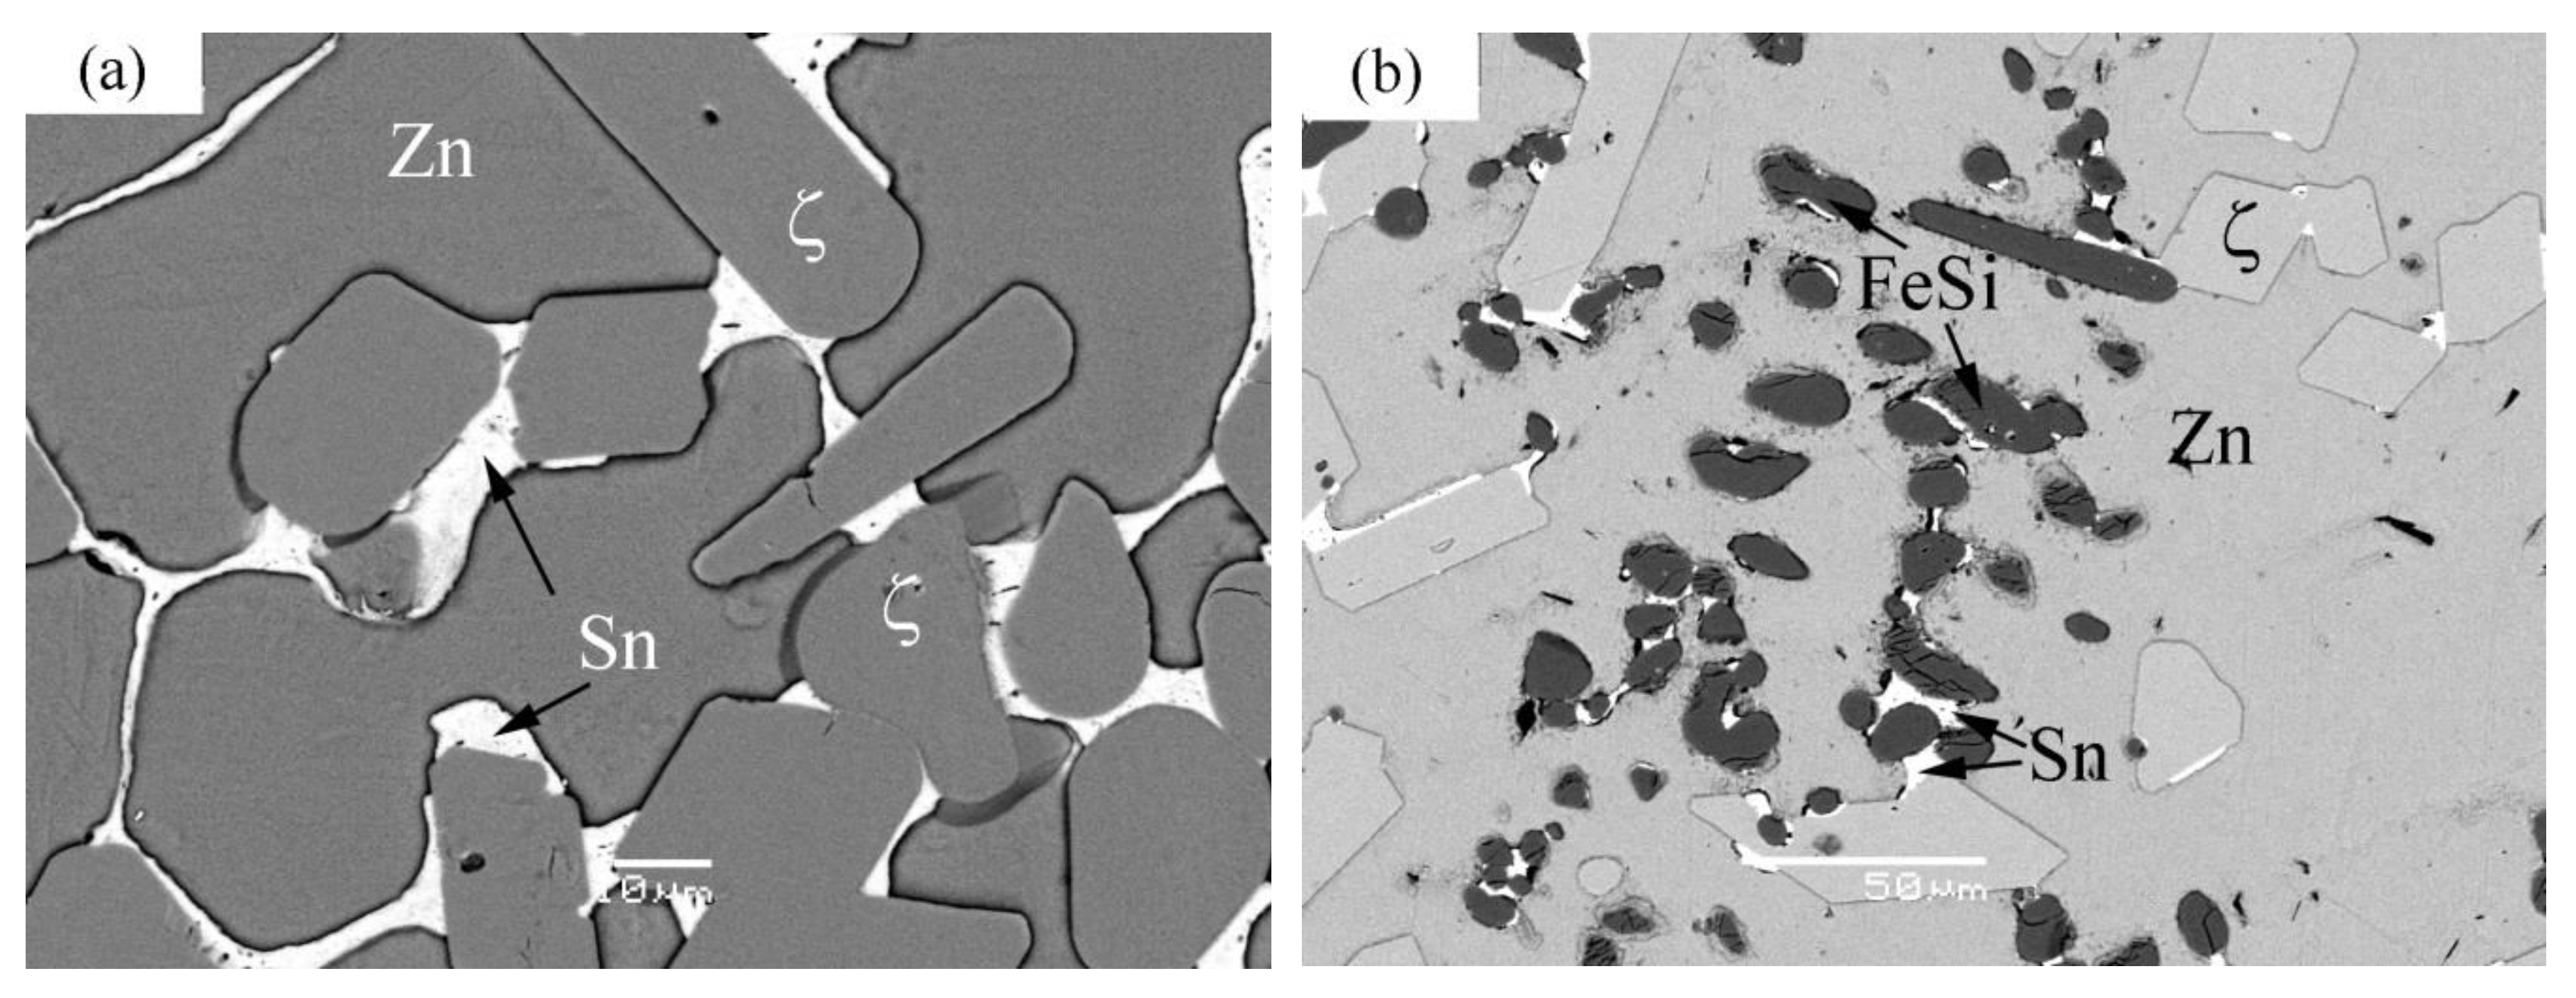
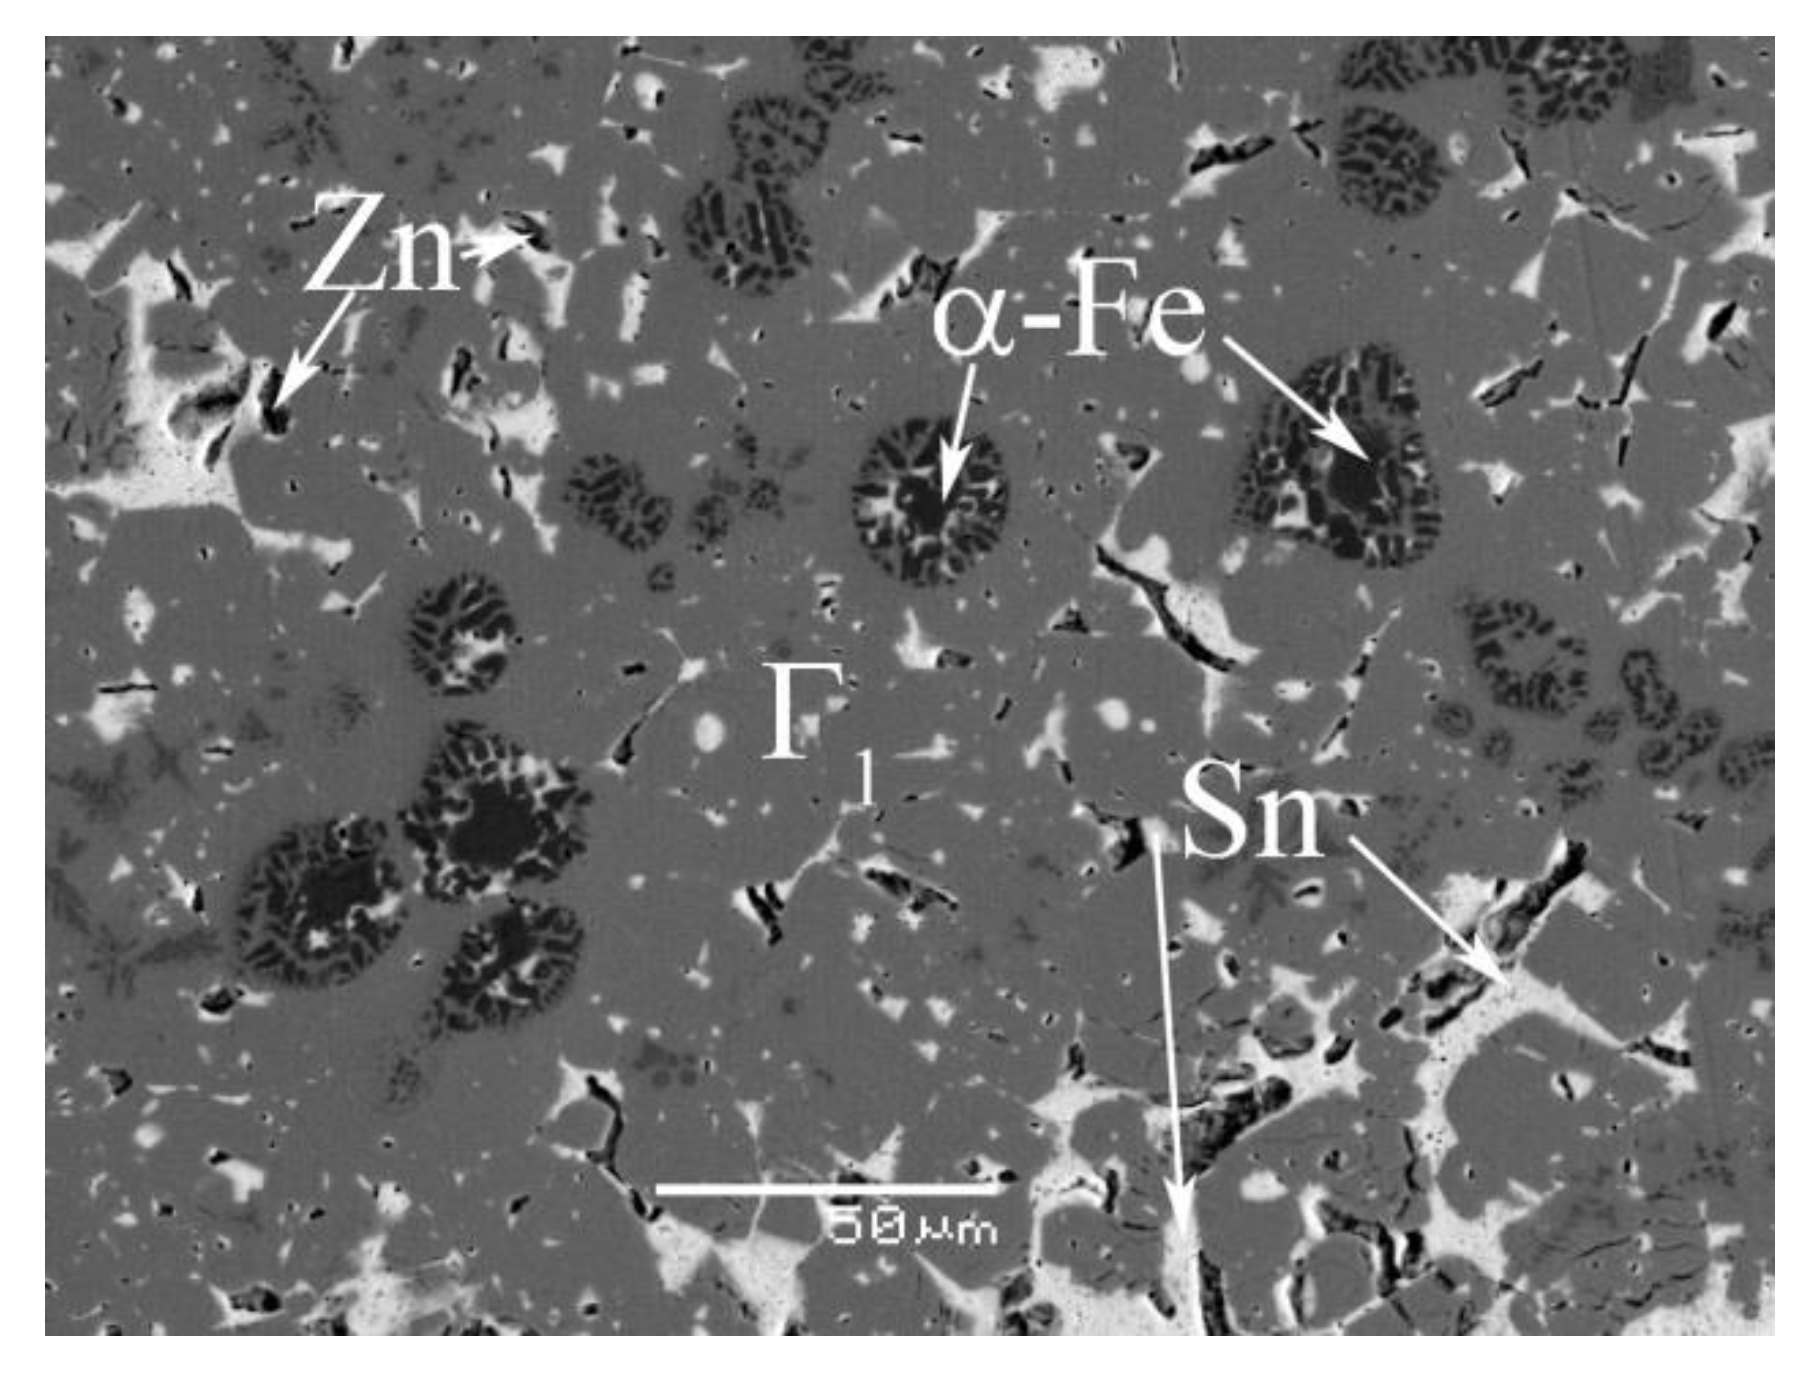
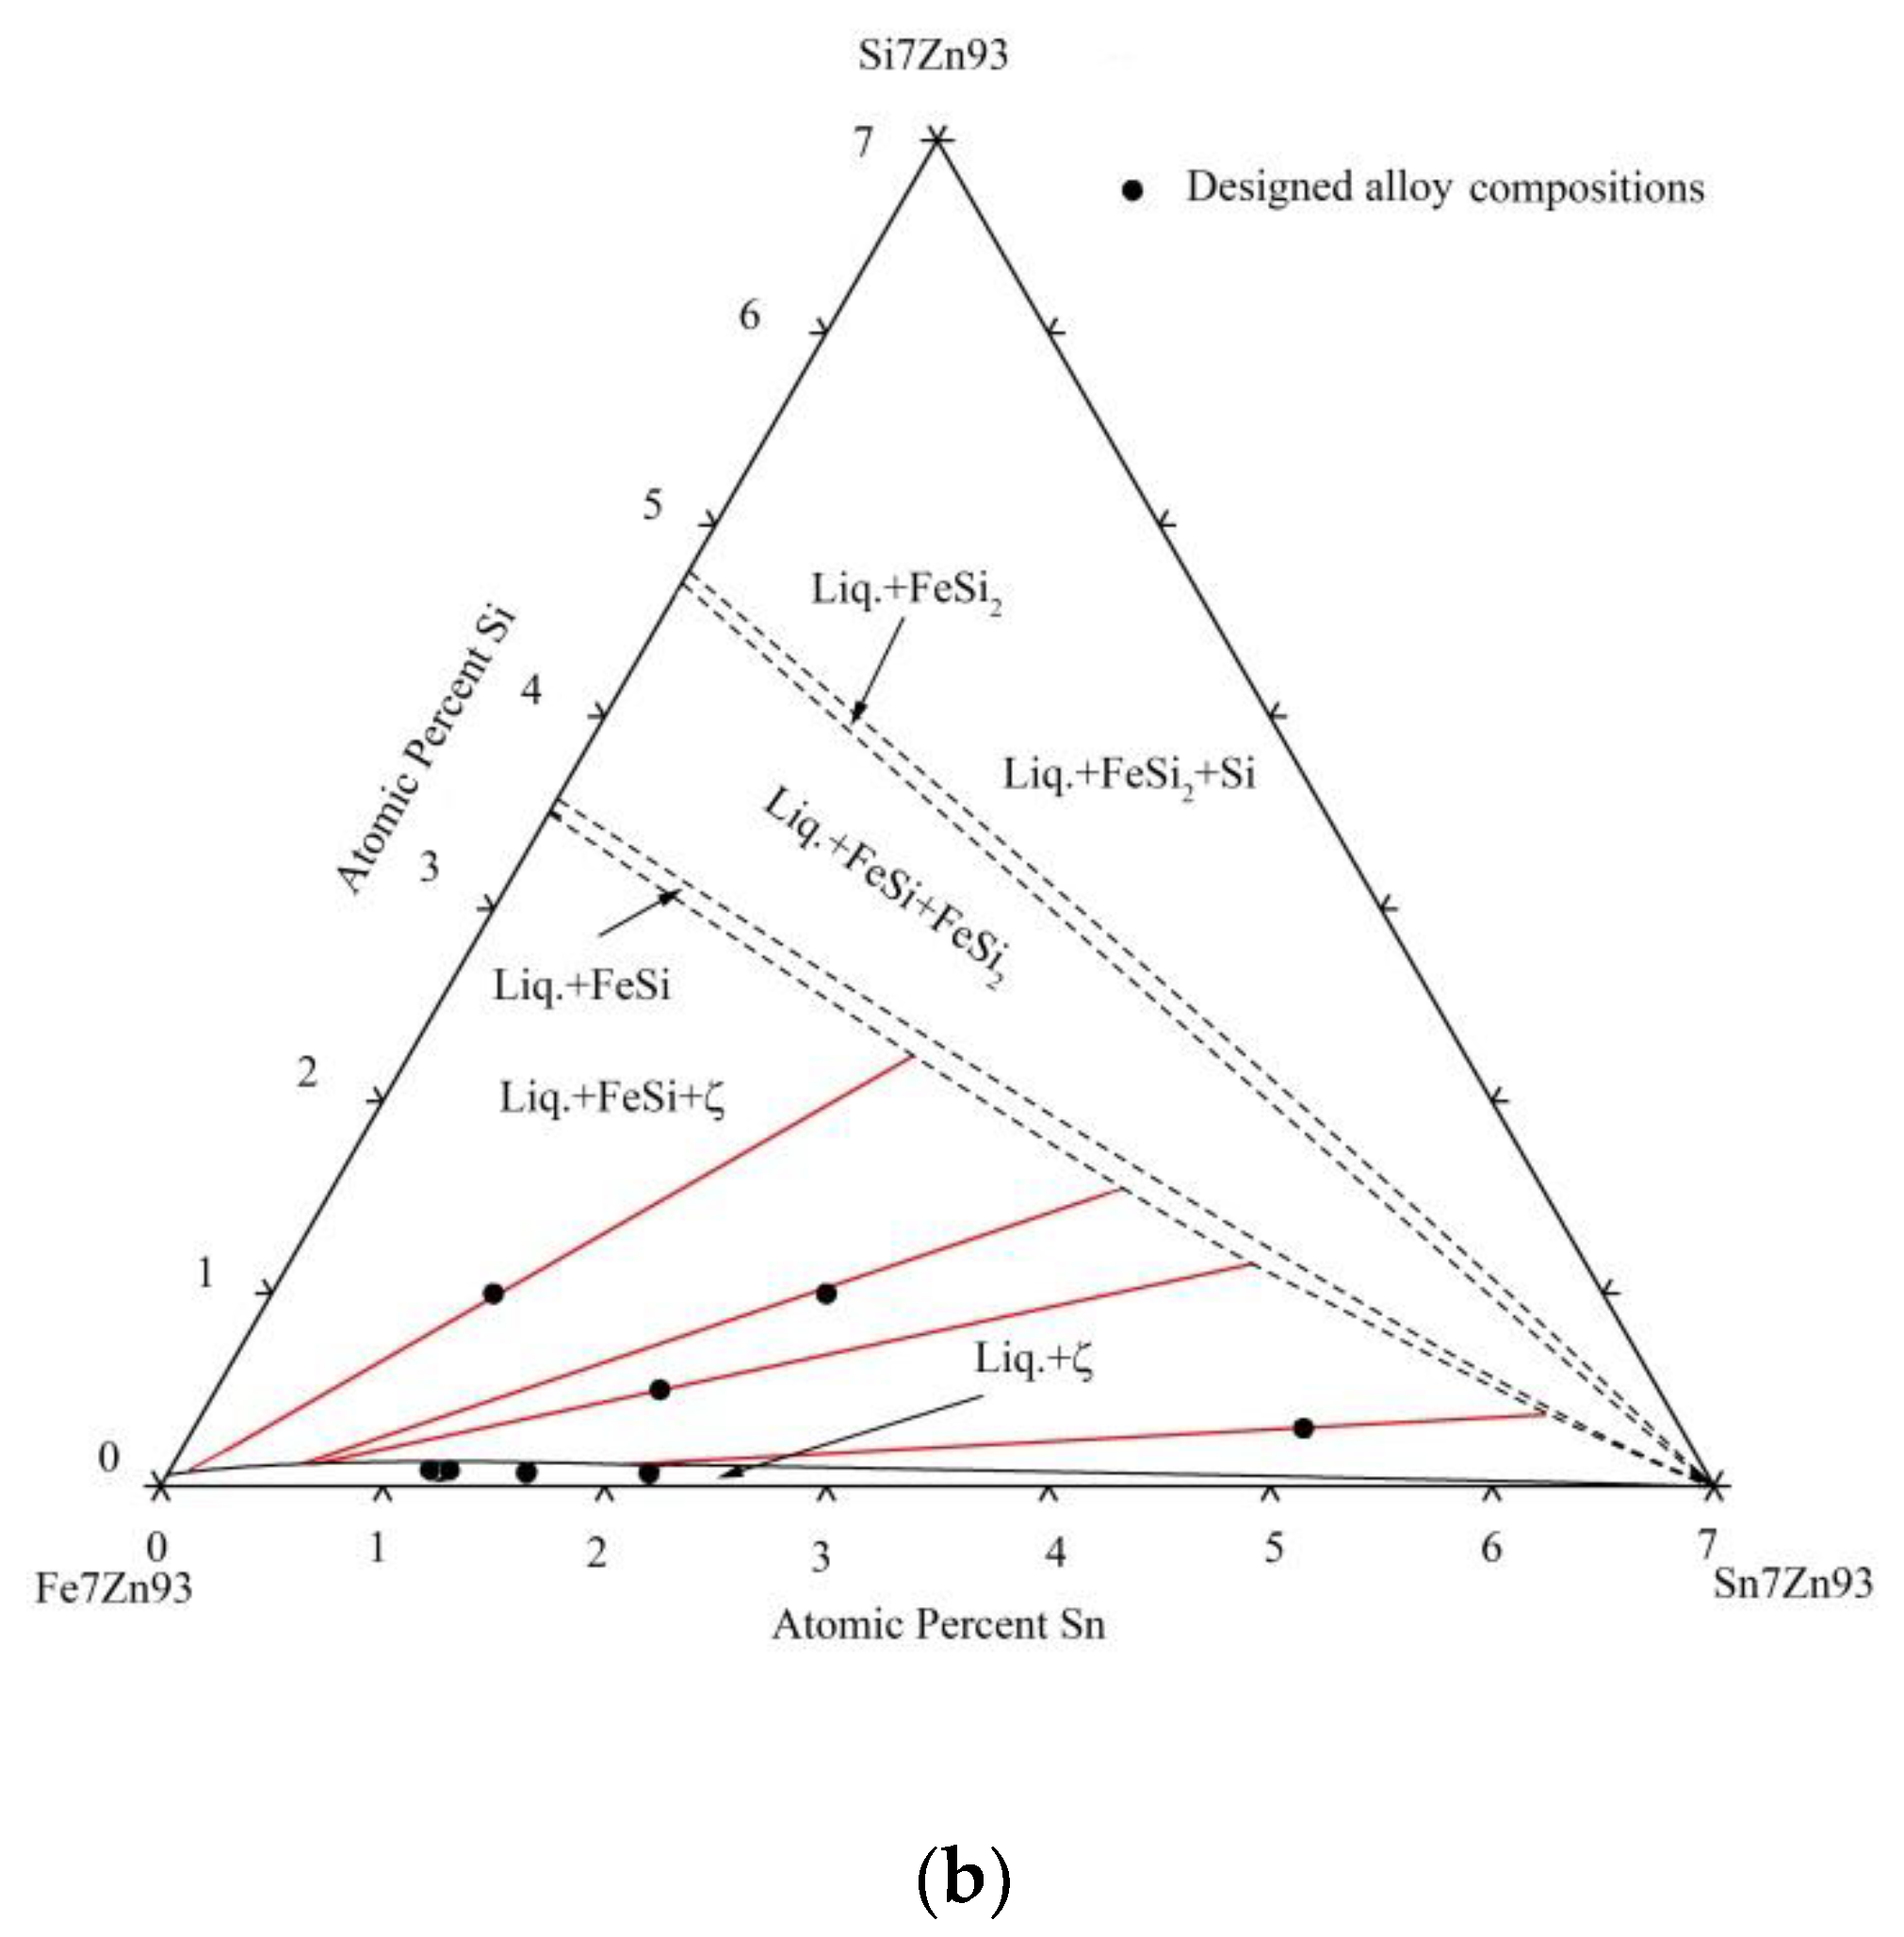
4.2. Phase Equilibrium of the Fe-Si-Sn-Zn Quaternary System at 450 °C with Zn Fixed at 93 At.%

Alloys marked as B1-B8 were prepared to determine the isothermal section of this system with Zn fixed at 93 at.%.
The microstructures of Alloys B1-B4 are similar. Figure 11a shows the microstructure of Alloy B1 as consisting of the Liq. and ζ phases. As the cooling rate is not rapid enough, the Liq. phase decomposes to the Zn-rich and Sn-rich phases. The Sn and Si solubilized in the ζ phase are limited.
As shown in Figure 11b, the dark FeSi and gray blocky ζ phases coexist in the matrix of Alloy B5. The matrix is a mixture of gray Zn-rich and Sn-rich solid-solution phases. The microstructures of Alloys B6 and B7 are similar, consisting of the Liq., FeSi, and ζ phases.
The phase equilibria in 70 and 93 at.% Zn-Fe-Si and Zn-Fe-Sn are based on the results of Su et al. [26] and Tang et al. [29], respectively. Based on the results of the microstructural studies and phase analyses, including the SEM-EDS and XRD analyses, and by consulting the Zn-rich corners of the relevant ternary systems, the 450 °C isothermal section of the Fe-Si-Sn-Zn system with Zn fixed at 70 and 93 at.% are constructed in Figure 12. Five four-phase regions, i.e., Liq. + FeSi + δ + ζ, Liq. + FeSi + δ + α-Fe, Liq. + δ + α-Fe + Γ1, Liq. + FeSn + α-Fe + Γ1, and Γ + FeSn + α-Fe + Γ1 exist in the isothermal section with 70 at.% Zn. By contrast, no four-phase region is experimentally identified in the isothermal section with 93 at.% Zn. The phase diagrams are constructed mainly on the four-phase field. When one of the phase compositions lies above the selected section (70 or 93 at.% Zn) and three other phase compositions are located below this section, the four-phase region is triangular. By contrast, when two equilibrium phases are on one side and two equilibrium phases are on the other side of the selected section, the four-phase field is represented as a quadrilateral. Furthermore, of note is that the projection of a specific equilibrium may appear in more than one section. For example, Sample B5 in Table 2 contains phases with 95.3 (Liq.), 92.7 (ζ), and 1.1 (FeSi) at.% Zn. Thus, this specific three-phase equilibrium can be projected in the sections at both 70 and 93 at.% Zn. Note that the red lines shown in the three-phase fields are projections of the measured tie-triangles within the plane.

5. Conclusions

In this study, isothermal sections of the Fe-Si-Sn-Zn quaternary system at 450 °C with Zn fixed at 70 and 93 at.% were determined based on SEM-EDS analyses and XRD results. The main conclusions are listed as follows.
(1)
Five four-phase regions exist in the isothermal section of the Fe-Si-Sn-Zn quaternary system at 450 °C with 70 at.% Zn. By contrast, no four-phase region is experimentally identified in the isothermal section with 93 at.% Zn.
(2)
The δ phase can coexist with the Liq. and FeSi phases.
(3)
The maximum solubility values of Sn and Zn in the FeSi phase are 0.4 and 1.2 at.%, respectively. The Sn percentages in the ζ, δ, Γ1, and Γ phases are 0.3, 1.1, 4.3, and 3.9 at.%, respectively. The Si percentages in the δ, Γ1, Γ, and FeSn phases are limited to 0.6, 0.3, 0.2, and 0.3 at.%, respectively.
(4)
No quaternary compound was found in the two sections.

Author Contributions

Conceptualization, X.W., F.Y., and Z.L.; data curation X.W. and X.S.; writing—original draft preparation, X.W., F.Y., and Z.L.; writing—review and editing, X.W.; X.C.; and X.S.

Funding

This research was funded by the National Science Foundation of China, grant number 51771160, the Provincial and Municipal Joint Fund for Natural Science of Hunan Province, grant number 2018JJ4048, and the Jiangsu Province Key Laboratory of Materials Surface Science and Technology, grant number KFBM20160002.

Conflicts of Interest

The authors declare no conflict of interest.

References

  1. Zhou, S.; Tu, H.; Wei, D.; Wu, C.; Wang, J.; Su, X. Experimental Determination of the Phase Equilibria of the La-Zn-Si System at 600 °C. J. Phase Equilib. Diffus. 2017, 38, 568–575. [Google Scholar] [CrossRef]
  2. Bellini, C.; Carlino, F. Intermetallic phase kinetic formation and thermal crack development in galvanized DCI. Frattura ed Integrita Strutturale 2019, 13, 740–747. [Google Scholar] [CrossRef]
  3. Yan, Y.; Su, X.; Liu, Y.; Ding, Y. 450 °C and 600 °C Isothermal Sections of the Zn-Cr-Si Ternary Phase Diagram. J. Phase Equilib. Diffus. 2018, 39, 166–175. [Google Scholar] [CrossRef]
  4. Wang, S.; Ma, K.; Liu, Y.; Wang, J.; Su, X. Phase Equilibria of 450 °C Isothermal Section of Zn-Al-Mg-Si Quaternary System. J. Phase Equilib. Diffus. 2017, 38, 906–915. [Google Scholar] [CrossRef]
  5. Wallinder, I.O.; Leygraf, C.; Karle′n, C.; Heijerick, D.; Janssen, C.R. Atmospheric Corrosion of Zinc-Based Materials: Runoff Rates. Chemical Speciation and Ecotoxicity Effects. Corros. Sci. 2001, 43, 809–816. [Google Scholar] [CrossRef]
  6. Bondareva, O.S.; Melnikov, A.A. Effect of the Silicon Content in Steel on the Hot-Dip Zinc Coating Microstructure Formation. IOP Conf. Ser. Mater. Sci. Eng. 2016, 156, 012015. [Google Scholar] [CrossRef]
  7. Liu, N.; Zhu, Z.; Ma, W.; Dai, Z.; Yin, F. The Zn-rich Corner of the Zn-Fe-V-Sb Quaternary Systems at 450 and 600 °C. J. Phase Equilib. Diffus. 2018, 39, 101–107. [Google Scholar] [CrossRef]
  8. Marder, A.R. The metallurgy of Zinc coated steel. Prog. Mater. Sci. 2000, 45, 191–271. [Google Scholar] [CrossRef]
  9. Gilles, M.; Sokolowski, R. The Zinc-Tin Galvanizing Alloy: A Unique Zinc Alloy for Galvanizing any Reactive Steel Grade. Proc. Intergalva 1997, 97, 8–11. [Google Scholar]
  10. Tu, H.; Wu, C.; Liu, Y.; Su, X.; Peng, H. Experimental Investigation of the 450 and 600 °C Sections of the Ti-V-Zn System. J. Phase Equilib. Diffus. 2016, 37, 651–657. [Google Scholar] [CrossRef]
  11. Lu, J.T.; Che, C.S.; Gang, K.; Xu, Q.Y.; Chen, J.H. Influence of silicon on the α-Fe/Γ interface of hot-dip galvanized steels. Surf. Coat. Tech. 2006, 200, 5277–5281. [Google Scholar]
  12. Tang, N.Y. Control of Silicon Reactivity in General Galvanizing. J. Phase Equilib. 2008, 29, 337–344. [Google Scholar] [CrossRef]
  13. Reumont, G.; Perrot, P.; Foct, J. Thermodynamic Study of the Galvanizing Process in a Zn-0.1%Ni Bath. J. Mater. Sci. 1998, 33, 4759–4768. [Google Scholar] [CrossRef]
  14. Reumont, G.; Gloriant, T.; Perrot, P. Experimental Influence of Kinetics on Galvanized Coatings when Saturating a Zinc Bath with Alloying Elements. J. Mater. Sci. Lett. 1996, 15, 445–449. [Google Scholar]
  15. Su, X.; Wu, C.; Liu, D.; Yin, F.; Zhu, Z.; Yang, S. Effect of Vanadium on Galvanizing Si-Containing Steels. Surf. Coat. Technol. 2010, 205, 213–218. [Google Scholar] [CrossRef]
  16. Zervoudis, J.; Anderson, G. A Review of Bath Alloy Additives and Their Impact on the Quality of the Galvanized Coating. In Proceedings of the 6th Asia Pacific General Galvanizing Conference, Mississauga, Canada, 29 May–2 June 2005; pp. 1–17. [Google Scholar]
  17. Pistofidis, N.; Vourlias, G.; Pavlidou, E.; Chrissafis, K.; Stergioudis, G.; K olychroniadis, E.; Tsipa, D. A Combined Characterization of Zinc Hot-Dip Galvanized Wires with DSC, XRD and SEM. J. Therm. Anal. Calorim. 2006, 86, 417–422. [Google Scholar] [CrossRef]
  18. Su, X.; Tang, N.Y.; Toguri, J.M. Thermodynamic Evaluation of the Fe-Zn System. J. Alloys Compd. 2001, 325, 129–136. [Google Scholar] [CrossRef]
  19. Raghavan, V. Fe-Zn (Iron-Zinc). J. Phase Equilib. 2003, 24, 544–545. [Google Scholar] [CrossRef]
  20. Nakano, J.; Malakhov, D.V.; Purdy, G.R. A Crystallographic Consistent Optimization of the Zn-Fe System. Calphad 2005, 29, 276–288. [Google Scholar] [CrossRef]
  21. Xiong, W.; Kong, Y.; Du, Y.; Liu, Z.K.; Selleby, M.; Sun, W.H. Thermodynamic Investigation of the Galvanizing Systems, I: Refinement of the Thermodynamic Description for the Fe-Zn System. Calphad 2009, 33, 433–440. [Google Scholar] [CrossRef]
  22. Weitzer, F.; Schuster, J.C.; Naka, M.; Stein, F.; Palm, M. On the Reaction Scheme and Liquidus Surface in the Ternary System Fe-Si-Ti. J. Intermetallics 2008, 16, 273–282. [Google Scholar] [CrossRef]
  23. Giefers, H.; Nicol, M. High Pressure X-Ray Diffraction Study of All Fe-Sn Intermetallic Compounds and One Fe-Sn Solid Solution. J. Alloys Compd. 2006, 422, 132–144. [Google Scholar] [CrossRef]
  24. Koster, W. The Iron-Silicon-ZincTernary System. Metallurgia 1969, 80, 219–229. [Google Scholar]
  25. Bretez, M.; Dauphin, J.Y.; Foct, J.; Perro, P. Phase Relations and Diffusion Paths in the System Zinc Vapor-Iron Silicon Alloys at 773 and 973 K. Z. Metallkd. 1987, 78, 137–140. [Google Scholar]
  26. Perrot, P.; Dauphin, J.Y. Calculation of the Fe-Zn-Si Phase Diagram between 773 and 1173 K. Calphad 1988, 12, 33–40. [Google Scholar] [CrossRef]
  27. Foct, J.; Perrot, P.; Reumont, G. Interpretation of the Role of Silicon on the Galvanizing Reaction Based on Kinetics, Morphology and Thermodynamics. Script. Metall. Mater. 1993, 98, 1195–1200. [Google Scholar] [CrossRef]
  28. Su, X.; Tang, N.Y.; Toguri, J.M. 450 °C Isothermal Section of the Fe-Zn-Si Ternary Phase Diagram. Can. Metall. Q. 2001, 40, 377–384. [Google Scholar] [CrossRef]
  29. Wang, J.; Su, X.; Yin, F.; Li, Z.; Zhao, M. The 480 °C and 405 °C Isothermal Sections of the Phase Diagram of the Fe-Zn-Si Ternary System. J. Alloys Compd. 2005, 399, 214–218. [Google Scholar] [CrossRef]
  30. Sha, C.; Liu, S.; Du, Y.; Xu, H.; Zhang, L.; Liu, Y. Experimental Investigation and Thermodynamic Reassessment of the Fe-Si-Zn System. Calphad 2010, 34, 405–414. [Google Scholar] [CrossRef]
  31. Tang, N.Y.; Su, X.; Yu, X. A Study of the Zn-Rich Corner of the Zn-Fe-Sn System. J. Phase Equilib. 2003, 24, 528–532. [Google Scholar] [CrossRef]
Figure 1. Ternary isothermal sections at 450 °C used as reference in the current study: (a) Zn-Fe-Si; Reproduction from [28], with permission of Taylor & Francis (b) Zn-Fe-Sn [31]. Reproduction from [31], with permission of Springer.
Metals 09 00908 g001
Figure 2. The microstructure of Alloy A1.
Metals 09 00908 g002
Figure 3. The microstructure (a) and the XRD pattern (b) of Alloy A2.
Metals 09 00908 g003
Figure 4. The microstructure (a) and XRD pattern (b) of Alloy A3.
Metals 09 00908 g004
Figure 5. The microstructure of Alloy A5.
Metals 09 00908 g005
Figure 6. The microstructure of Alloy A6.
Metals 09 00908 g006
Figure 7. The microstructure (a) and XRD pattern (b) of Alloy A9.
Metals 09 00908 g007
Figure 8. The microstructure of Alloy A11.
Metals 09 00908 g008
Figure 9. The microstructure (a) and XRD pattern (b) of Alloy A13.
Metals 09 00908 g009
Figure 10. The microstructure (a) and XRD pattern (b) of Alloy A14.
Metals 09 00908 g010
Figure 11. The SEM images of Alloys B1 and B5. (a) The microstructure of Alloy B1. (b) The microstructure of Alloy B5.
Metals 09 00908 g011
Figure 12. Isothermal sections of the Fe-Si-Sn-Zn quaternary system at 450 °C with Zn fixed at 70 (a) and 93 at.% (b).
Metals 09 00908 g012aMetals 09 00908 g012b
Table 1. Crystallographic data of the intermetallic compounds relevant to the present work.
PhaseCompositions, at.%Lattice Parameter, nmSpace GroupPrototypeReference
ZnFeSiSnabc
Γ-Fe3Zn1068.5-82.517.5-32.5--0.8932--I43mCu5Zn8[20]
Γ1-Fe11Zn4075-8119-25--1.7963--F43m-[20]
δ-FeZn1086.5-91.88.2-13.5--1.282-5.704P63mcFeZn10[20]
ζ-FeZn1392.8-946-7.2--1.34240.76080.5061C2/mCoZn13[20]
FeSi-5050-0.44891--P213FeSi[22]
FeSi2-66.733.3-0.987920.779910.78388CmcaFeSi2[22]
FeSn-50-500.5298-0.4448P6/mmmCoSn[23]
Table 2. Composition of samples and phases in the 450 °C isothermal section of the Fe-Si-Sn-Zn quaternary system with Zn fixed at 70 at.%.
SampleDesign CompositionPhaseComposition (at.%)
ZnFeSiSn
A17.5Fe-8.5Si-14Sn-70ZnLiq.83.2 ± 0.30.00.016.8 ± 0.2
FeSi0.8 ± 0.149.3 ± 0.849.7 ± 0.40.2 ± 0.1
FeSi21.7 ± 0.332.6 ± 0.665.2 ± 0.20.5 ± 0.1
A210Fe-7Si-13Sn-70ZnLiq.71.5 ± 0.40.5 ± 0.20.028.0 ± 0.4
FeSi1.1 ± 0.148.9 ± 0.949.6 ± 0.60.4 ± 0.1
ζ92.4 ± 0.47.3 ± 0.40.00.3 ± 0.1
A311Fe-5Si-14Sn-70ZnLiq.60.5 ± 0.20.00.5 ± 0.239.0 ± 0.4
FeSi1.2 ± 0.349.3 ± 0.249.3 ± 0.20.2 ± 0.1
δ90.2 ± 0.89.2 ± 0.80.00.6 ± 0.2
A49.5Fe-15Si-15.5Sn-70ZnLiq.49.6 ± 0.40.5 ± 0.10.6 ± 0.349.3 ± 0.8
FeSi1.2 ± 0.449.4 ± 0.449.2 ± 0.50.2 ± 0.1
δ89.8 ± 1.09.6 ± 0.40.00.6 ± 0.1
A513Fe-3Si-14Sn-70ZnLiq.51.4 ± 0.20.6 ± 0.10.2 ± 0.147.8 ± 0.6
FeSi0.8 ± 0.149.4 ± 0.549.4 ± 0.40.4 ± 0.1
δ87.9 ± 0.411.3 ± 0.20.3 ± 0.10.5 ± 0.1
α0.9 ± 0.172.6 ± 0.425.6 ± 0.60.9 ± 0.2
A614Fe-3Si-13Sn-70ZnLiq.51.3 ± 0.20.5 ± 0.20.2 ± 0.148.0 ± 0.5
FeSi0.7 ± 0.149.5 ± 0.649.5 ± 0.60.3 ± 0.1
δ87.9 ± 0.511.3 ± 0.20.4 ± 0.10.4 ± 0.1
α0.9 ± 0.172.7 ± 0.725.5 ± 0.60.9 ± 0.2
A716.5Fe-3Si-10.5Sn-70ZnLiq.36.0 ± 0.60.4 ± 0.10.2 ± 0.163.4 ± 0.1
δ86.7 ± 0.511.9 ± 0.20.6 ± 0.10.8 ± 0.1
α4.2 ± 0.171.7 ± 0.123.9 ± 0.50.2 ± 0.1
A819.5Fe-3.5Si-7Sn-70ZnLiq.35.5 ± 0.50.6 ± 0.10.5 ± 0.163.4 ± 0.6
δ85.9 ± 0.612.8 ± 0.20.4 ± 0.10.9 ± 0.1
α4.9 ± 0.470.8 ± 0.723.8 ± 0.50.5 ± 0.1
A922Fe-3Si-5Sn-70ZnLiq.10.9 ± 0.10.1 ± 0.10.4 ± 0.188.6 ± 0.1
δ86.7 ± 0.311.9 ± 0.50.3 ± 0.11.1 ± 0.1
α7.2 ± 0.671.0 ± 0.621.4 ± 0.50.4 ± 0.1
Γ177.3 ± 0.519.1 ± 0.60.3 ± 0.13.3 ± 0.6
A1014Fe-1Si-15Sn-70ZnLiq.10.8 ± 0.10.00.3 ± 0.188.9 ± 0.6
δ86.8 ± 0.711.9 ± 0.20.3 ± 0.11.0 ± 0.2
α7.1 ± 0.271.1 ± 0.721.4 ± 0.50.4 ± 0.2
Γ177.3 ± 0.319.2 ± 0.50.3 ± 0.13.2 ± 0.2
A1120Fe-1Si-9Sn-70ZnLiq.12.6 ± 0.50.1 ± 0.10.1 ± 0.187.2 ± 0.7
α7.2 ± 0.771.1 ± 0.321.1 ± 0.50.6 ± 0.1
Γ176.6 ± 0.719.3 ± 0.40.3 ± 0.13.8 ± 0.1
A1221.5Fe-1.5Si-7Sn-70ZnLiq.14.7 ± 0.30.00.3 ± 0.185.0 ± 0.5
α6.5 ± 0.472.1 ± 0.321.4 ± 0.20.0
Γ176.1 ± 0.719.6 ± 0.50.3 ± 0.54.0 ± 0.1
A1322Fe-1Si-7Sn-70ZnLiq.10.4 ± 0.20.00.4 ± 0.189.2 ± 0.8
FeSn1.9 ± 0.447.7 ± 0.50.3 ± 0.150.1 ± 0.5
α6.9 ± 0.172.2 ± 0.420.5 ± 0.80.4 ± 0.1
Γ175.8 ± 0.519.7 ± 0.10.3 ± 0.14.2 ± 0.1
A1424.5Fe-0.5Si-5Sn-70ZnΓ66.8 ± 0.729.1 ± 0.20.2 ± 0.13.9 ± 0.1
FeSn4.3 ± 0.446.1 ± 0.50.1 ± 0.149.5 ± 0.3
α2.5 ± 0.285.8 ± 0.611.4 ± 0.20.3 ± 0.1
Γ174.5 ± 0.521.0 ± 0.20.2 ± 0.14.3 ± 0.4
B14.9Fe-0.1Si-2Sn-93ZnLiq.94.3 ± 1.0 0.0 0.0 5.7 ± 0.3
ζ92.2 ± 0.5 7.7 ± 0.2 0.1 ± 0.1 0.0
B25.3Fe-0.1Si-1.6Sn-93ZnLiq.94.5 ± 1.0 0.1 ± 0.1 0.0 5.4 ± 0.1
ζ92.4 ± 0.5 7.4 ± 0.2 0.1 ± 0.1 0.1 ± 0.1
B35.7Fe-0.1Si-1.2Sn-93ZnLiq.95.1 ± 0.4 0.0 0.0 4.9 ± 0.2
ζ92.3 ± 0.3 7.6 ± 0.4 0.1 ± 0.1 0.0
B45.5Fe-0.1Si-1.4Sn-93ZnLiq.94.7 ± 1.0 0.0 0.0 5.3 ± 0.4
ζ92.4 ± 0.87.5 ± 0.10.1 ± 0.10.0
B51.7Fe-0.3Si-5Sn-93ZnLiq.93.7 ± 0.60.2 ± 0.10.06.1 ± 0.2
FeSi1.2 ± 0.249.5 ± 0.249.2 ± 0.80.1 ± 0.1
ζ92.8 ± 0.76.9 ± 0.30.1 ± 0.10.2 ± 0.1
B64.5Fe-0.5Si-2Sn-93ZnLiq.95.3 ± 0.70.1 ± 0.10.04.6 ± 0.3
FeSi1.1 ± 0.249.5 ± 0.249.1 ± 0.70.3 ± 0.2
ζ92.8 ± 0.36.9 ± 0.20.1 ± 0.10.2 ± 0.1
B75Fe-1Si-1Sn-93ZnLiq.97.4 ± 0.60.2 ± 0.10.02.4 ± 0.3
FeSi1.4 ± 0.149.3 ± 0.749.2 ± 0.70.1 ± 0.1
ζ92.6 ± 0.77.2 ± 0.20.2 ± 0.10.0
B83.5Fe-1Si-2.5Sn-93ZnLiq.95.9 ± 0.70.5 ± 0.10.03.6 ± 0.2
FeSi0.8 ± 0.249 ± 0.749.9 ± 0.20.3 ± 0.1
ζ92.6 ± 0.77.2 ± 0.60.1 ± 0.10.1 ± 0.1

