Article

Influence of Alloy Elements on Cracking in the Steel Ingot during Its Solidification

College of Materials Science and Engineering, Chongqing University, Chongqing 400044, China
*
Author to whom correspondence should be addressed.
Metals 2019, 9(8), 836; https://doi.org/10.3390/met9080836
Submission received: 22 June 2019 / Revised: 19 July 2019 / Accepted: 25 July 2019 / Published: 27 July 2019

Abstract

:
The average steepness of |dT/d(fs)1/2| on the T − (fs)1/2 curve were calculated during peritectic solidification, which was used to investigate the effect of alloying elements on surface longitudinal cracks of peritectic steels in the solidification process. The value of |dT/d(fs)1/2| indicates the liquid feeding capacity between interdendrites during solidification, where cracks can easily occur if there is poor capacity of liquid feeding, as in peritectic solidification shrinkage. The cracking tendency as a function of carbon content was well described by the |dT/d(fs)1/2| at the cooling rates of 0.5, 5, and 10 °C/s, and the influences of other solute elements on |dT/d(fs)1/2| were also calculated. The results indicate that the possibility of crack occurrence increased and the maximum average steepness |dT/d(fs)1/2| changed from 496.75 °C located near 0.09C wt.% to 622.14 °C near 0.11C wt.% with increasing cooling rate. The value of |dT/d(fs)1/2| on the T − (fs)1/2 curve during the peritectic solidification can be used to analyze the solidification crack for peritectic steels.

1. Introduction

Some alloys are susceptible to cracking during solidification, which has attracted the interest of many researchers. One of the most important examples in industrial practice is the production of peritectic steels in continuous casting, in which frequently occurring cracks are called hot tears, including surface longitudinal cracks and internal cracks [1,2,3,4,5,6,7,8]. Surface longitudinal crack formation is caused by the brittleness of the dendritic front, and all cracks observed originate and propagate along the interdendrites in the mushy zone [6,8]. The mushy zone contains liquid and dendritic grains, where dendritic grains are separated from one another by liquid, and this semisolid substance has little strength and ductility. When the tension deformation caused by shrinkage is directed perpendicularly to the dendrite axis to separate them in the deformation dendrite roots, cracks can form if the interdendritic liquid is isolated and cannot be fed from the surrounding liquid [3].
The shrinkage development during initial solidification is related to the composition of alloys and the cooling history. It is well known that the complex peritectic phase transition process—liquid (L) + delta-Fe (δ) → austenite (γ)—occurring at the solid/liquid interface, is the reason that peritectic steels incur cracks more easily than other steels. The peritectic phase transition entails two different events during solidification [9,10]. Firstly, γ nucleates and grows along the L/δ interface when the peritectic reaction starts, then the subsequent peritectic transformation occurs when the L and δ are separated by γ. A strong contraction and tensile strain are induced by the peritectic transformation, which is deemed critical for the crack susceptibility of the steel grades [11]. As a whole, the crack susceptibility can be affected by both the peritectic reaction and peritectic transformation rates, which change the shrinkage.
Several models have been proposed for evaluating the tendency of solidification cracks. Various methods can be divided into three categories based on liquid feeding (non-mechanical methods) [12,13,14,15,16], stress and strain (mechanical methods) [4,6,17], and a combination of the two methods. A model of feeding behavior was first proposed by Feurer [12] to analyze the crack formation between dendrites, where two parameters, SPV (the maximum flow rate) and SRG (solidification shrinkage rate), were used and a crack occurs when SPV < SRG. In the model of Clyne and Davies [13], the assumption of Feurer [12] was considered. The mushy zone was divided into liquid feeding zone and cracking zone at the last stage of solidification, where the crack susceptibility is the ratio of the time period where cracks may occur and the time period where liquid feeding occurs. The RDG (Rappaz–Drezet–Gremaud) model proposed by Rappaz et al. [14] was the first hot cracks model with a physically sound basis, which considered the unidirectional growth of columnar crystals, the effect of the transverse stress on dendrites, and liquid feeding opposite to the growth direction. In addition, based on the RDG model, a new criterion—the slope of |dT/d(fs)1/2| near (fs)1/2 = 1—was recently developed by Kou [15] to analyze the solidification crack of aluminum alloys. However, known from the eutectic solidification of aluminum alloy, a complex peritectic phase transition takes place for the solidification of peritectic steels. The effect of peritectic solidification on liquid flow to compensate shrinkage as the key should be paid more attention.
In this paper, in order to evaluate the possibility of crack formation, the ability of liquid flow to feed the shrinkage was analyzed during peritectic solidification. According to the relationship between shrinkage and liquid feeding, the average steepness of |dT/d(fs)1/2| on the curve of T − (fs)1/2 during the process of peritectic phase transition was used to analyze the solidification crack, and the effect of alloy composition on cracks was calculated and predicted.

2. Calculation

The steepness of |dT/d(fs)1/2| near (fs)1/2 = 1 on the curve of T − (fs)1/2 was proposed by Kou to analyze the solidification crack of aluminum alloys [15,16], where the crack formation condition follows Equation (1):
d ε local d T > 1 β d f s d T + 1 ( d T / d t ) d d z [ ( 1 1 β f s ) v z ] ,
where εlocal is the local strain, T is temperature, β is solidification shrinkage, fs is solidification fraction, dT/dt is cooling rate, and vz is liquidus-isotherm. The left-hand side of the equation represents the strain to separate the two adjacent grains to form the crack. On the right-hand side, the first item represents the growth of two adjacent grains toward each other to bond together to resist cracking, and the second item represents the liquid feeding between adjacent grains to resist cracking. When the |d(fs)1/2/dT| is smaller—namely, the |dT/d(fs)1/2| is much larger—there is a longer liquid channel between grains due to the lower lateral growth between two adjacent grains. If the length of the channel increased and the width of the liquid channel decreased, according to the Hagen-Poiseuille law [18], the velocity of liquid passing through the channel would decrease. At that time, the crack would form if the capacity of liquid flow was poor or could not be compensated. Moreover, a long liquid channel along the grain boundary is also conducive to crack propagation. For the solidification of peritectic steels, the peritectic phase transition during terminal solidification is the key factor for the occurrence of cracks. With a significantly larger shrinkage imposed on the interdendrites, the capacity of liquid flow to feed has a decisive effect on the formation of cracks [12,13,14,15]. Figure 1a shows a schematic diagram of the dendrite solidification of peritectic steel. An obvious lateral tensile deformation caused from the phase transition of δ to γ will increase the separation of neighboring grains, combined with the thermal shrinkage. Here, the peritectic solidification shrinkage and the thermal shrinkage can be represented by εlocal, and the evaluation capacity of liquid feeding at the last stage of solidification has meaning for the analysis of crack occurrence.
It is generally believed that a crack is most likely to occur between the point of feeding becoming inadequate and the end point of solidification. Clyne and Davies [13] defined the solidification ranging from fs = 0.4 to fs = 0.99 as the crack formation zone. Here, the peritectic solidification process is a continuous process, and the solidification range of peritectic solidification varies greatly for different steels. For example, the peritectic solidification of hyper-peritectic steels occurs earlier than for hypo-peritectic steels in the solid fraction, and the solid fraction of some steels may still be in the liquid free-flow zone after the peritectic solidification is complete. The relationships between liquid feeding, peritectic solidification shrinkage, and crack formation are simplified in this paper. Here, the shrinkage in the interdendrites due to the peritectic solidification was considered to be similar, and the capacity of liquid flow feeding is only discussed during the peritectic phase transition process. When calculating, the crack formed was assumed to end at the solid fraction of 0.99. The capacity of liquid feeding in the range of the peritectic solidification before fs = 0.99 was selected as the standard, and the average steepness of |dT/d(fs)1/2| was used to evaluate the crack susceptibility.
The relationship between solidification fraction and temperature was analyzed using the method proposed by Ueshima et al. [19], which has been used in several papers [19,20] and thus the details are not repeated here. The cross section diagram of primary dendrite solidification is considered to be a regular hexagon, where 1/6 is selected (Figure 1b). The diffusion of alloying elements in the growth direction of dendrites is neglected and only the transverse of one-dimensional element distribution is considered. The complete mixing in the liquid phase and local equilibrium at liquid/δ, L/γ, and δ/γ interfaces are assumed. The temperature distribution of dendrite is uniform in the cross section, and it decreases with time. The γ forms from the interface between liquid and δ. When δ → γ transformation occurs, Si, P, and S diffuse from γ to δ, while C and Mn diffuse from δ to γ because of their different equilibrium distribution coefficients in the interface of δ/γ. In the solidification process, the two-phase regions coexist with two or three phases in δ, γ, and L phases. The λ1/2 (primary dendrite spacing) is divided into 50 parts in the cross-section direction. When the liquid temperature (TL) obtained from the concentration of solute elements in the solidification front or the solid temperature (Tδ/γ) obtained from the concentration of solute elements at the interface of δ/γ is equal to the actual temperature, this part of the solidification is complete and the interface begins to enter the next phase. The liquid temperature and the solid temperature are calculated according to reference [19]. The thermodynamic data of the calculation are shown in Table 1. In addition, the primary dendrite spacing is also a prerequisite; the research of El-bealy et al. [21] was used and the relationship between primary dendrite spacing and cooling rate is summarized in Table 2. Figure 2 shows a calculated curve of T − (fs)1/2. Points a and b on the curve represent the starting and ending location of peritectic solidification, respectively. After the curve of T − (fs)1/2 is calculated, the range of peritectic solidification should be determined first, and then the |dT/d(fs)1/2|from point a to b on the curve of T − (fs)1/2 is calculated with a solidification fraction interval of 0.005. The average value of |dT/d(fs)1/2| is calculated last.

3. Results and Discussion

3.1. Carbon Contents

The crack formation of peritectic steels as a function of composition was analyzed during continuous casting. According to the calculation of ferrite potential (FP), the greatest susceptibility was experienced in steel containing 0.09C wt.%, where FP approached 1. Harste et al. [22] showed that the most uneven shell growth of steel was encountered 0.10C wt.% through a solidification experiment. Bernhard et al. [23] showed that the contraction force and total crack length of steels had maximum values around a carbon equivalent 0.1 wt.% in the submerged split chill tensile test.
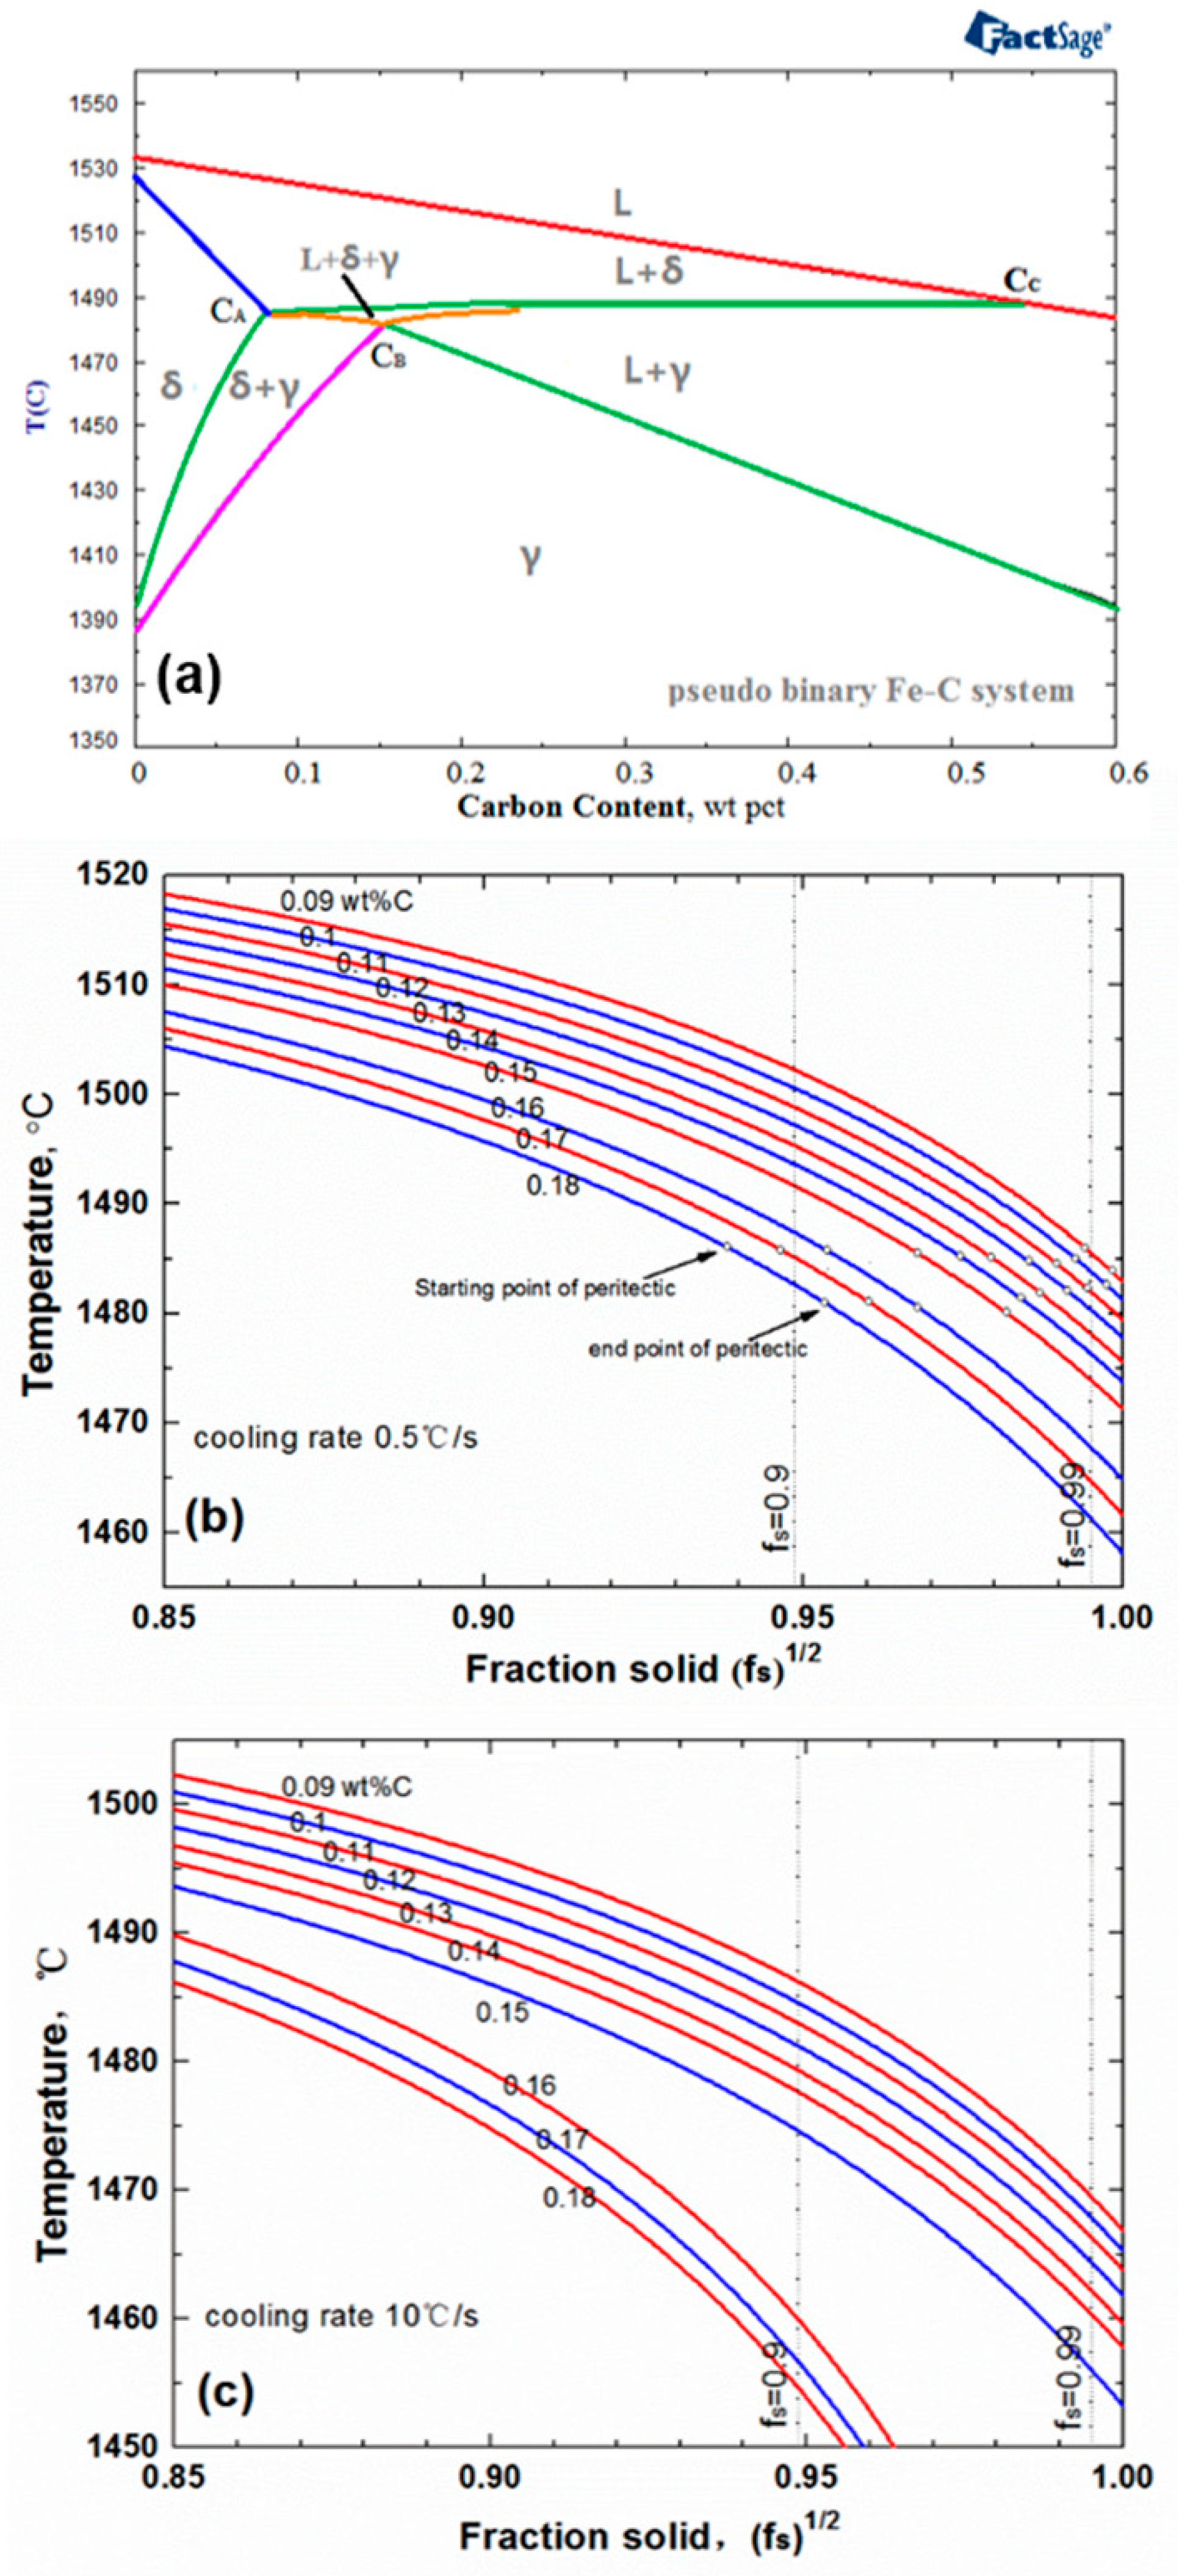
Figure 3 shows the case of the Fe-C alloy with 0.21Si, 1.5Mn, 0.01P, and 0.008S (wt.%), where the pseudo-binary phase diagram of Fe-C alloy is included (Figure 3a). Two T − (fs)1/2 curves, corresponding to the cooling rates of 0.5 and 10 °C/s, are shown for peritectic steels of various carbon contents (Figure 3b,c). At the low cooling rate of 0.5 °C/s, the results indicate a relatively small solidification temperature range and a small slope |dT/d(fs)1/2| with a flat solidification curve. Here, the smooth solidification curve indicates a quicker lateral growth of austenite growing into the liquid to increase the bonding strength between grains in the mushy zone. Meanwhile a short liquid channel between grains is favorable for liquid feeding. At the cooling rate of 10 °C/s, the range of solidification temperatures become bigger and produce a steeper curve, causing difficult liquid feeding.
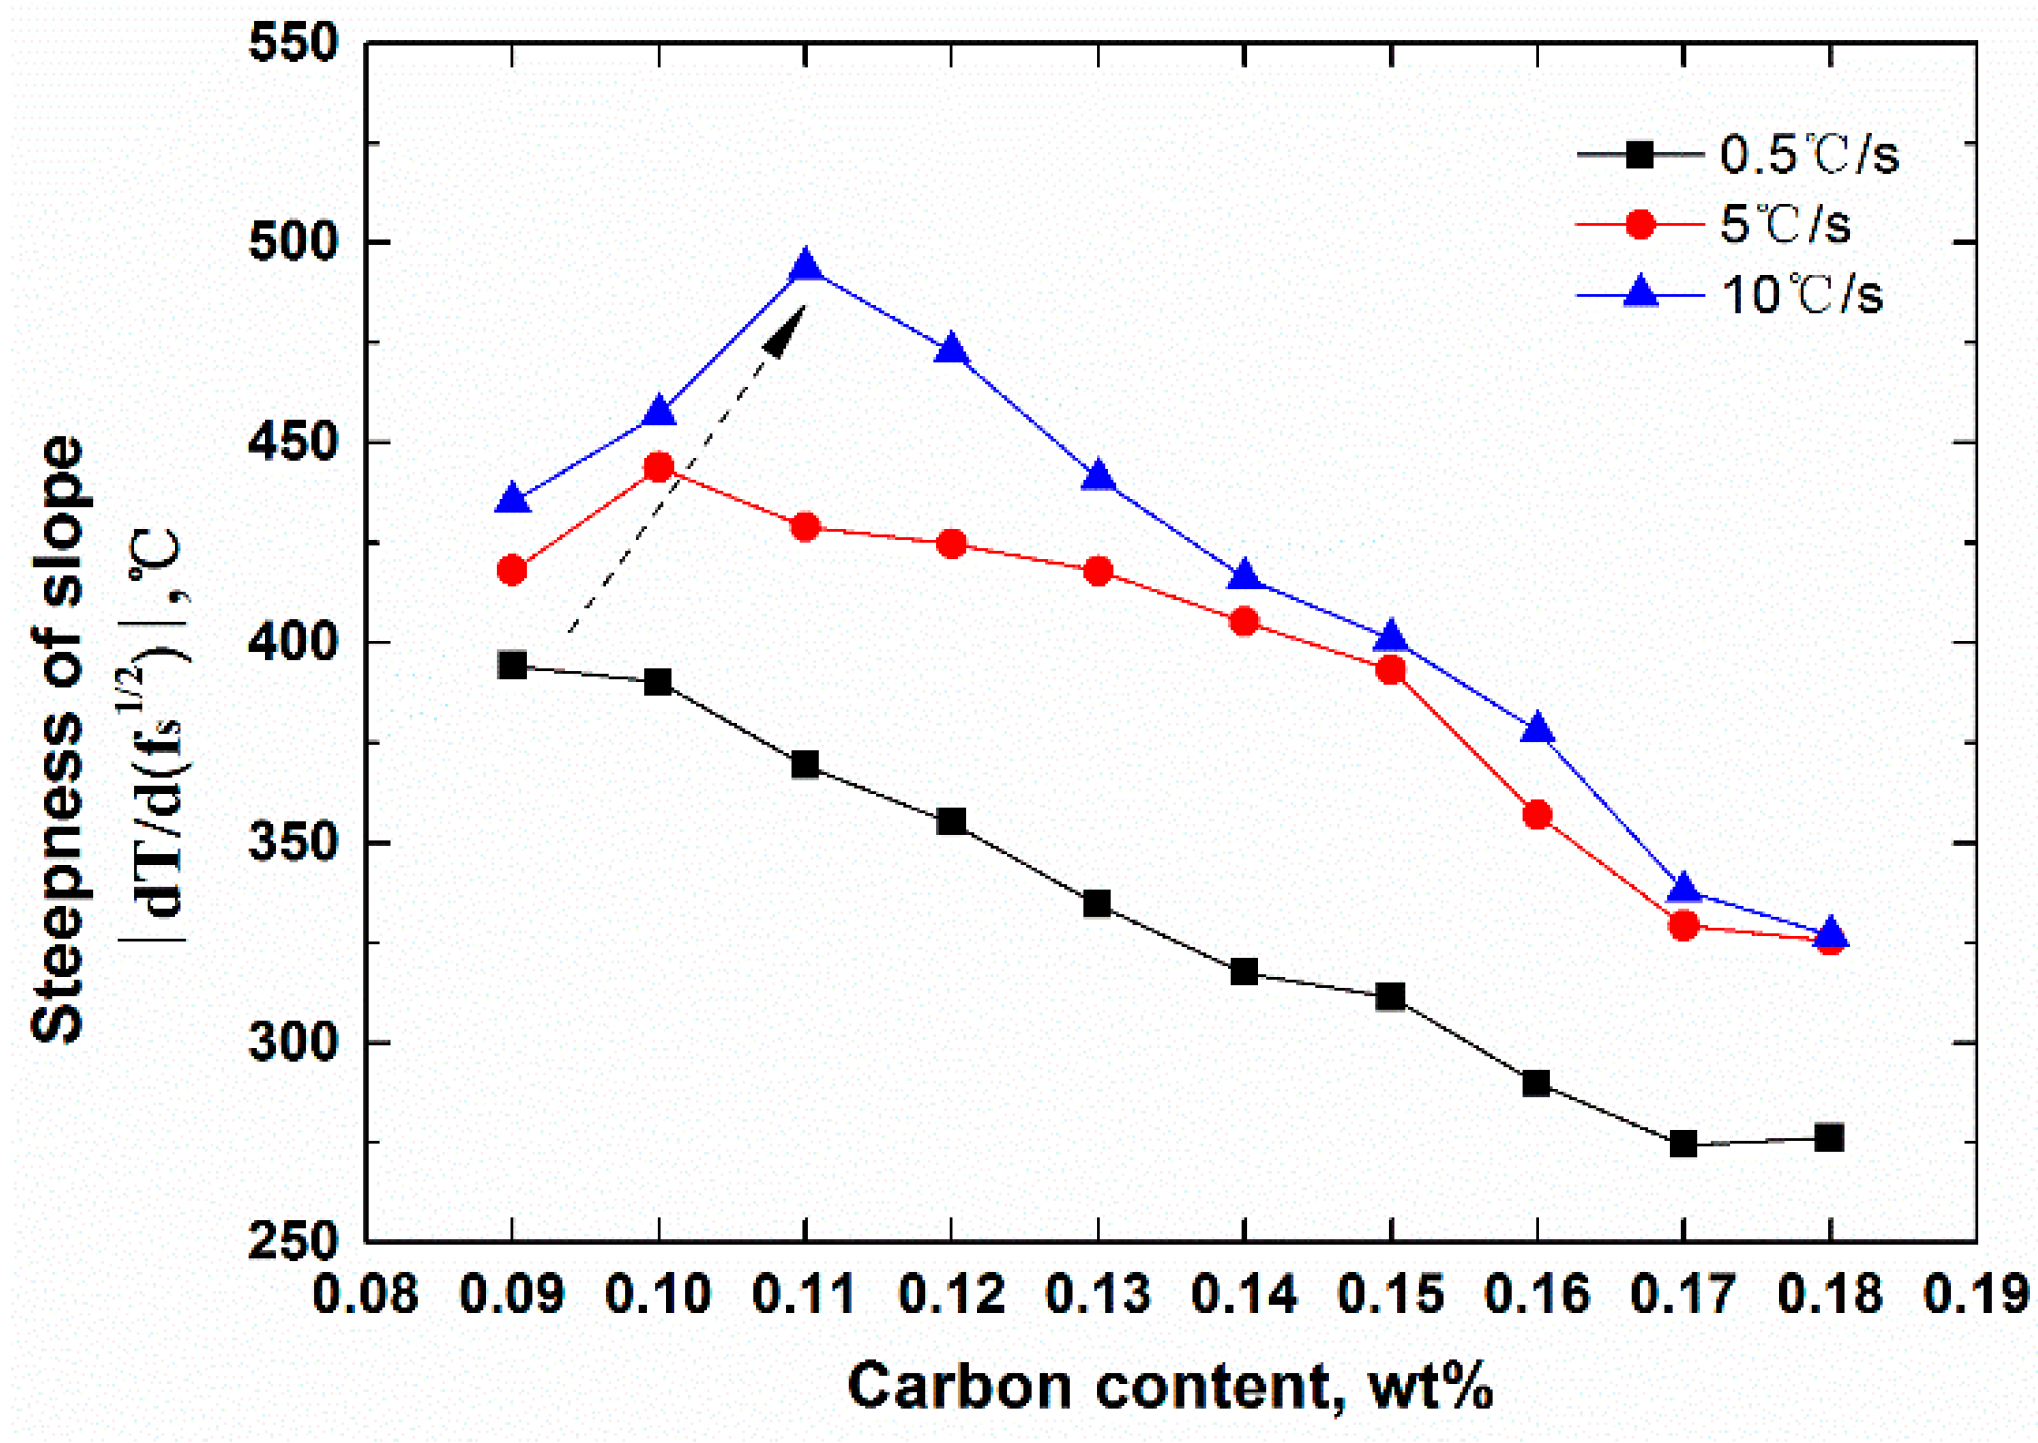
The steepness |dT/d(fs)1/2| of the alloy is plotted against the carbon content under three cooling rates in Figure 4, corresponding to 0.5, 5, and 10 °C/s, respectively. A peak value of |dT/d(fs)1/2| is shown at 0.09C wt.% with 394.25 °C at the cooling rate of 0.5 °C/s, which is close to the characteristic points CA. The value of |dT/d(fs)1/2| gradually was found to decrease with the increase of carbon content, which is consistent with the understanding of phase diagram under equilibrium conditions. The curve shows a peak value of 443.93 °C at 0.10C wt.% at the cooling rate of 5 °C/s, which means that the greatest crack susceptibility changes to 0.10C wt.% in that condition. When the cooling rate is 10 °C/s, the peak value was found at 0.11C wt.% with 493.76 °C. Comparing the change of |dT/d(fs)1/2| at three cooling rates, all of the |dT/d(fs)1/2| increased as the cooling rate increased. It can be clearly seen that the maximum steepness |dT/d(fs)1/2| of the alloy varied from 0.09C wt.% to 0.11C wt.% with the increase of cooling rate. This change is consistent with the previous understanding that the phase diagram shifts to the bottom left when the cooling rate increases, which is due to the micro-segregation of alloys’ composition decreasing the solidification temperature at the final solidification.
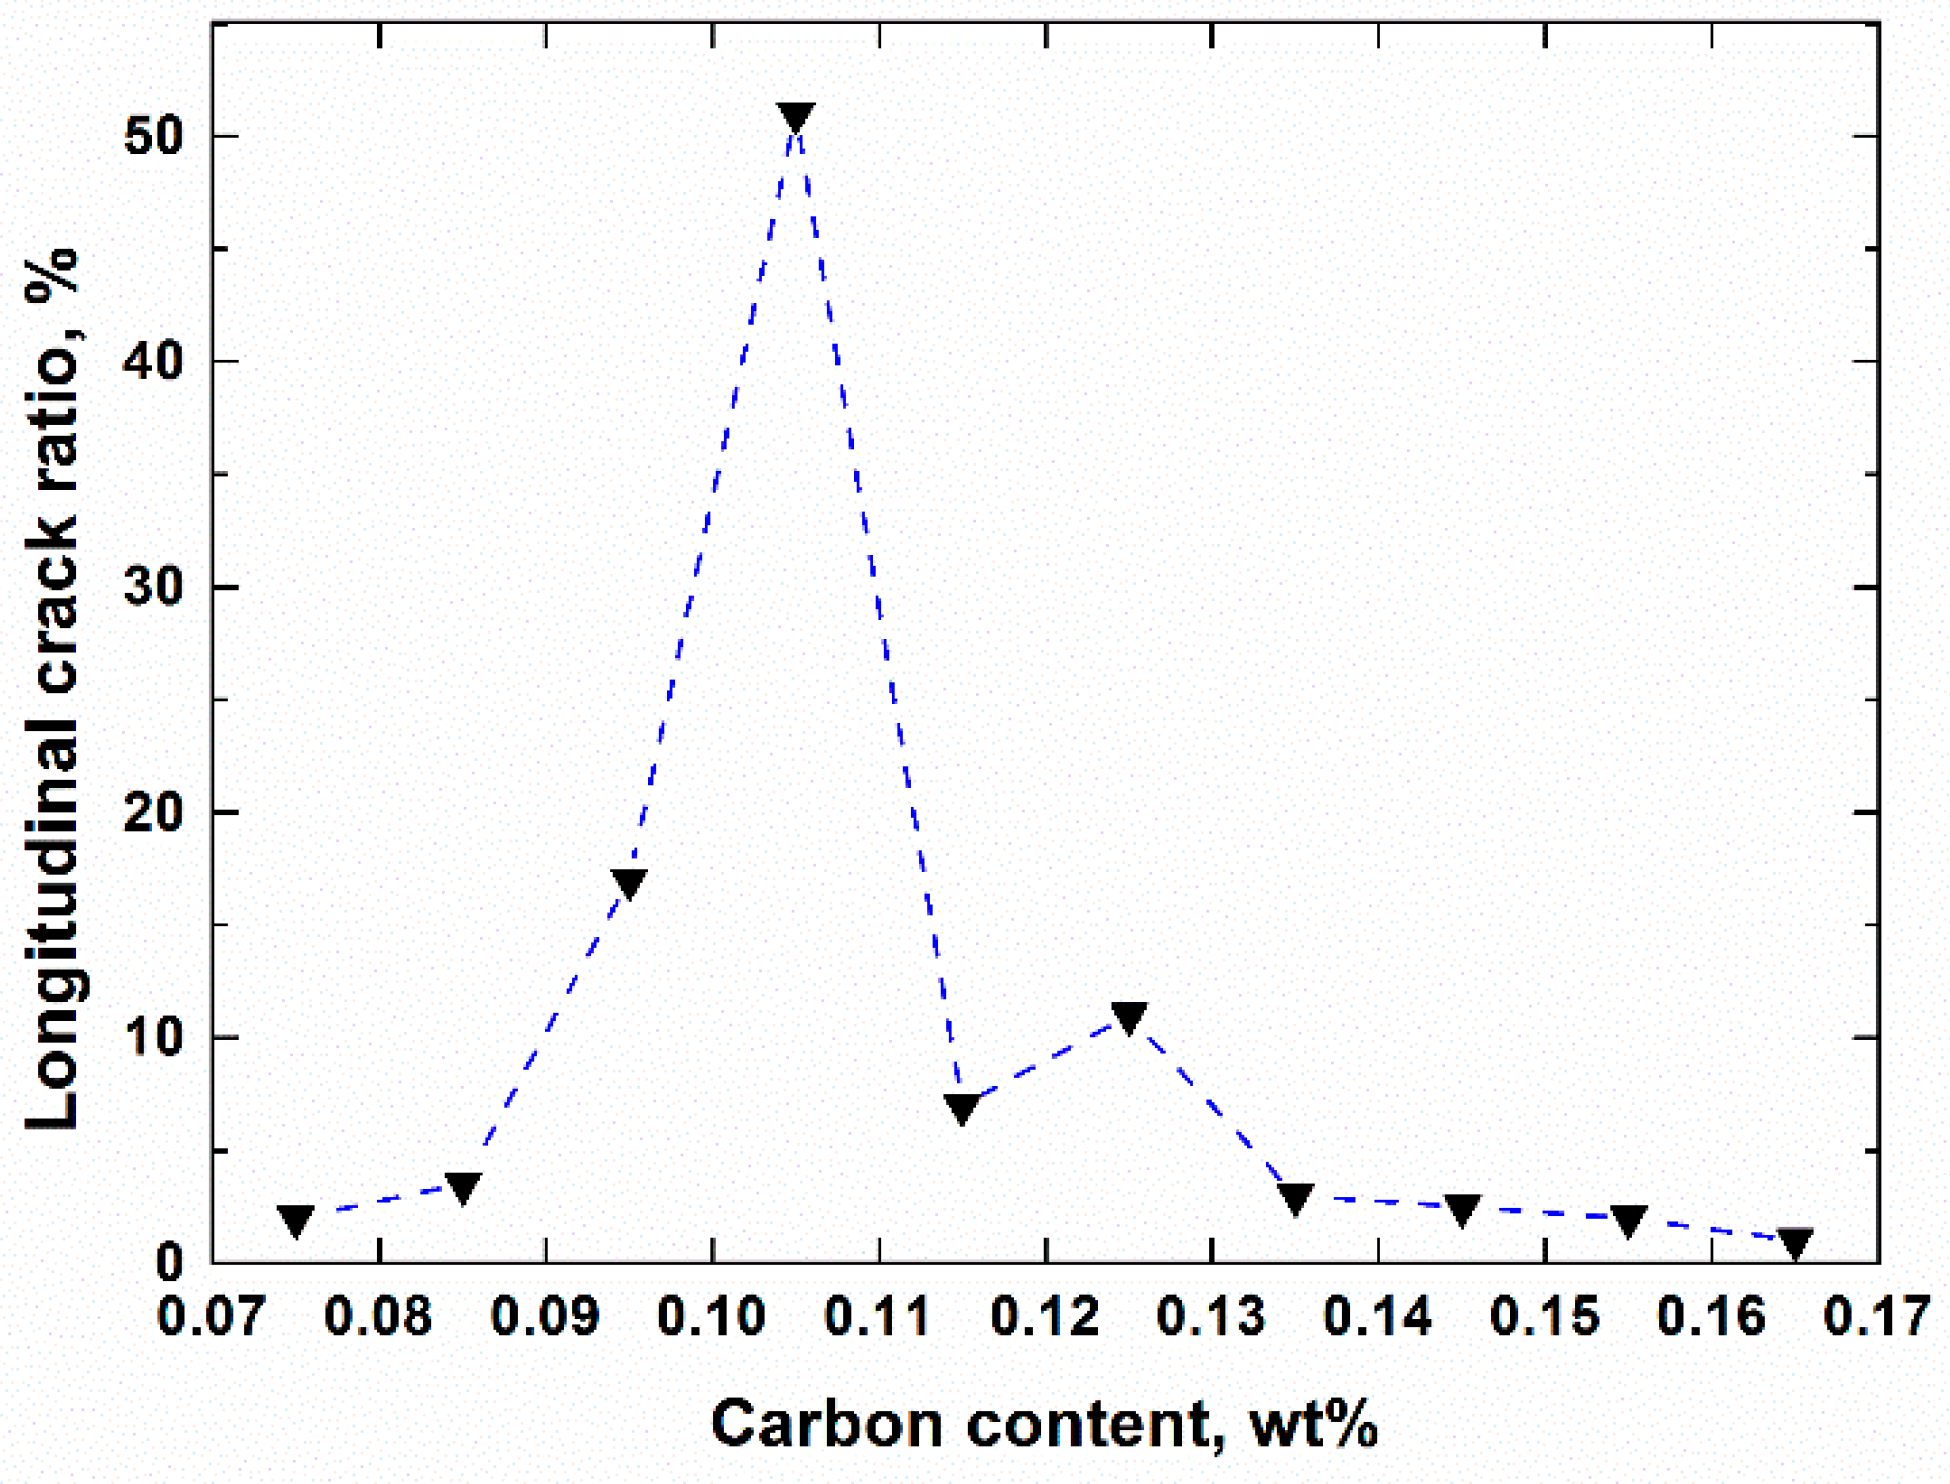
In order to analyze and verify the crack susceptibility index, industrial data for the slabs casting in the PANGANGGROUP of China were collected in January through June, 2017. The cross sections of slabs were (1080–1850) mm × (190, 220) mm. The casting speed varied in the range of 1.0–1.6 m/min, and the average heat flux near the meniscus was 1.4 MW/m2. According to the relationship between the heat flux and cooling rate obtained by Wolf et al. [24], the average cooling rate at the initial solidification stage could be estimated at around 8 °C/s. Figure 5 shows the variation of longitudinal crack ratio with carbon contents, where the carbon content was divided at intervals of 0.01%. The longitudinal crack ratio is defined as the ratio of the number of slabs with cracks within a specified carbon range to the total number of slabs with longitudinal cracks. The alloy elements Si, Mn, P, and S in steel were similar. The maximum longitudinal crack ratio was in the range of 0.10–0.11% and the number of slab cracks on both sides of this range decreased significantly. This result is consistent with the result of the steepness |dT/d(fs)1/2| at the cooling rate of 10 °C/s. In addition, the steepness |dT/d(fs)1/2| at 0.09–0.11%C was significantly higher than those at 0.12–0.15%C, which was also the same as the actual solidification process.

3.2. Mn and Si

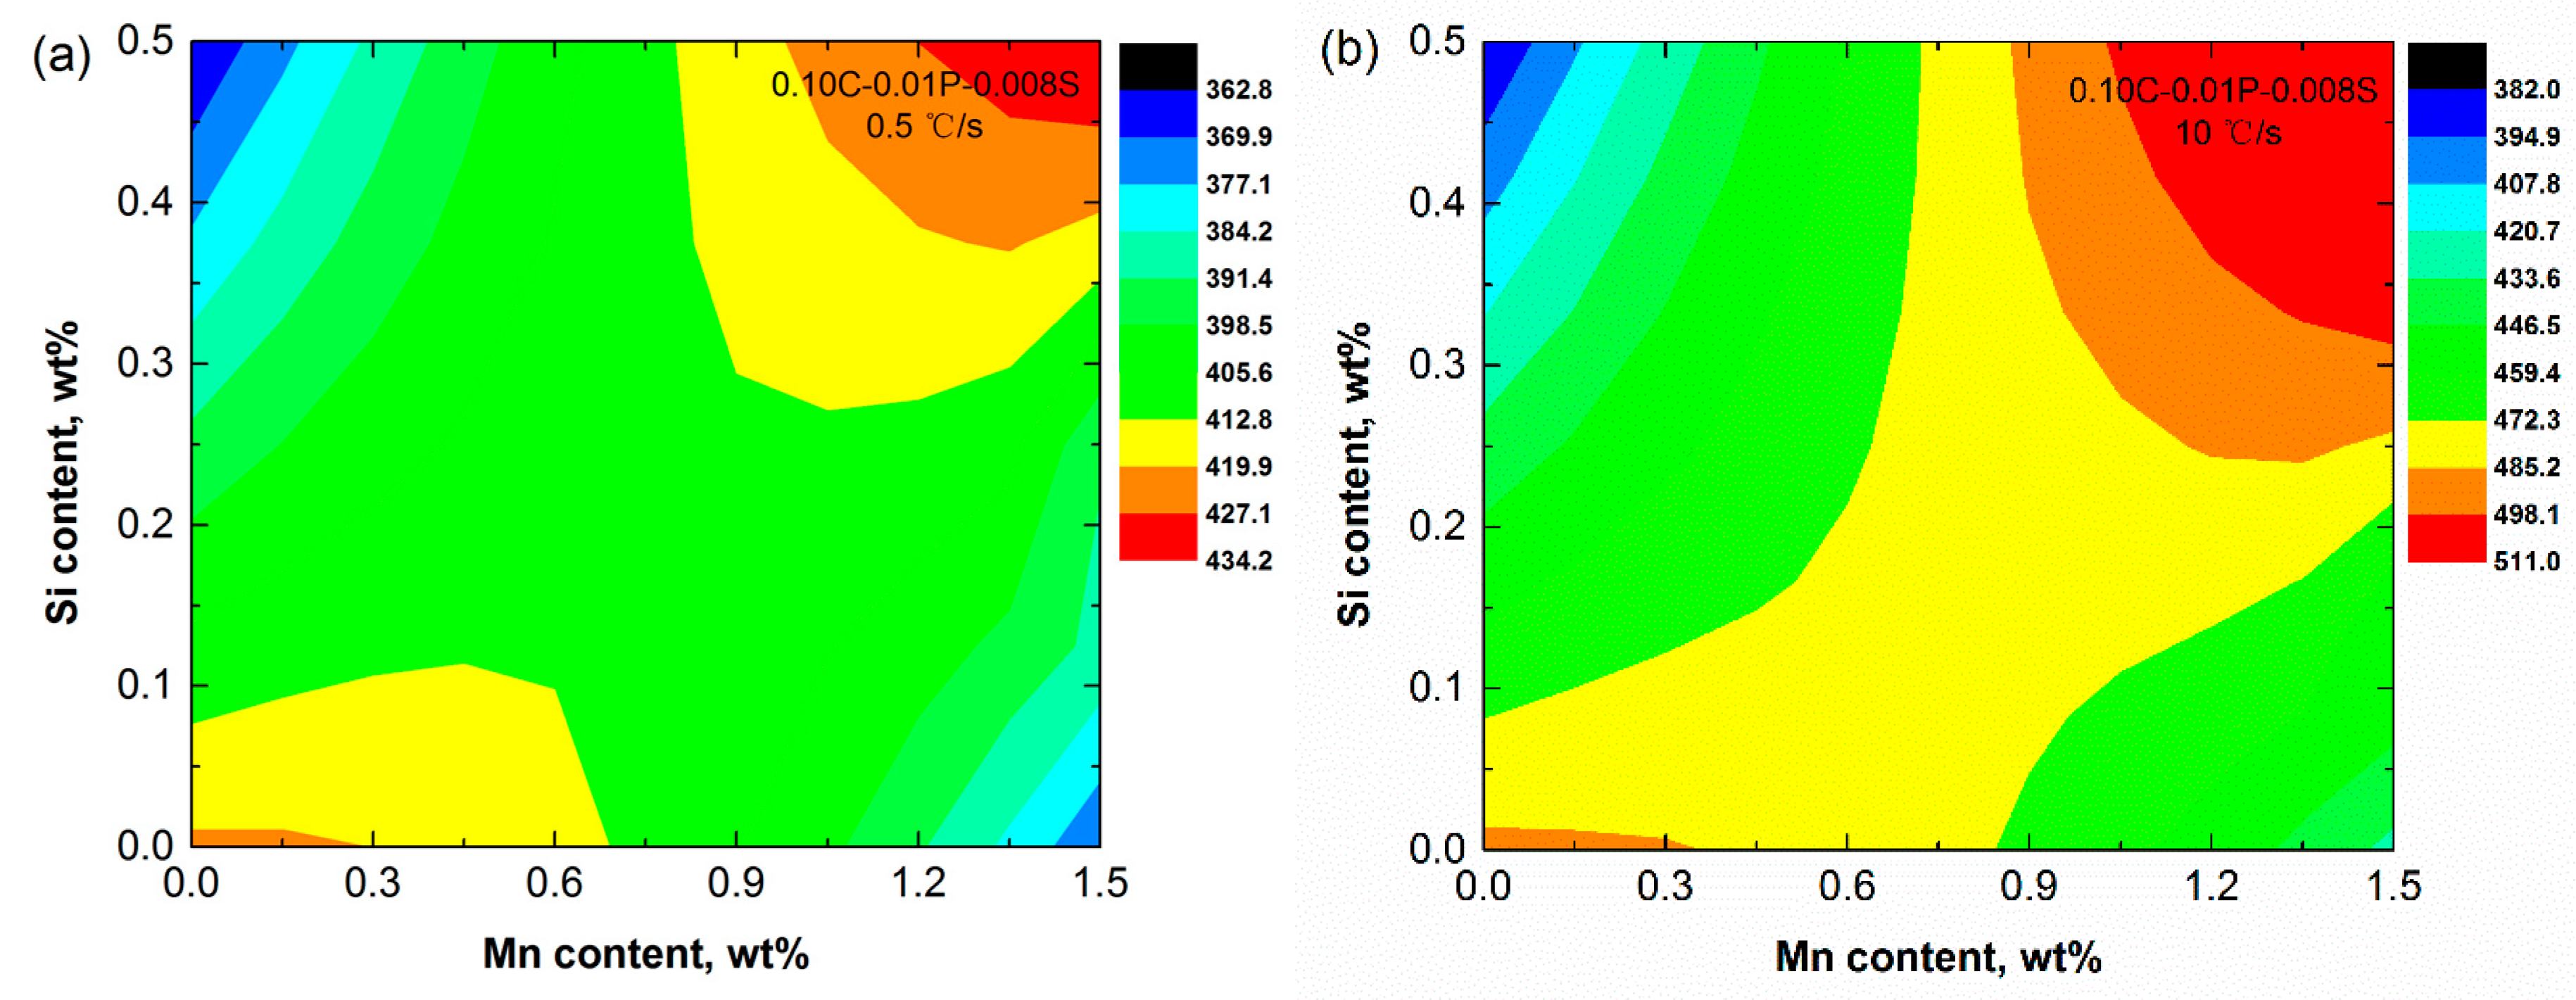
Mn and Si are the main alloying elements in steels because they allow for the adjustment of steels’ mechanical and casting properties. In order to analyze the effect of two elements on solidification crack susceptibility, the steepnesses |dT/d(fs)1/2| of a series of peritectic steels were calculated from Mn 0 to 1.5 wt.% at the interval of 0.15% and from Si 0 to 0.5 wt.% at the interval of 0.05%. The other elements in the steel system were fixed at 0.10%C, 0.01%P, and 0.008%S. A total of 121 alloy compositions in the steel system were covered, and the calculations of |dT/d(fs)1/2| were used to make a crack sensitivity map of peritectic steels with varying Mn and Si content.
There were larger values of |dT/d(fs)1/2| in the low Si/low Mn range as well as in the high Si/high Mn range at the cooling rate of 0.5 °C/s, and the highest crack susceptibility was 434.0 °C, located at 0.5Si–1.5Mn (Figure 6a). The case of the cooling rate of 10 °C/s had a similar situation. The highest crack susceptibility was 511 °C, which was located at 0.5Si–1.2Mn (Figure 6b). It is known that the alloying elements of Si and Mn can shift the characteristic point of peritectic reaction. According to the calculation, the crack susceptibility index increased with increasing cooling rate. The influence of Mn on the crack susceptibility was less pronounced than that of changing Si content, comparing with the change in the horizontal and vertical directions. However, the actual content of Si is often limited for steel grades requiring high plasticity and toughness.
The |dT/d(fs)1/2| of the alloys in the horizontal direction that passed through the maximum |dT/d(fs)1/2| in Figure 6b is plotted in Figure 7 against the Mn content at a constant Si content of 0.5%. In order to check the calculation result, according to the carbon equivalent of Xia et al. [25], the same case alloy was calculated and plotted in Figure 7. The carbon equivalent increased gradually with Mn content, and there were similar results for the crack susceptibility in both the calculation of |dT/d(fs)1/2| and the carbon equivalent. This good consistency from two evaluation results indicates the reliability of the calculation of |dT/d(fs)1/2|. The information provided by the crack susceptibility of |dT/d(fs)1/2| is important, and the possibility of crack formation can be reduced by changing alloy elements to improve the casting properties.
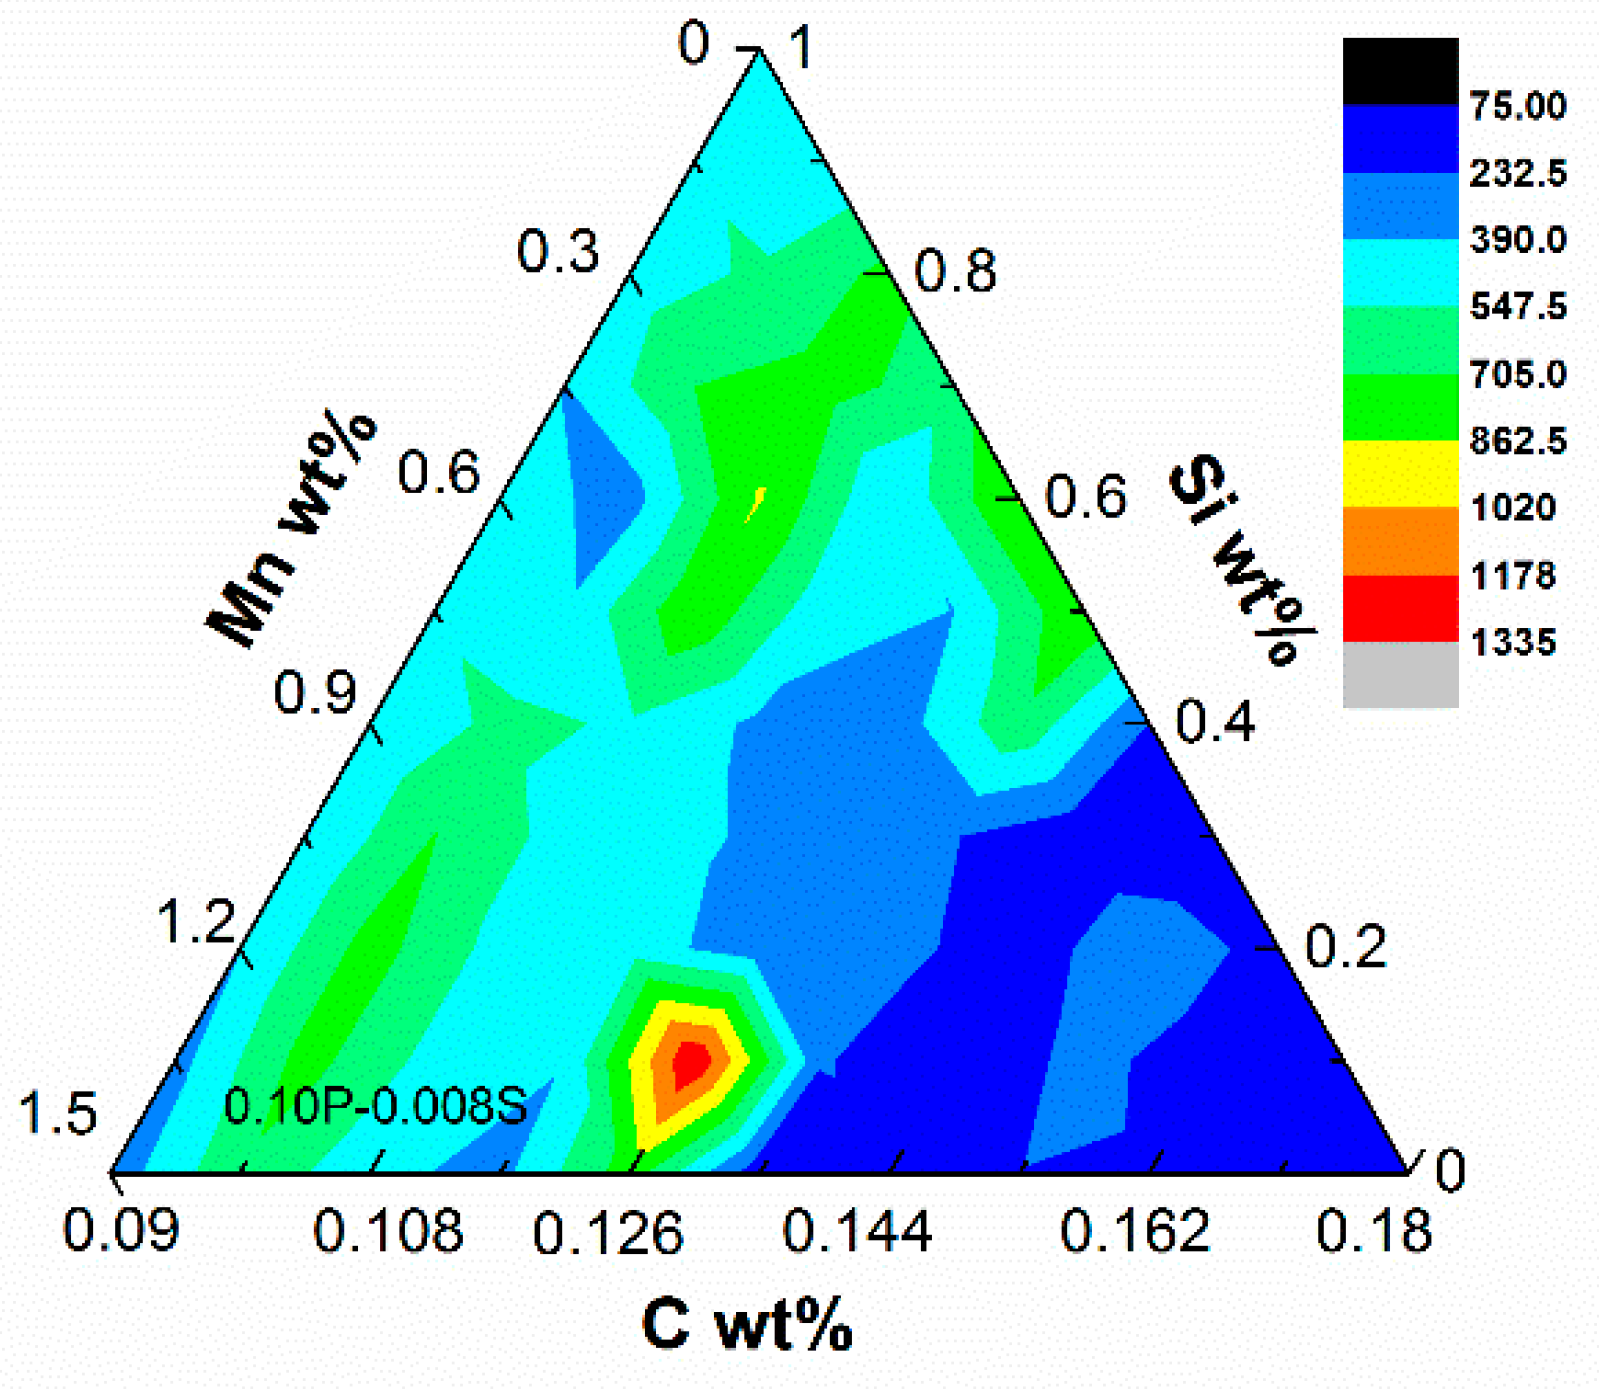
A simple ternary diagram (C–Si–Mn) of the crack susceptibility index was calculated to display the effects of C, Mn, and Si on the solidification crack susceptibility (Figure 8) at the cooling rate of 10 °C/s. The highest crack susceptibility was 1334.7 °C, located near 0.126C–1.35Mn–0.1Si. The solidification crack index of steels with 0.09–0.13C wt% was significantly higher than the high-carbon steel in Figure 8, as per previous understanding. Here, a clear solidification crack susceptibility varying with multiple elements could be obtained by this method, which is very helpful for the selection of casting parameters.

3.3. P and S

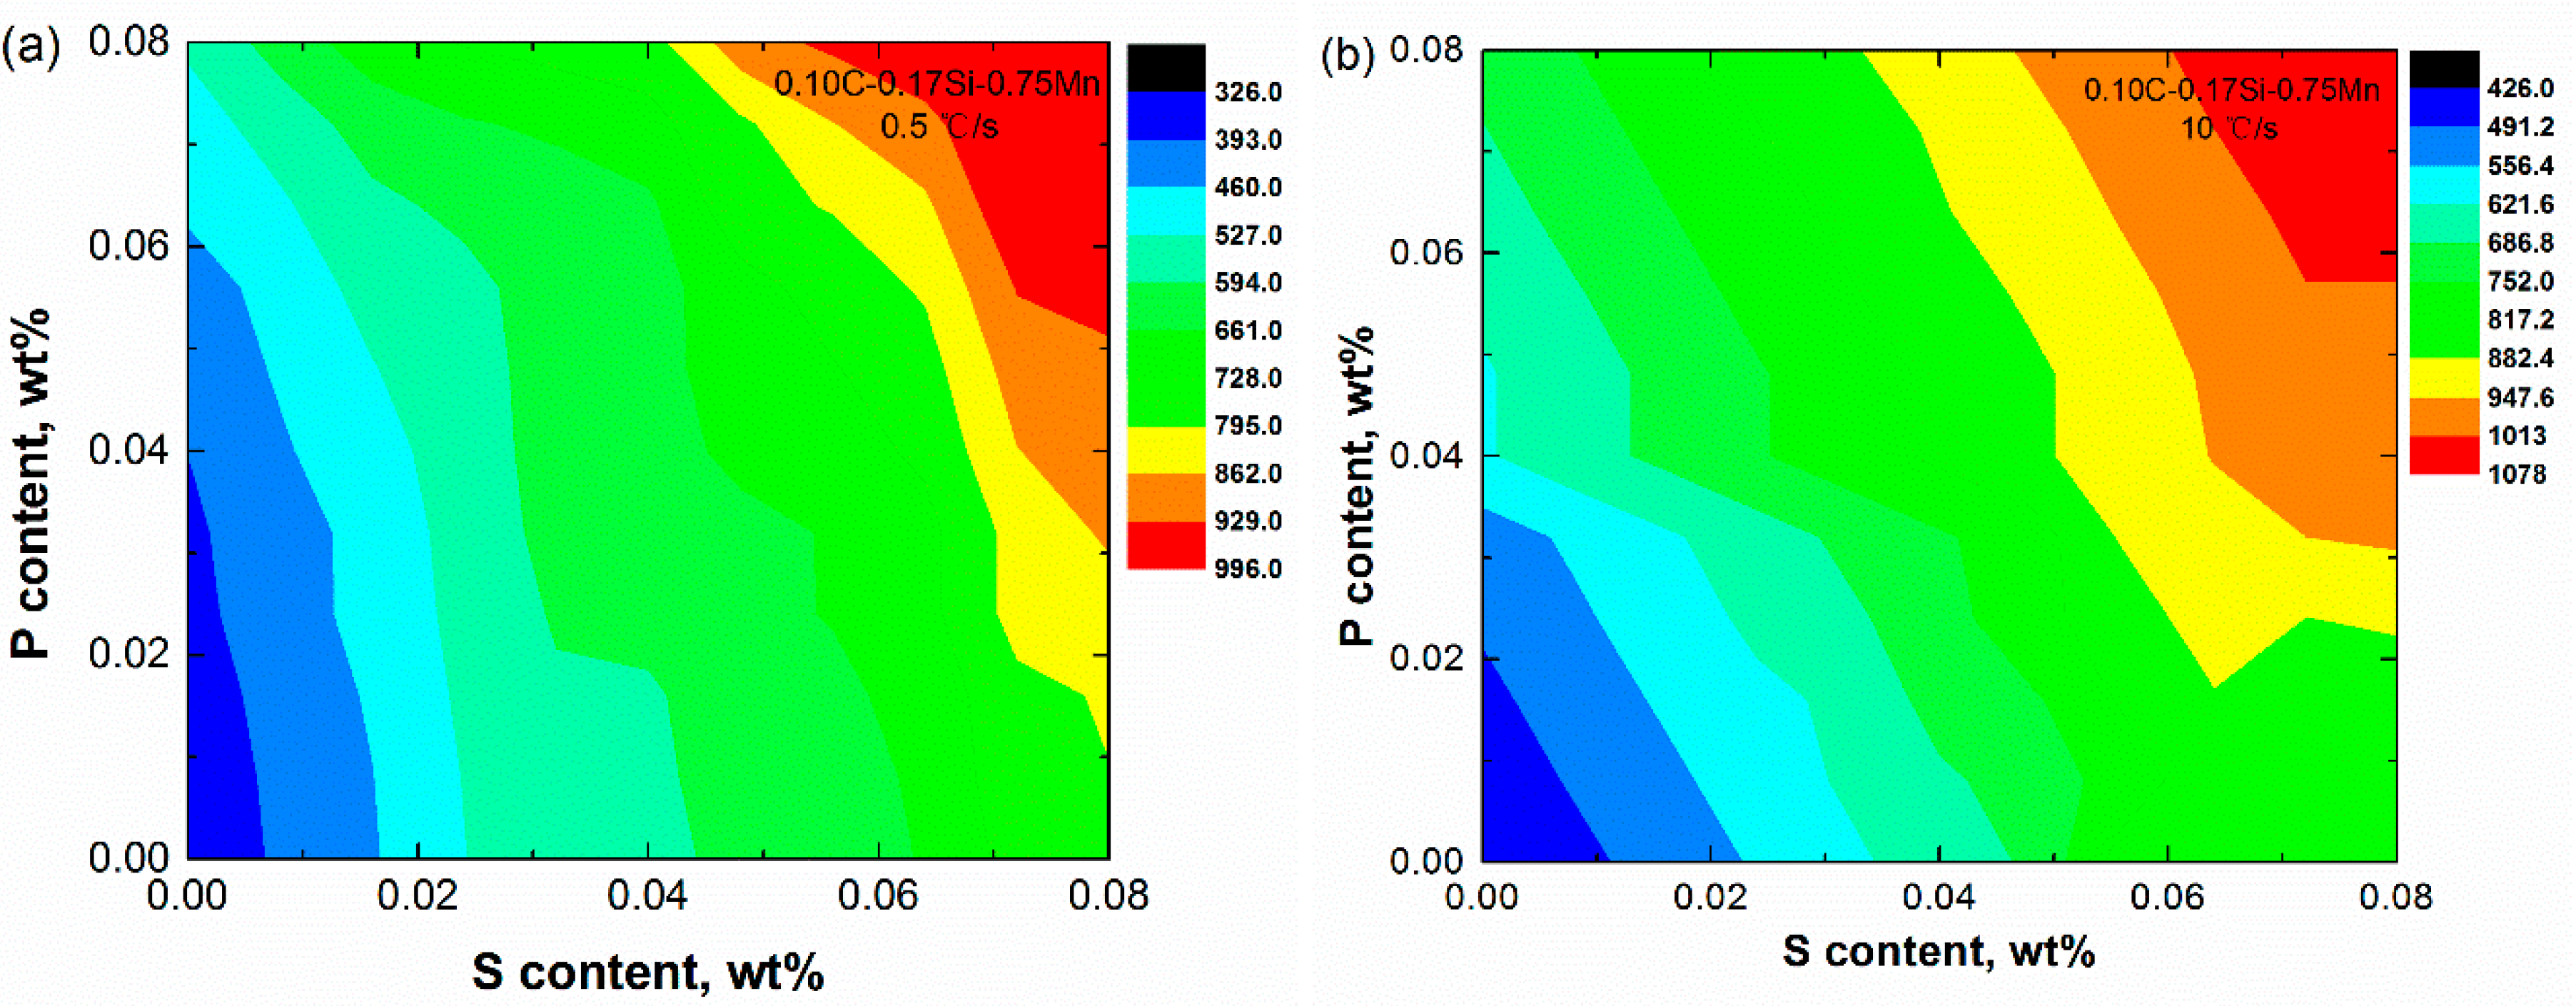
P and S are the main harmful alloying elements in steel, and their contents are usually strictly controlled. In order to analyze the effect of these two elements on solidification crack susceptibility, the steepnesses |dT/d(fs)1/2| of a series of peritectic steels were also calculated from 0 to 0.08 wt.% P at the interval of 0.008% and from 0 to 0.08 wt.% S at the interval of 0.008%. The other elements in the steel system were fixed at 0.10%C, 0.17%Si, and 0.75%Mn. A total of 121 alloy compositions in the steel system were covered and the calculation of |dT/d(fs)1/2| was used to make a crack sensitivity map of peritectic steels with varying P and S.
The |dT/d(fs)1/2| was larger in high P and S regions at the cooling rate of 0.5 °C/s, and the highest crack susceptibility was 994.2 °C, located at 0.08%P–0.08%S (Figure 9a). When the cooling rate was 10 °C/s, the highest crack susceptibility was 1076.0 °C, located at 0.08%P–0.08%S (Figure 9b). The effect of P content on the crack sensitivity index was relatively insignificant (according to the vertical direction). However, the presence of S was found to have quite a significant effect on the crack sensitivity index (in the horizontal direction). S is prone to macrosegregation during solidification as a segregation element, which will shift the peritectic reaction zone towards the left in the phase diagram and decrease the solidification temperature between grains. Here, a crack can easily form when shrinkage deformation occurs between grains. Sarkar et al. [26] have shown that S, even in low concentrations, significantly affects the peritectic solidification.
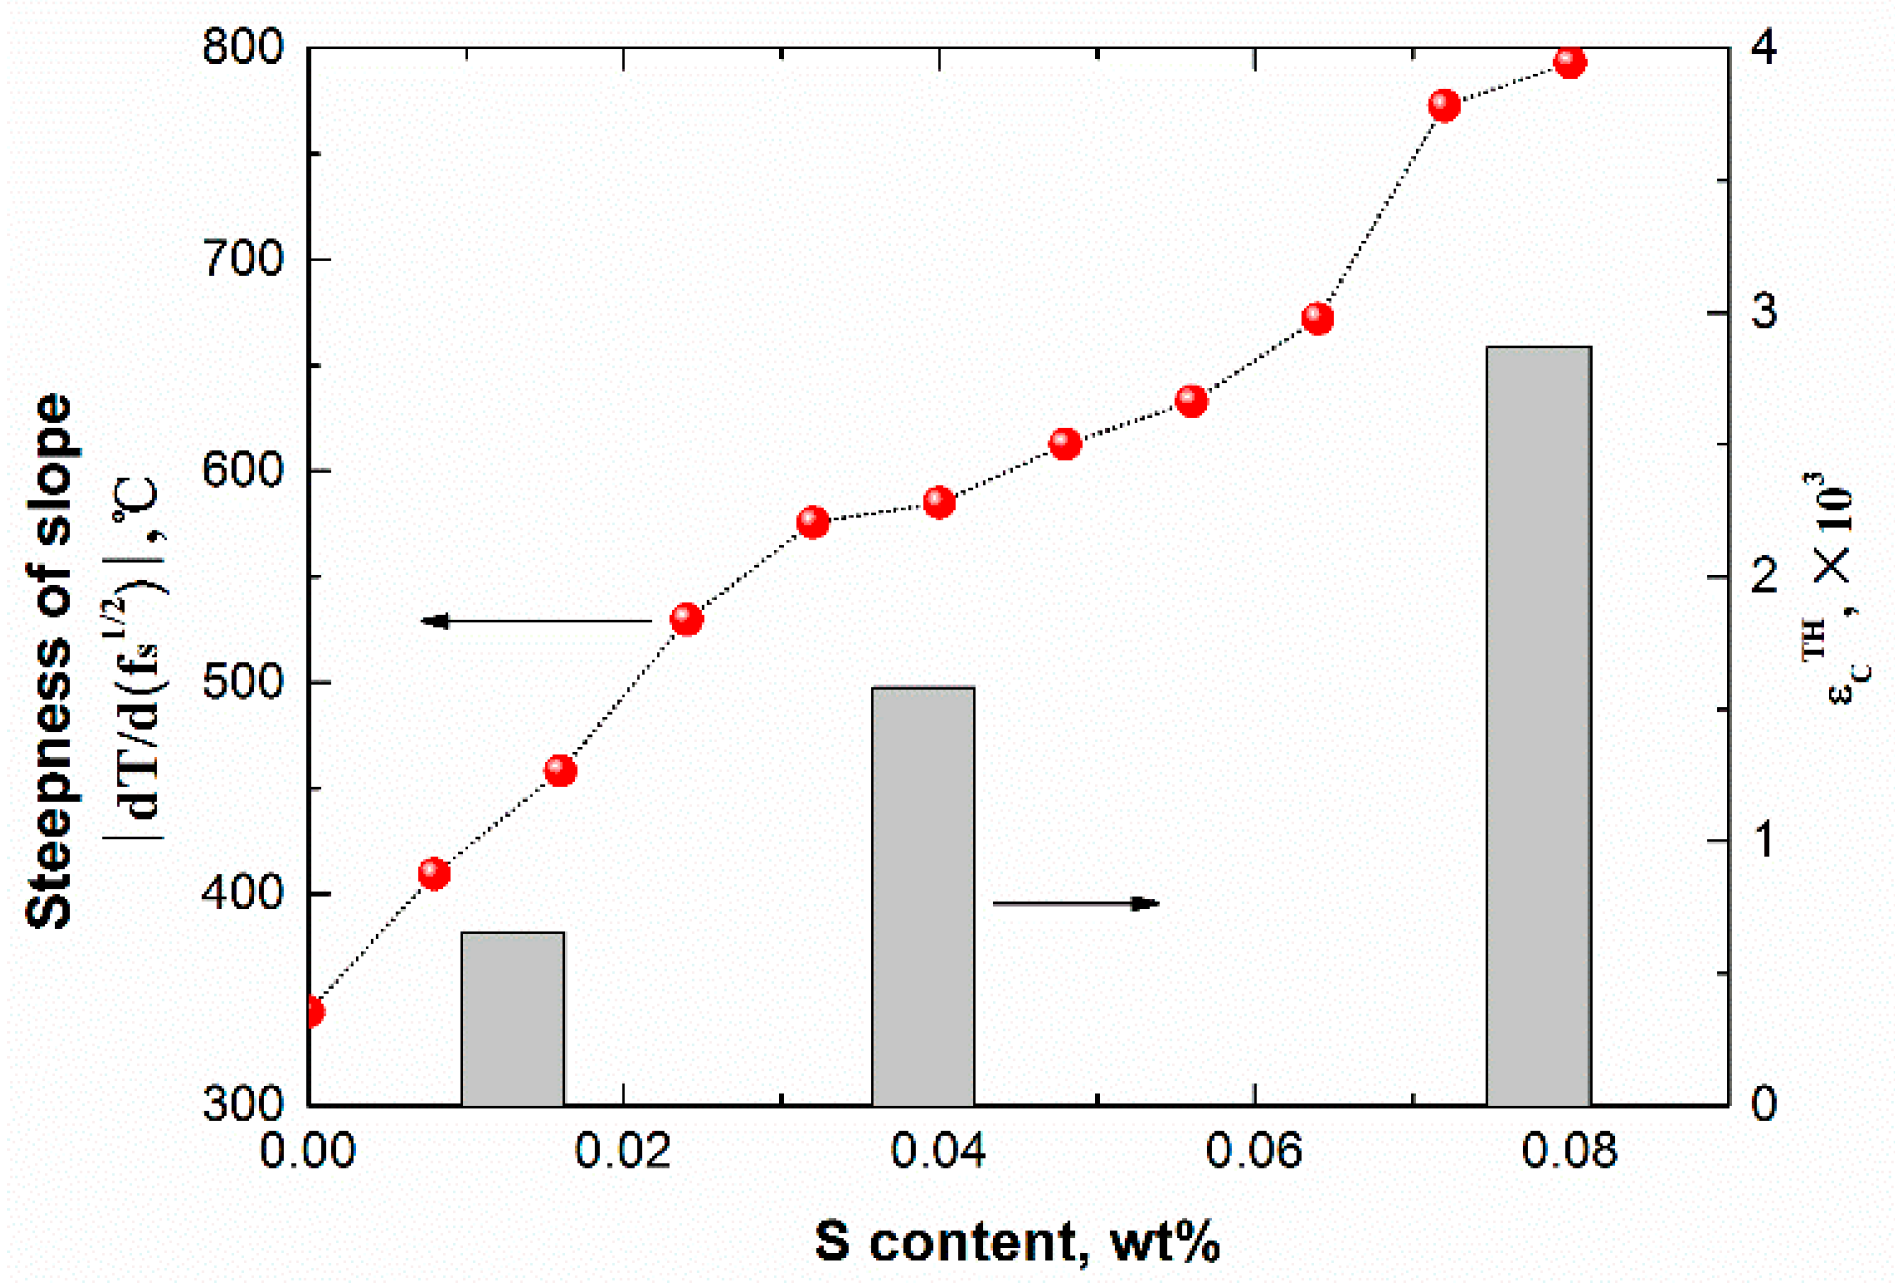
The |dT/d(fs)1/2| of the alloys in the horizontal direction at a constant P content of 0.008 wt.% in Figure 9a are plotted into Figure 10. In order to check the calculation results, the variation of strain in the brittle temperature range with the S contents from the work of Kim et al. [20] was also plotted. Both the value of |dT/d(fs)1/2| and the strain increase in the same sequence showed a good consistency.

4. Conclusions

  • The average steepness of |dT/d(fs)1/2| on the T − (fs)1/2 curve during peritectic solidification was proposed to estimate the solidification crack susceptibility for peritectic steels, which mainly reflected the capacity of liquid flow to compensate shrinkage during peritectic solidification. The cooling rate and peritectic solidification were considered.
  • The crack susceptibility index was calculated for steels with varying C contents at three cooling rates. The results indicate that the maximum level susceptibility changed from 0.09C wt.% to 0.11C wt.% with the increase of cooling rate. All of the |dT/d(fs)1/2| increased with increasing cooling rate, and the calculation index was verified compared with the date of industrial practice.
  • The effects of Mn and Si elements on solidification crack susceptibility were calculated. Under the cooling rate of 10 °C/s, the crack susceptibility index was the highest at 0.5%Si–1.2%Mn: 511.0 °C. Regarding the crack susceptibility index in the ternary diagram (C–Si–Mn), the highest crack susceptibility was near 0.126%C–1.35%Mn–0.1%Si, 1334.7 °C. The effect of P and S elements on solidification crack susceptibility was also calculated. The crack susceptibility index was the highest at 0.08%P–0.08%S: 1076.0 °C. This method of estimating the crack susceptibility by the average steepness |dT/d(fs)1/2| of the T − (fs)1/2 curve during solidification may prove very helpful for the casting guidance of steels.

Author Contributions

J.G. and G.W. conceived and designed the calculation; J.G. performed the calculation; J.G. wrote the paper.

Funding

This research received no external funding.

Acknowledgments

This research was supported by College of Materials Science and Engineering of Chongqing University.

Conflicts of Interest

The authors declare no conflict of interest.

References

  1. Fredriksson, H. The mechanism of the peritectic reaction in iron-base alloys. Met. Sci. 1976, 10, 77–86. [Google Scholar] [CrossRef]
  2. Yang, G.; Zhu, L.; Chen, W.; Yu, X. He, B. Initiation of surface cracks on beam blank in the mold during continuous casting. Metals 2018, 8, 712. [Google Scholar] [CrossRef]
  3. Saleem, S.; Vynnycky, M.; Fredriksson, H. The influence of peritectic reaction/transformation on crack susceptibility in the continuous casting of steels. Metall. Mater. Trans. B 2017, 48, 1625–1635. [Google Scholar] [CrossRef]
  4. Trejo, M.H.; Lopez, E.A.; Mondragon, J.J.R.; Roman, M.J.C.; Tovar, H.S. Effect of solidification path and contraction on the cracking susceptibility of carbon peritectic steels. Met. Mater. Int. 2010, 16, 731–737. [Google Scholar] [CrossRef]
  5. Hechu, K.; Slater, C.; Santillana, B.; Srirangam, P.; Sridhar, S. Real-time measurement of contraction behaviour of peritectic steels during solidification. In Proceedings of the AISTech-2016: Proceedings of the Iron and Steel Technology Conference, Pittsburgh, PA, USA, 16–19 May 2016; pp. 132–138. [Google Scholar]
  6. Emi, T.; Fredriksson, H. High-speed continuous casting of peritectic carbon steels. Mater. Sci. Eng. A 2005, 413, 2–9. [Google Scholar] [CrossRef]
  7. Lopez, E.A.; Trejo, M.H.; Mondragon, J.J.R.; Roman, M.D.J.C.; Tovar, H.S. Effect of C and Mn variations upon the solidification mode and surface cracking susceptibility of peritectic steels. ISIJ Int. 2009, 49, 851–858. [Google Scholar] [CrossRef]
  8. Ridolfi, M.R.; Vito, A.D.; Ferro, L. Effect of alloying elements on thermal contraction and crack susceptibility during in-mold solidification. Metal. Mater. Trans. B 2008, 39, 581–592. [Google Scholar] [CrossRef]
  9. Kerr, H.W.; Cisse, J.; Bolling, G.F. On equilibrium and non-equilibrium peritectic transformations. Acta Metall. 1974, 22, 677–686. [Google Scholar] [CrossRef]
  10. Wołczyński, W. Back-diffusion in crystal growth. Peritectics. Arch. Metall. Mater. 2015, 60, 2409–2414. [Google Scholar] [CrossRef]
  11. Dippenaar, R. In-Situ Analysis of the Peritectic Phase Transition-Relevant to the Continuous Casting of Steel. In Proceedings of the 5th International Congress on the Science and Technology of the Steelmaking, Dresden, Germany, 1–3 October 2012; pp. 1–9. [Google Scholar]
  12. Feurer, U. Quality control of engineering alloys and the role of metals science. Ph.D. Thesis, Delft University of Technology, Delft, The Netherlands, 1977. [Google Scholar]
  13. Clyne, T.W.; Wolf, M.; Kurz, W. The effect of melt composition on solidification cracking of steel, with particular reference to continuous casting. Metall. Trans. B 1982, 13B, 259–266. [Google Scholar] [CrossRef]
  14. Rappaz, M.; Drezet, J.M.; Gremaud, M. A new hot-tearing criterion. Metal. Mater. Trans. A 1999, 30, 449–455. [Google Scholar] [CrossRef]
  15. Kou, S. A criterion for cracking during solidification. Acta Mater. 2015, 88, 366–374. [Google Scholar] [CrossRef]
  16. Kou, S. A simple index for predicting the susceptibility to solidification cracking. Weld. J. 2015, 94, 374–388. [Google Scholar]
  17. Won, Y.M.; Yeo, T.J.; Seol, D.J.; Oh, K.H. A new criterion for internal crack formation in continuously cast steels. Metal. Mater. Trans. B 2000, 31, 779–794. [Google Scholar] [CrossRef]
  18. Asai, S. Transport Phenomena in Materials Processing, Electromagnetic Processing of Materials; Springer: Dordrecht, The Netherlands, 2012; pp. 321–329. [Google Scholar]
  19. Ueshima, Y.; Mizoguchi, S.; Matsumiya, T.; Kajioka, H. Analysis of solute distribution in dendrites of carbon steel with δ/γ transformation during solidification. Metall. Trans. B 1986, 17, 845–859. [Google Scholar] [CrossRef]
  20. Kim, K.H.; Yeo, T.J.; Oh, K.H.; Lee, D.N. Effect of carbon and sulfur in continuously cast strand on longitudinal surface cracks. ISIJ Int. 1996, 36, 284–289. [Google Scholar] [CrossRef]
  21. El-Bealy, M.; Thomas, B.G. Prediction of dendrite arm spacing for low alloy steel casting processes. Metal. Mater. Trans. B 1996, 27, 689–693. [Google Scholar] [CrossRef]
  22. Harste, K.; Schwerdtfeger, K. Shrinkage of round iron-carbon ingots during solidification and subsequent cooling. ISIJ Int. 2007, 43, 1011–1020. [Google Scholar] [CrossRef]
  23. Bernhard, C.; Xia, G. Influence of alloying elements on the thermal contraction of peritectic steels during initial solidification. Ironmak. Steelmak. 2006, 33, 52–56. [Google Scholar] [CrossRef]
  24. Wolf, M.M. Mold Heat Transfer and Lubrication Control-Two Major Functions of Caster Productivity and Quality Assurance. In Proceedings of the 13th Process Technology Conference Proceedings, Nashvile, TN, USA, 2–5 April 1995; pp. 99–117. [Google Scholar]
  25. Xia, G.; Narzt, H.P.; Fürst, C.; Mörwald, K.; Moertl, J.; Reisinger, P.; Lindenberger, L. Investigation of mould thermal behaviour by means of mould instrumentation. Ironmak. Steelmak. 2004, 31, 364–370. [Google Scholar] [CrossRef]
  26. Sarkar, R.; Sengupta, A.; Kumar, V.; Choudhar, S.K. Effects of alloying elements on the ferrite potential of peritectic and ultra-low carbon steels. ISIJ Int. 2015, 55, 781–790. [Google Scholar] [CrossRef]
Figure 1. (a) Schematic diagram of a solidification interface between solid and liquid; (b) calculation model of diffusion-controlled peritectic solidification.
Metals 09 00836 g001
Figure 2. An example of a calculated T − (fs)1/2 curve.
Metals 09 00836 g002
Figure 3. (a) The pseudo-binary phase diagram of Fe-C alloy; (b) the calculation of T − (fs)1/2 curve at 0.5 °C/s; (c) the calculation of T − (fs)1/2 curve at 10 °C/s.
Metals 09 00836 g003
Figure 4. Calculation of |dT/d(fs)1/2| of peritectic steels under three cooling rates: 0.5, 5, 10 °C/s.
Metals 09 00836 g004
Figure 5. Longitudinal crack ratio in cast slabs.
Metals 09 00836 g005
Figure 6. Crack susceptibility map of peritectic steels with varying Mn and Si at cooling rates of: (a) 0.5 °C/s, (b) 10 °C/s.
Metals 09 00836 g006
Figure 7. Comparison of the crack susceptibility of peritectic steels with different Mn contents, as well as their carbon equivalent.
Metals 09 00836 g007
Figure 8. The crack susceptibility map of peritectic steels with varying C–Si–Mn wt.% at the cooling rate of 10 °C/s.
Metals 09 00836 g008
Figure 9. Crack susceptibility maps of peritectic steels with varying P and S at cooling rates of: (a) 0.5 °C/s, (b) 10 °C/s.
Metals 09 00836 g009
Figure 10. Comparison of the crack susceptibility of peritectic steels with different S contents, as well as the strain.
Metals 09 00836 g010
Table 1. Distribution coefficients and diffusion coefficients of elements in steel.
Elementkδ/Lkγ/Lkδ/γDδ, m2·s−1Dγ, m2·s−1
C0.190.341.791.27 × 10−6exp(−81,379/RT)7.6 × 10−6exp(−134,557/RT)
Si0.770.520.688.0 × 10−4exp(−248,948/RT)3.0 × 10−5exp(−251,458/RT)
Mn0.760.781.037.6 × 10−4exp(−224,430/RT)5.5 × 10−6exp(−249,366/RT)
P0.230.130.572.9 × 10−4exp(−230,120/RT)1.0 × 10−6exp(−182,841/RT)
S0.050.0350.704.56 × 10−4exp(−214,639/RT)2.4 × 10−6exp(−223,425/RT)
Table 2. Expression to the primary dendrite arm spacing (λ1).
EquationEquation Parameters
λ1 = K(CR)m(C0)n μm, 0 ≤ C0 ≤ 0.15 (wt.%C), n = −0.316225 + 2.0325C0
K = 278.748, m = −0.206277638, CR is the cooling rate0.15 ≤ C0 ≤ 1 (wt.%C), n = −0.0189 + 0.49166C0