Article

Effect of Frictional Conditions on the Generation of Fine Grain Layers in Drawing of Thin Steel Wires

1
OJSC Magnitogorsk hardware and sizing plant “MMK-METIZ”, 5, Metiznikov, 455002 Magnitogorsk, Russia
2
School of Mechanical Engineering and Automation, Beihang University, No. 37 Xueyuan Road, Beijing 100191, China
3
Nosov Magnitogorsk state technical university, Department of Material Processing, 38, Lenin Avenue, 455000 Magnitogorsk, Russia
4
Ishlinsky Institute for Problems in Mechanics, Russian Academy of Sciences, 101-1 Prospect Vernadskogo, 119526 Moscow, Russia
*
Author to whom correspondence should be addressed.
Metals 2019, 9(8), 819; https://doi.org/10.3390/met9080819
Submission received: 24 June 2019 / Revised: 2 July 2019 / Accepted: 12 July 2019 / Published: 25 July 2019

Abstract

:
The process of drawing thin carbon steel wires through conical dies is used as an experimental method for determining the effect of frictional conditions and die angle on the generation of fine grain layers in the vicinity of the friction surface. In this study, a quantitative criterion for determining the thickness of fine grain layers is proposed. The criterion is based on the coefficient of anisotropy that characterizes the shape of grains. It is shown that fine grain layers are generated under all frictional conditions investigated, but the thickness of the layer depends on these conditions and die angle.

1. Introduction

In products of metal forming and metal cutting processes, material properties in narrow layers near friction surfaces are usually very different from that in the bulk. The mechanisms responsible for generating such layers were discussed in [1]. These layers may have a positive effect on the performance of structures and machine parts under service conditions [2,3]. The influence of the layers on tensile strength and microstructure of fine drawn wires was discussed in [4]. One of the distinguished material properties within the layers is fine grain microstructure [4,5,6,7,8,9,10,11,12,13]. It is, therefore, reasonable to name these layers fine grain layers.
Most of the results mentioned above concern with the description of material properties within fine grain layers. However, to develop a method for controlling the material properties within the fine grain layers using parameters of metal forming processes, it is necessary to study the effect of these parameters on the parameters that classify essential properties of the layers. Such a study was initiated in [14], where the process of extrusion through conical dies was used for revealing the dependence of the thickness of the fine grain layer on the die angle. For the same purpose, the process of upsetting with conical dies was adopted in [15]. In [14,15,16], the contact surface between the tool and test piece was intentionally treated to increase the friction stress as much as possible. Thus, these papers all dealt with the effect of geometric parameters of the processes on fine grain layers.
A distinguished feature of the present research is that the effect of frictional conditions on the generation of fine grain layers is studied using the process of drawing of thin wires. Another distinguishing feature of this research, when compared to [14,15], is that the ratio of the thickness of the fine grain layer to the radius of wires is much larger than the ratio of the thickness of the layer to the characteristic length of the testpieces used in [14,15]. This feature may be of importance for the efficient use of thin wires under service conditions.

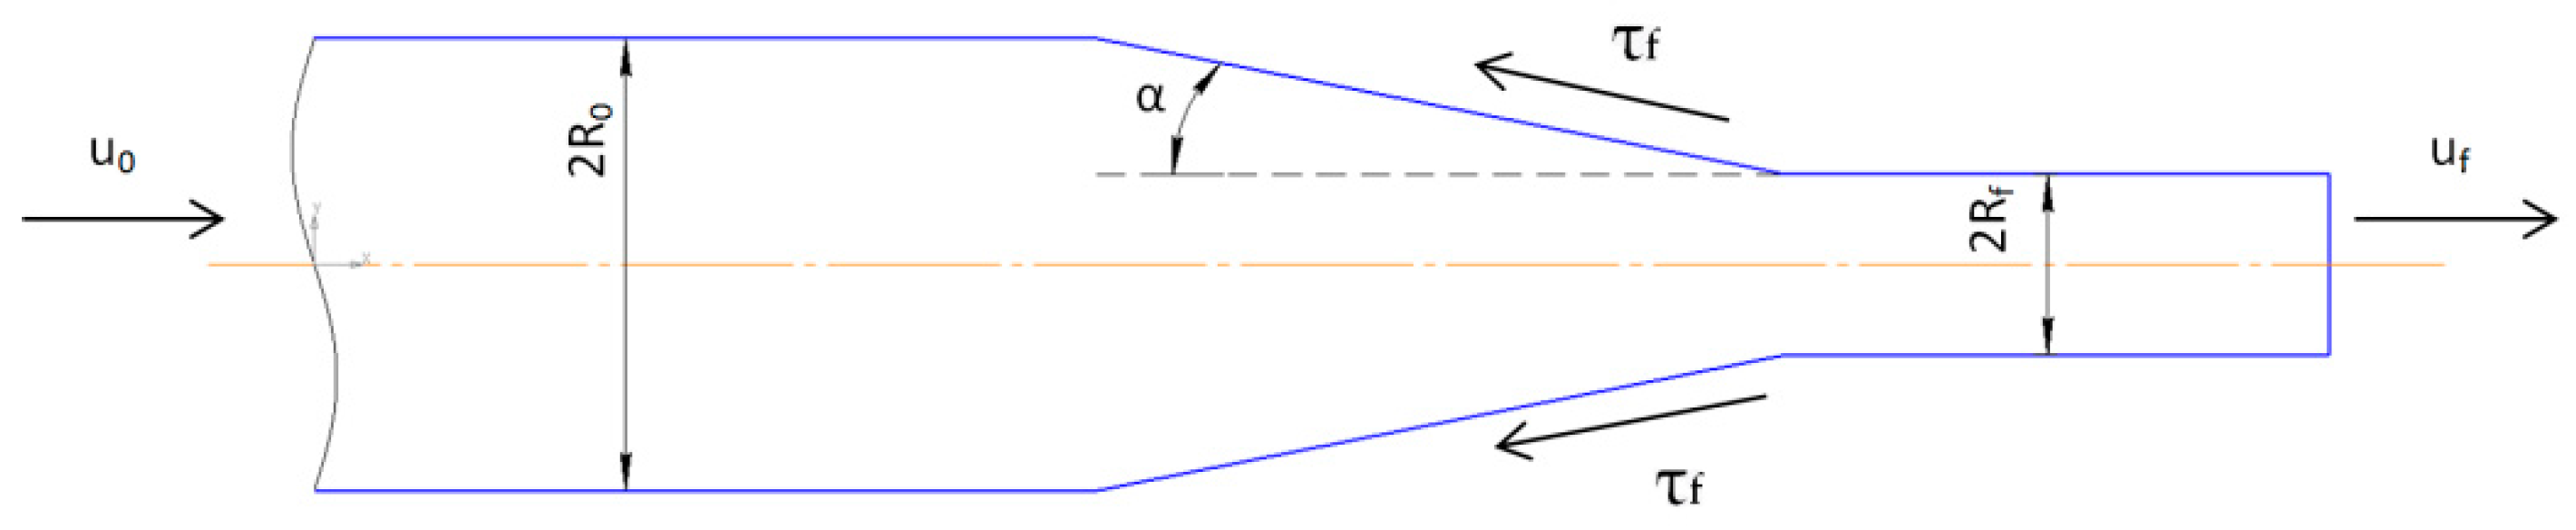
2. Conceptual Approach

The velocity field in the vicinity of frictional interfaces with high friction stresses is very different from the velocity field in standard tests used for determining material properties. In particular, the magnitude of the quadratic invariant of the strain rate tensor is very high near such surfaces. It is therefore very unlikely that conventional constitutive equations are capable of describing the response of material in the vicinity of frictional interfaces in metal forming processes. To overcome this difficulty, an approach based on the strain rate intensity factor was proposed and developed in [16]. The strain rate intensity factor is the coefficient of the leading singular term in a series expansion of the quadratic invariant of the strain rate tensor in the vicinity of maximum friction surfaces [17]. It follows from the asymptotic analyses carried out in [17] for various constitutive equations that the strain rate intensity factor controls the magnitude of the quadratic invariant of the strain rate tensor in a narrow layer near maximum friction surfaces. According to the approach in [16], the constitutive equations should involve the strain rate intensity factor rather than the quadratic invariant of the strain rate tensor. The latter is usually involved in traditional constitutive equations used for the modeling of metal forming processes. The constitutive equations based on the strain rate intensity factor are only valid in the vicinity of surfaces with high frictional stresses. In particular, the thickness of the layer of intensive plastic deformation should be found using the new type of constitutive equations. There are at least three issues that should be resolved for the further development of the approach [16]. One of these issues is that it is impossible to introduce a criterion that determines the thickness of the layer of intensive plastic deformation unambiguously. One possible criterion has been proposed in [15]. However, it is evident that the criterion should depend on the material.
The thickness of the layer of intensity plastic deformation is associated with a material particle moving along the friction surface at which the strain rate intensity factor is calculated throughout the process of deformation. According to the approach in [16], the thickness of the layer of intensive plastic deformation is completely controlled by the strain rate intensity factor. In particular, if the strain rate intensity factor at two material particles is the same throughout the process of deformation, then the thicknesses of the layer associated with these particles are the same. Therefore, another issue is that this predicted thickness can become equal to or even larger than the characteristic length of a process. It is evident that the approach is not appropriate in this case. This issue is of importance for processes with a small characteristic length. In this case, an experimental study for the material in question should be conducted to confirm the applicability of the approach [16].
The third issue is that the theoretical basis of the approach [16] requires the maximum friction law. It is evident that this law is not satisfied in many real processes. However, the layer of intensive plastic deformation is generated in these processes. Therefore, it is natural to expect that the approach in [16] is applicable even if the actual friction stress is less than that required by the maximum friction law. Another experimental study should be conducted to confirm the applicability of the approach in [16] for such processes.
In the present paper, the drawing of thin wires is used to resolve the issues above for high carbon steel.

3. Experimental

3.1. Material

High carbon steel wire with 0.8% C was chosen for the experimental study. The nominal initial diameter of the wire was 1.7 mm. The chemical composition of the steel used is presented in Table 1.
The wire was produced by drawing from a rod. After drawing, the wire was heat treated by patenting under the following regimes: furnace heating at the temperature of austenization 980–1000 °C for 60 s, isothermal cooling in melted lead at 560 °C for 20 s with further soaking in air to the ambient temperature. The pearlite structure with grain size of 5–30 µm was obtained. A typical wire microstructure after heat treatment is shown in Figure 1.

3.2. Process of Deformation

For revealing the friction condition and tool geometry effects on some properties of the fine grain layer the drawing process through conical dies made of sintered hard alloy H6F (tungsten carbide and cobalt) was used. A geometrical scheme of the process is shown in Figure 2.
In Table 2, the experimental regimes of the drawing process are presented. To study the effect of geometrical parameters of the process on the properties of the fine grain layer, dies with semi-angles of α = 4° (series of experiments 1.1–1.3), α = 5° (series of experiments 2.1–2.3) and α = 6° (series of experiments 3.1–3.3) were used. These values of die semi-angle are used for carbon steel wire manufacturing. To change friction conditions for the further assessment of their influence on the properties of the fine grain layer, two methods were adopted. Firstly, the special treatment of the contact surface between die and wire was performed. Secondly, different technological lubricants were applied. To achieve the soft friction conditions denoted by (s) in the manuscript, the surface of wire was coated by a layer of borax (sodium tetraborate) with surface density 5 g/m2. In addition, dry sodium drawing lubricant was used. To achieve the medium friction conditions denoted by (m) in the manuscript, borax and sodium lubricant were not used. Hard friction conditions (h) were achieved using no lubricant and adding abrasive diamond suspension to the deformation zone. The drawing speed uf (Figure 2) was equal to 0.5 m/s in all tests.

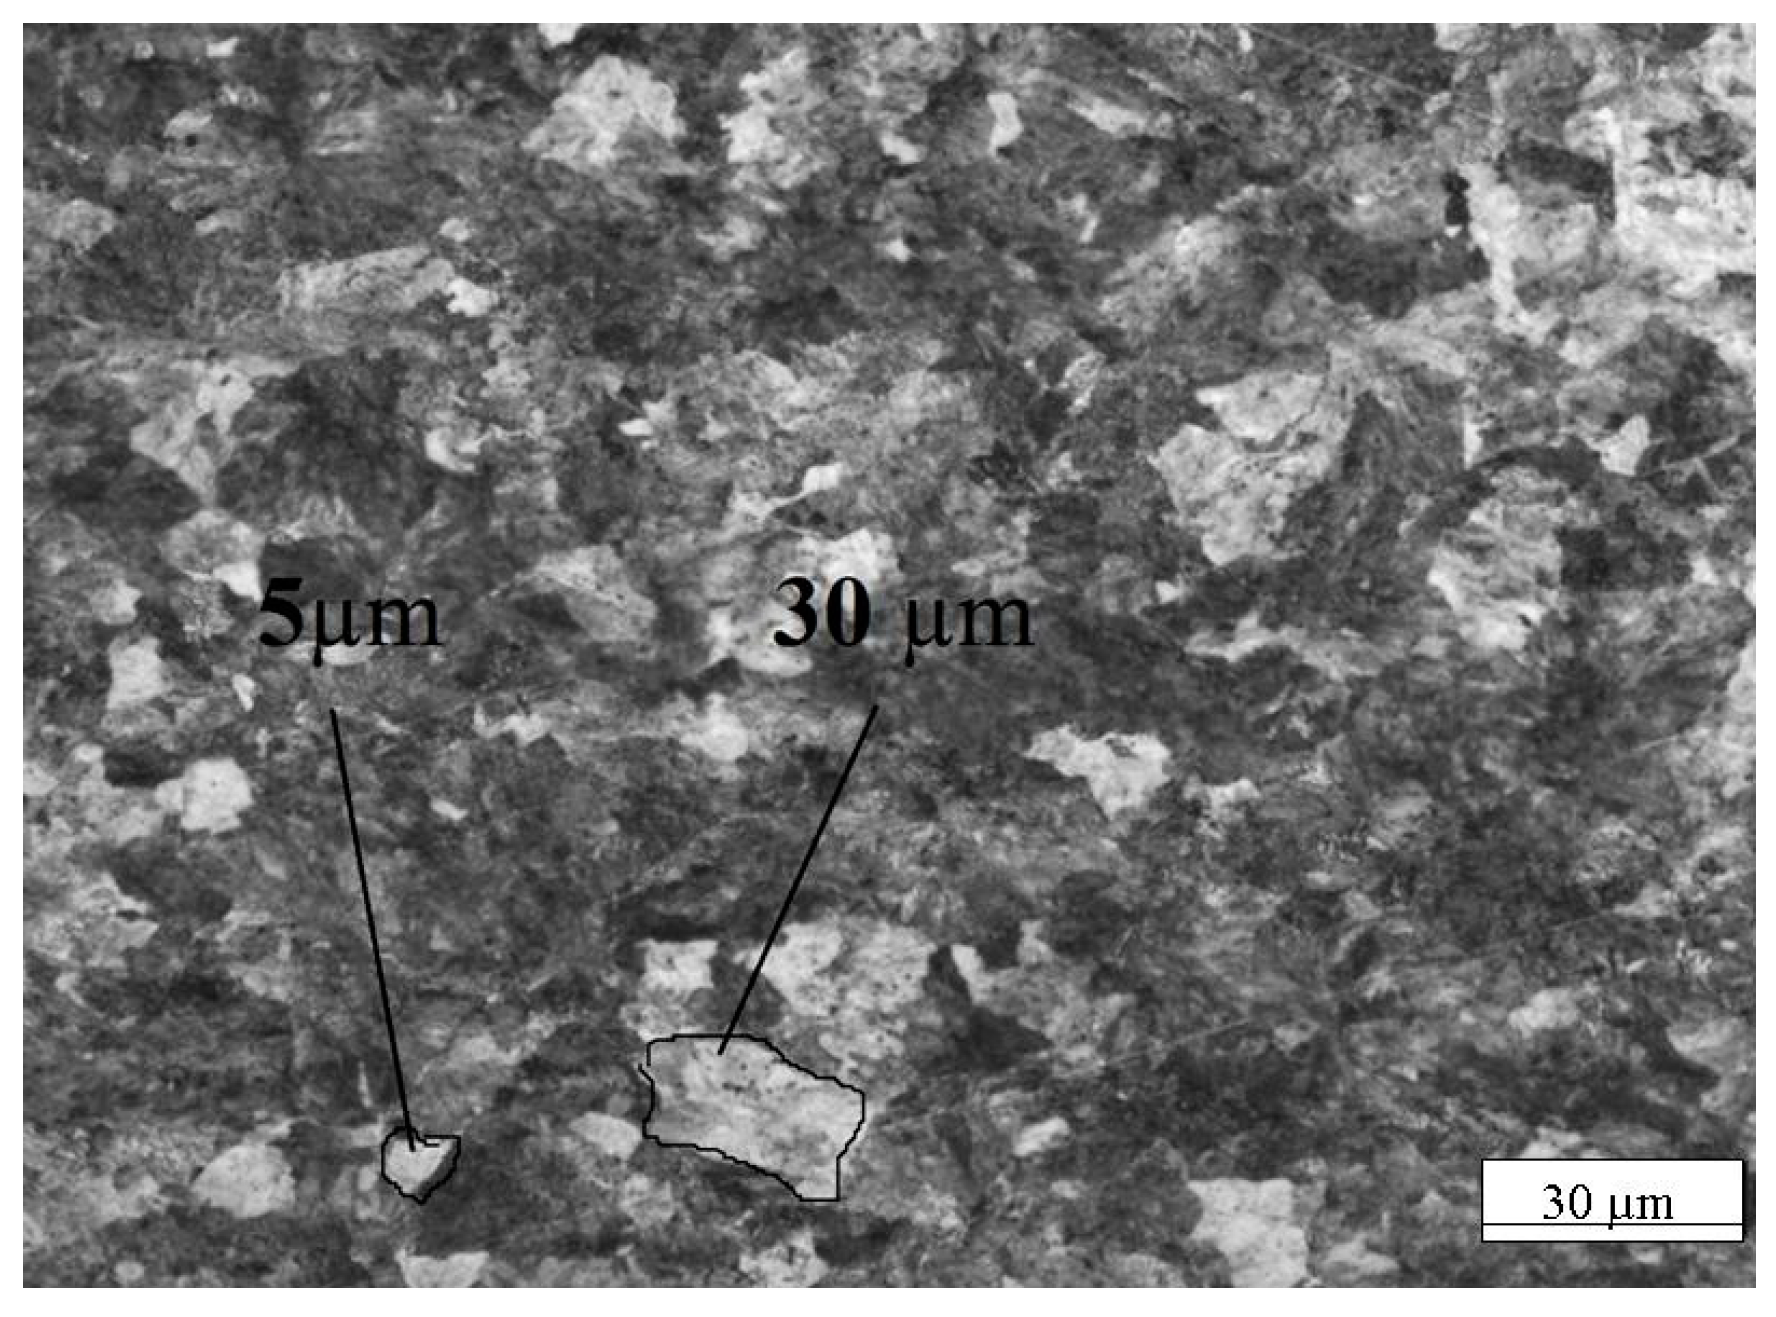
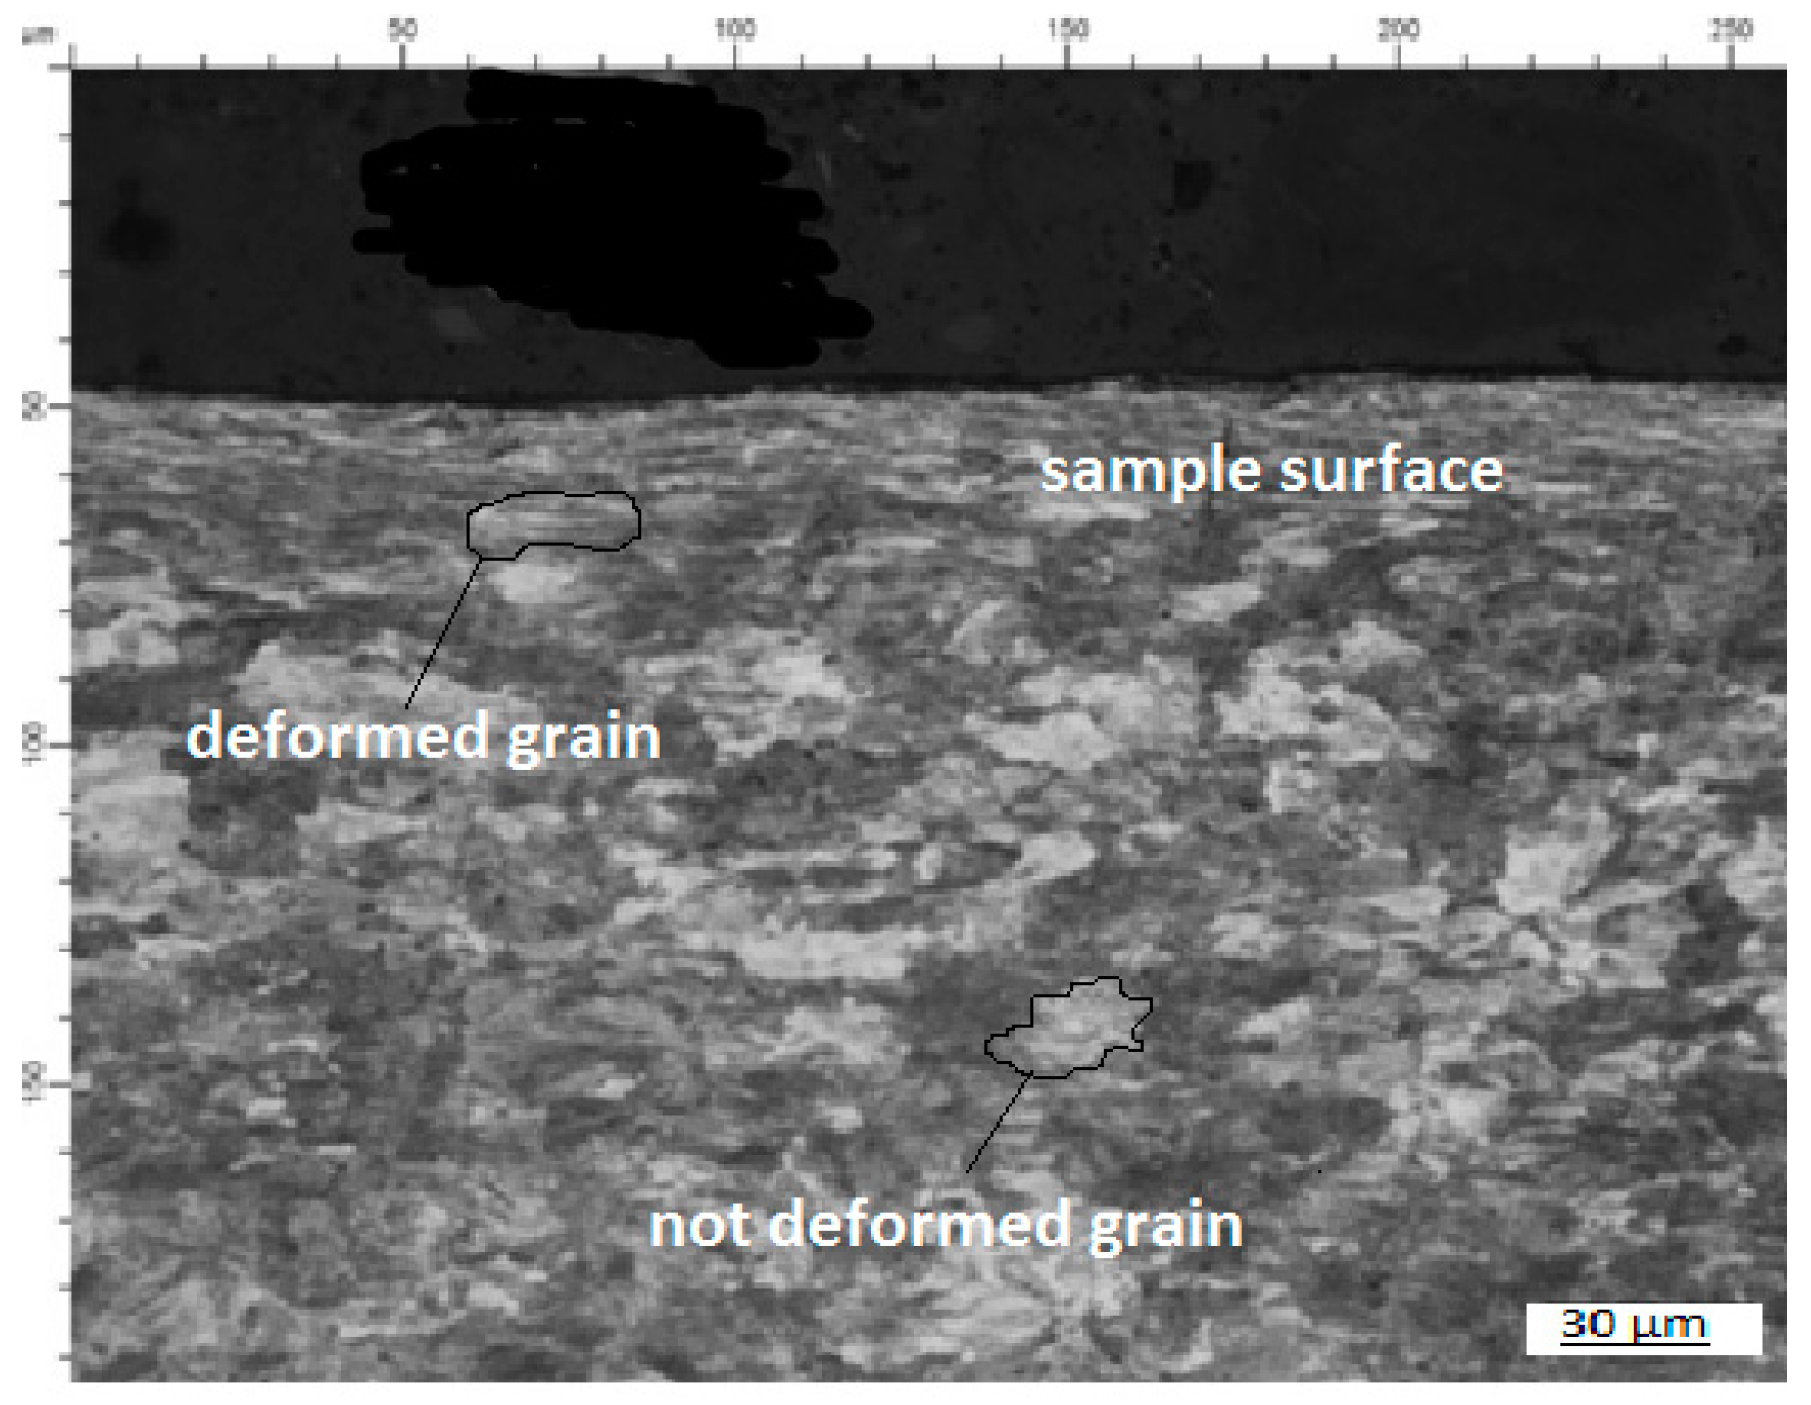
3.3. Material Characterization

Wire microstructure after drawing was investigated on samples prepared from the longitudinal section after etching in 4% solution of nitric acid in ethyl alcohol by immersion of the polished surface into the bath with the reagent. Optical microscopy with magnification of ×500 was used for the observation of microstructure. The qualitative distribution of microstructure in the vicinity of the friction surface after drawing is independent of the process conditions. A typical distribution is shown in Figure 3. It is seen from this figure that grains within the fine grain layer are elongated along the direction of drawing.
The change in grain size was analyzed by means of the coefficient of anisotropy A. This coefficient was calculated automatically using Thixomet PRO software (A. Kazakov, D. Kiselev, Saint-Petersburg, Russian Federation, certificate of authorship No. 2610-11-30/2004 from 02.03.2004) by the means of Equation (1):
A = N L || N L
where NL|| is the medium quantity of phase particles (grains) which are crossed by secants parallel to the deformation axis elated to the unit of the secant length; NL⊥ is the medium quantity of phase particles (grains) which are crossed by secants perpendicular to the deformation axis elated to the unit of the secant length.
Thereby, the coefficient of anisotropy A characterizes the relative change of grain size in the process of their plastic deformation [18]. The value of the coefficient of anisotropy A < 1 indicates that the grains are elongated along the drawing direction. If A > 1 then the grains are located perpendicular to the drawing axis. The coefficient of anisotropy makes it possible to estimate the deformation of grains in different layers of the drawn wire.
The special area was chosen on the obtained images for further microstructure analysis, so called the rectangle of analysis, with the average square of 7000–10,000 µm2 (Figure 4). Intervals with 5 µm in width from the surface to the center of the sample were used for the coefficient A estimation.
This image was obtained on the wire drawn from series 3.23 (Table 2).

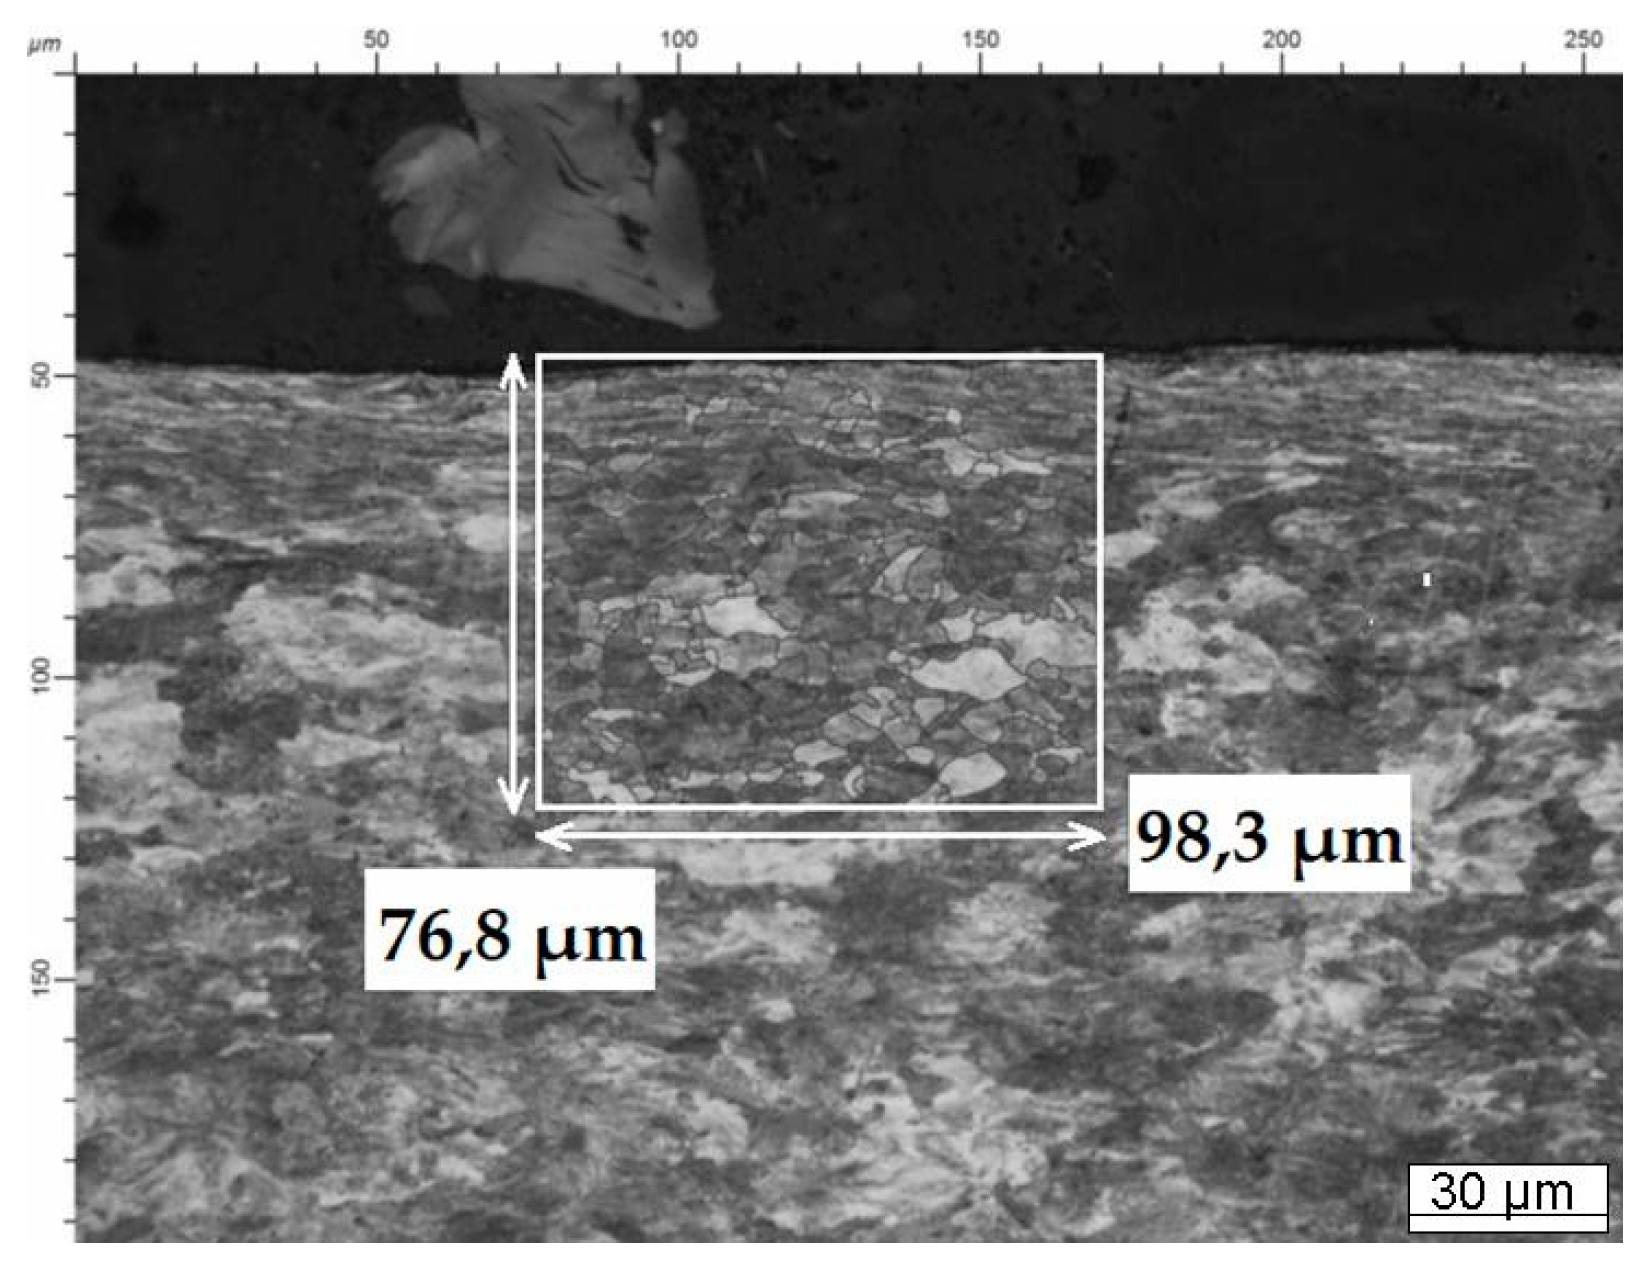
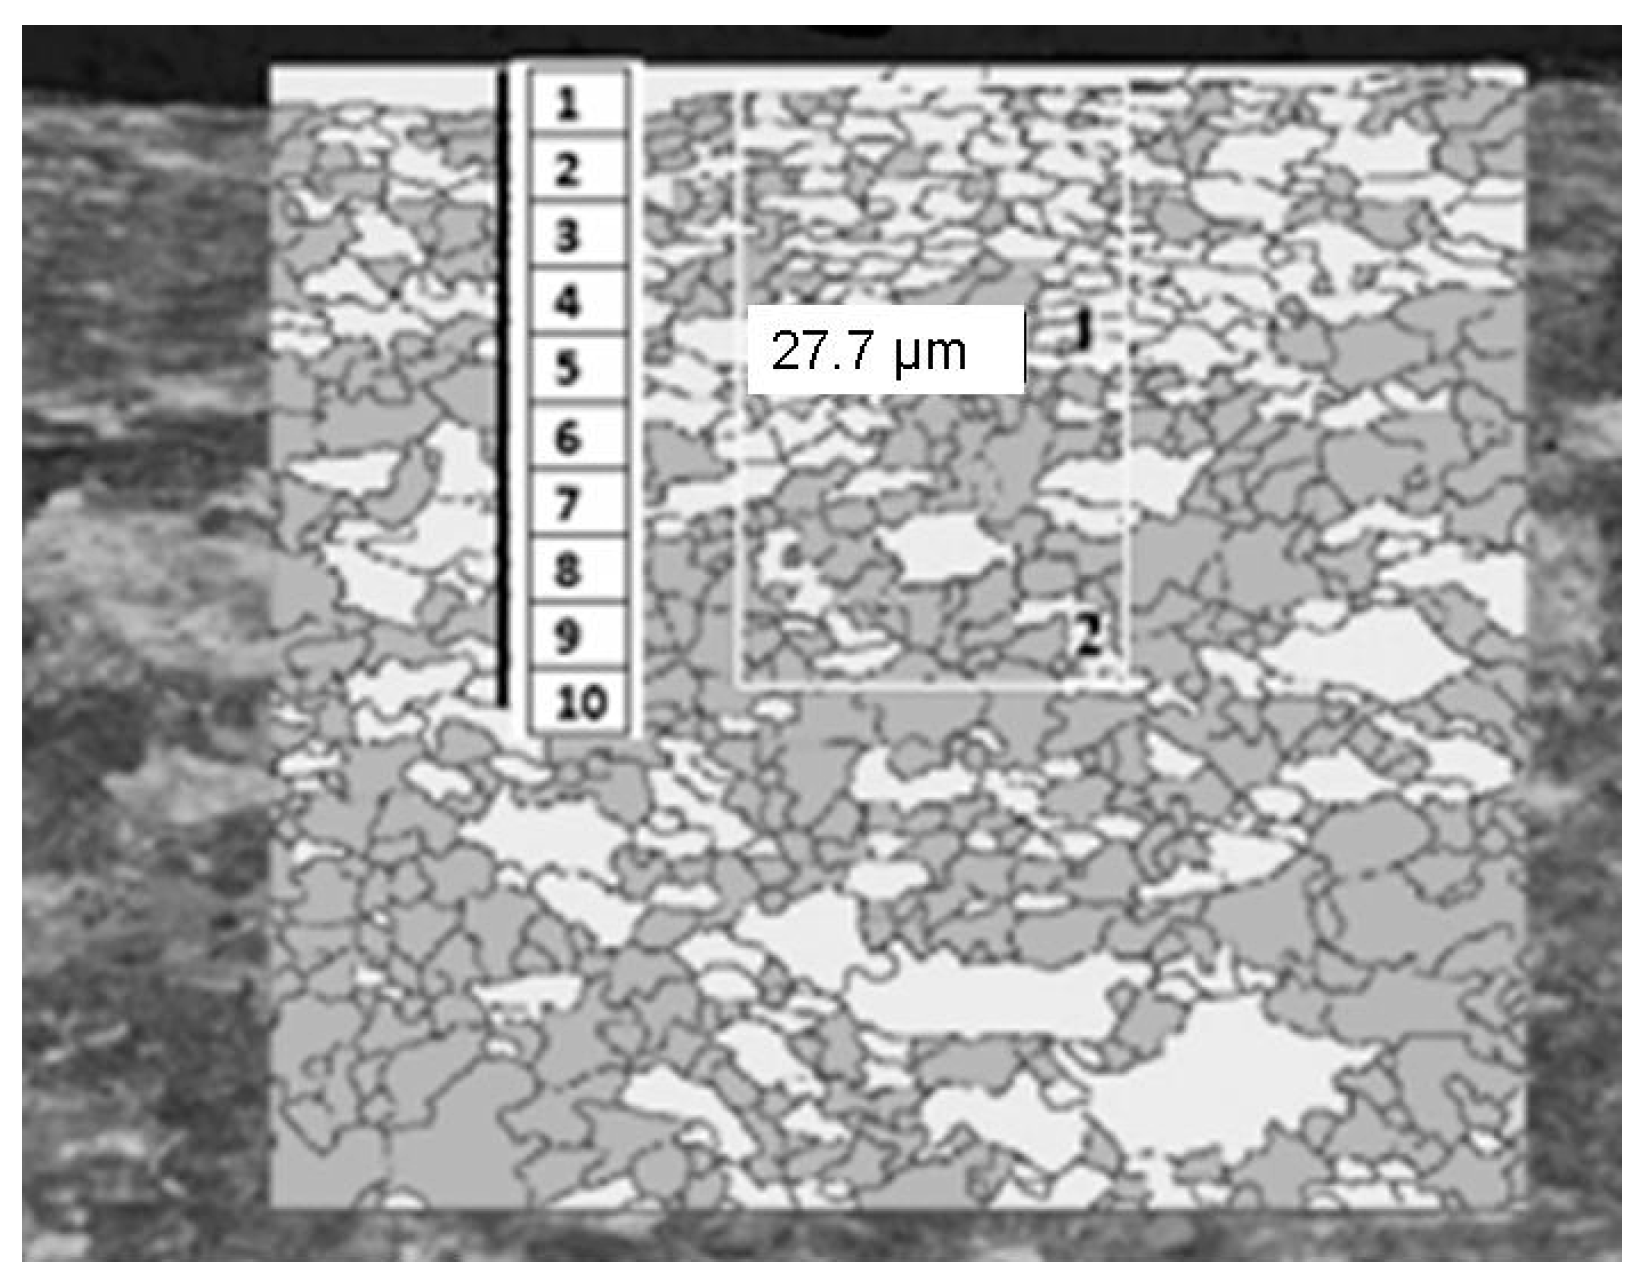
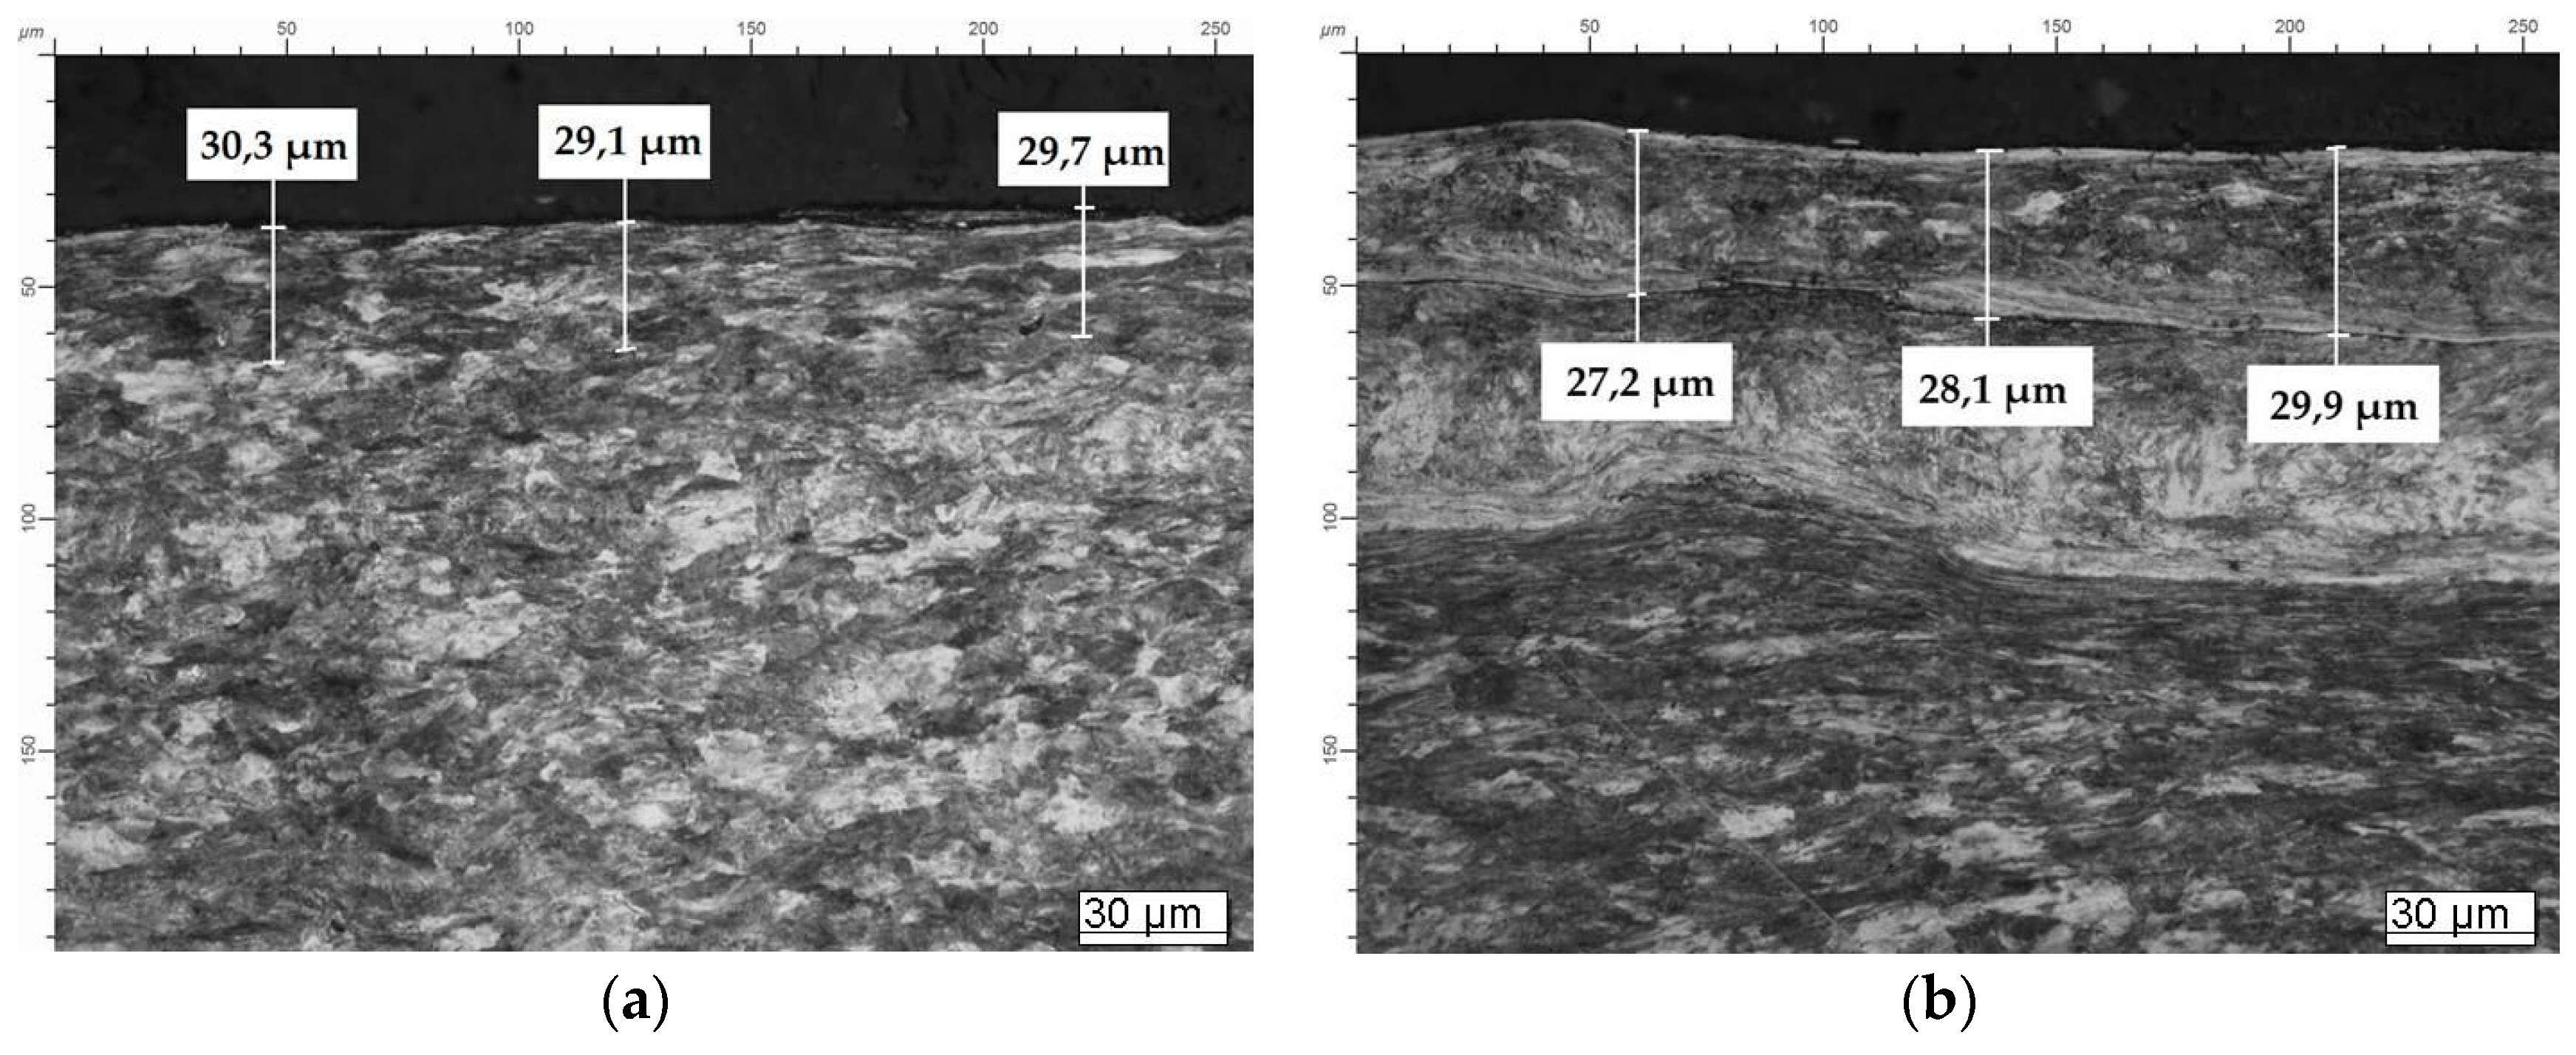
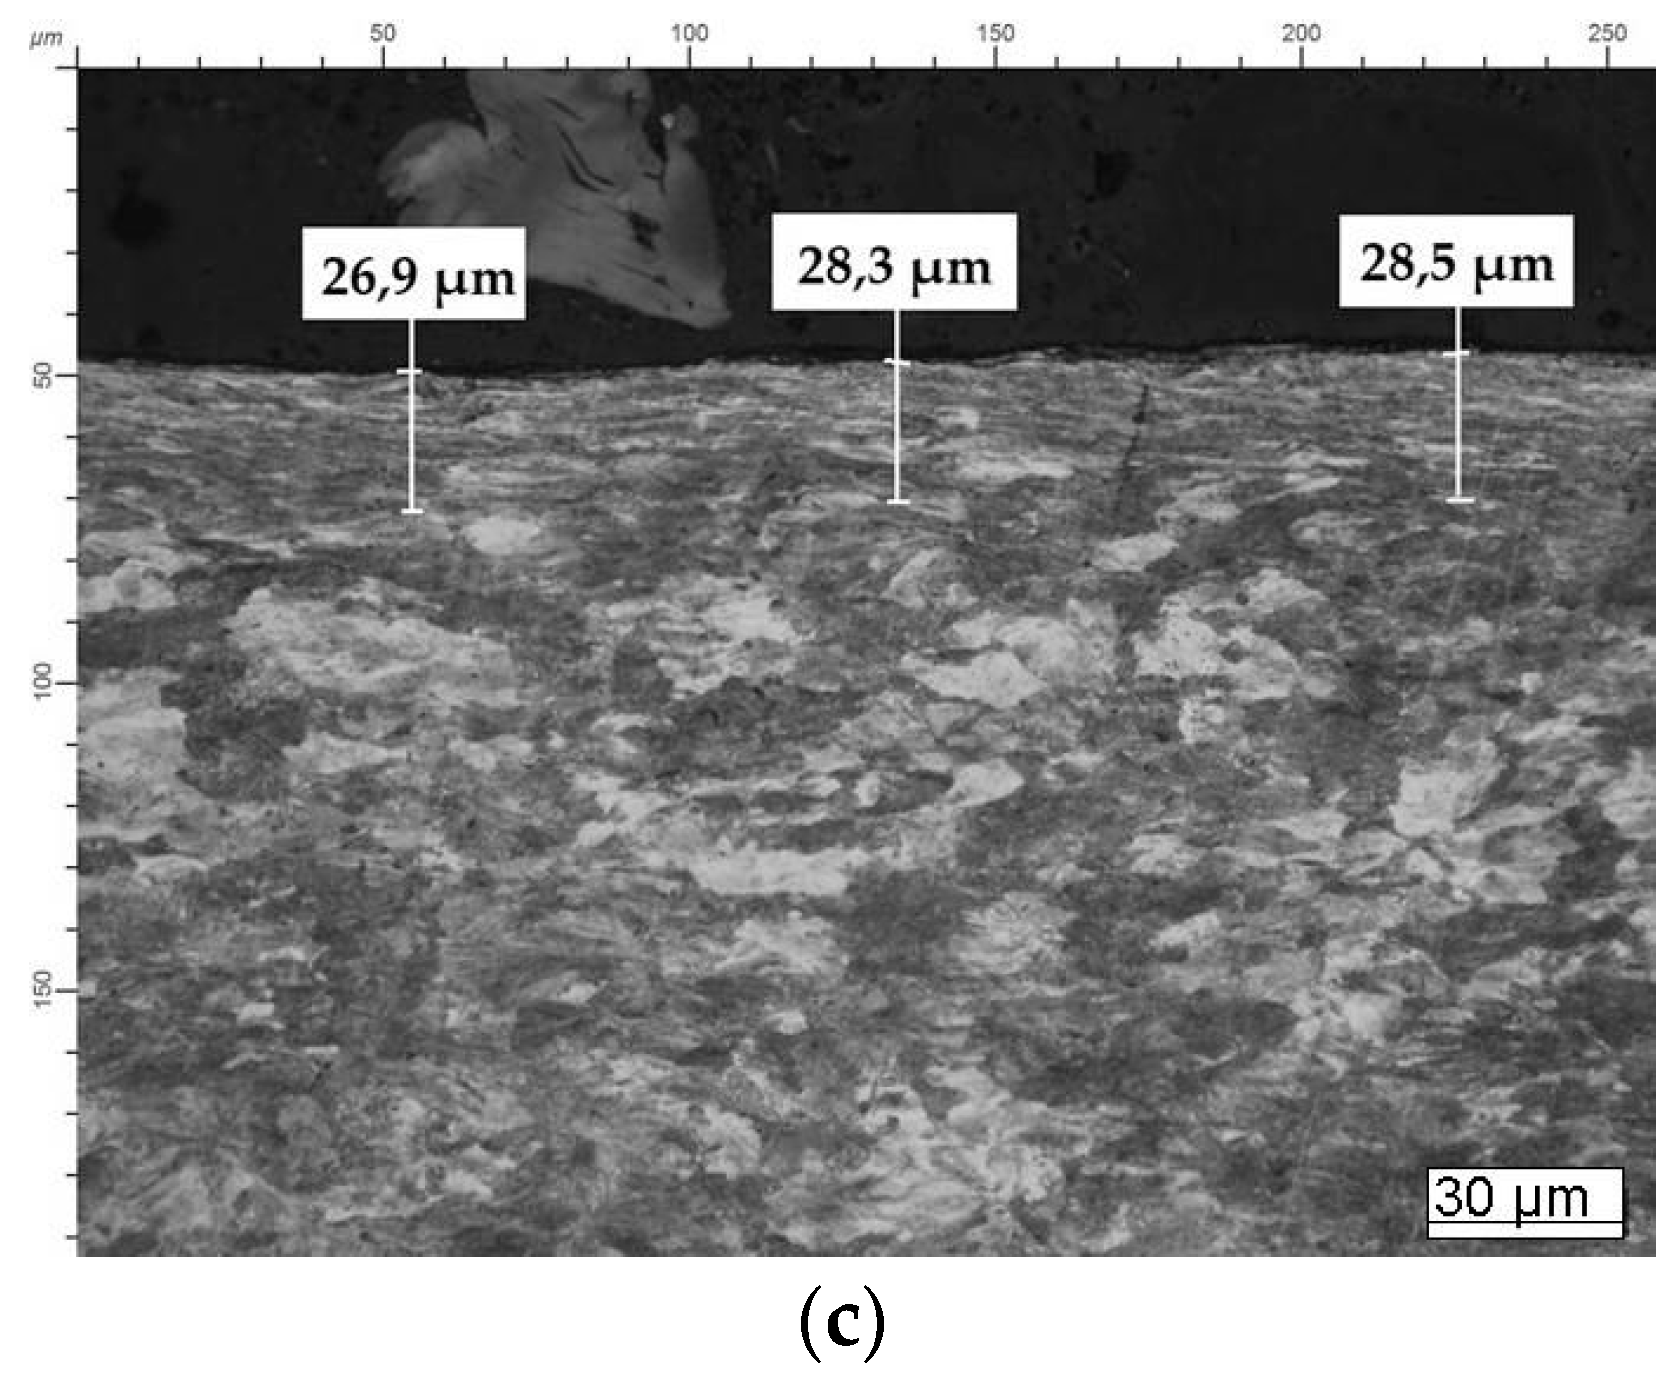
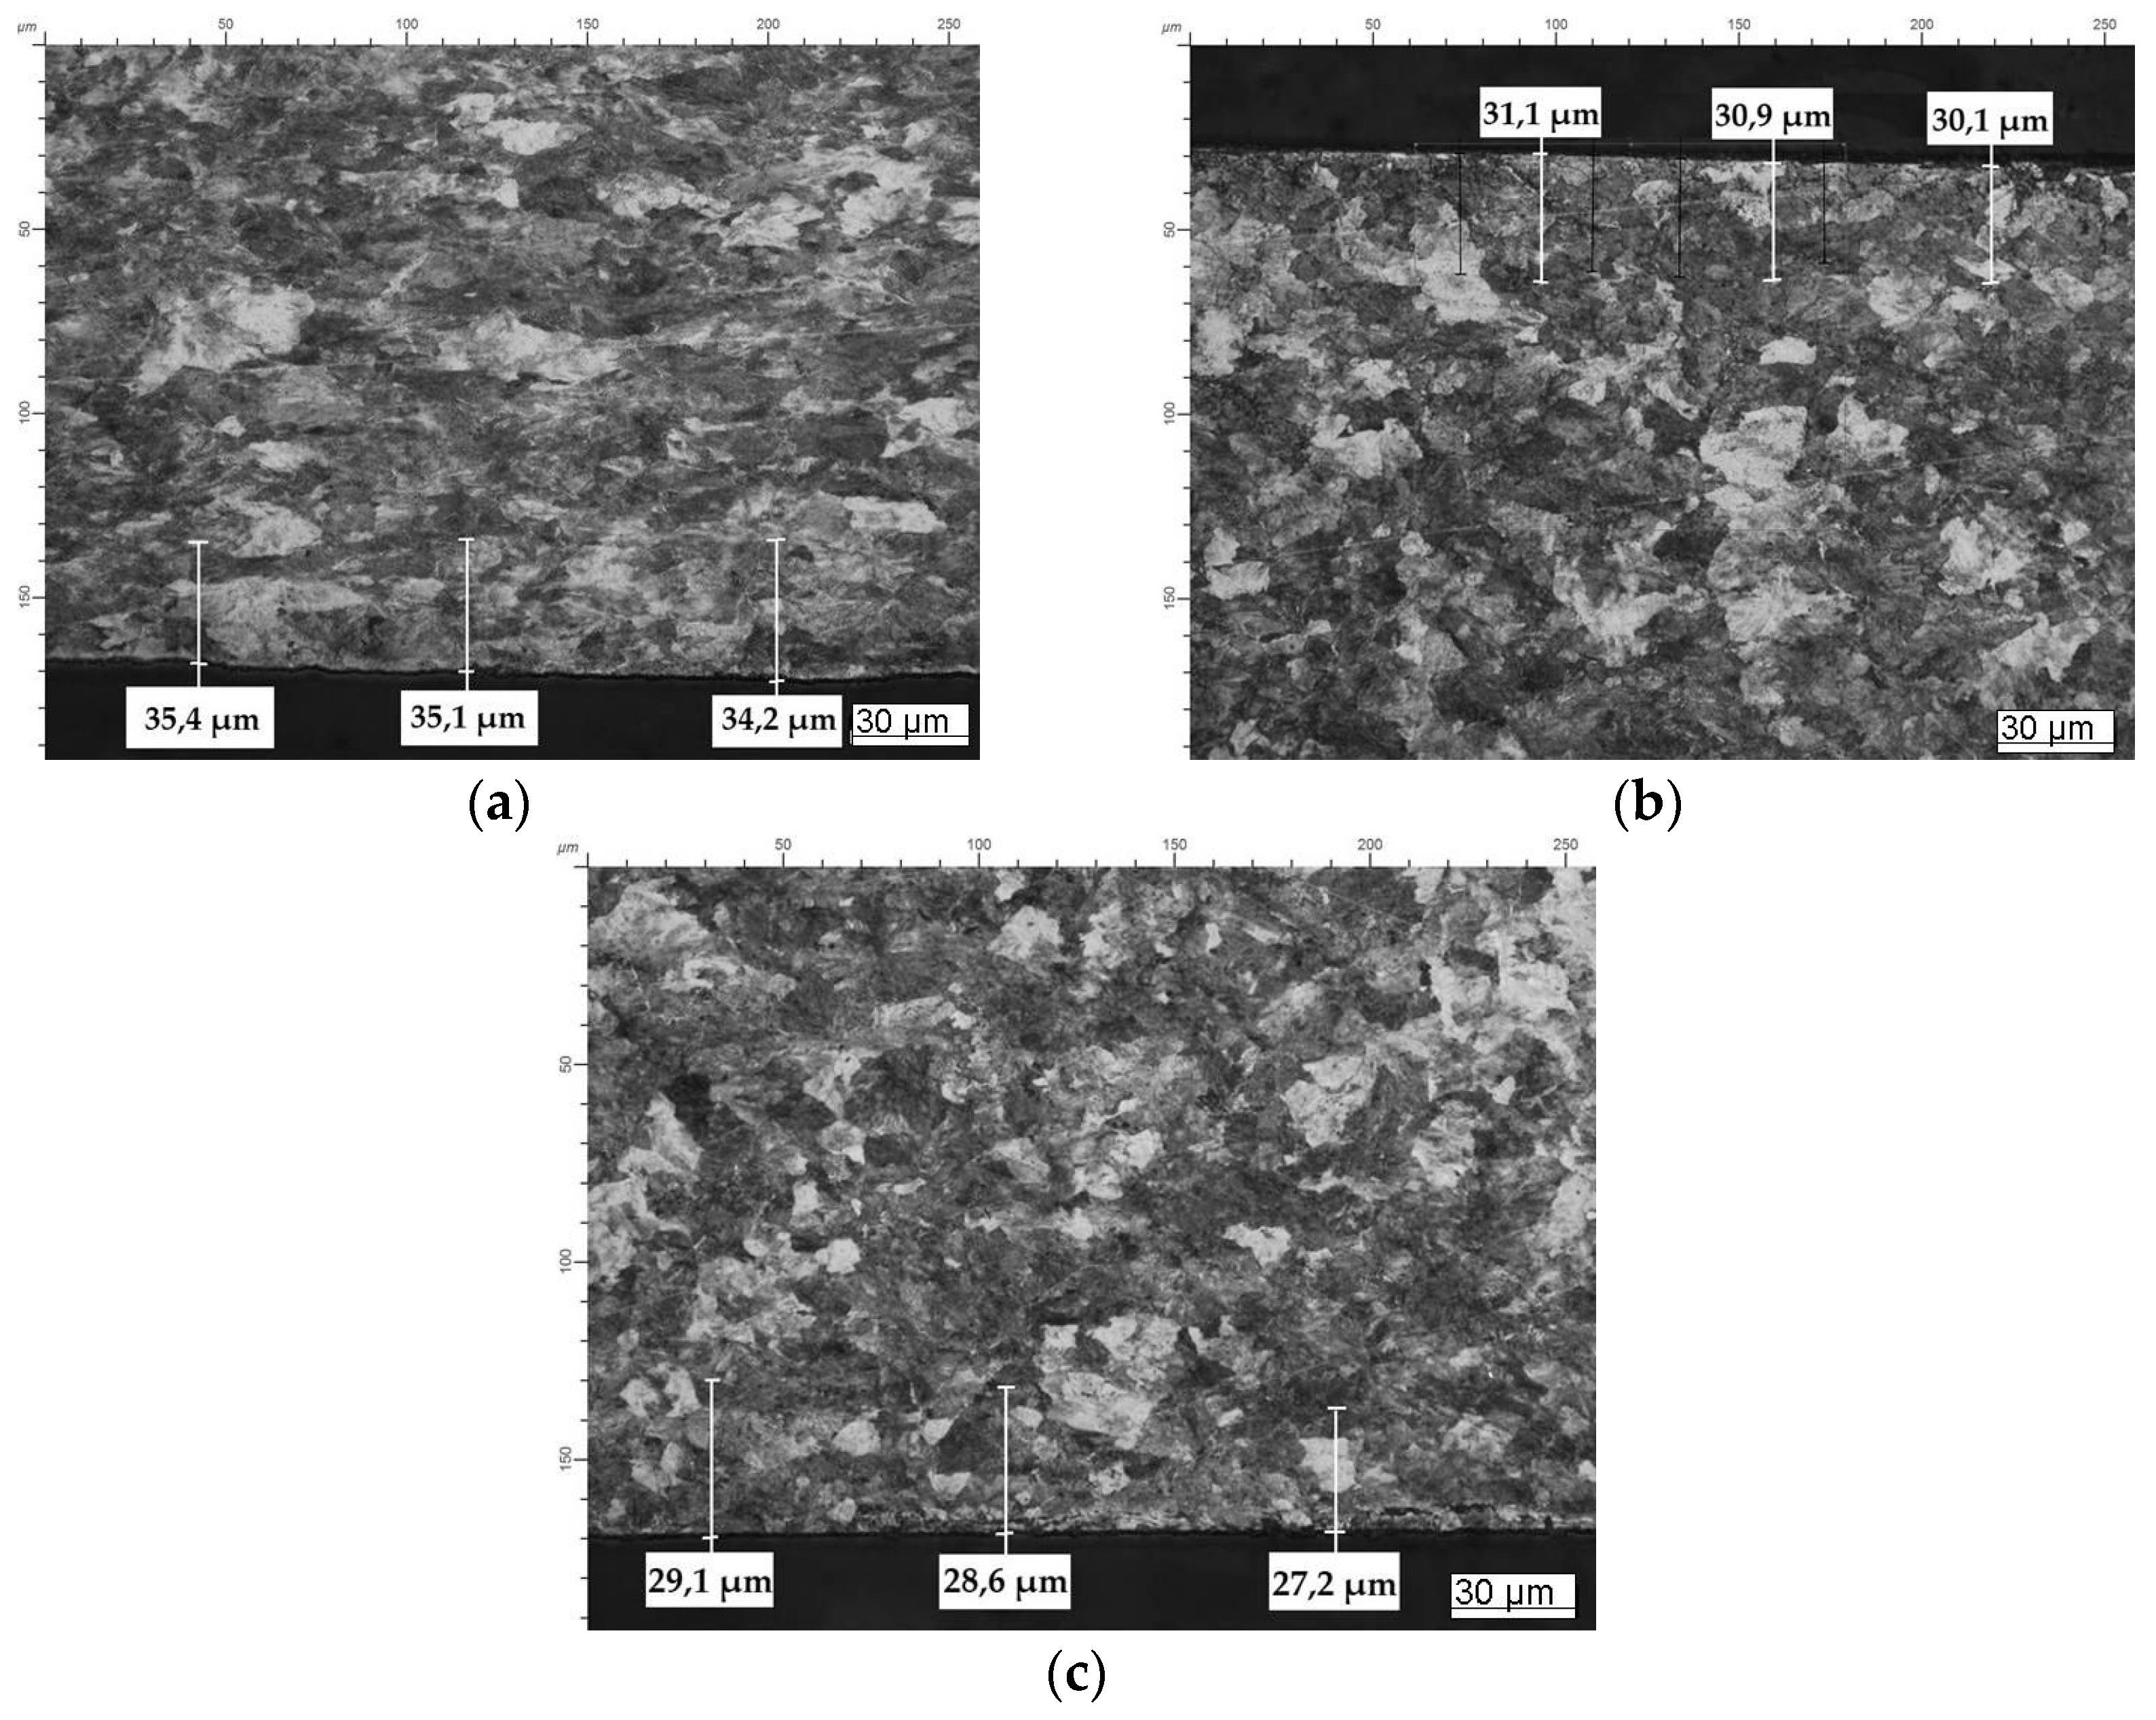
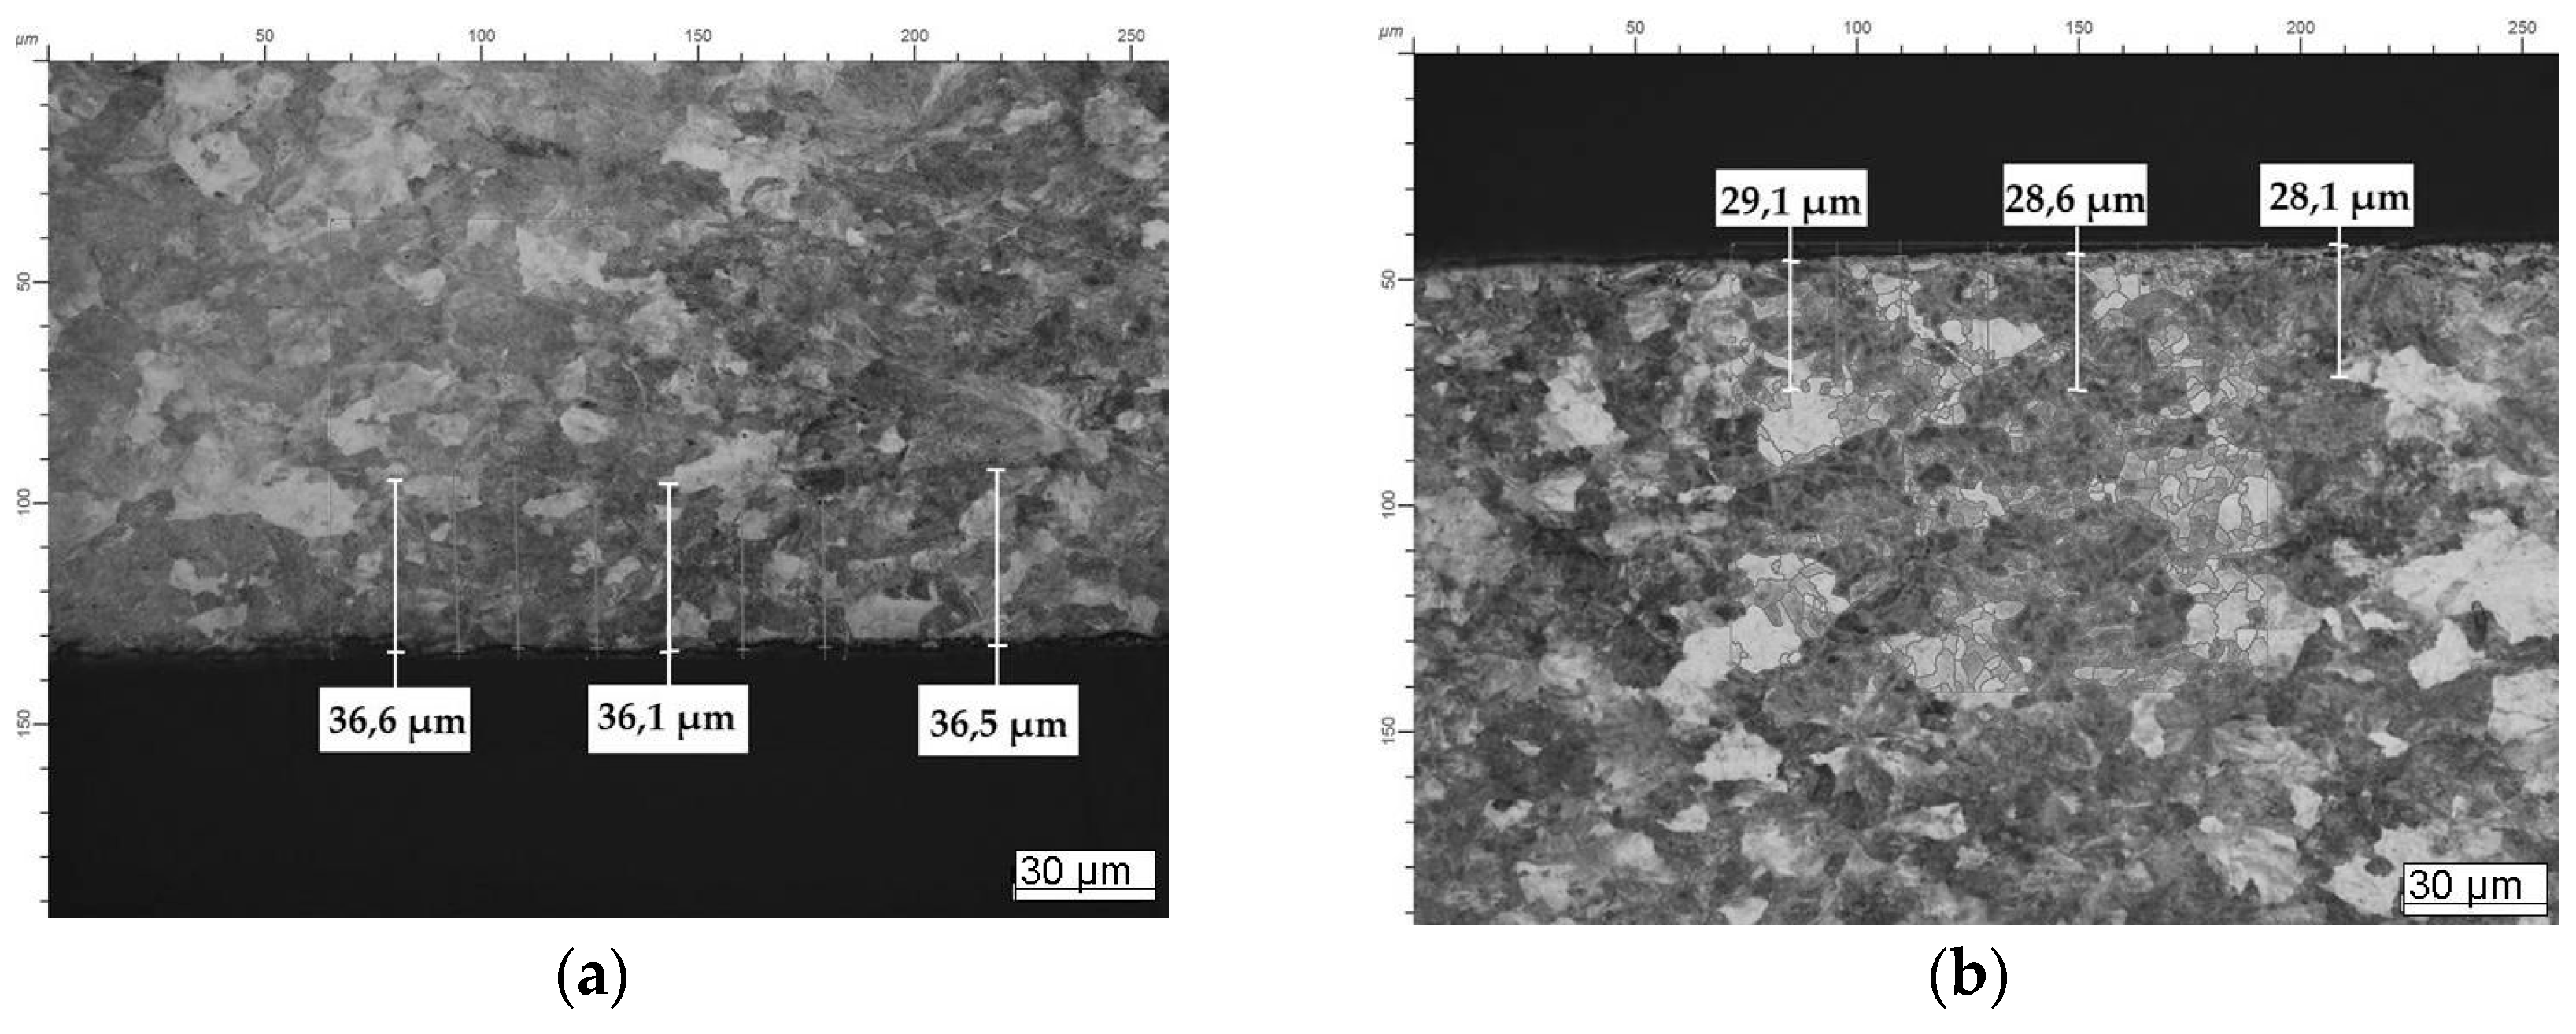
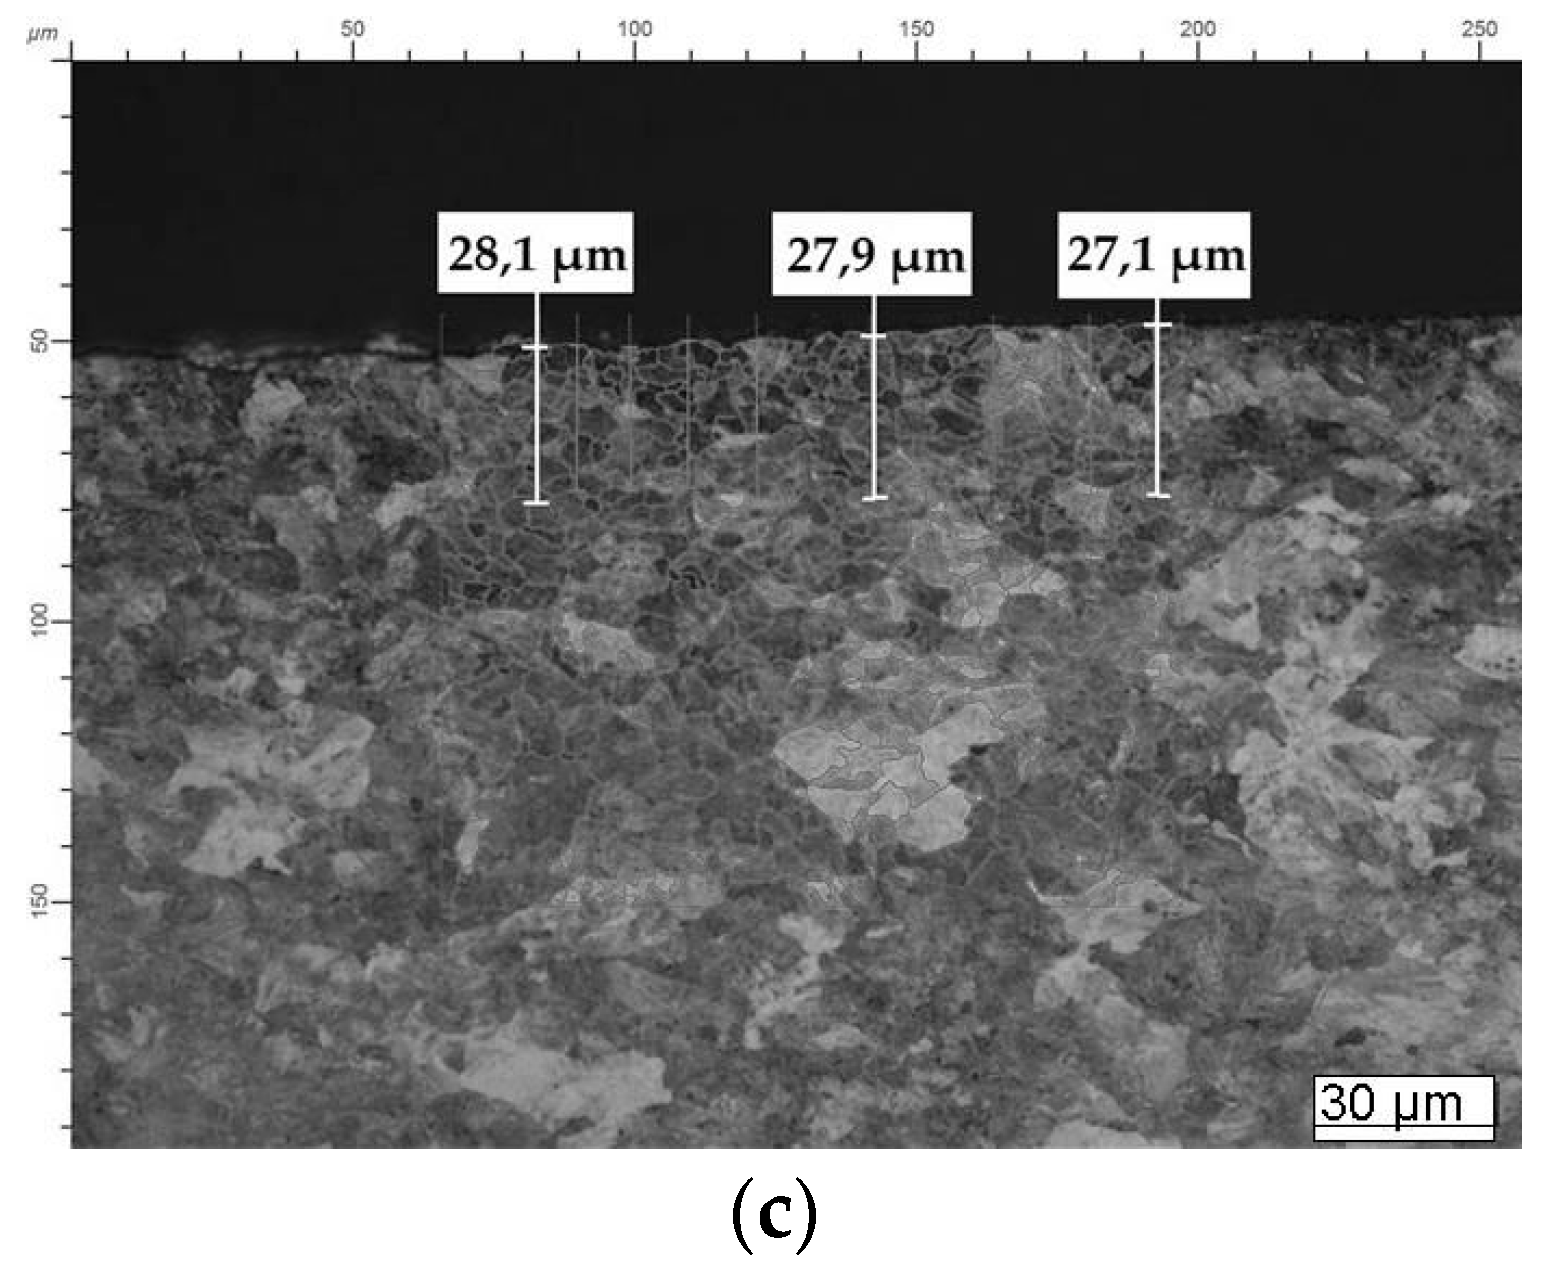
3.4. Thickness of the Layer

For determining the thickness of the fine grain layer, it is necessary to propose a quantitative criterion. In order to develop such criteria, it is instructive to examine the typical microstructure distribution in the transversal cross section of the wire after drawing (Figure 4).
The coefficient A was measured at the chosen locations with intervals 5 µm from the surface to the center as it is shown in Figure 5. Experiments were repeated three times at the same conditions. Three samples of carbon steel wire were obtained. Three measurements were made on each sample. As a result, nine values of the layer thickness were analyzed for each series of experiments.
The distribution of the coefficient of anisotropy from the wire surface to the center is presented in Figure 6. Location 10 corresponds to the center of the wire and location 1 to its surface.
It is seen from this figure that the coefficient of anisotropy attains its minimum value of about 0.31 at the surface and then monotonically increases from 0.31 to 0.67 between locations 1 and 4. The coefficient of anisotropy slightly varies from 0.71 to 0.72 between locations 5 and 6. Then, it increases again from 0.72 to 0.92 between location 6 and the center of the wire. Using this observation, it is reasonable to postulate the following criterion to determine the thickness of the fine grain later. The fine grain layer consists of grains whose coefficient of anisotropy satisfies the inequality:
A < 0.7
The analysis of the coefficient of anisotropy change at wire drawing makes it possible to determine the interval where the Equation (1) is correct and, hence, the depth of the surface layer. As a result, it was obtained that the thickness of the surface layer in the wire shown in Figure 5 is equal to 27.7 µm.

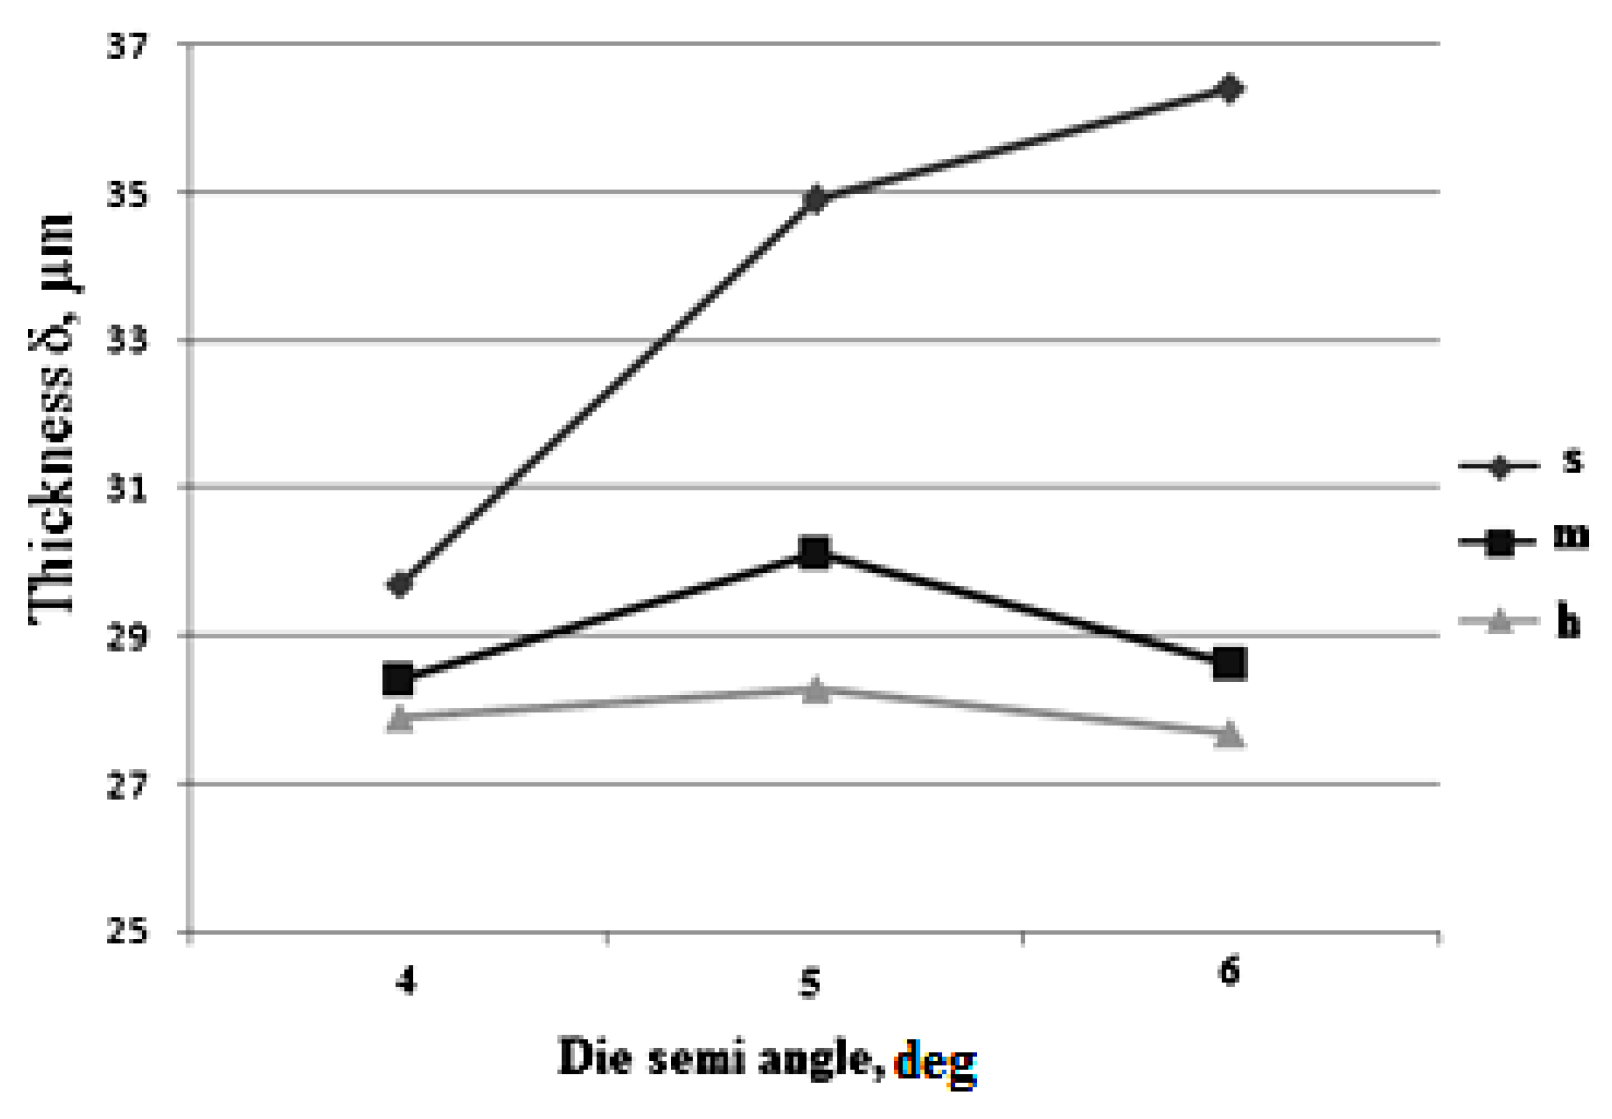
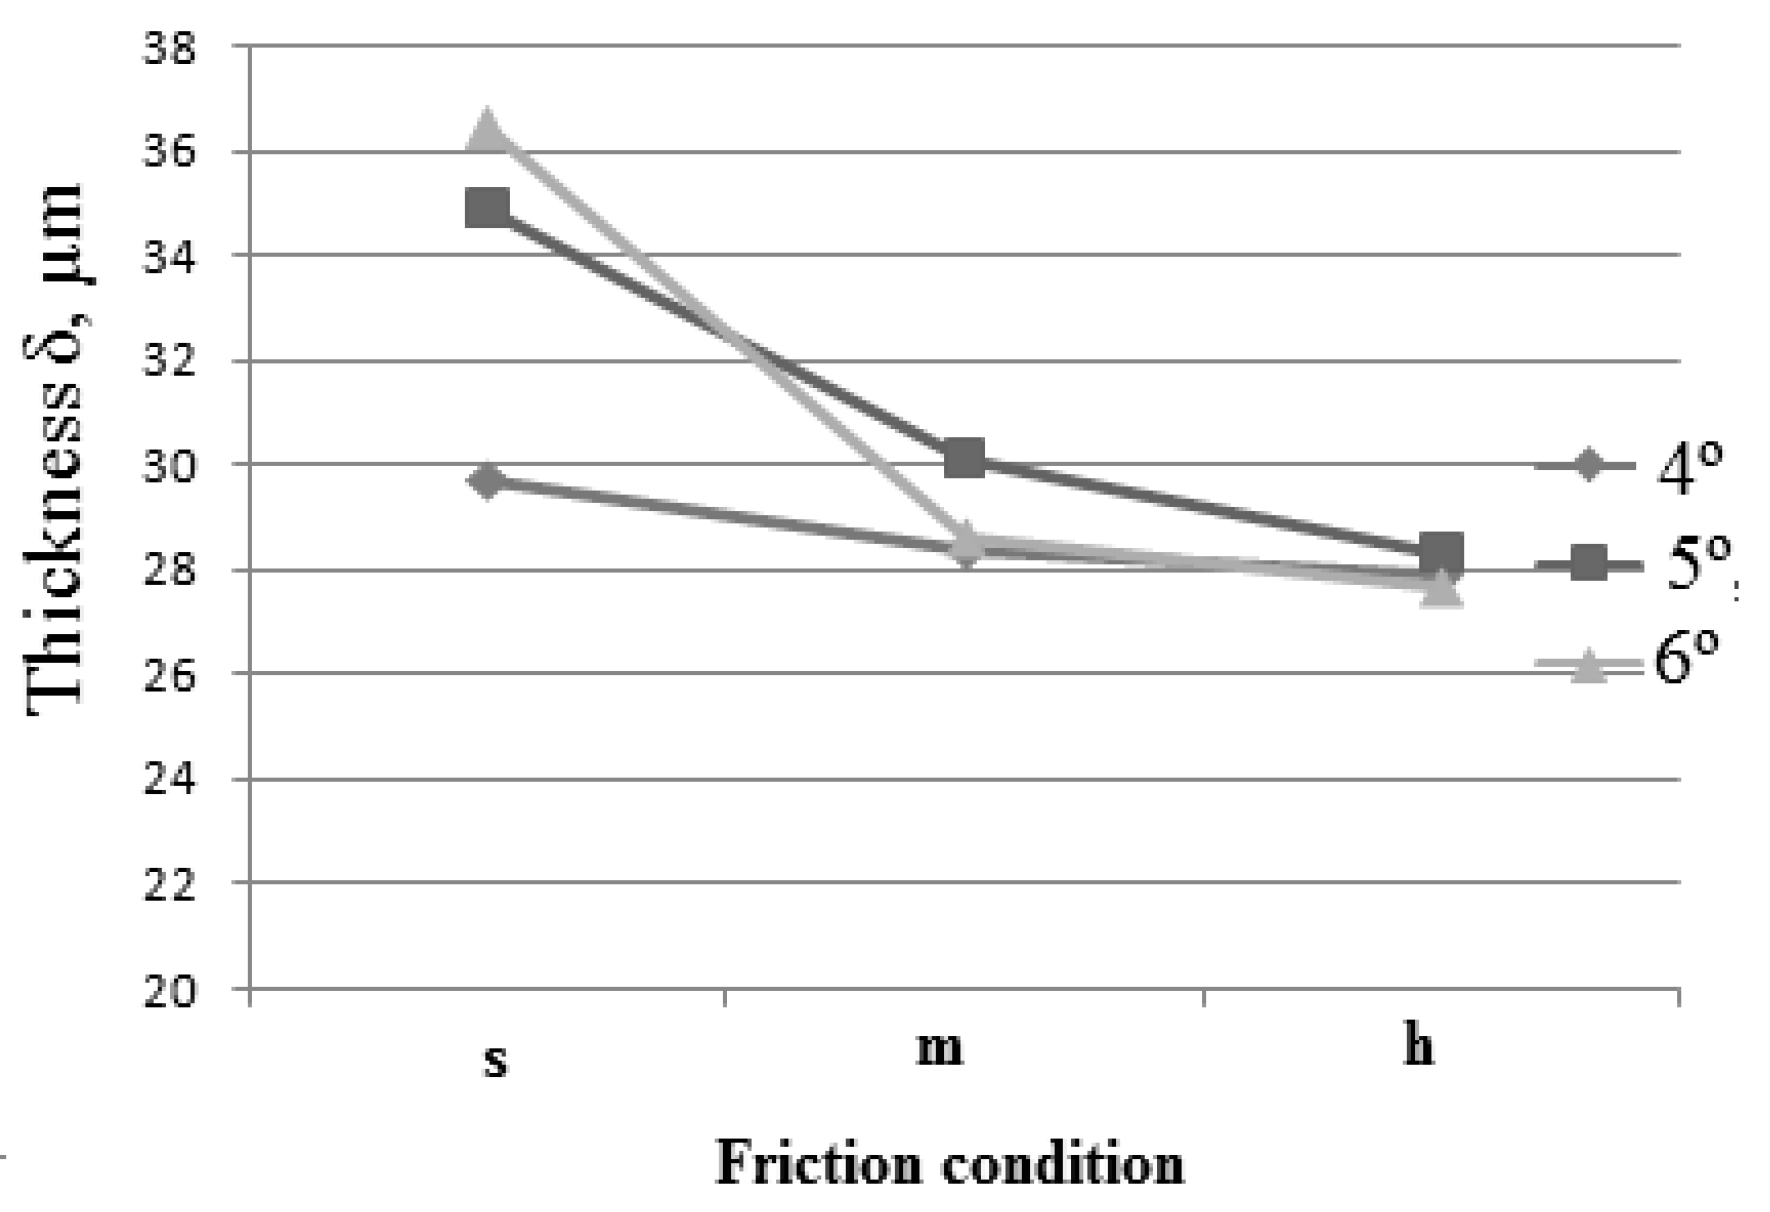
3.5. Effect of Frictional Conditions and Die Angle on the Thickness of the Layer

Criterion (2) was used to determine the thickness of the fine grain layer in all wires drawn under the conditions specified in Table 2. These results are illustrated in Figure 7, Figure 8 and Figure 9 and summarized in Table 3.
The effect of the die semi-angle on the thickness of the fine grain layer at different friction conditions is illustrated in Figure 10, and the effect of the friction conditions at different dies semi-angles in Figure 11.
From the data in Table 3, Figure 9 and Figure 10 it is evident that at thin wire drawing the increase of die semi-angle from 4° to 6° at soft friction conditions leads to the increase of the depth of the layer of severe plastic deformations from 29.7 µm to 36.4 µm. Even so, for medium and hard friction conditions, the effect of the die semi-angle is not evident because in this case the depth of the layer changes no more than 1–2 µm. For soft friction conditions the interesting fact can be stated. With the increase of the die semi-angle, the length of contact surface between carbon steel wire and the die (tool) decreases. At the same time, despite the contact surface decrease, the thickness of the layer increases. It is an unexpected result. It was assumed earlier that at drawing, the increase of contact length between the wire and the die had to result in the intensive wear of the die and formation of the thicker layer. This result needs further theoretical justification.
From the obtained results it is obvious that for all values of die semi-angle the friction conditions deterioration results in the decrease of the depth of layer of severe plastic deformations. At the same time, for drawing with die semi-angle 4° at friction conditions, worsening the layer depth decreases insignificantly from 29.7 µm to 27.9 µm. At wire drawing with die semi-angle 5°, the considerable decrease of layer depth occurs from 34.9 µm to 28.3 µm, and at wire drawing with die semi-angle 6°, the layer depth changes from 36.4 µm to 27.7 µm. It can be explained in the following way. At soft drawing conditions, the absolute value of the layer of severe plastic deformations is larger than at medium and hard friction conditions. Herewith, probably the indicator of the deformation intensity inside the layer is higher at medium and hard friction conditions. In other words, deformation localizes on the wire surface at medium and hard friction conditions. It is observed in lower degree at soft friction conditions. It is necessary to analyze this effect theoretically and can be carried out during further investigations.

4. Conclusions

Investigation results of the dependence of layer of severe plastic deformation depth at drawing of thin high carbon steel wire on such parameters as die semi-angle and friction conditions showed the following regularities:
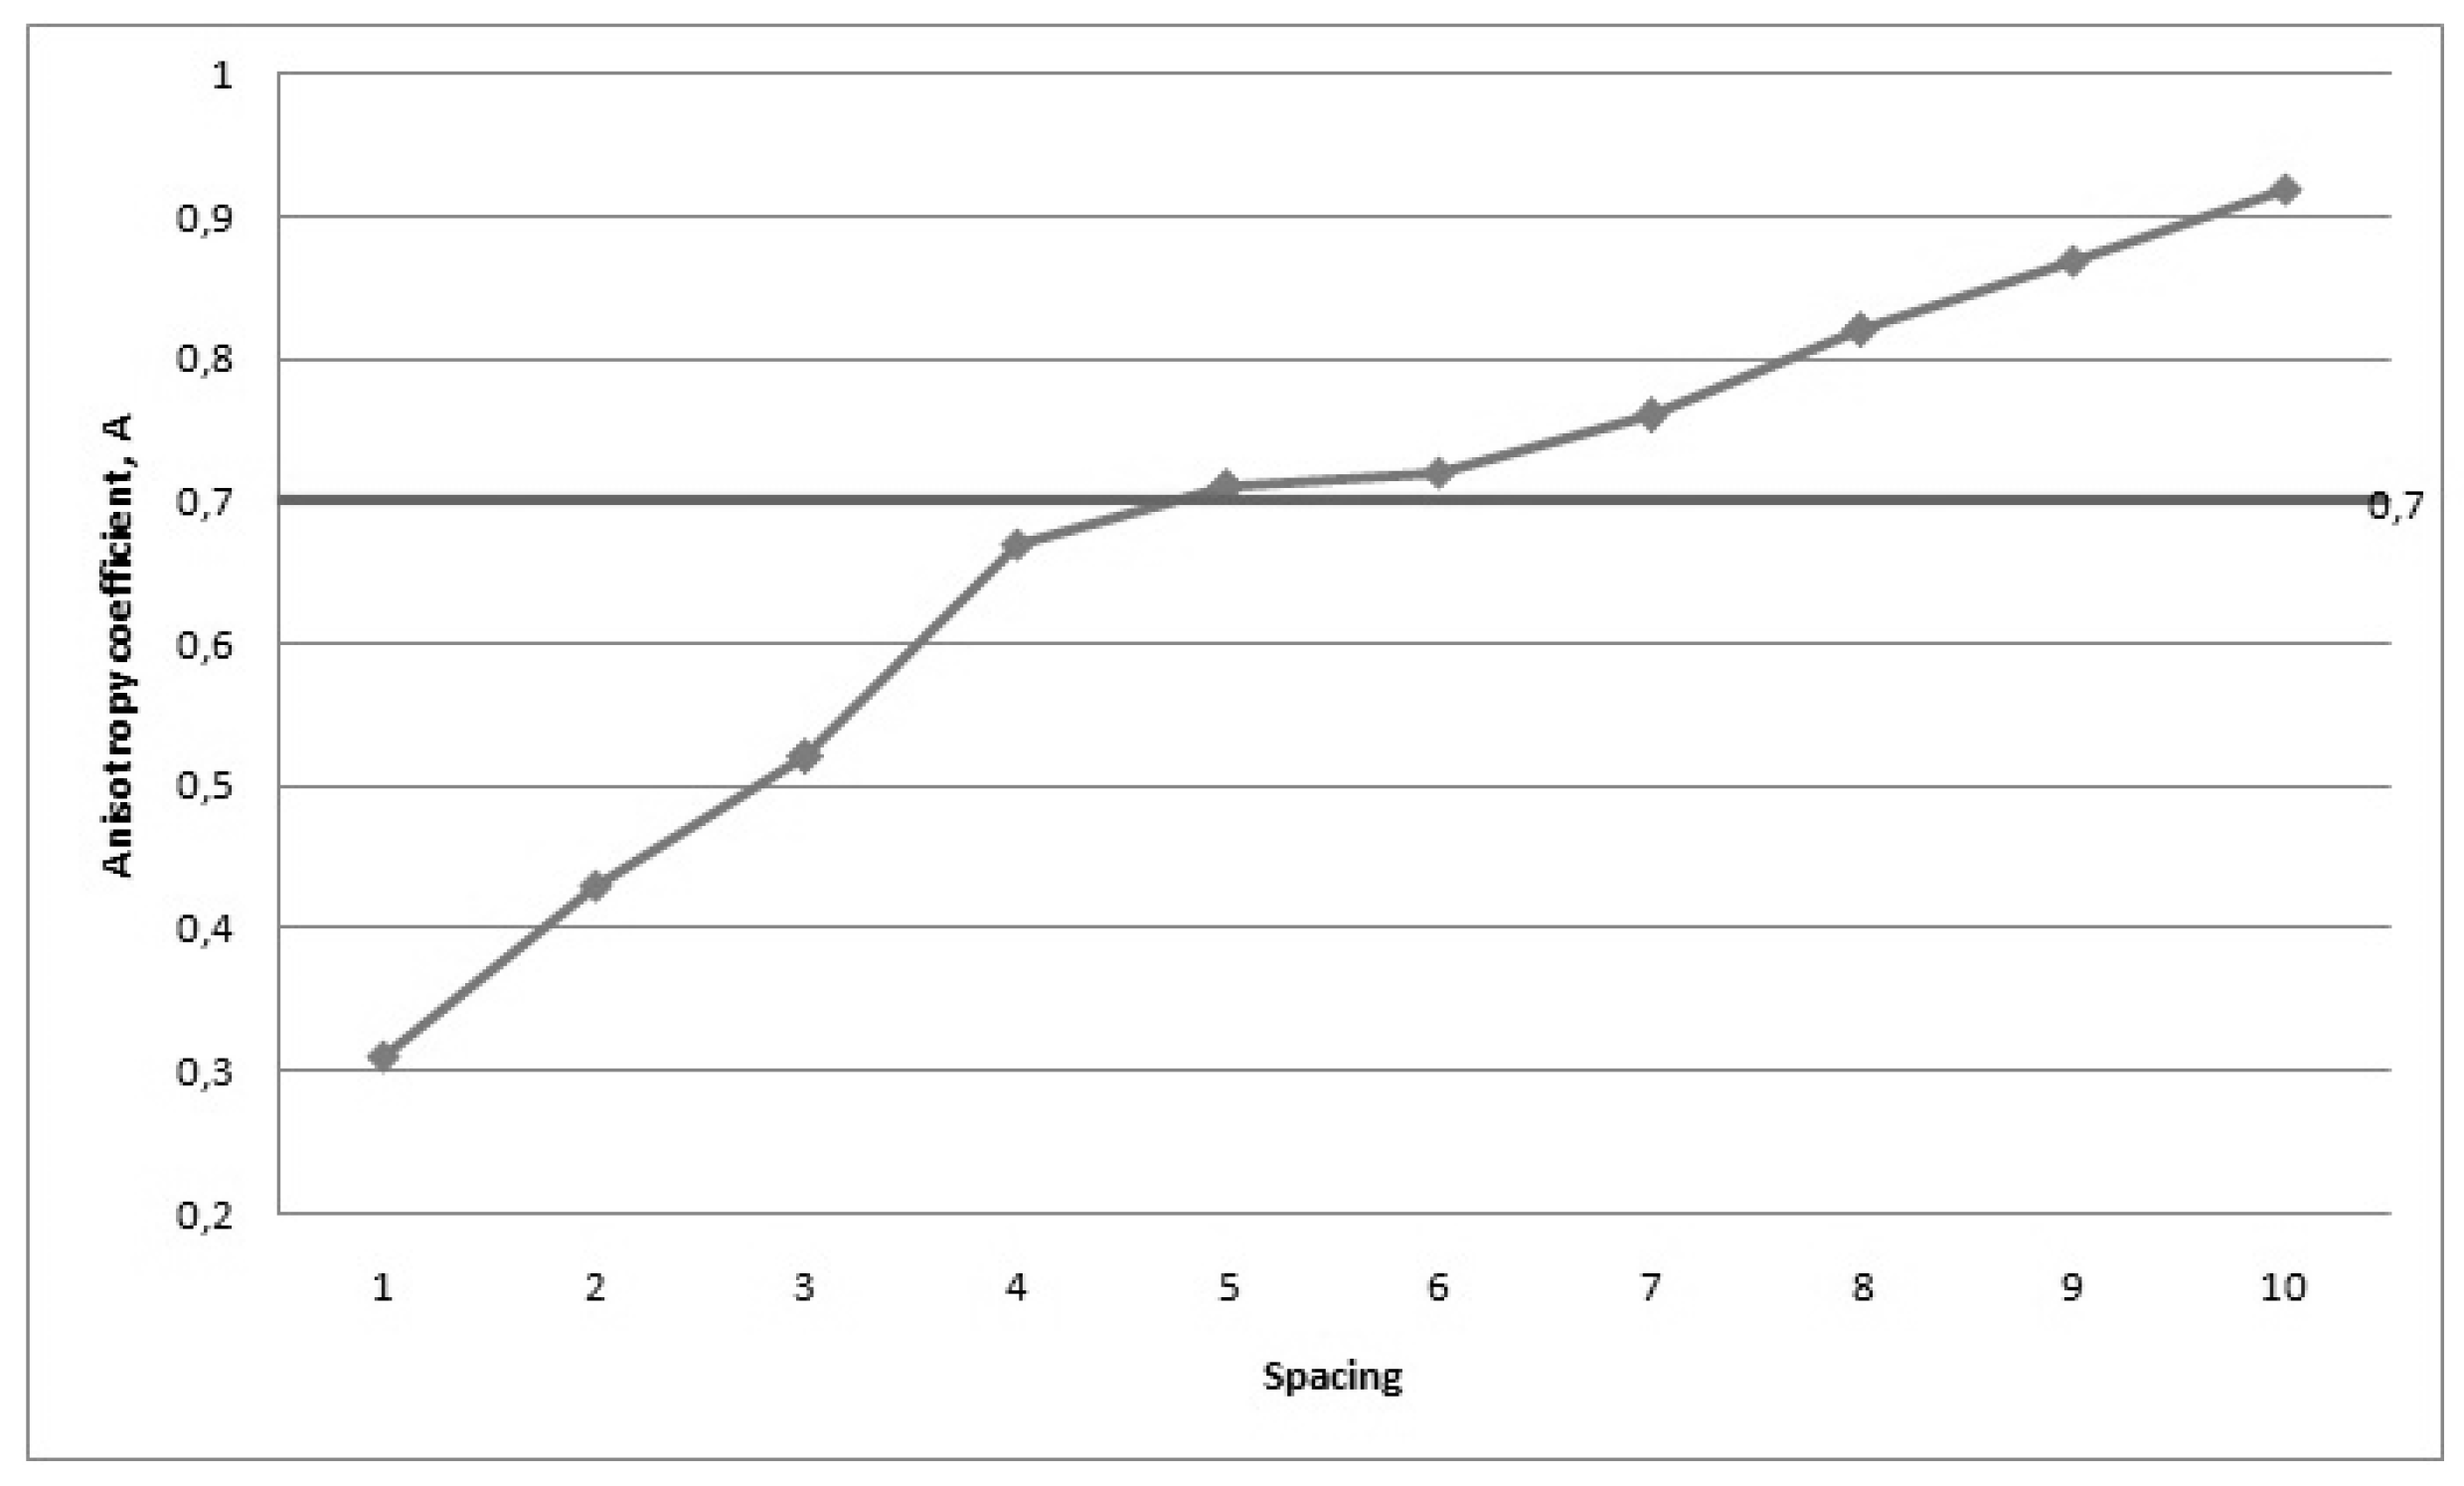
  • It is possible to study the pearlite grains’ deformation by metallographic method using the coefficient of anisotropy, which characterizes the deviation of grain linear dimension in the drawing direction and perpendicular to the drawing axis. The quantitative criteria which defines that a material grain belongs to the surface layer can be estimated as A < 0.7.
  • The increase of the die semi-angle working zone from 4° to 6° results in the increase of the depth of the layer of severe plastic deformation for soft friction conditions. As for medium and hard friction conditions the affect of die semi-angle size is negligible.
  • Independently of the die semi-angle, the deterioration in friction conditions leads to the decrease of the layer of severe plastic deformation depth. Wherein, the higher the die semi-angle size is, the more intense is the decrease of the layer depth at which friction conditions worsen.

Author Contributions

A.S. is responsible for general conceptualization and experimental part; M.P. is responsible for interpretation of experimental results; G.A. is responsible for metallographic observation; S.A. is responsible for writing-review & editing; L.L. is responsible for investigation and formal analysis of experimental results.

Funding

The reported study was supported by Russian Science Foundation (RSF), research project No. 18-19-00736.

Conflicts of Interest

The authors declare no conflict of interest.

References

  1. Griffiths, B.J. Mechanisms of white layer generation with reference to machining and deformation processes. ASME J. Tribol. 1987, 109, 525–530. [Google Scholar] [CrossRef]
  2. Griffiths, B.J.; Furze, D.C. Tribological advantages of white layers produced by machining. ASME J. Tribol. 1987, 109, 338–342. [Google Scholar] [CrossRef]
  3. Cho, D.-H.; Lee, S.-A.; Lee, Y.-Z. Mechanical properties and wear behavior of the white layer. Tribol. Lett. 2012, 45, 123–129. [Google Scholar] [CrossRef]
  4. Kajino, S.; Asakawa, M. Effect of “additional shear strain layer” on tensile strength and microstructure of fine drawn wire. J. Mater. Process. Technol. 2006, 177, 704–708. [Google Scholar] [CrossRef]
  5. Wu, X.; Yang, M.; Yuan, F.; Wu, G.; Wei, Y.; Huang, X.; Zhu, Y. Heterogeneous lamella structure unites. Proc. Natl. Acad. Sci. USA 2015, 112, 14501–14505. [Google Scholar] [CrossRef] [PubMed]
  6. Kim, Y.-T.; Ikeda, K. Flow behavior of the billet surface layer in porthole die extrusion of aluminum. Metall. Mater. Trans. 2000, 31, 1635–1643. [Google Scholar] [CrossRef]
  7. Sanabria, V.; Müller, S.; Gall, S.; Reimers, W. Investigation of Friction Boundary Conditions during Extrusion of Aluminium and Magnesium Alloys. Key Eng. Mater. 2014, 611, 997–1004. [Google Scholar] [CrossRef]
  8. Sanabria, V.; Mueller, S.; Reimers, W. Microstructure Evolution of Friction Boundary Layer during Extrusion of AA 6060. Procedia Eng. 2014, 81, 586–591. [Google Scholar] [CrossRef] [Green Version]
  9. Murai, T.; Matsuoka, S.; Miyamoto, S.; Oki, Y. Effects of extrusion conditions on microstructure and mechanical properties of AZ31B magnesium alloy extrusions. J. Mater. Process. Technol. 2003, 141, 207–212. [Google Scholar] [CrossRef]
  10. Milenin, A.A.; Berski, S.; Banaszek, G.; Dyja, H. Theoretical analysis and optimisation of parameters in extrusion process of explosive cladded bimetallic rods. J. Mater. Process. Technol. 2004, 157, 208–212. [Google Scholar] [CrossRef]
  11. Sasaki, T.T.; Morris, R.A.; Thompson, G.B.; Syarif, Y.; Fox, D. Formation of ultra-fine copper grains in copper-clad aluminum wire. Scr. Mater. 2010, 63, 488–491. [Google Scholar] [CrossRef]
  12. Thirumurugan, M.; Rao, S.A.; Kumaran, S.; Rao, T.S. Improved ductility in ZM21 magnesium–aluminium macrocomposite produced by co-extrusion. J. Mater. Process. Technol. 2011, 211, 1637–1642. [Google Scholar] [CrossRef]
  13. Li, X.; Zu, G.; Ding, M.; Mu, Y.; Wang, P. Interfacial microstructure and mechanical properties of Cu/Al clad sheet fabricated by asymmetrical roll bonding and annealing. Mater. Sci. Technol. 2011, 529, 485–491. [Google Scholar] [CrossRef]
  14. Alexandrov, S.; Jeng, Y.-R.; Hwang, Y.-M. Generation of a fine grain layer in the vicinity of frictional interfaces in direct extrusion of AZ31 alloy. ASME J. Manuf. Sci. Eng. 2015, 137, 051003. [Google Scholar] [CrossRef]
  15. Alexandrov, S.; Sidjanin, L.; Vilotic, D.; Movrin, D.; Lang, L. Generation of a layer of severe plastic deformation near friction surfaces in upsetting of steel specimens. Metals 2018, 8, 71. [Google Scholar] [CrossRef]
  16. Goldstein, R.V.; Alexandrov, S.E. An approach to prediction of microstructure formation near friction surfaces at large plastic strains. Phys. Mesomech. 2015, 18, 223–227. [Google Scholar] [CrossRef]
  17. Alexandrov, S.; Richmond, O. Singular plastic flow fields near surfaces of maximum friction stress. Int. J. Non-Linear Mech. 2001, 36, 1–11. [Google Scholar] [CrossRef]
  18. Stolyarov, A.; Kamalova, G.; Polyakova, M. Investigation of grain anisotropy on surface area between carbon steel wire at drawing. In Mater Science Forum; Trans Tech Publications: Zurich, Switzerland, 2019. [Google Scholar]
Figure 1. Typical microstructure of patenting wire, ×500.
Metals 09 00819 g001
Figure 2. Wire drawing process.
Metals 09 00819 g002
Figure 3. Microstructure of wire drawn (series of the experiments 3.3, see Table 2) ×500.
Metals 09 00819 g003
Figure 4. Panoramic image of wire with circled grains in Thixomet PRO software (the rectangle of analysis).
Metals 09 00819 g004
Figure 5. Locations where the coefficient of anisotropy was determined.
Metals 09 00819 g005
Figure 6. Distribution of the coefficient of anisotropy in the drawn wire from its surface to center.
Metals 09 00819 g006
Figure 7. Thickness of the fine grain layer after drawing through α = 4 deg die: (a) soft friction condition; (b) medium friction condition; and (c) hard friction condition.
Metals 09 00819 g007aMetals 09 00819 g007b
Figure 8. Thickness of the fine grain layer after drawing through α = 5 deg die: (a) soft friction condition; (b) medium friction condition; and (c) hard friction condition.
Metals 09 00819 g008
Figure 9. Thickness of the fine grain layer after drawing through α = 6 deg die: (a) soft friction condition; (b) medium friction condition; and (c) hard friction condition.
Metals 09 00819 g009aMetals 09 00819 g009b
Figure 10. Effect of the die semi-angle on the thickness of the fine grain layer at different friction conditions.
Metals 09 00819 g010
Figure 11. Effect of the friction conditions on the thickness of the fine grain layer at different die semi-angles.
Metals 09 00819 g011
Table 1. Chemical compositions of carbon steel wires (wt.%).
CSiMnNiSPCrCu
0.800.220.540.250.0350.0350.250.2
Table 2. Drawing experimental regimes.
Series of ExperimentsDie Semi-Angle α, DegFriction Condition
1.14s
1.2m
1.3h
2.15s
2.2m
2.3h
3.16s
3.2m
3.3h
Wire with 2R0 = 1.70 mm in diameter was drawn to 2Rf = 1.51 mm in diameter.
Table 3. Thickness of the fine grain layer.
Series of ExperimentsDie semi-Angle α, DegFriction ConditionThickness of the Fine Grain Layer, µmSample Range, µm
1.14s29.71.0
1.2m28.41.8
1.3h27.91.6
2.15s34.91.2
2.2m30.71.0
2.3h28.31.9
3.16s36.41.2
3.2m28.61.0
3.3h27.71

